Embed Size (px)
Citation preview
Eos, Vol. 79, No. 35, September 1, 1998
Days 54, 59, and 73 may represent peak periods of effusive activity, although days 54 and 73 were derived from off-nadir satellite views which artificially increase the number of pixels. The data are resampled when correcting to a map projection, which introduces an error that can increase the pixel count near the edge of the images. Day 59 is almost at nadir, so resampling is not an issue. An investigation of nonresampled data indicates that approximately half of the elevated pixel counts on days 54 and 73 are due to resampling and the remaining pixels are presumably related to increased volcanic activity, at least in part. Perhaps a slight shift in the location of pixel boundaries with respect to the position of the lava flow could also affect the number of hot pixels.
After day 73, clouds limited observations for 2 months and restricted accurate radiometric measurements. Most observations after day 73 indicated that the flow cooled and did not show any substantial effusive activity. Recent observations (January 4, 1998) indicate that the lava flow still remains above background temperatures. Images used in the analysis of flow size and rates were recorded at night to eliminate over-estimations that may result from solar heating.
In the future, AVO intends to refine the Okmok algorithm and automated warnings and
to investigate thermal anomalies to improve their detection and their relationship to eruptions. The use of SAR data will be expanded to include near real-time analysis to assess surface morphological changes and the use of interferometric techniques to detect volcano deformation related to an eruption. The Earth Observation System (EOS) data will be incorporated into the monitoring and analysis system.
Acknowledgments
This work is supported by the U.S. Geological Survey as part of the Volcano Hazards Program, and by additional funds from the state of Alaska. Several of the monitoring techniques described in this article were introduced or further refined after the Okmok eruption. Dave Schneider developed access and processing techniques for Geostationary satellite data and John Dehn made significant changes in the AVO volcano-monitoring Web page and refined the Puff tracking model.
References Byers, F. M, Geology of Umnak and Bogoslof
Islands Alaska, U.S. Geol. Surv. Bull, 1078-L, 367 pp., 1959.
Dean, K. G., K. Engle, Z. Lu, J . Eichelberger, T. Neal, and M. Doukas, Use of SAR Data
to Study Active Volcanoes in Alaska, ESA Earth Obs. Q., 53, September 21-23, 1996.
Harris, A. J . L., et al., Low cost volcano survei l lance from space : Case studies from Etna, Krafla, Cerro Negro, Fogo, Lascar and Erebus, Bull. Volcanol., 59, 49-64, 1997.
Higgins, J . , and A. J . L. Harris, VAST: A program to locate and analyze volcanic thermal anomalies automatically from remotely sensed data, Comput. GeoscL, 23, 627-645, 1997.
Kidwell, K. B . , (Ed. ) , NOAA Polar Orbiter Data Users Guide (TIROS-N, NOAA-6, NOAA-7, NOAA-8, NOAA-9, NOAA-10, NOAA-11, AND NOAA-12), National Oceanic and Atmospheric Administration National Environmental Satellite, Data, and Information Service, Washington, D.C., 1991.
Lu, Z., R. Fatland, M. Wyss, S. Li, J . Eichelberger, K. Dean, and J . Freymueller, Deformation of New Trident volcano measured by ERS-1 SAR interferometry, Katmai National Park, Alaska, Geophys. Res. Lett., 24, 695-698, 1997.
Massonnet, D., P. Briole, and A. Arnaud, Deflation of Mount Etna monitored by space-borne radar interferometry, Nature, 375, 567-570, 1995.
Newhall, C. G., and S. Self, The volcanic ex-plosivity index (VEI): An estimate of explosive magnitude for historical volcanism, J . Geophys. Res., 87, 1231-1238, 1982.
Searcy, C , K. Dean, and B. Stringer, PUFF: A volcanic ash tracking and prediction model, J . Volcanol. and Geophys. Res., 40, 1-16, 1998.
Simkin T., and L. Siebert, Volcanoes of the World, Second Edition, Geosc ience Press, Tucson, Arizona., 349 pp., 1994.
Calibration of Seismograph Network May Meet Test Ban Treaty's Monitoring Needs Petr Firbas, Karl Fuchs 5 and Walter D. Mooney
PAGES 413, 421
Systematic calibration of a network of seismographs could meet the seismic monitoring needs of the United Nations' comprehensive nuclear test ban treaty, a feasibility study suggests. To calibrate the network, known as the International Monitoring System (IMS), the three-dimensional seismic structure of the Earth must be taken into account . Deep seismic sounding (DSS) profiles and global three-dimensional seismic velocity inversions play prominent roles.
For more information, con tac t Walter D. Mooney, U.S. Geological Survey, 345 Middle-field Road, MS 977, Menlo Park, CA 94025 USA.
A verifiable test ban treaty is an important societal and technical goal. An essential ingredient is the ability to accurately locate seismic events, probably within a circle with a radius of 18 km, which is about 1000 km 2 . This would be for events with magnitude greater than 4 in continental areas.
The study indicated this can be done using seismic travel time corrections from maps based on a three-dimensional velocity model. In the study, the maps, called Source-Station Specific Corrections (SSSC) maps, were derived for IMS stations in Europe.
Event locations based on data from the IMS are to be determined by the International Data Center (IDC), and a Prototype IDC is currently being developed at the Cen
ter for Monitoring Research in Arlington, Virginia. The technical requirements of the IMS and IDC are largely based upon the previous work of the Group of Scientific Experts (GSE) of the Conference on Disarmament in Geneva. The most recent global test organized by the GSE is the Third Technical Test (GSETT-3). Comparisons of the GSETT-3 bulletin locations with those of known sources, such as quarry blasts, and those determined by local and regional seismic networks have revealed both random and systematic location differences. Based on the results of GSETT-3, steps for improving event location accuracy were endorsed by the GSE. The effort to calibrate the IMS has already begun (see, for example, Firbas etal. [1997]) .
Experience has shown that refinements in global one-dimensional models cannot improve the ability to locate events using regional phases. Travel time corrections that reflect regional three-dimensional structure are necessary. These corrections are distance and azimuth dependent. Travel time curves derived from explosion and earthquake seismology reveal major differences between uppermost mantle phases (Pn waves) propagating in t echnica l ly active re-
This page may be freely copied.
Eos, Vol. 79, No. 35, September 1, 1998
gions and those in stable cratonic Precam-brian regions. Recent studies show that Pn travel times for t echn ica l ly active regions are up to 5 s longer than the global average (see for example, Kennett [1991] ) , while Pn travel times for stable cratonic regions are 3 -6 s less than the global average at distances of 1000-1500 km.
One of the means of achieving a better fit of regional travel times is through the construction of three-dimensional Earth models, where variable resolution (depending on the density and quality of available data) may be obtained for various parts of the globe. Creating a global three-dimensional model that may be used to generate travel time corrections for all regional and teleseismic phases is a step-by-step process. The most reliable information about the crust and uppermost mantle comes from explosion seismology, such as DSS profiles.
Unique Data
Unique data for studies of travel times through the continental lithosphere are the
ultra-long-range (>3000 km) seismic profiles recorded in the former Soviet Union using Peaceful Nuclear Explosions (PNEs) as sources. S ince 1971, approximately 20 long-range seismic profiles using PNEs have been recorded in the former Soviet Union. These profiles provided penetration of the Earth's upper mantle to depths of more than 600 km. The close spacing of the mobile stations along the profiles allowed unprecedented resolution of fine structure of the upper mantle. The Center of Regional Geophysical and Geoecological Research (GEON) of the Russian Geological Committee has digitized many of the original analog field tapes of this unique dataset. The feasibility study underscored the importance of preserving existing seismological data such as these and other long-range profiles, as well as coordinates and origin times of other nuclear and chemical explosions recorded by the scientific community.
There are several important characteristics of the PNE seismogram sections. The variability of first arrival times between 400 and 2000 km is surprisingly large, both along
linear profiles and between crossing profiles. Such variability is most likely an expression of lateral velocity heterogeneities and/or of anisotropic wave propagation in the upper mantle. It may also reflect unaccounted for velocity heterogeneities at crustal levels, although the PNE profiles have rather dense measurements of crustal structure from chemica l explosions along the profile. Another important characteristic is that beyond 2000 km, the variability of first arrival times from the mantle transition zone b e c o m e s much smaller. Detailed information on the structure of the upper mantle from these long-range PNE profiles can be combined with the global three-dimensional models, especially the deeper parts of the mantle to improve the seismic calibration of the IMS [Fuchs, 1997] .
A critical step for the a c c e p t a n c e of empirically derived travel time corrections, or of a three-dimensional velocity model used to generate these corrections, is the verification of these corrections by independent data. Seismic events with well-known locations and origin times, thus known as calibration events, are extremely important for this verification.
-10 •I 4 4 4 -1 0 1 - f I 4 I
Delay Twm in Seconds 10 *0 -5 -4 -3 -2 -1 0 1 2 3 4 §
Delay Time in Seosnds 10
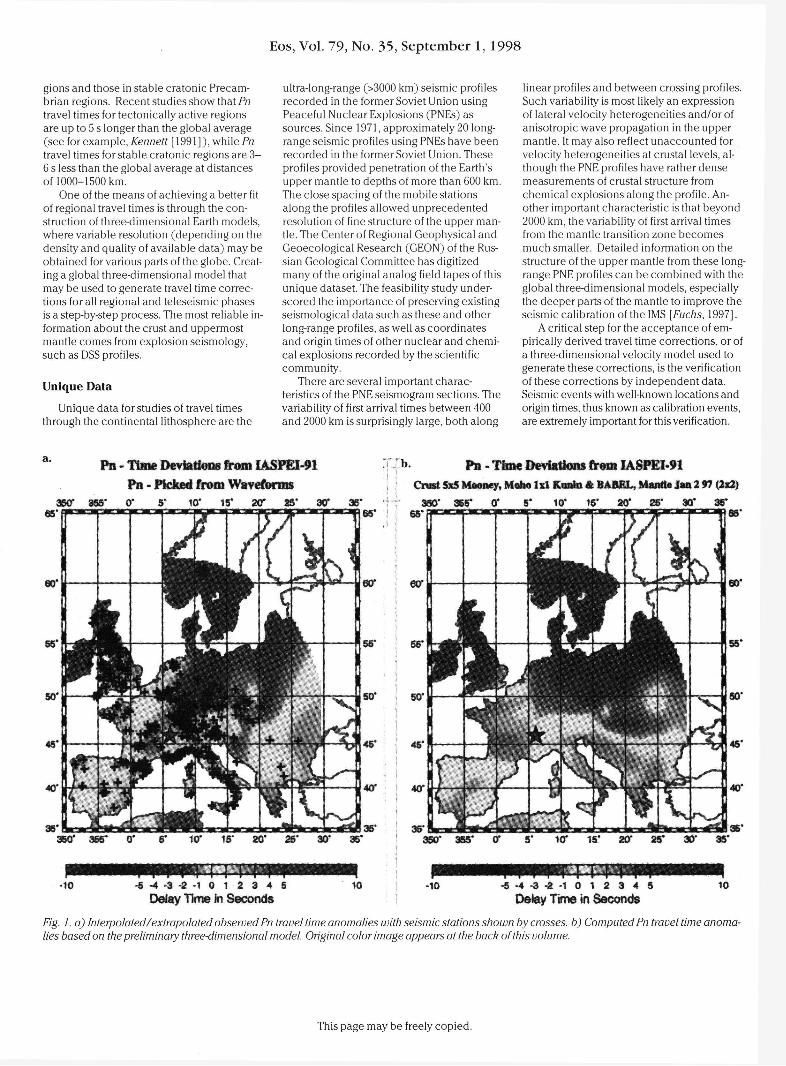
Fig. 1. a) Interpolated/extrapolated observed Pn travel time anomalies with seismic stations shown by crosses, b) Computed Pn travel time anomalies based on the preliminary three-dimensional model. Original color image appears at the back of this volume.
This page may be freely copied.

Eos, Vol. 79, No. 35, September 1, 1998
Pit - Time Deviations tmm IASPEI-9I Crasi M M ^ , Mote© 1x1 Kunin & BABEL, Mantle Jan $ f f (1x2)
ar « r r r to* tr m m m w
fm <* Time Deviations from IASPEI-91 Crust M mm®?* MM* I x l Ktmta & BABEL, 1 M b Jim 2 f f (2x2)
as®* a§r o* s* to* tr 20* as* ar 3r
IT
350 35 r o* 10* IS* 2Cf 2T 30* 3T
• 1 -5 - 4 - 3 - 2 - 1 0 1 2 3 4 5 10 -10 - 6 - 4 « 3 * » 1 0 1 2 $ 4 5
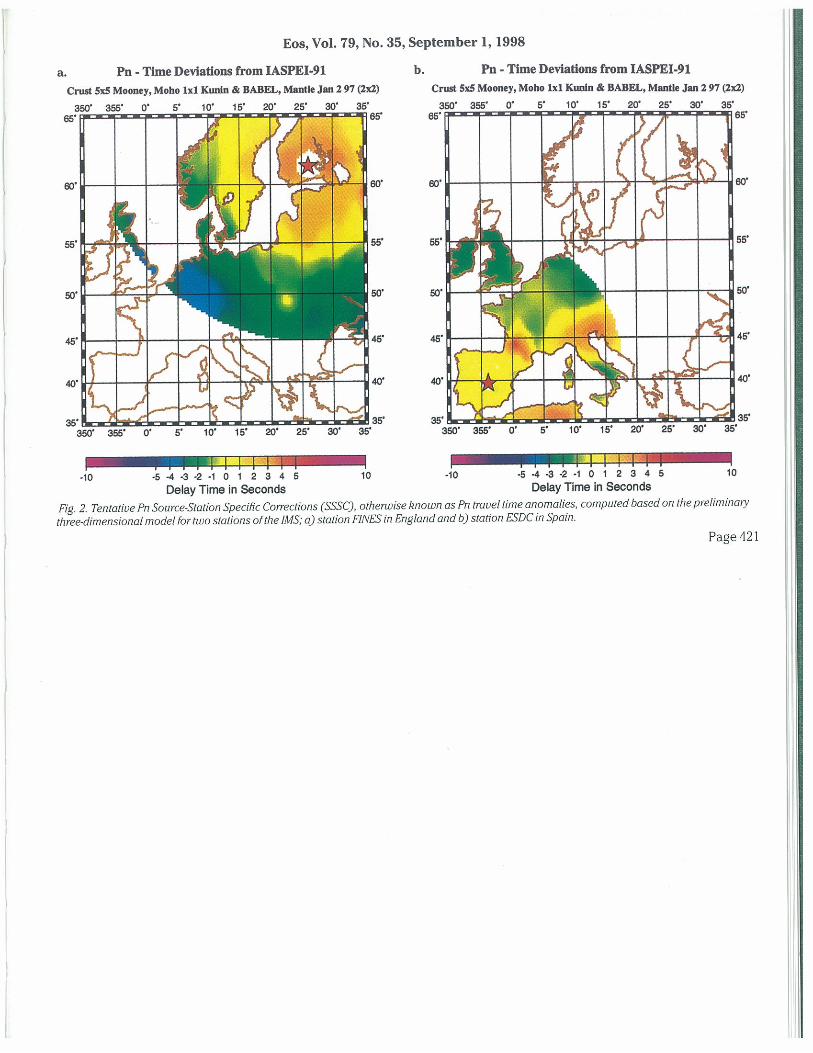
Delay Time in Seconds Delay Time in Seconds Hg. 2. Tentative Pn Source-Station Specific Corrections (SSSC), otherwise known as Pn travel time anomalies, computed based on the preliminary three-dimensional model for two stations of the IMS; a) station FINES in England and b) station ESDC in Spain. Original color image appears at the back of this volume.
The selection criteria for these calibration events must be very stringent. The most important criterion is the reliable knowledge of the exact origin parameters (event location and time from independent sources, preferably by direct field observations). Statistical approaches to determining travel time corrections using events with poorly known origin parameters, while sometimes useful, cannot recover the full amplitude of the travel time corrections within a three-dimensional structure.
A European Calibration Event
A magnitude 4.5 earthquake that occurred in France on July 15, 1996, proved useful for a pilot study of the calibration of travel times in Europe because the epicenter was inside a network of local stations [Observatoire de Grenoble, 1996] . An interpolated/extrapolated plot of deviations of the observed Pn travel times from the global 1991 tables of the International Association of Seismology and
Physics of the Earth's Interior (IASPEI) [Ken-nett, 1991] is shown in Figure la . The arrival times used in this study were based on consistent picking using waveform data from about 50 institutes in 25 countries. The black crosses show the positions of the used stations. Despite every effort to col lect as much data as possible, it is obvious that the area east of 17° is not sufficiently covered.
Three-dimensional travel time modeling was applied to these data from western and central Europe. Information regarding the velocity structure was provided by the U.S. Geological Survey, Cornell University, Harvard University, and the Australian National University. Interpretations of crustal structure were provided by various groups. Figure l b shows the result of a modeling exercise that was based on a preliminary model created by combining a 5° x 5° regionalization of the crust [Mooney etai, 1998] with a 1° x 1° Moho depth model and a 2° x 2° mantle model [Firbas et al., 1997] . This three-dimensional model successfully reproduced most
of the features seen in the Pn travel time anomaly maps of Figure l a for the area well constrained by data (west of 17°).
The three-dimensional velocity model was used to produce examples of SSSC maps for all IMS stations to be used in Europe. Figures 2a and 2b show estimates of SSSC maps for station FINES in southern Finland and station ESDC in Spain. These SSSC maps are preliminary. Nevertheless, they show basic features that can be expected from SSSC maps that will be used in the operational monitoring environment. The effect of the very deep Moho manifests itself on the SSSC map for station FINES. The map for station ESDC shows a very different pattern of anomalies and clearly shows the travel time delays corresponding to the Pyrenees and the Alps. The maxima and minima of travel time anomalies in the SSSC maps agree well with the values derived in some previous studies and do not e x c e e d ±7 sec .
The dense data sampling available for Europe facilitated this study, but it is not an-
This page may be freely copied.
Eos, Vol. 79, No. 35, September 1, 1998
Early Rise Experiment first Pn; Time Deviations front IASPEI-91
«* * *i 0 i t » 0#§a^ Una to tec^
G nome Nuclear Explosion .First Pn * Ttete Deviations front IASP&1-91
-tar -110* -fOO*
' J ,
o 1 a •0 *f 4 0 t S 9 Delay Timo In Seconds
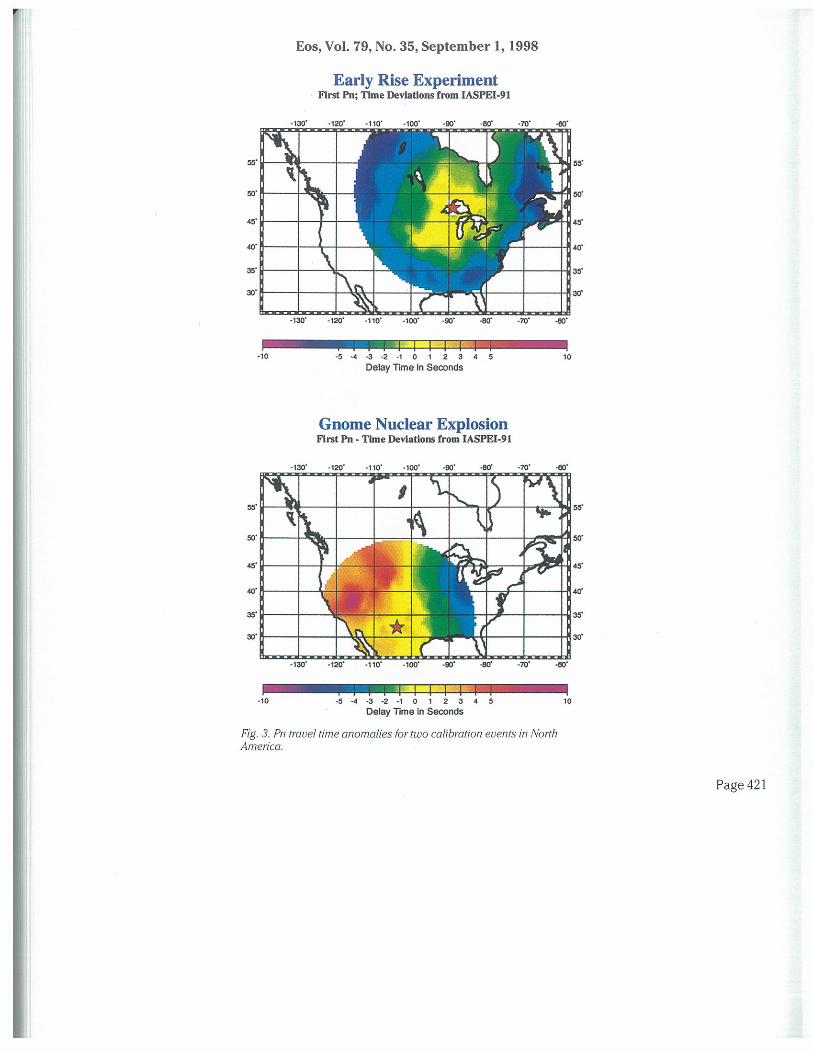
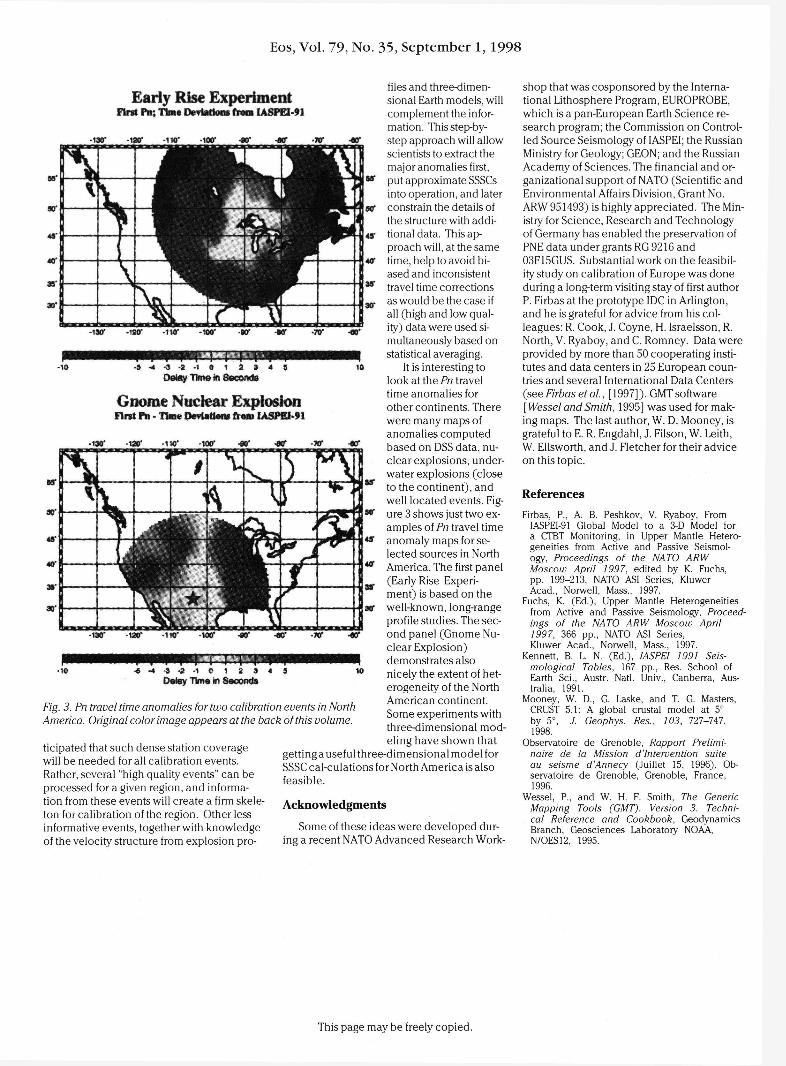
Rg. J. fraye/ time anomalies for two calibration events in North America. Original color image appears at the back of this volume.
ticipated that such dense station coverage will be needed for all calibration events. Rather, several "high quality events" can be processed for a given region, and information from these events will create a firm skeleton for calibration of the region. Other less informative events, together with knowledge of the velocity structure from explosion pro
files and three-dimensional Earth models, will complement the information. This step-by-step approach will allow scientists to extract the major anomalies first, put approximate SSSCs into operation, and later constrain the details of the structure with additional data. This approach will, at the same time, help to avoid biased and inconsistent travel time corrections as would be the case if all (high and low quality) data were used simultaneously based on statistical averaging.
It is interesting to look at the Pn travel time anomalies for other continents. There were many maps of anomalies computed based on DSS data, nuclear explosions, underwater explosions (c lose to the cont inent) , and well located events. Figure 3 shows just two examples of Pn travel time anomaly maps for selected sources in North America. The first panel (Early Rise Experiment) is based on the well-known, long-range profile studies. The second panel (Gnome Nuclear Explosion) demonstrates also nicely the extent of heterogeneity of the North American continent. Some experiments with three-dimensional modeling have shown that
getting a useful three-dimensional model for SSSC cal-culations for North America is also feasible.
Acknowledgments
Some of these ideas were developed during a recent NATO Advanced Research Work
shop that was cosponsored by the International Lithosphere Program, EUROPROBE, which is a pan-European Earth Sc i ence research program; the Commission on Controlled Source Seismology of IASPEI; the Russian Ministry for Geology; GEON; and the Russian Academy of Sc iences . The financial and organizational support of NATO (Scientific and Environmental Affairs Division, Grant No. ARW 951493) is highly appreciated. The Ministry for Sc ience , Research and Technology of Germany has enabled the preservation of PNE data under grants RG 9216 and 03F15GUS. Substantial work on the feasibility study on calibration of Europe was done during a long-term visiting stay of first author P. Firbas at the prototype IDC in Arlington, and he is grateful for advice from his colleagues: R. Cook, J . Coyne, H. Israelsson, R. North, V. Ryaboy, and C. Romney. Data were provided by more than 50 cooperating institutes and data centers in 25 European countries and several International Data Centers (see Firbas et al, [ 1997] ) . GMT software [Wessel and Smith, 1995] was used for making maps. The last author, W. D. Mooney, is grateful to E. R. Engdahl, J . Filson, W. Leith, W. Ellsworth, and J . Fletcher for their advice on this topic.
References Firbas, P., A. B . Peshkov, V. Ryaboy, From
IASPEI-91 Global Model to a 3-D Model for a CTBT Monitoring, in Upper Mantle Heterogeneit ies from Active and Passive Seismology, Proceedings of the NATO ARW Moscow April 1997, edited by K. Fuchs, pp. 199-213 , NATO ASI Series, Kluwer Acad., Norwell, Mass., 1997.
Fuchs, K. (Ed. ) , Upper Mantle Heterogeneit ies from Active and Passive Seismology, Proceedings of the NATO ARW Moscow April 1997, 366 pp., NATO ASI Series, Kluwer Acad., Norwell, Mass., 1997.
Kennett, B . L. N. (Ed.) , IASPEI 1991 Seis-mological Tables, 167 pp., Res. School of Earth Sci . , Austr. Natl. Univ., Canberra, Australia, 1991.
Mooney, W. D., G. Laske, and T. G. Masters, CRUST 5.1: A global crustal model at 5° by 5° , J . Geophys. Res., 103, 121-1 Al, 1998.
Observatoire de Grenoble, Rapport Prelimi-naire de la Mission d'Intervention suite au seisme dAnnecy (Juillet 15, 1996) , Observatoire de Grenoble, Grenoble , France, 1996.
Wessel, P., and W. H. F. Smith, The Generic Mapping Tools (GMT). Version 3. Technical Reference and Cookbook, Geodynamics Branch, Geosc i ences Laboratory NOAA, N/0ES12 , 1995.
This page may be freely copied.