Embed Size (px)
Citation preview
Astronomy & Astrophysics manuscript no. zelda2 c©ESO 2018April 24, 2018
Calibration of quasi-static aberrations in exoplanet direct-imaginginstruments with a Zernike phase-mask sensor
II. Concept validation with ZELDA on VLT/SPHEREM. N’Diaye1, A. Vigan2, 3, K. Dohlen2, J.-F. Sauvage4, 2, A. Caillat2, A. Costille2, J. H. V. Girard3,
J.-L. Beuzit5, 6, T. Fusco4, 2, P. Blanchard2, J. Le Merrer2, D. Le Mignant2, F. Madec2, G. Moreaux2,D. Mouillet5, 6, P. Puget5, 6, and G. Zins3, 5, 6
1 Space Telescope Science Institute, 3700 San Martin Drive, Baltimore, MD 21218, USAe-mail: [email protected]
2 Aix Marseille Université, CNRS, LAM (Laboratoire d’Astrophysique de Marseille) UMR 7326, 13388, Marseille, France3 European Southern Observatory, Alonso de Cordova 3107, Vitacura, Santiago, Chile4 ONERA, The French Aerospace Lab, BP72, 29 avenue de la Division Leclerc, 92322 Châtillon Cedex, France5 CNRS, IPAG (Institut de Planétologie et d’Astrophysique de Grenoble), UMR 5274, B.P. 53, F-38041 Grenoble Cedex 9, France6 Université Grenoble Alpes, IPAG, 38000 Grenoble, France
ABSTRACT
Warm or massive gas giant planets, brown dwarfs, and debris disks around nearby stars are now routinely observed by dedicatedhigh-contrast imaging instruments that are mounted on large, ground-based observatories. These facilities include extreme adaptiveoptics (ExAO) and state-of-the-art coronagraphy to achieve unprecedented sensitivities for exoplanet detection and their spectral char-acterization. However, low spatial frequency differential aberrations between the ExAO sensing path and the science path representcritical limitations for the detection of giant planets with a contrast lower than a few 10−6 at very small separations (<0.3′′) from theirhost star. In our previous work, we proposed a wavefront sensor based on Zernike phase-contrast methods to circumvent this problemand measure these quasi-static aberrations at a nanometric level. We present the design, manufacturing, and testing of ZELDA, aprototype that was installed on VLT/SPHERE during its reintegration in Chile. Using the internal light source of the instrument, wefirst performed measurements in the presence of Zernike or Fourier modes introduced with the deformable mirror. Our experimentalresults are consistent with the results in simulations, confirming the ability of our sensor to measure small aberrations (<50 nm rms)with nanometric accuracy. Following these results, we corrected the long-lived non-common path aberrations in SPHERE based onZELDA measurements and estimated a contrast gain of 10 in the coronagraphic image at 0.2′′, reaching the raw contrast limit setby the coronagraph in the instrument. In addition to this encouraging result, the simplicity of the design and its phase reconstructionalgorithm makes ZELDA an excellent candidate for the online measurements of quasi-static aberrations during the observations. Theimplementation of a ZELDA-based sensing path on the current and future facilities (ELTs, future space missions) could facilitate theobservation of cold gaseous or massive rocky planets around nearby stars.
Key words. instrumentation: high angular resolution – instrumentation: adaptive optics – techniques: high-angular resolution –telescopes – methods: data analysis
1. Introduction
Circumstellar disks and planetary companions around nearbystars are routinely observed on the ground by several facili-ties with exoplanet direct-imaging capabilities (e.g. Beuzit et al.2008; Macintosh et al. 2008; Guyon et al. 2010; Hinkley et al.2011; Skemer et al. 2012; Close et al. 2014). Of these facili-ties, the instruments VLT/SPHERE and Gemini Planet Imager(GPI) have recently seen first light in 2013-2014, providing un-precedented sensitivity and inner working angle for exoplanetobservations (Macintosh et al. 2014; Vigan et al. 2015). Sincetheir commissioning, they have shed light on known or newlydetected planetary companions with insights on their physicalcharacteristics (orbit and mass) and atmospheric chemical fea-tures through spectral characterization and photometric and as-trometric information (Galicher et al. 2014; Chilcote et al. 2015;Vigan et al. 2016; Maire et al. 2016; Zurlo et al. 2016; Bonnefoyet al. 2016). Similar to the recent discovery of 51 Eri b (Macin-tosh et al. 2015), large surveys of nearby stars with these instru-
ments are expected to unveil more gas giant planets, providingclues for comparative exoplanetology and enabling a better un-derstanding on the formation and evolution of planetary systems.
To achieve direct imaging and spectroscopy of companionsorbiting nearby stars, these ground-based instruments rely on acombination of extreme adaptive optics (ExAO) system for thefine control of the wavefront errors that are due to atmosphericturbulence and optic imperfections, coronagraphy for starlightsuppression, and dedicated observational strategies and post-processing methods to retrieve the signal of the substellar masscompanions. With their near-infrared capabilities, these instru-ments can observe faint planetary-mass companions in thermalemission and study young or massive gaseous planets with con-trast ratios down to 10−5 − 10−6 at 0.2-0.3′′, corresponding tosolar system scales for stars within 100 pc.
Differential aberrations between the ExAO sensing pathand the science path, so-called non-common path aberrations(NCPA), have been identified as setting high-contrast perfor-
Article number, page 1 of 12
arX
iv:1
606.
0189
5v2
[as
tro-
ph.E
P] 1
7 Ju
n 20
16
A&A proofs: manuscript no. zelda2
mance limits for adaptive optics instruments. Their importancewas well known (e.g. Fusco et al. 2006) at the start of the devel-opment of the recently commissioned planet imagers, GPI andSPHERE, and various strategies were implemented to minimizethem. In particular, SPHERE has a differential tip-tilt correctionsystem, using a camera close to the coronagraph as an imageposition sensor, to ensure that any differential image movementis compensated for. Thermally induced differential defocus wasminimized by design, and on-coronagraph focus is optimized atthe start of observations. Higher-order aberrations, responsiblefor the residual quasi-static speckles that limit the high-contrastperformance of the instrument, were first of all minimized bytightly specifying all optics in the differential path, and secondby implementing AO calibration strategies to minimize residualaberrations. For SPHERE the differential optics worked betterthan specified, and consequently, the adopted calibration strat-egy, which is based on phase diversity techniques (Sauvage et al.2007), was not found to improve the final image quality andwas finally discarded. Still, the remaining NCPA are on the or-der of a few tens of nanometers, preventing coronagraphs fromachieving their ultimate performance. These wavefront errorscan be split into two contributions: the long-timescale aberra-tions that are due to the optical surface errors or misalignmentsin the instrument optical train and the slowly varying instrumen-tal aberrations that are caused by thermal or opto-mechanicaldeformations as well as moving optics such as atmospheric dis-persion correctors (e.g. Macintosh et al. 2005; Martinez et al.2012, 2013). They lead to static and quasi-static speckles in thecoronagraphic images, which represent critical limitations forthe detection and observation of older or lighter gaseous plan-ets at smaller separations. More precise measurement strategiesare required to measure and correct for these small errors withaccuracy and achieve deeper contrast (down to 10−7, represent-ing the ultimate contrast limit of these instruments) for the ob-servation of the faintest companions. Other unforeseen limitingeffects have also been experienced with these new instrumentsof unprecedented performance. In particular, the low-wind ef-fect (LWE) where piston patterns appear across the spiders inmonolithic-pupil telescopes, has turned out to be devastating asit systematically occurs when the outdoor wind speed (i.e., 30 mbelow the VLT platform) is below 1 to 3 m/s (Sauvage et al.2016). Around 20% of observing time is affected by this effect,causing strong speckle in the first Airy ring and even splittingof the main peak into up to four peaks of varying intensity. Thecause of this effect has been identified as being energetic transferbetween spiders that are radiatively cooled by the night sky, andthe slowly passing dome air. While strategies such as repaintingspiders using a low-emissivity paint are being studied to controlthe root cause of this particular case of dome seeing, real-timephase measurements may be needed to correct for its effect.
Over the past few years, several methods have been proposedto circumvent the NCPA problem (e.g. Gonsalves 1982; Wallaceet al. 2010a; Paul et al. 2013). We have proposed the use of aZernike phase mask sensor to calibrate the NCPA seen by thecoronagraph in exoplanet direct imagers (N’Diaye et al. 2013;hereafter Paper I). This phase-contrast method uses a phase-shiftmask to modulate the phase differential aberrations into inten-sity variations in the pupil plane. Since differential aberrationsin exoplanet imagers are small, a linear or quadratic relation be-tween the wavefront errors and the pupil intensity enables recon-structing the differential aberrations at nanometric accuracy witha simple, fast algorithm, making calibration in real time possible.
Zernike sensors have been explored in astronomy to addressvarious instrumentation aspects, such as wavefront sensing in
adaptive optics systems or cophasing of telescope segmented pri-mary mirror (Bloemhof & Wallace 2003, 2004; Dohlen 2004;Surdej et al. 2010; Wallace et al. 2011; Vigan et al. 2011). Re-cently, the Zernike sensor has been adopted for the WFIRSTmission to measure low-order aberrations in its coronagraphicinstrument and control pointing errors and focus drifts on thecoronagraphic mask (Spergel et al. 2013, 2015; Zhao 2014).Laboratory demonstration of the concept have been carried outin this context (Shi et al. 2015). We have also performed pre-liminary tests and obtained encouraging results of the Zernikesensor on the coronagraphic testbed in Marseille (N’Diaye et al.2012, 2014; Dohlen et al. 2013). However, and to the best of ourknowledge, no experimental validation has been performed ona real instrument for the measurement of coronagraphic aberra-tions.
In this paper, we propose to validate the Zernike phase-masksensor for the measurement of differential aberrations in a realexoplanet direct-imaging instrument, SPHERE at the VLT. Wedesigned a sensor called ZELDA (which stands for Zernike sen-sor for Extremely Low-level Differential Aberrations) and in-stalled a manufactured prototype in SPHERE during its rein-tegration at the ESO Paranal observatory in 2014. We presentthe first experimental results, using the internal light sourceof the instrument. After recalling the principle and formalismof the Zernike sensor, we present the design, properties, andmanufacturing of ZELDA. We then evaluate the performanceof our wavefront sensor in the presence of different aberrationmodes and analyze its sensitivity to spectral bandpass. We fi-nally present the first results of ZELDA-based wavefront correc-tion on VLT/SPHERE for the long-lived speckles and derive thecontrast gain achieved with this calibration.
2. ZELDA sensor
2.1. Principle and formalism
The ZELDA sensor is based on phase-contrast techniques thatwere proposed by Zernike (1934) to measure NCPA in high-contrast imaging instruments with nanometric accuracy. Webriefly recall the principle and formalism of this Zernike sensorthat were detailed in Paper I.
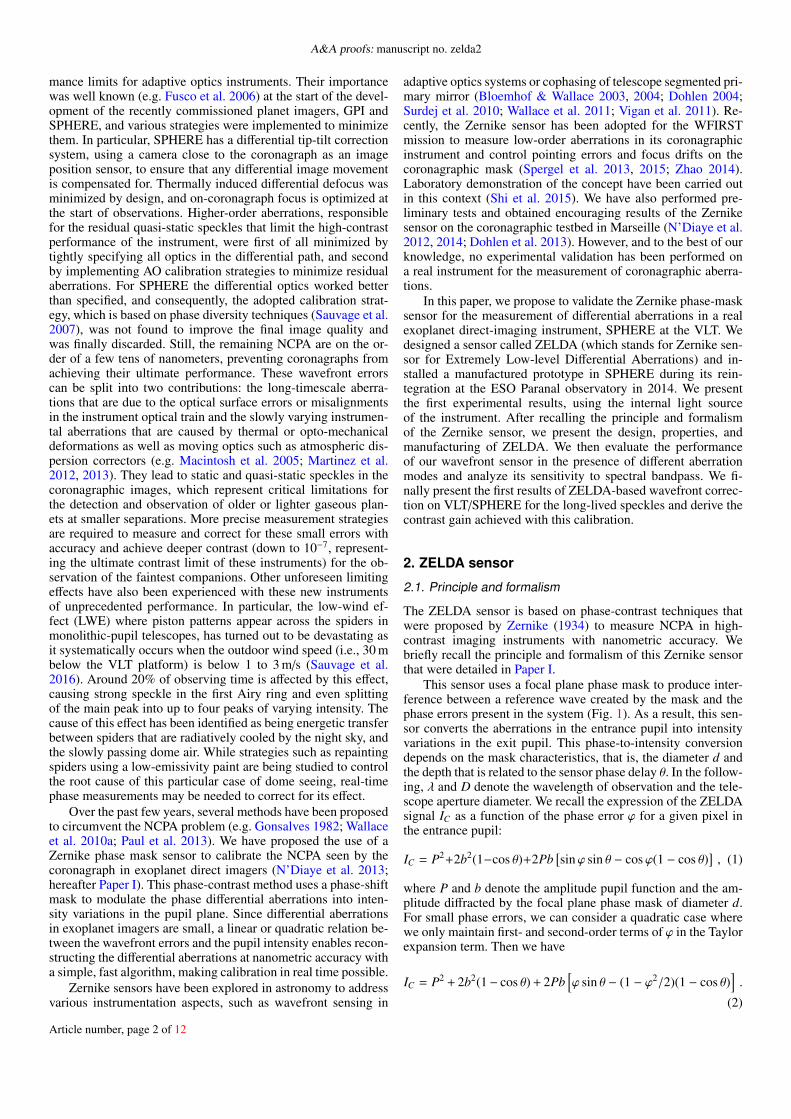
This sensor uses a focal plane phase mask to produce inter-ference between a reference wave created by the mask and thephase errors present in the system (Fig. 1). As a result, this sen-sor converts the aberrations in the entrance pupil into intensityvariations in the exit pupil. This phase-to-intensity conversiondepends on the mask characteristics, that is, the diameter d andthe depth that is related to the sensor phase delay θ. In the follow-ing, λ and D denote the wavelength of observation and the tele-scope aperture diameter. We recall the expression of the ZELDAsignal IC as a function of the phase error ϕ for a given pixel inthe entrance pupil:
IC = P2+2b2(1−cos θ)+2Pb[sinϕ sin θ − cosϕ(1 − cos θ)
], (1)
where P and b denote the amplitude pupil function and the am-plitude diffracted by the focal plane phase mask of diameter d.For small phase errors, we can consider a quadratic case wherewe only maintain first- and second-order terms of ϕ in the Taylorexpansion term. Then we have
IC = P2 + 2b2(1− cos θ) + 2Pb[ϕ sin θ − (1 − ϕ2/2)(1 − cos θ)
].
(2)
Article number, page 2 of 12
M. N’Diaye et al.: Zernike phase-mask sensor. II.
Phase maskWavefront error map ZELDA meas.
Entrance pupil plane A Focal plane B Exit pupil
plane C
Cam
era
Fig. 1. Principle of the ZELDA analysis with wavefront errors in theentrance pupil plane A to estimate, a phase mask centered on the stellarsignal in the following focal plane B, and the intensity measurement inthe re-imaged pupil plane C. A linear or quadratic reconstruction of theaberrations is performed from the recorded intensity with nanometricaccuracy.
The phase can be recovered from the intensity by solving thissecond-order equation. For a phase mask with depth θ = π/2 andangular diameter 1.06 λ0/D, where λ0 denotes the wavelength ofdesign, b ranges between 0.4 and 0.6 (see Fig. 3 of Paper I).Assuming a normalized amplitude in the entrance pupil P = 1,we obtain the solution
ϕ = −1 +√
3 − 2b − (1 − IC)/b . (3)
The formalism of the Zernike phase-mask sensor is valid for anyaperture geometry, including primary mirror segmentation, cen-tral obstruction, or spider struts, since the intensity measurementand the phase reconstruction is performed inside the geometricpupil at any given point. This property makes our sensor particu-larly interesting for measurements in the context of a deformablemirror (DM) with dead actuators as in SPHERE, since their re-spective points do not alter the measurements of the other pointsinside the geometric pupil.
2.2. Design and properties
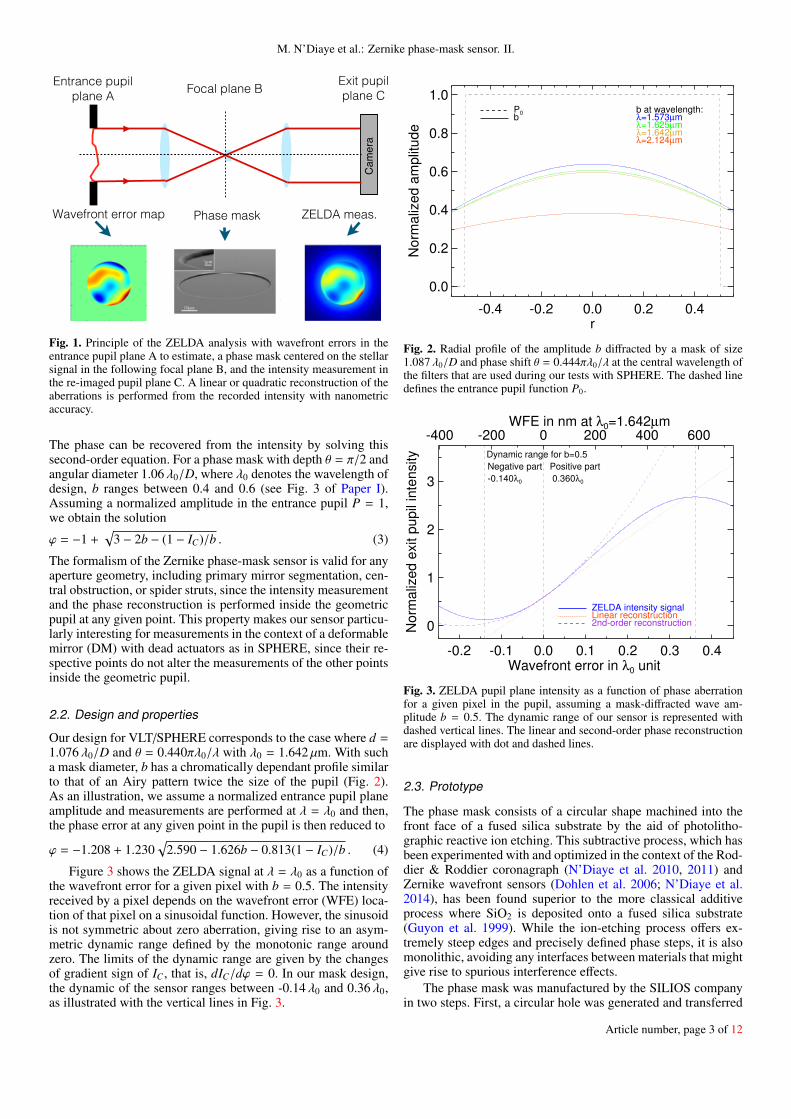
Our design for VLT/SPHERE corresponds to the case where d =1.076 λ0/D and θ = 0.440πλ0/λ with λ0 = 1.642 µm. With sucha mask diameter, b has a chromatically dependant profile similarto that of an Airy pattern twice the size of the pupil (Fig. 2).As an illustration, we assume a normalized entrance pupil planeamplitude and measurements are performed at λ = λ0 and then,the phase error at any given point in the pupil is then reduced to
ϕ = −1.208 + 1.230√
2.590 − 1.626b − 0.813(1 − IC)/b . (4)
Figure 3 shows the ZELDA signal at λ = λ0 as a function ofthe wavefront error for a given pixel with b = 0.5. The intensityreceived by a pixel depends on the wavefront error (WFE) loca-tion of that pixel on a sinusoidal function. However, the sinusoidis not symmetric about zero aberration, giving rise to an asym-metric dynamic range defined by the monotonic range aroundzero. The limits of the dynamic range are given by the changesof gradient sign of IC , that is, dIC/dϕ = 0. In our mask design,the dynamic of the sensor ranges between -0.14 λ0 and 0.36 λ0,as illustrated with the vertical lines in Fig. 3.
-0.4 -0.2 0.0 0.2 0.4r
0.0
0.2
0.4
0.6
0.8
1.0
No
rma
lize
d a
mp
litu
de
b at wavelength:λ=1.573µmλ=1.625µmλ=1.642µmλ=2.124µm
P0b
Fig. 2. Radial profile of the amplitude b diffracted by a mask of size1.087 λ0/D and phase shift θ = 0.444πλ0/λ at the central wavelength ofthe filters that are used during our tests with SPHERE. The dashed linedefines the entrance pupil function P0.
-0.2 -0.1 0.0 0.1 0.2 0.3 0.4Wavefront error in λ0 unit
0
1
2
3
No
rma
lize
d e
xit p
up
il in
ten
sity Dynamic range for b=0.5
Negative part
-0.140λ0
Positive part
0.360λ0
-400 -200 0 200 400 600WFE in nm at λ0=1.642µm
ZELDA intensity signalLinear reconstruction2nd-order reconstruction
Fig. 3. ZELDA pupil plane intensity as a function of phase aberrationfor a given pixel in the pupil, assuming a mask-diffracted wave am-plitude b = 0.5. The dynamic range of our sensor is represented withdashed vertical lines. The linear and second-order phase reconstructionare displayed with dot and dashed lines.
2.3. Prototype
The phase mask consists of a circular shape machined into thefront face of a fused silica substrate by the aid of photolitho-graphic reactive ion etching. This subtractive process, which hasbeen experimented with and optimized in the context of the Rod-dier & Roddier coronagraph (N’Diaye et al. 2010, 2011) andZernike wavefront sensors (Dohlen et al. 2006; N’Diaye et al.2014), has been found superior to the more classical additiveprocess where SiO2 is deposited onto a fused silica substrate(Guyon et al. 1999). While the ion-etching process offers ex-tremely steep edges and precisely defined phase steps, it is alsomonolithic, avoiding any interfaces between materials that mightgive rise to spurious interference effects.
The phase mask was manufactured by the SILIOS companyin two steps. First, a circular hole was generated and transferred
Article number, page 3 of 12
A&A proofs: manuscript no. zelda2
10 mm
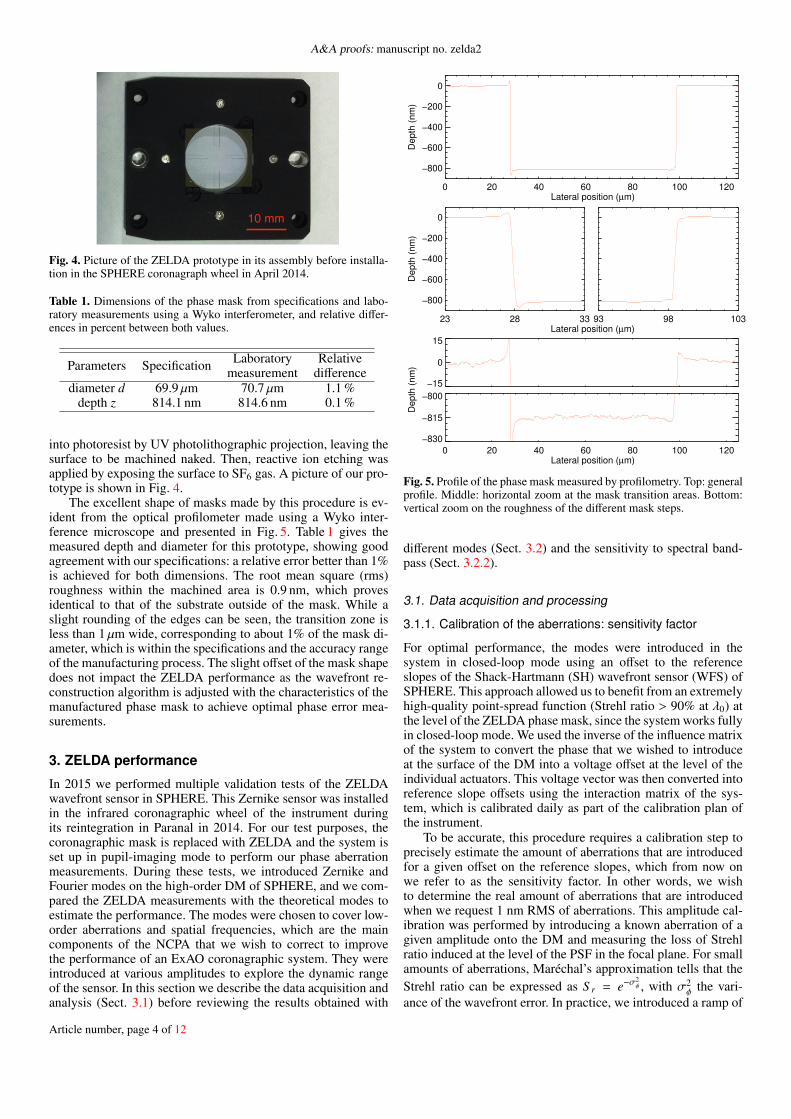
Fig. 4. Picture of the ZELDA prototype in its assembly before installa-tion in the SPHERE coronagraph wheel in April 2014.
Table 1. Dimensions of the phase mask from specifications and labo-ratory measurements using a Wyko interferometer, and relative differ-ences in percent between both values.
Parameters Specification Laboratory Relativemeasurement difference
diameter d 69.9 µm 70.7 µm 1.1 %depth z 814.1 nm 814.6 nm 0.1 %
into photoresist by UV photolithographic projection, leaving thesurface to be machined naked. Then, reactive ion etching wasapplied by exposing the surface to SF6 gas. A picture of our pro-totype is shown in Fig. 4.
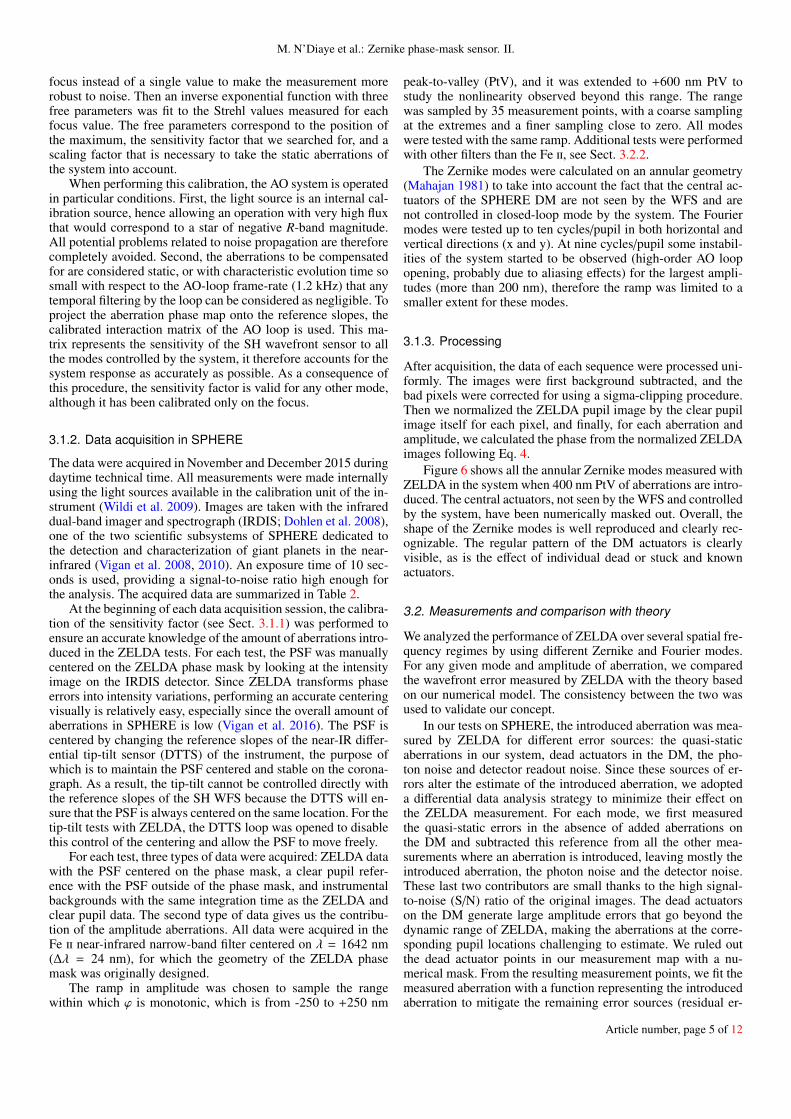
The excellent shape of masks made by this procedure is ev-ident from the optical profilometer made using a Wyko inter-ference microscope and presented in Fig. 5. Table 1 gives themeasured depth and diameter for this prototype, showing goodagreement with our specifications: a relative error better than 1%is achieved for both dimensions. The root mean square (rms)roughness within the machined area is 0.9 nm, which provesidentical to that of the substrate outside of the mask. While aslight rounding of the edges can be seen, the transition zone isless than 1 µm wide, corresponding to about 1% of the mask di-ameter, which is within the specifications and the accuracy rangeof the manufacturing process. The slight offset of the mask shapedoes not impact the ZELDA performance as the wavefront re-construction algorithm is adjusted with the characteristics of themanufactured phase mask to achieve optimal phase error mea-surements.
3. ZELDA performance
In 2015 we performed multiple validation tests of the ZELDAwavefront sensor in SPHERE. This Zernike sensor was installedin the infrared coronagraphic wheel of the instrument duringits reintegration in Paranal in 2014. For our test purposes, thecoronagraphic mask is replaced with ZELDA and the system isset up in pupil-imaging mode to perform our phase aberrationmeasurements. During these tests, we introduced Zernike andFourier modes on the high-order DM of SPHERE, and we com-pared the ZELDA measurements with the theoretical modes toestimate the performance. The modes were chosen to cover low-order aberrations and spatial frequencies, which are the maincomponents of the NCPA that we wish to correct to improvethe performance of an ExAO coronagraphic system. They wereintroduced at various amplitudes to explore the dynamic rangeof the sensor. In this section we describe the data acquisition andanalysis (Sect. 3.1) before reviewing the results obtained with
0 20 40 60 80 100 120Lateral position (µm)
−800
−600
−400
−200
0
De
pth
(n
m)
23 28 33 Lateral position (µm)
−800
−600
−400
−200
0
De
pth
(n
m)
93 98 103
−15
0
15
0 20 40 60 80 100 120Lateral position (µm)
−830
−815
−800
D
ep
th (
nm
)
Fig. 5. Profile of the phase mask measured by profilometry. Top: generalprofile. Middle: horizontal zoom at the mask transition areas. Bottom:vertical zoom on the roughness of the different mask steps.
different modes (Sect. 3.2) and the sensitivity to spectral band-pass (Sect. 3.2.2).
3.1. Data acquisition and processing
3.1.1. Calibration of the aberrations: sensitivity factor
For optimal performance, the modes were introduced in thesystem in closed-loop mode using an offset to the referenceslopes of the Shack-Hartmann (SH) wavefront sensor (WFS) ofSPHERE. This approach allowed us to benefit from an extremelyhigh-quality point-spread function (Strehl ratio > 90% at λ0) atthe level of the ZELDA phase mask, since the system works fullyin closed-loop mode. We used the inverse of the influence matrixof the system to convert the phase that we wished to introduceat the surface of the DM into a voltage offset at the level of theindividual actuators. This voltage vector was then converted intoreference slope offsets using the interaction matrix of the sys-tem, which is calibrated daily as part of the calibration plan ofthe instrument.
To be accurate, this procedure requires a calibration step toprecisely estimate the amount of aberrations that are introducedfor a given offset on the reference slopes, which from now onwe refer to as the sensitivity factor. In other words, we wishto determine the real amount of aberrations that are introducedwhen we request 1 nm RMS of aberrations. This amplitude cal-ibration was performed by introducing a known aberration of agiven amplitude onto the DM and measuring the loss of Strehlratio induced at the level of the PSF in the focal plane. For smallamounts of aberrations, Maréchal’s approximation tells that theStrehl ratio can be expressed as S r = e−σ
2φ , with σ2
φ the vari-ance of the wavefront error. In practice, we introduced a ramp of
Article number, page 4 of 12
M. N’Diaye et al.: Zernike phase-mask sensor. II.
focus instead of a single value to make the measurement morerobust to noise. Then an inverse exponential function with threefree parameters was fit to the Strehl values measured for eachfocus value. The free parameters correspond to the position ofthe maximum, the sensitivity factor that we searched for, and ascaling factor that is necessary to take the static aberrations ofthe system into account.
When performing this calibration, the AO system is operatedin particular conditions. First, the light source is an internal cal-ibration source, hence allowing an operation with very high fluxthat would correspond to a star of negative R-band magnitude.All potential problems related to noise propagation are thereforecompletely avoided. Second, the aberrations to be compensatedfor are considered static, or with characteristic evolution time sosmall with respect to the AO-loop frame-rate (1.2 kHz) that anytemporal filtering by the loop can be considered as negligible. Toproject the aberration phase map onto the reference slopes, thecalibrated interaction matrix of the AO loop is used. This ma-trix represents the sensitivity of the SH wavefront sensor to allthe modes controlled by the system, it therefore accounts for thesystem response as accurately as possible. As a consequence ofthis procedure, the sensitivity factor is valid for any other mode,although it has been calibrated only on the focus.
3.1.2. Data acquisition in SPHERE
The data were acquired in November and December 2015 duringdaytime technical time. All measurements were made internallyusing the light sources available in the calibration unit of the in-strument (Wildi et al. 2009). Images are taken with the infrareddual-band imager and spectrograph (IRDIS; Dohlen et al. 2008),one of the two scientific subsystems of SPHERE dedicated tothe detection and characterization of giant planets in the near-infrared (Vigan et al. 2008, 2010). An exposure time of 10 sec-onds is used, providing a signal-to-noise ratio high enough forthe analysis. The acquired data are summarized in Table 2.
At the beginning of each data acquisition session, the calibra-tion of the sensitivity factor (see Sect. 3.1.1) was performed toensure an accurate knowledge of the amount of aberrations intro-duced in the ZELDA tests. For each test, the PSF was manuallycentered on the ZELDA phase mask by looking at the intensityimage on the IRDIS detector. Since ZELDA transforms phaseerrors into intensity variations, performing an accurate centeringvisually is relatively easy, especially since the overall amount ofaberrations in SPHERE is low (Vigan et al. 2016). The PSF iscentered by changing the reference slopes of the near-IR differ-ential tip-tilt sensor (DTTS) of the instrument, the purpose ofwhich is to maintain the PSF centered and stable on the corona-graph. As a result, the tip-tilt cannot be controlled directly withthe reference slopes of the SH WFS because the DTTS will en-sure that the PSF is always centered on the same location. For thetip-tilt tests with ZELDA, the DTTS loop was opened to disablethis control of the centering and allow the PSF to move freely.
For each test, three types of data were acquired: ZELDA datawith the PSF centered on the phase mask, a clear pupil refer-ence with the PSF outside of the phase mask, and instrumentalbackgrounds with the same integration time as the ZELDA andclear pupil data. The second type of data gives us the contribu-tion of the amplitude aberrations. All data were acquired in theFe ii near-infrared narrow-band filter centered on λ = 1642 nm(∆λ = 24 nm), for which the geometry of the ZELDA phasemask was originally designed.
The ramp in amplitude was chosen to sample the rangewithin which ϕ is monotonic, which is from -250 to +250 nm
peak-to-valley (PtV), and it was extended to +600 nm PtV tostudy the nonlinearity observed beyond this range. The rangewas sampled by 35 measurement points, with a coarse samplingat the extremes and a finer sampling close to zero. All modeswere tested with the same ramp. Additional tests were performedwith other filters than the Fe ii, see Sect. 3.2.2.
The Zernike modes were calculated on an annular geometry(Mahajan 1981) to take into account the fact that the central ac-tuators of the SPHERE DM are not seen by the WFS and arenot controlled in closed-loop mode by the system. The Fouriermodes were tested up to ten cycles/pupil in both horizontal andvertical directions (x and y). At nine cycles/pupil some instabil-ities of the system started to be observed (high-order AO loopopening, probably due to aliasing effects) for the largest ampli-tudes (more than 200 nm), therefore the ramp was limited to asmaller extent for these modes.
3.1.3. Processing
After acquisition, the data of each sequence were processed uni-formly. The images were first background subtracted, and thebad pixels were corrected for using a sigma-clipping procedure.Then we normalized the ZELDA pupil image by the clear pupilimage itself for each pixel, and finally, for each aberration andamplitude, we calculated the phase from the normalized ZELDAimages following Eq. 4.
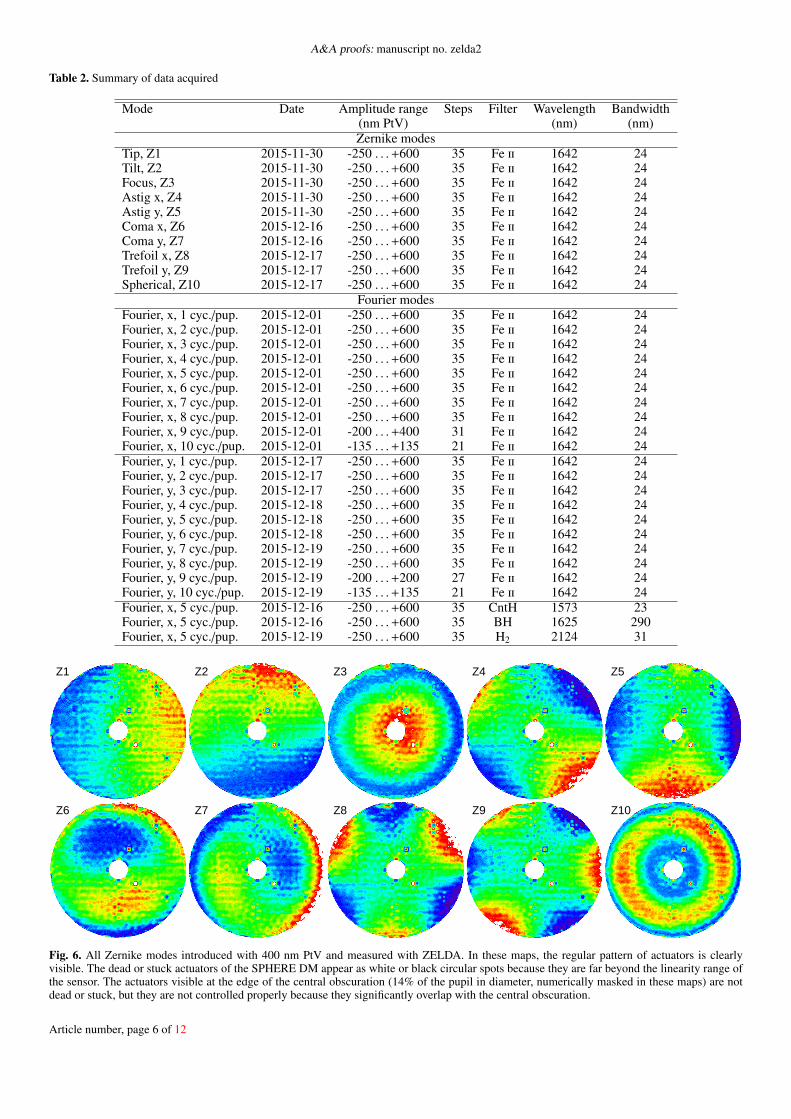
Figure 6 shows all the annular Zernike modes measured withZELDA in the system when 400 nm PtV of aberrations are intro-duced. The central actuators, not seen by the WFS and controlledby the system, have been numerically masked out. Overall, theshape of the Zernike modes is well reproduced and clearly rec-ognizable. The regular pattern of the DM actuators is clearlyvisible, as is the effect of individual dead or stuck and knownactuators.
3.2. Measurements and comparison with theory
We analyzed the performance of ZELDA over several spatial fre-quency regimes by using different Zernike and Fourier modes.For any given mode and amplitude of aberration, we comparedthe wavefront error measured by ZELDA with the theory basedon our numerical model. The consistency between the two wasused to validate our concept.
In our tests on SPHERE, the introduced aberration was mea-sured by ZELDA for different error sources: the quasi-staticaberrations in our system, dead actuators in the DM, the pho-ton noise and detector readout noise. Since these sources of er-rors alter the estimate of the introduced aberration, we adopteda differential data analysis strategy to minimize their effect onthe ZELDA measurement. For each mode, we first measuredthe quasi-static errors in the absence of added aberrations onthe DM and subtracted this reference from all the other mea-surements where an aberration is introduced, leaving mostly theintroduced aberration, the photon noise and the detector noise.These last two contributors are small thanks to the high signal-to-noise (S/N) ratio of the original images. The dead actuatorson the DM generate large amplitude errors that go beyond thedynamic range of ZELDA, making the aberrations at the corre-sponding pupil locations challenging to estimate. We ruled outthe dead actuator points in our measurement map with a nu-merical mask. From the resulting measurement points, we fit themeasured aberration with a function representing the introducedaberration to mitigate the remaining error sources (residual er-
Article number, page 5 of 12
A&A proofs: manuscript no. zelda2
Table 2. Summary of data acquired
Mode Date Amplitude range Steps Filter Wavelength Bandwidth(nm PtV) (nm) (nm)Zernike modes
Tip, Z1 2015-11-30 -250 . . . +600 35 Fe ii 1642 24Tilt, Z2 2015-11-30 -250 . . . +600 35 Fe ii 1642 24Focus, Z3 2015-11-30 -250 . . . +600 35 Fe ii 1642 24Astig x, Z4 2015-11-30 -250 . . . +600 35 Fe ii 1642 24Astig y, Z5 2015-11-30 -250 . . . +600 35 Fe ii 1642 24Coma x, Z6 2015-12-16 -250 . . . +600 35 Fe ii 1642 24Coma y, Z7 2015-12-16 -250 . . . +600 35 Fe ii 1642 24Trefoil x, Z8 2015-12-17 -250 . . . +600 35 Fe ii 1642 24Trefoil y, Z9 2015-12-17 -250 . . . +600 35 Fe ii 1642 24Spherical, Z10 2015-12-17 -250 . . . +600 35 Fe ii 1642 24
Fourier modesFourier, x, 1 cyc./pup. 2015-12-01 -250 . . . +600 35 Fe ii 1642 24Fourier, x, 2 cyc./pup. 2015-12-01 -250 . . . +600 35 Fe ii 1642 24Fourier, x, 3 cyc./pup. 2015-12-01 -250 . . . +600 35 Fe ii 1642 24Fourier, x, 4 cyc./pup. 2015-12-01 -250 . . . +600 35 Fe ii 1642 24Fourier, x, 5 cyc./pup. 2015-12-01 -250 . . . +600 35 Fe ii 1642 24Fourier, x, 6 cyc./pup. 2015-12-01 -250 . . . +600 35 Fe ii 1642 24Fourier, x, 7 cyc./pup. 2015-12-01 -250 . . . +600 35 Fe ii 1642 24Fourier, x, 8 cyc./pup. 2015-12-01 -250 . . . +600 35 Fe ii 1642 24Fourier, x, 9 cyc./pup. 2015-12-01 -200 . . . +400 31 Fe ii 1642 24Fourier, x, 10 cyc./pup. 2015-12-01 -135 . . . +135 21 Fe ii 1642 24Fourier, y, 1 cyc./pup. 2015-12-17 -250 . . . +600 35 Fe ii 1642 24Fourier, y, 2 cyc./pup. 2015-12-17 -250 . . . +600 35 Fe ii 1642 24Fourier, y, 3 cyc./pup. 2015-12-17 -250 . . . +600 35 Fe ii 1642 24Fourier, y, 4 cyc./pup. 2015-12-18 -250 . . . +600 35 Fe ii 1642 24Fourier, y, 5 cyc./pup. 2015-12-18 -250 . . . +600 35 Fe ii 1642 24Fourier, y, 6 cyc./pup. 2015-12-18 -250 . . . +600 35 Fe ii 1642 24Fourier, y, 7 cyc./pup. 2015-12-19 -250 . . . +600 35 Fe ii 1642 24Fourier, y, 8 cyc./pup. 2015-12-19 -250 . . . +600 35 Fe ii 1642 24Fourier, y, 9 cyc./pup. 2015-12-19 -200 . . . +200 27 Fe ii 1642 24Fourier, y, 10 cyc./pup. 2015-12-19 -135 . . . +135 21 Fe ii 1642 24Fourier, x, 5 cyc./pup. 2015-12-16 -250 . . . +600 35 CntH 1573 23Fourier, x, 5 cyc./pup. 2015-12-16 -250 . . . +600 35 BH 1625 290Fourier, x, 5 cyc./pup. 2015-12-19 -250 . . . +600 35 H2 2124 31
Z1 Z2 Z3 Z4 Z5
Z6 Z7 Z8 Z9 Z10
Fig. 6. All Zernike modes introduced with 400 nm PtV and measured with ZELDA. In these maps, the regular pattern of actuators is clearlyvisible. The dead or stuck actuators of the SPHERE DM appear as white or black circular spots because they are far beyond the linearity range ofthe sensor. The actuators visible at the edge of the central obscuration (14% of the pupil in diameter, numerically masked in these maps) are notdead or stuck, but they are not controlled properly because they significantly overlap with the central obscuration.
Article number, page 6 of 12
M. N’Diaye et al.: Zernike phase-mask sensor. II.
-100
-50
0
50
100
150M
ea
su
rem
en
t in
nm
rm
s Tip/Tilt
theoryexperiment Tipexperiment Tilt
-100 -50 0 50 100 150Wavefront error in nm rms
-5
0
5
Diffe
ren
ce
-100
-50
0
50
100
150
Me
asu
rem
en
t in
nm
rm
s Defocus
theoryexperiment
-100 -50 0 50 100 150Wavefront error in nm rms
-5
0
5
Diffe
ren
ce
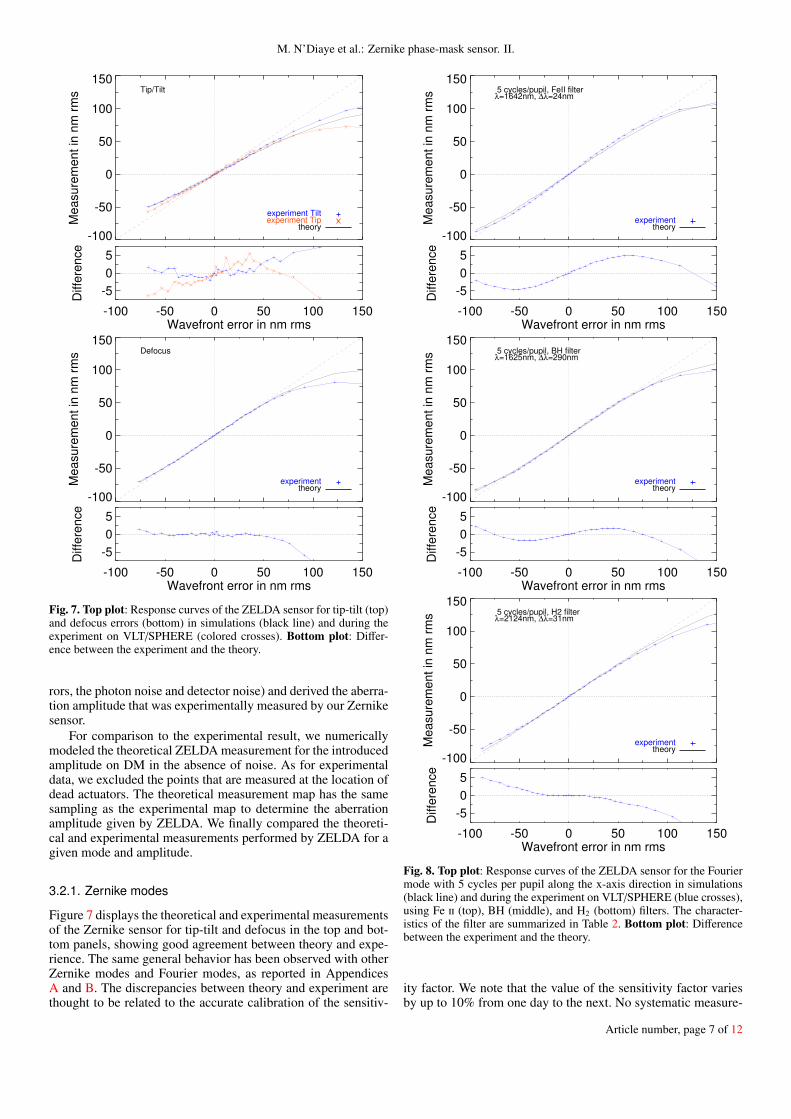
Fig. 7. Top plot: Response curves of the ZELDA sensor for tip-tilt (top)and defocus errors (bottom) in simulations (black line) and during theexperiment on VLT/SPHERE (colored crosses). Bottom plot: Differ-ence between the experiment and the theory.
rors, the photon noise and detector noise) and derived the aberra-tion amplitude that was experimentally measured by our Zernikesensor.
For comparison to the experimental result, we numericallymodeled the theoretical ZELDA measurement for the introducedamplitude on DM in the absence of noise. As for experimentaldata, we excluded the points that are measured at the location ofdead actuators. The theoretical measurement map has the samesampling as the experimental map to determine the aberrationamplitude given by ZELDA. We finally compared the theoreti-cal and experimental measurements performed by ZELDA for agiven mode and amplitude.
3.2.1. Zernike modes
Figure 7 displays the theoretical and experimental measurementsof the Zernike sensor for tip-tilt and defocus in the top and bot-tom panels, showing good agreement between theory and expe-rience. The same general behavior has been observed with otherZernike modes and Fourier modes, as reported in AppendicesA and B. The discrepancies between theory and experiment arethought to be related to the accurate calibration of the sensitiv-
-100
-50
0
50
100
150
Me
asu
rem
en
t in
nm
rm
s 5 cycles/pupil, FeII filterλ=1642nm, ∆λ=24nm
theoryexperiment
-100 -50 0 50 100 150Wavefront error in nm rms
-5
0
5
Diffe
ren
ce
-100
-50
0
50
100
150
Me
asu
rem
en
t in
nm
rm
s 5 cycles/pupil, BH filterλ=1625nm, ∆λ=290nm
theoryexperiment
-100 -50 0 50 100 150Wavefront error in nm rms
-5
0
5
Diffe
ren
ce
-100
-50
0
50
100
150
Me
asu
rem
en
t in
nm
rm
s 5 cycles/pupil, H2 filterλ=2124nm, ∆λ=31nm
theoryexperiment
-100 -50 0 50 100 150Wavefront error in nm rms
-5
0
5
Diffe
ren
ce
Fig. 8. Top plot: Response curves of the ZELDA sensor for the Fouriermode with 5 cycles per pupil along the x-axis direction in simulations(black line) and during the experiment on VLT/SPHERE (blue crosses),using Fe ii (top), BH (middle), and H2 (bottom) filters. The character-istics of the filter are summarized in Table 2. Bottom plot: Differencebetween the experiment and the theory.
ity factor. We note that the value of the sensitivity factor variesby up to 10% from one day to the next. No systematic measure-
Article number, page 7 of 12
A&A proofs: manuscript no. zelda2
ments were made to quantify the variations at higher temporalfrequency, but it is reasonable to assume that some variationscan be expected over the course of 5-6 hours (typical length ofour data acquisition sessions), leading to the small differencesobserved with respect to the theory.
The Zernike sensor shows a linear response around the zeropoint, enabling a simple reconstruction of the small corona-graphic aberrations and fast convergence with close-loop com-pensation toward the zero point in one or two iterations. In thisregime, the slope of the response curve is equal to one for allthe Zernike modes except for the tip-tilt errors. As underlined inPaper I, this behavior is believed to be due to the modification ofthe light distribution going through the decentered mask with re-spect to the star image. With a careful calibration, this effect willhave no impact on the ability of the Zernike sensor to measuretip-tilt errors.
For the aberrations outside the linear range, the Zernike sen-sor still proves efficient by considering a close-loop operationbetween with the measurement and correction. The measure-ments converge towards the linear regime of the wavefront sen-sor after a few iterations, as shown by Vigan et al. (2011). SinceZELDA is assumed to operate in the presence of small aberra-tions, our data analysis is based on a quadratic relation betweenthe measured intensity and the wavefront errors (see Sect. 2). In-vestigating a more accurate reconstruction expression could in-crease the measurement accuracy for large phase errors but thisis beyond the scope of the paper.
3.2.2. Sensitivity to spectral bandpass
The above results have been given for an internal light sourcepassing through a Fe ii narrow-band filter of central wavelengthλc =1642 nm and bandwidth ∆λ =24 nm, for which the ZELDAsensor has been originally designed. In Paper I we numericallystudied the sensitivity of the Zernike sensor to chromatic effects,showing the reliability of our concept for a light source withwell-known central wavelength. We now probe the performanceof our sensor experimentally by measuring aberrations in lightsource filtered with different chromatic parameters on SPHERE.
We analyzed the ZELDA response curve for a Fourier aber-ration mode with five cycles per pupil in three different filters:Fe ii (λc=1642 nm, ∆λ=24 nm), BH (λc=1625 nm, ∆λ=290 nm),and H2 (λc=2124 nm, ∆λ=31 nm). Based on the nature of theconsidered filters, we estimated the introduced aberration with adata analysis based on the terms θ and b that were re-evaluated atλ = λc, as shown in Fig. 2. The ZELDA measurements for thesethree filters are given in Fig. 8.
For each filter, the experimental measurements agree wellwith the numerical values. The match in BH and H2 filters seemsslightly better than in Fe ii filter, and we see two reasons thatmight explain this result: first of all, a better calibration of thesensitivity factor when the test with BH and H2 filters were per-formed, and second, the smaller amount of aberrations with re-spect to the wavelength at redder filters, enabling a more accu-rate measurement of the small errors by ZELDA, provided thatthe sensor has enough dynamic range to operate.
More interestingly, the second and third panels underline theability of ZELDA to perform accurate aberration measurementsusing filters with a wide spectral band (∆λ=290 nm) or centeredon a wavelength largely shifted from the wavelength of design(λc =2124 nm instead of λ0 =1642 nm, i.e., a shift of 482 nm), aslong as the data analysis accounts for the filter characteristics inits reduction. This interesting property of our sensor could provebeneficial for the estimation of chromatic aberrations by oper-
ating multichromatic aberration measurements with ZELDA atseveral narrow-band filters, ideally in parallel. Such measure-ments could possibly lead to contrast gain in post-processingmethods based on spectral deconvolution (Sparks & Ford 2002;Vigan et al. 2008) and hence, improvement in the extraction ofthe spectral information for the faintest planetary companions.
4. Results with ZELDA-based wavefront correction
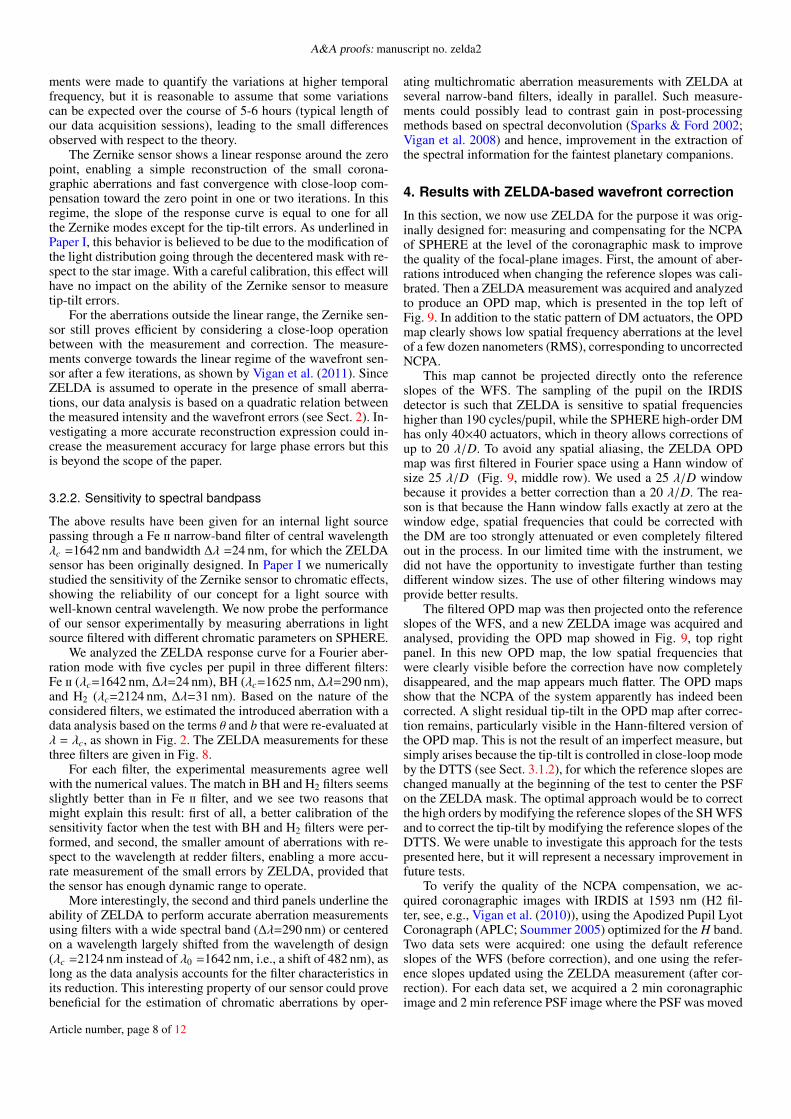
In this section, we now use ZELDA for the purpose it was orig-inally designed for: measuring and compensating for the NCPAof SPHERE at the level of the coronagraphic mask to improvethe quality of the focal-plane images. First, the amount of aber-rations introduced when changing the reference slopes was cali-brated. Then a ZELDA measurement was acquired and analyzedto produce an OPD map, which is presented in the top left ofFig. 9. In addition to the static pattern of DM actuators, the OPDmap clearly shows low spatial frequency aberrations at the levelof a few dozen nanometers (RMS), corresponding to uncorrectedNCPA.
This map cannot be projected directly onto the referenceslopes of the WFS. The sampling of the pupil on the IRDISdetector is such that ZELDA is sensitive to spatial frequencieshigher than 190 cycles/pupil, while the SPHERE high-order DMhas only 40×40 actuators, which in theory allows corrections ofup to 20 λ/D. To avoid any spatial aliasing, the ZELDA OPDmap was first filtered in Fourier space using a Hann window ofsize 25 λ/D (Fig. 9, middle row). We used a 25 λ/D windowbecause it provides a better correction than a 20 λ/D. The rea-son is that because the Hann window falls exactly at zero at thewindow edge, spatial frequencies that could be corrected withthe DM are too strongly attenuated or even completely filteredout in the process. In our limited time with the instrument, wedid not have the opportunity to investigate further than testingdifferent window sizes. The use of other filtering windows mayprovide better results.
The filtered OPD map was then projected onto the referenceslopes of the WFS, and a new ZELDA image was acquired andanalysed, providing the OPD map showed in Fig. 9, top rightpanel. In this new OPD map, the low spatial frequencies thatwere clearly visible before the correction have now completelydisappeared, and the map appears much flatter. The OPD mapsshow that the NCPA of the system apparently has indeed beencorrected. A slight residual tip-tilt in the OPD map after correc-tion remains, particularly visible in the Hann-filtered version ofthe OPD map. This is not the result of an imperfect measure, butsimply arises because the tip-tilt is controlled in close-loop modeby the DTTS (see Sect. 3.1.2), for which the reference slopes arechanged manually at the beginning of the test to center the PSFon the ZELDA mask. The optimal approach would be to correctthe high orders by modifying the reference slopes of the SH WFSand to correct the tip-tilt by modifying the reference slopes of theDTTS. We were unable to investigate this approach for the testspresented here, but it will represent a necessary improvement infuture tests.
To verify the quality of the NCPA compensation, we ac-quired coronagraphic images with IRDIS at 1593 nm (H2 fil-ter, see, e.g., Vigan et al. (2010)), using the Apodized Pupil LyotCoronagraph (APLC; Soummer 2005) optimized for the H band.Two data sets were acquired: one using the default referenceslopes of the WFS (before correction), and one using the refer-ence slopes updated using the ZELDA measurement (after cor-rection). For each data set, we acquired a 2 min coronagraphicimage and 2 min reference PSF image where the PSF was moved
Article number, page 8 of 12
M. N’Diaye et al.: Zernike phase-mask sensor. II.
Before correction After correction
Before correction[filtered]
After correction[filtered]
-150
-100
-50
0
50
100
150
Pha
se e
rror
s [n
m]
Before correction After correction
0 5 10 15 20 λ/D 0 5 10 15 20 λ/D10-6
10-5
10-4
10-3C
ontr
ast
Fig. 9. Illustration of the correction of the SPHERE NCPA usingZELDA measurements with IRDIS. The top row shows the OPD mapsmeasured with ZELDA before (left) and after (right) the correction, pre-sented at the same color scale. The middle row shows the same mapsfiltered in Fourier space using a Hann window of size 25 λ/D (see text).Low spatial frequency aberrations are clearly visible on the left, whilethey have disappeared after the correction, except for a small amountof residual tip-tilt (see text). The bottom row shows the equivalent focalplane coronagraphic images before (left) and after (right) the compen-sation of the NCPA, measured at 1593 nm (IRDIS H2 filter) and pre-sented at the same color scale. The gain is obvious close to the center,but also noticeable farther out where the intensity of the speckles in thecorrected area has decreased significantly.
out of the coronagraphic mask. A neutral density filter was usedto acquire the reference PSF without saturating the peak. Cor-responding instrumental backgrounds were also acquired. Theresulting coronagraphic images are showed in the bottom rowof Fig. 9. The visual difference between the two images is strik-ing inside the AO-corrected area. The image before correction isdominated by speckles close to the axis, up to 7-8 λ/D. It alsoshows a strong horizontal and vertical pattern of speckles thatextend from the edge of the corrected region down to ∼10 λ/D.After the NCPA correction, the whole AO-corrected region ap-pears much cleaner: the speckles close to the axis have almostdisappeared to reveal a very regular annulus at the edge of thecoronagraphic mask, similar to what is expected from the theo-retical design of the SPHERE APLC (Guerri et al. 2011). In the4-8 λ/D range, the static speckles are also strongly attenuated.In the remaining AO-corrected region, the speckles are also at-tenuated, which is particularly visible along the horizontal and
10-7
10-6
10-5
10-4
Nor
mal
ized
sta
ndar
d de
viat
ion
0 5 10 15 20 25 30Angular separation [λ/D]
16
14
12
10
Con
tras
t [m
ag]
Before correctionAfter correction
SPHERE APLC (theory)
0.0 0.2 0.4 0.6 0.8 1.0 1.2Angular separation [as]
1
10
Gai
n
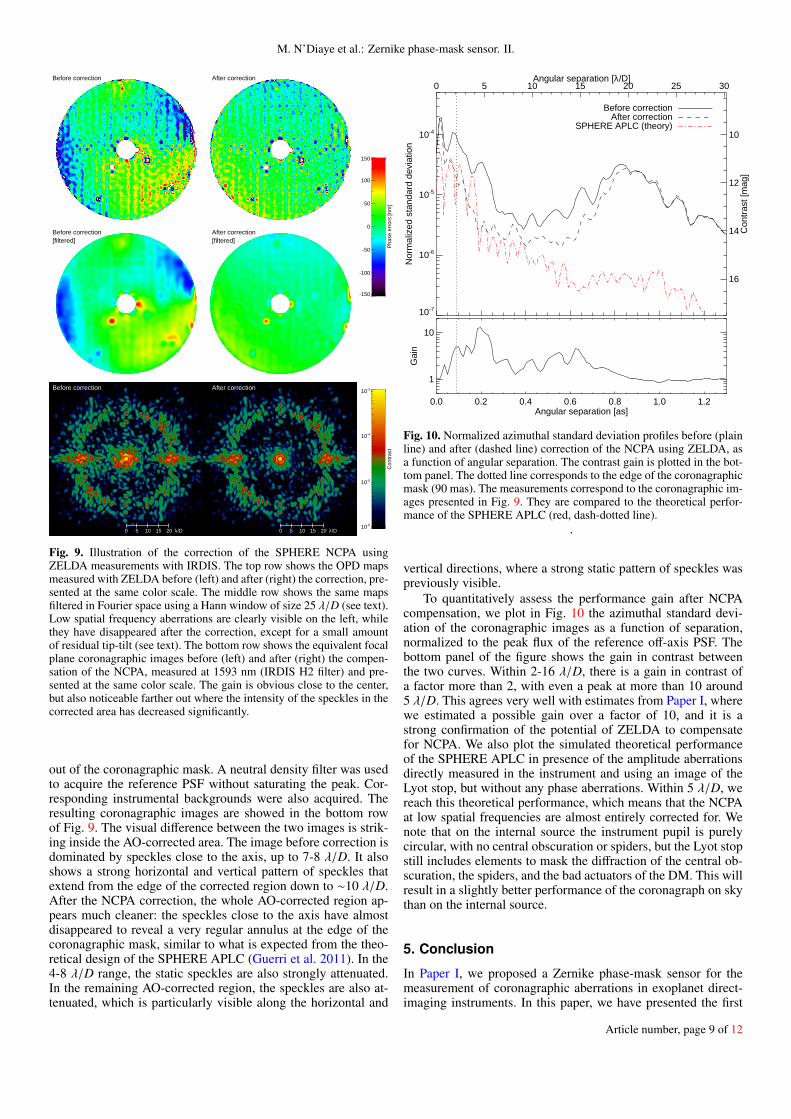
Fig. 10. Normalized azimuthal standard deviation profiles before (plainline) and after (dashed line) correction of the NCPA using ZELDA, asa function of angular separation. The contrast gain is plotted in the bot-tom panel. The dotted line corresponds to the edge of the coronagraphicmask (90 mas). The measurements correspond to the coronagraphic im-ages presented in Fig. 9. They are compared to the theoretical perfor-mance of the SPHERE APLC (red, dash-dotted line).
.
vertical directions, where a strong static pattern of speckles waspreviously visible.
To quantitatively assess the performance gain after NCPAcompensation, we plot in Fig. 10 the azimuthal standard devi-ation of the coronagraphic images as a function of separation,normalized to the peak flux of the reference off-axis PSF. Thebottom panel of the figure shows the gain in contrast betweenthe two curves. Within 2-16 λ/D, there is a gain in contrast ofa factor more than 2, with even a peak at more than 10 around5 λ/D. This agrees very well with estimates from Paper I, wherewe estimated a possible gain over a factor of 10, and it is astrong confirmation of the potential of ZELDA to compensatefor NCPA. We also plot the simulated theoretical performanceof the SPHERE APLC in presence of the amplitude aberrationsdirectly measured in the instrument and using an image of theLyot stop, but without any phase aberrations. Within 5 λ/D, wereach this theoretical performance, which means that the NCPAat low spatial frequencies are almost entirely corrected for. Wenote that on the internal source the instrument pupil is purelycircular, with no central obscuration or spiders, but the Lyot stopstill includes elements to mask the diffraction of the central ob-scuration, the spiders, and the bad actuators of the DM. This willresult in a slightly better performance of the coronagraph on skythan on the internal source.
5. Conclusion
In Paper I, we proposed a Zernike phase-mask sensor for themeasurement of coronagraphic aberrations in exoplanet direct-imaging instruments. In this paper, we have presented the first
Article number, page 9 of 12
A&A proofs: manuscript no. zelda2
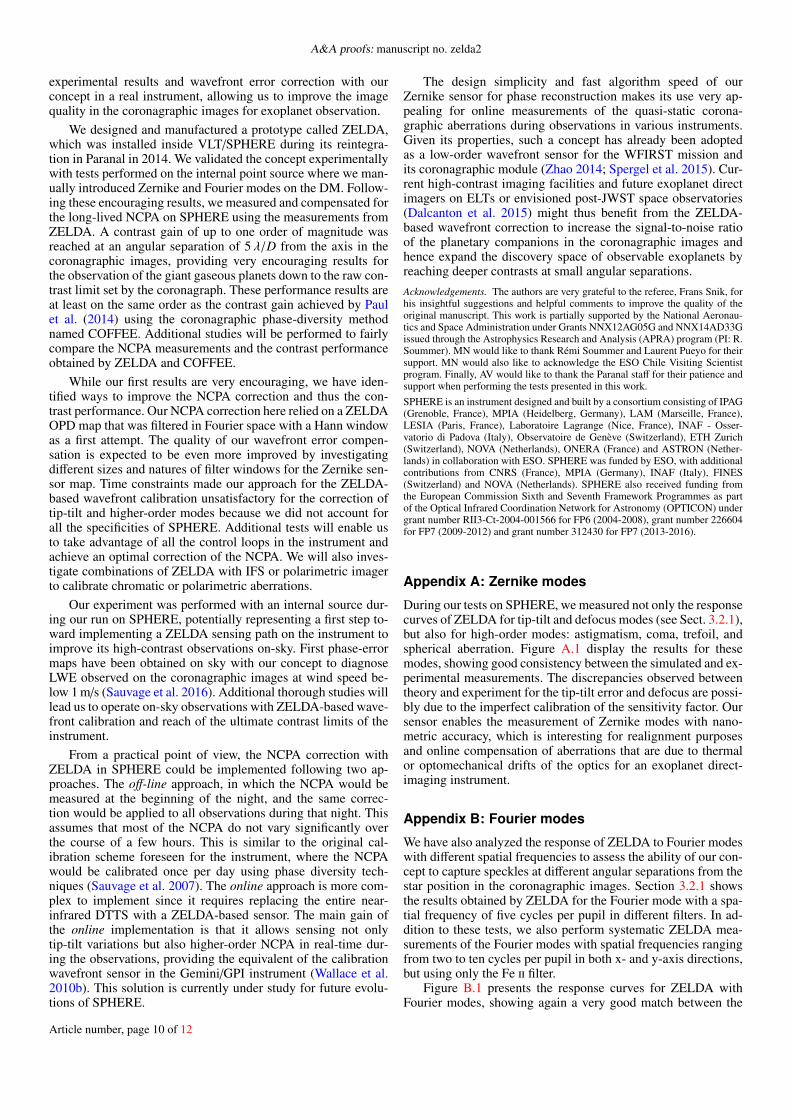
experimental results and wavefront error correction with ourconcept in a real instrument, allowing us to improve the imagequality in the coronagraphic images for exoplanet observation.
We designed and manufactured a prototype called ZELDA,which was installed inside VLT/SPHERE during its reintegra-tion in Paranal in 2014. We validated the concept experimentallywith tests performed on the internal point source where we man-ually introduced Zernike and Fourier modes on the DM. Follow-ing these encouraging results, we measured and compensated forthe long-lived NCPA on SPHERE using the measurements fromZELDA. A contrast gain of up to one order of magnitude wasreached at an angular separation of 5 λ/D from the axis in thecoronagraphic images, providing very encouraging results forthe observation of the giant gaseous planets down to the raw con-trast limit set by the coronagraph. These performance results areat least on the same order as the contrast gain achieved by Paulet al. (2014) using the coronagraphic phase-diversity methodnamed COFFEE. Additional studies will be performed to fairlycompare the NCPA measurements and the contrast performanceobtained by ZELDA and COFFEE.
While our first results are very encouraging, we have iden-tified ways to improve the NCPA correction and thus the con-trast performance. Our NCPA correction here relied on a ZELDAOPD map that was filtered in Fourier space with a Hann windowas a first attempt. The quality of our wavefront error compen-sation is expected to be even more improved by investigatingdifferent sizes and natures of filter windows for the Zernike sen-sor map. Time constraints made our approach for the ZELDA-based wavefront calibration unsatisfactory for the correction oftip-tilt and higher-order modes because we did not account forall the specificities of SPHERE. Additional tests will enable usto take advantage of all the control loops in the instrument andachieve an optimal correction of the NCPA. We will also inves-tigate combinations of ZELDA with IFS or polarimetric imagerto calibrate chromatic or polarimetric aberrations.
Our experiment was performed with an internal source dur-ing our run on SPHERE, potentially representing a first step to-ward implementing a ZELDA sensing path on the instrument toimprove its high-contrast observations on-sky. First phase-errormaps have been obtained on sky with our concept to diagnoseLWE observed on the coronagraphic images at wind speed be-low 1 m/s (Sauvage et al. 2016). Additional thorough studies willlead us to operate on-sky observations with ZELDA-based wave-front calibration and reach of the ultimate contrast limits of theinstrument.
From a practical point of view, the NCPA correction withZELDA in SPHERE could be implemented following two ap-proaches. The off-line approach, in which the NCPA would bemeasured at the beginning of the night, and the same correc-tion would be applied to all observations during that night. Thisassumes that most of the NCPA do not vary significantly overthe course of a few hours. This is similar to the original cal-ibration scheme foreseen for the instrument, where the NCPAwould be calibrated once per day using phase diversity tech-niques (Sauvage et al. 2007). The online approach is more com-plex to implement since it requires replacing the entire near-infrared DTTS with a ZELDA-based sensor. The main gain ofthe online implementation is that it allows sensing not onlytip-tilt variations but also higher-order NCPA in real-time dur-ing the observations, providing the equivalent of the calibrationwavefront sensor in the Gemini/GPI instrument (Wallace et al.2010b). This solution is currently under study for future evolu-tions of SPHERE.
The design simplicity and fast algorithm speed of ourZernike sensor for phase reconstruction makes its use very ap-pealing for online measurements of the quasi-static corona-graphic aberrations during observations in various instruments.Given its properties, such a concept has already been adoptedas a low-order wavefront sensor for the WFIRST mission andits coronagraphic module (Zhao 2014; Spergel et al. 2015). Cur-rent high-contrast imaging facilities and future exoplanet directimagers on ELTs or envisioned post-JWST space observatories(Dalcanton et al. 2015) might thus benefit from the ZELDA-based wavefront correction to increase the signal-to-noise ratioof the planetary companions in the coronagraphic images andhence expand the discovery space of observable exoplanets byreaching deeper contrasts at small angular separations.Acknowledgements. The authors are very grateful to the referee, Frans Snik, forhis insightful suggestions and helpful comments to improve the quality of theoriginal manuscript. This work is partially supported by the National Aeronau-tics and Space Administration under Grants NNX12AG05G and NNX14AD33Gissued through the Astrophysics Research and Analysis (APRA) program (PI: R.Soummer). MN would like to thank Rémi Soummer and Laurent Pueyo for theirsupport. MN would also like to acknowledge the ESO Chile Visiting Scientistprogram. Finally, AV would like to thank the Paranal staff for their patience andsupport when performing the tests presented in this work.SPHERE is an instrument designed and built by a consortium consisting of IPAG(Grenoble, France), MPIA (Heidelberg, Germany), LAM (Marseille, France),LESIA (Paris, France), Laboratoire Lagrange (Nice, France), INAF - Osser-vatorio di Padova (Italy), Observatoire de Genève (Switzerland), ETH Zurich(Switzerland), NOVA (Netherlands), ONERA (France) and ASTRON (Nether-lands) in collaboration with ESO. SPHERE was funded by ESO, with additionalcontributions from CNRS (France), MPIA (Germany), INAF (Italy), FINES(Switzerland) and NOVA (Netherlands). SPHERE also received funding fromthe European Commission Sixth and Seventh Framework Programmes as partof the Optical Infrared Coordination Network for Astronomy (OPTICON) undergrant number RII3-Ct-2004-001566 for FP6 (2004-2008), grant number 226604for FP7 (2009-2012) and grant number 312430 for FP7 (2013-2016).
Appendix A: Zernike modes
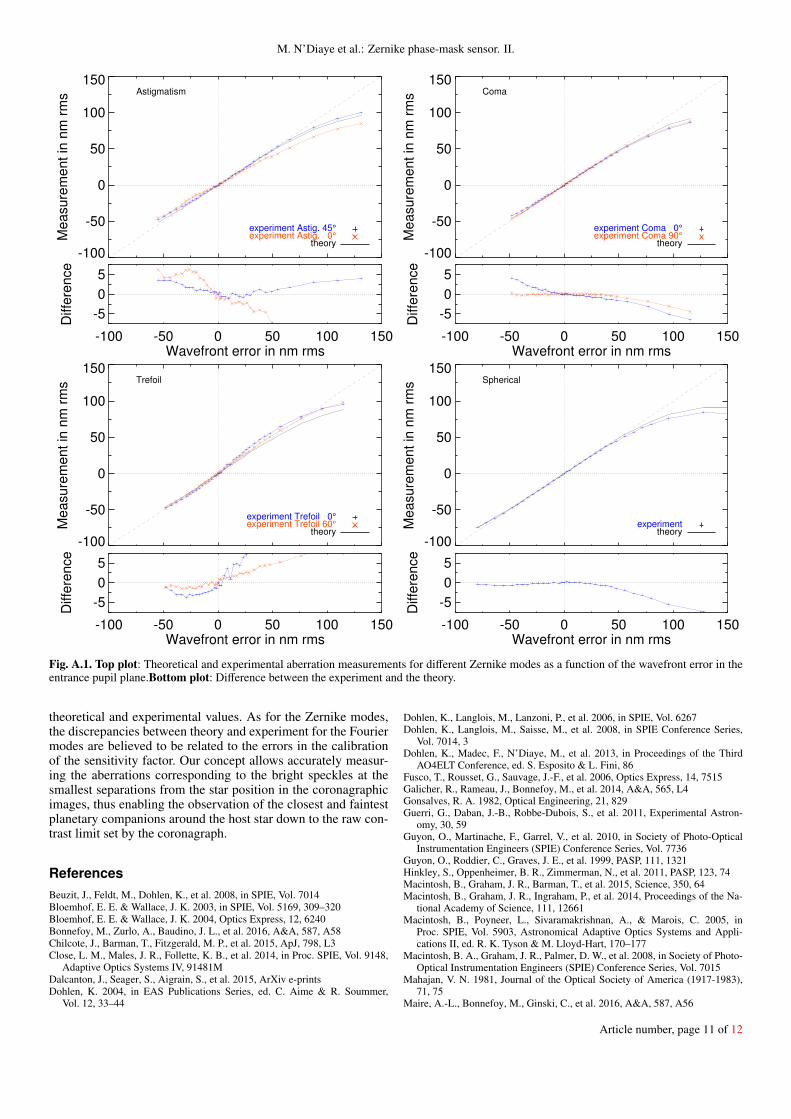
During our tests on SPHERE, we measured not only the responsecurves of ZELDA for tip-tilt and defocus modes (see Sect. 3.2.1),but also for high-order modes: astigmatism, coma, trefoil, andspherical aberration. Figure A.1 display the results for thesemodes, showing good consistency between the simulated and ex-perimental measurements. The discrepancies observed betweentheory and experiment for the tip-tilt error and defocus are possi-bly due to the imperfect calibration of the sensitivity factor. Oursensor enables the measurement of Zernike modes with nano-metric accuracy, which is interesting for realignment purposesand online compensation of aberrations that are due to thermalor optomechanical drifts of the optics for an exoplanet direct-imaging instrument.
Appendix B: Fourier modes
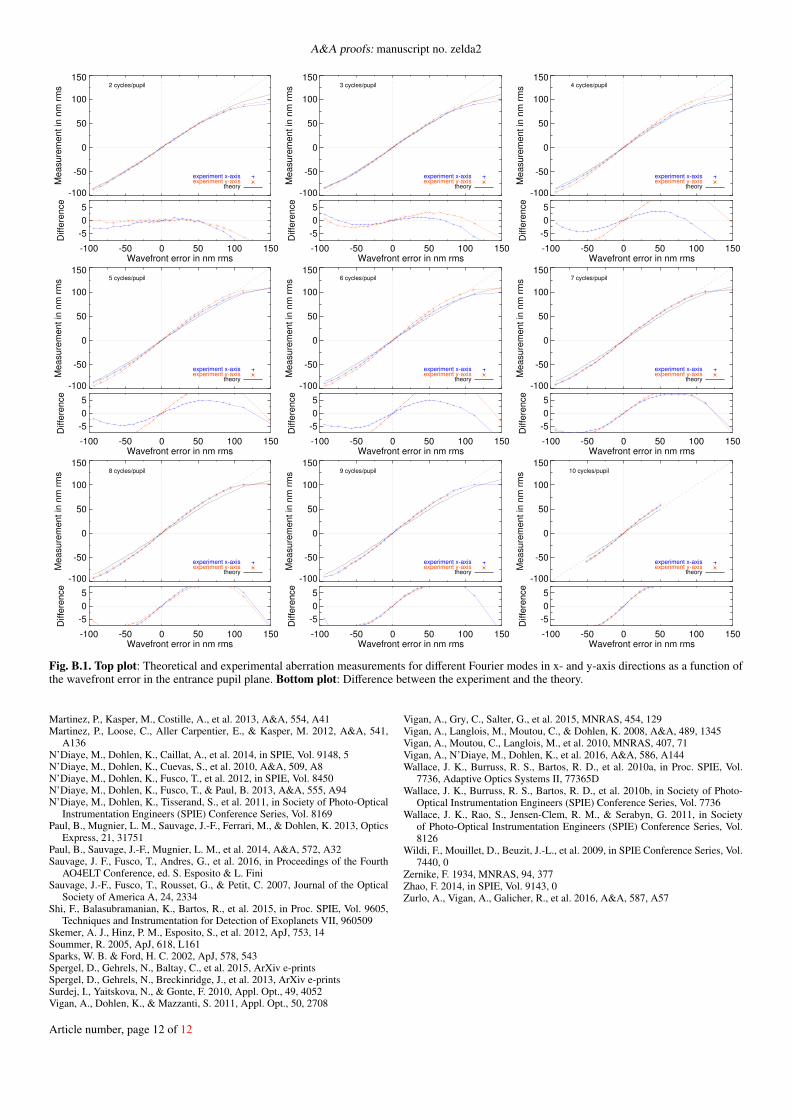
We have also analyzed the response of ZELDA to Fourier modeswith different spatial frequencies to assess the ability of our con-cept to capture speckles at different angular separations from thestar position in the coronagraphic images. Section 3.2.1 showsthe results obtained by ZELDA for the Fourier mode with a spa-tial frequency of five cycles per pupil in different filters. In ad-dition to these tests, we also perform systematic ZELDA mea-surements of the Fourier modes with spatial frequencies rangingfrom two to ten cycles per pupil in both x- and y-axis directions,but using only the Fe ii filter.
Figure B.1 presents the response curves for ZELDA withFourier modes, showing again a very good match between the
Article number, page 10 of 12
M. N’Diaye et al.: Zernike phase-mask sensor. II.
-100
-50
0
50
100
150
Measure
ment in
nm
rm
s Astigmatism
theoryexperiment Astig. 0°experiment Astig. 45°
-100 -50 0 50 100 150Wavefront error in nm rms
-5
0
5
Diffe
rence
-100
-50
0
50
100
150
Measure
ment in
nm
rm
s Coma
theoryexperiment Coma 90°experiment Coma 0°
-100 -50 0 50 100 150Wavefront error in nm rms
-5
0
5
Diffe
rence
-100
-50
0
50
100
150
Measure
ment in
nm
rm
s Trefoil
theoryexperiment Trefoil 60°experiment Trefoil 0°
-100 -50 0 50 100 150Wavefront error in nm rms
-5
0
5
Diffe
rence
-100
-50
0
50
100
150
Measure
ment in
nm
rm
s Spherical
theoryexperiment
-100 -50 0 50 100 150Wavefront error in nm rms
-5
0
5
Diffe
rence
Fig. A.1. Top plot: Theoretical and experimental aberration measurements for different Zernike modes as a function of the wavefront error in theentrance pupil plane.Bottom plot: Difference between the experiment and the theory.
theoretical and experimental values. As for the Zernike modes,the discrepancies between theory and experiment for the Fouriermodes are believed to be related to the errors in the calibrationof the sensitivity factor. Our concept allows accurately measur-ing the aberrations corresponding to the bright speckles at thesmallest separations from the star position in the coronagraphicimages, thus enabling the observation of the closest and faintestplanetary companions around the host star down to the raw con-trast limit set by the coronagraph.
ReferencesBeuzit, J., Feldt, M., Dohlen, K., et al. 2008, in SPIE, Vol. 7014Bloemhof, E. E. & Wallace, J. K. 2003, in SPIE, Vol. 5169, 309–320Bloemhof, E. E. & Wallace, J. K. 2004, Optics Express, 12, 6240Bonnefoy, M., Zurlo, A., Baudino, J. L., et al. 2016, A&A, 587, A58Chilcote, J., Barman, T., Fitzgerald, M. P., et al. 2015, ApJ, 798, L3Close, L. M., Males, J. R., Follette, K. B., et al. 2014, in Proc. SPIE, Vol. 9148,
Adaptive Optics Systems IV, 91481MDalcanton, J., Seager, S., Aigrain, S., et al. 2015, ArXiv e-printsDohlen, K. 2004, in EAS Publications Series, ed. C. Aime & R. Soummer,
Vol. 12, 33–44
Dohlen, K., Langlois, M., Lanzoni, P., et al. 2006, in SPIE, Vol. 6267Dohlen, K., Langlois, M., Saisse, M., et al. 2008, in SPIE Conference Series,
Vol. 7014, 3Dohlen, K., Madec, F., N’Diaye, M., et al. 2013, in Proceedings of the Third
AO4ELT Conference, ed. S. Esposito & L. Fini, 86Fusco, T., Rousset, G., Sauvage, J.-F., et al. 2006, Optics Express, 14, 7515Galicher, R., Rameau, J., Bonnefoy, M., et al. 2014, A&A, 565, L4Gonsalves, R. A. 1982, Optical Engineering, 21, 829Guerri, G., Daban, J.-B., Robbe-Dubois, S., et al. 2011, Experimental Astron-
omy, 30, 59Guyon, O., Martinache, F., Garrel, V., et al. 2010, in Society of Photo-Optical
Instrumentation Engineers (SPIE) Conference Series, Vol. 7736Guyon, O., Roddier, C., Graves, J. E., et al. 1999, PASP, 111, 1321Hinkley, S., Oppenheimer, B. R., Zimmerman, N., et al. 2011, PASP, 123, 74Macintosh, B., Graham, J. R., Barman, T., et al. 2015, Science, 350, 64Macintosh, B., Graham, J. R., Ingraham, P., et al. 2014, Proceedings of the Na-
tional Academy of Science, 111, 12661Macintosh, B., Poyneer, L., Sivaramakrishnan, A., & Marois, C. 2005, in
Proc. SPIE, Vol. 5903, Astronomical Adaptive Optics Systems and Appli-cations II, ed. R. K. Tyson & M. Lloyd-Hart, 170–177
Macintosh, B. A., Graham, J. R., Palmer, D. W., et al. 2008, in Society of Photo-Optical Instrumentation Engineers (SPIE) Conference Series, Vol. 7015
Mahajan, V. N. 1981, Journal of the Optical Society of America (1917-1983),71, 75
Maire, A.-L., Bonnefoy, M., Ginski, C., et al. 2016, A&A, 587, A56
Article number, page 11 of 12
A&A proofs: manuscript no. zelda2
-100
-50
0
50
100
150
Measure
ment in
nm
rm
s 2 cycles/pupil
theoryexperiment y-axisexperiment x-axis
-100 -50 0 50 100 150Wavefront error in nm rms
-5
0
5
Diffe
rence
-100
-50
0
50
100
150
Measure
ment in
nm
rm
s 3 cycles/pupil
theoryexperiment y-axisexperiment x-axis
-100 -50 0 50 100 150Wavefront error in nm rms
-5
0
5
Diffe
rence
-100
-50
0
50
100
150
Measure
ment in
nm
rm
s 4 cycles/pupil
theoryexperiment y-axisexperiment x-axis
-100 -50 0 50 100 150Wavefront error in nm rms
-5
0
5
Diffe
rence
-100
-50
0
50
100
150
Measure
ment in
nm
rm
s 5 cycles/pupil
theoryexperiment y-axisexperiment x-axis
-100 -50 0 50 100 150Wavefront error in nm rms
-5
0
5
Diffe
rence
-100
-50
0
50
100
150
Measure
ment in
nm
rm
s 6 cycles/pupil
theoryexperiment y-axisexperiment x-axis
-100 -50 0 50 100 150Wavefront error in nm rms
-5
0
5
Diffe
rence
-100
-50
0
50
100
150
Measure
ment in
nm
rm
s 7 cycles/pupil
theoryexperiment y-axisexperiment x-axis
-100 -50 0 50 100 150Wavefront error in nm rms
-5
0
5
Diffe
rence
-100
-50
0
50
100
150
Measure
ment in
nm
rm
s 8 cycles/pupil
theoryexperiment y-axisexperiment x-axis
-100 -50 0 50 100 150Wavefront error in nm rms
-5
0
5
Diffe
rence
-100
-50
0
50
100
150
Measure
ment in
nm
rm
s 9 cycles/pupil
theoryexperiment y-axisexperiment x-axis
-100 -50 0 50 100 150Wavefront error in nm rms
-5
0
5
Diffe
rence
-100
-50
0
50
100
150
Measure
ment in
nm
rm
s 10 cycles/pupil
theoryexperiment y-axisexperiment x-axis
-100 -50 0 50 100 150Wavefront error in nm rms
-5
0
5
Diffe
rence
Fig. B.1. Top plot: Theoretical and experimental aberration measurements for different Fourier modes in x- and y-axis directions as a function ofthe wavefront error in the entrance pupil plane. Bottom plot: Difference between the experiment and the theory.
Martinez, P., Kasper, M., Costille, A., et al. 2013, A&A, 554, A41Martinez, P., Loose, C., Aller Carpentier, E., & Kasper, M. 2012, A&A, 541,
A136N’Diaye, M., Dohlen, K., Caillat, A., et al. 2014, in SPIE, Vol. 9148, 5N’Diaye, M., Dohlen, K., Cuevas, S., et al. 2010, A&A, 509, A8N’Diaye, M., Dohlen, K., Fusco, T., et al. 2012, in SPIE, Vol. 8450N’Diaye, M., Dohlen, K., Fusco, T., & Paul, B. 2013, A&A, 555, A94N’Diaye, M., Dohlen, K., Tisserand, S., et al. 2011, in Society of Photo-Optical
Instrumentation Engineers (SPIE) Conference Series, Vol. 8169Paul, B., Mugnier, L. M., Sauvage, J.-F., Ferrari, M., & Dohlen, K. 2013, Optics
Express, 21, 31751Paul, B., Sauvage, J.-F., Mugnier, L. M., et al. 2014, A&A, 572, A32Sauvage, J. F., Fusco, T., Andres, G., et al. 2016, in Proceedings of the Fourth
AO4ELT Conference, ed. S. Esposito & L. FiniSauvage, J.-F., Fusco, T., Rousset, G., & Petit, C. 2007, Journal of the Optical
Society of America A, 24, 2334Shi, F., Balasubramanian, K., Bartos, R., et al. 2015, in Proc. SPIE, Vol. 9605,
Techniques and Instrumentation for Detection of Exoplanets VII, 960509Skemer, A. J., Hinz, P. M., Esposito, S., et al. 2012, ApJ, 753, 14Soummer, R. 2005, ApJ, 618, L161Sparks, W. B. & Ford, H. C. 2002, ApJ, 578, 543Spergel, D., Gehrels, N., Baltay, C., et al. 2015, ArXiv e-printsSpergel, D., Gehrels, N., Breckinridge, J., et al. 2013, ArXiv e-printsSurdej, I., Yaitskova, N., & Gonte, F. 2010, Appl. Opt., 49, 4052Vigan, A., Dohlen, K., & Mazzanti, S. 2011, Appl. Opt., 50, 2708
Vigan, A., Gry, C., Salter, G., et al. 2015, MNRAS, 454, 129Vigan, A., Langlois, M., Moutou, C., & Dohlen, K. 2008, A&A, 489, 1345Vigan, A., Moutou, C., Langlois, M., et al. 2010, MNRAS, 407, 71Vigan, A., N’Diaye, M., Dohlen, K., et al. 2016, A&A, 586, A144Wallace, J. K., Burruss, R. S., Bartos, R. D., et al. 2010a, in Proc. SPIE, Vol.
7736, Adaptive Optics Systems II, 77365DWallace, J. K., Burruss, R. S., Bartos, R. D., et al. 2010b, in Society of Photo-
Optical Instrumentation Engineers (SPIE) Conference Series, Vol. 7736Wallace, J. K., Rao, S., Jensen-Clem, R. M., & Serabyn, G. 2011, in Society
of Photo-Optical Instrumentation Engineers (SPIE) Conference Series, Vol.8126
Wildi, F., Mouillet, D., Beuzit, J.-L., et al. 2009, in SPIE Conference Series, Vol.7440, 0
Zernike, F. 1934, MNRAS, 94, 377Zhao, F. 2014, in SPIE, Vol. 9143, 0Zurlo, A., Vigan, A., Galicher, R., et al. 2016, A&A, 587, A57
Article number, page 12 of 12