Embed Size (px)
Citation preview

FLOTEK.G 2017- “Innovative Solutions in Flow Measurement and Control- Oil, Water and Gas”
August 28-30, 2017, FCRI, Palakkad, Kerala, India
Calibration of Electromagnetic Flowmeter Using Advanced
SCADA System
Ali Abbas
Research Scholar
Alternate Hydro Energy Centre
Indian Institute of Technology
Roorkee 247667, India
Email: [email protected]
Nitin Kumar Jhankal
Research Scholar
Alternate Hydro Energy Centre
Indian Institute of Technology
Roorkee 247667, India
Email: [email protected]
Arun Kumar
Professor, Alternate Hydro Energy Centre,
Indian Institute of Technology Roorkee,
Roorkee 247667, India
Email: [email protected]
ABSTRACT
The Programmable Logic Controller (PLC)
based Supervisory Control and Data
Acquisition (SCADA) system is designed for
automation, remote monitoring, signal
acquisition, data logging and report
generation for flow calibration and
measurement process. In this paper logic and
flow charts in PLC programming for
execution of calibration process and controls
are presented. In situ calibration of different
measuring instruments used in flow
calibration viz. flow meter, measuring tank
load cells, calibrator tank load cells have
been performed and calibration equations
have been derived from their calibration
curves. Gravimetric approach using flying
start and stop method has been adopted for
flow calibration in present study. Systematic
and random error of weighing balance and
flow diverter has been evaluated as per ISO
4185.
KEY WORDS
Calibration, measurement, SCADA,
gravimetric method, uncertainty,
experimental
1.0 INTRODUCTION
A fully automatic SCADA based Hydraulic
turbine R&D laboratory has been set-up in
2016 at Alternate Hydro Energy Centre
(AHEC), Indian Institute of Technology (IIT)
Roorkee, Uttarakhand, India, a center of
excellence for small hydropower in the
country, to validate the homologous hydro
models, designed and fabricated by various
turbines manufactures. During the flow
calibration and measurement, the main
process quantities e.g. water flow rate,
pressure and temperature are stabilized by
logic developed in a computer-based
Supervisory Control and Data Acquisition
(SCADA) system, with other relevant
process parameters like temperature, diverter
actuation, load cell reading and ambient-air
conditions, being monitored. This is an
essential prerequisite to provide reproducible
conditions that are necessary to achieve a
high degree of reproducibility in the
measurement and calibration processes.
The Programmable Logic Controller (PLC)
based SCADA system is used for automation,
remote monitoring, signal acquisition, data
logging and report generation. The data from
field instruments during calibration and
measurement of flow are acquired and
control commands to field devices are being
sent by SCADA. The PLC also controls the
process and acquire raw signal from field
instruments and convert it into the secondary

output parameters. The PLC is used as the
main decision making module.
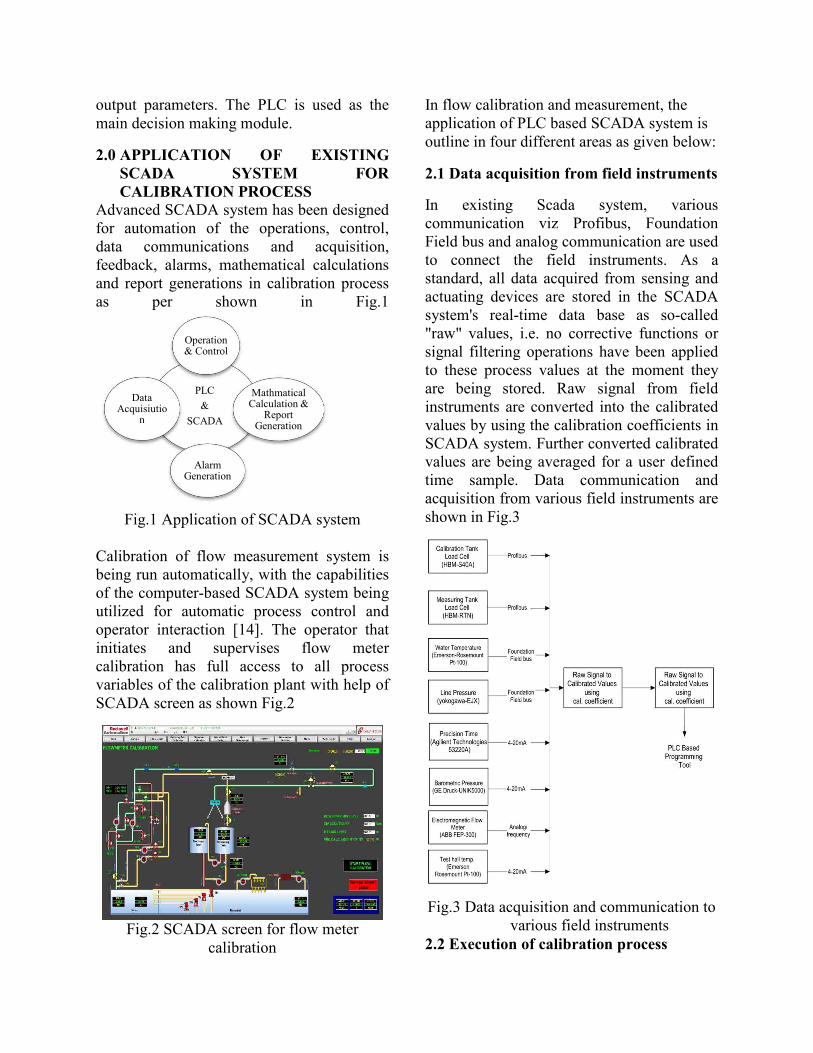
2.0 APPLICATION OF EXISTING
SCADA SYSTEM FOR
CALIBRATION PROCESS
Advanced SCADA system has been designed
for automation of the operations, control,
data communications and acquisition,
feedback, alarms, mathematical calculations
and report generations in calibration process
as per shown in Fig.1
Fig.1 Application of SCADA system
Calibration of flow measurement system is
being run automatically, with the capabilities
of the computer-based SCADA system being
utilized for automatic process control and
operator interaction [14]. The operator that
initiates and supervises flow meter
calibration has full access to all process
variables of the calibration plant with help of
SCADA screen as shown Fig.2
Fig.2 SCADA screen for flow meter
calibration
In flow calibration and measurement, the
application of PLC based SCADA system is
outline in four different areas as given below:
2.1 Data acquisition from field instruments
In existing Scada system, various
communication viz Profibus, Foundation
Field bus and analog communication are used
to connect the field instruments. As a
standard, all data acquired from sensing and
actuating devices are stored in the SCADA
system's real-time data base as so-called
"raw" values, i.e. no corrective functions or
signal filtering operations have been applied
to these process values at the moment they
are being stored. Raw signal from field
instruments are converted into the calibrated
values by using the calibration coefficients in
SCADA system. Further converted calibrated
values are being averaged for a user defined
time sample. Data communication and
acquisition from various field instruments are
shown in Fig.3
Fig.3 Data acquisition and communication to
various field instruments
2.2 Execution of calibration process
PLC
&
SCADA
Operation & Control
Mathmatical Calculation &
Report Generation
Alarm Generation
Data Acquisiutio
n

A program has been design in PLC language
as per given flow chart in Fig.4 to execute the
electromagnetic flowmeter calibration
process.
Fig. 4 Program flow for execution of
calibration process
2.3 Control of Operation & Alarm
generation
SCADA is designed to control speed of
pump, Valves, Sump level, Overflow in
measuring tank during execution of flow
calibration. Automatic computer-based
supervision of all plant devices, e.g. the
leakage-prove operation of on/off valves,
guarantees to provide reliable calibration
results []. The PLC based programming in
the ladder logic is developed for overflow
control in measuring tank using Flow chart
given in Fig. 5
Fig. 5 Program flow chart for overflow
control of water
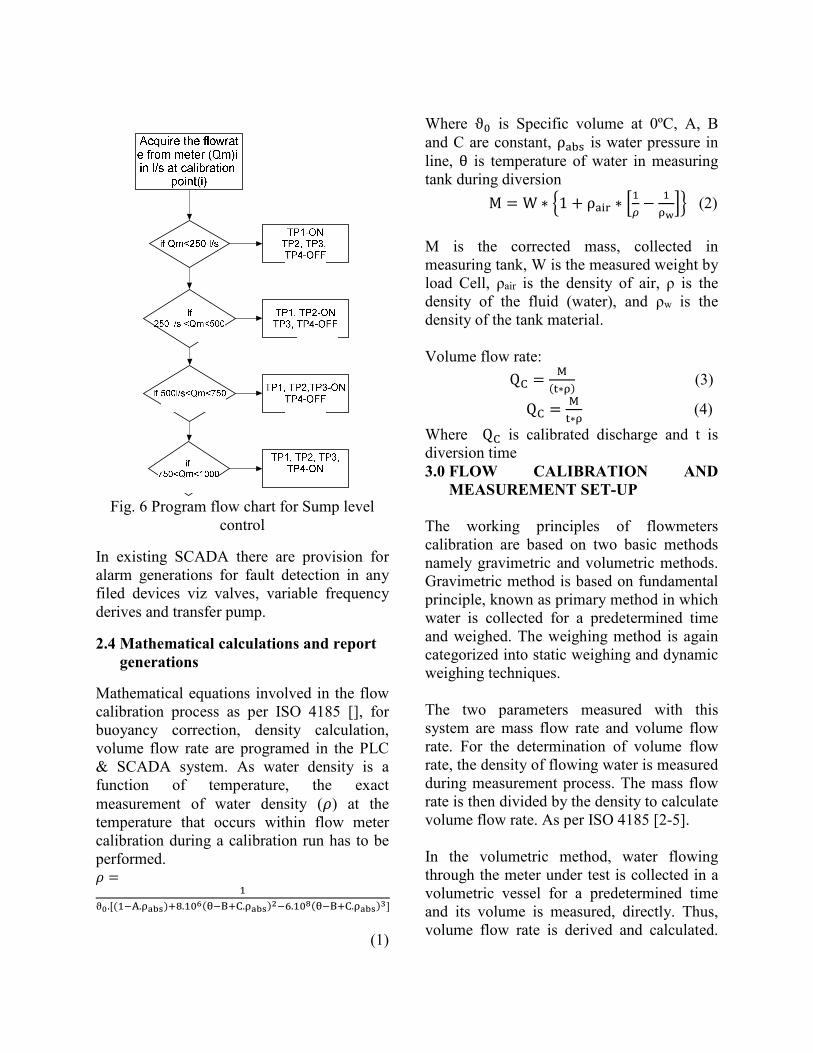
Fig. 6 Program flow chart for Sump level
control
In existing SCADA there are provision for
alarm generations for fault detection in any
filed devices viz valves, variable frequency
derives and transfer pump.
2.4 Mathematical calculations and report
generations
Mathematical equations involved in the flow
calibration process as per ISO 4185 [], for
buoyancy correction, density calculation,
volume flow rate are programed in the PLC
& SCADA system. As water density is a
function of temperature, the exact
measurement of water density (�) at the
temperature that occurs within flow meter
calibration during a calibration run has to be
performed. � = ���.[(�.�� �)��.���(����.�� �)��.���(����.�� �)�]
(1)
Where ϑ� is Specific volume at 0ºC, A, B
and C are constant, ρ�� is water pressure in
line, θ is temperature of water in measuring
tank during diversion
M = W ∗ %1 + ρ�() ∗ *�+ − ��-./ (2)
M is the corrected mass, collected in
measuring tank, W is the measured weight by
load Cell, ρair is the density of air, ρ is the
density of the fluid (water), and ρw is the
density of the tank material.
Volume flow rate:
Q� = 1(2∗�) (3)
Q� = 12∗� (4)
Where Q� is calibrated discharge and t is
diversion time
3.0 FLOW CALIBRATION AND
MEASUREMENT SET-UP
The working principles of flowmeters
calibration are based on two basic methods
namely gravimetric and volumetric methods.
Gravimetric method is based on fundamental
principle, known as primary method in which
water is collected for a predetermined time
and weighed. The weighing method is again
categorized into static weighing and dynamic
weighing techniques.
The two parameters measured with this
system are mass flow rate and volume flow
rate. For the determination of volume flow
rate, the density of flowing water is measured
during measurement process. The mass flow
rate is then divided by the density to calculate
volume flow rate. As per ISO 4185 [2-5].
In the volumetric method, water flowing
through the meter under test is collected in a
volumetric vessel for a predetermined time
and its volume is measured, directly. Thus,
volume flow rate is derived and calculated.

Since the determination of volume flow rate
is measured indirectly from mass, it is treated
as secondary method. The documentary
standard released by ISO for flow
measurement in closed conduits using
volumetric method is ISO 4064 [6-8]. The
primary method based on weighing is well
established and widely accepted method
internationally [9–12].
Calibration of the electromagnetic flow meter
has been carried in open loop in which, water
is pumped from a sump having the constant
water level and diverted to the measuring
tank for a specified period through flow
diverter using gravimetric approach with
flying start- and -stop method as per ISO
4185[3].
In situ calibration chain of flow measurement
system is as follows:
(a) Calibration of balance system:
(b) Calibration of electromagnetic flow
meter:
Calibration of flow meter was performed
using gravimetric method using flying start
and stop approach as per ISO-4185.
3.1 Calibration of balance system
3.1.1 Standard weights
The F2 class standard weights are used for
calibration of calibrator tank load cell
3.1.2 Calibration of calibrator tank load
cell
Calibration of calibrator tank load cell (2ton)
is carried out with standard weights up to
1500 kg (72 No- 20 kg, 6 No-10 kg). The
empty weight of calibrator tank is 490 kg.
The output signals from load cell are logged
in SCADA at 100Hz.
A curve has been plotted between output
signal of load cell (34)56 and applied
standard weights and as shown in Fig.7 along
with its regression curve as shown in Fig.8
Fig.7 Calibration curve calibrator tank load
cell
Fig. 8 Regression error of calibrator tank load
cell
3.1.3 Calibration of Measuring Tank
Load Cell
Three ring torsion type load cell of 22-ton
each are placed at the bottom of measuring
tank to measure the weight of water collected
over a period of diversion time. These load
cells are calibrated with a calibrator tank load
cell.
A fix calibrated weight of water (about1300
kg) is transferred from calibrator tank to
measuring tank. Initial and final output
signals (mV) of load cells (measuring tank
and calibrator tank) are logged SCADA
system. The same is repeated until the level
of measuring tank reached at maximum.
0
200
400
600
800
1000
1200
1400
1600
0.00 2.00 4.00 6.00
Applie
d S
tandard
Weig
ht(k
g)
Measured Signal (mV)
-0.20
-0.10
0.00
0.10
0.20
0 300 600 900 1200 1500E
rror
(%)
Applied standard Weight(kg)

Fig.9 measuring tank load cell calibration
loop
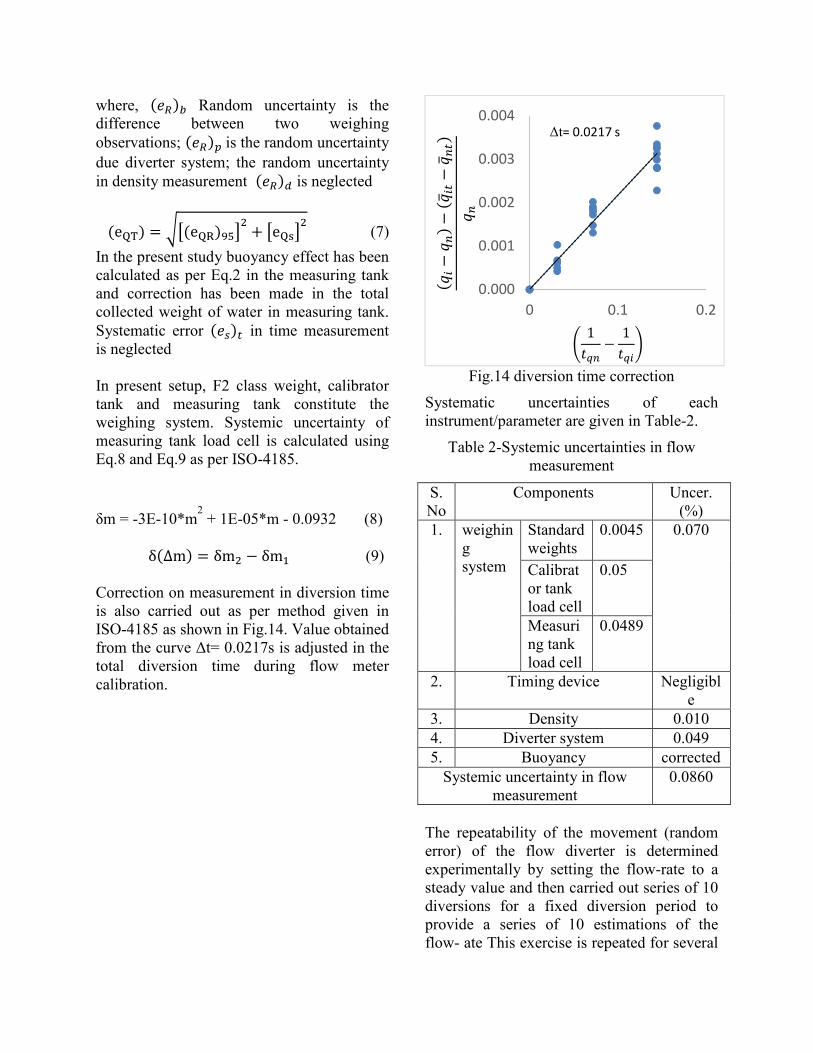
The cumulative corrected weight of water
transferred by calibrator tank is plotted
against the primary output signal (34)76 of
measuring tank load cell as shown in Fig.10.
Regression error of measuring tank load cell
is plotted against applied standard weight as
shown in Fig.11.
Fig. 10 calibration curve of measuring tank
load cell
Fig. 11 Regression error of measuring tank
load cell
3.2 Calibration of electromagnetic flow
meter
Calibration of flow meter is carried out for
discharge range between 100 l/s to 750 l/s by
keeping sump level constant. For maintaining
sump level constant, A PLC based program
has been developed in ladder logic, details
discuss in section…. Timing error of diverter
system are obtained and used to correct the
measured discharge. Water is diverted into
measuring tank for a set period of time until
it gets fully filled. Initial and final readings of
measuring tank load cells (mV)MT, initial and
final temperature and diversion time are
logged into SCADA in order to calculate the
discharge. Buoyancy correction is made to
the readings of a load cell to take account of
the difference between the upward thrust
exerted by the atmosphere and water being
weighed.
Frequency (89) signal from flowmeter during
diversion period are log in SCADA and flow
Calibration and regression curve are plotted
in Fig.12 and Fig.13 respectively.
0
5000
10000
15000
20000
25000
30000
35000
40000
45000
0.0 3.0 6.0 9.0 12.0
Measured Voltage (mV)
Applie
dC
um
ula
tive
Weig
ht(K
g)
δm = -3E-10*m2 + 1E-05*m -
0.0932
-1.2
-1.0
-0.8
-0.6
-0.4
-0.2
0.0
0.2
0.4
0 10000 20000 30000 40000 50000
Cummulative weight of
Err
or
(%)

Fig.12 Flow meter calibration curve
Fig.13 regression error of flow meter
Calibration equations of electromagnetic
flowmeter, measuring tank load cell and
calibrator tank load cell are tabulated in
Table-1.
Table-1 Calibration equation of flow
parameters
Instrument Calibration equation
Calibrator
tank load
cell
(:56)5 = 400.76 ∗ (34)56− 495.82
Measuring
tank load (:76)5 = 4622.57 ∗ (34)76− 11523.86
Flow meter D5 = 3 ∗ 10E ∗ 89F+ 0.191448∗ 89+ 1.318646
These calibration equations are used in
Ladder logic based PLC programming to
convert raw signal into calibrated values.
4.0 UNCERTAINTY ANALYSIS
The uncertainty associated with a discharge
measurement is obtained by combining the
uncertainties arising from the sources.
Although "systematic" errors have been
distinguished from "random" errors, the
probability distribution of the possible values
of each systematic component is essentially
Gaussian, and, in accordance with IS0 5168.
The combination of all the uncertainties may
be made by the root-sum-square method.
As per ISO 4185, the systematic, random
uncertainty and total uncertainty in discharge
measurement is given by (as per ISO
4185(1980)) Eq.5, Eq.6 and Eq.7
respectively.
eH = I[(e )�]F + J(e )KLF + [(e )M]F +[(e )N]F + [(e )2]F
(5)
where OP is the overall system uncertainty; (QP)R uncertainty due to the weighing
machine; (QP)S is the buoyancy correction; (QP)T is the systematic uncertainty due to
diverter system; (QP)V is systematic
uncertainty due to the timing device; (QP)W systematic uncertainty in the
measurement of density.
(eHX)YZ = [[(eX)�]F + J(eX)KLF (6)
0
100
200
300
400
500
600
700
800
0 1000 2000 3000 4000
Measure
d D
ischarg
e (
l/s)
Measured Frequency (Hz)
-0.20
-0.16
-0.12
-0.08
-0.04
0.00
0.04
0.08
0.12
0.16
0.20
0 200 400 600 800
Discharge (l/s)
Err
or
%

where, (Q\)R Random uncertainty is the
difference between two weighing
observations; (Q\)T is the random uncertainty
due diverter system; the random uncertainty
in density measurement (Q\)W is neglected
(eH]) = [J(eHX)YZLF + JeH LF (7)
In the present study buoyancy effect has been
calculated as per Eq.2 in the measuring tank
and correction has been made in the total
collected weight of water in measuring tank.
Systematic error (QP)V in time measurement
is neglected
In present setup, F2 class weight, calibrator
tank and measuring tank constitute the
weighing system. Systemic uncertainty of
measuring tank load cell is calculated using
Eq.8 and Eq.9 as per ISO-4185.
δm = -3E-10*m2 + 1E-05*m - 0.0932 (8)
δ(Δm) = δmF − δm� (9)
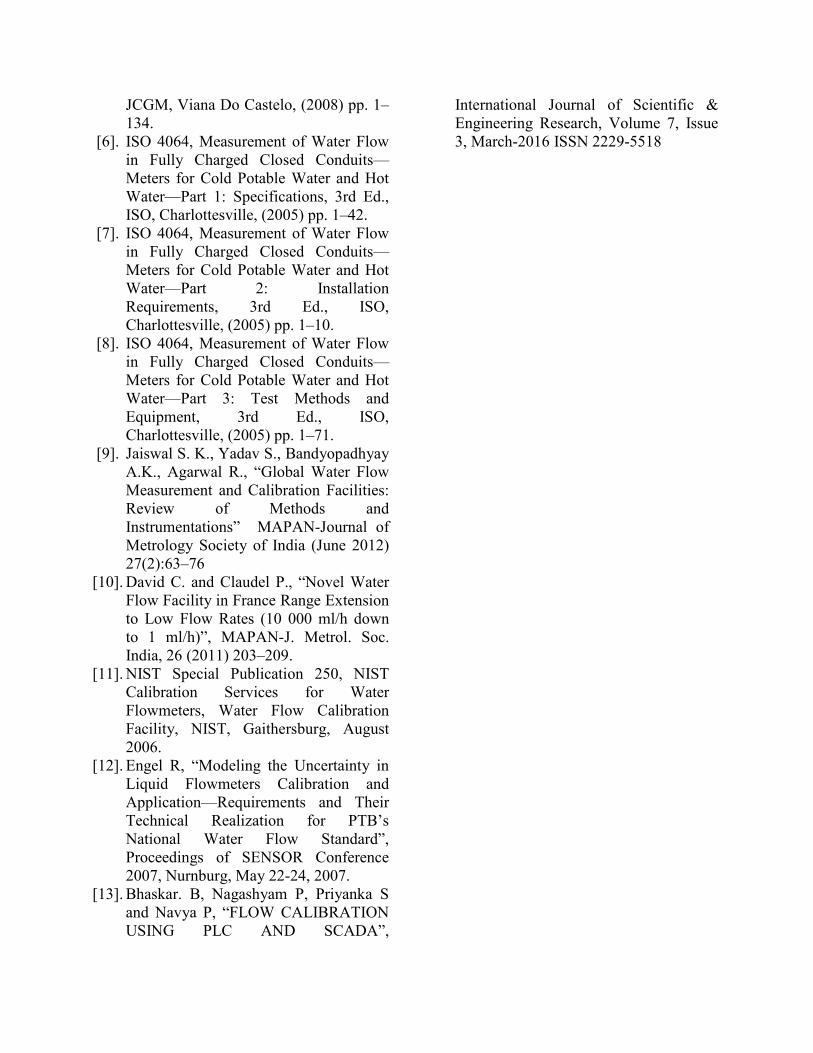
Correction on measurement in diversion time
is also carried out as per method given in
ISO-4185 as shown in Fig.14. Value obtained
from the curve Δt= 0.0217s is adjusted in the
total diversion time during flow meter
calibration.
Fig.14 diversion time correction
Systematic uncertainties of each
instrument/parameter are given in Table-2.
Table 2-Systemic uncertainties in flow
measurement
S.
No
Components Uncer.
(%)
1. weighin
g
system
Standard
weights
0.0045 0.070
Calibrat
or tank
load cell
0.05
Measuri
ng tank
load cell
0.0489
2. Timing device Negligibl
e
3. Density 0.010
4. Diverter system 0.049
5. Buoyancy corrected
Systemic uncertainty in flow
measurement
0.0860
The repeatability of the movement (random
error) of the flow diverter is determined
experimentally by setting the flow-rate to a
steady value and then carried out series of 10
diversions for a fixed diversion period to
provide a series of 10 estimations of the
flow- ate This exercise is repeated for several
Δt= 0.0217 s
0.000
0.001
0.002
0.003
0.004
0 0.1 0.21abc − 1abd

different diversion periods and, from the
standard deviation of each series of
measurements, the 95 % confidence limits
have been be evaluated as per ISO-4185 and
are shown in Fig.15.
Fig.15 Random error in diverter time
For evaluation of random error of weighing
system, the standard deviation of the
distribution of points about the best-fit curve
shown in Fig.11 is calculated with 95 %
confidence limits of the distribution
determined using Student’s t-table. This
value of confidence limits is multiplied by
square root of two (since the determination of
the mass of water collected in measuring tank
during a diversion is obtained from the
difference between two weighing) as per
ISO-4185. Random error of flow diverter
system and weighing system are found as
±0.0262616 and ±0.0485% respectively.
Total random error in flow measurement
during calibration is calculated using Eq.7
and found out as 0.0551%. Systematic
uncertainty of flow measurement during
calibration is 0.0860% and regression error at
700 l/s is found 0.02% from flow calibration
curve. The total uncertainty in flow
measurement at 700 l/s is found as ±0.104%.
5.0 CONCLUSIONS
The real-time data base as an inherent
component of the SCADA system being
applied for the automated operation of the
test field provides capabilities these special
capabilities are a prerequisite to execute the
flow calibration process and control the flied
instruments. In-situ calibration of measuring
instruments viz calibrator tank load cell,
measuring tank load cell, flowmeter has been
performed. Calibration equations, regression
curves have been obtained. Uncertainty
analysis has been performed as per ISO 4185
at 700 l/s flowrate and systematic error,
random error and regression error has been
found 0.086%, 0.055% and 0.02%
respectively. The total uncertainty in flow
measurement at 700 l/s is found as ±0.104%.
Acknowledgement:
Financial support for this Laboratory and
Research team is supported by the Ministry
new and renewable energy, Govt. of India.
6.0 REFERENCE
[1]. Engel R., Baade H.J., and Rubel A,
Performance Improvement of Liquid
Flow Calibrators by Applying Special
Measurement and Control Strategies,
Proceedings of the 11th International
Conference on Flow Measurement
(FLOMEKO 2003), Groningen, May
12–14, 2003.
[2]. ISO 4185:1980, Measurement of liquid
flow in closed conduits-Weighing
method, 1st edition, 1980, pp. 1-21.
[3]. ISO 9368-1, Measurement of Liquid
Flow in Closed Conduits by Weighing
Methods—Procedure for Checking the
Installations, Part 1: Static Weighing
System, 1st Ed., ISO, Charlottesville,
(1990) pp. 1–22.
[4]. ISO 5168, Measurement of Liquid Flow
in Closed Conduits— Procedure for the
Evaluation of Uncertainties, 2nd Ed.,
ISO, Charlottesville, (2005) pp. 1–65.
[5]. JCGM 100, Evaluation of measurement
data – Guide to the expression of
uncertainty in measurement, 1st Ed.,
-0.06
-0.04
-0.02
0
0.02
0.04
0.06
0 20 40 60
Diversion Time (s)
Err
or
(%)

JCGM, Viana Do Castelo, (2008) pp. 1–
134.
[6]. ISO 4064, Measurement of Water Flow
in Fully Charged Closed Conduits—
Meters for Cold Potable Water and Hot
Water—Part 1: Specifications, 3rd Ed.,
ISO, Charlottesville, (2005) pp. 1–42.
[7]. ISO 4064, Measurement of Water Flow
in Fully Charged Closed Conduits—
Meters for Cold Potable Water and Hot
Water—Part 2: Installation
Requirements, 3rd Ed., ISO,
Charlottesville, (2005) pp. 1–10.
[8]. ISO 4064, Measurement of Water Flow
in Fully Charged Closed Conduits—
Meters for Cold Potable Water and Hot
Water—Part 3: Test Methods and
Equipment, 3rd Ed., ISO,
Charlottesville, (2005) pp. 1–71.
[9]. Jaiswal S. K., Yadav S., Bandyopadhyay
A.K., Agarwal R., “Global Water Flow
Measurement and Calibration Facilities:
Review of Methods and
Instrumentations” MAPAN-Journal of
Metrology Society of India (June 2012)
27(2):63–76
[10]. David C. and Claudel P., “Novel Water
Flow Facility in France Range Extension
to Low Flow Rates (10 000 ml/h down
to 1 ml/h)”, MAPAN-J. Metrol. Soc.
India, 26 (2011) 203–209.
[11]. NIST Special Publication 250, NIST
Calibration Services for Water
Flowmeters, Water Flow Calibration
Facility, NIST, Gaithersburg, August
2006.
[12]. Engel R, “Modeling the Uncertainty in
Liquid Flowmeters Calibration and
Application—Requirements and Their
Technical Realization for PTB’s
National Water Flow Standard”,
Proceedings of SENSOR Conference
2007, Nurnburg, May 22-24, 2007.
[13]. Bhaskar. B, Nagashyam P, Priyanka S
and Navya P, “FLOW CALIBRATION
USING PLC AND SCADA”,
International Journal of Scientific &
Engineering Research, Volume 7, Issue
3, March-2016 ISSN 2229-5518

FLOTEK.G 2017- “Innovative Solutions in Flow Measurement and Control- Oil, Water and Gas”
August 28-30, 2017, FCRI, Palakkad, Kerala, India
Calibration of Electromagnetic Flowmeter Using Advanced
SCADA System
Ali Abbas
Research Scholar
Alternate Hydro Energy Centre
Indian Institute of Technology
Roorkee 247667, India
Email: [email protected]
Nitin Kumar Jhankal
Research Scholar
Alternate Hydro Energy Centre
Indian Institute of Technology
Roorkee 247667, India
Email: [email protected]
Arun Kumar
Professor, Alternate Hydro Energy Centre,
Indian Institute of Technology Roorkee,
Roorkee 247667, India
Email: [email protected]
ABSTRACT
The Programmable Logic Controller (PLC)
based Supervisory Control and Data
Acquisition (SCADA) system is designed for
automation, remote monitoring, signal
acquisition, data logging and report
generation for flow calibration and
measurement process. In this paper logic and
flow charts in PLC programming for
execution of calibration process and controls
are presented. In situ calibration of different
measuring instruments used in flow
calibration viz. flow meter, measuring tank
load cells, calibrator tank load cells have
been performed and calibration equations
have been derived from their calibration
curves. Gravimetric approach using flying
start and stop method has been adopted for
flow calibration in present study. Systematic
and random error of weighing balance and
flow diverter has been evaluated as per ISO
4185.
KEY WORDS
Calibration, measurement, SCADA,
gravimetric method, uncertainty,
experimental
1.0 INTRODUCTION
A fully automatic SCADA based Hydraulic
turbine R&D laboratory has been set-up in
2016 at Alternate Hydro Energy Centre
(AHEC), Indian Institute of Technology (IIT)
Roorkee, Uttarakhand, India, a center of
excellence for small hydropower in the
country, to validate the homologous hydro
models, designed and fabricated by various
turbines manufactures. During the flow
calibration and measurement, the main
process quantities e.g. water flow rate,
pressure and temperature are stabilized by
logic developed in a computer-based
Supervisory Control and Data Acquisition
(SCADA) system, with other relevant
process parameters like temperature, diverter
actuation, load cell reading and ambient-air
conditions, being monitored. This is an
essential prerequisite to provide reproducible
conditions that are necessary to achieve a
high degree of reproducibility in the
measurement and calibration processes.
The Programmable Logic Controller (PLC)
based SCADA system is used for automation,
remote monitoring, signal acquisition, data
logging and report generation. The data from
field instruments during calibration and
measurement of flow are acquired and
control commands to field devices are being
sent by SCADA. The PLC also controls the
process and acquire raw signal from field
instruments and convert it into the secondary
output parameters. The PLC is used as the
main decision making module.
2.0 APPLICATION OF EXISTING
SCADA SYSTEM FOR
CALIBRATION PROCESS
Advanced SCADA system has been designed
for automation of the operations, control,
data communications and acquisition,
feedback, alarms, mathematical calculations
and report generations in calibration process
as per shown in Fig.1
Fig.1 Application of SCADA system
Calibration of flow measurement system is
being run automatically, with the capabilities
of the computer-based SCADA system being
utilized for automatic process control and
operator interaction [14]. The operator that
initiates and supervises flow meter
calibration has full access to all process
variables of the calibration plant with help of
SCADA screen as shown Fig.2
Fig.2 SCADA screen for flow meter
calibration
In flow calibration and measurement, the
application of PLC based SCADA system is
outline in four different areas as given below:
2.1 Data acquisition from field instruments
In existing Scada system, various
communication viz Profibus, Foundation
Field bus and analog communication are used
to connect the field instruments. As a
standard, all data acquired from sensing and
actuating devices are stored in the SCADA
system's real-time data base as so-called
"raw" values, i.e. no corrective functions or
signal filtering operations have been applied
to these process values at the moment they
are being stored. Raw signal from field
instruments are converted into the calibrated
values by using the calibration coefficients in
SCADA system. Further converted calibrated
values are being averaged for a user defined
time sample. Data communication and
acquisition from various field instruments are
shown in Fig.3
Fig.3 Data acquisition and communication to
various field instruments
2.2 Execution of calibration process
PLC
&
SCADA
Operation & Control
Mathmatical Calculation &
Report Generation
Alarm Generation
Data Acquisiutio
n

A program has been design in PLC language
as per given flow chart in Fig.4 to execute the
electromagnetic flowmeter calibration
process.
Fig. 4 Program flow for execution of
calibration process
2.3 Control of Operation & Alarm
generation
SCADA is designed to control speed of
pump, Valves, Sump level, Overflow in
measuring tank during execution of flow
calibration. Automatic computer-based
supervision of all plant devices, e.g. the
leakage-prove operation of on/off valves,
guarantees to provide reliable calibration
results []. The PLC based programming in
the ladder logic is developed for overflow
control in measuring tank using Flow chart
given in Fig. 5
Fig. 5 Program flow chart for overflow
control of water

Fig. 6 Program flow chart for Sump level
control
In existing SCADA there are provision for
alarm generations for fault detection in any
filed devices viz valves, variable frequency
derives and transfer pump.
2.4 Mathematical calculations and report
generations
Mathematical equations involved in the flow
calibration process as per ISO 4185 [], for
buoyancy correction, density calculation,
volume flow rate are programed in the PLC
& SCADA system. As water density is a
function of temperature, the exact
measurement of water density (�) at the
temperature that occurs within flow meter
calibration during a calibration run has to be
performed. � = ���.[(�.�� �)��.���(����.�� �)��.���(����.�� �)�]
(1)
Where ϑ� is Specific volume at 0ºC, A, B
and C are constant, ρ�� is water pressure in
line, θ is temperature of water in measuring
tank during diversion
M = W ∗ %1 + ρ�() ∗ *�+ − ��-./ (2)
M is the corrected mass, collected in
measuring tank, W is the measured weight by
load Cell, ρair is the density of air, ρ is the
density of the fluid (water), and ρw is the
density of the tank material.
Volume flow rate:
Q� = 1(2∗�) (3)
Q� = 12∗� (4)
Where Q� is calibrated discharge and t is
diversion time
3.0 FLOW CALIBRATION AND
MEASUREMENT SET-UP
The working principles of flowmeters
calibration are based on two basic methods
namely gravimetric and volumetric methods.
Gravimetric method is based on fundamental
principle, known as primary method in which
water is collected for a predetermined time
and weighed. The weighing method is again
categorized into static weighing and dynamic
weighing techniques.
The two parameters measured with this
system are mass flow rate and volume flow
rate. For the determination of volume flow
rate, the density of flowing water is measured
during measurement process. The mass flow
rate is then divided by the density to calculate
volume flow rate. As per ISO 4185 [2-5].
In the volumetric method, water flowing
through the meter under test is collected in a
volumetric vessel for a predetermined time
and its volume is measured, directly. Thus,
volume flow rate is derived and calculated.

Since the determination of volume flow rate
is measured indirectly from mass, it is treated
as secondary method. The documentary
standard released by ISO for flow
measurement in closed conduits using
volumetric method is ISO 4064 [6-8]. The
primary method based on weighing is well
established and widely accepted method
internationally [9–12].
Calibration of the electromagnetic flow meter
has been carried in open loop in which, water
is pumped from a sump having the constant
water level and diverted to the measuring
tank for a specified period through flow
diverter using gravimetric approach with
flying start- and -stop method as per ISO
4185[3].
In situ calibration chain of flow measurement
system is as follows:
(a) Calibration of balance system:
(b) Calibration of electromagnetic flow
meter:
Calibration of flow meter was performed
using gravimetric method using flying start
and stop approach as per ISO-4185.
3.1 Calibration of balance system
3.1.1 Standard weights
The F2 class standard weights are used for
calibration of calibrator tank load cell
3.1.2 Calibration of calibrator tank load
cell
Calibration of calibrator tank load cell (2ton)
is carried out with standard weights up to
1500 kg (72 No- 20 kg, 6 No-10 kg). The
empty weight of calibrator tank is 490 kg.
The output signals from load cell are logged
in SCADA at 100Hz.
A curve has been plotted between output
signal of load cell (34)56 and applied
standard weights and as shown in Fig.7 along
with its regression curve as shown in Fig.8
Fig.7 Calibration curve calibrator tank load
cell
Fig. 8 Regression error of calibrator tank load
cell
3.1.3 Calibration of Measuring Tank
Load Cell
Three ring torsion type load cell of 22-ton
each are placed at the bottom of measuring
tank to measure the weight of water collected
over a period of diversion time. These load
cells are calibrated with a calibrator tank load
cell.
A fix calibrated weight of water (about1300
kg) is transferred from calibrator tank to
measuring tank. Initial and final output
signals (mV) of load cells (measuring tank
and calibrator tank) are logged SCADA
system. The same is repeated until the level
of measuring tank reached at maximum.
0
200
400
600
800
1000
1200
1400
1600
0.00 2.00 4.00 6.00
Applie
d S
tandard
Weig
ht(k
g)
Measured Signal (mV)
-0.20
-0.10
0.00
0.10
0.20
0 300 600 900 1200 1500E
rror
(%)
Applied standard Weight(kg)
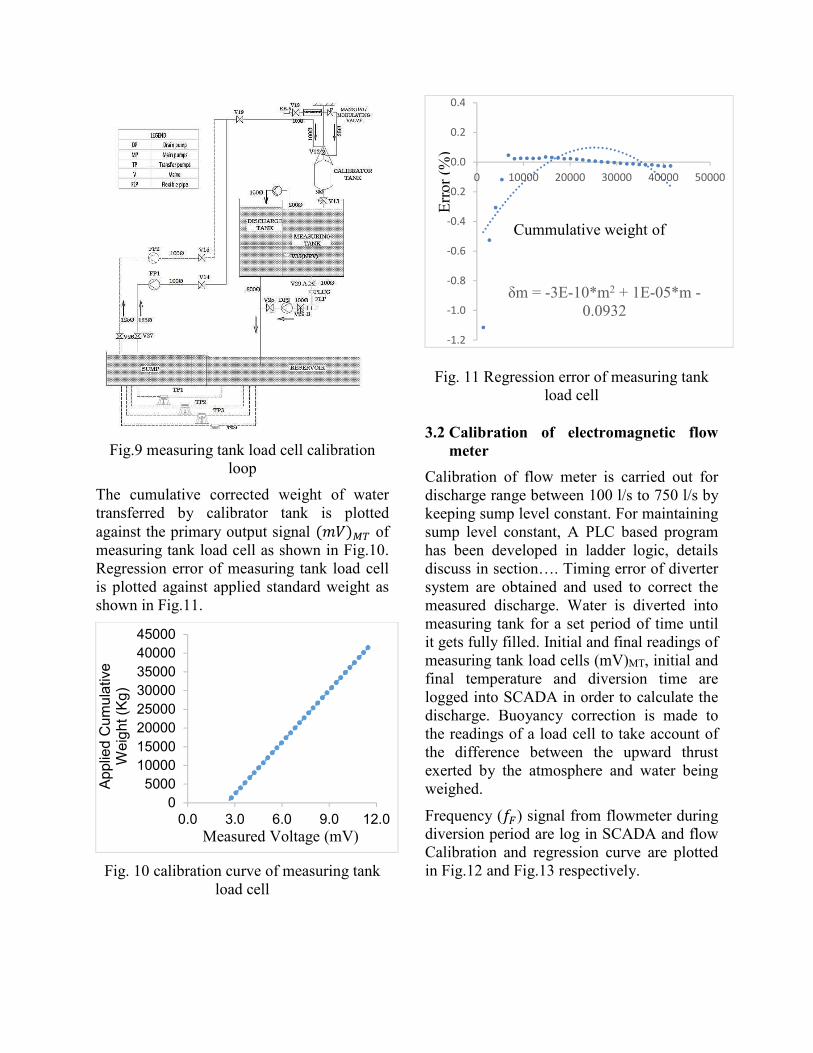
Fig.9 measuring tank load cell calibration
loop
The cumulative corrected weight of water
transferred by calibrator tank is plotted
against the primary output signal (34)76 of
measuring tank load cell as shown in Fig.10.
Regression error of measuring tank load cell
is plotted against applied standard weight as
shown in Fig.11.
Fig. 10 calibration curve of measuring tank
load cell
Fig. 11 Regression error of measuring tank
load cell
3.2 Calibration of electromagnetic flow
meter
Calibration of flow meter is carried out for
discharge range between 100 l/s to 750 l/s by
keeping sump level constant. For maintaining
sump level constant, A PLC based program
has been developed in ladder logic, details
discuss in section…. Timing error of diverter
system are obtained and used to correct the
measured discharge. Water is diverted into
measuring tank for a set period of time until
it gets fully filled. Initial and final readings of
measuring tank load cells (mV)MT, initial and
final temperature and diversion time are
logged into SCADA in order to calculate the
discharge. Buoyancy correction is made to
the readings of a load cell to take account of
the difference between the upward thrust
exerted by the atmosphere and water being
weighed.
Frequency (89) signal from flowmeter during
diversion period are log in SCADA and flow
Calibration and regression curve are plotted
in Fig.12 and Fig.13 respectively.
0
5000
10000
15000
20000
25000
30000
35000
40000
45000
0.0 3.0 6.0 9.0 12.0
Measured Voltage (mV)
Applie
dC
um
ula
tive
Weig
ht(K
g)
δm = -3E-10*m2 + 1E-05*m -
0.0932
-1.2
-1.0
-0.8
-0.6
-0.4
-0.2
0.0
0.2
0.4
0 10000 20000 30000 40000 50000
Cummulative weight of
Err
or
(%)

Fig.12 Flow meter calibration curve
Fig.13 regression error of flow meter
Calibration equations of electromagnetic
flowmeter, measuring tank load cell and
calibrator tank load cell are tabulated in
Table-1.
Table-1 Calibration equation of flow
parameters
Instrument Calibration equation
Calibrator
tank load
cell
(:56)5 = 400.76 ∗ (34)56− 495.82
Measuring
tank load (:76)5 = 4622.57 ∗ (34)76− 11523.86
Flow meter D5 = 3 ∗ 10E ∗ 89F+ 0.191448∗ 89+ 1.318646
These calibration equations are used in
Ladder logic based PLC programming to
convert raw signal into calibrated values.
4.0 UNCERTAINTY ANALYSIS
The uncertainty associated with a discharge
measurement is obtained by combining the
uncertainties arising from the sources.
Although "systematic" errors have been
distinguished from "random" errors, the
probability distribution of the possible values
of each systematic component is essentially
Gaussian, and, in accordance with IS0 5168.
The combination of all the uncertainties may
be made by the root-sum-square method.
As per ISO 4185, the systematic, random
uncertainty and total uncertainty in discharge
measurement is given by (as per ISO
4185(1980)) Eq.5, Eq.6 and Eq.7
respectively.
eH = I[(e )�]F + J(e )KLF + [(e )M]F +[(e )N]F + [(e )2]F
(5)
where OP is the overall system uncertainty; (QP)R uncertainty due to the weighing
machine; (QP)S is the buoyancy correction; (QP)T is the systematic uncertainty due to
diverter system; (QP)V is systematic
uncertainty due to the timing device; (QP)W systematic uncertainty in the
measurement of density.
(eHX)YZ = [[(eX)�]F + J(eX)KLF (6)
0
100
200
300
400
500
600
700
800
0 1000 2000 3000 4000
Measure
d D
ischarg
e (
l/s)
Measured Frequency (Hz)
-0.20
-0.16
-0.12
-0.08
-0.04
0.00
0.04
0.08
0.12
0.16
0.20
0 200 400 600 800
Discharge (l/s)
Err
or
%
where, (Q\)R Random uncertainty is the
difference between two weighing
observations; (Q\)T is the random uncertainty
due diverter system; the random uncertainty
in density measurement (Q\)W is neglected
(eH]) = [J(eHX)YZLF + JeH LF (7)
In the present study buoyancy effect has been
calculated as per Eq.2 in the measuring tank
and correction has been made in the total
collected weight of water in measuring tank.
Systematic error (QP)V in time measurement
is neglected
In present setup, F2 class weight, calibrator
tank and measuring tank constitute the
weighing system. Systemic uncertainty of
measuring tank load cell is calculated using
Eq.8 and Eq.9 as per ISO-4185.
δm = -3E-10*m2 + 1E-05*m - 0.0932 (8)
δ(Δm) = δmF − δm� (9)
Correction on measurement in diversion time
is also carried out as per method given in
ISO-4185 as shown in Fig.14. Value obtained
from the curve Δt= 0.0217s is adjusted in the
total diversion time during flow meter
calibration.
Fig.14 diversion time correction
Systematic uncertainties of each
instrument/parameter are given in Table-2.
Table 2-Systemic uncertainties in flow
measurement
S.
No
Components Uncer.
(%)
1. weighin
g
system
Standard
weights
0.0045 0.070
Calibrat
or tank
load cell
0.05
Measuri
ng tank
load cell
0.0489
2. Timing device Negligibl
e
3. Density 0.010
4. Diverter system 0.049
5. Buoyancy corrected
Systemic uncertainty in flow
measurement
0.0860
The repeatability of the movement (random
error) of the flow diverter is determined
experimentally by setting the flow-rate to a
steady value and then carried out series of 10
diversions for a fixed diversion period to
provide a series of 10 estimations of the
flow- ate This exercise is repeated for several
Δt= 0.0217 s
0.000
0.001
0.002
0.003
0.004
0 0.1 0.21abc − 1abd

different diversion periods and, from the
standard deviation of each series of
measurements, the 95 % confidence limits
have been be evaluated as per ISO-4185 and
are shown in Fig.15.
Fig.15 Random error in diverter time
For evaluation of random error of weighing
system, the standard deviation of the
distribution of points about the best-fit curve
shown in Fig.11 is calculated with 95 %
confidence limits of the distribution
determined using Student’s t-table. This
value of confidence limits is multiplied by
square root of two (since the determination of
the mass of water collected in measuring tank
during a diversion is obtained from the
difference between two weighing) as per
ISO-4185. Random error of flow diverter
system and weighing system are found as
±0.0262616 and ±0.0485% respectively.
Total random error in flow measurement
during calibration is calculated using Eq.7
and found out as 0.0551%. Systematic
uncertainty of flow measurement during
calibration is 0.0860% and regression error at
700 l/s is found 0.02% from flow calibration
curve. The total uncertainty in flow
measurement at 700 l/s is found as ±0.104%.
5.0 CONCLUSIONS
The real-time data base as an inherent
component of the SCADA system being
applied for the automated operation of the
test field provides capabilities these special
capabilities are a prerequisite to execute the
flow calibration process and control the flied
instruments. In-situ calibration of measuring
instruments viz calibrator tank load cell,
measuring tank load cell, flowmeter has been
performed. Calibration equations, regression
curves have been obtained. Uncertainty
analysis has been performed as per ISO 4185
at 700 l/s flowrate and systematic error,
random error and regression error has been
found 0.086%, 0.055% and 0.02%
respectively. The total uncertainty in flow
measurement at 700 l/s is found as ±0.104%.
Acknowledgement:
Financial support for this Laboratory and
Research team is supported by the Ministry
new and renewable energy, Govt. of India.
6.0 REFERENCE
[1]. Engel R., Baade H.J., and Rubel A,
Performance Improvement of Liquid
Flow Calibrators by Applying Special
Measurement and Control Strategies,
Proceedings of the 11th International
Conference on Flow Measurement
(FLOMEKO 2003), Groningen, May
12–14, 2003.
[2]. ISO 4185:1980, Measurement of liquid
flow in closed conduits-Weighing
method, 1st edition, 1980, pp. 1-21.
[3]. ISO 9368-1, Measurement of Liquid
Flow in Closed Conduits by Weighing
Methods—Procedure for Checking the
Installations, Part 1: Static Weighing
System, 1st Ed., ISO, Charlottesville,
(1990) pp. 1–22.
[4]. ISO 5168, Measurement of Liquid Flow
in Closed Conduits— Procedure for the
Evaluation of Uncertainties, 2nd Ed.,
ISO, Charlottesville, (2005) pp. 1–65.
[5]. JCGM 100, Evaluation of measurement
data – Guide to the expression of
uncertainty in measurement, 1st Ed.,
-0.06
-0.04
-0.02
0
0.02
0.04
0.06
0 20 40 60
Diversion Time (s)
Err
or
(%)
JCGM, Viana Do Castelo, (2008) pp. 1–
134.
[6]. ISO 4064, Measurement of Water Flow
in Fully Charged Closed Conduits—
Meters for Cold Potable Water and Hot
Water—Part 1: Specifications, 3rd Ed.,
ISO, Charlottesville, (2005) pp. 1–42.
[7]. ISO 4064, Measurement of Water Flow
in Fully Charged Closed Conduits—
Meters for Cold Potable Water and Hot
Water—Part 2: Installation
Requirements, 3rd Ed., ISO,
Charlottesville, (2005) pp. 1–10.
[8]. ISO 4064, Measurement of Water Flow
in Fully Charged Closed Conduits—
Meters for Cold Potable Water and Hot
Water—Part 3: Test Methods and
Equipment, 3rd Ed., ISO,
Charlottesville, (2005) pp. 1–71.
[9]. Jaiswal S. K., Yadav S., Bandyopadhyay
A.K., Agarwal R., “Global Water Flow
Measurement and Calibration Facilities:
Review of Methods and
Instrumentations” MAPAN-Journal of
Metrology Society of India (June 2012)
27(2):63–76
[10]. David C. and Claudel P., “Novel Water
Flow Facility in France Range Extension
to Low Flow Rates (10 000 ml/h down
to 1 ml/h)”, MAPAN-J. Metrol. Soc.
India, 26 (2011) 203–209.
[11]. NIST Special Publication 250, NIST
Calibration Services for Water
Flowmeters, Water Flow Calibration
Facility, NIST, Gaithersburg, August
2006.
[12]. Engel R, “Modeling the Uncertainty in
Liquid Flowmeters Calibration and
Application—Requirements and Their
Technical Realization for PTB’s
National Water Flow Standard”,
Proceedings of SENSOR Conference
2007, Nurnburg, May 22-24, 2007.
[13]. Bhaskar. B, Nagashyam P, Priyanka S
and Navya P, “FLOW CALIBRATION
USING PLC AND SCADA”,
International Journal of Scientific &
Engineering Research, Volume 7, Issue
3, March-2016 ISSN 2229-5518

FLOTEK.G 2017- “Innovative Solutions in Flow Measurement and Control- Oil, Water and Gas”
August 28-30, 2017, FCRI, Palakkad, Kerala, India
Calibration of Electromagnetic Flowmeter Using Advanced
SCADA System
Ali Abbas
Research Scholar
Alternate Hydro Energy Centre
Indian Institute of Technology
Roorkee 247667, India
Email: [email protected]
Nitin Kumar Jhankal
Research Scholar
Alternate Hydro Energy Centre
Indian Institute of Technology
Roorkee 247667, India
Email: [email protected]
Arun Kumar
Professor, Alternate Hydro Energy Centre,
Indian Institute of Technology Roorkee,
Roorkee 247667, India
Email: [email protected]
ABSTRACT
The Programmable Logic Controller (PLC)
based Supervisory Control and Data
Acquisition (SCADA) system is designed for
automation, remote monitoring, signal
acquisition, data logging and report
generation for flow calibration and
measurement process. In this paper logic and
flow charts in PLC programming for
execution of calibration process and controls
are presented. In situ calibration of different
measuring instruments used in flow
calibration viz. flow meter, measuring tank
load cells, calibrator tank load cells have
been performed and calibration equations
have been derived from their calibration
curves. Gravimetric approach using flying
start and stop method has been adopted for
flow calibration in present study. Systematic
and random error of weighing balance and
flow diverter has been evaluated as per ISO
4185.
KEY WORDS
Calibration, measurement, SCADA,
gravimetric method, uncertainty,
experimental
1.0 INTRODUCTION
A fully automatic SCADA based Hydraulic
turbine R&D laboratory has been set-up in
2016 at Alternate Hydro Energy Centre
(AHEC), Indian Institute of Technology (IIT)
Roorkee, Uttarakhand, India, a center of
excellence for small hydropower in the
country, to validate the homologous hydro
models, designed and fabricated by various
turbines manufactures. During the flow
calibration and measurement, the main
process quantities e.g. water flow rate,
pressure and temperature are stabilized by
logic developed in a computer-based
Supervisory Control and Data Acquisition
(SCADA) system, with other relevant
process parameters like temperature, diverter
actuation, load cell reading and ambient-air
conditions, being monitored. This is an
essential prerequisite to provide reproducible
conditions that are necessary to achieve a
high degree of reproducibility in the
measurement and calibration processes.
The Programmable Logic Controller (PLC)
based SCADA system is used for automation,
remote monitoring, signal acquisition, data
logging and report generation. The data from
field instruments during calibration and
measurement of flow are acquired and
control commands to field devices are being
sent by SCADA. The PLC also controls the
process and acquire raw signal from field
instruments and convert it into the secondary

output parameters. The PLC is used as the
main decision making module.
2.0 APPLICATION OF EXISTING
SCADA SYSTEM FOR
CALIBRATION PROCESS
Advanced SCADA system has been designed
for automation of the operations, control,
data communications and acquisition,
feedback, alarms, mathematical calculations
and report generations in calibration process
as per shown in Fig.1
Fig.1 Application of SCADA system
Calibration of flow measurement system is
being run automatically, with the capabilities
of the computer-based SCADA system being
utilized for automatic process control and
operator interaction [14]. The operator that
initiates and supervises flow meter
calibration has full access to all process
variables of the calibration plant with help of
SCADA screen as shown Fig.2
Fig.2 SCADA screen for flow meter
calibration
In flow calibration and measurement, the
application of PLC based SCADA system is
outline in four different areas as given below:
2.1 Data acquisition from field instruments
In existing Scada system, various
communication viz Profibus, Foundation
Field bus and analog communication are used
to connect the field instruments. As a
standard, all data acquired from sensing and
actuating devices are stored in the SCADA
system's real-time data base as so-called
"raw" values, i.e. no corrective functions or
signal filtering operations have been applied
to these process values at the moment they
are being stored. Raw signal from field
instruments are converted into the calibrated
values by using the calibration coefficients in
SCADA system. Further converted calibrated
values are being averaged for a user defined
time sample. Data communication and
acquisition from various field instruments are
shown in Fig.3
Fig.3 Data acquisition and communication to
various field instruments
2.2 Execution of calibration process
PLC
&
SCADA
Operation & Control
Mathmatical Calculation &
Report Generation
Alarm Generation
Data Acquisiutio
n

A program has been design in PLC language
as per given flow chart in Fig.4 to execute the
electromagnetic flowmeter calibration
process.
Fig. 4 Program flow for execution of
calibration process
2.3 Control of Operation & Alarm
generation
SCADA is designed to control speed of
pump, Valves, Sump level, Overflow in
measuring tank during execution of flow
calibration. Automatic computer-based
supervision of all plant devices, e.g. the
leakage-prove operation of on/off valves,
guarantees to provide reliable calibration
results []. The PLC based programming in
the ladder logic is developed for overflow
control in measuring tank using Flow chart
given in Fig. 5
Fig. 5 Program flow chart for overflow
control of water

Fig. 6 Program flow chart for Sump level
control
In existing SCADA there are provision for
alarm generations for fault detection in any
filed devices viz valves, variable frequency
derives and transfer pump.
2.4 Mathematical calculations and report
generations
Mathematical equations involved in the flow
calibration process as per ISO 4185 [], for
buoyancy correction, density calculation,
volume flow rate are programed in the PLC
& SCADA system. As water density is a
function of temperature, the exact
measurement of water density (�) at the
temperature that occurs within flow meter
calibration during a calibration run has to be
performed. � = ���.[(�.�� �)��.���(����.�� �)��.���(����.�� �)�]
(1)
Where ϑ� is Specific volume at 0ºC, A, B
and C are constant, ρ�� is water pressure in
line, θ is temperature of water in measuring
tank during diversion
M = W ∗ %1 + ρ�() ∗ *�+ − ��-./ (2)
M is the corrected mass, collected in
measuring tank, W is the measured weight by
load Cell, ρair is the density of air, ρ is the
density of the fluid (water), and ρw is the
density of the tank material.
Volume flow rate:
Q� = 1(2∗�) (3)
Q� = 12∗� (4)
Where Q� is calibrated discharge and t is
diversion time
3.0 FLOW CALIBRATION AND
MEASUREMENT SET-UP
The working principles of flowmeters
calibration are based on two basic methods
namely gravimetric and volumetric methods.
Gravimetric method is based on fundamental
principle, known as primary method in which
water is collected for a predetermined time
and weighed. The weighing method is again
categorized into static weighing and dynamic
weighing techniques.
The two parameters measured with this
system are mass flow rate and volume flow
rate. For the determination of volume flow
rate, the density of flowing water is measured
during measurement process. The mass flow
rate is then divided by the density to calculate
volume flow rate. As per ISO 4185 [2-5].
In the volumetric method, water flowing
through the meter under test is collected in a
volumetric vessel for a predetermined time
and its volume is measured, directly. Thus,
volume flow rate is derived and calculated.

Since the determination of volume flow rate
is measured indirectly from mass, it is treated
as secondary method. The documentary
standard released by ISO for flow
measurement in closed conduits using
volumetric method is ISO 4064 [6-8]. The
primary method based on weighing is well
established and widely accepted method
internationally [9–12].
Calibration of the electromagnetic flow meter
has been carried in open loop in which, water
is pumped from a sump having the constant
water level and diverted to the measuring
tank for a specified period through flow
diverter using gravimetric approach with
flying start- and -stop method as per ISO
4185[3].
In situ calibration chain of flow measurement
system is as follows:
(a) Calibration of balance system:
(b) Calibration of electromagnetic flow
meter:
Calibration of flow meter was performed
using gravimetric method using flying start
and stop approach as per ISO-4185.
3.1 Calibration of balance system
3.1.1 Standard weights
The F2 class standard weights are used for
calibration of calibrator tank load cell
3.1.2 Calibration of calibrator tank load
cell
Calibration of calibrator tank load cell (2ton)
is carried out with standard weights up to
1500 kg (72 No- 20 kg, 6 No-10 kg). The
empty weight of calibrator tank is 490 kg.
The output signals from load cell are logged
in SCADA at 100Hz.
A curve has been plotted between output
signal of load cell (34)56 and applied
standard weights and as shown in Fig.7 along
with its regression curve as shown in Fig.8
Fig.7 Calibration curve calibrator tank load
cell
Fig. 8 Regression error of calibrator tank load
cell
3.1.3 Calibration of Measuring Tank
Load Cell
Three ring torsion type load cell of 22-ton
each are placed at the bottom of measuring
tank to measure the weight of water collected
over a period of diversion time. These load
cells are calibrated with a calibrator tank load
cell.
A fix calibrated weight of water (about1300
kg) is transferred from calibrator tank to
measuring tank. Initial and final output
signals (mV) of load cells (measuring tank
and calibrator tank) are logged SCADA
system. The same is repeated until the level
of measuring tank reached at maximum.
0
200
400
600
800
1000
1200
1400
1600
0.00 2.00 4.00 6.00
Applie
d S
tandard
Weig
ht(k
g)
Measured Signal (mV)
-0.20
-0.10
0.00
0.10
0.20
0 300 600 900 1200 1500E
rror
(%)
Applied standard Weight(kg)

Fig.9 measuring tank load cell calibration
loop
The cumulative corrected weight of water
transferred by calibrator tank is plotted
against the primary output signal (34)76 of
measuring tank load cell as shown in Fig.10.
Regression error of measuring tank load cell
is plotted against applied standard weight as
shown in Fig.11.
Fig. 10 calibration curve of measuring tank
load cell
Fig. 11 Regression error of measuring tank
load cell
3.2 Calibration of electromagnetic flow
meter
Calibration of flow meter is carried out for
discharge range between 100 l/s to 750 l/s by
keeping sump level constant. For maintaining
sump level constant, A PLC based program
has been developed in ladder logic, details
discuss in section…. Timing error of diverter
system are obtained and used to correct the
measured discharge. Water is diverted into
measuring tank for a set period of time until
it gets fully filled. Initial and final readings of
measuring tank load cells (mV)MT, initial and
final temperature and diversion time are
logged into SCADA in order to calculate the
discharge. Buoyancy correction is made to
the readings of a load cell to take account of
the difference between the upward thrust
exerted by the atmosphere and water being
weighed.
Frequency (89) signal from flowmeter during
diversion period are log in SCADA and flow
Calibration and regression curve are plotted
in Fig.12 and Fig.13 respectively.
0
5000
10000
15000
20000
25000
30000
35000
40000
45000
0.0 3.0 6.0 9.0 12.0
Measured Voltage (mV)
Applie
dC
um
ula
tive
Weig
ht(K
g)
δm = -3E-10*m2 + 1E-05*m -
0.0932
-1.2
-1.0
-0.8
-0.6
-0.4
-0.2
0.0
0.2
0.4
0 10000 20000 30000 40000 50000
Cummulative weight of
Err
or
(%)

Fig.12 Flow meter calibration curve
Fig.13 regression error of flow meter
Calibration equations of electromagnetic
flowmeter, measuring tank load cell and
calibrator tank load cell are tabulated in
Table-1.
Table-1 Calibration equation of flow
parameters
Instrument Calibration equation
Calibrator
tank load
cell
(:56)5 = 400.76 ∗ (34)56− 495.82
Measuring
tank load (:76)5 = 4622.57 ∗ (34)76− 11523.86
Flow meter D5 = 3 ∗ 10E ∗ 89F+ 0.191448∗ 89+ 1.318646
These calibration equations are used in
Ladder logic based PLC programming to
convert raw signal into calibrated values.
4.0 UNCERTAINTY ANALYSIS
The uncertainty associated with a discharge
measurement is obtained by combining the
uncertainties arising from the sources.
Although "systematic" errors have been
distinguished from "random" errors, the
probability distribution of the possible values
of each systematic component is essentially
Gaussian, and, in accordance with IS0 5168.
The combination of all the uncertainties may
be made by the root-sum-square method.
As per ISO 4185, the systematic, random
uncertainty and total uncertainty in discharge
measurement is given by (as per ISO
4185(1980)) Eq.5, Eq.6 and Eq.7
respectively.
eH = I[(e )�]F + J(e )KLF + [(e )M]F +[(e )N]F + [(e )2]F
(5)
where OP is the overall system uncertainty; (QP)R uncertainty due to the weighing
machine; (QP)S is the buoyancy correction; (QP)T is the systematic uncertainty due to
diverter system; (QP)V is systematic
uncertainty due to the timing device; (QP)W systematic uncertainty in the
measurement of density.
(eHX)YZ = [[(eX)�]F + J(eX)KLF (6)
0
100
200
300
400
500
600
700
800
0 1000 2000 3000 4000
Measure
d D
ischarg
e (
l/s)
Measured Frequency (Hz)
-0.20
-0.16
-0.12
-0.08
-0.04
0.00
0.04
0.08
0.12
0.16
0.20
0 200 400 600 800
Discharge (l/s)
Err
or
%

where, (Q\)R Random uncertainty is the
difference between two weighing
observations; (Q\)T is the random uncertainty
due diverter system; the random uncertainty
in density measurement (Q\)W is neglected
(eH]) = [J(eHX)YZLF + JeH LF (7)
In the present study buoyancy effect has been
calculated as per Eq.2 in the measuring tank
and correction has been made in the total
collected weight of water in measuring tank.
Systematic error (QP)V in time measurement
is neglected
In present setup, F2 class weight, calibrator
tank and measuring tank constitute the
weighing system. Systemic uncertainty of
measuring tank load cell is calculated using
Eq.8 and Eq.9 as per ISO-4185.
δm = -3E-10*m2 + 1E-05*m - 0.0932 (8)
δ(Δm) = δmF − δm� (9)
Correction on measurement in diversion time
is also carried out as per method given in
ISO-4185 as shown in Fig.14. Value obtained
from the curve Δt= 0.0217s is adjusted in the
total diversion time during flow meter
calibration.
Fig.14 diversion time correction
Systematic uncertainties of each
instrument/parameter are given in Table-2.
Table 2-Systemic uncertainties in flow
measurement
S.
No
Components Uncer.
(%)
1. weighin
g
system
Standard
weights
0.0045 0.070
Calibrat
or tank
load cell
0.05
Measuri
ng tank
load cell
0.0489
2. Timing device Negligibl
e
3. Density 0.010
4. Diverter system 0.049
5. Buoyancy corrected
Systemic uncertainty in flow
measurement
0.0860
The repeatability of the movement (random
error) of the flow diverter is determined
experimentally by setting the flow-rate to a
steady value and then carried out series of 10
diversions for a fixed diversion period to
provide a series of 10 estimations of the
flow- ate This exercise is repeated for several
Δt= 0.0217 s
0.000
0.001
0.002
0.003
0.004
0 0.1 0.21abc − 1abd

different diversion periods and, from the
standard deviation of each series of
measurements, the 95 % confidence limits
have been be evaluated as per ISO-4185 and
are shown in Fig.15.
Fig.15 Random error in diverter time
For evaluation of random error of weighing
system, the standard deviation of the
distribution of points about the best-fit curve
shown in Fig.11 is calculated with 95 %
confidence limits of the distribution
determined using Student’s t-table. This
value of confidence limits is multiplied by
square root of two (since the determination of
the mass of water collected in measuring tank
during a diversion is obtained from the
difference between two weighing) as per
ISO-4185. Random error of flow diverter
system and weighing system are found as
±0.0262616 and ±0.0485% respectively.
Total random error in flow measurement
during calibration is calculated using Eq.7
and found out as 0.0551%. Systematic
uncertainty of flow measurement during
calibration is 0.0860% and regression error at
700 l/s is found 0.02% from flow calibration
curve. The total uncertainty in flow
measurement at 700 l/s is found as ±0.104%.
5.0 CONCLUSIONS
The real-time data base as an inherent
component of the SCADA system being
applied for the automated operation of the
test field provides capabilities these special
capabilities are a prerequisite to execute the
flow calibration process and control the flied
instruments. In-situ calibration of measuring
instruments viz calibrator tank load cell,
measuring tank load cell, flowmeter has been
performed. Calibration equations, regression
curves have been obtained. Uncertainty
analysis has been performed as per ISO 4185
at 700 l/s flowrate and systematic error,
random error and regression error has been
found 0.086%, 0.055% and 0.02%
respectively. The total uncertainty in flow
measurement at 700 l/s is found as ±0.104%.
Acknowledgement:
Financial support for this Laboratory and
Research team is supported by the Ministry
new and renewable energy, Govt. of India.
6.0 REFERENCE
[1]. Engel R., Baade H.J., and Rubel A,
Performance Improvement of Liquid
Flow Calibrators by Applying Special
Measurement and Control Strategies,
Proceedings of the 11th International
Conference on Flow Measurement
(FLOMEKO 2003), Groningen, May
12–14, 2003.
[2]. ISO 4185:1980, Measurement of liquid
flow in closed conduits-Weighing
method, 1st edition, 1980, pp. 1-21.
[3]. ISO 9368-1, Measurement of Liquid
Flow in Closed Conduits by Weighing
Methods—Procedure for Checking the
Installations, Part 1: Static Weighing
System, 1st Ed., ISO, Charlottesville,
(1990) pp. 1–22.
[4]. ISO 5168, Measurement of Liquid Flow
in Closed Conduits— Procedure for the
Evaluation of Uncertainties, 2nd Ed.,
ISO, Charlottesville, (2005) pp. 1–65.
[5]. JCGM 100, Evaluation of measurement
data – Guide to the expression of
uncertainty in measurement, 1st Ed.,
-0.06
-0.04
-0.02
0
0.02
0.04
0.06
0 20 40 60
Diversion Time (s)
Err
or
(%)

JCGM, Viana Do Castelo, (2008) pp. 1–
134.
[6]. ISO 4064, Measurement of Water Flow
in Fully Charged Closed Conduits—
Meters for Cold Potable Water and Hot
Water—Part 1: Specifications, 3rd Ed.,
ISO, Charlottesville, (2005) pp. 1–42.
[7]. ISO 4064, Measurement of Water Flow
in Fully Charged Closed Conduits—
Meters for Cold Potable Water and Hot
Water—Part 2: Installation
Requirements, 3rd Ed., ISO,
Charlottesville, (2005) pp. 1–10.
[8]. ISO 4064, Measurement of Water Flow
in Fully Charged Closed Conduits—
Meters for Cold Potable Water and Hot
Water—Part 3: Test Methods and
Equipment, 3rd Ed., ISO,
Charlottesville, (2005) pp. 1–71.
[9]. Jaiswal S. K., Yadav S., Bandyopadhyay
A.K., Agarwal R., “Global Water Flow
Measurement and Calibration Facilities:
Review of Methods and
Instrumentations” MAPAN-Journal of
Metrology Society of India (June 2012)
27(2):63–76
[10]. David C. and Claudel P., “Novel Water
Flow Facility in France Range Extension
to Low Flow Rates (10 000 ml/h down
to 1 ml/h)”, MAPAN-J. Metrol. Soc.
India, 26 (2011) 203–209.
[11]. NIST Special Publication 250, NIST
Calibration Services for Water
Flowmeters, Water Flow Calibration
Facility, NIST, Gaithersburg, August
2006.
[12]. Engel R, “Modeling the Uncertainty in
Liquid Flowmeters Calibration and
Application—Requirements and Their
Technical Realization for PTB’s
National Water Flow Standard”,
Proceedings of SENSOR Conference
2007, Nurnburg, May 22-24, 2007.
[13]. Bhaskar. B, Nagashyam P, Priyanka S
and Navya P, “FLOW CALIBRATION
USING PLC AND SCADA”,
International Journal of Scientific &
Engineering Research, Volume 7, Issue
3, March-2016 ISSN 2229-5518