Embed Size (px)
Citation preview
ORIGINAL ARTICLE
doi:10.1111/j.1558-5646.2010.01097.x
CALIBRATING DIVERGENCE TIMES ONSPECIES TREES VERSUS GENE TREES:IMPLICATIONS FOR SPECIATION HISTORYOF APHELOCOMA JAYSJohn E. McCormack,1,2 Joseph Heled,3 Kathleen S. Delaney,4 A. Townsend Peterson,5 and L. Lacey Knowles1
1Museum of Zoology, Department of Ecology and Evolutionary Biology, University of Michigan, Ann Arbor,
Michigan 481092E-mail: [email protected]
3Computational Evolution Group, Department of Computer Science, University of Auckland, Auckland, New Zealand4University of California, Los Angeles, Department of Ecology and Evolutionary Biology, 621 Charles E. Young Dr.,
Los Angeles, California 900955Biodiversity Institute, University of Kansas, Lawrence, Kansas 66044
Received February 4, 2010
Accepted July 20, 2010
Estimates of the timing of divergence are central to testing the underlying causes of speciation. Relaxed molecular clocks and
fossil calibration have improved these estimates; however, these advances are implemented in the context of gene trees, which
can overestimate divergence times. Here we couple recent innovations for dating speciation events with the analytical power
of species trees, where multilocus data are considered in a coalescent context. Divergence times are estimated in the bird genus
Aphelocoma to test whether speciation in these jays coincided with mountain uplift or glacial cycles. Gene trees and species trees
show general agreement that diversification began in the Miocene amid mountain uplift. However, dates from the multilocus
species tree are more recent, occurring predominately in the Pleistocene, consistent with theory that divergence times can be
significantly overestimated with gene-tree based approaches that do not correct for genetic divergence that predates speciation.
In addition to coalescent stochasticity, Haldane’s rule could account for some differences in timing estimates between mitochondrial
DNA and nuclear genes. By incorporating a fossil calibration applied to the species tree, in addition to the process of gene lineage
coalescence, the present approach provides a more biologically realistic framework for dating speciation events, and hence for
testing the links between diversification and specific biogeographic and geologic events.
KEY WORDS: Aphelocoma, BEAST, divergence times, fossil calibration, gene tree, glaciations, mountain uplift, Pleistocene, species
tree.
The timing of speciation events holds special significance for
addressing questions in evolutionary biogeography (e.g., Brown
et al. 2008), yet obtaining accurate estimates for divergence times
on phylogenies is notoriously difficult and fraught with potential
sources of error (Arbogast et al. 2002; Grauer and Martin 2004).
Recent analytical advances in relaxed phylogenetics (Thorne and
Kishino 2002; Sanderson 2003; Drummond and Rambaut 2007)
have addressed many of these difficulties, for instance by allow-
ing for molecular rate heterogeneity among lineages (reviewed in
Brown and van Tuinen in press). Timing estimates have also been
made more accurate with the inclusion of fossil calibrations (Yang
and Rannala 2006) and informative priors on substitution rates
1 8 4C© 2010 The Author(s). Evolution C© 2010 The Society for the Study of Evolution.Evolution 65-1: 184–202
DIVERGENCE DATING ON SPECIES TREES
(e.g., Weir and Schluter 2008). However, these advances have
thus far been limited to gene-tree or concatenation approaches,
where divergence times are estimated under the assumption that
all gene trees share the same topology and branch lengths. Yet
research shows that topological discord among genes is common-
place (Knowles and Carstens 2007; Cranston et al. 2009), and
although multiple potential sources for gene-tree heterogeneity
exist (Maddison 1997; Degnan and Rosenberg 2009), a universal
source of discord arises from the random coalescence of gene
lineages (Kingman 1982). Compared to concatenation, the multi-
locus coalescent allows for much more accurate estimation of the
divergence history (i.e., the pattern of species splitting) (Maddison
and Knowles 2006; Edwards et al. 2007; Kubatko and Degnan
2007; Heled and Drummond 2010). Moreover, because the tim-
ing of gene divergences necessarily predates the actual speciation
event (unless gene flow accompanies species divergence), con-
clusions based on gene trees will always overestimate divergence
times in contrast to multilocus coalescent approaches (Edwards
and Beerli 2000; Carstens and Knowles 2007b). In light of these
issues, the unification of species-tree methods (which are based
on the multilocus coalescent; Knowles 2009) with relaxed phylo-
genetics provides a next step in the progress toward a precise and
accurate understanding of the timing of species diversification.
Accurate estimation of divergence times is especially criti-
cal when testing diversification hypotheses that involve adjacent,
nonoverlapping time intervals. In North America, mountain for-
mation and glacial cycles were two largely discrete Earth history
events that radically reshaped landscapes (Axelrod 1979; Webb
and Bartlein 1992; Hewitt 2004), affecting both the timing and
tempo of speciation of plants and animals (e.g., Knowles 2000;
Lessa et al. 2003; Smith and Farrell 2005). Peaking during the
Miocene, mountain uplift fragmented species’ ranges and created
high-elevation habitats for colonization (Van Devender 2002).
Despite the general consensus that these events promoted di-
versification (Badgley, in review), few detailed genetic studies
have linked speciation events to this time period (but see Riddle
1995, 1996; Jaeger et al. 2005). More emphasis has been placed
on Pleistocene glacial cycles, which are thought to have pro-
moted divergence either directly through ice sheet advance (Weir
and Schluter 2004) or indirectly by fragmenting habitats (Hewitt
1996; Knowles 2001; Knowles et al. 2007; Muster et al. 2009).
The signal of Pleistocene divergence is expected to be particularly
evident in the last 0.7 million years (Ma), when glacial cycles be-
came more intense (Webb and Bartlein 1992). In birds, the bulk of
evidence appears to support a prominent role for glacial cycles in
diversification (Avise and Walker 1998; Weir and Schluter 2004;
Cicero and Johnson 2006), although some evidence based on
fixed-rate molecular clocks points to pre-Pleistocene divergence
(Klicka and Zink 1997, 1999; Lovette and Bermingham 1999).
The importance of glacial cycles (Weir and Schluter 2007) and
other major biogeographic events (e.g., land bridge completion
between North and South America; Weir et al. 2010) to speciation
has begun to be addressed with relaxed phylogenetics, but how
conclusions might differ if analyses were conducted at the level
of the species tree—the appropriate level for such analyses—is
unknown.
We test the relative roles of mountain uplift and glacial cy-
cles on diversification in jays (genus Aphelocoma) by calibrating
divergence times on a species tree, an analysis made possible
by recent modifications to the program BEAST (Drummond and
Rambaut 2007) that allow for joint estimation of the species tree
and divergence times (∗BEAST; Heled and Drummond 2010). In
this framework, fossil calibrations are applied appropriately to the
species tree, whereas priors on substitution rates are applied to
individual gene trees. We compare species-tree divergence dates
to those estimated from more traditional analyses, including a
single mitochondrial DNA (mtDNA) gene tree and concatenated
data from one mtDNA gene and two nuclear introns.
The bird genus Aphelocoma provides an excellent study sys-
tem with which to test the relative influence of Pleistocene glacial
cycles and Miocene mountain uplift in North America in a species-
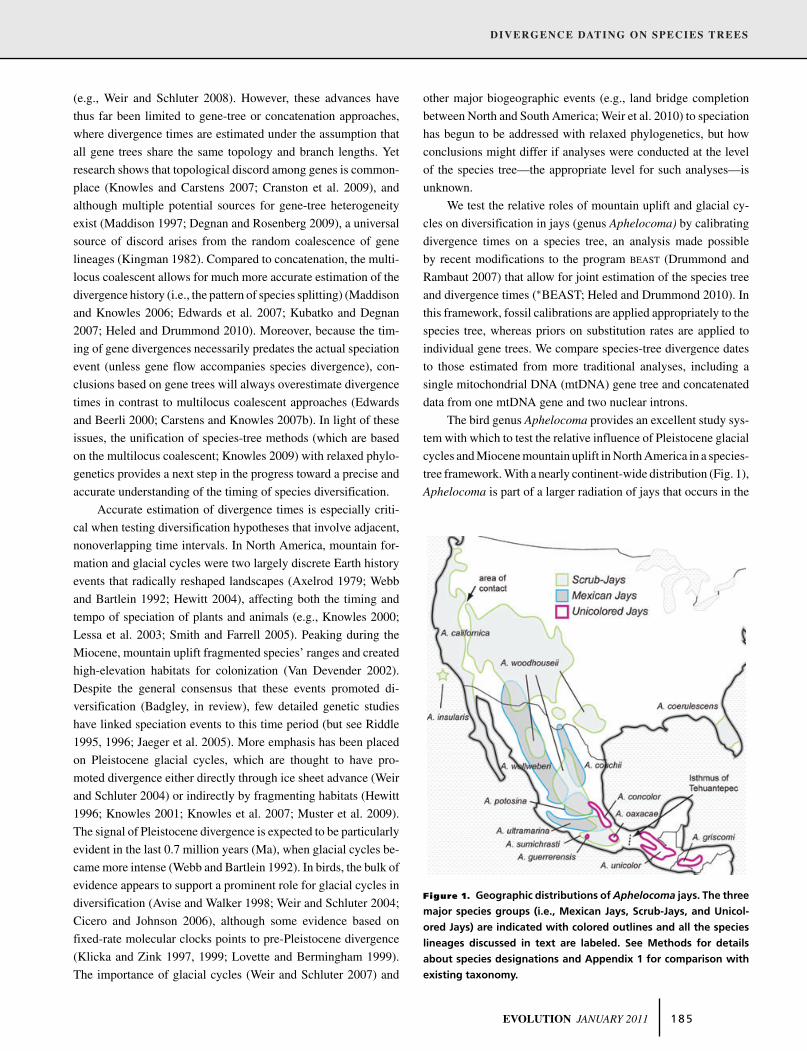
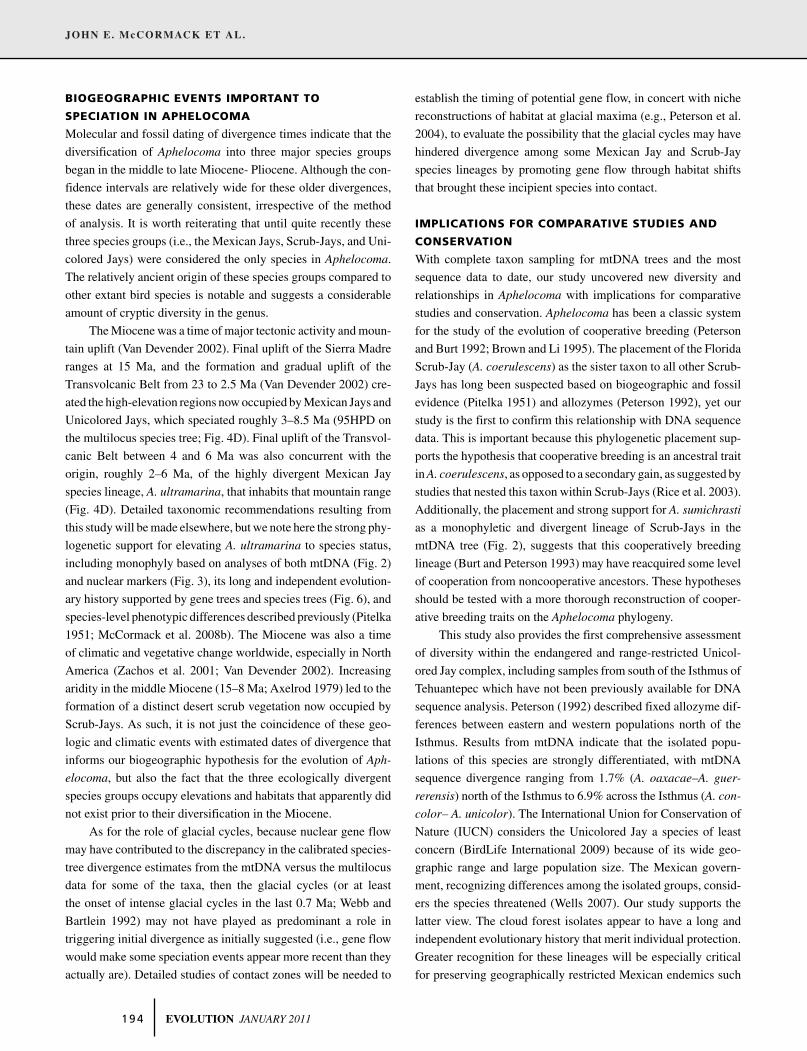
tree framework. With a nearly continent-wide distribution (Fig. 1),
Aphelocoma is part of a larger radiation of jays that occurs in the
Figure 1. Geographic distributions of Aphelocoma jays. The three
major species groups (i.e., Mexican Jays, Scrub-Jays, and Unicol-
ored Jays) are indicated with colored outlines and all the species
lineages discussed in text are labeled. See Methods for details
about species designations and Appendix 1 for comparison with
existing taxonomy.
EVOLUTION JANUARY 2011 1 8 5
JOHN E. McCORMACK ET AL.
New World (Bonaccorso and Peterson 2007). Aphelocoma species
occupy regions of both high and low elevation in many ecolog-
ical contexts (Pitelka 1951; Peterson and Vargas-Barajas 1993;
McCormack and Smith 2008), making diversification hypotheses
invoking both mountain uplift and glacial cycles plausible. Our
time-calibrated phylogenies include a fossil calibration point for
the genus, as well as a new fossil-calibrated mtDNA substitution
rate (with error) for birds specifically (Weir and Schluter 2008).
Bird fossils do not preserve well, and it is especially difficult to
find pre-Pleistocene fossils that can be attributed with high confi-
dence to a specific living species or ancestor. Setting Aphelocoma
apart is the existence of a relatively old (1.98–2.01 Ma) fossil of
the Florida Scrub-Jay (A. coerulescens), complete with synapo-
morphic bill traits (Emslie 1996). This fossil allows for a minimum
age estimate on a node placed away from the tips of the phylogeny,
where calibration points are most informative (Drummond et al.
2006). Additionally, although a modern phylogenetic analysis
of the genus is largely lacking, geographic distributions (Pitelka
1951; Peterson 1991b) and phenotypic (Pitelka 1951; Peterson
1991a; McCormack et al. 2008b) and genetic diversity (Peterson
1992; Rice et al. 2003; Bhagabati et al. 2004; Delaney et al. 2008;
McCormack et al. 2008a) in Aphelocoma are well described, pro-
viding a framework for a comprehensive systematic study in-
cluding representatives from all known repositories of diversity
(although the necessity of using ancient DNA limited the collec-
tion of nuclear data for some lineages). A pair of recent studies
also suggests that Aphelocoma is older and more phylogeneti-
cally diverse than previously recognized (Delaney et al. 2008;
McCormack et al. 2008b), distinctions that are not reflected in
their current taxonomy (Watson 2005). A better understanding
of the speciational history of Aphelocoma is important given the
group’s status as a classic study system for the evolution of coop-
erative breeding (Woolfenden and Fitzpatrick 1985; Peterson and
Burt 1992; Brown and Li 1995) and the ecological niche (Peterson
and Holt 2003; Rice et al. 2003; McCormack et al. 2010).
MethodsSTUDY SYSTEM
Until the elevation of the Florida Scrub-Jay (A. coerulescens) and
Island Scrub-Jay (A. insularis) to full species status separate from
Western Scrub-Jays (A. californica) (American Ornithologists’
Union 1998), Aphelocoma was split into three species that cor-
responded to the major morphological and plumage types: Scrub
Jays, Mexican Jays, and Unicolored Jays (Fig. 1). Single-species
studies since that time have revealed considerable phylogenetic
and morphological diversity within Western Scrub-Jays (Delaney
et al. 2008) and Mexican Jays (McCormack et al. 2008b) that ap-
proaches species-level distinctiveness in the genus. Phylogenetic
diversity within Unicolored Jays is less well known, owing to a
lack of modern sampling south of the Isthmus of Tehuantepec
in Mexico. Due to the uncertainty surrounding current species
limits (Watson 2005), and because species-tree methods are most
useful when each genetically isolated group is considered a sep-
arate taxon, we refer to the major lineages of Aphelocoma as full
species (see Fig. 1 for geographic range of all lineages discussed
hereafter). We acknowledge the possibility that some of these
lineages might not merit elevation to full species status upon de-
tailed study; however, they are included here to provide a more
comprehensive view on the timing of the divergence history.
An important assumption of species-tree methods is a lack of
gene flow among lineages. In empirical studies, this assumption is
often violated to some extent. However, compared to many other
relatively recently evolved bird groups, gene flow among Aphelo-
coma lineages is limited; detailed studies have only documented
likely cases of gene flow among two pairs of lineages (see Dis-
cussion for details). In neither case are these lineages sister taxa
and in both cases gene flow is evident in nuclear markers whereas
mtDNA show reciprocal monophyly. Although there are methods
that model gene flow as well as the coalescent (i.e., the isolation-
with-migration model; Hey and Nielsen 2004), the approaches
based on the Isolation-with-Migration model are inappropriate if
gene flow is not between sister taxa, and they require a species-
tree as input (i.e., they do not provide an estimate of a species tree
under a model of divergence with gene flow).
SAMPLE COLLECTION AND DNA EXTRACTION
Molecular analyses were based on 80 frozen tissue or blood sam-
ples from individuals from across the full extent of geographic,
morphological, and taxonomic diversity currently known in Aph-
elocoma (Appendix 1). Genomic DNA was extracted from blood
and tissue using a DNeasyTM Tissue Kit (Qiagen, Valencia, CA)
following manufacturer’s protocols. For DNA extraction from toe
pads of museum specimens of three Unicolored Jay lineages, for
which fresh blood or tissue was not available, a similar protocol
was used, except that the toe pads were washed in ethanol for
several days prior to DNA extraction, special care was given to
ensure sterile conditions, digestion time was extended for up to
72 h, and DNA was eluted with larger volume to increase yield
and later vacuum-centrifuged to increase DNA concentrations.
MITOCHONDRIAL DNA SEQUENCES
A 636-bp fragment of the NADH dehydrogenase subunit 2 (ND2)
was amplified using primers H-6313 and L-5216 and an 820-bp
fragment of the cytochrome b (cyt b) gene was amplified using
primers H-16065 and L-14990. PCR conditions were the same for
both genes and follow procedures described in McCormack et al.
(2008b). Several different pairs of internal primers were used to
obtain ancient DNA. PCR products were sequenced using an au-
tomated ABI 3730 XL capillary sequencer (Applied Biosystems,
1 8 6 EVOLUTION JANUARY 2011
DIVERGENCE DATING ON SPECIES TREES
Foster City, CA). All sequences were aligned with SEQUENCHER
4.1.4 (Gene Codes Corporation, Ann Arbor, MI).
NUCLEAR INTRON DNA SEQUENCES
We screened a panel of 10 nuclear introns and chose two that
amplified well across Aphelocoma taxa and were variable.
We amplified a 527-bp portion of ornithine decarboxylase,
introns 6 & 7 (OD) using primers OD.6F 5′-GATGAYTCCAAA
GCAGTYTGTCGNCTCAG-3′ and OD.8R 5′-CCAGGRAA
GCCACCACCAATRTC-3′ (Harrigan et al. 2008). We also
amplified a 689-bp fragment of rhodopsin, intron 1 (Rho) using
a specially designed forward primer Rhod.1Fjay 5′-GAGCCA
CCTGCTCAGTATCC-3′ and Rhod.1R 5′-CCCATGATG
GCGTGGTTCTCCCC-3′ (Kimball et al. 2009). PCR reactions
were carried out using the following conditions: 3 min at 92◦C,
35 cycles of 1 min at 92◦C, 30 s at 60◦C, and 30 s at 72◦C,
and a final extension of 5 min at 72◦C. Sequences were aligned
with SEQUENCHER. Individuals with multiple heterozygous sites
were phased probabilistically using the program PHASE (Stephens
et al. 2001), accepting results with a probability >90%, using a
burn-in of 10,000 iterations and a run length of 10,000 iterations.
Haplotypes for remaining individuals were determined by
cloning. Haplotypes for individuals heterozygous for indels were
determined using the web-based program INDELLIGENT version
1.2 (Dmitriev and Rakitov 2008) or by cloning. TOPALi version 2
(Milne et al. 2004) was used to test for recombination in nuclear
loci using the difference of sums of squares (DSS) method with
a sliding window of 100-bp and 10-bp step size.
SINGLE GENE-TREE ANALYSES
Phylogenies for mtDNA data and nuclear introns were recon-
structed using maximum likelihood (ML) and Bayesian analysis.
Because there were several indels in the OD gene that appeared
to be phylogenetically informative, Maximum Parsimony (MP)
was also implemented with a heuristic search in PAUP∗ version
4.0b (Swofford 2000) with single and contiguous-base indels
treated as a single event and included in the analysis. Prior to
ML and Bayesian analysis, we selected a best-fit model of nu-
cleotide substitution for each of the three genes (including by
codon position for mtDNA only) using MRMODELTEST version 2.3
(Nylander 2004) under the Akaike information criterion (AIC).
Data were partitioned into codon positions for mtDNA because
different substitution models were indicated for each position (see
Results).
ML trees were estimated using GARLI, version 0.951 (Zwickl
2006) using best-fit nucleotide-substitution models, with parame-
ter values estimated from the data and gamma-rate categories set
to four. Bootstrap support for the mtDNA gene tree was assessed
via 500 pseudoreplicates. Bayesian analysis on gene trees was
performed using MRBAYES version 3.1.2 (Ronquist and Huelsen-
beck 2003) as opposed to BEAST because multiple chains can
be implemented more easily in the former, allowing for better
exploration of parameter space. For mtDNA, we partitioned data
by codon position, assigning to each partition its best-fit model
family of nucleotide substitution, with all parameters unlinked
between partitions except topology and branch lengths. We ran
two independent analyses for 5 × 10⁶ generations using four
Markov chains and default heating values. Parameter values were
estimated from the data using uniform priors. Trees were sam-
pled every 1000 generations, resulting in 5000 trees for each run.
A majority-rule consensus tree was created from the final 10,000
trees. For each analysis, burn-in times were determined by eye us-
ing Tracer version 1.5 and convergence was assessed with AWTY
(Nylander et al. 2008) to confirm that the standard deviation of
split frequencies approached zero.
Phylogenies were rooted with sequences from close relatives
of Aphelocoma as determined from a recent phylogeny of New
World jays (Bonaccorso and Peterson 2007). For mtDNA, trees
were rooted using DNA sequence from a Steller’s jay (Cyanocitta
stelleri) and a pinyon jay (Gymnorhinus cyanocephalus). For nu-
clear introns, trees were rooted using C. stelleri.
DIVERGENCE DATING OF GENE TREES
For comparison to species-tree based estimates, divergence dates
were estimated under a gene-tree framework from the mtDNA
data alone and from concatenated data (i.e., the mtDNA and the
two nuclear genes combined to estimate a single gene tree). Di-
vergence times of the major lineages were estimated with the
coalescence-based program BEAST version 1.4.8 (Drummond and
Rambaut 2006). Desirable features of BEAST from the standpoint
of this study include the ability to (1) calibrate the phylogeny us-
ing fossil data for certain nodes, (2) allow substitution rates to vary
among branches, and (3) input a prior on the global substitution
rate for mtDNA, incorporating error (Drummond et al. 2006). For
both the mtDNA and concatenated gene analysis, we chose a Yule
tree prior under the assumption that the gene tree is the species
tree. As is customary for such analyses, we used a phylogeny
pruned arbitrarily to include one representative from each of the
major lineages uncovered with the mtDNA gene tree analysis.
This method excludes closely related terminal taxa because the
Yule tree prior does not include a model of coalescence, which
can complicate rate estimation for closely related sequences (Ho
2005). For the mtDNA analysis, we used 17 Aphelocoma lin-
eages (plus two outgroups). For the concatenated analysis, we
used 14 Aphelocoma lineages plus one outgroup because nuclear
data could not be obtained from the three Unicolored Jay lineages
for which ancient DNA was used.
For the mtDNA analysis, we used BEAST to estimate substitu-
tion models for each codon position, assuming uncorrelated rates.
For this and all other BEAST analyses, we applied a lower bound
EVOLUTION JANUARY 2011 1 8 7
JOHN E. McCORMACK ET AL.
of 1.87 Ma on the date of the split between A. coerulescens and
other Scrub-Jays based on a fossil bearing synapomorphies in bill
morphology unique to A. coerulescens (Emslie 1996). Not only
is taxonomic error minimized when fossils are assigned to extant
species, but the fact that the geographic range of A. coerulescens
is far removed from other living congeners makes confusion with
similar species less likely. Further details on identifying extant
North America birds from bill fossil data can be found in Emslie
(2007).
The fossil A. coerulescens was dated to 1.87–2.01 Ma based
on its occurrence in the Inglis 1A local fauna and reference to a de-
tailed biochronology of Florida’s fauna (Morgan 2005). Potential
error toward older dates was considered through the highly con-
servative application of a uniform prior to all dates from 1.87 Ma
back to 100 Ma. Although a lognormal shape has been suggested
for priors based on fossil data (Ho 2007), we had no information
about the possible shape of the distribution (i.e., location of its
peak and 95 HPD). To address potential error toward younger
dates, we reran our analyses using 1.5 Ma as the lower bound.
Results were qualitatively similar with mean divergence dates for
all nodes differing on average 5% between the two analyses, well
within the 95HPDs. BEAST requires a fossil calibration date on
the root node or, if this is not available, a prior on the global
substitution rate (Drummond et al. 2006). A middle Miocene fos-
sil bearing similarities to Aphelocoma exists (Brodkorb 1972).
However, given that the fossil is fragmentary and taxonomic as-
signment equivocal, we chose not to use this fossil to inform a
prior on the root node as incorrect taxonomic assignment can in-
troduce a large source of error into estimates of divergence times
(Ho 2007). Instead, we applied a prior on the global mtDNA sub-
stitution rate (mean = 0.0105 substitutions/my ± 0.001 95% CI)
based on new fossil calibrations of coding mtDNA substitution
rates in birds (Weir and Schluter 2008). We allowed this rate to
vary among branches in accordance with a lognormal distribution
with uncorrelated rates. Some studies have found mutation rates to
be much higher over recent timescales (Subramanian et al. 2009),
suggesting time dependency of mutation rates; given that our
study investigated speciation over several million years, we used
a substitution rate calibration that corresponded to this timescale.
In general, our priors were not expected to have an undue in-
fluence on the posterior age estimates because of the unrestrictive
nature of our fossil prior (i.e., a flat prior). However, to examine
whether this fossil prior was having a strong effect on our poste-
rior divergence estimates, we ran an empty alignment (generated
by Beauti) for the mtDNA data. Although similar analyses were
not possible for all analyses (because of limitations arising from
generating empty alignments from hand-edited XML files), we
expect results of the empty alignment for the mtDNA gene tree
to be generally representative because the same fossil prior was
used in all analyses.
For the concatenated analysis, we specified appropriate sub-
stitution models for the different data partitions. Data were con-
catenated by matching the mtDNA to one of the phased nuclear
gene copies chosen at random for each individual to generate
one concatenated sequence per individual. Preliminary analysis
revealed that nuclear genes were evolving at rates similar to one
another, but different from the mtDNA rate, so the XML file for
analysis in BEAST was edited by hand to allow two molecular
clocks, one for mtDNA and one for nuclear genes. The fossil
prior and prior on the mtDNA substitution rate were the same as
above.
Chain lengths were 107 with parameters sampled every 103
for the mtDNA analysis because preliminary runs indicated that
this analysis converged relatively quickly and remained stable. For
the concatenated analysis, chain lengths were increased to 108.
Convergence statistics were monitored by effective samples sizes
(ESS), monitoring the run in Tracer version1.5, and with AWTY.
A consensus tree with divergence times was obtained from the
10,000 or 100,000 trees after discarding the first 10% as burn-in,
which was quite conservative.
DIVERGENCE DATING OF THE SPECIES TREE
Simulation studies have shown that three loci combined with
multiple (3–9) gene copies per lineage is sufficient for recovering
species trees with high accuracy for divergences much younger
than that expected in our study (Maddison and Knowles 2006;
McCormack et al. 2009; Heled and Drummond 2010; Knowles
2010). The species-tree analysis employed three genes and the
number of gene copies per lineage ranged from 2 to 31 (aver-
age = 6.9 gene copies per lineage) across all loci. Species-tree
analyses were implemented in ∗BEAST, part of the BEAST version
1.5.3 package. ∗BEAST infers species trees from multilocus data
and shows advantages in computational speed and accuracy over
other similar methods (Heled and Drummond 2010). ∗BEAST uses
the multispecies coalescent, an extension of the coalescent prior
designed to handle multiple species. Each gene tree is embedded
inside the species tree and follows the coalescent in each extant
and ancestral species. For this reason, and because ∗BEAST can
handle different numbers of gene copies for each taxon, we used
the full dataset representing all individuals from each Aphelocoma
lineage (plus one outgroup) for which both mtDNA and nuclear
data were collected. In addition to divergence times, ∗BEAST also
incorporates an estimate of population sizes for each branch into
species-tree estimation. Because our goals concerned the tim-
ing of diversification, we have focused only on divergence times
here. The analysis used a Yule prior for the species tree. The
fossil prior on the divergence of A. coerulescens was applied to
the species tree, whereas the prior for the mtDNA substitution
rate (see above) was applied to that gene tree only. Specifically,
the XML was hand-edited to include a prior on the species tree
1 8 8 EVOLUTION JANUARY 2011
DIVERGENCE DATING ON SPECIES TREES
such that only topologies with C. stelleri as the outgroup were
considered, and a uniform prior of 1.87–100 Ma was applied to
the stem group (see Fig. 4) of A. coerulescens. The XML file
with embedded instructions for hand-editing is included as Sup-
porting information, and automation of XML file generation for
this method with Beauti is planned for inclusion in the upcoming
BEAST 1.6 package. The mtDNA data were partitioned into three
codon positions, and a relaxed uncorrelated lognormal clock was
applied to this gene tree. A strict clock was used for the nuclear
genes following preliminary runs, which established no signifi-
cant deviations from a strict clock in that, for these genes, the
95HPD of the posterior distribution of the standard deviation of
the substitution rate included zero. Results for the ∗BEAST anal-
yses were obtained by combining posterior samples from four
independent chains of length 5 × 10⁷ each. Again, convergence
was assessed with ESS values, Tracer, and AWTY; a conservative
cutoff of 10% was used for the burn-in.
Because the mtDNA data were suspected to support a dif-
ferent topology than the nuclear data for reasons other than the
stochasticity of the coalescent process (see Discussion), we also
analyzed the mtDNA data separately. Although species-tree anal-
yses are typically carried out using multilocus data, inference from
a single locus is possible (see details in Heled and Drummond
2010), and preferable for estimating divergence times because
they explicitly take into account the gene divergence within the
ancestral population as opposed to analyses based directly on a
gene tree, which do not take into account gene divergence that
predates species divergence (see Edwards and Beerli 2000). Un-
like the gene-tree analysis from above, all individuals were used,
and as in the multilocus analysis, the fossil prior was applied to
the species tree, whereas the mutation rate prior was applied to
the gene tree. Chain lengths were 108 with parameters sampled
every 103. For all analyses using *BEAST, a consensus tree with
divergence times was obtained from the 100,000 trees after dis-
carding the first 10% as burn-in. A cloudogram of the species tree
was created from the posterior distribution of species trees with
DensiTree (Bouckaert 2010).
ResultsDNA SEQUENCE CHARACTERISTICS AND GENE TREE
ANALYSIS
Final mtDNA sequences were 820 bp for cyt b and 636 bp for
ND2 with no premature stop codons. The two fragments were
concatenated and treated as a single locus for further analysis. Of
the total 1456 bp of mtDNA, 393 sites (27%) were variable. The
OD nuclear intron was 527 bp with 24 (4.6%) variable sites. OD
also had eight indels, some of which were fixed among lineages.
Two deletions were found in a heterozygous state. An interest-
ing insertion–deletion pattern was observed in some Scrub-Jays
in which a suite of five substitutions occurred over a 15-bp re-
gion flanked on either end by a single-bp insertion and deletion.
Twelve Scrub-Jays were detected with this substitution pattern in
a heterozygous state and were readily observed by a characteristic
15-bp segment of nonaligning DNA. This portion was excised for
ML and Bayesian analysis and coded as a single mutation event
for MP. The Rho intron consisted of 689 bp total and had 30 vari-
able sites (4.4%). No significant recombination was detected in
the nuclear loci.
For mtDNA data, MRMODELTEST identified a GTR + I + G
as the best model for the locus, and HKY + I, GTR + I, and
HKY + I + G for first, second, and third mtDNA codon po-
sitions, respectively. ML and Bayesian analysis of mtDNA data
produced concordant trees with considerable phylogenetic struc-
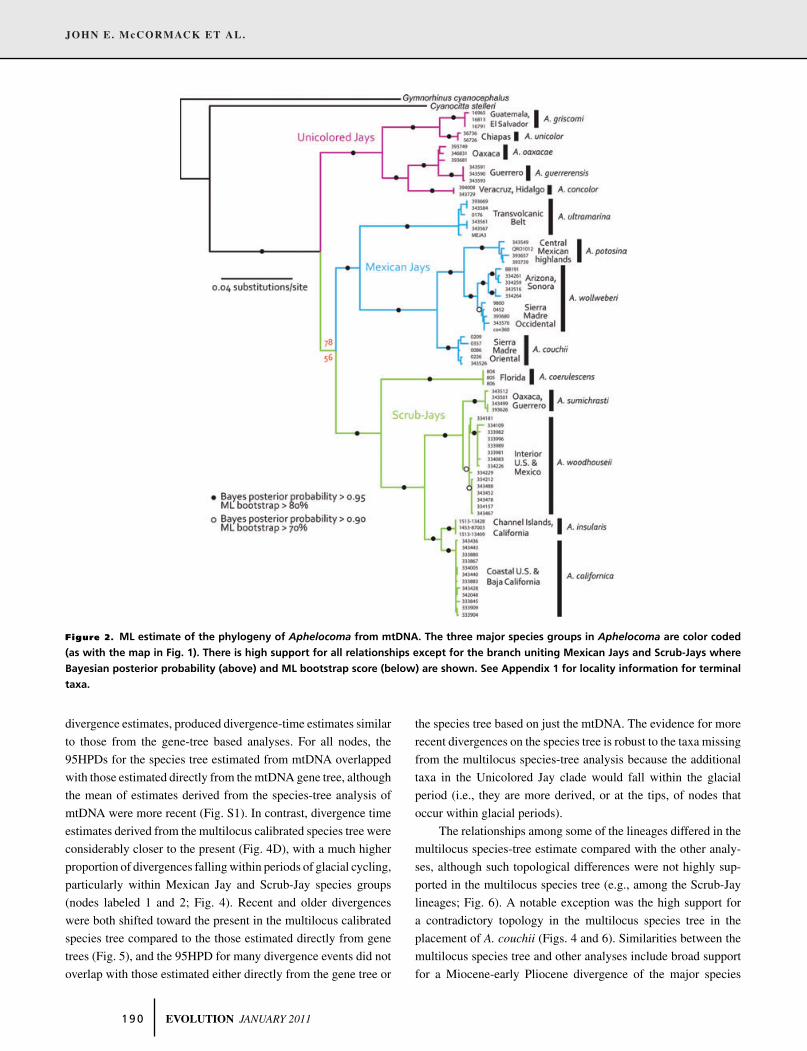
ture (Fig. 2). Uncorrected sequence divergence among the major
species groups (i.e., the Mexican Jays, Scrub-Jays, and Unicol-
ored Jays) ranged from 9.9% to 10.3%. The Mexican Jay lineage
from the Transvolcanic Belt, A. ultramarina, was also highly di-
vergent (9.0% divergence from other Mexican Jays), as was the
Florida Scrub-Jay, A. coerulescens (8.0% divergence from other
Scrub-Jays). Bootstrap support and posterior probabilities were
high for all branches except for the node uniting Mexican Jays
and Scrub-Jays (Fig. 2).
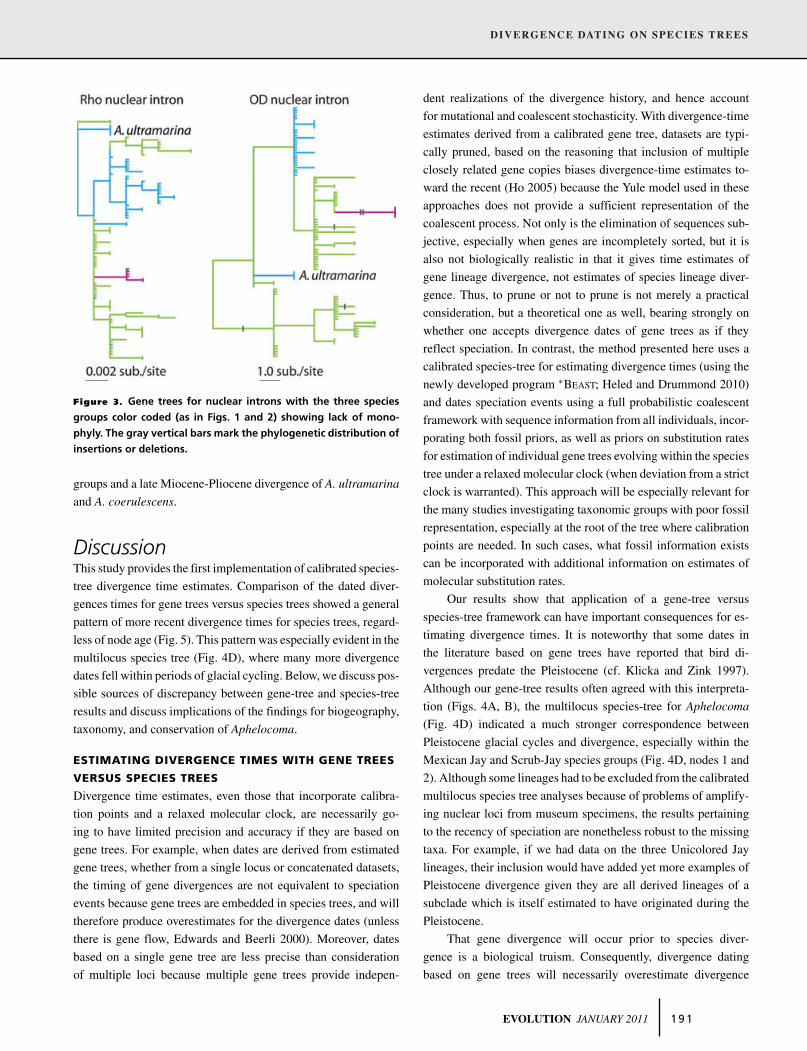
For the nuclear genes, best-fit models were HKY for OD
and HKY + I for Rho. ML and Bayesian analyses were largely
congruent in showing moderate levels of incomplete lineage sort-
ing. (Fig. 3). Lineages observed in the mtDNA phylogeny often
grouped together in the nuclear gene phylogenies, but others were
paraphyletic. Two major mtDNA clades that were also mono-
phyletic in both nuclear intron phylogenies were Unicolored Jays
and A. ultramarina.
PHYLOGENETIC DATING AND DIVERGENCE TIMES
High effective sample sizes were observed for all parameters in
all BEAST analyses (posterior ESS values >4000 for all four anal-
yses) and assessment of convergence statistics in Tracer and AWTY
indicated that all analyses had converged. Maximum clade cred-
ibility trees for the mtDNA and concatenated data (Figs. 4A, B)
were identical in topology to those produced by Bayesian and
ML analysis of the mtDNA tree. Divergence times for these two
calibrated gene-tree based approaches were similar and supported
initial Miocene diversification of the three major species groups
(i.e., the Mexican Jays, Scrub-Jays, and Unicolored Jays), with
divergence within these species groups occurring throughout the
Miocene, Pliocene, and early Pleistocene (Fig. 4 and S1). Al-
though the 95HPD for many nodes overlapped the Pleistocene,
relatively few divergence events dated to the period of intense
glacial cycles 0.7 Ma to present (Fig. 4).
Analysis of the mtDNA within the calibrated species-tree
approach (Fig. 4C), which used data from all individuals to inform
EVOLUTION JANUARY 2011 1 8 9
JOHN E. McCORMACK ET AL.
Figure 2. ML estimate of the phylogeny of Aphelocoma from mtDNA. The three major species groups in Aphelocoma are color coded
(as with the map in Fig. 1). There is high support for all relationships except for the branch uniting Mexican Jays and Scrub-Jays where
Bayesian posterior probability (above) and ML bootstrap score (below) are shown. See Appendix 1 for locality information for terminal
taxa.
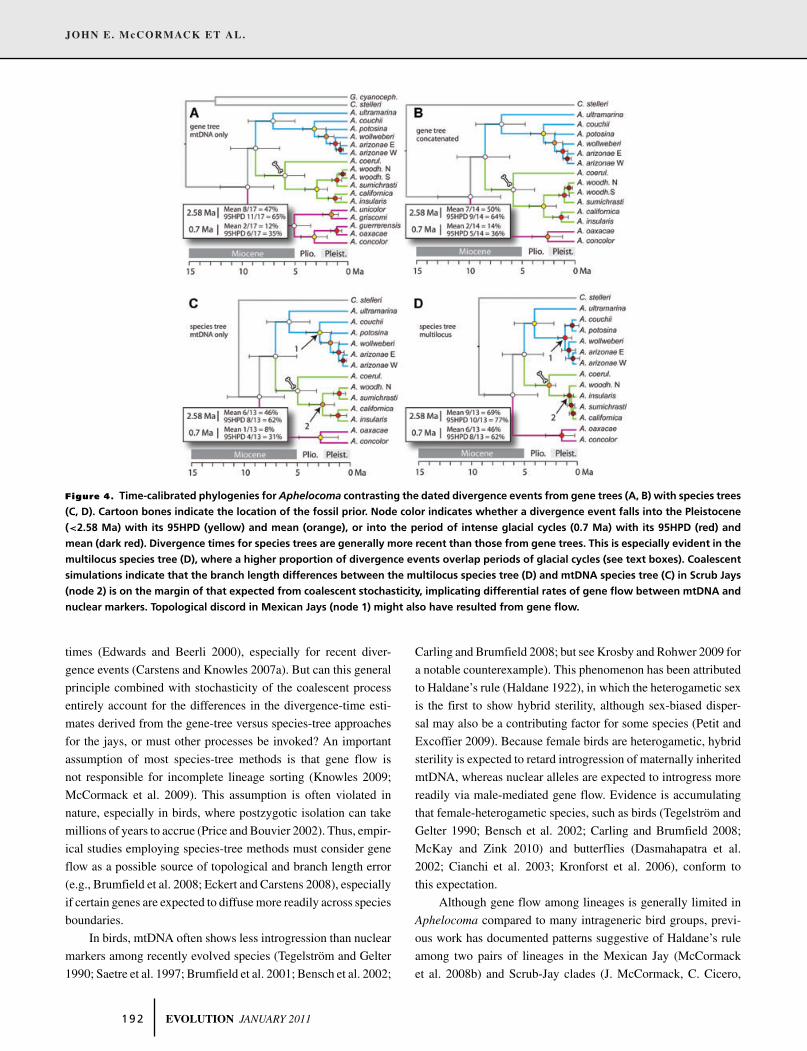
divergence estimates, produced divergence-time estimates similar
to those from the gene-tree based analyses. For all nodes, the
95HPDs for the species tree estimated from mtDNA overlapped
with those estimated directly from the mtDNA gene tree, although
the mean of estimates derived from the species-tree analysis of
mtDNA were more recent (Fig. S1). In contrast, divergence time
estimates derived from the multilocus calibrated species tree were
considerably closer to the present (Fig. 4D), with a much higher
proportion of divergences falling within periods of glacial cycling,
particularly within Mexican Jay and Scrub-Jay species groups
(nodes labeled 1 and 2; Fig. 4). Recent and older divergences
were both shifted toward the present in the multilocus calibrated
species tree compared to the those estimated directly from gene
trees (Fig. 5), and the 95HPD for many divergence events did not
overlap with those estimated either directly from the gene tree or
the species tree based on just the mtDNA. The evidence for more
recent divergences on the species tree is robust to the taxa missing
from the multilocus species-tree analysis because the additional
taxa in the Unicolored Jay clade would fall within the glacial
period (i.e., they are more derived, or at the tips, of nodes that
occur within glacial periods).
The relationships among some of the lineages differed in the
multilocus species-tree estimate compared with the other analy-
ses, although such topological differences were not highly sup-
ported in the multilocus species tree (e.g., among the Scrub-Jay
lineages; Fig. 6). A notable exception was the high support for
a contradictory topology in the multilocus species tree in the
placement of A. couchii (Figs. 4 and 6). Similarities between the
multilocus species tree and other analyses include broad support
for a Miocene-early Pliocene divergence of the major species
1 9 0 EVOLUTION JANUARY 2011
DIVERGENCE DATING ON SPECIES TREES
Figure 3. Gene trees for nuclear introns with the three species
groups color coded (as in Figs. 1 and 2) showing lack of mono-
phyly. The gray vertical bars mark the phylogenetic distribution of
insertions or deletions.
groups and a late Miocene-Pliocene divergence of A. ultramarina
and A. coerulescens.
DiscussionThis study provides the first implementation of calibrated species-
tree divergence time estimates. Comparison of the dated diver-
gences times for gene trees versus species trees showed a general
pattern of more recent divergence times for species trees, regard-
less of node age (Fig. 5). This pattern was especially evident in the
multilocus species tree (Fig. 4D), where many more divergence
dates fell within periods of glacial cycling. Below, we discuss pos-
sible sources of discrepancy between gene-tree and species-tree
results and discuss implications of the findings for biogeography,
taxonomy, and conservation of Aphelocoma.
ESTIMATING DIVERGENCE TIMES WITH GENE TREES
VERSUS SPECIES TREES
Divergence time estimates, even those that incorporate calibra-
tion points and a relaxed molecular clock, are necessarily go-
ing to have limited precision and accuracy if they are based on
gene trees. For example, when dates are derived from estimated
gene trees, whether from a single locus or concatenated datasets,
the timing of gene divergences are not equivalent to speciation
events because gene trees are embedded in species trees, and will
therefore produce overestimates for the divergence dates (unless
there is gene flow, Edwards and Beerli 2000). Moreover, dates
based on a single gene tree are less precise than consideration
of multiple loci because multiple gene trees provide indepen-
dent realizations of the divergence history, and hence account
for mutational and coalescent stochasticity. With divergence-time
estimates derived from a calibrated gene tree, datasets are typi-
cally pruned, based on the reasoning that inclusion of multiple
closely related gene copies biases divergence-time estimates to-
ward the recent (Ho 2005) because the Yule model used in these
approaches does not provide a sufficient representation of the
coalescent process. Not only is the elimination of sequences sub-
jective, especially when genes are incompletely sorted, but it is
also not biologically realistic in that it gives time estimates of
gene lineage divergence, not estimates of species lineage diver-
gence. Thus, to prune or not to prune is not merely a practical
consideration, but a theoretical one as well, bearing strongly on
whether one accepts divergence dates of gene trees as if they
reflect speciation. In contrast, the method presented here uses a
calibrated species-tree for estimating divergence times (using the
newly developed program ∗BEAST; Heled and Drummond 2010)
and dates speciation events using a full probabilistic coalescent
framework with sequence information from all individuals, incor-
porating both fossil priors, as well as priors on substitution rates
for estimation of individual gene trees evolving within the species
tree under a relaxed molecular clock (when deviation from a strict
clock is warranted). This approach will be especially relevant for
the many studies investigating taxonomic groups with poor fossil
representation, especially at the root of the tree where calibration
points are needed. In such cases, what fossil information exists
can be incorporated with additional information on estimates of
molecular substitution rates.
Our results show that application of a gene-tree versus
species-tree framework can have important consequences for es-
timating divergence times. It is noteworthy that some dates in
the literature based on gene trees have reported that bird di-
vergences predate the Pleistocene (cf. Klicka and Zink 1997).
Although our gene-tree results often agreed with this interpreta-
tion (Figs. 4A, B), the multilocus species-tree for Aphelocoma
(Fig. 4D) indicated a much stronger correspondence between
Pleistocene glacial cycles and divergence, especially within the
Mexican Jay and Scrub-Jay species groups (Fig. 4D, nodes 1 and
2). Although some lineages had to be excluded from the calibrated
multilocus species tree analyses because of problems of amplify-
ing nuclear loci from museum specimens, the results pertaining
to the recency of speciation are nonetheless robust to the missing
taxa. For example, if we had data on the three Unicolored Jay
lineages, their inclusion would have added yet more examples of
Pleistocene divergence given they are all derived lineages of a
subclade which is itself estimated to have originated during the
Pleistocene.
That gene divergence will occur prior to species diver-
gence is a biological truism. Consequently, divergence dating
based on gene trees will necessarily overestimate divergence
EVOLUTION JANUARY 2011 1 9 1
JOHN E. McCORMACK ET AL.
Figure 4. Time-calibrated phylogenies for Aphelocoma contrasting the dated divergence events from gene trees (A, B) with species trees
(C, D). Cartoon bones indicate the location of the fossil prior. Node color indicates whether a divergence event falls into the Pleistocene
(<2.58 Ma) with its 95HPD (yellow) and mean (orange), or into the period of intense glacial cycles (0.7 Ma) with its 95HPD (red) and
mean (dark red). Divergence times for species trees are generally more recent than those from gene trees. This is especially evident in the
multilocus species tree (D), where a higher proportion of divergence events overlap periods of glacial cycles (see text boxes). Coalescent
simulations indicate that the branch length differences between the multilocus species tree (D) and mtDNA species tree (C) in Scrub Jays
(node 2) is on the margin of that expected from coalescent stochasticity, implicating differential rates of gene flow between mtDNA and
nuclear markers. Topological discord in Mexican Jays (node 1) might also have resulted from gene flow.
times (Edwards and Beerli 2000), especially for recent diver-
gence events (Carstens and Knowles 2007a). But can this general
principle combined with stochasticity of the coalescent process
entirely account for the differences in the divergence-time esti-
mates derived from the gene-tree versus species-tree approaches
for the jays, or must other processes be invoked? An important
assumption of most species-tree methods is that gene flow is
not responsible for incomplete lineage sorting (Knowles 2009;
McCormack et al. 2009). This assumption is often violated in
nature, especially in birds, where postzygotic isolation can take
millions of years to accrue (Price and Bouvier 2002). Thus, empir-
ical studies employing species-tree methods must consider gene
flow as a possible source of topological and branch length error
(e.g., Brumfield et al. 2008; Eckert and Carstens 2008), especially
if certain genes are expected to diffuse more readily across species
boundaries.
In birds, mtDNA often shows less introgression than nuclear
markers among recently evolved species (Tegelstrom and Gelter
1990; Saetre et al. 1997; Brumfield et al. 2001; Bensch et al. 2002;
Carling and Brumfield 2008; but see Krosby and Rohwer 2009 for
a notable counterexample). This phenomenon has been attributed
to Haldane’s rule (Haldane 1922), in which the heterogametic sex
is the first to show hybrid sterility, although sex-biased disper-
sal may also be a contributing factor for some species (Petit and
Excoffier 2009). Because female birds are heterogametic, hybrid
sterility is expected to retard introgression of maternally inherited
mtDNA, whereas nuclear alleles are expected to introgress more
readily via male-mediated gene flow. Evidence is accumulating
that female-heterogametic species, such as birds (Tegelstrom and
Gelter 1990; Bensch et al. 2002; Carling and Brumfield 2008;
McKay and Zink 2010) and butterflies (Dasmahapatra et al.
2002; Cianchi et al. 2003; Kronforst et al. 2006), conform to
this expectation.
Although gene flow among lineages is generally limited in
Aphelocoma compared to many intrageneric bird groups, previ-
ous work has documented patterns suggestive of Haldane’s rule
among two pairs of lineages in the Mexican Jay (McCormack
et al. 2008b) and Scrub-Jay clades (J. McCormack, C. Cicero,
1 9 2 EVOLUTION JANUARY 2011
DIVERGENCE DATING ON SPECIES TREES
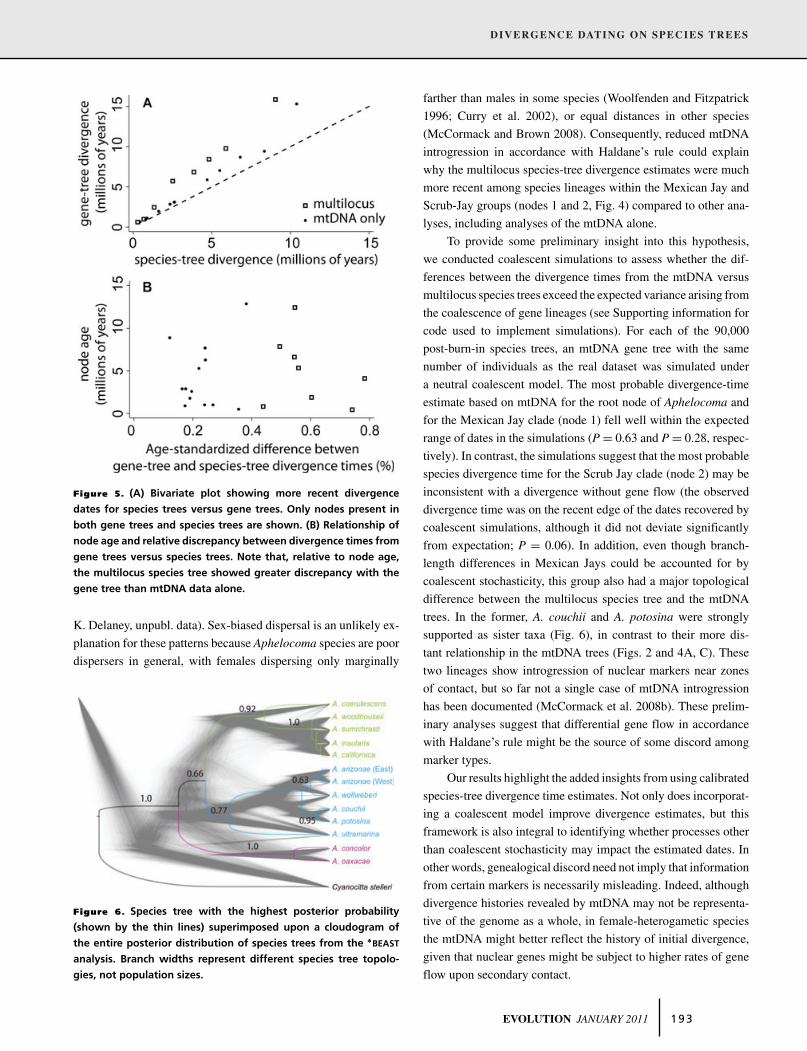
Figure 5. (A) Bivariate plot showing more recent divergence
dates for species trees versus gene trees. Only nodes present in
both gene trees and species trees are shown. (B) Relationship of
node age and relative discrepancy between divergence times from
gene trees versus species trees. Note that, relative to node age,
the multilocus species tree showed greater discrepancy with the
gene tree than mtDNA data alone.
K. Delaney, unpubl. data). Sex-biased dispersal is an unlikely ex-
planation for these patterns because Aphelocoma species are poor
dispersers in general, with females dispersing only marginally
Figure 6. Species tree with the highest posterior probability
(shown by the thin lines) superimposed upon a cloudogram of
the entire posterior distribution of species trees from the ∗BEAST
analysis. Branch widths represent different species tree topolo-
gies, not population sizes.
farther than males in some species (Woolfenden and Fitzpatrick
1996; Curry et al. 2002), or equal distances in other species
(McCormack and Brown 2008). Consequently, reduced mtDNA
introgression in accordance with Haldane’s rule could explain
why the multilocus species-tree divergence estimates were much
more recent among species lineages within the Mexican Jay and
Scrub-Jay groups (nodes 1 and 2, Fig. 4) compared to other ana-
lyses, including analyses of the mtDNA alone.
To provide some preliminary insight into this hypothesis,
we conducted coalescent simulations to assess whether the dif-
ferences between the divergence times from the mtDNA versus
multilocus species trees exceed the expected variance arising from
the coalescence of gene lineages (see Supporting information for
code used to implement simulations). For each of the 90,000
post-burn-in species trees, an mtDNA gene tree with the same
number of individuals as the real dataset was simulated under
a neutral coalescent model. The most probable divergence-time
estimate based on mtDNA for the root node of Aphelocoma and
for the Mexican Jay clade (node 1) fell well within the expected
range of dates in the simulations (P = 0.63 and P = 0.28, respec-
tively). In contrast, the simulations suggest that the most probable
species divergence time for the Scrub Jay clade (node 2) may be
inconsistent with a divergence without gene flow (the observed
divergence time was on the recent edge of the dates recovered by
coalescent simulations, although it did not deviate significantly
from expectation; P = 0.06). In addition, even though branch-
length differences in Mexican Jays could be accounted for by
coalescent stochasticity, this group also had a major topological
difference between the multilocus species tree and the mtDNA
trees. In the former, A. couchii and A. potosina were strongly
supported as sister taxa (Fig. 6), in contrast to their more dis-
tant relationship in the mtDNA trees (Figs. 2 and 4A, C). These
two lineages show introgression of nuclear markers near zones
of contact, but so far not a single case of mtDNA introgression
has been documented (McCormack et al. 2008b). These prelim-
inary analyses suggest that differential gene flow in accordance
with Haldane’s rule might be the source of some discord among
marker types.
Our results highlight the added insights from using calibrated
species-tree divergence time estimates. Not only does incorporat-
ing a coalescent model improve divergence estimates, but this
framework is also integral to identifying whether processes other
than coalescent stochasticity may impact the estimated dates. In
other words, genealogical discord need not imply that information
from certain markers is necessarily misleading. Indeed, although
divergence histories revealed by mtDNA may not be representa-
tive of the genome as a whole, in female-heterogametic species
the mtDNA might better reflect the history of initial divergence,
given that nuclear genes might be subject to higher rates of gene
flow upon secondary contact.
EVOLUTION JANUARY 2011 1 9 3
JOHN E. McCORMACK ET AL.
BIOGEOGRAPHIC EVENTS IMPORTANT TO
SPECIATION IN APHELOCOMA
Molecular and fossil dating of divergence times indicate that the
diversification of Aphelocoma into three major species groups
began in the middle to late Miocene- Pliocene. Although the con-
fidence intervals are relatively wide for these older divergences,
these dates are generally consistent, irrespective of the method
of analysis. It is worth reiterating that until quite recently these
three species groups (i.e., the Mexican Jays, Scrub-Jays, and Uni-
colored Jays) were considered the only species in Aphelocoma.
The relatively ancient origin of these species groups compared to
other extant bird species is notable and suggests a considerable
amount of cryptic diversity in the genus.
The Miocene was a time of major tectonic activity and moun-
tain uplift (Van Devender 2002). Final uplift of the Sierra Madre
ranges at 15 Ma, and the formation and gradual uplift of the
Transvolcanic Belt from 23 to 2.5 Ma (Van Devender 2002) cre-
ated the high-elevation regions now occupied by Mexican Jays and
Unicolored Jays, which speciated roughly 3–8.5 Ma (95HPD on
the multilocus species tree; Fig. 4D). Final uplift of the Transvol-
canic Belt between 4 and 6 Ma was also concurrent with the
origin, roughly 2–6 Ma, of the highly divergent Mexican Jay
species lineage, A. ultramarina, that inhabits that mountain range
(Fig. 4D). Detailed taxonomic recommendations resulting from
this study will be made elsewhere, but we note here the strong phy-
logenetic support for elevating A. ultramarina to species status,
including monophyly based on analyses of both mtDNA (Fig. 2)
and nuclear markers (Fig. 3), its long and independent evolution-
ary history supported by gene trees and species trees (Fig. 6), and
species-level phenotypic differences described previously (Pitelka
1951; McCormack et al. 2008b). The Miocene was also a time
of climatic and vegetative change worldwide, especially in North
America (Zachos et al. 2001; Van Devender 2002). Increasing
aridity in the middle Miocene (15–8 Ma; Axelrod 1979) led to the
formation of a distinct desert scrub vegetation now occupied by
Scrub-Jays. As such, it is not just the coincidence of these geo-
logic and climatic events with estimated dates of divergence that
informs our biogeographic hypothesis for the evolution of Aph-
elocoma, but also the fact that the three ecologically divergent
species groups occupy elevations and habitats that apparently did
not exist prior to their diversification in the Miocene.
As for the role of glacial cycles, because nuclear gene flow
may have contributed to the discrepancy in the calibrated species-
tree divergence estimates from the mtDNA versus the multilocus
data for some of the taxa, then the glacial cycles (or at least
the onset of intense glacial cycles in the last 0.7 Ma; Webb and
Bartlein 1992) may not have played as predominant a role in
triggering initial divergence as initially suggested (i.e., gene flow
would make some speciation events appear more recent than they
actually are). Detailed studies of contact zones will be needed to
establish the timing of potential gene flow, in concert with niche
reconstructions of habitat at glacial maxima (e.g., Peterson et al.
2004), to evaluate the possibility that the glacial cycles may have
hindered divergence among some Mexican Jay and Scrub-Jay
species lineages by promoting gene flow through habitat shifts
that brought these incipient species into contact.
IMPLICATIONS FOR COMPARATIVE STUDIES AND
CONSERVATION
With complete taxon sampling for mtDNA trees and the most
sequence data to date, our study uncovered new diversity and
relationships in Aphelocoma with implications for comparative
studies and conservation. Aphelocoma has been a classic system
for the study of the evolution of cooperative breeding (Peterson
and Burt 1992; Brown and Li 1995). The placement of the Florida
Scrub-Jay (A. coerulescens) as the sister taxon to all other Scrub-
Jays has long been suspected based on biogeographic and fossil
evidence (Pitelka 1951) and allozymes (Peterson 1992), yet our
study is the first to confirm this relationship with DNA sequence
data. This is important because this phylogenetic placement sup-
ports the hypothesis that cooperative breeding is an ancestral trait
in A. coerulescens, as opposed to a secondary gain, as suggested by
studies that nested this taxon within Scrub-Jays (Rice et al. 2003).
Additionally, the placement and strong support for A. sumichrasti
as a monophyletic and divergent lineage of Scrub-Jays in the
mtDNA tree (Fig. 2), suggests that this cooperatively breeding
lineage (Burt and Peterson 1993) may have reacquired some level
of cooperation from noncooperative ancestors. These hypotheses
should be tested with a more thorough reconstruction of cooper-
ative breeding traits on the Aphelocoma phylogeny.
This study also provides the first comprehensive assessment
of diversity within the endangered and range-restricted Unicol-
ored Jay complex, including samples from south of the Isthmus of
Tehuantepec which have not been previously available for DNA
sequence analysis. Peterson (1992) described fixed allozyme dif-
ferences between eastern and western populations north of the
Isthmus. Results from mtDNA indicate that the isolated popu-
lations of this species are strongly differentiated, with mtDNA
sequence divergence ranging from 1.7% (A. oaxacae–A. guer-
rerensis) north of the Isthmus to 6.9% across the Isthmus (A. con-
color– A. unicolor). The International Union for Conservation of
Nature (IUCN) considers the Unicolored Jay a species of least
concern (BirdLife International 2009) because of its wide geo-
graphic range and large population size. The Mexican govern-
ment, recognizing differences among the isolated groups, consid-
ers the species threatened (Wells 2007). Our study supports the
latter view. The cloud forest isolates appear to have a long and
independent evolutionary history that merit individual protection.
Greater recognition for these lineages will be especially critical
for preserving geographically restricted Mexican endemics such
1 9 4 EVOLUTION JANUARY 2011
DIVERGENCE DATING ON SPECIES TREES
as A. guerrerensis and A. concolor where habitat loss is feared to
be driving rapid declines.
ACKNOWLEDGMENTSWe thank K. Harada and C. Silliman for laboratory assistance, J. Brownfor guidance with BEAST 1.4.8, and A. Cuervo for comments on themanuscript. J. Johnson provided primers for nuclear introns, and T. Leeand T. Duda kindly granted time and space for cloning. Samples werefacilitated by S. Schoech and M. Rensel, J. Hafner (Moore Laboratoryof Zoology at Occidental College), D. Willard (Field Museum of Natu-ral History), M. Robbins (University of Kansas), B. Bowen, A. Navarro(UNAM), R. Benford, and C. Collins. G. Castaneda, T. Hanks, G. Levan-doski, I. Moran, E. Penaloza, V. Rodrıguez, and R. Tinajero helped collectfield samples. JH was supported by Marsden grant number UOA0502.This work was generously funded by an award to JEM from the Frank M.Chapman Memorial Fund at the American Museum of Natural Historyand a National Science Foundation grant (DEB-0918218) to LLK.
LITERATURE CITEDAmerican Ornithologists’ Union. 1998. Check-list of North American birds.
American Ornithologists’ Union, Washington, D.C.Arbogast, B. S., S. V. Edwards, J. Wakeley, P. Beerli, and J. B. Slowinski.
2002. Estimating divergence times from molecular data on phylogeneticand population genetic timescales. Ann. Rev. Ecol. Syst. 33:707–740.
Avise, J. C., and D. Walker. 1998. Pleistocene phylogeographic effects onavian populations and the speciation process. Proc. R. Soc. Lond. B.265:457–463.
Axelrod, D. 1979. Age and origin of Sonoran desert vegetation. Occas. Pap.Calif. Acad. Sci. 132:1–74.
Badgley, C. 2010. Tectonics, topography, and mammalian diversity. Ecogra-phy 33:220–231.
Bensch, S., A. J. Helbig, M. Salomon, and I. Seibold. 2002. Amplified frag-ment length polymorphism analysis identifies hybrids between two sub-species of warblers. Mol. Ecol. 11:473–481.
Bhagabati, N. K., J. L. Brown, and B. S. Bowen. 2004. Geographic varia-tion in Mexican jays (Aphelocoma ultramarina): local differentiation,polyphyly or hybridization? Mol. Ecol. 13:2721–2734.
BirdLife International. 2009. Species factsheet: Aphelocoma unicolor. Avail-able at http://www.birdlife.org. Accessed June 8, 2009.
Bonaccorso, E., and A. T. Peterson. 2007. A multilocus phylogeny of the NewWorld jay genera. Mol. Phylo. Evol. 42:467–476.
Bouckaert, R. R. 2010. DensiTree: making sense of sets of phylogenetic trees.Bioinformatics 26:1372–1373.
Brodkorb, P. 1972. Neogene fossil jays from the Great Plains. Condor 74:347–349.
Brown, J. L., and S.-H. Li. 1995. Phylogeny of social behavior in Aphelocoma
jays: a role for hybridization? Auk 112:464–472.Brown, J. W., J. S. Rest, J. Garcıa-Moreno, M. D. Sorenson, and D. P. Mindell.
2008. Strong mitochondrial DNA support for a Cretaceous origin ofmodern avian lineages. BMC Biology 6:6.
Brown, J. W., and M. van Tuinen. Evolving perceptions on the antiquity ofthe modern avian tree. in G. Dyke and G. Kaiser, eds. The evolutionaryhistory of modern birds. Univ. of California Press, Berkeley, California.In press.
Brumfield, R. T., R. W. Jernigan, D. B. McDonald, and M. J. Braun. 2001.Evolutionary implications of divergent clines in an avian (Manacus:Aves) hybrid zone. Evolution 55:2070–2087.
Brumfield, R. T., L. Liu, D. E. Lum, and S. V. Edwards. 2008. Comparisonof species tree methods for reconstructing the phylogeny of bearded
manakins (Aves: Pipridae, Manacus) from multilocus sequence data.Syst. Biol. 57:719–731.
Burt, D. B., and A. T. Peterson. 1993. Biology of the cooperatively breed-ing Scrub Jays (Aphelocoma coerulescens) of Oaxaca, Mexico. Auk110:207–214.
Carling, M. D., and R. T. Brumfield. 2008. Haldane’s rule in an avian system:using cline theory and divergence population genetics to test for dif-ferential introgression of mitochondrial, autosomal, and sex-linked lociacross the Passerina bunting hybrid zone. Evolution 62:2600–2615.
Carstens, B. C., and L. L. Knowles. 2007a. Estimating species phylogeny fromgene-tree probabilities despite incomplete lineage sorting: an examplefrom Melanoplus grasshoppers. Syst. Biol. 56:400–411.
———. 2007b. Shifting distributions and speciation: species divergence dur-ing rapid climate change. Mol. Ecol. 6:619–627.
Cianchi, R., A. Ungaro, M. Marini, and L. Bullini. 2003. Differential pat-terns of hybridization and introgression between the swallowtails Papilo
machaon and P. hospiton from Sardinia and Corsica islands (Lepi-doptera, Papilionidae). Mol. Ecol. 12:1461–1471.
Cicero, C., and N. K. Johnson. 2006. The tempo of avian diversification: reply.Evolution 60:413–414.
Cranston, K., B. Hurwitz, D. Ware, L. Stein, and R. Wing. 2009. Species treesfrom highly incongruent gene trees in rice. Syst. Biol. 58:489–500.
Curry, R. L., A. T. Peterson, and T. A. Langen. 2002. Western Scrub-Jay(Aphelocoma californica). in A. Poole, ed. The Birds of North Americaonline. Cornell Laboratory of Ornithology, Ithaca, New York. Availableat http://bna.birds.cornell.edu/bna/species/712.
Dasmahapatra, K. K., M. J. Blum, A. Aiello, S. Hackwell, N. Davies, E.Bermingham, and J. Mallet. 2002. Inferences from a rapidly movinghybrid zone. Evolution 56:741–753.
Degnan, J. H., and N. A. Rosenberg. 2009. Gene tree discordance, phylo-genetic inference, and the multispecies coalescent. Trends Ecol. Evol.24:332–340.
Delaney, K. S., S. Zafar, and R. K. Wayne. 2008. Genetic divergence and dif-ferentiation within Western Scrub-Jays (Aphelocoma californica). Auk125:839–849.
Dmitriev, D. A., and R. A. Rakitov. 2008. Decoding of superimposed tracesproduced by direct sequencing of heterozygous indels. PLoS Comput.Biol. 4:e1000113.
Drummond, A. J., S. Y. W. Ho, M. J. Phillips, and A. Rambaut. 2006. Relaxedphylogenetics and dating with confidence. PLoS Biol. 4:e88.
Drummond, A. J., and A. Rambaut. 2006. BEAST v1.4, Available athttp://beast.bio.ed.ac.uk/.
———. 2007. BEAST: Bayesian evolutionary analysis by sampling trees.BMC Evol. Biol. 7:214.
Eckert, A. J., and B. C. Carstens. 2008. Does gene flow destroy phylogeneticsignal? The performance of three methods for estimating species phylo-genies in the presence of gene flow. Mol. Phylogenet. Evol. 49:832–842.
Edwards, S. V., and P. Beerli. 2000. Perspective: gene divergence, populationdivergence, and the variance in coalescence time in phylogeographicstudies. Evolution 54:1839–1854.
Edwards, S. V., L. Liu, and D. K. Pearl. 2007. High-resolution species treeswithout concatentation. Proc. Natl. Acad. Sci. USA 104:5936–5941.
Emslie, S. 2007. Fossil passerines from the early Pliocene of Kansas and theevolution of Songbirds in North America. Auk 124:85–95.
Emslie, S. D. 1996. A fossil Scrub-Jay supports a recent systematic decision.Condor 98:675–680.
Grauer, D., and W. Martin. 2004. Reading the entrails of chickens: moleculartimescales of evolution and the illusion of precision. Trends Genetics20:80–86.
Haldane, J. B. S. 1922. Sex ratio and unisex sterility in hybrid animals. J.Genetics 12:101–109.
EVOLUTION JANUARY 2011 1 9 5
JOHN E. McCORMACK ET AL.
Harrigan, R. J., M. E. Mazza, and M. D. Sorenson. 2008. Computation versuscloning: evaluation of two methods for haplotype determination. Mol.Ecol. Res. 8:1239–1248.
Heled, J., and A. Drummond. 2010. Bayesian inference of species trees frommultilocus data. Mol. Biol. Evol. 27:570–580.
Hewitt, G. 1996. Some genetic consequences of ice ages, and their role indivergence and speciation. Biol. J. Linn. Soc. 58:247–276.
Hewitt, G. M. 2004. Genetic consequences of climatic oscillations in theQuaternary. Phil. Trans. R. Soc. Lond. B 359:183–195.
Hey, J., and R. Nielsen. 2004. Multilocus methods for estimating populationsizes, migration rates and divergence time, With applications to thedivergence of Drosophila pseudoobscura and D. persimilis. Genetics167:747–760.
Ho, S. Y. M. 2007. Calibrating molecular estimates of substitution rates anddivergence times in birds. J. Avian Biol. 38:409–414.
Ho, S. Y. W. 2005. Time dependency of molecular rate estimates and sys-tematic overestimation of recent divergence times. Mol. Biol. Evol.22:1561–1568.
Jaeger, J. R., B. R. Riddle, and D. F. Bradford. 2005. Cryptic Neogene vicari-ance and Quaternary dispersal of the red-spotted toad (Bufo punctatus):insights on the evolution of North American warm desert biotas. Mol.Ecol. 14:3033–3048.
Kimball, R. T., E. L. Braun, F. K. Barker, R. C. K. Bowie, M. J. Braun, J. L.Chojnowskia, S. J. Hackett, K.-L. Han, J. Harshman, V. Heimer-Torres,et al. 2009. A well-tested set of primers to amplify regions spread acrossthe avian genome. Mol. Phylogenet. Evol. 50:654–660.
Kingman, J. F. C. 1982. The coalescent. Stoch. Process. Appl. 13:235–248.Klicka, J., and R. M. Zink. 1997. The importance of recent ice ages in speci-
ation: a failed paradigm. Science 277:1666–1669.———. 1999. Pleistocene effects on North American songbird evolution.
Proc. R. Soc. Lond. B. 266:695–700.Knowles, L. 2009. Species tree estimation: methods of phylogenetic analysis
when there is incongruence across genes. Syst. Biol. 58:463–467.Knowles, L., B. Carstens, and M. Keat. 2007. Coupling genetic and ecological-
niche models to examine how past population distributions contribute todivergence. Curr. Biol. 17:940–946.
Knowles, L. L. 2000. Tests of Pleistocene speciation in montane grasshoppers(genus Melanoplus) from the sky islands of western North America.Evolution 54:1337–1348.
———. 2001. Did the Pleistocene glaciations promote divergence? Tests ofexplicit refugial models in montane grasshoppers. Mol. Ecol. 10:691–701.
———. 2010. Sampling strategies for species-tree estimation. Pp. 163–173 inL. L. Knowles and L. S. Kubatko, eds. Estimating species trees: practicaland theoretical aspects. Wiley-Blackwell, Oxford, U.K.
Knowles, L. L., and B. C. Carstens. 2007. Estimating a geographically explicitmodel of population divergence. Evolution 61:477–493.
Kronforst, M. R., L. G. Young, L. M. Blume, and L. E. Gilbert. 2006. Multi-locus analyses of admixture and introgression among hybridizing Heli-conius butterflies. Evolution 60:1254–1268.
Krosby, M., and S. Rohwer. 2009. A 2000 km genetic wake yields evidencefor northern glacial refugia and hybrid zone movement in a pair ofsongbirds. Proc. R. Soc. Lond. B. 276:615–621.
Kubatko, L. S., and J. H. Degnan. 2007. Inconsistency of phylogenetic esti-mates from concatenated data under coalescence. Syst. Biol. 56:17–24.
Lessa, E. P., J. A. Cook, and J. L. Patton. 2003. Genetic footprints of demo-graphic expansion in North America, but not Amazonia, during the LateQuaternary. Proc. Natl. Acad. Sci. USA 100:10331–10334.
Lovette, I. J., and E. Bermingham. 1999. Explosive speciation in the NewWorld Dendroica warblers. Proc. R. Soc. Lond. B. 266:1629–1636.
Maddison, W. P. 1997. Gene trees in species trees. Syst. Biol. 46:523–536.
Maddison, W. P., and L. L. Knowles. 2006. Inferring phylogeny despite in-complete lineage sorting. Syst. Biol. 55:21–30.
McCormack, J., and J. Brown. 2008. Mexican Jay (Aphelocoma ul-
tramarina). in A. Poole, ed. The birds of North America On-line. Cornell Laboratory of Ornithology, Ithaca, NY. Available athttp://bna.birds.cornell.edu/bna/species/118.
McCormack, J., and T. Smith. 2008. Niche expansion leads to small-scaleadaptive divergence along an elevation gradient in a medium-sizedpasserine bird. Proc. R. Soc. Lond. B. 275:2155–2164.
McCormack, J. E., B. S. Bowen, and T. B. Smith. 2008a. Integrating paleoe-cology and genetics of bird populations in two sky island archipelagos.BMC Biol. 6:28.
McCormack, J. E., L. L. Knowles, and H. Huang. 2009. Maximum-likelihoodestimates of species trees: how accuracy of phylogenetic inference de-pends upon the divergence history and sampling design. Syst. Biol.58:501–508.
McCormack, J. E., A. T. Peterson, E. Bonaccorso, and T. B. Smith. 2008b. Spe-ciation in the highlands of Mexico: genetic and phenotypic divergence inthe Mexican jay (Aphelocoma ultramarina). Mol. Ecol. 17:2505–2521.
McCormack, J. E., A. J. Zellmer, and L. L. Knowles. 2010. Does niche diver-gence accompany allopatric divergence in Aphelocoma jays as predictedunder ecological speciation? Insights from tests with niche models. Evo-lution 64:1231–1244.
McKay, B., and R. Zink. 2010. The causes of mitochondrial gene tree para-phyly in birds. Mol. Phylo. Evol. 54:647–650.
Milne, I., F. Wright, G. Rowe, D. Marshall, D. Husmeier, and G. McGuire.2004. TOPALi: software for automatic identification of recombinantsequences within DNA multiple alignments. Bioinformatics 20:1806–1807.
Morgan, G. 2005. The Great American Biotic Interchange in Florida. Bull.Fla. Mus. Nat. Hist. 45:271–311.
Muster, C., W. Maddison, S. Uhlmann, T. Berendonk, and A. Vogler. 2009.Artic-alpine distributions—metapopulations on a continental scale? Am.Nat. 173:313–326.
Nylander, J. A. A. 2004. MrModeltest v2. Program distributed by the author,Evolutionary Biology Centre, Uppsala University, Sweden.
Nylander, J. A. A., J. C. Wilgenbusch, D. L. Warren, and D. L. Swofford.2008. AWTY (are we there yet?): a system for graphical exploration ofMCMC convergence in Bayesian phylogenetic inference. Bioinformat-ics 24:581–583.
Peterson, A., and R. D. Holt. 2003. Niche differentiation in Mexican birds: us-ing point occurrences to detect ecological innovation. Ecol. Lett. 6:774–782.
Peterson, A. T. 1991a. Geographic variation in the ontogeny of beak colorationof gray-breasted jays Aphelocoma ultramarina. Condor 93:448–452.
———. 1991b. New distributional information on the Aphelocoma jays. Bull.Br. Ornithol. Club 111:28–33.
———. 1992. Phylogeny and rates of molecular evolution in the Aphelocoma
jays (Corvidae). Auk 109:133–147.Peterson, A. T., and D. B. Burt. 1992. Phylogenetic history of social evo-
lution and habitat use in the Aphelocoma jays. Anim. Behav. 44:859–866.
Peterson, A. T., E. Martinez-Meyer, and C. Gonzalez-Salazar. 2004. Recon-structing the Pleistocene geography of the Aphelocoma jays (Corvidae).Divers Distrib. 10:237–246.
Peterson, A. T., and N. Vargas-Barajas. 1993. Ecological diversity in scrubjays, Aphelocoma coerulescens. Pp. 309–317 in T. P. Ramamoorthy, A.Lot, R. Bye and J. Fa, eds. The biological diversity of Mexico: originsand distribution. Oxford Univ. Press, Oxford, U.K.
Petit, R., and L. Excoffier. 2009. Gene flow and species delimitation. TrendsEcol. Evol. 27:386–393.
1 9 6 EVOLUTION JANUARY 2011
DIVERGENCE DATING ON SPECIES TREES
Pitelka, F. A. 1951. Speciation and ecological distribution in American jaysof the genus Aphelocoma. Univ. of California Press, Berkeley and LosAngeles, California.
Price, T., and M. Bouvier. 2002. The evolution of F1 postzygotic incompati-bilities in birds. Evolution 56:2083–2089.
Rice, N. H., E. Martinez-Meyer, and A. T. Peterson. 2003. Ecological nichedifferentiation in the Aphelocoma jays: a phylogenetic perspective. Biol.J. Linn. Soc. 80:369–383.
Riddle, B. R. 1995. Molecular biogeography in the pocket mice (Perognathus
and Chaetodipus) and grasshopper mice (Onychomys): the late Cenozoicdevelopment of a North American aridlands rodent guild. J. Mammal.76:283–301.
———. 1996. The molecular phylogenetic bridge between deep and shallowhistory in continental biotas. Trends Ecol. Evol. 11:207–211.
Ronquist, F., and J. P. Huelsenbeck. 2003. MrBayes 3: Bayesian phlogeneticinference under mixed models. Bioinformatics 19:1572–1574.
Saetre, G. P., T. Moum, S. Bures, M. Kral, M. Adamjan, and J. Moreno. 1997.A sexually selected character displacement in flycatchers reinforcespremating isolation. Nature 387:589–592.
Sanderson, M. 2003. r8s: inferring absolute rates of molecular evolution anddivergence times in the absence of a molecular clock. Bioinformatics19:301–302.
Smith, C. I., and B. D. Farrell. 2005. Range expansions in the flightlesslonghorn cactus beetles, Moneilema gigas and Moneilema armatum, inresponse to Pleistocene climate changes. Mol. Ecol. 14:1025–1044.
Stephens, M., N. Smith, and P. Donnelly. 2001. A new statistical methodfor haplotype reconstruction from population data. Am. J. Hum. Genet.68:978–989.
Subramanian, S., D. R. Denver, C. D. Millar, T. Heupink, A. Aschrafi, S.D. Emslie, C. Baroni, and D. M. Lambert. 2009. High mitogenomicevolutionary rates and time dependency. Trends Genetics 25:482–486.
Swofford, D. L. 2000. PAUP∗. phylogenetic analysis using parsimony(∗and other methods). Ver 4.0b. Sinauer Associates, Sunderland, Mas-sachusetts.
Tegelstrom, H., and H. P. Gelter. 1990. Haldane’s rule and sex biased geneflow between two hybridizing flycatcher species (Ficedula albicollis
and F. hypoleuca, Aves: Muscicapidae). Evolution 44:2012–2021.
Thorne, J. L., and H. Kishino. 2002. Divergence time and evolutionary rateestimation with multilocus data. Syst. Biol. 51:689–702.
Van Devender, T. 2002. The Sonoran desert tortoise. Univ. of Arizona Pressand the Arizona-Sonora Desert Museum, Tucson, Arizona.
Watson, D. M. 2005. Diagnosable versus distinct: evaluating species limits inbirds. BioScience 55:60–68.
Webb, I. T., and P. Bartlein. 1992. Global changes during the last 3 millionyears: climatic controls and biotic responses. Annu. Rev. Ecol. Syst.23:141–173.
Weir, J., D. Schluter, and E. Bermingham. 2010. The Great American BioticInterchange in birds. Proc. Natl. Acad. Sci. USA 106:21737–21742.
Weir, J. T., and D. Schluter. 2004. Ice sheets promote speciation in borealbirds. Proc. R. Soc. Lond. B. 271:1881–1887.
———. 2007. The latitudinal gradient in recent speciation and extinction ratesof birds and mammals. Science 315:1574–1576.
———. 2008. Calibrating the avian molecular clock. Mol. Ecol. 17:2321–2328.
Wells, J. 2007. Birder’s conservation handbook: 100 North American birds atrisk. Princeton Univ. Press, Princeton, New Jersey.
Woolfenden, G., and J. Fitzpatrick. 1985. The Florida Scrub-Jay: demographyof a cooperatively-breeding bird. Princeton Univ. Press, Princeton, NewJersey.
Woolfenden, G. E., and J. W. Fitzpatrick. 1996. Florida Scrub-Jay (Aphe-locoma coerulescens). in A. Poole, ed. The birds of North Americaonline. Cornell Laboratory of Ornithology, Ithaca, New York. Availableat http://bna.birds.cornell.edu/bna/species/228.
Yang, Z. H., and B. Rannala. 2006. Bayesian estimation of species divergencetimes under a molecular clock using multiple fossil calibrations withsoft bounds. Mol. Biol. Evol. 23:212–226.
Zachos, J., M. Pagani, L. Sloan, E. Thomas, and K. Billups. 2001. Trends,rhythms, and aberrations in global climate 65 Ma to present. Science292:686–693.
Zwickl, D. J. 2006. Genetic algorithm approaches for the phylogenetic analysisof large biological sequence datasets under the maximum likelihoodcriterion. Ph.D. diss., University of Texas at Austin.
Associate Editor: M. Alfaro
EVOLUTION JANUARY 2011 1 9 7
JOHN E. McCORMACK ET AL.
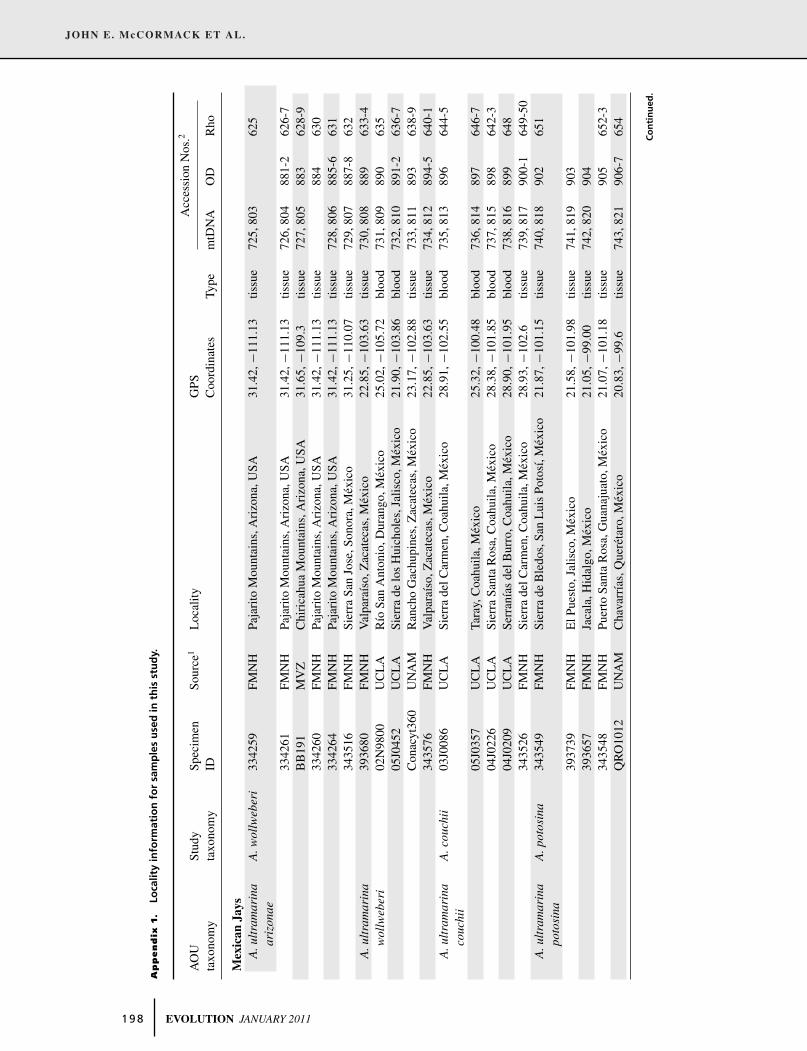
Ap
pen
dix
1.
Loca
lity
info
rmat
ion
for
sam
ple
su
sed
inth
isst
ud
y.
Acc
essi
onN
os.2
AO
USt
udy
Spec
imen
Sour
ce1
Loc
ality
GPS
taxo
nom
yta
xono
my
IDC
oord
inat
esTy
pem
tDN
AO
DR
ho
Mex
ican
Jays
A.u
ltra
mar
ina
ariz
onae
A.w
ollw
eber
i33
4259
FMN
HPa
jari
toM
ount
ains
,Ari
zona
,USA
31.4
2,−1
11.1
3tis
sue
725,
803
625
3342
61FM
NH
Paja
rito
Mou
ntai
ns,A
rizo
na,U
SA31
.42,
−111
.13
tissu
e72
6,80
488
1-2
626-
7B
B19
1M
VZ
Chi
rica
hua
Mou
ntai
ns,A
rizo
na,U
SA31
.65,
−109
.3tis
sue
727,
805
883
628-
933
4260
FMN
HPa
jari
toM
ount
ains
,Ari
zona
,USA
31.4
2,−1
11.1
3tis
sue
884
630
3342
64FM
NH
Paja
rito
Mou
ntai
ns,A
rizo
na,U
SA31
.42,
−111
.13
tissu
e72
8,80
688
5-6
631
3435
16FM
NH
Sier
raSa
nJo
se,S
onor
a,M
exic
o31
.25,
−110
.07
tissu
e72
9,80
788
7-8
632
A.u
ltra
mar
ina
3936
80FM
NH
Val
para
ıso,
Zac
atec
as,M
exic
o22
.85,
−103
.63
tissu
e73
0,80
888
963
3-4
wol
lweb
eri
02N
9800
UC
LA
Rıo
San
Ant
onio
,Dur
ango
,Mex
ico
25.0
2,−1
05.7
2bl
ood
731,
809
890
635
05J0
452
UC
LA
Sier
rade
los
Hui
chol
es,J
alis
co,M
exic
o21
.90,
−103
.86
bloo
d73
2,81
089
1-2
636-
7C
onac
yt36
0U
NA
MR
anch
oG
achu
pine
s,Z
acat
ecas
,Mex
ico
23.1
7,−1
02.8
8tis
sue
733,
811
893
638-
934
3576
FMN
HV
alpa
raıs
o,Z
acat
ecas
,Mex
ico
22.8
5,−1
03.6
3tis
sue
734,
812
894-
564
0-1
A.u
ltra
mar
ina
couc
hii
A.c
ouch
ii03
J008
6U
CL
ASi
erra
delC
arm
en,C
oahu
ila,M
exic
o28
.91,
−102
.55
bloo
d73
5,81
389
664
4-5
05J0
357
UC
LA
Tara
y,C
oahu
ila,M
exic
o25
.32,
−100
.48
bloo
d73
6,81
489
764
6-7
04J0
226
UC
LA
Sier
raSa
nta
Ros
a,C
oahu
ila,M
exic
o28
.38,
−101
.85
bloo
d73
7,81
589
864
2-3
04J0
209
UC
LA
Serr
anıa
sde
lBur
ro,C
oahu
ila,M
exic
o28
.90,
−101
.95
bloo
d73
8,81
689
964
834
3526
FMN
HSi
erra
delC
arm
en,C
oahu
ila,M
exic
o28
.93,
−102
.6tis
sue
739,
817
900-
164
9-50
A.u
ltra
mar
ina
poto
sina
A.p
otos
ina
3435
49FM
NH
Sier
rade
Ble
dos,
San
Lui
sPo
tosı
,Mex
ico
21.8
7,−1
01.1
5tis
sue
740,
818
902
651
3937
39FM
NH
ElP
uest
o,Ja
lisco
,Mex
ico
21.5
8,−1
01.9
8tis
sue
741,
819
903
3936
57FM
NH
Jaca
la,H
idal
go,M
exic
o21
.05,
−99.
00tis
sue
742,
820
904
3435
48FM
NH
Puer
toSa
nta
Ros
a,G
uana
juat
o,M
exic
o21
.07,
−101
.18
tissu
e90
565
2-3
QR
O10
12U
NA
MC
hava
rrıa
s,Q
uere
taro
,Mex
ico
20.8
3,−9
9.6
tissu
e74
3,82
190
6-7
654
Co
nti
nu
ed.
1 9 8 EVOLUTION JANUARY 2011
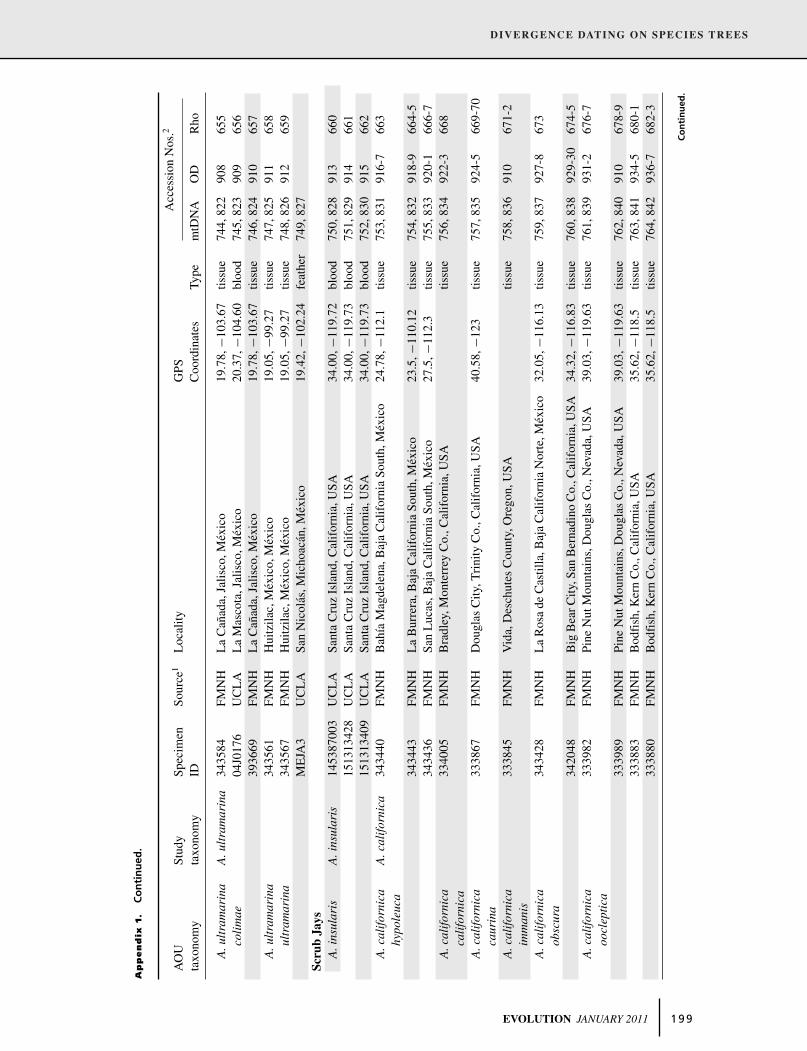
DIVERGENCE DATING ON SPECIES TREES
Ap
pen
dix
1.
Co
nti
nu
ed.
Acc
essi
onN
os.2
AO
USt
udy
Spec
imen
Sour
ce1
Loc
ality
GPS
taxo
nom
yta
xono
my
IDC
oord
inat
esTy
pem
tDN
AO
DR
ho
A.u
ltra
mar
ina
A.u
ltra
mar
ina
3435
84FM
NH
La
Can
ada,
Jalis
co,M
exic
o19
.78,
−103
.67
tissu
e74
4,82
290
865
5co
lim
ae04
J017
6U
CL
AL
aM
asco
ta,J
alis
co,M
exic
o20
.37,
−104
.60
bloo
d74
5,82
390
965
639
3669
FMN
HL
aC
anad
a,Ja
lisco
,Mex
ico
19.7
8,−1
03.6
7tis
sue
746,
824
910
657
A.u
ltra
mar
ina
3435
61FM
NH
Hui
tzila
c,M
exic
o,M
exic
o19
.05,
−99.
27tis
sue
747,
825
911
658
ultr
amar
ina
3435
67FM
NH
Hui
tzila
c,M
exic
o,M
exic
o19
.05,
−99.
27tis
sue
748,
826
912
659
ME
JA3
UC
LA
San
Nic
olas
,Mic
hoac
an,M
exic
o19
.42,
−102
.24
feat
her
749,
827
Scru
bJa
ysA
.ins
ular
isA
.ins
ular
is14
5387
003
UC
LA
Sant
aC
ruz
Isla
nd,C
alif
orni
a,U
SA34
.00,
−119
.72
bloo
d75
0,82
891
366
015
1313
428
UC
LA
Sant
aC
ruz
Isla
nd,C
alif
orni
a,U
SA34
.00,
−119
.73
bloo
d75
1,82
991
466
115
1313
409
UC
LA
Sant
aC
ruz
Isla
nd,C
alif
orni
a,U
SA34
.00,
−119
.73
bloo
d75
2,83
091
566
2A
.cal
ifor
nica
hypo
leuc
aA
.cal
ifor
nica
3434
40FM
NH
Bah
ıaM
agde
lena
,Baj
aC
alif
orni
aSo
uth,
Mex
ico
24.7
8,−1
12.1
tissu
e75
3,83
191
6-7
663
3434
43FM
NH
La
Bur
rera
,Baj
aC
alif
orni
aSo
uth,
Mex
ico
23.5
,−11
0.12
tissu
e75
4,83
291
8-9
664-
534
3436
FMN
HSa
nL
ucas
,Baj
aC
alif
orni
aSo
uth,
Mex
ico
27.5
,−11
2.3
tissu
e75
5,83
392
0-1
666-
7A
.cal
ifor
nica
cali
forn
ica
3340
05FM
NH
Bra
dley
,Mon
terr
eyC
o.,C
alif
orni
a,U
SAtis
sue
756,
834
922-
366
8
A.c
alif
orni
caca
urin
a33
3867
FMN
HD
ougl
asC
ity,T
rini
tyC
o.,C
alif
orni
a,U
SA40
.58,
−123
tissu
e75
7,83
592
4-5
669-
70
A.c
alif
orni
caim
man
is33
3845
FMN
HV
ida,
Des
chut
esC
ount
y,O
rego
n,U
SAtis
sue
758,
836
910
671-
2
A.c
alif
orni
caob
scur
a34
3428
FMN
HL
aR
osa
deC
astil
la,B
aja
Cal
ifor
nia
Nor
te,M
exic
o32
.05,
−116
.13
tissu
e75
9,83
792
7-8
673
3420
48FM
NH
Big
Bea
rCity
,San
Ber
nadi
noC
o.,C
alif
orni
a,U
SA34
.32,
−116
.83
tissu
e76
0,83
892
9-30
674-
5A
.cal
ifor
nica
oocl
epti
ca33
3982
FMN
HPi
neN
utM
ount
ains
,Dou
glas
Co.
,Nev
ada,
USA
39.0
3,−1
19.6
3tis
sue
761,
839
931-
267
6-7
3339
89FM
NH
Pine
Nut
Mou
ntai
ns,D
ougl
asC
o.,N
evad
a,U
SA39
.03,
−119
.63
tissu
e76
2,84
091
067
8-9
3338
83FM
NH
Bod
fish
,Ker
nC
o.,C
alif
orni
a,U
SA35
.62,
−118
.5tis
sue
763,
841
934-
568
0-1
3338
80FM
NH
Bod
fish
,Ker
nC
o.,C
alif
orni
a,U
SA35
.62,
−118
.5tis
sue
764,
842
936-
768
2-3
Co
nti
nu
ed.
EVOLUTION JANUARY 2011 1 9 9
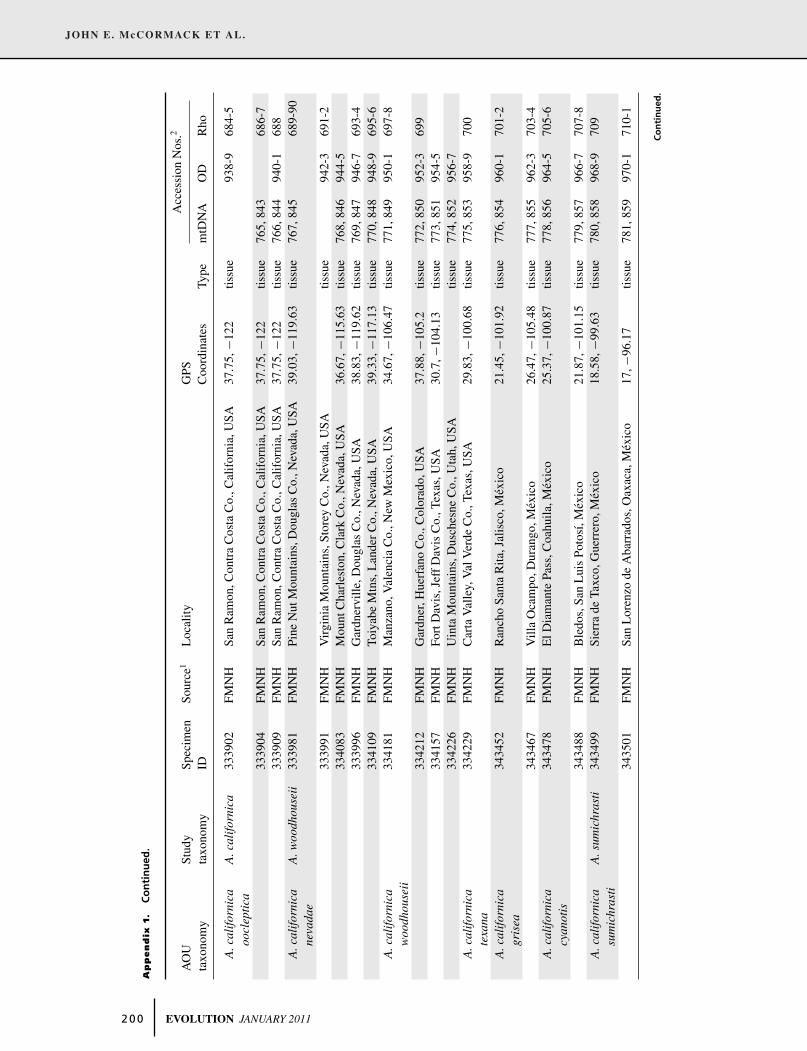
JOHN E. McCORMACK ET AL.
Ap
pen
dix
1.
Co
nti
nu
ed.
Acc
essi
onN
os.2
AO
USt
udy
Spec
imen
Sour
ce1
Loc
ality
GPS
taxo
nom
yta
xono
my
IDC
oord
inat
esTy
pem
tDN
AO
DR
ho
A.c
alif
orni
caoo
clep
tica
A.c
alif
orni
ca33
3902
FMN
HSa
nR
amon
,Con
tra
Cos
taC
o.,C
alif
orni
a,U
SA37
.75,
−122
tissu
e93
8-9
684-
5
3339
04FM
NH
San
Ram
on,C
ontr
aC
osta
Co.
,Cal
ifor
nia,
USA
37.7
5,−1
22tis
sue
765,
843
686-
733
3909
FMN
HSa
nR
amon
,Con
tra
Cos
taC
o.,C
alif
orni
a,U
SA37
.75,
−122
tissu
e76
6,84
494
0-1
688
A.c
alif
orni
cane
vada
eA
.woo
dhou
seii
3339
81FM
NH
Pine
Nut
Mou
ntai
ns,D
ougl
asC
o.,N
evad
a,U
SA39
.03,
−119
.63
tissu
e76
7,84
568
9-90
3339
91FM
NH
Vir
gini
aM
ount
ains
,Sto
rey
Co.
,Nev
ada,
USA
tissu
e94
2-3
691-
233
4083
FMN
HM
ount
Cha
rles
ton,
Cla
rkC
o.,N
evad
a,U
SA36
.67,
−115
.63
tissu
e76
8,84
694
4-5
3339
96FM
NH
Gar
dner
ville
,Dou
glas
Co.
,Nev
ada,
USA
38.8
3,−1
19.6
2tis
sue
769,
847
946-
769
3-4
3341
09FM
NH
Toiy
abe
Mtn
s,L
ande
rC
o.,N
evad
a,U
SA39
.33,
−117
.13
tissu
e77
0,84
894
8-9
695-
6A
.cal
ifor
nica
woo
dhou
seii
3341
81FM
NH
Man
zano
,Val
enci
aC
o.,N
ewM
exic
o,U
SA34
.67,
−106
.47
tissu
e77
1,84
995
0-1
697-
8
3342
12FM
NH
Gar
dner
,Hue
rfan
oC
o.,C
olor
ado,
USA
37.8
8,−1
05.2
tissu
e77
2,85
095
2-3
699
3341
57FM
NH
Fort
Dav
is,J
eff
Dav
isC
o.,T
exas
,USA
30.7
,−10
4.13
tissu
e77
3,85
195
4-5
3342
26FM
NH
Uin
taM
ount
ains
,Dus
ches
neC
o.,U
tah,
USA
tissu
e77
4,85
295
6-7
A.c
alif
orni
cate
xana
3342
29FM
NH
Car
taV
alle
y,V
alV
erde
Co.
,Tex
as,U
SA29
.83,
−100
.68
tissu
e77
5,85
395
8-9
700
A.c
alif
orni
cagr
isea
3434
52FM
NH
Ran
cho
Sant
aR
ita,J
alis
co,M
exic
o21
.45,
−101
.92
tissu
e77
6,85
496
0-1
701-
2
3434
67FM
NH
Vill
aO
cam
po,D
uran
go,M
exic
o26
.47,
−105
.48
tissu
e77
7,85
596
2-3
703-
4A
.cal
ifor
nica
cyan
otis
3434
78FM
NH
ElD
iam
ante
Pass
,Coa
huila
,Mex
ico
25.3
7,−1
00.8
7tis
sue
778,
856
964-
570
5-6
3434
88FM
NH
Ble
dos,
San
Lui
sPo
tosı
,Mex
ico
21.8
7,−1
01.1
5tis
sue
779,
857
966-
770
7-8
A.c
alif
orni
casu
mic
hras
tiA
.sum
ichr
asti
3434
99FM
NH
Sier
rade
Taxc
o,G
uerr
ero,
Mex
ico
18.5
8,−9
9.63
tissu
e78
0,85
896
8-9
709
3435
01FM
NH
San
Lor
enzo
deA
barr
ados
,Oax
aca,
Mex
ico
17,−
96.1
7tis
sue
781,
859
970-
171
0-1
Co
nti
nu
ed.
2 0 0 EVOLUTION JANUARY 2011
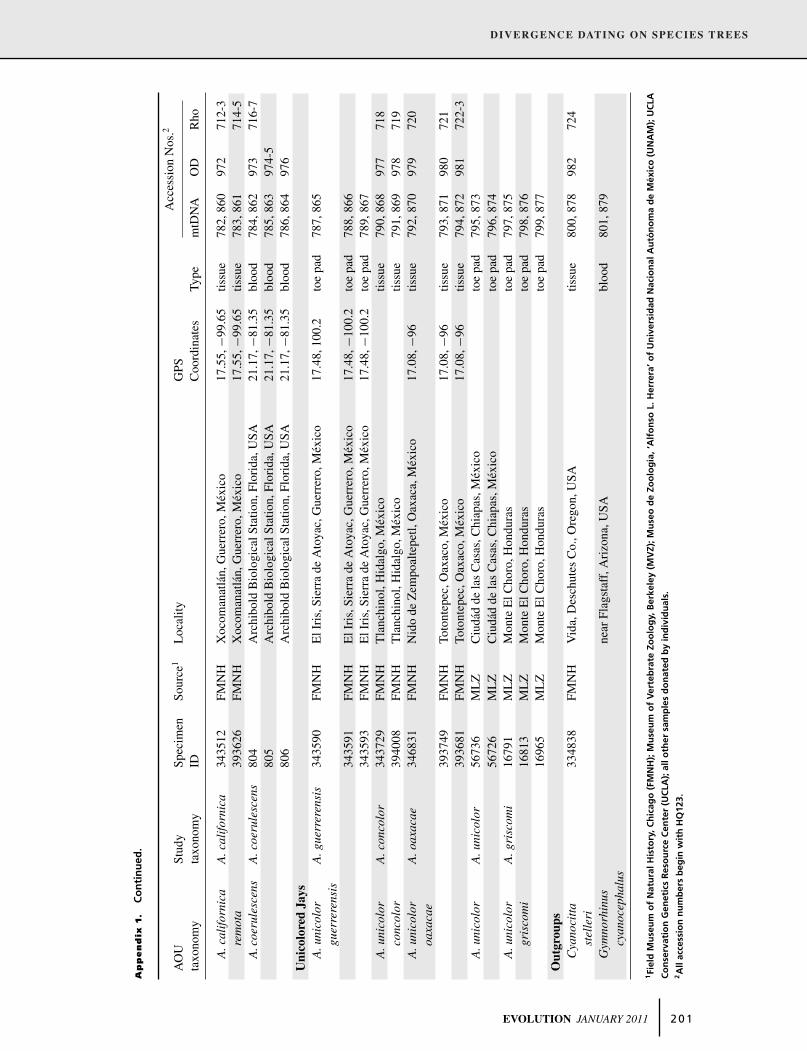
DIVERGENCE DATING ON SPECIES TREES
Ap
pen
dix
1.
Co
nti
nu
ed.
Acc
essi
onN
os.2
AO
USt
udy
Spec
imen
Sour
ce1
Loc
ality
GPS
taxo
nom
yta
xono
my
IDC
oord
inat
esTy
pem
tDN
AO
DR
ho
A.c
alif
orni
caA
.cal
ifor
nica
3435
12FM
NH
Xoc
oman
atla
n,G
uerr
ero,
Mex
ico
17.5
5,−9
9.65
tissu
e78
2,86
097
271
2-3
rem
ota
3936
26FM
NH
Xoc
oman
atla
n,G
uerr
ero,
Mex
ico
17.5
5,−9
9.65
tissu
e78
3,86
171
4-5
A.c
oeru
lesc
ens
A.c
oeru
lesc
ens
804
Arc
hibo
ldB
iolo
gica
lSta
tion,
Flor
ida,
USA
21.1
7,−8
1.35
bloo
d78
4,86
297
371
6-7
805
Arc
hibo
ldB
iolo
gica
lSta
tion,
Flor
ida,
USA
21.1
7,−8
1.35
bloo
d78
5,86
397
4-5
806
Arc
hibo
ldB
iolo
gica
lSta
tion,
Flor
ida,
USA
21.1
7,−8
1.35
bloo
d78
6,86
497
6U
nico
lore
dJa
ysA
.uni
colo
rgu
erre
rens
isA
.gue
rrer
ensi
s34
3590
FMN
HE
lIri
s,Si
erra
deA
toya
c,G
uerr
ero,
Mex
ico
17.4
8,10
0.2
toe
pad
787,
865
3435
91FM
NH
ElI
ris,
Sier
rade
Ato
yac,
Gue
rrer
o,M
exic
o17
.48,
−100
.2to
epa
d78
8,86
634
3593
FMN
HE
lIri
s,Si
erra
deA
toya
c,G
uerr
ero,
Mex
ico
17.4
8,−1
00.2
toe
pad
789,
867
A.u
nico
lor
A.c
onco
lor
3437
29FM
NH
Tla
nchi
nol,
Hid
algo
,Mex
ico
tissu
e79
0,86
897
771
8co
ncol
or39
4008
FMN
HT
lanc
hino
l,H
idal
go,M
exic
otis
sue
791,
869
978
719
A.u
nico
lor
oaxa
cae
A.o
axac
ae34
6831
FMN
HN
ido
deZ
empo
alte
petl,
Oax
aca,
Mex
ico
17.0
8,−9
6tis
sue
792,
870
979
720
3937
49FM
NH
Toto
ntep
ec,O
axac
o,M
exic
o17
.08,
−96
tissu
e79
3,87
198
072
139
3681
FMN
HTo
tont
epec
,Oax
aco,
Mex
ico
17.0
8,−9
6tis
sue
794,
872
981
722-
3A
.uni
colo
run
icol
orA
.uni
colo
r56
736
ML
ZC
iuda
dde
las
Cas
as,C
hiap
as,M
exic
oto
epa
d79
5,87
356
726
ML
ZC
iuda
dde
las
Cas
as,C
hiap
as,M
exic
oto
epa
d79
6,87
4A
.uni
colo
rA
.gri
scom
i16
791
ML
ZM
onte
ElC
horo
,Hon
dura
sto
epa
d79
7,87
5gr
isco
mi
1681
3M
LZ
Mon
teE
lCho
ro,H
ondu
ras
toe
pad
798,
876
1696
5M
LZ
Mon
teE
lCho
ro,H
ondu
ras
toe
pad
799,
877
Out
grou
psC
yano
citt
ast
elle
ri33
4838
FMN
HV
ida,
Des
chut
esC
o.,O
rego
n,U
SAtis
sue
800,
878
982
724
Gym
norh
inus
cyan
ocep
halu
sne
arFl
agst
aff,
Ari
zona
,USA
bloo
d80
1,87
9
1Fi
eld
Mu
seu
mo
fN
atu
ral
His
tory
,C
hic
ago
(FM
NH
);M
use
um
of
Ver
teb
rate
Zoo
log
y,B
erke
ley
(MV
Z);M
use
od
eZo
olo
gıa
,‘A
lfo
nso
L.H
erre
ra’
of
Un
iver
sid
adN
acio
nal
Au
ton
om
ad
eM
exic
o(U
NA
M);
UC
LA
Co
nse
rvat
ion
Gen
etic
sR
eso
urc
eC
ente
r(U
CLA
);al
loth
ersa
mp
les
do
nat
edb
yin
div
idu
als.
2A
llac
cess
ion
nu
mb
ers
beg
inw
ith
HQ
123.
EVOLUTION JANUARY 2011 2 0 1

JOHN E. McCORMACK ET AL.
Supporting InformationThe following supporting information is available for this article:
Figure S1. Absolute dates and 95HPDs for gene trees and species trees.
Supporting Information may be found in the online version of this article.
Please note: Wiley-Blackwell is not responsible for the content or functionality of any supporting information supplied by the
authors. Any queries (other than missing material) should be directed to the corresponding author for the article.
2 0 2 EVOLUTION JANUARY 2011


![1202 mccormack[1]](https://img.pdfslide.us/doc/110x75/54944385b479594c4d8b4a55/1202-mccormack1.jpg)