Embed Size (px)
Citation preview
Consolidated Financial Statements for the year ended 29 February 2016
Calgro M3 Developments Limited and its Subsidiaries
Ind
ex
2
Index
Index Page
General Information 3
Directors’ Responsibilities and Approval 4
Certificate of the Company Secretary 4
Directors’ Report 5 - 7
Independent Auditor’s Report 8
Consolidated Statement of Financial Position 10
Consolidated Statement of Comprehensive Income 11
Consolidated Statement of Changes in Equity 12
Consolidated Statement of Cash Flows 13
Notes to the Consolidated Financial Statements 14 - 49
The reports and statements set out below comprise the consolidated financial statements presented to the shareholder:
Gen
eral in
form
ation
3
General informationCalgro M3 Developments LimitedIncorporated in the Republic of South AfricaRegistration number 1996/017246/06
Registered OfficeCalgro M3 BuildingBallywoods Office Park33 Ballyclare DriveBryanston2196
Business AddressCalgro M3 BuildingBallywoods Office Park33 Ballyclare DriveBryanston2196
Postal AddressPrivate Bag X33Craighall2024
Published10 May 2016
PreparerThe financial statements have been internally compiled by WA Joubert CA (SA).
BankersFirst National BankStandard Bank
AuditorsPricewaterhouseCoopers Inc.
SecretaryW Williams
DirectorsBP Malherbe ExecutiveWJ Lategan ExecutiveFJ Steyn ExecutiveDN Steyn ExecutiveBG Blieden ExecutiveW Williams ExecutiveWA Joubert Executive
Level of AssuranceThese financial statements have been audited by our external auditors PricewaterhouseCoopers Inc. in compliance with the applicable requirements of the Companies Act 71 of 2008.
4
Directors’ Responsibilities and Approval
The Directors are required in terms of the Companies Act 71 of 2008 to maintain adequate accounting records and are responsible for the content and integrity of the consolidated and separate financial statements and related financial information included in this report. It is their responsibility to ensure that the consolidated and separate financial statements fairly present the state of affairs of the Group and Company as at the end of the financial year and the results of its operations and cash flows for the period then ended, in conformity with International Financial Reporting Standards. The external auditors are engaged to express an independent opinion on the financial statements.The consolidated and separate financial statements are prepared in accordance with International Financial Reporting Standards (IFRS) and are based upon appropriate accounting policies consistently applied and supported by reasonable and prudent judgments and estimates.The Directors acknowledge that they are ultimately responsible for the system of internal financial control established by the Group and Company and place considerable importance on maintaining a strong control environment. To enable the Directors to meet these responsibilities, the Board of Directors sets standards for internal control aimed at reducing the risk of error or loss in a cost effective manner. The standards include the proper delegation of responsibilities within a clearly defined framework, effective accounting procedures and adequate segregation of duties to ensure an acceptable level of risk. These controls are monitored throughout the Group and Company and all employees are required to maintain the highest ethical standards in ensuring the Group and Company’s business is conducted in a manner that in all reasonable circumstances is above reproach. The focus of risk management in the Group and Company is on identifying, assessing, managing and monitoring all known forms of risk across the Group and Company. While operating risk cannot be fully eliminated, the Group and Company endeavours to minimise it by ensuring that appropriate infrastructure, controls, systems and ethical behaviour are applied and managed within predetermined procedures and constraints.The Code of Corporate Practices and Conduct has been integrated into the Group and Company’s strategies and operations.The Directors are of the opinion, based on the information and explanations given by management, that the system of internal control provides reasonable assurance that the financial records may be relied on for the preparation of the consolidated and separate financial statements. However, any system of internal financial control can provide only reasonable, and not absolute assurance against material misstatement or loss.The Directors have reviewed the Group and Company’s cash flow forecast for the year to 28 February 2017 and, in the light of this review and the current financial position, they are satisfied that the Group and Company has or has access to adequate resources to continue in operational existence for the foreseeable future.The external auditors are responsible for independently auditing and reporting on the Company’s annual financial statements. The consolidated and separate financial statements have been examined by the Group and Company’s external auditors and their report is presented on page 8.The external auditors were given unrestricted access to all financial records and related data, including minutes of all meetings of shareholders, the Board and the Board of Directors. The Board of Directors believe that all representations made to the independent auditors during their audit are valid and appropriate.The Company’s ultimate holding company has appointed an audit committee which performs the functions required under Section 94(7) of the Companies Act 71 of 2008 on behalf of Calgro M3 Developments Limited. The consolidated and separate financial statements set out on pages 10 to 49, which have been prepared on the going concern basis, were approved by the Board of Directors on 10 May 2016 and were signed on its behalf by:
BP Malherbe WJ Lategan
Certificate of the Company SecretaryI, Wayne Williams, hereby confirm, in my capacity as Company Secretary of Calgro M3 Developments Limited that for the year ended 29 February 2016, the Company has filed all required returns and notices in terms of the Companies Act 71 of 2008 and that all such returns and notices are to the best of my knowledge and belief true, correct and up to date.
Wayne WilliamsCompany Secretary10 May 2016
Dire
ctors’ R
ep
ort
5
Directors’ Report
The Directors submit their report for the year ended 29 February 2016.
1. Nature of BusinessMain business and operations:
The Company is engaged in construction and land development.
The operating cycle for inventory and construction contracts is considered to be longer than 12 months. Accordingly the associated assets and liabilities are classified as current as they are expected to be settled within the same operating cycle as inventory and construction contracts.
Registered OfficeCalgro M3 BuildingBallywoods Office Park33 Ballyclare DriveBryanston2196
Postal AddressPrivate Bag X33Craighall2024
2. Financial PositionThe consolidated and separate financial statements on pages 10 to 49 set out fully the financial position, results of operations and cash flows of the Group and Company for the year ended 29 February 2016 and do not in our opinion require any further comment.
For segmental reporting, please refer to note 38 of the consolidated financial statements.
3. Events after Reporting PeriodThere were no events after the year ended 29 February 2016 that warrant disclosure in this report.
4. Type of CompanyCalgro M3 Developments Limited is registered as a public company in terms of the Companies Act No. 71 of 2008.
5. Subsidiary CompaniesAll direct and indirect subsidiaries are South African-based.
The attributable interest of the holding Company in the aggregate income earned and losses incurred after taxation by its subsidiaries,excluding any associated consolidation entries are as follows:
R’000 2016 2015Profit 96 8 253Losses (5 971) (417)
6. Share Appreciation RightsDuring the current year, all Directors and selected employees who were previously granted Share Appreciation Rights (SAR’s) were given the option to either continue on their SAR scheme, agree a settlement value for their unvested SAR’s with the Group or modify their unvested SAR’s to the Calgro M3 Executive Share Scheme (“Executive scheme”). Five individuals elected to settle their unvested SAR’s, one individual elected to partly settle his SAR and continue on the SAR scheme and eight individuals elected to modify their SARs to the Executive Share Scheme.
The SAR’s were previously divided into two main categories with various SAR issues in each category. At 29 February 2016, the total number of SAR’s outstanding is 300 000 (2015: 10 378 172) and are classified within Category 2 (2015: 5 400 000). There are no SAR’s classified in Category 1 (2015: 4 978 172).
Nil Category 1 SAR’s were granted (2015 FY - 1 744 839) and 916 667 Category 1 SAR’s were exercised (2015 FY - 1 616 667) by Directors and selected employees during the 2016 financial year. Nil Category 2 SAR’s were granted (2015 FY -1 200 000) and 450 000 Category 2 SAR’s were exercised (2015 FY - Nil) by Directors and selected employees during the 2016 financial year.
The rights will vest if the share price at each vesting date exceeds the hurdle price.
6
Dire
ctor
s’ R
epor
t
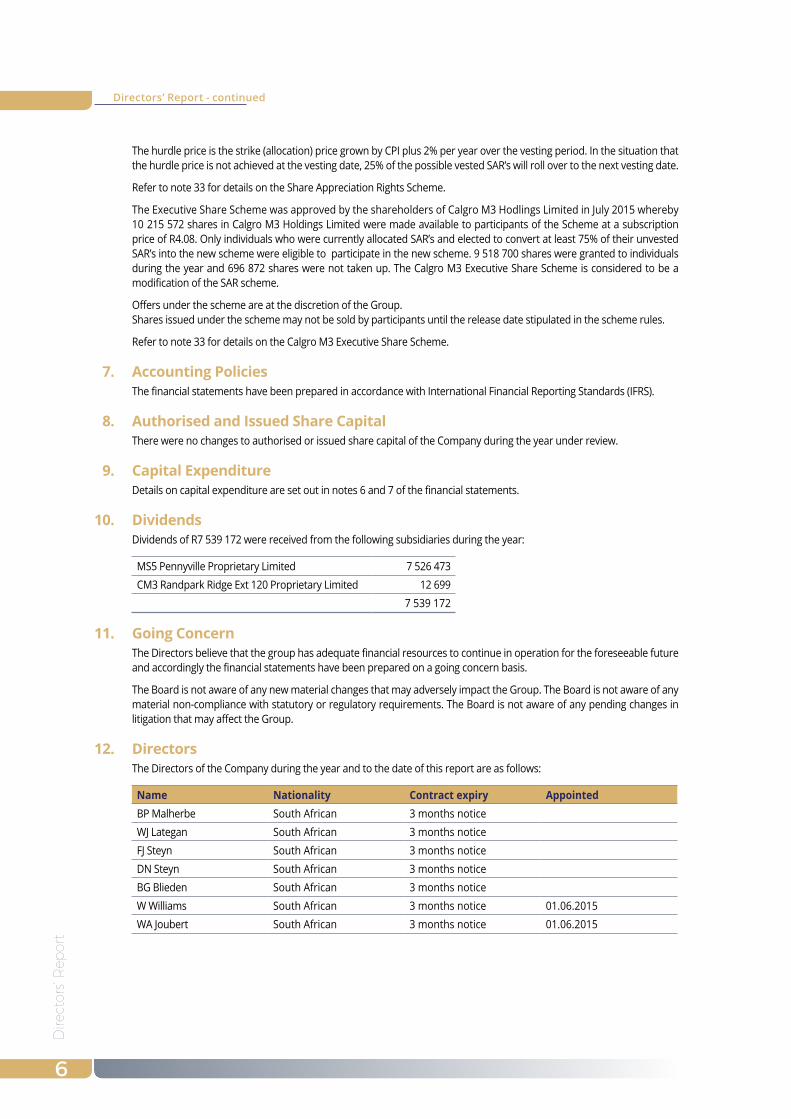
The hurdle price is the strike (allocation) price grown by CPI plus 2% per year over the vesting period. In the situation that the hurdle price is not achieved at the vesting date, 25% of the possible vested SAR’s will roll over to the next vesting date.
Refer to note 33 for details on the Share Appreciation Rights Scheme.
The Executive Share Scheme was approved by the shareholders of Calgro M3 Hodlings Limited in July 2015 whereby 10 215 572 shares in Calgro M3 Holdings Limited were made available to participants of the Scheme at a subscription price of R4.08. Only individuals who were currently allocated SAR’s and elected to convert at least 75% of their unvested SAR’s into the new scheme were eligible to participate in the new scheme. 9 518 700 shares were granted to individuals during the year and 696 872 shares were not taken up. The Calgro M3 Executive Share Scheme is considered to be a modification of the SAR scheme.
Offers under the scheme are at the discretion of the Group.Shares issued under the scheme may not be sold by participants until the release date stipulated in the scheme rules.
Refer to note 33 for details on the Calgro M3 Executive Share Scheme.
7. Accounting PoliciesThe financial statements have been prepared in accordance with International Financial Reporting Standards (IFRS).
8. Authorised and Issued Share CapitalThere were no changes to authorised or issued share capital of the Company during the year under review.
9. Capital ExpenditureDetails on capital expenditure are set out in notes 6 and 7 of the financial statements.
10. DividendsDividends of R7 539 172 were received from the following subsidiaries during the year:
MS5 Pennyville Proprietary Limited 7 526 473CM3 Randpark Ridge Ext 120 Proprietary Limited 12 699
7 539 172
11. Going ConcernThe Directors believe that the group has adequate financial resources to continue in operation for the foreseeable future and accordingly the financial statements have been prepared on a going concern basis.
The Board is not aware of any new material changes that may adversely impact the Group. The Board is not aware of any material non-compliance with statutory or regulatory requirements. The Board is not aware of any pending changes in litigation that may affect the Group.
12. Directors The Directors of the Company during the year and to the date of this report are as follows:
Name Nationality Contract expiry AppointedBP Malherbe South African 3 months noticeWJ Lategan South African 3 months noticeFJ Steyn South African 3 months noticeDN Steyn South African 3 months noticeBG Blieden South African 3 months noticeW Williams South African 3 months notice 01.06.2015WA Joubert South African 3 months notice 01.06.2015
Directors’ Report - continued

7
Directors’ R
eport
13. SecretaryW Williams will continue in office in accordance with section 86 of the Companies Act, subject to the approval of the shareholders at the next general meeting.
Business addressCalgro M3 BuildingBallywoods Office Park33 Ballyclare DriveBryanston2196
Postal addressPrivate Bag X33Craighall2024
14. Auditors PricewaterhouseCoopers Inc will continue in office in accordance with section 90 of the Companies Act, subject to the approval of the shareholders at the next general meeting. J-P van Staden will be the individual registered auditor who will undertake the audit.
15. PreparerThe financial statements have been internally compiled by WA Joubert CA (SA).
16. Liquidity and SolvencyThe Directors have performed the required liquidity and solvency tests by reviewing future cash flows of the Group and Company as required by the Companies Act No. 71 of 2008.
17. Level of AssuranceThese financial statements have been audited in compliance with the applicable requirements of the Companies Act No. 71 of 2008.
18. Special ResolutionNo special resolutions relating to the capital structure, borrowing powers or any other material matter that affects the understanding of the Group were passed by subsidiary companies during the year under review.
Directors’ Report - continued
Ind
ep
en
den
t A
ud
ito
r’s R
ep
ort
8
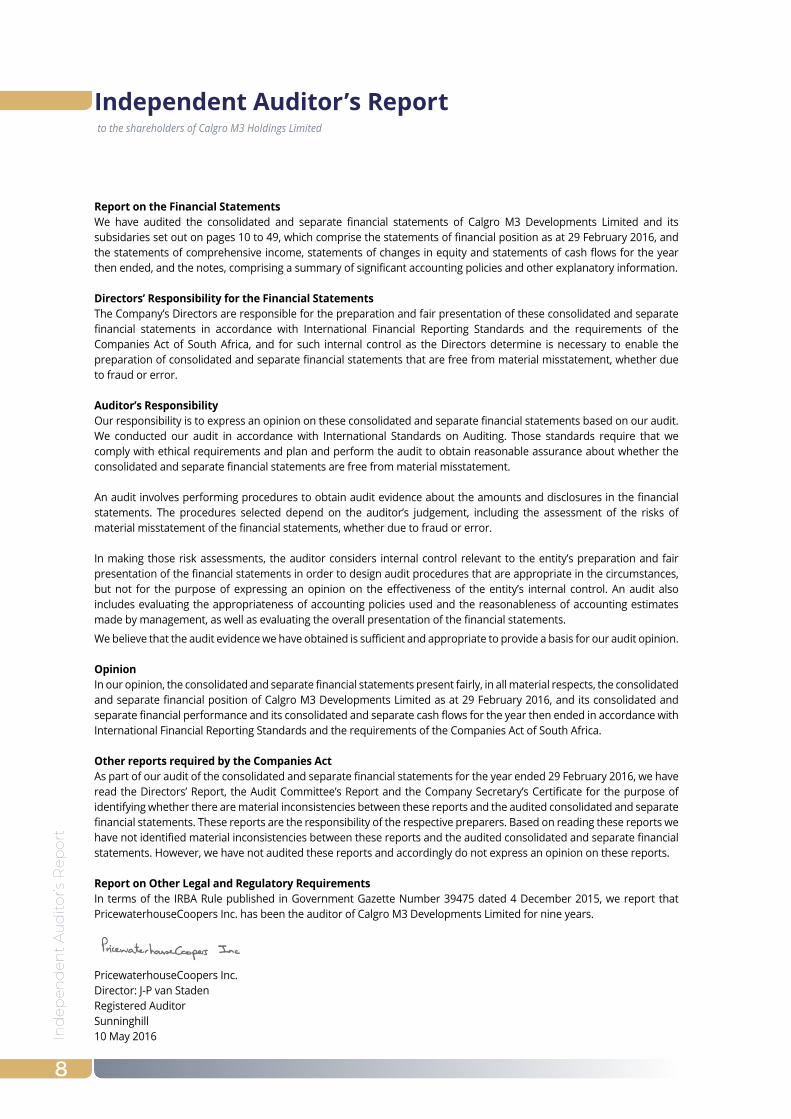
Independent Auditor’s Report
Report on the Financial StatementsWe have audited the consolidated and separate financial statements of Calgro M3 Developments Limited and its subsidaries set out on pages 10 to 49, which comprise the statements of financial position as at 29 February 2016, and the statements of comprehensive income, statements of changes in equity and statements of cash flows for the year then ended, and the notes, comprising a summary of significant accounting policies and other explanatory information. Directors’ Responsibility for the Financial StatementsThe Company’s Directors are responsible for the preparation and fair presentation of these consolidated and separate financial statements in accordance with International Financial Reporting Standards and the requirements of the Companies Act of South Africa, and for such internal control as the Directors determine is necessary to enable the preparation of consolidated and separate financial statements that are free from material misstatement, whether due to fraud or error.
Auditor’s ResponsibilityOur responsibility is to express an opinion on these consolidated and separate financial statements based on our audit. We conducted our audit in accordance with International Standards on Auditing. Those standards require that we comply with ethical requirements and plan and perform the audit to obtain reasonable assurance about whether the consolidated and separate financial statements are free from material misstatement.
An audit involves performing procedures to obtain audit evidence about the amounts and disclosures in the financial statements. The procedures selected depend on the auditor’s judgement, including the assessment of the risks of material misstatement of the financial statements, whether due to fraud or error.
In making those risk assessments, the auditor considers internal control relevant to the entity’s preparation and fair presentation of the financial statements in order to design audit procedures that are appropriate in the circumstances, but not for the purpose of expressing an opinion on the effectiveness of the entity’s internal control. An audit also includes evaluating the appropriateness of accounting policies used and the reasonableness of accounting estimates made by management, as well as evaluating the overall presentation of the financial statements.
We believe that the audit evidence we have obtained is sufficient and appropriate to provide a basis for our audit opinion.
OpinionIn our opinion, the consolidated and separate financial statements present fairly, in all material respects, the consolidated and separate financial position of Calgro M3 Developments Limited as at 29 February 2016, and its consolidated and separate financial performance and its consolidated and separate cash flows for the year then ended in accordance with International Financial Reporting Standards and the requirements of the Companies Act of South Africa.
Other reports required by the Companies ActAs part of our audit of the consolidated and separate financial statements for the year ended 29 February 2016, we have read the Directors’ Report, the Audit Committee’s Report and the Company Secretary’s Certificate for the purpose of identifying whether there are material inconsistencies between these reports and the audited consolidated and separate financial statements. These reports are the responsibility of the respective preparers. Based on reading these reports we have not identified material inconsistencies between these reports and the audited consolidated and separate financial statements. However, we have not audited these reports and accordingly do not express an opinion on these reports.
Report on Other Legal and Regulatory RequirementsIn terms of the IRBA Rule published in Government Gazette Number 39475 dated 4 December 2015, we report that PricewaterhouseCoopers Inc. has been the auditor of Calgro M3 Developments Limited for nine years.
PricewaterhouseCoopers Inc. Director: J-P van StadenRegistered Auditor Sunninghill10 May 2016
to the shareholders of Calgro M3 Holdings Limited

10
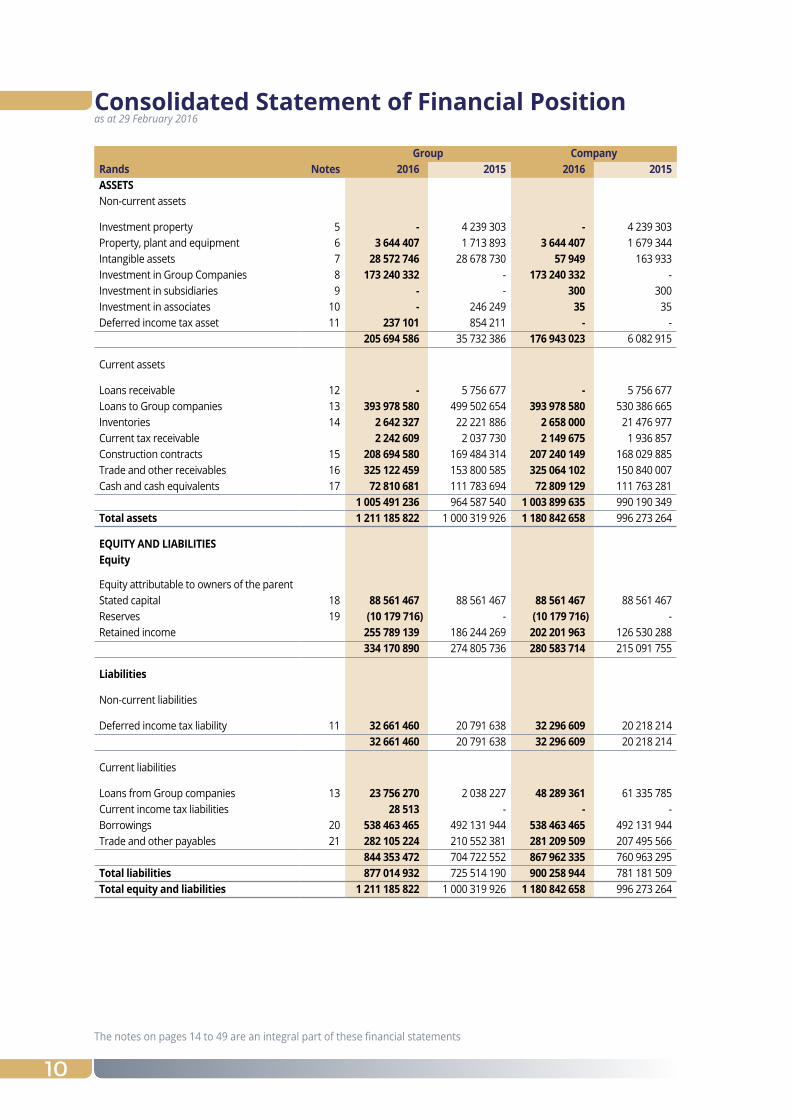
Group CompanyRands Notes 2016 2015 2016 2015ASSEtSNon-current assets
Investment property 5 - 4 239 303 - 4 239 303 Property, plant and equipment 6 3 644 407 1 713 893 3 644 407 1 679 344 Intangible assets 7 28 572 746 28 678 730 57 949 163 933 Investment in Group Companies 8 173 240 332 - 173 240 332 - Investment in subsidiaries 9 - - 300 300 Investment in associates 10 - 246 249 35 35 Deferred income tax asset 11 237 101 854 211 - -
205 694 586 35 732 386 176 943 023 6 082 915
Current assets
Loans receivable 12 - 5 756 677 - 5 756 677 Loans to Group companies 13 393 978 580 499 502 654 393 978 580 530 386 665 Inventories 14 2 642 327 22 221 886 2 658 000 21 476 977 Current tax receivable 2 242 609 2 037 730 2 149 675 1 936 857 Construction contracts 15 208 694 580 169 484 314 207 240 149 168 029 885 Trade and other receivables 16 325 122 459 153 800 585 325 064 102 150 840 007 Cash and cash equivalents 17 72 810 681 111 783 694 72 809 129 111 763 281
1 005 491 236 964 587 540 1 003 899 635 990 190 349 total assets 1 211 185 822 1 000 319 926 1 180 842 658 996 273 264
EquIty AND LIABILItIESEquity
Equity attributable to owners of the parentStated capital 18 88 561 467 88 561 467 88 561 467 88 561 467 Reserves 19 (10 179 716) - (10 179 716) - Retained income 255 789 139 186 244 269 202 201 963 126 530 288
334 170 890 274 805 736 280 583 714 215 091 755
Liabilities
Non-current liabilities
Deferred income tax liability 11 32 661 460 20 791 638 32 296 609 20 218 214 32 661 460 20 791 638 32 296 609 20 218 214
Current liabilities
Loans from Group companies 13 23 756 270 2 038 227 48 289 361 61 335 785 Current income tax liabilities 28 513 - - - Borrowings 20 538 463 465 492 131 944 538 463 465 492 131 944 Trade and other payables 21 282 105 224 210 552 381 281 209 509 207 495 566
844 353 472 704 722 552 867 962 335 760 963 295 total liabilities 877 014 932 725 514 190 900 258 944 781 181 509 Total equity and liabilities 1 211 185 822 1 000 319 926 1 180 842 658 996 273 264
Consolidated Statement of Financial Position
The notes on pages 14 to 49 are an integral part of these financial statements
as at 29 February 2016
11
Directors’ R
eport
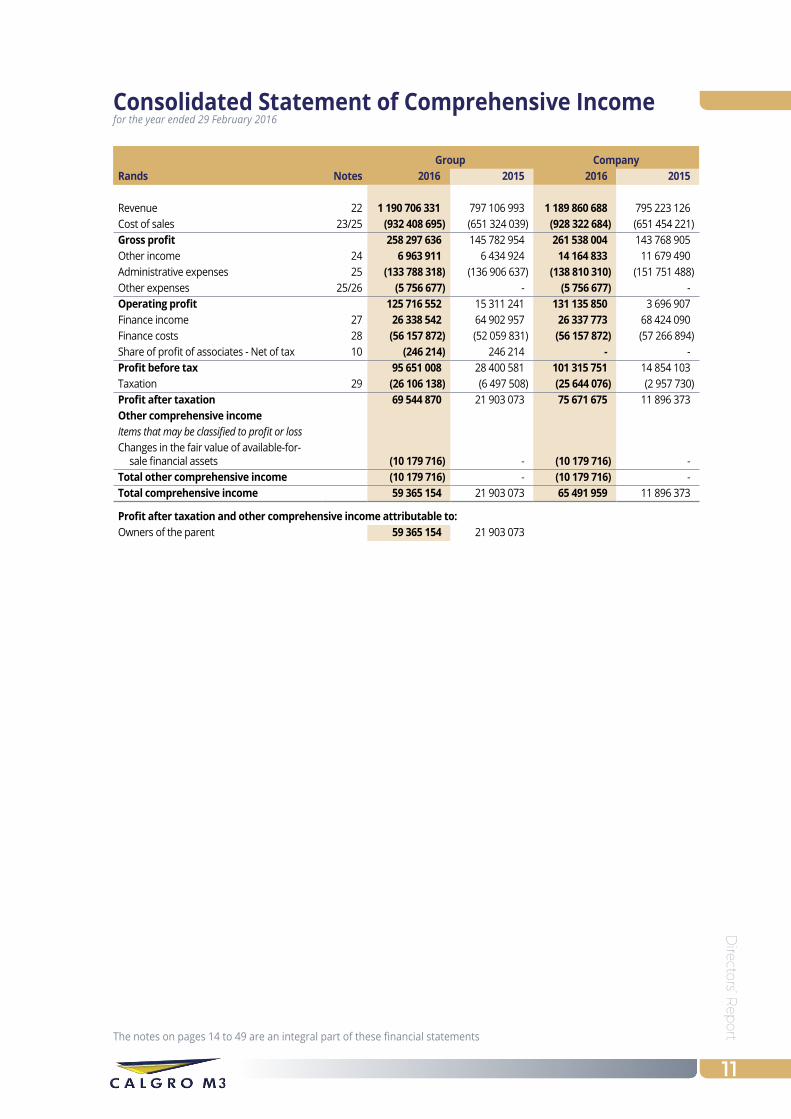
Consolidated Statement of Comprehensive Income
Group CompanyRands Notes 2016 2015 2016 2015
Revenue 22 1 190 706 331 797 106 993 1 189 860 688 795 223 126 Cost of sales 23/25 (932 408 695) (651 324 039) (928 322 684) (651 454 221) Gross profit 258 297 636 145 782 954 261 538 004 143 768 905 Other income 24 6 963 911 6 434 924 14 164 833 11 679 490 Administrative expenses 25 (133 788 318) (136 906 637) (138 810 310) (151 751 488) Other expenses 25/26 (5 756 677) - (5 756 677) - Operating profit 125 716 552 15 311 241 131 135 850 3 696 907 Finance income 27 26 338 542 64 902 957 26 337 773 68 424 090 Finance costs 28 (56 157 872) (52 059 831) (56 157 872) (57 266 894) Share of profit of associates - Net of tax 10 (246 214) 246 214 - - Profit before tax 95 651 008 28 400 581 101 315 751 14 854 103 Taxation 29 (26 106 138) (6 497 508) (25 644 076) (2 957 730) Profit after taxation 69 544 870 21 903 073 75 671 675 11 896 373 Other comprehensive incomeItems that may be classified to profit or lossChanges in the fair value of available-for-
sale financial assets (10 179 716) - (10 179 716) - Total other comprehensive income (10 179 716) - (10 179 716) - Total comprehensive income 59 365 154 21 903 073 65 491 959 11 896 373
Profit after taxation and other comprehensive income attributable to:Owners of the parent 59 365 154 21 903 073
The notes on pages 14 to 49 are an integral part of these financial statements
for the year ended 29 February 2016
12
Ind
epen
den
t A
ud
itor’s
Rep
ort
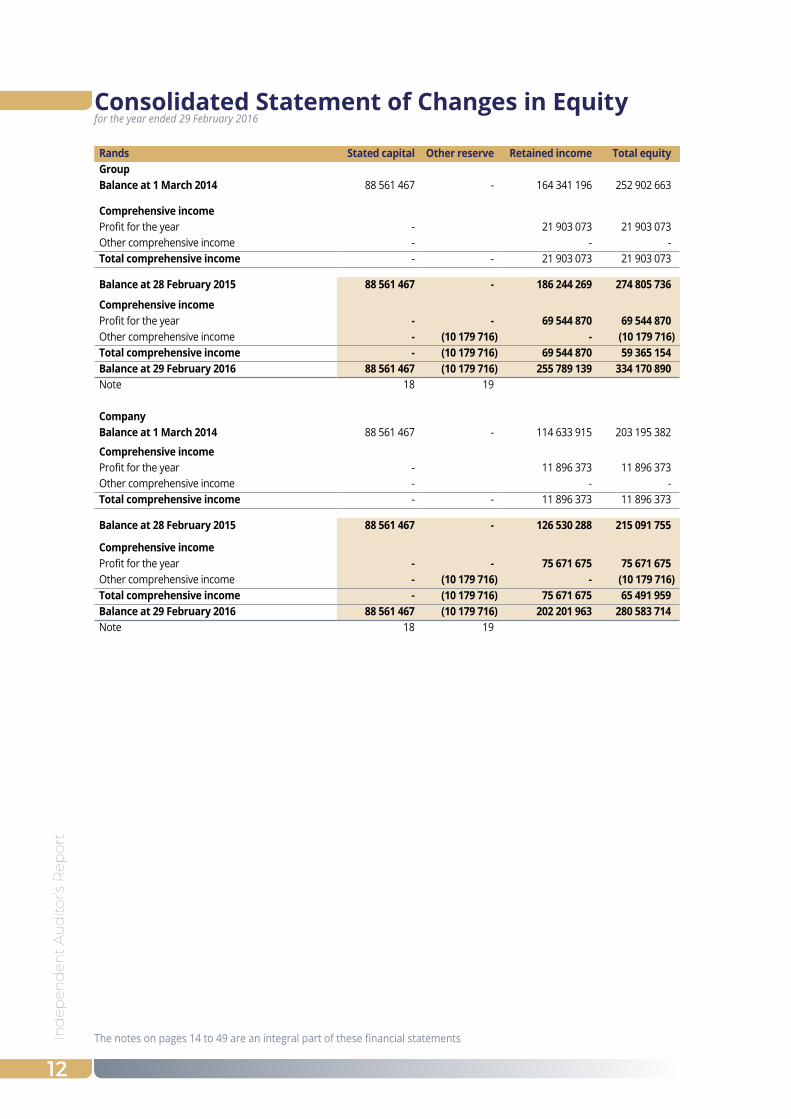
Rands Stated capital Other reserve Retained income Total equityGroupBalance at 1 March 2014 88 561 467 - 164 341 196 252 902 663
Comprehensive incomeProfit for the year - 21 903 073 21 903 073 Other comprehensive income - - - Total comprehensive income - - 21 903 073 21 903 073
Balance at 28 February 2015 88 561 467 - 186 244 269 274 805 736
Comprehensive incomeProfit for the year - - 69 544 870 69 544 870 Other comprehensive income - (10 179 716) - (10 179 716) Total comprehensive income - (10 179 716) 69 544 870 59 365 154 Balance at 29 February 2016 88 561 467 (10 179 716) 255 789 139 334 170 890 Note 18 19
CompanyBalance at 1 March 2014 88 561 467 - 114 633 915 203 195 382
Comprehensive incomeProfit for the year - 11 896 373 11 896 373 Other comprehensive income - - - Total comprehensive income - - 11 896 373 11 896 373
Balance at 28 February 2015 88 561 467 - 126 530 288 215 091 755
Comprehensive incomeProfit for the year - - 75 671 675 75 671 675 Other comprehensive income - (10 179 716) - (10 179 716) Total comprehensive income - (10 179 716) 75 671 675 65 491 959 Balance at 29 February 2016 88 561 467 (10 179 716) 202 201 963 280 583 714 Note 18 19
Consolidated Statement of Changes in Equity
The notes on pages 14 to 49 are an integral part of these financial statements
for the year ended 29 February 2016
Co
nso
lidate
d S
tatem
en
t of C
ash Flo
ws
13
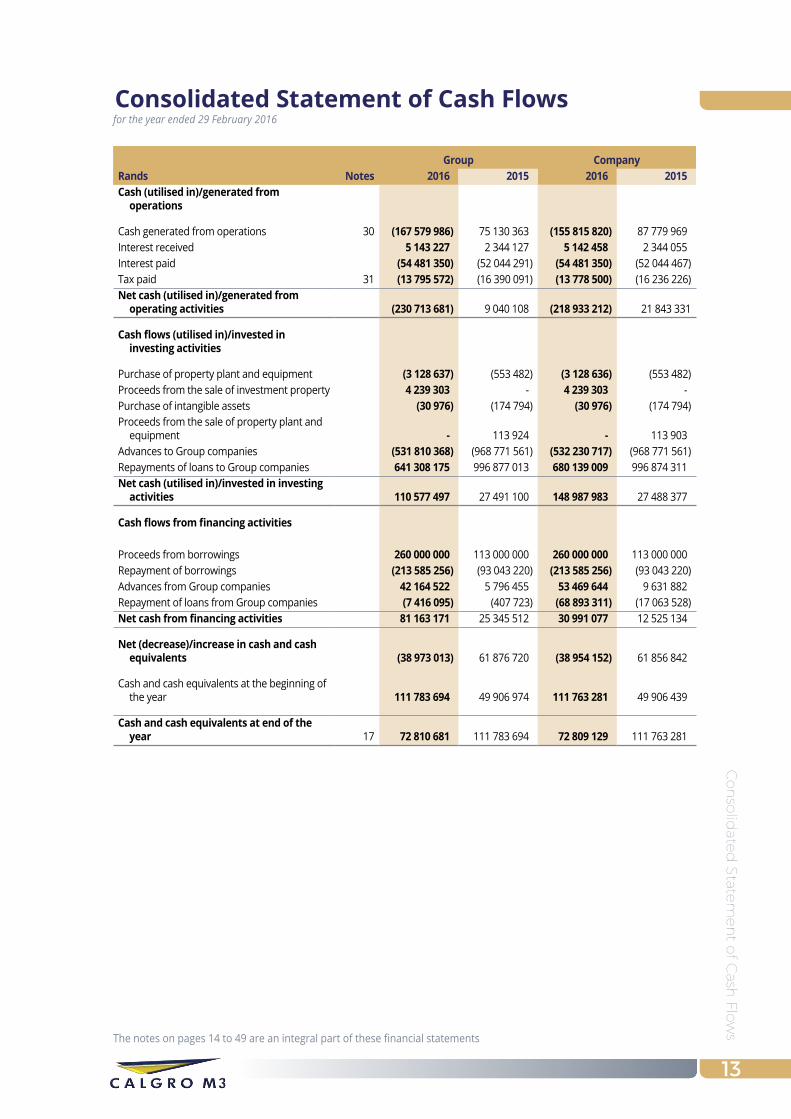
Consolidated Statement of Cash Flows
The notes on pages 14 to 49 are an integral part of these financial statements
Group CompanyRands Notes 2016 2015 2016 2015Cash (utilised in)/generated from
operations
Cash generated from operations 30 (167 579 986) 75 130 363 (155 815 820) 87 779 969 Interest received 5 143 227 2 344 127 5 142 458 2 344 055 Interest paid (54 481 350) (52 044 291) (54 481 350) (52 044 467) Tax paid 31 (13 795 572) (16 390 091) (13 778 500) (16 236 226) Net cash (utilised in)/generated from
operating activities (230 713 681) 9 040 108 (218 933 212) 21 843 331
Cash flows (utilised in)/invested in investing activities
Purchase of property plant and equipment (3 128 637) (553 482) (3 128 636) (553 482) Proceeds from the sale of investment property 4 239 303 - 4 239 303 - Purchase of intangible assets (30 976) (174 794) (30 976) (174 794) Proceeds from the sale of property plant and
equipment - 113 924 - 113 903 Advances to Group companies (531 810 368) (968 771 561) (532 230 717) (968 771 561) Repayments of loans to Group companies 641 308 175 996 877 013 680 139 009 996 874 311 Net cash (utilised in)/invested in investing
activities 110 577 497 27 491 100 148 987 983 27 488 377
Cash flows from financing activities
Proceeds from borrowings 260 000 000 113 000 000 260 000 000 113 000 000 Repayment of borrowings (213 585 256) (93 043 220) (213 585 256) (93 043 220) Advances from Group companies 42 164 522 5 796 455 53 469 644 9 631 882 Repayment of loans from Group companies (7 416 095) (407 723) (68 893 311) (17 063 528) Net cash from financing activities 81 163 171 25 345 512 30 991 077 12 525 134
Net (decrease)/increase in cash and cash equivalents (38 973 013) 61 876 720 (38 954 152) 61 856 842
Cash and cash equivalents at the beginning of the year 111 783 694 49 906 974 111 763 281 49 906 439
Cash and cash equivalents at end of the year 17 72 810 681 111 783 694 72 809 129 111 763 281
for the year ended 29 February 2016
No
tes
to t
he C
on
solid
ated
Fin
anci
al S
tate
men
ts
14
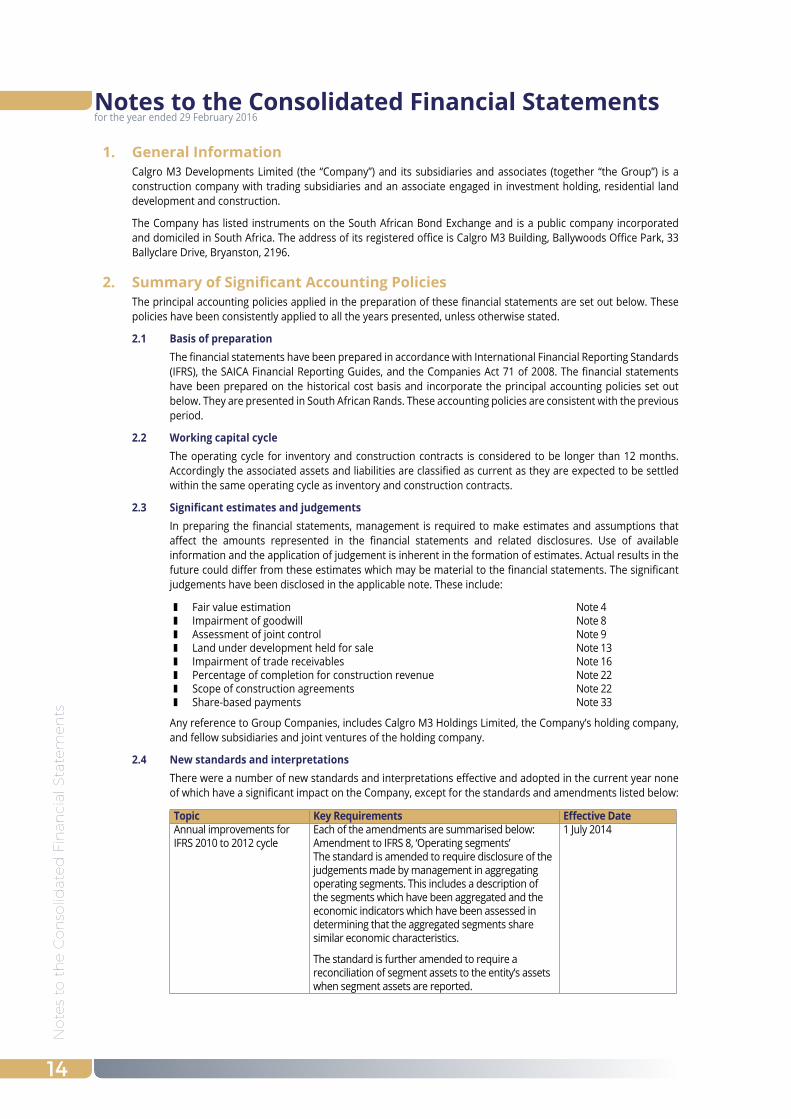
Notes to the Consolidated Financial Statements
1. General InformationCalgro M3 Developments Limited (the “Company”) and its subsidiaries and associates (together “the Group”) is a construction company with trading subsidiaries and an associate engaged in investment holding, residential land development and construction.
The Company has listed instruments on the South African Bond Exchange and is a public company incorporated and domiciled in South Africa. The address of its registered office is Calgro M3 Building, Ballywoods Office Park, 33 Ballyclare Drive, Bryanston, 2196.
2. Summary of Significant Accounting PoliciesThe principal accounting policies applied in the preparation of these financial statements are set out below. These policies have been consistently applied to all the years presented, unless otherwise stated.
2.1 Basis of preparationThe financial statements have been prepared in accordance with International Financial Reporting Standards (IFRS), the SAICA Financial Reporting Guides, and the Companies Act 71 of 2008. The financial statements have been prepared on the historical cost basis and incorporate the principal accounting policies set out below. They are presented in South African Rands. These accounting policies are consistent with the previous period.
2.2 Working capital cycleThe operating cycle for inventory and construction contracts is considered to be longer than 12 months. Accordingly the associated assets and liabilities are classified as current as they are expected to be settled within the same operating cycle as inventory and construction contracts.
2.3 Significant estimates and judgementsIn preparing the financial statements, management is required to make estimates and assumptions that affect the amounts represented in the financial statements and related disclosures. Use of available information and the application of judgement is inherent in the formation of estimates. Actual results in the future could differ from these estimates which may be material to the financial statements. The significant judgements have been disclosed in the applicable note. These include:
❚ Fair value estimation Note 4 ❚ Impairment of goodwill Note 8 ❚ Assessment of joint control Note 9 ❚ Land under development held for sale Note 13 ❚ Impairment of trade receivables Note 16 ❚ Percentage of completion for construction revenue Note 22 ❚ Scope of construction agreements Note 22 ❚ Share-based payments Note 33
Any reference to Group Companies, includes Calgro M3 Holdings Limited, the Company’s holding company, and fellow subsidiaries and joint ventures of the holding company.
2.4 New standards and interpretationsThere were a number of new standards and interpretations effective and adopted in the current year none of which have a significant impact on the Company, except for the standards and amendments listed below:
Topic Key Requirements Effective DateAnnual improvements for IFRS 2010 to 2012 cycle
Each of the amendments are summarised below:Amendment to IFRS 8, ‘Operating segments’The standard is amended to require disclosure of the judgements made by management in aggregating operating segments. This includes a description of the segments which have been aggregated and the economic indicators which have been assessed in determining that the aggregated segments share similar economic characteristics.
The standard is further amended to require a reconciliation of segment assets to the entity’s assets when segment assets are reported.
1 July 2014
for the year ended 29 February 2016
No
tes to
the C
on
solid
ated
Finan
cial State
men
ts
15
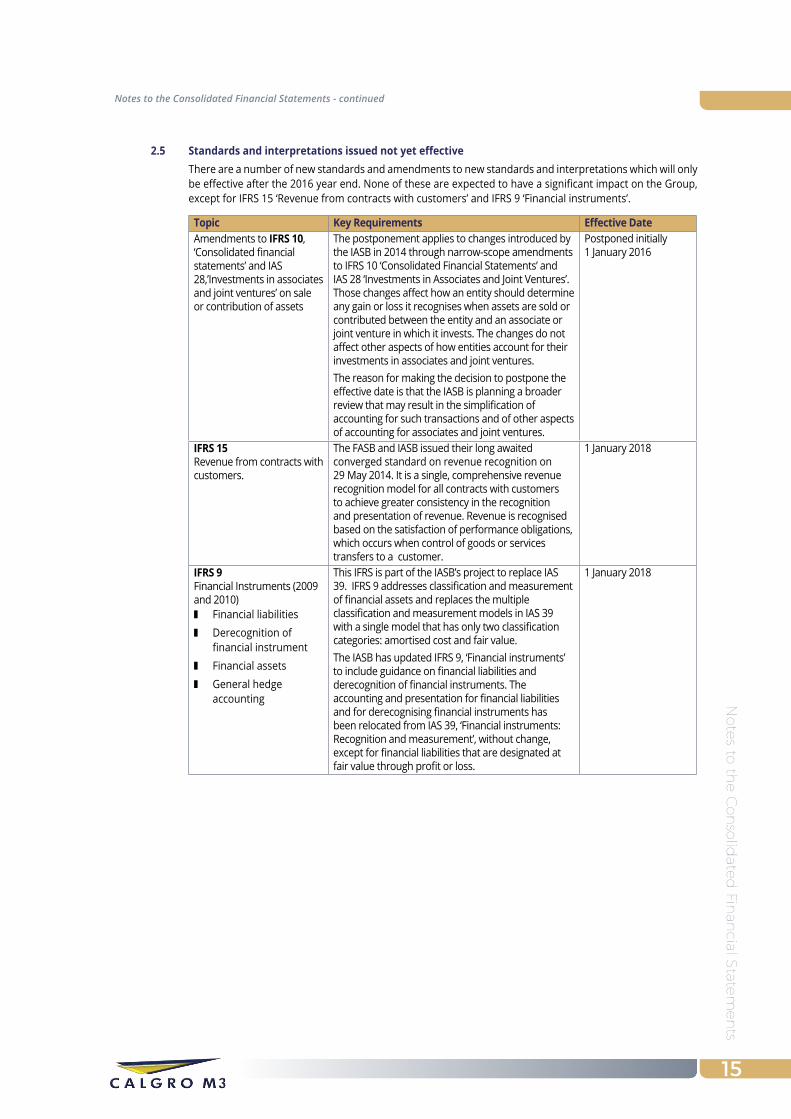
2.5 Standards and interpretations issued not yet effectiveThere are a number of new standards and amendments to new standards and interpretations which will only be effective after the 2016 year end. None of these are expected to have a significant impact on the Group, except for IFRS 15 ‘Revenue from contracts with customers’ and IFRS 9 ‘Financial instruments’.
Topic Key Requirements Effective DateAmendments to IFRS 10, ‘Consolidated financial statements’ and IAS 28,’Investments in associates and joint ventures’ on sale or contribution of assets
The postponement applies to changes introduced by the IASB in 2014 through narrow-scope amendments to IFRS 10 ‘Consolidated Financial Statements’ and IAS 28 ‘Investments in Associates and Joint Ventures’. Those changes affect how an entity should determine any gain or loss it recognises when assets are sold or contributed between the entity and an associate or joint venture in which it invests. The changes do not affect other aspects of how entities account for their investments in associates and joint ventures.The reason for making the decision to postpone the effective date is that the IASB is planning a broader review that may result in the simplification of accounting for such transactions and of other aspects of accounting for associates and joint ventures.
Postponed initially1 January 2016
IFRS 15Revenue from contracts with customers.
The FASB and IASB issued their long awaited converged standard on revenue recognition on 29 May 2014. It is a single, comprehensive revenue recognition model for all contracts with customers to achieve greater consistency in the recognition and presentation of revenue. Revenue is recognised based on the satisfaction of performance obligations, which occurs when control of goods or services transfers to a customer.
1 January 2018
IFRS 9Financial Instruments (2009 and 2010) ❚ Financial liabilities ❚ Derecognition of
financial instrument ❚ Financial assets ❚ General hedge
accounting
This IFRS is part of the IASB’s project to replace IAS 39. IFRS 9 addresses classification and measurement of financial assets and replaces the multiple classification and measurement models in IAS 39 with a single model that has only two classification categories: amortised cost and fair value.The IASB has updated IFRS 9, ‘Financial instruments’ to include guidance on financial liabilities and derecognition of financial instruments. The accounting and presentation for financial liabilities and for derecognising financial instruments has been relocated from IAS 39, ‘Financial instruments: Recognition and measurement’, without change, except for financial liabilities that are designated at fair value through profit or loss.
1 January 2018
Notes to the Consolidated Financial Statements - continued
No
tes
to t
he C
on
solid
ated
Fin
anci
al S
tate
men
ts
16
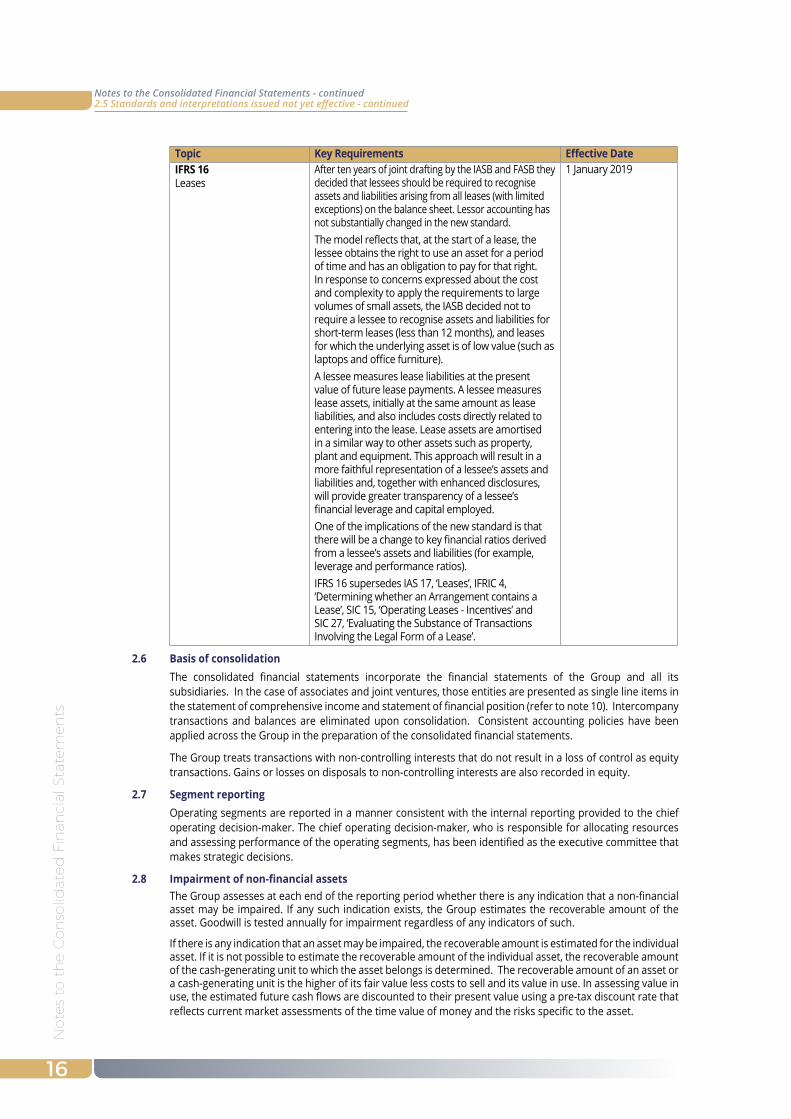
2.5 Standards and interpretations issued not yet effective - continued
Topic Key Requirements Effective DateIFRS 16Leases
After ten years of joint drafting by the IASB and FASB they decided that lessees should be required to recognise assets and liabilities arising from all leases (with limited exceptions) on the balance sheet. Lessor accounting has not substantially changed in the new standard.The model reflects that, at the start of a lease, the lessee obtains the right to use an asset for a period of time and has an obligation to pay for that right. In response to concerns expressed about the cost and complexity to apply the requirements to large volumes of small assets, the IASB decided not to require a lessee to recognise assets and liabilities for short-term leases (less than 12 months), and leases for which the underlying asset is of low value (such as laptops and office furniture).A lessee measures lease liabilities at the present value of future lease payments. A lessee measures lease assets, initially at the same amount as lease liabilities, and also includes costs directly related to entering into the lease. Lease assets are amortised in a similar way to other assets such as property, plant and equipment. This approach will result in a more faithful representation of a lessee’s assets and liabilities and, together with enhanced disclosures, will provide greater transparency of a lessee’s financial leverage and capital employed.One of the implications of the new standard is that there will be a change to key financial ratios derived from a lessee’s assets and liabilities (for example, leverage and performance ratios).IFRS 16 supersedes IAS 17, ‘Leases’, IFRIC 4, ‘Determining whether an Arrangement contains a Lease’, SIC 15, ‘Operating Leases - Incentives’ and SIC 27, ‘Evaluating the Substance of Transactions Involving the Legal Form of a Lease’.
1 January 2019
2.6 Basis of consolidationThe consolidated financial statements incorporate the financial statements of the Group and all its subsidiaries. In the case of associates and joint ventures, those entities are presented as single line items in the statement of comprehensive income and statement of financial position (refer to note 10). Intercompany transactions and balances are eliminated upon consolidation. Consistent accounting policies have been applied across the Group in the preparation of the consolidated financial statements.
The Group treats transactions with non-controlling interests that do not result in a loss of control as equity transactions. Gains or losses on disposals to non-controlling interests are also recorded in equity.
2.7 Segment reportingOperating segments are reported in a manner consistent with the internal reporting provided to the chief operating decision-maker. The chief operating decision-maker, who is responsible for allocating resources and assessing performance of the operating segments, has been identified as the executive committee that makes strategic decisions.
2.8 Impairment of non-financial assetsThe Group assesses at each end of the reporting period whether there is any indication that a non-financial asset may be impaired. If any such indication exists, the Group estimates the recoverable amount of the asset. Goodwill is tested annually for impairment regardless of any indicators of such.
If there is any indication that an asset may be impaired, the recoverable amount is estimated for the individual asset. If it is not possible to estimate the recoverable amount of the individual asset, the recoverable amount of the cash-generating unit to which the asset belongs is determined. The recoverable amount of an asset or a cash-generating unit is the higher of its fair value less costs to sell and its value in use. In assessing value in use, the estimated future cash flows are discounted to their present value using a pre-tax discount rate that reflects current market assessments of the time value of money and the risks specific to the asset.
Notes to the Consolidated Financial Statements - continued
No
tes to
the C
on
solid
ated
Finan
cial State
men
ts
17
If the recoverable amount of an individual non-financial asset is less than its carrying amount, the carrying amount of the asset is reduced to its recoverable amount. That reduction is an impairment loss and is recognised directly in profit or loss.
Impairment losses recognised in respect of cash-generating units are allocated first to reduce the carrying amount of any goodwill allocated to the units and then to reduce the carrying amounts of the other assets in the unit on a pro rata basis.
When an impairment loss subsequently reverses, the carrying amount of the asset (or cash-generating unit) is increased to the revised estimate of its recoverable amount, but limited to the carrying amount that would have been determined had no impairment loss been recognised for the asset (or cash-generating unit) in prior years. A reversal of an impairment loss is recognised immediately in profit or loss. An impairment loss in respect of goodwill is not reversed.
2.9 Provisions and contingenciesProvisions are recognised when there is a present legal or constructive obligation as a result of a past event for which it is more likely than not that an outflow of resources will be required to settle the obligation and a reliable estimate can be made of the amount of the obligation. The amount of a provision is the present value of the expenditure expected to be required to settle the obligation.
Contingent assets and contingent liabilities are not recognised.
2.10 Foreign currency translation(a) Functional and presentation currency
Items included in the financial statements of each of the Group’s entities are measured using the currency of the primary economic environment in which the entity operates (‘the functional currency’). The consolidated financial statements are presented in South African Rands, which is the Group’s presentation currency.
(b) Group companiesThe results and financial position of all the Group entities (none of which has the currency of a hyper-inflationary economy) that have a functional currency different from the presentation currency are translated into the presentation currency as follows:(i) assets and liabilities for each balance sheet presented are translated at the closing rate at the date
of that balance sheet;(ii) income and expenses for each income statement are translated at average exchange rates (unless
this average is not a reasonable approximation of the cumulative effect of the rates prevailing on the transaction dates, in which case income and expenses are translated at the rate on the dates of the transactions); and
(iii) all resulting exchange differences are recognised in other comprehensive income.
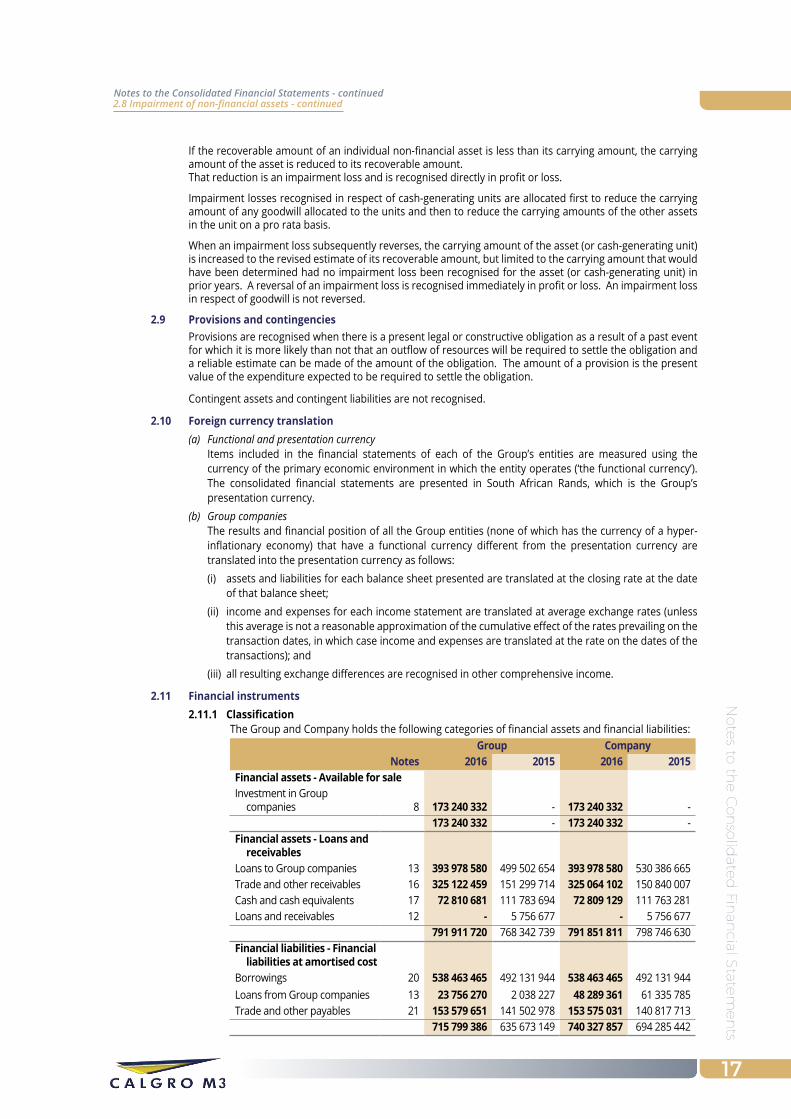
2.11 Financial instruments2.11.1 Classification
The Group and Company holds the following categories of financial assets and financial liabilities:Group Company
Notes 2016 2015 2016 2015Financial assets - Available for saleInvestment in Group
companies 8 173 240 332 - 173 240 332 - 173 240 332 - 173 240 332 -
Financial assets - Loans and receivables
Loans to Group companies 13 393 978 580 499 502 654 393 978 580 530 386 665 Trade and other receivables 16 325 122 459 151 299 714 325 064 102 150 840 007 Cash and cash equivalents 17 72 810 681 111 783 694 72 809 129 111 763 281 Loans and receivables 12 - 5 756 677 - 5 756 677
791 911 720 768 342 739 791 851 811 798 746 630 Financial liabilities - Financial
liabilities at amortised costBorrowings 20 538 463 465 492 131 944 538 463 465 492 131 944 Loans from Group companies 13 23 756 270 2 038 227 48 289 361 61 335 785 Trade and other payables 21 153 579 651 141 502 978 153 575 031 140 817 713
715 799 386 635 673 149 740 327 857 694 285 442
2.8 Impairment of non-financial assets - continuedNotes to the Consolidated Financial Statements - continued
No
tes
to t
he C
on
solid
ated
Fin
anci
al S
tate
men
ts
18
2.11.2 Initial recognition and measurementAt initial recognition, the Group measures a financial asset at its fair value plus, transaction costs that are directly attributable to the acquisition of the financial asset. The Group does not have any financial assets classified at fair value through profit or loss. When securities classified as available-for-sale are sold, the accumulated fair value adjustments recognised in other comprehensive income are reclassified to profit or loss as gains and losses from investment securities.
2.11.3 Subsequent measurementLoans and receivables and held-to-maturity investments are subsequently carried at amortised cost using the effective interest method.Available-for-sale financial assets are subsequently carried at fair value. Gains or losses arising from changes in the fair value are recognised in other comprehensive income and accumulated in a separate reserve within equity.All of the Group’s financial liabilities are classified as ‘financial liabilities at amortised cost’ and are therefore subsequently measured at amortised cost.
2.11.4 Impairment of financial assetsAssets carried at amortised costsFinancial assets carried at amortised cost are reviewed for impairment whenever events or changes in circumstances indicate the carrying amount may not be recoverable. Impairment is normally determined based on a realistic assessment of future cash flows discounted using the original effective interest rate compared with contractual amounts. For amounts due to the Group, significant financial difficulties of the debtor, probability that the debtor will enter bankruptcy and default of payments are all considered indicators of impairment. Impairment losses are recognised in profit or loss.The Group’s trade receivables are impaired through use of an allowance account. The amount of the loss is recognised in profit or loss within administrative expenses. When the trade receivable is written off, it is written-off against the relevant allowance account. Subsequent recoveries of amounts previously written off are credited against administrative expenses.
Assets classified as available for saleIf there is objective evidence of impairment for available-for-sale financial assets, the cumulative loss – measured as the difference between the acquisition cost and the current fair value, less any impairment loss on that financial asset previously recognised in profit or loss – is removed from equity and recognised in profit or loss.Impairment losses on equity instruments that were recognised in profit or loss are not reversed through profit or loss in a subsequent period.The Group and Company’s activities expose it to a variety of financial risks: market risk (including cash flow interest rate risk), credit risk and liquidity risk.Risk management is carried out by the executive committee and identifies and evaluates financial risks in close-co-operation with the Group and Company’s operating units. The Board of Directors are responsible for overall risk management, as well as guidance covering specific areas, such as interest rate risk and credit risk, and investment of excess liquidity.
Notes to the Consolidated Financial Statements - continued2.11 Financial Instruments - continued
No
tes to
the C
on
solid
ated
Finan
cial State
men
ts
19
3. Risk Management3.1 Financial risk management
(a) Market risk (cash flow interest rate risk) The Group and Company’s interest rate risk arises mainly from borrowings and loans from Group
companies. (refer to note 13 and 20). The interest rate exposure is monitored and managed by the executive committee and will not be hedged
to limit interest rate risk. The executive committee monitors the cash flows relating to borrowings and loans from Group companies i.e. interest paid, more so than the changes in the interest rate. Refer to the statement of cash flows for more information on finance costs paid.
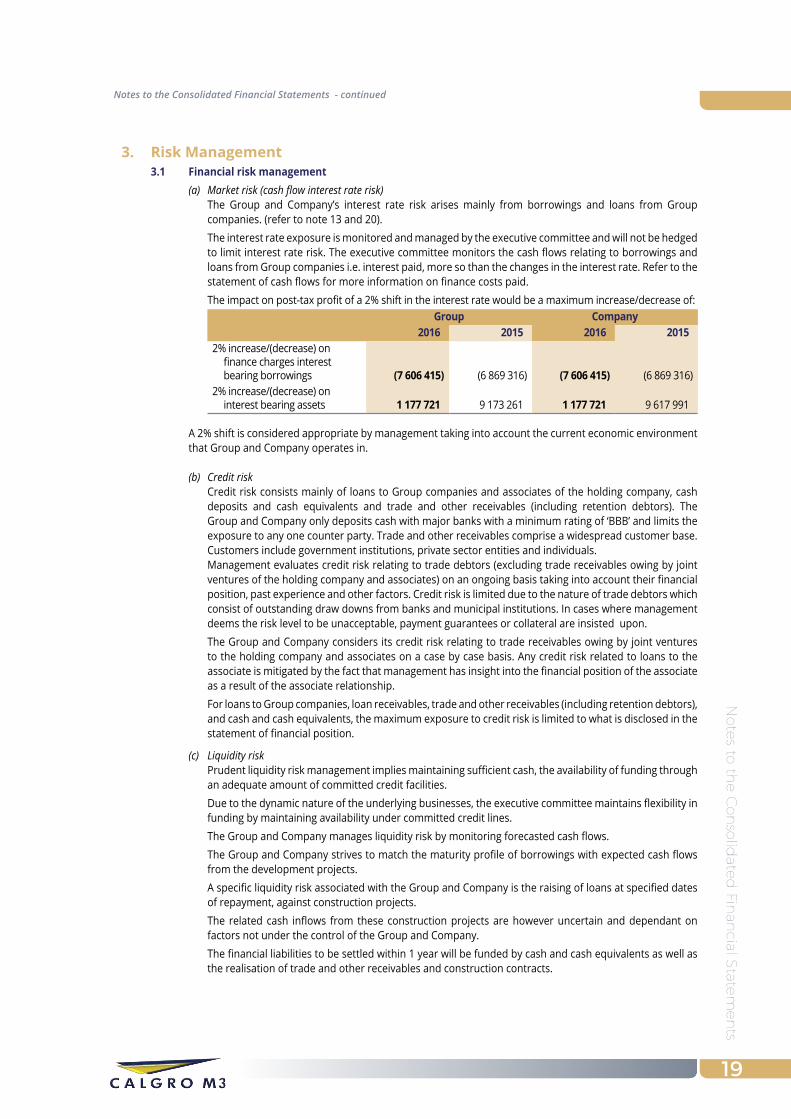
The impact on post-tax profit of a 2% shift in the interest rate would be a maximum increase/decrease of:Group Company
2016 2015 2016 20152% increase/(decrease) on
finance charges interest bearing borrowings (7 606 415) (6 869 316) (7 606 415) (6 869 316)
2% increase/(decrease) on interest bearing assets 1 177 721 9 173 261 1 177 721 9 617 991
A 2% shift is considered appropriate by management taking into account the current economic environmentthat Group and Company operates in.
(b) Credit risk Credit risk consists mainly of loans to Group companies and associates of the holding company, cash
deposits and cash equivalents and trade and other receivables (including retention debtors). The Group and Company only deposits cash with major banks with a minimum rating of ‘BBB’ and limits the exposure to any one counter party. Trade and other receivables comprise a widespread customer base.Customers include government institutions, private sector entities and individuals.
Management evaluates credit risk relating to trade debtors (excluding trade receivables owing by joint ventures of the holding company and associates) on an ongoing basis taking into account their financial position, past experience and other factors. Credit risk is limited due to the nature of trade debtors which consist of outstanding draw downs from banks and municipal institutions. In cases where management deems the risk level to be unacceptable, payment guarantees or collateral are insisted upon.
The Group and Company considers its credit risk relating to trade receivables owing by joint ventures to the holding company and associates on a case by case basis. Any credit risk related to loans to the associate is mitigated by the fact that management has insight into the financial position of the associate as a result of the associate relationship.
For loans to Group companies, loan receivables, trade and other receivables (including retention debtors), and cash and cash equivalents, the maximum exposure to credit risk is limited to what is disclosed in the statement of financial position.
(c) Liquidity risk Prudent liquidity risk management implies maintaining sufficient cash, the availability of funding through
an adequate amount of committed credit facilities. Due to the dynamic nature of the underlying businesses, the executive committee maintains flexibility in
funding by maintaining availability under committed credit lines. The Group and Company manages liquidity risk by monitoring forecasted cash flows. The Group and Company strives to match the maturity profile of borrowings with expected cash flows
from the development projects. A specific liquidity risk associated with the Group and Company is the raising of loans at specified dates
of repayment, against construction projects. The related cash inflows from these construction projects are however uncertain and dependant on
factors not under the control of the Group and Company. The financial liabilities to be settled within 1 year will be funded by cash and cash equivalents as well as
the realisation of trade and other receivables and construction contracts.
Notes to the Consolidated Financial Statements - continued

No
tes
to t
he C
on
solid
ated
Fin
anci
al S
tate
men
ts
20
The table below analyses the Group and Company’s financial liabilities into relevant maturity groupings based on the remaining period at the reporting period date to the contractual maturity date.
The amounts disclosed in the table are the contractual undiscounted cash flows. Balances due within twelve months equal their carrying balances as the impact of discounting is not significant.
Group
2016Less than
1 yearBetween 1
and 2 yearsBetween 2
and 3 yearsBetween 3
and 4 yearsBetween 4
and 5 years totalBorrowings (including
future interest) 250 942 496 174 028 379 116 159 670 10 304 365 97 728 274 649 163 184 Loans from Group
companies - - - - - - Trade and other payables 153 579 651 - - - - 153 579 651
404 522 147 174 028 379 116 159 670 10 304 365 97 728 274 802 742 835
2015Borrowings (including
future interest) 66 254 785 364 086 691 160 293 504 - - 524 380 195 Loans from Group
companies 2 038 227 - - - - 2 038 227 Trade and other payables 141 502 978 - - - - 141 502 978
209 795 990 364 086 691 160 293 504 - - 667 921 400
Company
2016Less than
1 yearBetween 1
and 2 yearsBetween 2
and 3 yearsBetween 3
and 4 yearsBetween 4
and 5 years totalBorrowings (including
future interest) 250 942 496 174 028 379 116 159 670 10 304 365 97 728 274 649 163 184 Loans from Group
companies - - - - - - Trade and other payables 153 575 031 - - - - 153 575 031
404 517 527 174 028 379 116 159 670 10 304 365 97 728 274 802 738 215
2015Borrowings (including
future interest) 66 254 785 364 086 691 160 293 504 - - 590 634 980 Loans from Group
companies 61 335 785 - - - - 61 335 785 Trade and other payables 140 817 713 - - - - 140 817 713
268 408 283 364 086 691 160 293 504 - - 792 788 478
The above amounts will be repaid by utilising cash generated from operations, available cash, working capital facilities and the refinancing of borrowings.
The Group and Company has overdraft facilities with major banks to the value of R60 000 000 (2015 - R40 000 000)
3.2 Capital risk management The Group’s and Company’s objectives when managing capital are to safeguard the Group’s ability to continue as
a going concern in order to provide returns for shareholders and benefits for other stakeholders. Management’s intention is to use debt as a means to fund operations rather than to raise more capital.
The Group monitors capital on the basis of its debt/equity ratio. The maximum allowed Debt/Equity ratio for the Group is 1.5 : 1
Debt/equity ratioThis ratio is calculated as net debt divided by equity. Net debt is calculated as total borrowings less cash and cash equivalents. Equity is calculated as the total equity per the statement of financial position.
3. Risk Management - continuedNotes to the Consolidated Financial Statements - continued
No
tes to
the C
on
solid
ated
Finan
cial State
men
ts
21
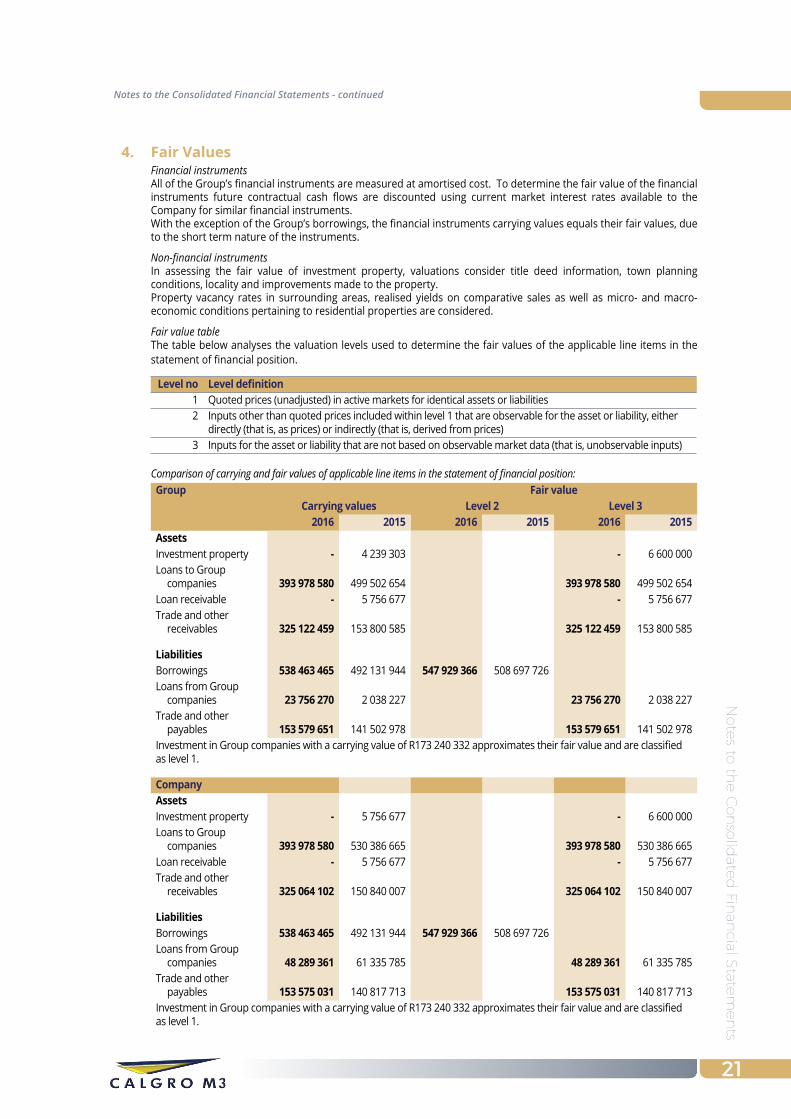
4. Fair ValuesFinancial instrumentsAll of the Group’s financial instruments are measured at amortised cost. To determine the fair value of the financial instruments future contractual cash flows are discounted using current market interest rates available to the Company for similar financial instruments. With the exception of the Group’s borrowings, the financial instruments carrying values equals their fair values, due to the short term nature of the instruments.
Non-financial instrumentsIn assessing the fair value of investment property, valuations consider title deed information, town planning conditions, locality and improvements made to the property. Property vacancy rates in surrounding areas, realised yields on comparative sales as well as micro- and macro-economic conditions pertaining to residential properties are considered.
Fair value tableThe table below analyses the valuation levels used to determine the fair values of the applicable line items in the statement of financial position.
Level no Level definition1 Quoted prices (unadjusted) in active markets for identical assets or liabilities2 Inputs other than quoted prices included within level 1 that are observable for the asset or liability, either
directly (that is, as prices) or indirectly (that is, derived from prices)3 Inputs for the asset or liability that are not based on observable market data (that is, unobservable inputs)
Comparison of carrying and fair values of applicable line items in the statement of financial position: Group Fair value
Carrying values Level 2 Level 32016 2015 2016 2015 2016 2015
AssetsInvestment property - 4 239 303 - 6 600 000 Loans to Group
companies 393 978 580 499 502 654 393 978 580 499 502 654 Loan receivable - 5 756 677 - 5 756 677 Trade and other
receivables 325 122 459 153 800 585 325 122 459 153 800 585
LiabilitiesBorrowings 538 463 465 492 131 944 547 929 366 508 697 726 Loans from Group
companies 23 756 270 2 038 227 23 756 270 2 038 227 Trade and other
payables 153 579 651 141 502 978 153 579 651 141 502 978 Investment in Group companies with a carrying value of R173 240 332 approximates their fair value and are classified as level 1.
CompanyAssetsInvestment property - 5 756 677 - 6 600 000 Loans to Group
companies 393 978 580 530 386 665 393 978 580 530 386 665 Loan receivable - 5 756 677 - 5 756 677 Trade and other
receivables 325 064 102 150 840 007 325 064 102 150 840 007
LiabilitiesBorrowings 538 463 465 492 131 944 547 929 366 508 697 726 Loans from Group
companies 48 289 361 61 335 785 48 289 361 61 335 785 Trade and other
payables 153 575 031 140 817 713 153 575 031 140 817 713 Investment in Group companies with a carrying value of R173 240 332 approximates their fair value and are classified as level 1.
Notes to the Consolidated Financial Statements - continued

No
tes
to t
he C
on
solid
ated
Fin
anci
al S
tate
men
ts
22
5. Investment Property
Accounting policyThe Group owned two townhouses that were held to earn long-term rental income and for capital appreciation.The investment property is initially recognised at cost and subsequently measured at cost less accumulated depreciation and impairment losses. Depreciation is provided to write down the cost, less estimated residual value over the useful life, which is 20 years for the townhouses. The cost of land is not depreciated.The residual value of buildings exceeds the carrying amount, as a result, no depreciation has been provided.
Group and Company 2016 2015
CostAccumulated depreciation
Carrying amount Cost
Accumulated depreciation
Carrying amount
Investment property - - - 4 239 303 - 4 239 303
Group and CompanyThe two investment properties held were disposed in the current year.Land and buildings under investment property had a fair value of RNil (2015 - R4 650 000). The fair value was based on a valuation by an independent valuer who held a recognised and relevant professional qualification and had recent experience in the location and category of the investment property being valued.Rental income received in respect of investment property amounts to Rnil (2015 - R252 000). Refer to note 24.A register containing the information required by Regulation 25(3) of the Companies Regulations, 2011 is available for inspection at the registered office of the Company.
6. Property, Plant and EquipmentAccounting policyThe Group’s long life assets mainly provide the infrastructure to enable the Group to operate. The assets are initially measured at cost. The cost of the assets are then recognised in the statement of comprehensive income over the useful lives of the assets as a depreciation charge.The useful lives of the assets have been assessed as follows:Item Average useful life - Plant and machinery, motor vehicles 5 years - Leasehold improvements 10 years - Furniture and fixtures and office equipment 6 years - IT Equipment 3 years
Group 2016 2015
CostAccumulated depreciation
Carrying amount Cost
Accumulated depreciation
Carrying amount
Plant and machinery 3 040 636 (2 848 911) 191 725 3 111 292 (2 419 981) 691 311 Furniture and
fixtures 811 734 (173 161) 638 573 273 026 (96 376) 176 650 Motor vehicles 190 263 (152 212) 38 051 327 098 (244 047) 83 051 Office equipment 840 569 (196 250) 644 319 375 977 (117 177) 258 800 IT equipment 899 840 (529 295) 370 545 937 115 (462 317) 474 798 Leasehold
improvements 1 863 671 (102 477) 1 761 194 31 945 (2 662) 29 283 total 7 646 713 (4 002 306) 3 644 407 5 056 453 (3 342 560) 1 713 893
CompanyPlant and machinery 3 040 636 (2 848 911) 191 725 3 111 291 (2 419 980) 691 311 Furniture and
fixtures 811 734 (173 162) 638 572 256 826 (87 602) 169 224 Motor vehicles 190 263 (152 211) 38 052 327 099 (244 046) 83 053 Office equipment 840 569 (196 250) 644 319 329 477 (97 802) 231 675 IT equipment 899 840 (529 295) 370 545 937 116 (462 318) 474 798 Leasehold
improvements 1 863 671 (102 477) 1 761 194 31 945 (2 662) 29 283 total 7 646 713 (4 002 306) 3 644 407 4 993 754 (3 314 410) 1 679 344
Notes to the Consolidated Financial Statements - continued
No
tes to
the C
on
solid
ated
Finan
cial State
men
ts
23
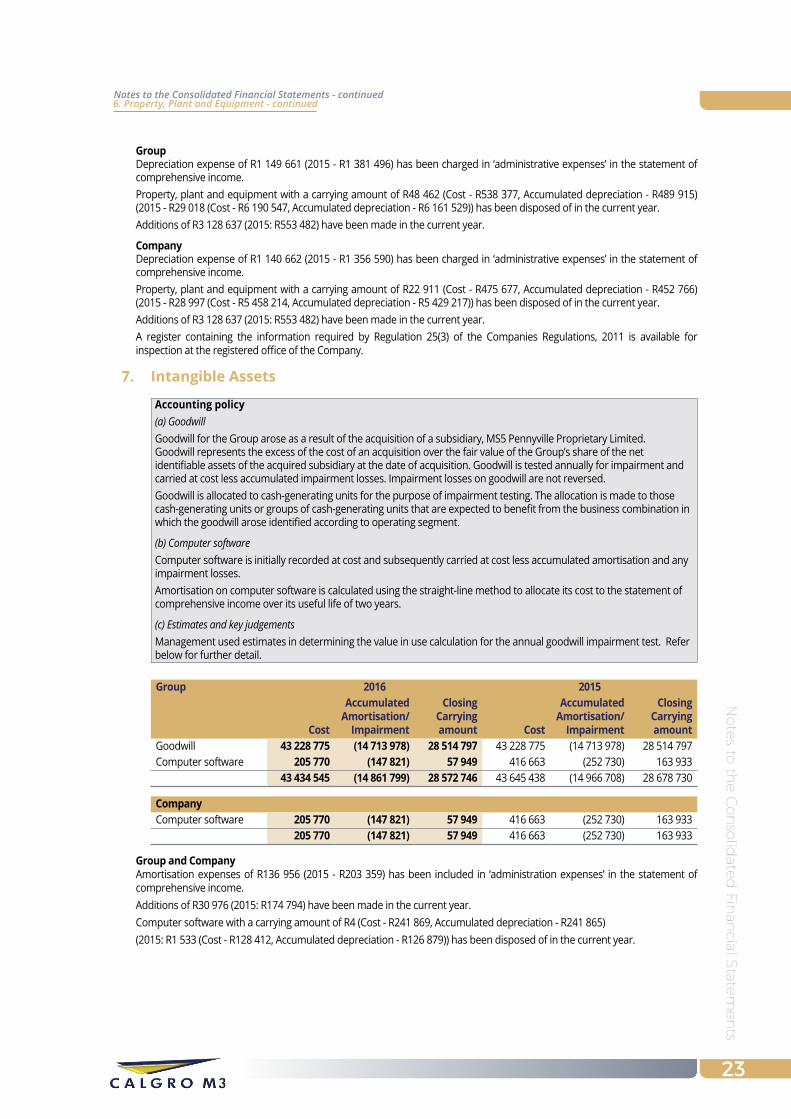
GroupDepreciation expense of R1 149 661 (2015 - R1 381 496) has been charged in ‘administrative expenses’ in the statement of comprehensive income.Property, plant and equipment with a carrying amount of R48 462 (Cost - R538 377, Accumulated depreciation - R489 915) (2015 - R29 018 (Cost - R6 190 547, Accumulated depreciation - R6 161 529)) has been disposed of in the current year.Additions of R3 128 637 (2015: R553 482) have been made in the current year.
CompanyDepreciation expense of R1 140 662 (2015 - R1 356 590) has been charged in ‘administrative expenses’ in the statement of comprehensive income.Property, plant and equipment with a carrying amount of R22 911 (Cost - R475 677, Accumulated depreciation - R452 766) (2015 - R28 997 (Cost - R5 458 214, Accumulated depreciation - R5 429 217)) has been disposed of in the current year.Additions of R3 128 637 (2015: R553 482) have been made in the current year.A register containing the information required by Regulation 25(3) of the Companies Regulations, 2011 is available for inspection at the registered office of the Company.
7. Intangible Assets
Accounting policy(a) Goodwill Goodwill for the Group arose as a result of the acquisition of a subsidiary, MS5 Pennyville Proprietary Limited.Goodwill represents the excess of the cost of an acquisition over the fair value of the Group’s share of the net identifiable assets of the acquired subsidiary at the date of acquisition. Goodwill is tested annually for impairment and carried at cost less accumulated impairment losses. Impairment losses on goodwill are not reversed.Goodwill is allocated to cash-generating units for the purpose of impairment testing. The allocation is made to those cash-generating units or groups of cash-generating units that are expected to benefit from the business combination in which the goodwill arose identified according to operating segment.
(b) Computer softwareComputer software is initially recorded at cost and subsequently carried at cost less accumulated amortisation and any impairment losses.Amortisation on computer software is calculated using the straight-line method to allocate its cost to the statement of comprehensive income over its useful life of two years.
(c) Estimates and key judgementsManagement used estimates in determining the value in use calculation for the annual goodwill impairment test. Refer below for further detail.
Group 2016 2015
Cost
Accumulated Amortisation/
Impairment
Closing Carrying amount Cost
Accumulated Amortisation/
Impairment
Closing Carrying amount
Goodwill 43 228 775 (14 713 978) 28 514 797 43 228 775 (14 713 978) 28 514 797 Computer software 205 770 (147 821) 57 949 416 663 (252 730) 163 933
43 434 545 (14 861 799) 28 572 746 43 645 438 (14 966 708) 28 678 730
CompanyComputer software 205 770 (147 821) 57 949 416 663 (252 730) 163 933
205 770 (147 821) 57 949 416 663 (252 730) 163 933
Group and CompanyAmortisation expenses of R136 956 (2015 - R203 359) has been included in ‘administration expenses’ in the statement of comprehensive income.Additions of R30 976 (2015: R174 794) have been made in the current year.Computer software with a carrying amount of R4 (Cost - R241 869, Accumulated depreciation - R241 865) (2015: R1 533 (Cost - R128 412, Accumulated depreciation - R126 879)) has been disposed of in the current year.
6. Property, Plant and Equipment - continuedNotes to the Consolidated Financial Statements - continued
No
tes
to t
he C
on
solid
ated
Fin
anci
al S
tate
men
ts
24
7. Intangible Assets - continued
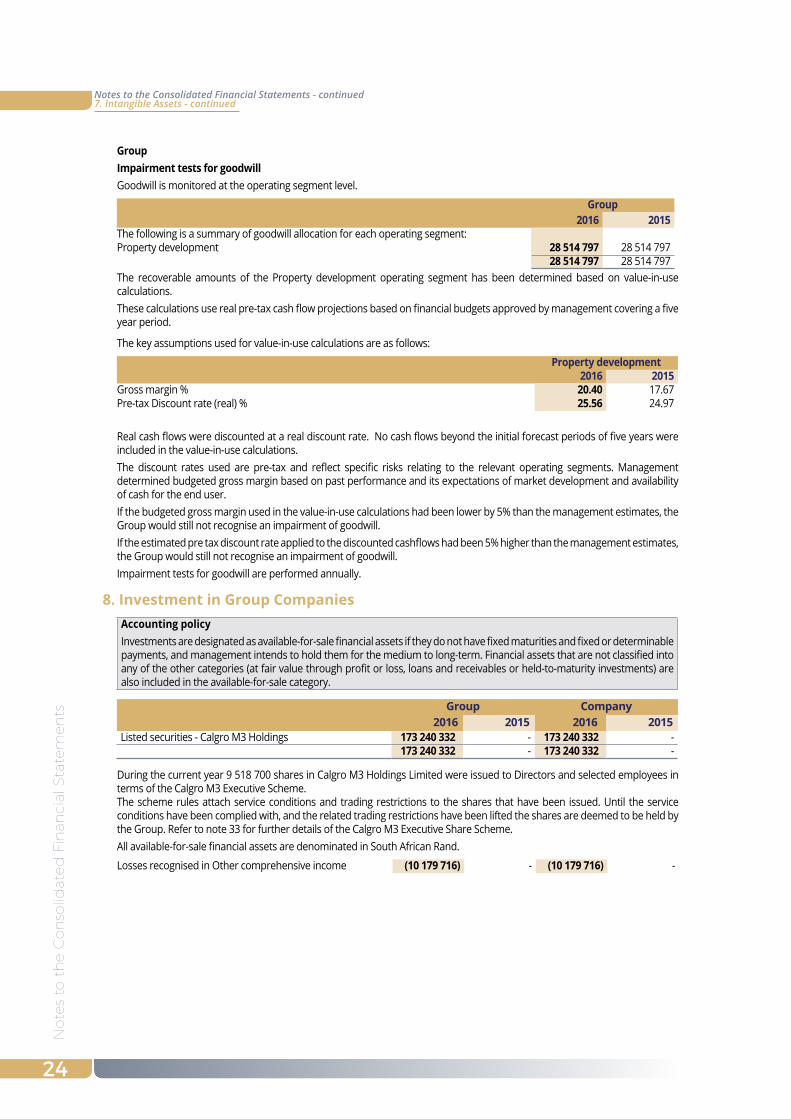
Group Impairment tests for goodwillGoodwill is monitored at the operating segment level.
Group2016 2015
The following is a summary of goodwill allocation for each operating segment:Property development 28 514 797 28 514 797
28 514 797 28 514 797 The recoverable amounts of the Property development operating segment has been determined based on value-in-use calculations. These calculations use real pre-tax cash flow projections based on financial budgets approved by management covering a five year period.
The key assumptions used for value-in-use calculations are as follows:
Property development2016 2015
Gross margin % 20.40 17.67Pre-tax Discount rate (real) % 25.56 24.97
Real cash flows were discounted at a real discount rate. No cash flows beyond the initial forecast periods of five years were included in the value-in-use calculations.The discount rates used are pre-tax and reflect specific risks relating to the relevant operating segments. Management determined budgeted gross margin based on past performance and its expectations of market development and availability of cash for the end user.If the budgeted gross margin used in the value-in-use calculations had been lower by 5% than the management estimates, the Group would still not recognise an impairment of goodwill.If the estimated pre tax discount rate applied to the discounted cashflows had been 5% higher than the management estimates, the Group would still not recognise an impairment of goodwill.Impairment tests for goodwill are performed annually.
8. Investment in Group CompaniesAccounting policyInvestments are designated as available-for-sale financial assets if they do not have fixed maturities and fixed or determinable payments, and management intends to hold them for the medium to long-term. Financial assets that are not classified into any of the other categories (at fair value through profit or loss, loans and receivables or held-to-maturity investments) are also included in the available-for-sale category.
Group Company2016 2015 2016 2015
Listed securities - Calgro M3 Holdings 173 240 332 - 173 240 332 - 173 240 332 - 173 240 332 -
During the current year 9 518 700 shares in Calgro M3 Holdings Limited were issued to Directors and selected employees in terms of the Calgro M3 Executive Scheme. The scheme rules attach service conditions and trading restrictions to the shares that have been issued. Until the service conditions have been complied with, and the related trading restrictions have been lifted the shares are deemed to be held by the Group. Refer to note 33 for further details of the Calgro M3 Executive Share Scheme.All available-for-sale financial assets are denominated in South African Rand.
Losses recognised in Other comprehensive income (10 179 716) - (10 179 716) -
Notes to the Consolidated Financial Statements - continued
No
tes to
the C
on
solid
ated
Finan
cial State
men
ts
25
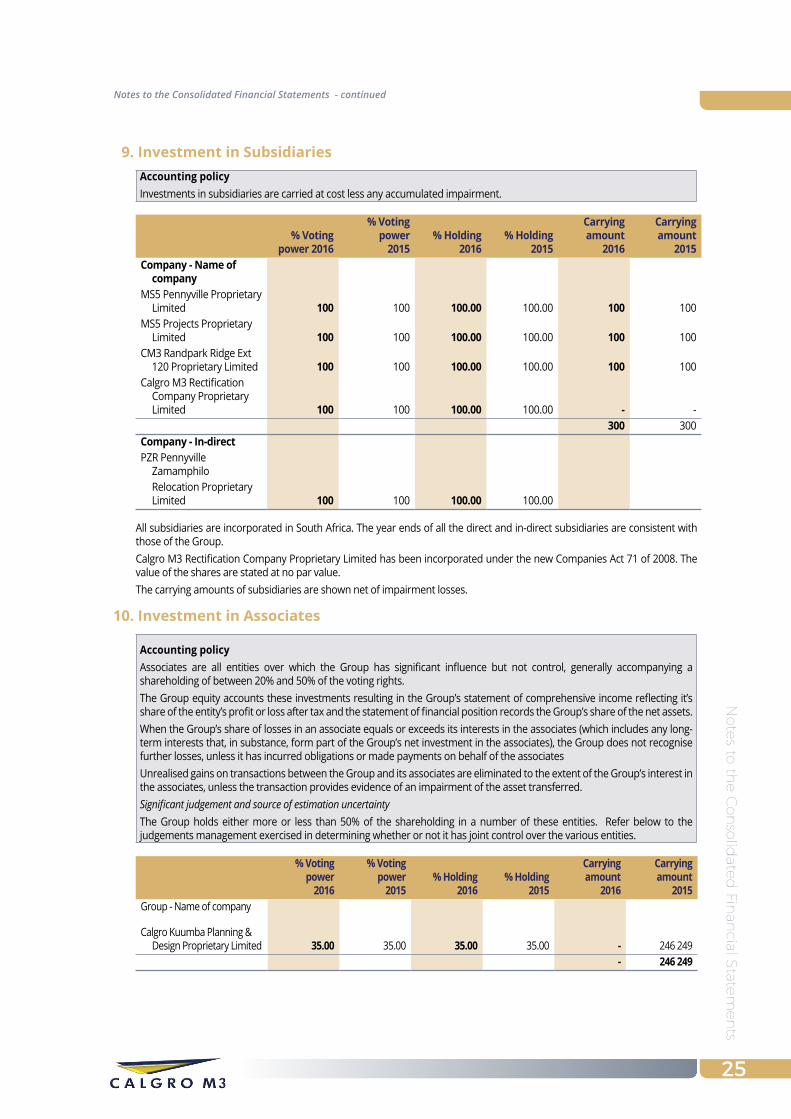
9. Investment in SubsidiariesAccounting policyInvestments in subsidiaries are carried at cost less any accumulated impairment.
% Voting power 2016
% Voting power
2015% Holding
2016% Holding
2015
Carrying amount
2016
Carrying amount
2015Company - Name of
companyMS5 Pennyville Proprietary
Limited 100 100 100.00 100.00 100 100 MS5 Projects Proprietary
Limited 100 100 100.00 100.00 100 100 CM3 Randpark Ridge Ext
120 Proprietary Limited 100 100 100.00 100.00 100 100 Calgro M3 Rectification
Company Proprietary Limited 100 100 100.00 100.00 - -
300 300 Company - In-directPZR Pennyville
Zamamphilo Relocation Proprietary
Limited 100 100 100.00 100.00
All subsidiaries are incorporated in South Africa. The year ends of all the direct and in-direct subsidiaries are consistent with those of the Group.Calgro M3 Rectification Company Proprietary Limited has been incorporated under the new Companies Act 71 of 2008. The value of the shares are stated at no par value.The carrying amounts of subsidiaries are shown net of impairment losses.
10. Investment in Associates
Accounting policyAssociates are all entities over which the Group has significant influence but not control, generally accompanying a shareholding of between 20% and 50% of the voting rights.The Group equity accounts these investments resulting in the Group’s statement of comprehensive income reflecting it’s share of the entity’s profit or loss after tax and the statement of financial position records the Group’s share of the net assets.When the Group’s share of losses in an associate equals or exceeds its interests in the associates (which includes any long-term interests that, in substance, form part of the Group’s net investment in the associates), the Group does not recognise further losses, unless it has incurred obligations or made payments on behalf of the associatesUnrealised gains on transactions between the Group and its associates are eliminated to the extent of the Group’s interest in the associates, unless the transaction provides evidence of an impairment of the asset transferred.Significant judgement and source of estimation uncertaintyThe Group holds either more or less than 50% of the shareholding in a number of these entities. Refer below to the judgements management exercised in determining whether or not it has joint control over the various entities.
% Voting power
2016
% Voting power
2015% Holding
2016% Holding
2015
Carrying amount
2016
Carrying amount
2015Group - Name of company
Calgro Kuumba Planning & Design Proprietary Limited 35.00 35.00 35.00 35.00 - 246 249
- 246 249
Notes to the Consolidated Financial Statements - continued
No
tes
to t
he C
on
solid
ated
Fin
anci
al S
tate
men
ts
26
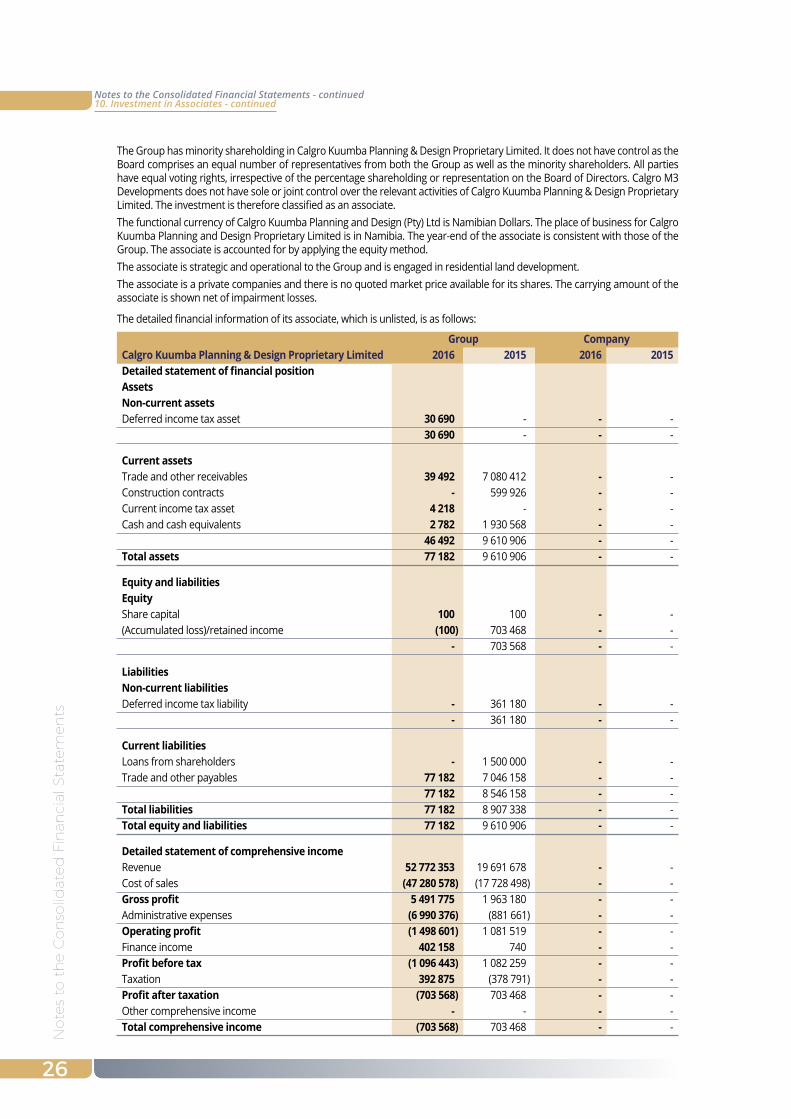
The Group has minority shareholding in Calgro Kuumba Planning & Design Proprietary Limited. It does not have control as the Board comprises an equal number of representatives from both the Group as well as the minority shareholders. All parties have equal voting rights, irrespective of the percentage shareholding or representation on the Board of Directors. Calgro M3 Developments does not have sole or joint control over the relevant activities of Calgro Kuumba Planning & Design Proprietary Limited. The investment is therefore classified as an associate.The functional currency of Calgro Kuumba Planning and Design (Pty) Ltd is Namibian Dollars. The place of business for Calgro Kuumba Planning and Design Proprietary Limited is in Namibia. The year-end of the associate is consistent with those of the Group. The associate is accounted for by applying the equity method.The associate is strategic and operational to the Group and is engaged in residential land development.The associate is a private companies and there is no quoted market price available for its shares. The carrying amount of the associate is shown net of impairment losses.
The detailed financial information of its associate, which is unlisted, is as follows:
Group CompanyCalgro Kuumba Planning & Design Proprietary Limited 2016 2015 2016 2015Detailed statement of financial positionAssetsNon-current assetsDeferred income tax asset 30 690 - - -
30 690 - - -
Current assetsTrade and other receivables 39 492 7 080 412 - - Construction contracts - 599 926 - - Current income tax asset 4 218 - - - Cash and cash equivalents 2 782 1 930 568 - -
46 492 9 610 906 - - total assets 77 182 9 610 906 - -
Equity and liabilitiesEquityShare capital 100 100 - - (Accumulated loss)/retained income (100) 703 468 - -
- 703 568 - -
LiabilitiesNon-current liabilitiesDeferred income tax liability - 361 180 - -
- 361 180 - -
Current liabilitiesLoans from shareholders - 1 500 000 - - Trade and other payables 77 182 7 046 158 - -
77 182 8 546 158 - - total liabilities 77 182 8 907 338 - - Total equity and liabilities 77 182 9 610 906 - -
Detailed statement of comprehensive incomeRevenue 52 772 353 19 691 678 - - Cost of sales (47 280 578) (17 728 498) - - Gross profit 5 491 775 1 963 180 - - Administrative expenses (6 990 376) (881 661) - - Operating profit (1 498 601) 1 081 519 - - Finance income 402 158 740 - - Profit before tax (1 096 443) 1 082 259 - - Taxation 392 875 (378 791) - - Profit after taxation (703 568) 703 468 - - Other comprehensive income - - - - Total comprehensive income (703 568) 703 468 - -
10. Investment in Associates - continuedNotes to the Consolidated Financial Statements - continued
No
tes to
the C
on
solid
ated
Finan
cial State
men
ts
27
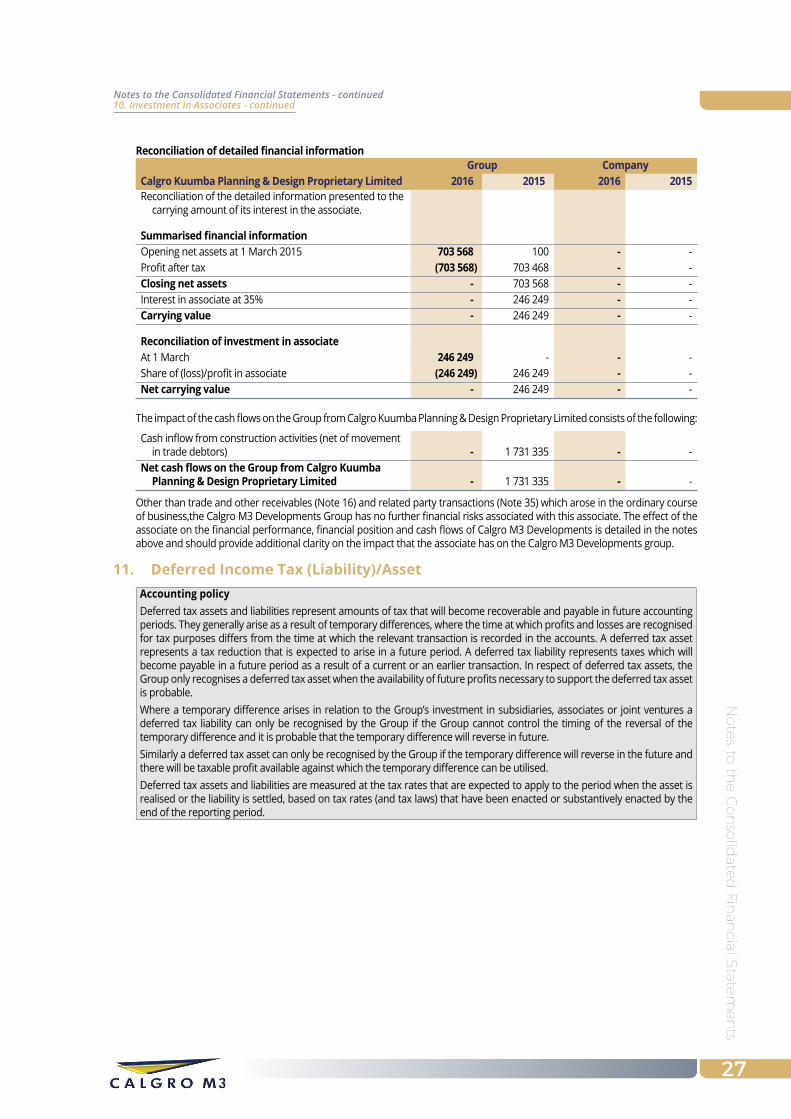
Group CompanyCalgro Kuumba Planning & Design Proprietary Limited 2016 2015 2016 2015Reconciliation of the detailed information presented to the
carrying amount of its interest in the associate.
Summarised financial informationOpening net assets at 1 March 2015 703 568 100 - - Profit after tax (703 568) 703 468 - - Closing net assets - 703 568 - - Interest in associate at 35% - 246 249 - - Carrying value - 246 249 - -
Reconciliation of investment in associateAt 1 March 246 249 - - - Share of (loss)/profit in associate (246 249) 246 249 - - Net carrying value - 246 249 - -
The impact of the cash flows on the Group from Calgro Kuumba Planning & Design Proprietary Limited consists of the following:
Cash inflow from construction activities (net of movement in trade debtors) - 1 731 335 - -
Net cash flows on the Group from Calgro Kuumba Planning & Design Proprietary Limited - 1 731 335 - -
Other than trade and other receivables (Note 16) and related party transactions (Note 35) which arose in the ordinary course of business,the Calgro M3 Developments Group has no further financial risks associated with this associate. The effect of the associate on the financial performance, financial position and cash flows of Calgro M3 Developments is detailed in the notes above and should provide additional clarity on the impact that the associate has on the Calgro M3 Developments group.
11. Deferred Income Tax (Liability)/AssetAccounting policyDeferred tax assets and liabilities represent amounts of tax that will become recoverable and payable in future accounting periods. They generally arise as a result of temporary differences, where the time at which profits and losses are recognised for tax purposes differs from the time at which the relevant transaction is recorded in the accounts. A deferred tax asset represents a tax reduction that is expected to arise in a future period. A deferred tax liability represents taxes which will become payable in a future period as a result of a current or an earlier transaction. In respect of deferred tax assets, the Group only recognises a deferred tax asset when the availability of future profits necessary to support the deferred tax asset is probable.Where a temporary difference arises in relation to the Group’s investment in subsidiaries, associates or joint ventures a deferred tax liability can only be recognised by the Group if the Group cannot control the timing of the reversal of the temporary difference and it is probable that the temporary difference will reverse in future. Similarly a deferred tax asset can only be recognised by the Group if the temporary difference will reverse in the future and there will be taxable profit available against which the temporary difference can be utilised.Deferred tax assets and liabilities are measured at the tax rates that are expected to apply to the period when the asset is realised or the liability is settled, based on tax rates (and tax laws) that have been enacted or substantively enacted by the end of the reporting period.
Reconciliation of detailed financial information
10. Investment in Associates - continuedNotes to the Consolidated Financial Statements - continued
No
tes
to t
he C
on
solid
ated
Fin
anci
al S
tate
men
ts
28
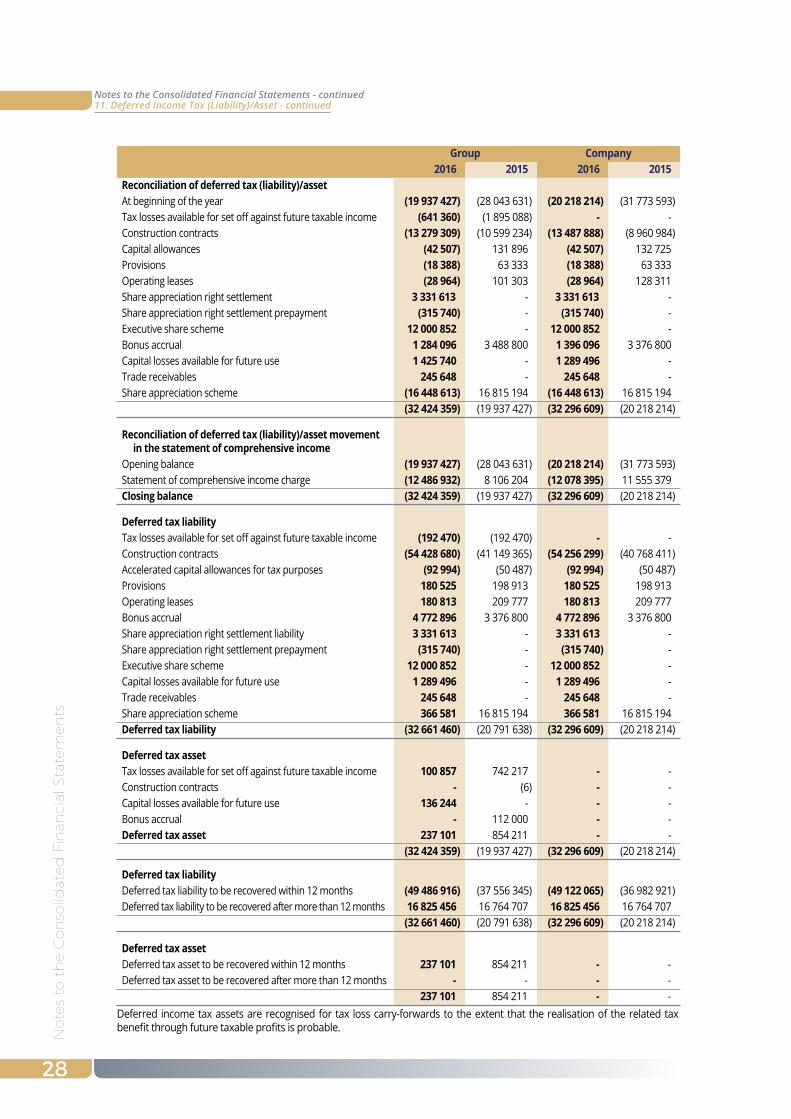
11. Deferred Income Tax (Liability)/Asset - continued
Group Company2016 2015 2016 2015
Reconciliation of deferred tax (liability)/assetAt beginning of the year (19 937 427) (28 043 631) (20 218 214) (31 773 593) Tax losses available for set off against future taxable income (641 360) (1 895 088) - - Construction contracts (13 279 309) (10 599 234) (13 487 888) (8 960 984) Capital allowances (42 507) 131 896 (42 507) 132 725 Provisions (18 388) 63 333 (18 388) 63 333 Operating leases (28 964) 101 303 (28 964) 128 311 Share appreciation right settlement 3 331 613 - 3 331 613 - Share appreciation right settlement prepayment (315 740) - (315 740) - Executive share scheme 12 000 852 - 12 000 852 - Bonus accrual 1 284 096 3 488 800 1 396 096 3 376 800 Capital losses available for future use 1 425 740 - 1 289 496 - Trade receivables 245 648 - 245 648 - Share appreciation scheme (16 448 613) 16 815 194 (16 448 613) 16 815 194
(32 424 359) (19 937 427) (32 296 609) (20 218 214)
Reconciliation of deferred tax (liability)/asset movement in the statement of comprehensive income
Opening balance (19 937 427) (28 043 631) (20 218 214) (31 773 593) Statement of comprehensive income charge (12 486 932) 8 106 204 (12 078 395) 11 555 379 Closing balance (32 424 359) (19 937 427) (32 296 609) (20 218 214)
Deferred tax liabilityTax losses available for set off against future taxable income (192 470) (192 470) - - Construction contracts (54 428 680) (41 149 365) (54 256 299) (40 768 411) Accelerated capital allowances for tax purposes (92 994) (50 487) (92 994) (50 487) Provisions 180 525 198 913 180 525 198 913 Operating leases 180 813 209 777 180 813 209 777 Bonus accrual 4 772 896 3 376 800 4 772 896 3 376 800 Share appreciation right settlement liability 3 331 613 - 3 331 613 - Share appreciation right settlement prepayment (315 740) - (315 740) - Executive share scheme 12 000 852 - 12 000 852 - Capital losses available for future use 1 289 496 - 1 289 496 - Trade receivables 245 648 - 245 648 - Share appreciation scheme 366 581 16 815 194 366 581 16 815 194 Deferred tax liability (32 661 460) (20 791 638) (32 296 609) (20 218 214)
Deferred tax assetTax losses available for set off against future taxable income 100 857 742 217 - - Construction contracts - (6) - - Capital losses available for future use 136 244 - - - Bonus accrual - 112 000 - - Deferred tax asset 237 101 854 211 - -
(32 424 359) (19 937 427) (32 296 609) (20 218 214)
Deferred tax liabilityDeferred tax liability to be recovered within 12 months (49 486 916) (37 556 345) (49 122 065) (36 982 921) Deferred tax liability to be recovered after more than 12 months 16 825 456 16 764 707 16 825 456 16 764 707
(32 661 460) (20 791 638) (32 296 609) (20 218 214)
Deferred tax assetDeferred tax asset to be recovered within 12 months 237 101 854 211 - - Deferred tax asset to be recovered after more than 12 months - - - -
237 101 854 211 - - Deferred income tax assets are recognised for tax loss carry-forwards to the extent that the realisation of the related tax benefit through future taxable profits is probable.
Notes to the Consolidated Financial Statements - continued
No
tes to
the C
on
solid
ated
Finan
cial State
men
ts
29
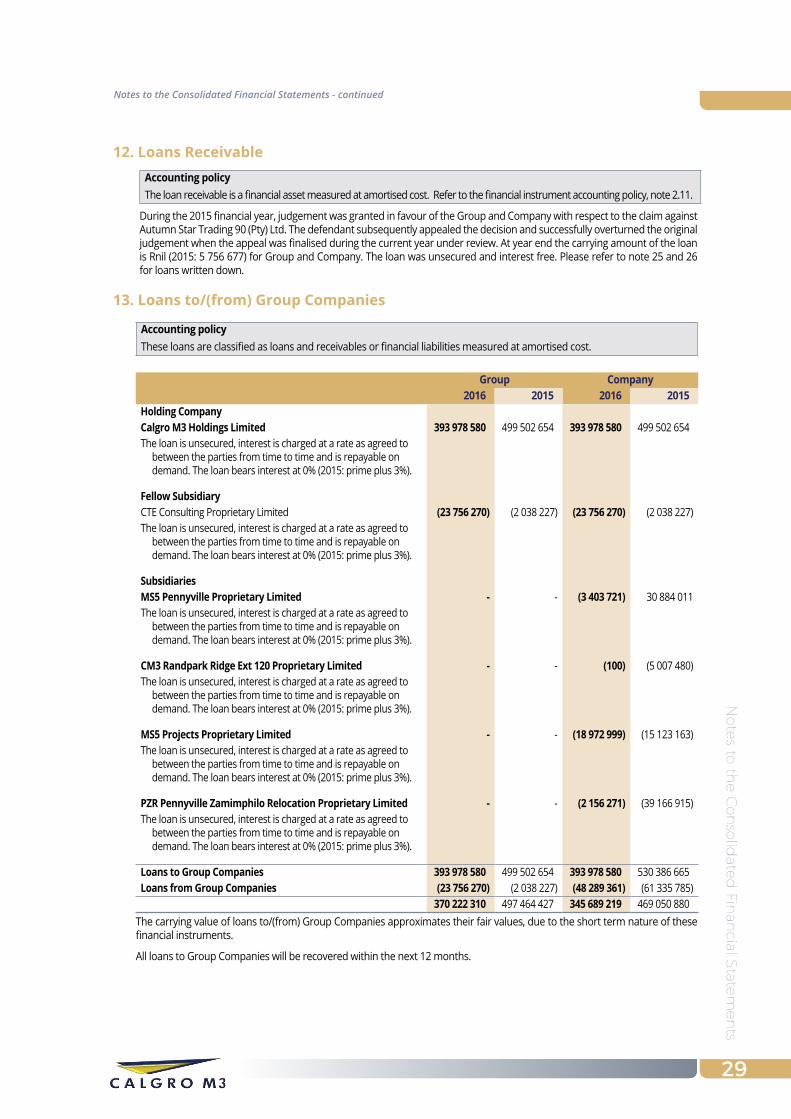
12. Loans ReceivableAccounting policyThe loan receivable is a financial asset measured at amortised cost. Refer to the financial instrument accounting policy, note 2.11.
During the 2015 financial year, judgement was granted in favour of the Group and Company with respect to the claim against Autumn Star Trading 90 (Pty) Ltd. The defendant subsequently appealed the decision and successfully overturned the original judgement when the appeal was finalised during the current year under review. At year end the carrying amount of the loan is Rnil (2015: 5 756 677) for Group and Company. The loan was unsecured and interest free. Please refer to note 25 and 26 for loans written down.
13. Loans to/(from) Group Companies
Accounting policyThese loans are classified as loans and receivables or financial liabilities measured at amortised cost.
Group Company2016 2015 2016 2015
Holding CompanyCalgro M3 Holdings Limited 393 978 580 499 502 654 393 978 580 499 502 654 The loan is unsecured, interest is charged at a rate as agreed to
between the parties from time to time and is repayable on demand. The loan bears interest at 0% (2015: prime plus 3%).
Fellow SubsidiaryCTE Consulting Proprietary Limited (23 756 270) (2 038 227) (23 756 270) (2 038 227) The loan is unsecured, interest is charged at a rate as agreed to
between the parties from time to time and is repayable on demand. The loan bears interest at 0% (2015: prime plus 3%).
SubsidiariesMS5 Pennyville Proprietary Limited - - (3 403 721) 30 884 011 The loan is unsecured, interest is charged at a rate as agreed to
between the parties from time to time and is repayable on demand. The loan bears interest at 0% (2015: prime plus 3%).
CM3 Randpark Ridge Ext 120 Proprietary Limited - - (100) (5 007 480) The loan is unsecured, interest is charged at a rate as agreed to
between the parties from time to time and is repayable on demand. The loan bears interest at 0% (2015: prime plus 3%).
MS5 Projects Proprietary Limited - - (18 972 999) (15 123 163) The loan is unsecured, interest is charged at a rate as agreed to
between the parties from time to time and is repayable on demand. The loan bears interest at 0% (2015: prime plus 3%).
PZR Pennyville Zamimphilo Relocation Proprietary Limited - - (2 156 271) (39 166 915) The loan is unsecured, interest is charged at a rate as agreed to
between the parties from time to time and is repayable on demand. The loan bears interest at 0% (2015: prime plus 3%).
Loans to Group Companies 393 978 580 499 502 654 393 978 580 530 386 665 Loans from Group Companies (23 756 270) (2 038 227) (48 289 361) (61 335 785)
370 222 310 497 464 427 345 689 219 469 050 880 The carrying value of loans to/(from) Group Companies approximates their fair values, due to the short term nature of these financial instruments.
All loans to Group Companies will be recovered within the next 12 months.
Notes to the Consolidated Financial Statements - continued
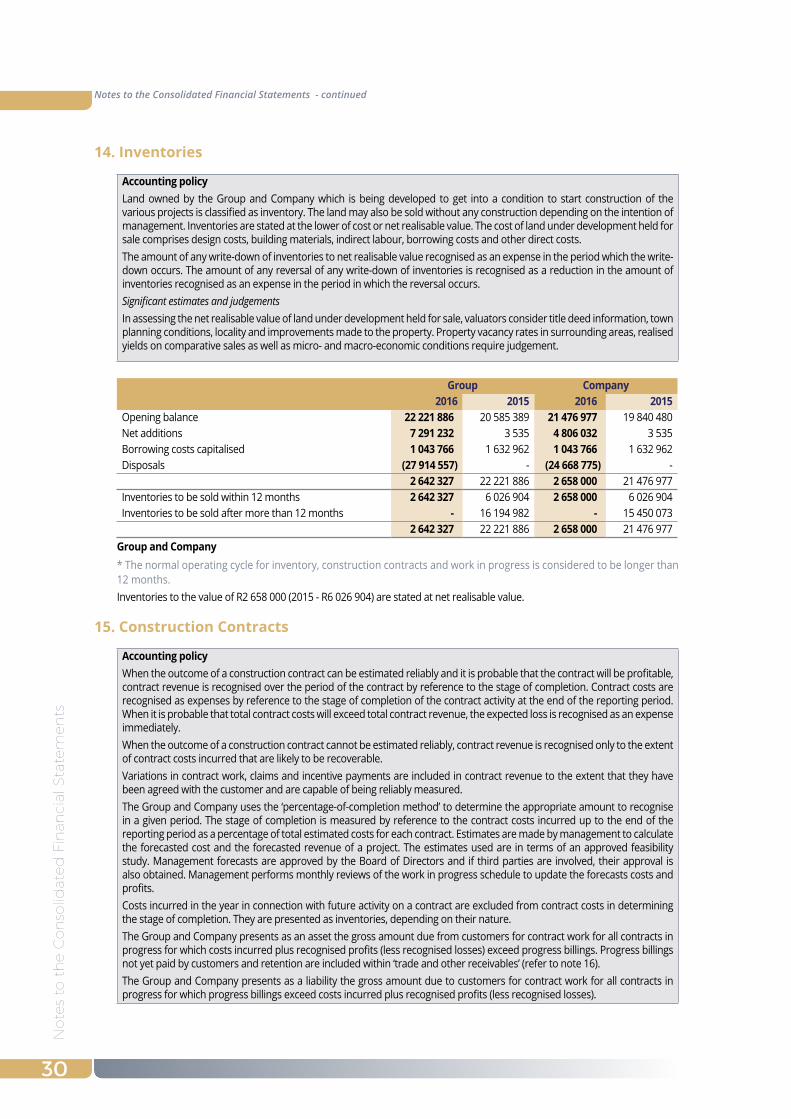
No
tes
to t
he C
on
solid
ated
Fin
anci
al S
tate
men
ts
30
14. Inventories
Accounting policyLand owned by the Group and Company which is being developed to get into a condition to start construction of the various projects is classified as inventory. The land may also be sold without any construction depending on the intention of management. Inventories are stated at the lower of cost or net realisable value. The cost of land under development held for sale comprises design costs, building materials, indirect labour, borrowing costs and other direct costs.The amount of any write-down of inventories to net realisable value recognised as an expense in the period which the write-down occurs. The amount of any reversal of any write-down of inventories is recognised as a reduction in the amount of inventories recognised as an expense in the period in which the reversal occurs.Significant estimates and judgementsIn assessing the net realisable value of land under development held for sale, valuators consider title deed information, town planning conditions, locality and improvements made to the property. Property vacancy rates in surrounding areas, realised yields on comparative sales as well as micro- and macro-economic conditions require judgement.
Group Company2016 2015 2016 2015
Opening balance 22 221 886 20 585 389 21 476 977 19 840 480 Net additions 7 291 232 3 535 4 806 032 3 535 Borrowing costs capitalised 1 043 766 1 632 962 1 043 766 1 632 962 Disposals (27 914 557) - (24 668 775) -
2 642 327 22 221 886 2 658 000 21 476 977 Inventories to be sold within 12 months 2 642 327 6 026 904 2 658 000 6 026 904 Inventories to be sold after more than 12 months - 16 194 982 - 15 450 073
2 642 327 22 221 886 2 658 000 21 476 977 Group and Company* The normal operating cycle for inventory, construction contracts and work in progress is considered to be longer than 12 months.Inventories to the value of R2 658 000 (2015 - R6 026 904) are stated at net realisable value.
15. Construction Contracts
Accounting policyWhen the outcome of a construction contract can be estimated reliably and it is probable that the contract will be profitable, contract revenue is recognised over the period of the contract by reference to the stage of completion. Contract costs are recognised as expenses by reference to the stage of completion of the contract activity at the end of the reporting period. When it is probable that total contract costs will exceed total contract revenue, the expected loss is recognised as an expense immediately.When the outcome of a construction contract cannot be estimated reliably, contract revenue is recognised only to the extent of contract costs incurred that are likely to be recoverable.Variations in contract work, claims and incentive payments are included in contract revenue to the extent that they have been agreed with the customer and are capable of being reliably measured.The Group and Company uses the ‘percentage-of-completion method’ to determine the appropriate amount to recognise in a given period. The stage of completion is measured by reference to the contract costs incurred up to the end of the reporting period as a percentage of total estimated costs for each contract. Estimates are made by management to calculate the forecasted cost and the forecasted revenue of a project. The estimates used are in terms of an approved feasibility study. Management forecasts are approved by the Board of Directors and if third parties are involved, their approval is also obtained. Management performs monthly reviews of the work in progress schedule to update the forecasts costs and profits.Costs incurred in the year in connection with future activity on a contract are excluded from contract costs in determining the stage of completion. They are presented as inventories, depending on their nature.The Group and Company presents as an asset the gross amount due from customers for contract work for all contracts in progress for which costs incurred plus recognised profits (less recognised losses) exceed progress billings. Progress billings not yet paid by customers and retention are included within ‘trade and other receivables’ (refer to note 16).The Group and Company presents as a liability the gross amount due to customers for contract work for all contracts in progress for which progress billings exceed costs incurred plus recognised profits (less recognised losses).
Notes to the Consolidated Financial Statements - continued
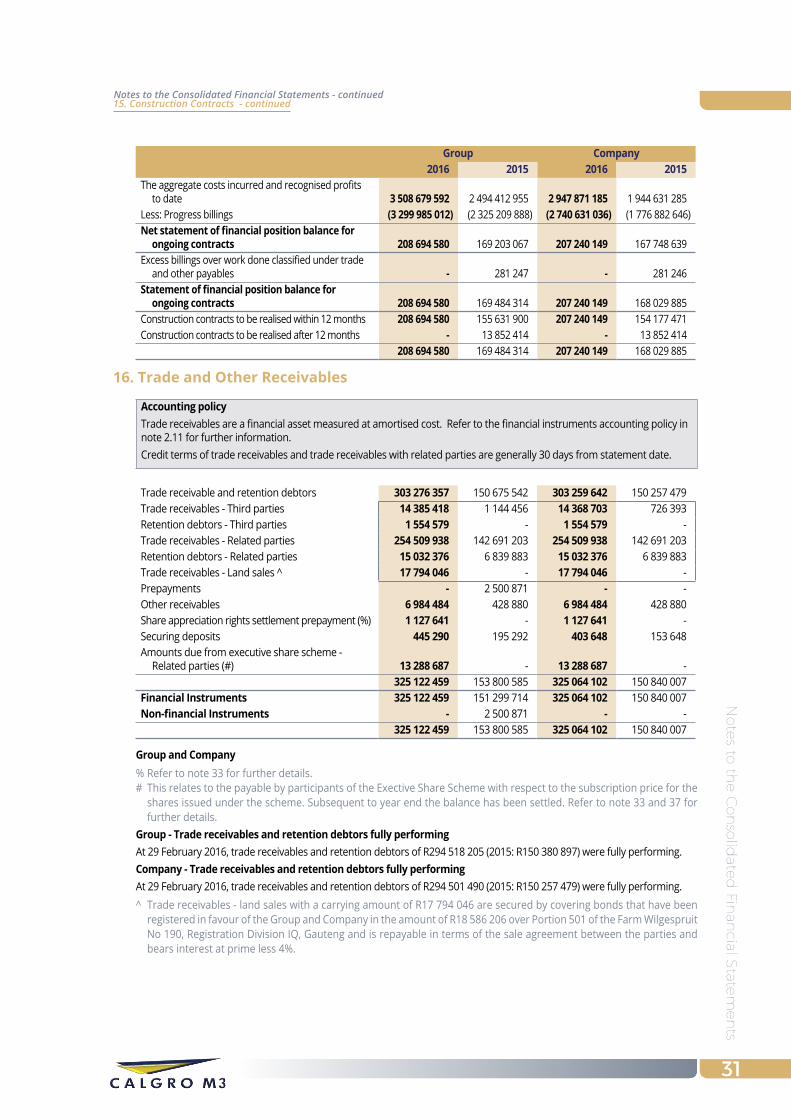
No
tes to
the C
on
solid
ated
Finan
cial State
men
ts
31
Group Company2016 2015 2016 2015
The aggregate costs incurred and recognised profits to date 3 508 679 592 2 494 412 955 2 947 871 185 1 944 631 285
Less: Progress billings (3 299 985 012) (2 325 209 888) (2 740 631 036) (1 776 882 646) Net statement of financial position balance for
ongoing contracts 208 694 580 169 203 067 207 240 149 167 748 639 Excess billings over work done classified under trade
and other payables - 281 247 - 281 246 Statement of financial position balance for
ongoing contracts 208 694 580 169 484 314 207 240 149 168 029 885 Construction contracts to be realised within 12 months 208 694 580 155 631 900 207 240 149 154 177 471 Construction contracts to be realised after 12 months - 13 852 414 - 13 852 414
208 694 580 169 484 314 207 240 149 168 029 885
16. Trade and Other Receivables
Accounting policyTrade receivables are a financial asset measured at amortised cost. Refer to the financial instruments accounting policy in note 2.11 for further information.Credit terms of trade receivables and trade receivables with related parties are generally 30 days from statement date.
Trade receivable and retention debtors 303 276 357 150 675 542 303 259 642 150 257 479 Trade receivables - Third parties 14 385 418 1 144 456 14 368 703 726 393 Retention debtors - Third parties 1 554 579 - 1 554 579 - Trade receivables - Related parties 254 509 938 142 691 203 254 509 938 142 691 203 Retention debtors - Related parties 15 032 376 6 839 883 15 032 376 6 839 883 Trade receivables - Land sales ^ 17 794 046 - 17 794 046 - Prepayments - 2 500 871 - - Other receivables 6 984 484 428 880 6 984 484 428 880 Share appreciation rights settlement prepayment (%) 1 127 641 - 1 127 641 - Securing deposits 445 290 195 292 403 648 153 648 Amounts due from executive share scheme - Related parties (#) 13 288 687 - 13 288 687 -
325 122 459 153 800 585 325 064 102 150 840 007 Financial Instruments 325 122 459 151 299 714 325 064 102 150 840 007 Non-financial Instruments - 2 500 871 - -
325 122 459 153 800 585 325 064 102 150 840 007
Group and Company% Refer to note 33 for further details.# This relates to the payable by participants of the Exective Share Scheme with respect to the subscription price for the
shares issued under the scheme. Subsequent to year end the balance has been settled. Refer to note 33 and 37 for further details.
Group - Trade receivables and retention debtors fully performingAt 29 February 2016, trade receivables and retention debtors of R294 518 205 (2015: R150 380 897) were fully performing.Company - Trade receivables and retention debtors fully performingAt 29 February 2016, trade receivables and retention debtors of R294 501 490 (2015: R150 257 479) were fully performing.^ Trade receivables - land sales with a carrying amount of R17 794 046 are secured by covering bonds that have been
registered in favour of the Group and Company in the amount of R18 586 206 over Portion 501 of the Farm Wilgespruit No 190, Registration Division IQ, Gauteng and is repayable in terms of the sale agreement between the parties and bears interest at prime less 4%.
15. Construction Contracts - continuedNotes to the Consolidated Financial Statements - continued
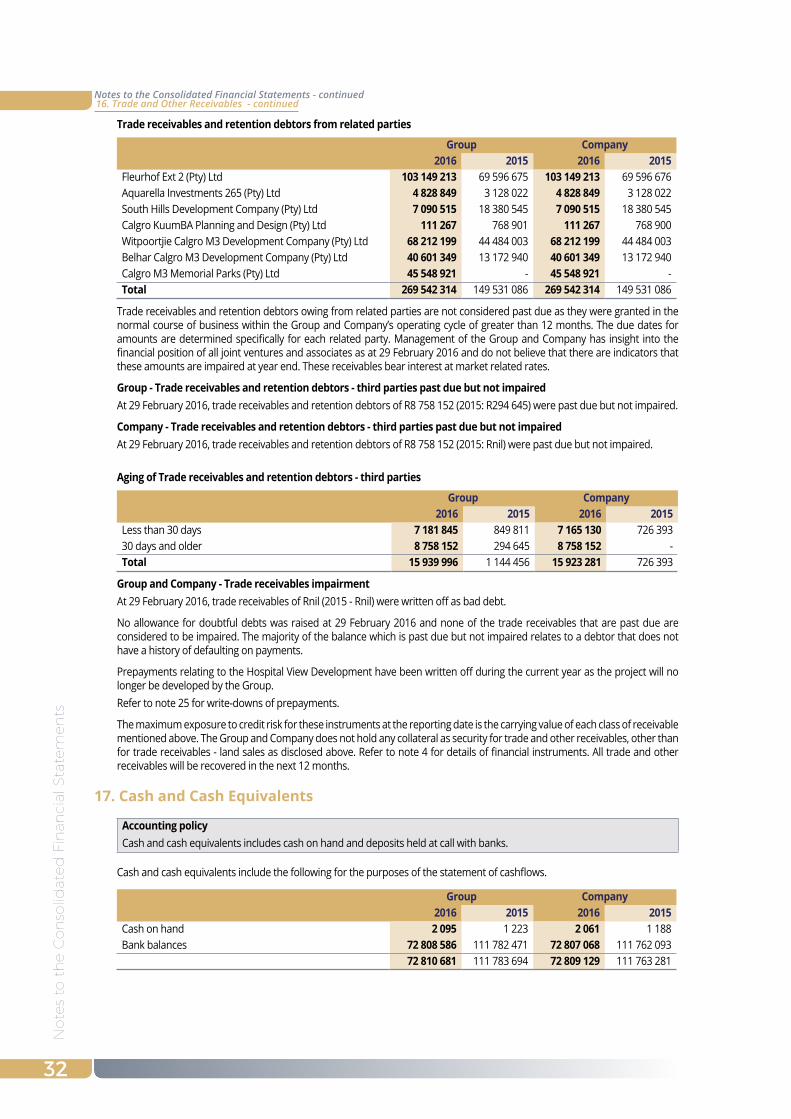
32
No
tes
to t
he C
on
solid
ated
Fin
anci
al S
tate
men
ts
Trade receivables and retention debtors from related parties
Group Company2016 2015 2016 2015
Fleurhof Ext 2 (Pty) Ltd 103 149 213 69 596 675 103 149 213 69 596 676 Aquarella Investments 265 (Pty) Ltd 4 828 849 3 128 022 4 828 849 3 128 022 South Hills Development Company (Pty) Ltd 7 090 515 18 380 545 7 090 515 18 380 545 Calgro KuumBA Planning and Design (Pty) Ltd 111 267 768 901 111 267 768 900 Witpoortjie Calgro M3 Development Company (Pty) Ltd 68 212 199 44 484 003 68 212 199 44 484 003 Belhar Calgro M3 Development Company (Pty) Ltd 40 601 349 13 172 940 40 601 349 13 172 940 Calgro M3 Memorial Parks (Pty) Ltd 45 548 921 - 45 548 921 - total 269 542 314 149 531 086 269 542 314 149 531 086
Trade receivables and retention debtors owing from related parties are not considered past due as they were granted in the normal course of business within the Group and Company’s operating cycle of greater than 12 months. The due dates for amounts are determined specifically for each related party. Management of the Group and Company has insight into the financial position of all joint ventures and associates as at 29 February 2016 and do not believe that there are indicators that these amounts are impaired at year end. These receivables bear interest at market related rates.
Group - Trade receivables and retention debtors - third parties past due but not impairedAt 29 February 2016, trade receivables and retention debtors of R8 758 152 (2015: R294 645) were past due but not impaired.
Company - Trade receivables and retention debtors - third parties past due but not impairedAt 29 February 2016, trade receivables and retention debtors of R8 758 152 (2015: Rnil) were past due but not impaired.
Aging of Trade receivables and retention debtors - third parties
Group Company2016 2015 2016 2015
Less than 30 days 7 181 845 849 811 7 165 130 726 393 30 days and older 8 758 152 294 645 8 758 152 - total 15 939 996 1 144 456 15 923 281 726 393
Group and Company - Trade receivables impairmentAt 29 February 2016, trade receivables of Rnil (2015 - Rnil) were written off as bad debt.
No allowance for doubtful debts was raised at 29 February 2016 and none of the trade receivables that are past due are considered to be impaired. The majority of the balance which is past due but not impaired relates to a debtor that does not have a history of defaulting on payments.
Prepayments relating to the Hospital View Development have been written off during the current year as the project will no longer be developed by the Group.Refer to note 25 for write-downs of prepayments.
The maximum exposure to credit risk for these instruments at the reporting date is the carrying value of each class of receivable mentioned above. The Group and Company does not hold any collateral as security for trade and other receivables, other than for trade receivables - land sales as disclosed above. Refer to note 4 for details of financial instruments. All trade and other receivables will be recovered in the next 12 months.
17. Cash and Cash Equivalents
Accounting policyCash and cash equivalents includes cash on hand and deposits held at call with banks.
Cash and cash equivalents include the following for the purposes of the statement of cashflows.
Group Company2016 2015 2016 2015
Cash on hand 2 095 1 223 2 061 1 188 Bank balances 72 808 586 111 782 471 72 807 068 111 762 093
72 810 681 111 783 694 72 809 129 111 763 281
16. Trade and Other Receivables - continuedNotes to the Consolidated Financial Statements - continued
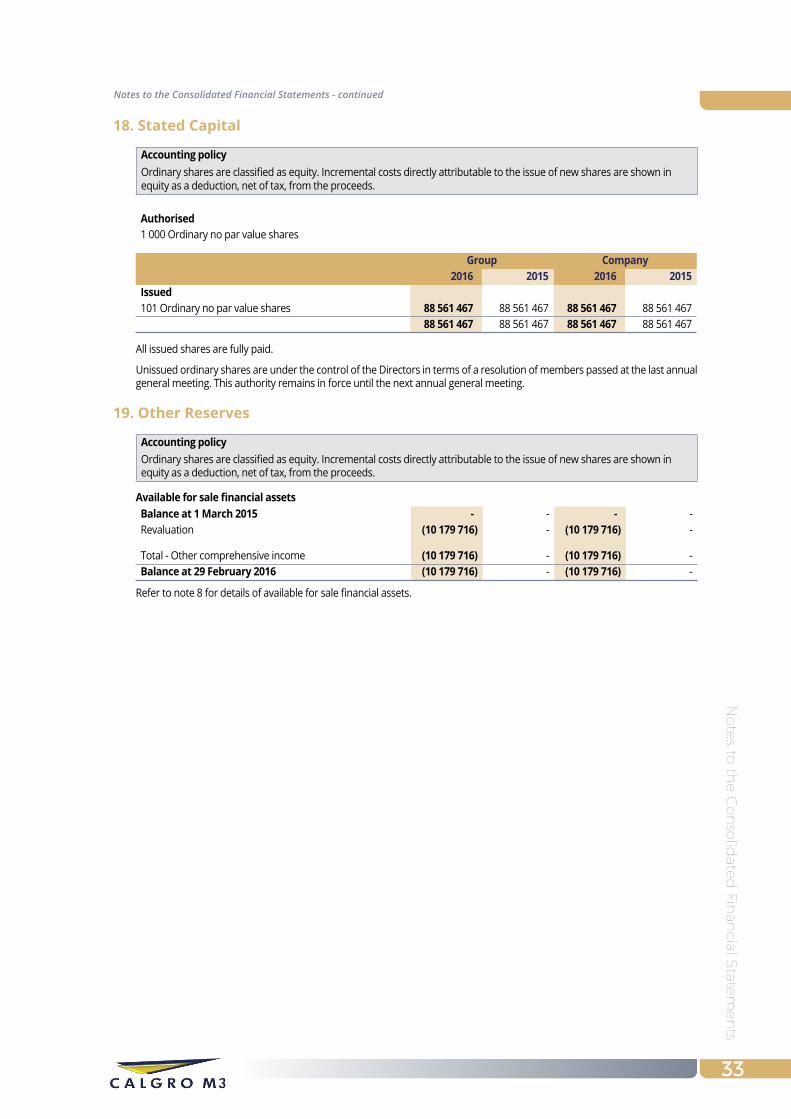
No
tes to
the C
on
solid
ated
Finan
cial State
men
ts
33
18. Stated Capital
Accounting policyOrdinary shares are classified as equity. Incremental costs directly attributable to the issue of new shares are shown in equity as a deduction, net of tax, from the proceeds.
Authorised1 000 Ordinary no par value shares
Group Company2016 2015 2016 2015
Issued101 Ordinary no par value shares 88 561 467 88 561 467 88 561 467 88 561 467
88 561 467 88 561 467 88 561 467 88 561 467
All issued shares are fully paid.
Unissued ordinary shares are under the control of the Directors in terms of a resolution of members passed at the last annual general meeting. This authority remains in force until the next annual general meeting.
19. Other Reserves
Accounting policyOrdinary shares are classified as equity. Incremental costs directly attributable to the issue of new shares are shown in equity as a deduction, net of tax, from the proceeds.
Available for sale financial assets Balance at 1 March 2015 - - - - Revaluation (10 179 716) - (10 179 716) -
Total - Other comprehensive income (10 179 716) - (10 179 716) - Balance at 29 February 2016 (10 179 716) - (10 179 716) -
Refer to note 8 for details of available for sale financial assets.
Notes to the Consolidated Financial Statements - continued
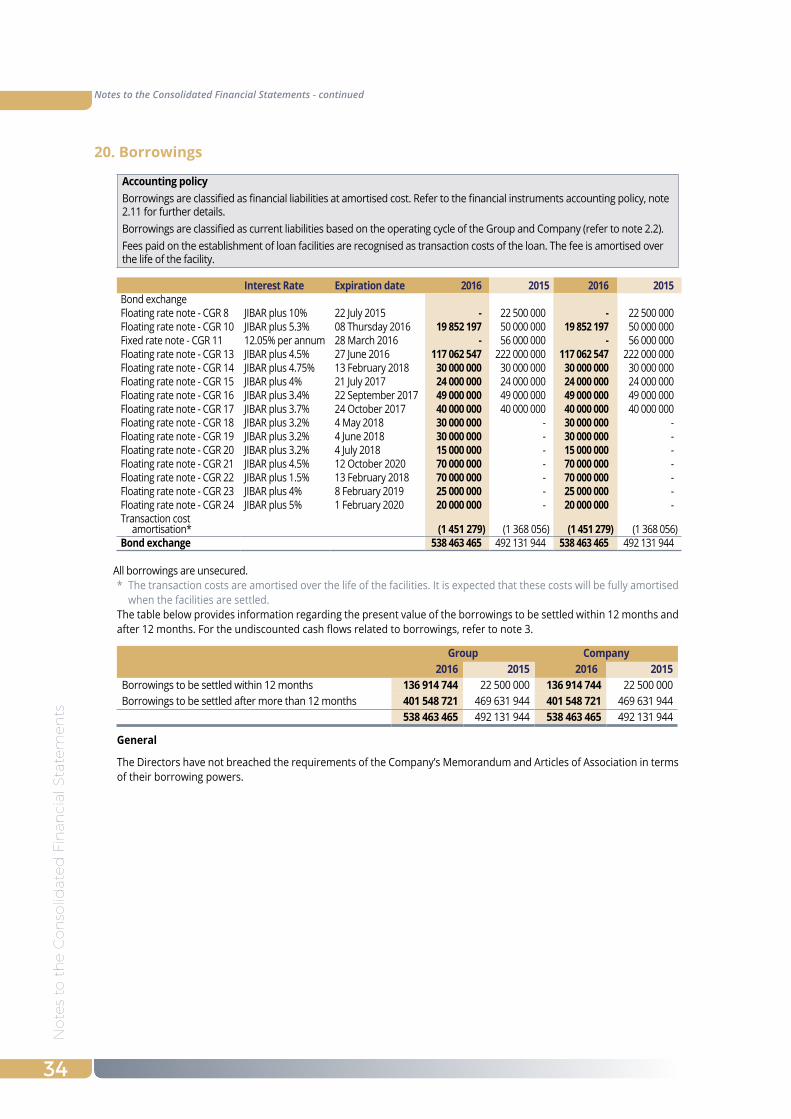
34
No
tes
to t
he C
on
solid
ated
Fin
anci
al S
tate
men
ts
20. Borrowings
Accounting policyBorrowings are classified as financial liabilities at amortised cost. Refer to the financial instruments accounting policy, note 2.11 for further details.Borrowings are classified as current liabilities based on the operating cycle of the Group and Company (refer to note 2.2).Fees paid on the establishment of loan facilities are recognised as transaction costs of the loan. The fee is amortised over the life of the facility.
Interest Rate Expiration date 2016 2015 2016 2015Bond exchangeFloating rate note - CGR 8 JIBAR plus 10% 22 July 2015 - 22 500 000 - 22 500 000 Floating rate note - CGR 10 JIBAR plus 5.3% 08 Thursday 2016 19 852 197 50 000 000 19 852 197 50 000 000 Fixed rate note - CGR 11 12.05% per annum 28 March 2016 - 56 000 000 - 56 000 000 Floating rate note - CGR 13 JIBAR plus 4.5% 27 June 2016 117 062 547 222 000 000 117 062 547 222 000 000 Floating rate note - CGR 14 JIBAR plus 4.75% 13 February 2018 30 000 000 30 000 000 30 000 000 30 000 000 Floating rate note - CGR 15 JIBAR plus 4% 21 July 2017 24 000 000 24 000 000 24 000 000 24 000 000 Floating rate note - CGR 16 JIBAR plus 3.4% 22 September 2017 49 000 000 49 000 000 49 000 000 49 000 000 Floating rate note - CGR 17 JIBAR plus 3.7% 24 October 2017 40 000 000 40 000 000 40 000 000 40 000 000 Floating rate note - CGR 18 JIBAR plus 3.2% 4 May 2018 30 000 000 - 30 000 000 - Floating rate note - CGR 19 JIBAR plus 3.2% 4 June 2018 30 000 000 - 30 000 000 - Floating rate note - CGR 20 JIBAR plus 3.2% 4 July 2018 15 000 000 - 15 000 000 - Floating rate note - CGR 21 JIBAR plus 4.5% 12 October 2020 70 000 000 - 70 000 000 - Floating rate note - CGR 22 JIBAR plus 1.5% 13 February 2018 70 000 000 - 70 000 000 - Floating rate note - CGR 23 JIBAR plus 4% 8 February 2019 25 000 000 - 25 000 000 - Floating rate note - CGR 24 JIBAR plus 5% 1 February 2020 20 000 000 - 20 000 000 - Transaction cost
amortisation* (1 451 279) (1 368 056) (1 451 279) (1 368 056) Bond exchange 538 463 465 492 131 944 538 463 465 492 131 944
All borrowings are unsecured.* The transaction costs are amortised over the life of the facilities. It is expected that these costs will be fully amortised
when the facilities are settled.The table below provides information regarding the present value of the borrowings to be settled within 12 months and after 12 months. For the undiscounted cash flows related to borrowings, refer to note 3.
Group Company2016 2015 2016 2015
Borrowings to be settled within 12 months 136 914 744 22 500 000 136 914 744 22 500 000 Borrowings to be settled after more than 12 months 401 548 721 469 631 944 401 548 721 469 631 944
538 463 465 492 131 944 538 463 465 492 131 944
General
The Directors have not breached the requirements of the Company’s Memorandum and Articles of Association in terms of their borrowing powers.
Notes to the Consolidated Financial Statements - continued
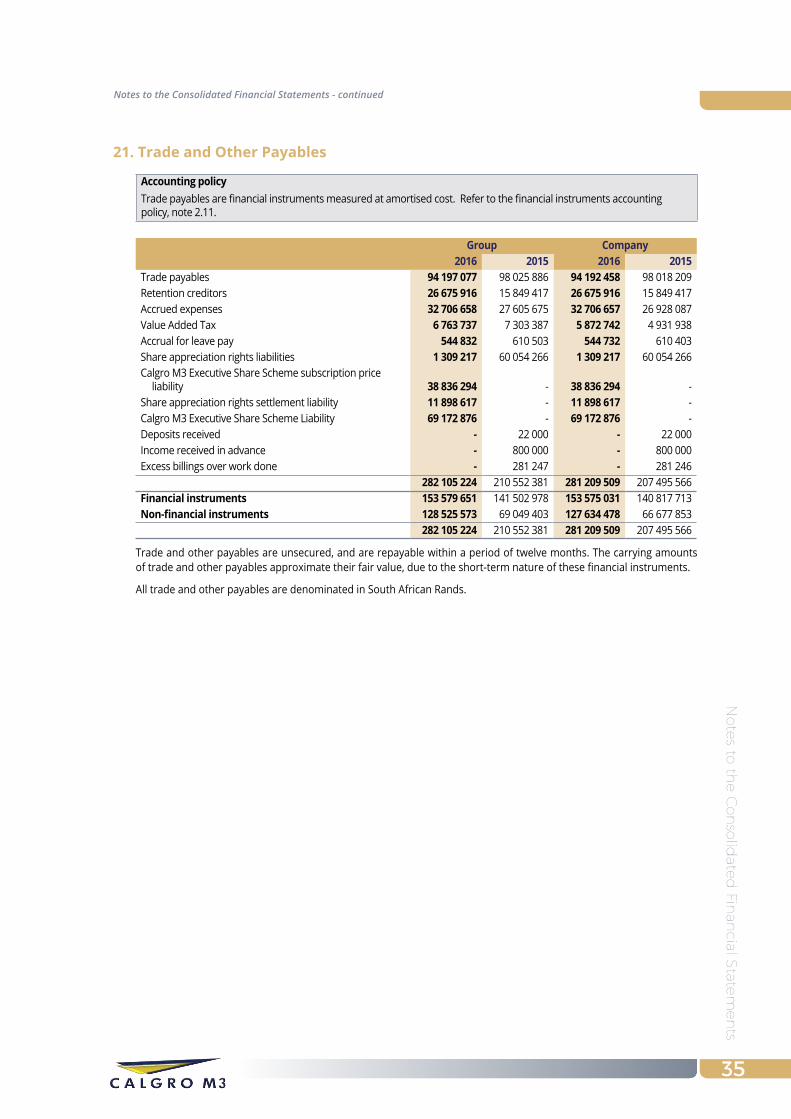
35
No
tes to
the C
on
solid
ated
Finan
cial State
men
ts
21. Trade and Other Payables
Accounting policyTrade payables are financial instruments measured at amortised cost. Refer to the financial instruments accounting policy, note 2.11.
Group Company2016 2015 2016 2015
Trade payables 94 197 077 98 025 886 94 192 458 98 018 209 Retention creditors 26 675 916 15 849 417 26 675 916 15 849 417 Accrued expenses 32 706 658 27 605 675 32 706 657 26 928 087 Value Added Tax 6 763 737 7 303 387 5 872 742 4 931 938 Accrual for leave pay 544 832 610 503 544 732 610 403 Share appreciation rights liabilities 1 309 217 60 054 266 1 309 217 60 054 266 Calgro M3 Executive Share Scheme subscription price
liability 38 836 294 - 38 836 294 - Share appreciation rights settlement liability 11 898 617 - 11 898 617 - Calgro M3 Executive Share Scheme Liability 69 172 876 - 69 172 876 - Deposits received - 22 000 - 22 000 Income received in advance - 800 000 - 800 000 Excess billings over work done - 281 247 - 281 246
282 105 224 210 552 381 281 209 509 207 495 566 Financial instruments 153 579 651 141 502 978 153 575 031 140 817 713 Non-financial instruments 128 525 573 69 049 403 127 634 478 66 677 853
282 105 224 210 552 381 281 209 509 207 495 566
Trade and other payables are unsecured, and are repayable within a period of twelve months. The carrying amounts of trade and other payables approximate their fair value, due to the short-term nature of these financial instruments.
All trade and other payables are denominated in South African Rands.
Notes to the Consolidated Financial Statements - continued

36
No
tes
to t
he C
on
solid
ated
Fin
anci
al S
tate
men
ts
22. Revenue
Accounting policyThe Group and Company earns revenue from the sale of land, through the rendering of services and construction contracts.(a) Sale of developed landThe sale of developed land relates to the sale of land, classified as inventory, which is either developed or not. Revenue is recognised when the land is sold and all documents of ownership has been transferred.(b) Rendering of servicesThe rendering of services relates to revenue generated from professional services provided by the Group e.g. townplanning etc. Revenue is recognised at the date that these services are rendered.(c) Construction contractsRevenue is recognised over the period of the contract on the ‘percentage-of-completion’ basis by reference to the contract costs incurred up to the end of the reporting period as a percentage of total estimated costs for each contract. In applying the recognition criteria in IAS 18 ‘Revenue’, judgement is required in determining whether:
❚ a single transaction includes separately identifiable components; or❚ two or more transactions together, when they are linked in such a way that the commercial effect cannot be understood without reference to the series of transactions as a whole, should be grouped.
Significant judgement and source of estimation uncertainty The Group and Company uses the ‘percentage-of-completion’ method in accounting for its construction contracts. Use of the ‘percentage-of-completion’ method requires the Group and Company to estimate the construction services and activities performed to date as a proportion of the total services and activities to be performed. In addition, judgements are required when recognising and measuring any variations or claims on each contract.Estimates are made by management to calculate the forecasted cost of a project. The estimates used are in terms of an approved feasibility study. Management forecasts are approved by the Board of Directors and if third parties are involved, their approval is also obtained. Management performs monthly reviews of the work in progress schedule to update the forecasts costs and profits.The Group and Company applies judgement in determining whether contracts for the sale of land and the construction of residential housing include separately identifiable components or whether they should be grouped together.The Group considers the customers ability to specify the major structural elements of the design with respect to a construction agreement, before both the commencement of construction and during construction, when determining whether a construction agreement should be accounted for within the scope of IAS 11 Construction Contracts or IAS 18 Revenue.
Group Company2016 2015 2016 2015
Sale of developed land 24 179 238 - 24 179 238 - Rendering of services - 495 225 - 495 225 Construction contracts 1 166 527 093 796 611 768 1 165 681 450 794 727 901
1 190 706 331 797 106 993 1 189 860 688 795 223 126
23. Cost of Sales
Sale of developed land 27 914 557 - 24 668 775 - Commissions 5 423 562 6 854 486 1 999 134 - Construction costs 899 070 576 644 469 553 901 654 776 651 454 221
932 408 695 651 324 039 928 322 684 651 454 221
24. Other Income
Accounting policy(a) Dividend incomeDividend income is recognised when the right to receive payment is established.(b) Rental incomeRental income from operating leases is recognised on a straight-line basis over the lease term.(c) Management feesManagement fees are recognised on the date the services are performed.
Notes to the Consolidated Financial Statements - continued
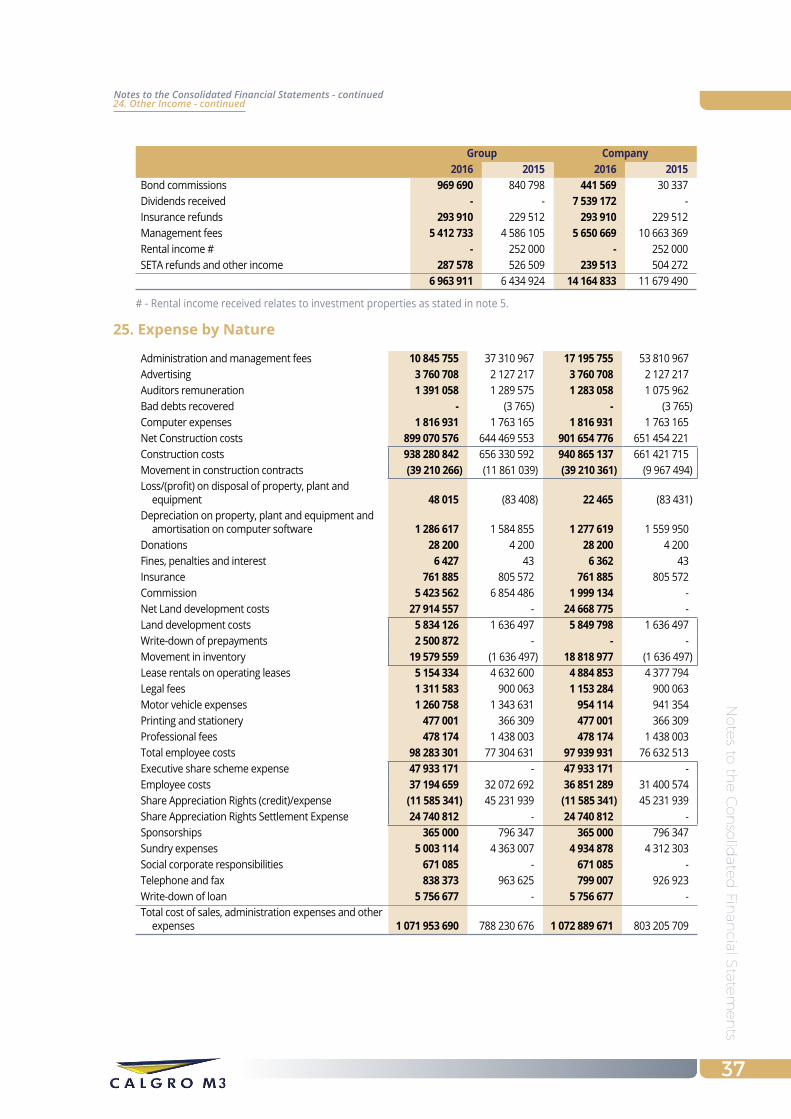
37
No
tes to
the C
on
solid
ated
Finan
cial State
men
ts
Group Company2016 2015 2016 2015
Bond commissions 969 690 840 798 441 569 30 337 Dividends received - - 7 539 172 - Insurance refunds 293 910 229 512 293 910 229 512 Management fees 5 412 733 4 586 105 5 650 669 10 663 369 Rental income # - 252 000 - 252 000 SETA refunds and other income 287 578 526 509 239 513 504 272
6 963 911 6 434 924 14 164 833 11 679 490
# - Rental income received relates to investment properties as stated in note 5.
25. Expense by Nature
Administration and management fees 10 845 755 37 310 967 17 195 755 53 810 967 Advertising 3 760 708 2 127 217 3 760 708 2 127 217 Auditors remuneration 1 391 058 1 289 575 1 283 058 1 075 962 Bad debts recovered - (3 765) - (3 765) Computer expenses 1 816 931 1 763 165 1 816 931 1 763 165 Net Construction costs 899 070 576 644 469 553 901 654 776 651 454 221 Construction costs 938 280 842 656 330 592 940 865 137 661 421 715 Movement in construction contracts (39 210 266) (11 861 039) (39 210 361) (9 967 494) Loss/(profit) on disposal of property, plant and
equipment 48 015 (83 408) 22 465 (83 431) Depreciation on property, plant and equipment and
amortisation on computer software 1 286 617 1 584 855 1 277 619 1 559 950 Donations 28 200 4 200 28 200 4 200 Fines, penalties and interest 6 427 43 6 362 43 Insurance 761 885 805 572 761 885 805 572 Commission 5 423 562 6 854 486 1 999 134 - Net Land development costs 27 914 557 - 24 668 775 - Land development costs 5 834 126 1 636 497 5 849 798 1 636 497 Write-down of prepayments 2 500 872 - - - Movement in inventory 19 579 559 (1 636 497) 18 818 977 (1 636 497) Lease rentals on operating leases 5 154 334 4 632 600 4 884 853 4 377 794 Legal fees 1 311 583 900 063 1 153 284 900 063 Motor vehicle expenses 1 260 758 1 343 631 954 114 941 354 Printing and stationery 477 001 366 309 477 001 366 309 Professional fees 478 174 1 438 003 478 174 1 438 003 Total employee costs 98 283 301 77 304 631 97 939 931 76 632 513 Executive share scheme expense 47 933 171 - 47 933 171 - Employee costs 37 194 659 32 072 692 36 851 289 31 400 574 Share Appreciation Rights (credit)/expense (11 585 341) 45 231 939 (11 585 341) 45 231 939 Share Appreciation Rights Settlement Expense 24 740 812 - 24 740 812 - Sponsorships 365 000 796 347 365 000 796 347 Sundry expenses 5 003 114 4 363 007 4 934 878 4 312 303 Social corporate responsibilities 671 085 - 671 085 - Telephone and fax 838 373 963 625 799 007 926 923 Write-down of loan 5 756 677 - 5 756 677 - Total cost of sales, administration expenses and other
expenses 1 071 953 690 788 230 676 1 072 889 671 803 205 709
24. Other Income - continuedNotes to the Consolidated Financial Statements - continued
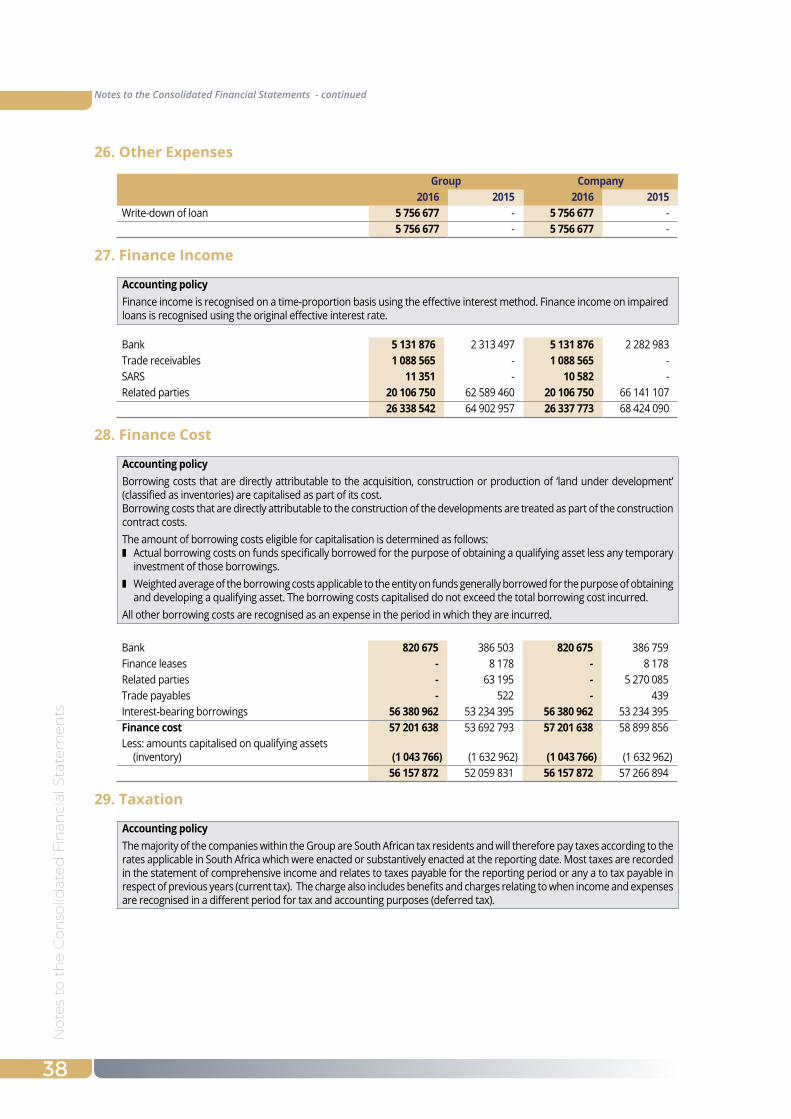
38
No
tes
to t
he C
on
solid
ated
Fin
anci
al S
tate
men
ts
26. Other Expenses
Group Company2016 2015 2016 2015
Write-down of loan 5 756 677 - 5 756 677 - 5 756 677 - 5 756 677 -
27. Finance Income
Accounting policyFinance income is recognised on a time-proportion basis using the effective interest method. Finance income on impaired loans is recognised using the original effective interest rate.
Bank 5 131 876 2 313 497 5 131 876 2 282 983 Trade receivables 1 088 565 - 1 088 565 - SARS 11 351 - 10 582 - Related parties 20 106 750 62 589 460 20 106 750 66 141 107
26 338 542 64 902 957 26 337 773 68 424 090
28. Finance Cost
Accounting policyBorrowing costs that are directly attributable to the acquisition, construction or production of ‘land under development’ (classified as inventories) are capitalised as part of its cost.Borrowing costs that are directly attributable to the construction of the developments are treated as part of the construction contract costs.The amount of borrowing costs eligible for capitalisation is determined as follows:❚ Actual borrowing costs on funds specifically borrowed for the purpose of obtaining a qualifying asset less any temporary
investment of those borrowings.❚ Weighted average of the borrowing costs applicable to the entity on funds generally borrowed for the purpose of obtaining
and developing a qualifying asset. The borrowing costs capitalised do not exceed the total borrowing cost incurred.All other borrowing costs are recognised as an expense in the period in which they are incurred.
Bank 820 675 386 503 820 675 386 759 Finance leases - 8 178 - 8 178 Related parties - 63 195 - 5 270 085 Trade payables - 522 - 439 Interest-bearing borrowings 56 380 962 53 234 395 56 380 962 53 234 395 Finance cost 57 201 638 53 692 793 57 201 638 58 899 856 Less: amounts capitalised on qualifying assets
(inventory) (1 043 766) (1 632 962) (1 043 766) (1 632 962) 56 157 872 52 059 831 56 157 872 57 266 894
29. taxation
Accounting policyThe majority of the companies within the Group are South African tax residents and will therefore pay taxes according to the rates applicable in South Africa which were enacted or substantively enacted at the reporting date. Most taxes are recorded in the statement of comprehensive income and relates to taxes payable for the reporting period or any a to tax payable in respect of previous years (current tax). The charge also includes benefits and charges relating to when income and expenses are recognised in a different period for tax and accounting purposes (deferred tax).
Notes to the Consolidated Financial Statements - continued
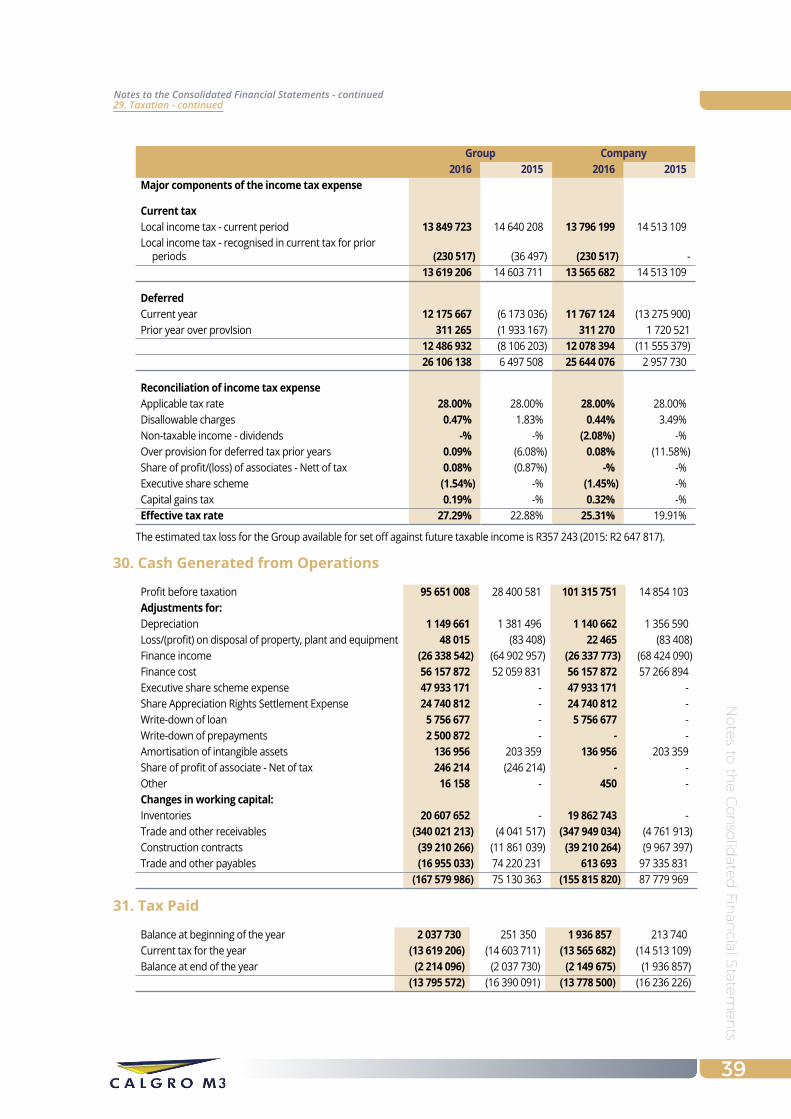
39
No
tes to
the C
on
solid
ated
Finan
cial State
men
ts
Group Company2016 2015 2016 2015
Major components of the income tax expense
Current taxLocal income tax - current period 13 849 723 14 640 208 13 796 199 14 513 109 Local income tax - recognised in current tax for prior
periods (230 517) (36 497) (230 517) - 13 619 206 14 603 711 13 565 682 14 513 109
DeferredCurrent year 12 175 667 (6 173 036) 11 767 124 (13 275 900) Prior year over provIsion 311 265 (1 933 167) 311 270 1 720 521
12 486 932 (8 106 203) 12 078 394 (11 555 379) 26 106 138 6 497 508 25 644 076 2 957 730
Reconciliation of income tax expenseApplicable tax rate 28.00% 28.00% 28.00% 28.00%Disallowable charges 0.47% 1.83% 0.44% 3.49%Non-taxable income - dividends -% -% (2.08%) -%Over provision for deferred tax prior years 0.09% (6.08%) 0.08% (11.58%)Share of profit/(loss) of associates - Nett of tax 0.08% (0.87%) -% -%Executive share scheme (1.54%) -% (1.45%) -%Capital gains tax 0.19% -% 0.32% -%Effective tax rate 27.29% 22.88% 25.31% 19.91%
The estimated tax loss for the Group available for set off against future taxable income is R357 243 (2015: R2 647 817).
30. Cash Generated from Operations
Profit before taxation 95 651 008 28 400 581 101 315 751 14 854 103 Adjustments for:Depreciation 1 149 661 1 381 496 1 140 662 1 356 590 Loss/(profit) on disposal of property, plant and equipment 48 015 (83 408) 22 465 (83 408) Finance income (26 338 542) (64 902 957) (26 337 773) (68 424 090) Finance cost 56 157 872 52 059 831 56 157 872 57 266 894 Executive share scheme expense 47 933 171 - 47 933 171 - Share Appreciation Rights Settlement Expense 24 740 812 - 24 740 812 - Write-down of loan 5 756 677 - 5 756 677 - Write-down of prepayments 2 500 872 - - - Amortisation of intangible assets 136 956 203 359 136 956 203 359 Share of profit of associate - Net of tax 246 214 (246 214) - - Other 16 158 - 450 - Changes in working capital:Inventories 20 607 652 - 19 862 743 - Trade and other receivables (340 021 213) (4 041 517) (347 949 034) (4 761 913) Construction contracts (39 210 266) (11 861 039) (39 210 264) (9 967 397) Trade and other payables (16 955 033) 74 220 231 613 693 97 335 831
(167 579 986) 75 130 363 (155 815 820) 87 779 969
31. tax Paid
Balance at beginning of the year 2 037 730 251 350 1 936 857 213 740 Current tax for the year (13 619 206) (14 603 711) (13 565 682) (14 513 109) Balance at end of the year (2 214 096) (2 037 730) (2 149 675) (1 936 857)
(13 795 572) (16 390 091) (13 778 500) (16 236 226)
Notes to the Consolidated Financial Statements - continued29. Taxation - continued
No
tes
to t
he C
on
solid
ated
Fin
anci
al S
tate
men
ts
40
32. Commitments
Accounting policyFinancial guarantee contracts are recognised as financial liabilities at the date the guarantee is issued. Liabilities arising from financial guarantee contracts, are initially recognised at fair value and subsequently at the higher of: ❚ the amount determined in accordance with IAS 37, ‘Provisions, contingent liabilities and contingent assets’; and❚ the amount initially recognised (fair value) less, when appropriate, cumulative amortisation of the initial amount
recognised is in accordance with IAS 18 ‘Revenue’.The fair value of the financial guarantee is determined as the Group and Companies’ exposure with regards to the net realisable value of the inventories pledged as security and the outstanding debt on the mortgage bonds.
Operating LeaseThe Group and Company has bound itself to a rental agreement for the Head office in Bryanston, Gauteng until August 2025. The amount payable in the following 12 months is R3 156 265, with an amount of R19 707 786 payable wthin 2 to 5 years and the remaining balance of R18 652 894 payable after 5 years. The lease agreement has an escalation clause of 7.5% effective in the month of September.
33. Share-Based Payments
Accounting policyShare-based payments are remuneration payments to selected employees that take the form of award schemes in the Group. The Group’s award schemes are all settled in cash, i.e. the employees do not receive shares or options at settlement. The year in which the employee renders services to the Group to obtain the award is the year in which the expense is recognised in the statement of comprehensive income with a corresponding increase recognised in the liability. The expense is determined by measuring the fair value of the liability at each year end.If the share-based payments granted do not vest until the counter party completes a specified period of service, the Group accounts for those services as they are rendered by the counter party during the vesting period, or on a straight line basis over the vesting period.If the share-based payments vest immediately, the services received are recognised in full.If the terms of a scheme are modified, at a minimum an expense is recognised as if the terms had not been modified. An additional expense is recognised for any modification that increases the total fair value of the share-based payment arrangement, or is otherwise beneficial to the employee, as measured at the date of modification.Significant judgement and source of estimation uncertaintyManagement used the Binomial Tree Valuation method to determine the value of the Share Appreciation Rights at issue date.
Group and CompanyShare Appreciation Rights SchemeThe share appreciation rights (SAR’s) which are granted to Directors and selected employees are divided into two main categories with various SAR issues within each category. The rights will vest if the share price at each vesting date exceeds the hurdle price. The hurdle price is the strike (allocation) price grown by CPI plus 2% per year over the vesting period. In the situation that the hurdle price is not achieved at the vesting date, 25% of the possible vested SAR’s will roll over to the next vesting date. During the current year, all Directors and selected employees who were previously granted Share Appreciation Rights (SAR’s) were given the option to either continue on the SAR scheme, agree a settlement value for their unvested SAR’s with the Group or modify their unvested SAR’s to the Calgro M3 Executive Share Scheme.The share appreciation rights scheme was amended following the respective elections of the participants which has been outlined below:1) One individual cancelled 50% of his unvested SAR’s and agreed new settlement terms. The remaining 50% of his
unvested SAR’s is still on the scheme2) Eight individuals converted 100% of the unvested SAR’s from the SAR scheme to the Executive Share Scheme3) Four individuals cancelled 100% of their unvested SAR’s and agreed new settlement terms
Notes to the Consolidated Financial Statements - continued
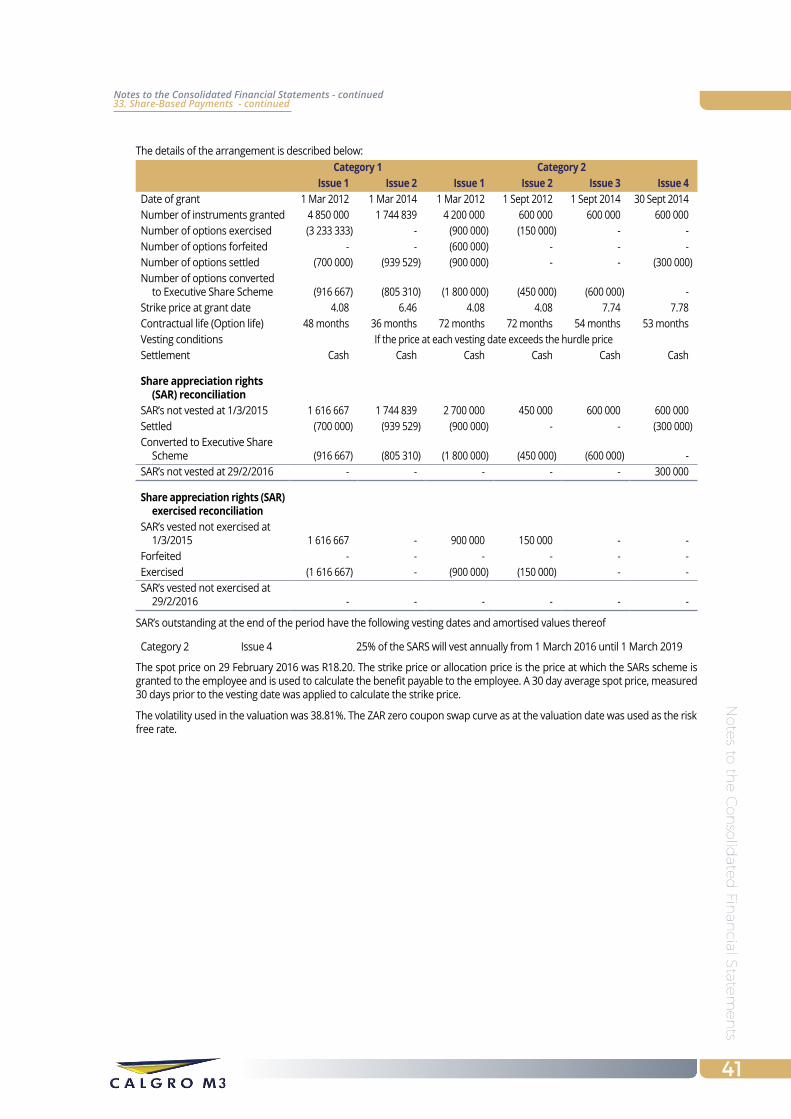
No
tes to
the C
on
solid
ated
Finan
cial State
men
ts
41
The details of the arrangement is described below:Category 1 Category 2
Issue 1 Issue 2 Issue 1 Issue 2 Issue 3 Issue 4Date of grant 1 Mar 2012 1 Mar 2014 1 Mar 2012 1 Sept 2012 1 Sept 2014 30 Sept 2014Number of instruments granted 4 850 000 1 744 839 4 200 000 600 000 600 000 600 000 Number of options exercised (3 233 333) - (900 000) (150 000) - - Number of options forfeited - - (600 000) - - - Number of options settled (700 000) (939 529) (900 000) - - (300 000)Number of options converted
to Executive Share Scheme (916 667) (805 310) (1 800 000) (450 000) (600 000) - Strike price at grant date 4.08 6.46 4.08 4.08 7.74 7.78Contractual life (Option life) 48 months 36 months 72 months 72 months 54 months 53 monthsVesting conditions If the price at each vesting date exceeds the hurdle priceSettlement Cash Cash Cash Cash Cash Cash
Share appreciation rights (SAR) reconciliation
SAR’s not vested at 1/3/2015 1 616 667 1 744 839 2 700 000 450 000 600 000 600 000 Settled (700 000) (939 529) (900 000) - - (300 000)Converted to Executive Share
Scheme (916 667) (805 310) (1 800 000) (450 000) (600 000) - SAR’s not vested at 29/2/2016 - - - - - 300 000
Share appreciation rights (SAR) exercised reconciliation
SAR’s vested not exercised at 1/3/2015 1 616 667 - 900 000 150 000 - -
Forfeited - - - - - - Exercised (1 616 667) - (900 000) (150 000) - - SAR’s vested not exercised at
29/2/2016 - - - - - -
SAR’s outstanding at the end of the period have the following vesting dates and amortised values thereof
Category 2 Issue 4 25% of the SARS will vest annually from 1 March 2016 until 1 March 2019
The spot price on 29 February 2016 was R18.20. The strike price or allocation price is the price at which the SARs scheme is granted to the employee and is used to calculate the benefit payable to the employee. A 30 day average spot price, measured 30 days prior to the vesting date was applied to calculate the strike price.
The volatility used in the valuation was 38.81%. The ZAR zero coupon swap curve as at the valuation date was used as the risk free rate.
33. Share-Based Payments - continuedNotes to the Consolidated Financial Statements - continued
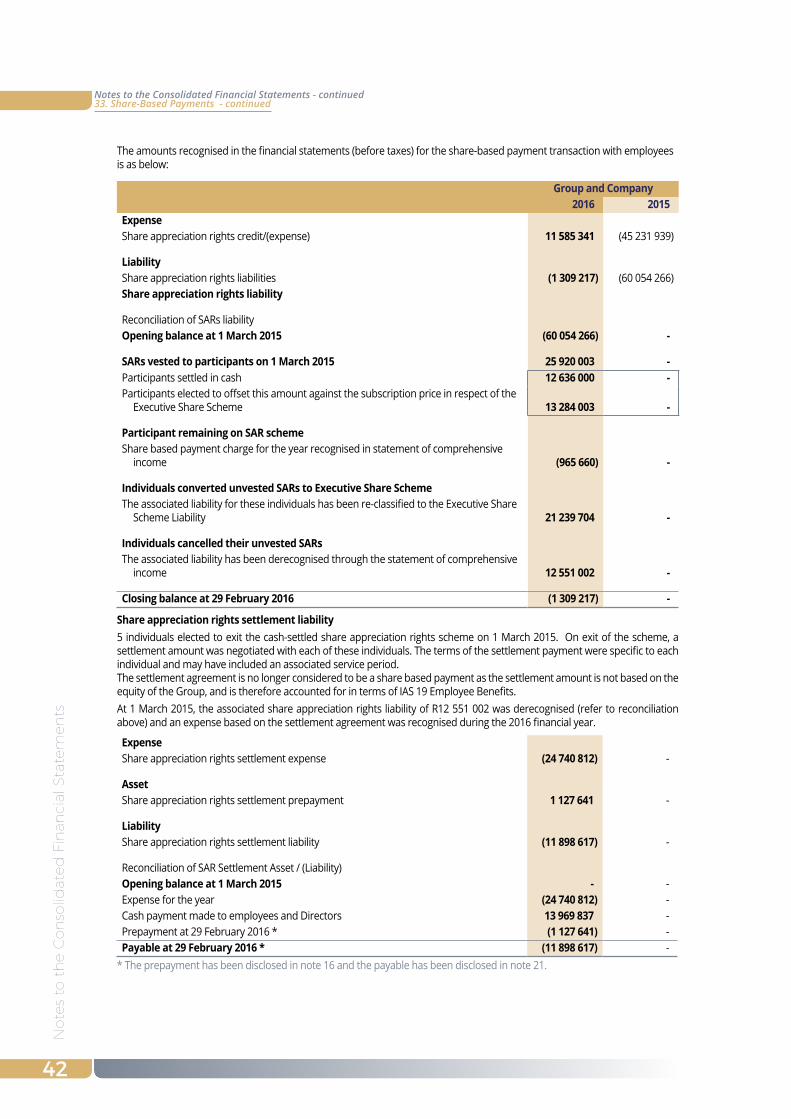
No
tes
to t
he C
on
solid
ated
Fin
anci
al S
tate
men
ts
42
The amounts recognised in the financial statements (before taxes) for the share-based payment transaction with employees is as below:
Group and Company2016 2015
ExpenseShare appreciation rights credit/(expense) 11 585 341 (45 231 939)
LiabilityShare appreciation rights liabilities (1 309 217) (60 054 266)Share appreciation rights liability
Reconciliation of SARs liabilityOpening balance at 1 March 2015 (60 054 266) -
SARs vested to participants on 1 March 2015 25 920 003 - Participants settled in cash 12 636 000 - Participants elected to offset this amount against the subscription price in respect of the
Executive Share Scheme 13 284 003 -
Participant remaining on SAR schemeShare based payment charge for the year recognised in statement of comprehensive
income (965 660) -
Individuals converted unvested SARs to Executive Share SchemeThe associated liability for these individuals has been re-classified to the Executive Share
Scheme Liability 21 239 704 -
Individuals cancelled their unvested SARsThe associated liability has been derecognised through the statement of comprehensive
income 12 551 002 -
Closing balance at 29 February 2016 (1 309 217) -
Share appreciation rights settlement liability5 individuals elected to exit the cash-settled share appreciation rights scheme on 1 March 2015. On exit of the scheme, a settlement amount was negotiated with each of these individuals. The terms of the settlement payment were specific to each individual and may have included an associated service period. The settlement agreement is no longer considered to be a share based payment as the settlement amount is not based on the equity of the Group, and is therefore accounted for in terms of IAS 19 Employee Benefits.At 1 March 2015, the associated share appreciation rights liability of R12 551 002 was derecognised (refer to reconciliation above) and an expense based on the settlement agreement was recognised during the 2016 financial year.
ExpenseShare appreciation rights settlement expense (24 740 812) -
AssetShare appreciation rights settlement prepayment 1 127 641 -
LiabilityShare appreciation rights settlement liability (11 898 617) -
Reconciliation of SAR Settlement Asset / (Liability)Opening balance at 1 March 2015 - - Expense for the year (24 740 812) - Cash payment made to employees and Directors 13 969 837 - Prepayment at 29 February 2016 * (1 127 641) - Payable at 29 February 2016 * (11 898 617) -
* The prepayment has been disclosed in note 16 and the payable has been disclosed in note 21.
33. Share-Based Payments - continuedNotes to the Consolidated Financial Statements - continued

No
tes to
the C
on
solid
ated
Finan
cial State
men
ts
43
Calgro M3 Executive Share SchemeThe Executive Share Scheme was approved by the shareholders of Calgro M3 Holdings Limited (Holding company) in July 2015 whereby 10,215,572 shares in Calgro M3 Holdings were made available to participants of the Scheme at a subscription price of R4.08. Only individuals who were currently allocated SARs and elected to convert at least 75% of their unvested SARS into the new scheme were eligible to participate in the new scheme. 9 518 700 shares were granted to individuals during the year and 696,872 shares were not taken up. The Calgro M3 Executive Share Scheme is considered to be a modification of the SAR scheme. Under the Executive Share Scheme, participants are allocated shares in line with the scheme rules and are required to subscribe for these shares at R4.08 per share. There are no performance conditions related to this scheme, other than the service period as outlined below. Shares issued under the scheme may not be sold by participants until the release dates stipulated in the scheme rules as outlined below. In terms of IFRS 2 Share Based Payments, the above scheme is considered to be cash settled from the persepective of Calgro M3 Developments Limited and equity settled from the perspective of Calgro M3 Holdings Limited.The spot price on 29 February 2016 was R18.20. The strike price or allocation price is the price at which the SAR scheme is granted to the employee and is used to calculate the benefit payable to the employee. A 30 day average spot price, measured 30 days prior to the vesting date was applied to calculate the strike price. The volatility used in the valuation was 38.81%. The ZAR zero coupon swap curve as at the valuation date was used as the risk free rate.
Reconciliation of subscription price for shares issued:Total amount to be received for subscription of shares 38 836 294 Cash received (8 113 137)Offset against 2015 bonus (4 150 466)Offset against exercised SARs (13 284 003)Balance receivable by Group and Company included under Trade and other receivables 13 288 688
Number of shares
granted
Service commencement
date
50% trading restriction
- release date 1
50% trading restriction
- release date 2
Service period
Final release date Value
Category 1 1 050 069 1-Mar-15 1-Mar-17 1-Mar-18 3 years 1-Mar-18 10 867 613 Category 2 2 090 618 1-Mar-15 1-Mar-19 1-Mar-20 5 years 1-Mar-20 42 499 581 Category 3 6 378 012 1-Mar-15 1-Mar-20 1-Mar-21 6 years 1-Mar-21 15 805 681 total 9 518 700 69 172 876
The amounts recognised in the financial statements (before taxes) for the share-based payment transaction with employees is as below:
Group and Company2016 2015
ExpenseExecutive share scheme expense (47 933 172) -
LiabilityExecutive share scheme liability (69 172 876) -
Reconciliation of Executive Share Scheme liabilityOpening balance at 1 March 2015 - -
Individuals converted unvested SARs to Executive Share SchemeThe associated liability for these individuals was re-classified from the SAR liability (21 239 704) -
Modification from the SAR Scheme to the Executive Share SchemeAdditional expense recognised in the statement of comprehensive income at
modifcation date as if terms of the Executive Share Scheme were always in place (12 568 744) -
2016 share-based payment expenseShare-based payment charge for the year recognised in statement of comprehensive
income (35 364 428) -
Closing balance at 29 February 2016 (69 172 876) -
33. Share-Based Payments - continuedNotes to the Consolidated Financial Statements - continued
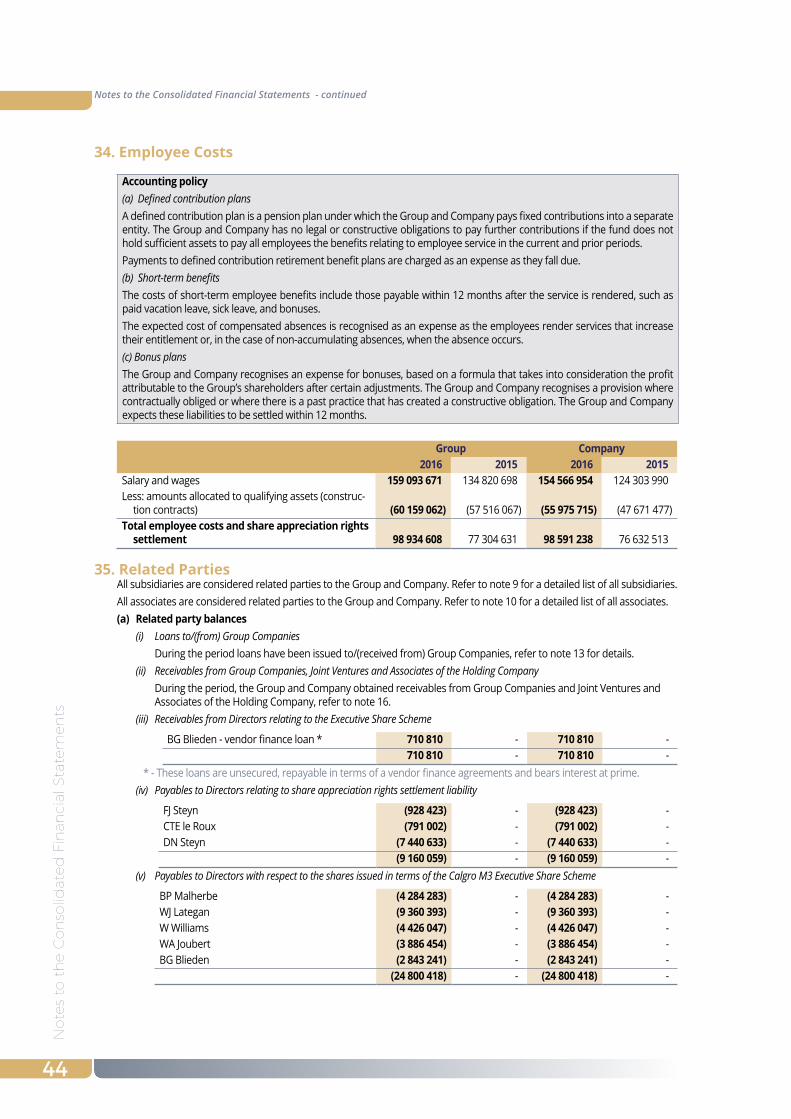
No
tes
to t
he C
on
solid
ated
Fin
anci
al S
tate
men
ts
44
34. Employee Costs
Accounting policy(a) Defined contribution plansA defined contribution plan is a pension plan under which the Group and Company pays fixed contributions into a separate entity. The Group and Company has no legal or constructive obligations to pay further contributions if the fund does not hold sufficient assets to pay all employees the benefits relating to employee service in the current and prior periods.Payments to defined contribution retirement benefit plans are charged as an expense as they fall due.(b) Short-term benefitsThe costs of short-term employee benefits include those payable within 12 months after the service is rendered, such as paid vacation leave, sick leave, and bonuses.The expected cost of compensated absences is recognised as an expense as the employees render services that increase their entitlement or, in the case of non-accumulating absences, when the absence occurs.(c) Bonus plansThe Group and Company recognises an expense for bonuses, based on a formula that takes into consideration the profit attributable to the Group’s shareholders after certain adjustments. The Group and Company recognises a provision where contractually obliged or where there is a past practice that has created a constructive obligation. The Group and Company expects these liabilities to be settled within 12 months.
Group Company2016 2015 2016 2015
Salary and wages 159 093 671 134 820 698 154 566 954 124 303 990 Less: amounts allocated to qualifying assets (construc-
tion contracts) (60 159 062) (57 516 067) (55 975 715) (47 671 477) Total employee costs and share appreciation rights
settlement 98 934 608 77 304 631 98 591 238 76 632 513
35. Related PartiesAll subsidiaries are considered related parties to the Group and Company. Refer to note 9 for a detailed list of all subsidiaries.All associates are considered related parties to the Group and Company. Refer to note 10 for a detailed list of all associates.(a) Related party balances
(i) Loans to/(from) Group Companies During the period loans have been issued to/(received from) Group Companies, refer to note 13 for details.(ii) Receivables from Group Companies, Joint Ventures and Associates of the Holding Company During the period, the Group and Company obtained receivables from Group Companies and Joint Ventures and
Associates of the Holding Company, refer to note 16.(iii) Receivables from Directors relating to the Executive Share Scheme
BG Blieden - vendor finance loan * 710 810 - 710 810 - 710 810 - 710 810 -
* - These loans are unsecured, repayable in terms of a vendor finance agreements and bears interest at prime.(iv) Payables to Directors relating to share appreciation rights settlement liability
FJ Steyn (928 423) - (928 423) - CTE le Roux (791 002) - (791 002) - DN Steyn (7 440 633) - (7 440 633) -
(9 160 059) - (9 160 059) - (v) Payables to Directors with respect to the shares issued in terms of the Calgro M3 Executive Share Scheme
BP Malherbe (4 284 283) - (4 284 283) - WJ Lategan (9 360 393) - (9 360 393) - W Williams (4 426 047) - (4 426 047) - WA Joubert (3 886 454) - (3 886 454) - BG Blieden (2 843 241) - (2 843 241) -
(24 800 418) - (24 800 418) -
Notes to the Consolidated Financial Statements - continued
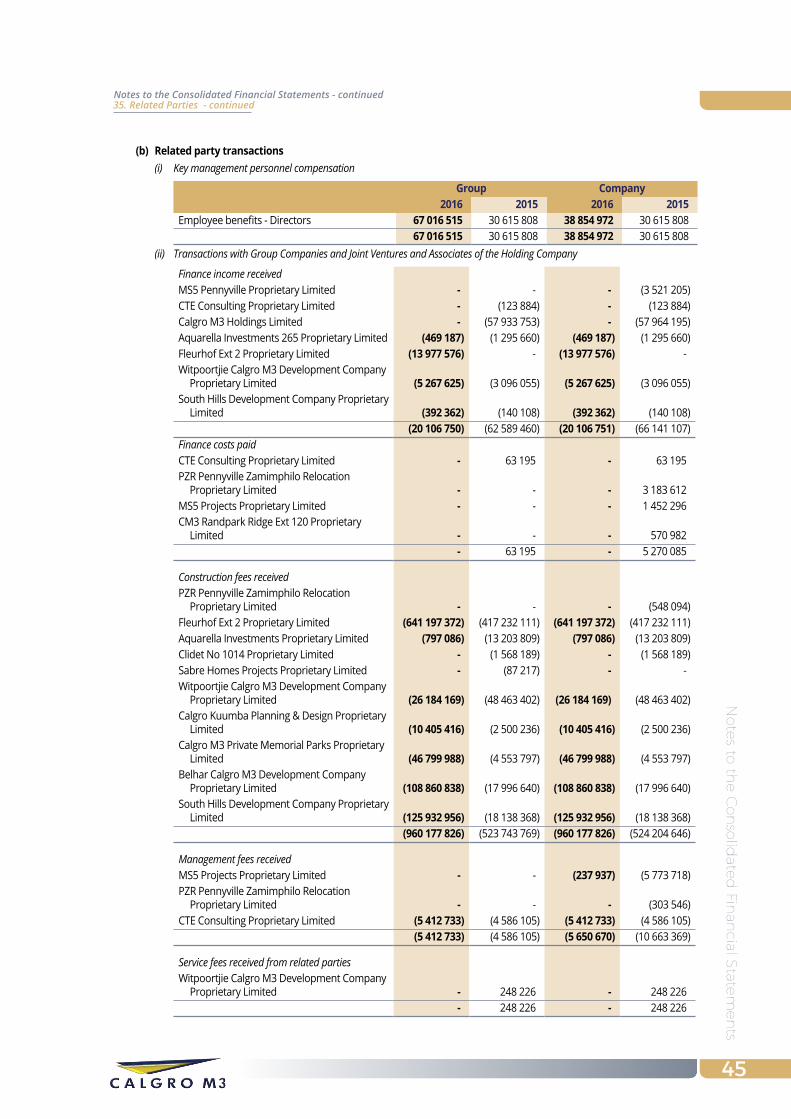
No
tes to
the C
on
solid
ated
Finan
cial State
men
ts
45
(b) Related party transactions(i) Key management personnel compensation
Group Company2016 2015 2016 2015
Employee benefits - Directors 67 016 515 30 615 808 38 854 972 30 615 808 67 016 515 30 615 808 38 854 972 30 615 808
(ii) Transactions with Group Companies and Joint Ventures and Associates of the Holding Company
Finance income receivedMS5 Pennyville Proprietary Limited - - - (3 521 205) CTE Consulting Proprietary Limited - (123 884) - (123 884) Calgro M3 Holdings Limited - (57 933 753) - (57 964 195) Aquarella Investments 265 Proprietary Limited (469 187) (1 295 660) (469 187) (1 295 660) Fleurhof Ext 2 Proprietary Limited (13 977 576) - (13 977 576) - Witpoortjie Calgro M3 Development Company
Proprietary Limited (5 267 625) (3 096 055) (5 267 625) (3 096 055) South Hills Development Company Proprietary
Limited (392 362) (140 108) (392 362) (140 108) (20 106 750) (62 589 460) (20 106 751) (66 141 107)
Finance costs paidCTE Consulting Proprietary Limited - 63 195 - 63 195 PZR Pennyville Zamimphilo Relocation
Proprietary Limited - - - 3 183 612 MS5 Projects Proprietary Limited - - - 1 452 296 CM3 Randpark Ridge Ext 120 Proprietary
Limited - - - 570 982 - 63 195 - 5 270 085
Construction fees receivedPZR Pennyville Zamimphilo Relocation
Proprietary Limited - - - (548 094) Fleurhof Ext 2 Proprietary Limited (641 197 372) (417 232 111) (641 197 372) (417 232 111) Aquarella Investments Proprietary Limited (797 086) (13 203 809) (797 086) (13 203 809) Clidet No 1014 Proprietary Limited - (1 568 189) - (1 568 189) Sabre Homes Projects Proprietary Limited - (87 217) - - Witpoortjie Calgro M3 Development Company
Proprietary Limited (26 184 169) (48 463 402) (26 184 169) (48 463 402) Calgro Kuumba Planning & Design Proprietary
Limited (10 405 416) (2 500 236) (10 405 416) (2 500 236) Calgro M3 Private Memorial Parks Proprietary
Limited (46 799 988) (4 553 797) (46 799 988) (4 553 797) Belhar Calgro M3 Development Company
Proprietary Limited (108 860 838) (17 996 640) (108 860 838) (17 996 640) South Hills Development Company Proprietary
Limited (125 932 956) (18 138 368) (125 932 956) (18 138 368) (960 177 826) (523 743 769) (960 177 826) (524 204 646)
Management fees receivedMS5 Projects Proprietary Limited - - (237 937) (5 773 718) PZR Pennyville Zamimphilo Relocation
Proprietary Limited - - - (303 546) CTE Consulting Proprietary Limited (5 412 733) (4 586 105) (5 412 733) (4 586 105)
(5 412 733) (4 586 105) (5 650 670) (10 663 369)
Service fees received from related partiesWitpoortjie Calgro M3 Development Company
Proprietary Limited - 248 226 - 248 226 - 248 226 - 248 226
35. Related Parties - continuedNotes to the Consolidated Financial Statements - continued
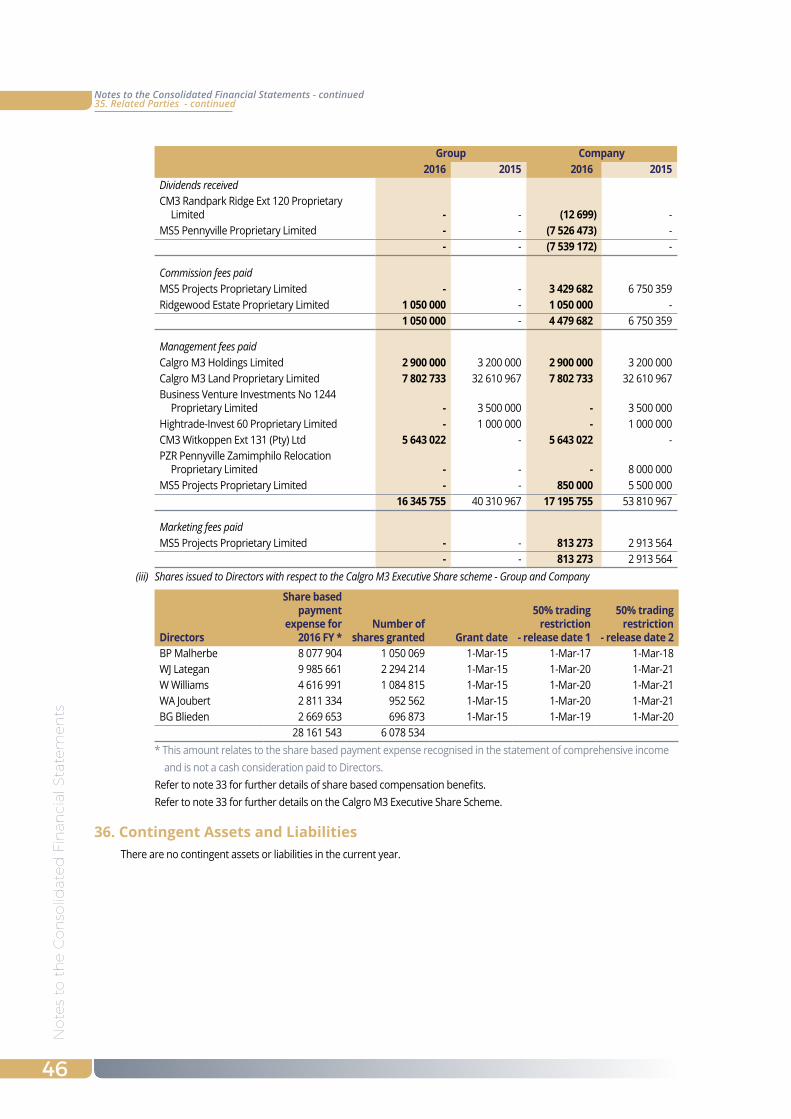
No
tes
to t
he C
on
solid
ated
Fin
anci
al S
tate
men
ts
46
Group Company2016 2015 2016 2015
Dividends receivedCM3 Randpark Ridge Ext 120 Proprietary
Limited - - (12 699) - MS5 Pennyville Proprietary Limited - - (7 526 473) -
- - (7 539 172) -
Commission fees paidMS5 Projects Proprietary Limited - - 3 429 682 6 750 359 Ridgewood Estate Proprietary Limited 1 050 000 - 1 050 000 -
1 050 000 - 4 479 682 6 750 359
Management fees paidCalgro M3 Holdings Limited 2 900 000 3 200 000 2 900 000 3 200 000 Calgro M3 Land Proprietary Limited 7 802 733 32 610 967 7 802 733 32 610 967 Business Venture Investments No 1244
Proprietary Limited - 3 500 000 - 3 500 000 Hightrade-Invest 60 Proprietary Limited - 1 000 000 - 1 000 000 CM3 Witkoppen Ext 131 (Pty) Ltd 5 643 022 - 5 643 022 - PZR Pennyville Zamimphilo Relocation
Proprietary Limited - - - 8 000 000 MS5 Projects Proprietary Limited - - 850 000 5 500 000
16 345 755 40 310 967 17 195 755 53 810 967
Marketing fees paidMS5 Projects Proprietary Limited - - 813 273 2 913 564
- - 813 273 2 913 564 (iii) Shares issued to Directors with respect to the Calgro M3 Executive Share scheme - Group and Company
Directors
Share based payment
expense for 2016 FY *
Number of shares granted Grant date
50% trading restriction
- release date 1
50% trading restriction
- release date 2BP Malherbe 8 077 904 1 050 069 1-Mar-15 1-Mar-17 1-Mar-18WJ Lategan 9 985 661 2 294 214 1-Mar-15 1-Mar-20 1-Mar-21W Williams 4 616 991 1 084 815 1-Mar-15 1-Mar-20 1-Mar-21WA Joubert 2 811 334 952 562 1-Mar-15 1-Mar-20 1-Mar-21BG Blieden 2 669 653 696 873 1-Mar-15 1-Mar-19 1-Mar-20
28 161 543 6 078 534 * This amount relates to the share based payment expense recognised in the statement of comprehensive income and is not a cash consideration paid to Directors.Refer to note 33 for further details of share based compensation benefits.Refer to note 33 for further details on the Calgro M3 Executive Share Scheme.
36. Contingent Assets and LiabilitiesThere are no contingent assets or liabilities in the current year.
35. Related Parties - continuedNotes to the Consolidated Financial Statements - continued
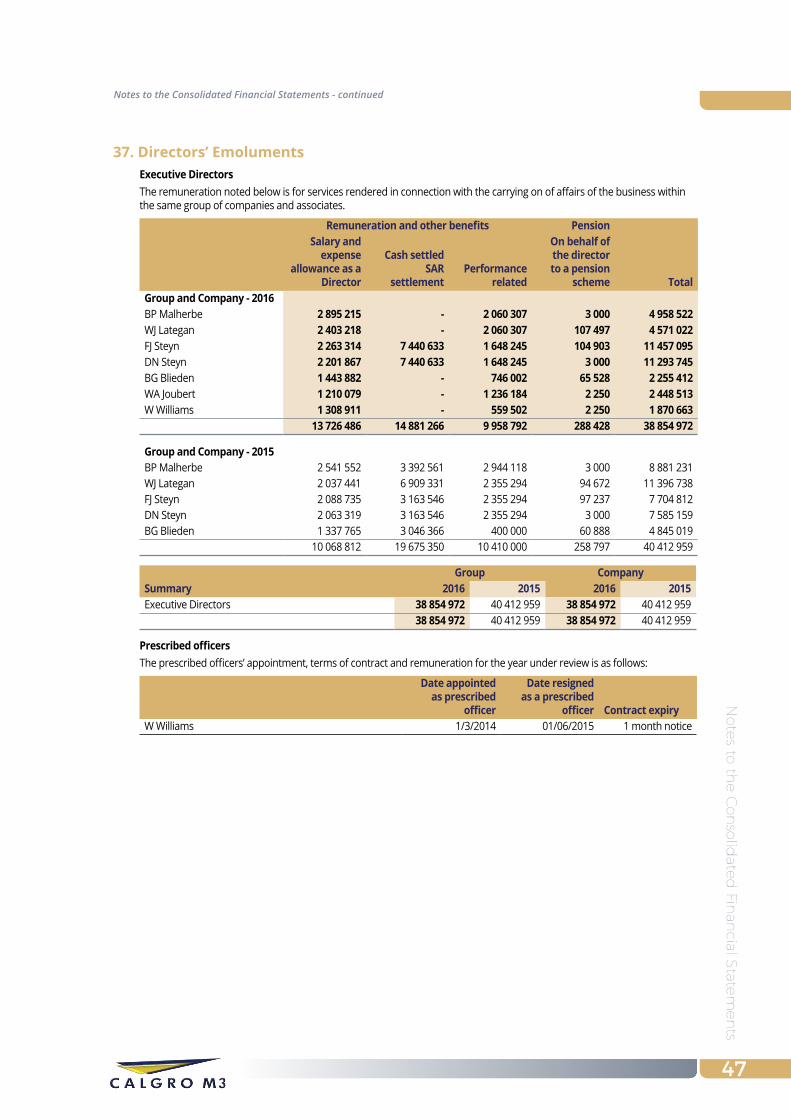
No
tes to
the C
on
solid
ated
Finan
cial State
men
ts
47
37. Directors’ EmolumentsExecutive DirectorsThe remuneration noted below is for services rendered in connection with the carrying on of affairs of the business within the same group of companies and associates.
Remuneration and other benefits PensionSalary and
expense allowance as a
Director
Cash settled SAR
settlementPerformance
related
On behalf of the director to a pension
scheme totalGroup and Company - 2016BP Malherbe 2 895 215 - 2 060 307 3 000 4 958 522 WJ Lategan 2 403 218 - 2 060 307 107 497 4 571 022 FJ Steyn 2 263 314 7 440 633 1 648 245 104 903 11 457 095 DN Steyn 2 201 867 7 440 633 1 648 245 3 000 11 293 745 BG Blieden 1 443 882 - 746 002 65 528 2 255 412 WA Joubert 1 210 079 - 1 236 184 2 250 2 448 513 W Williams 1 308 911 - 559 502 2 250 1 870 663
13 726 486 14 881 266 9 958 792 288 428 38 854 972
Group and Company - 2015BP Malherbe 2 541 552 3 392 561 2 944 118 3 000 8 881 231 WJ Lategan 2 037 441 6 909 331 2 355 294 94 672 11 396 738 FJ Steyn 2 088 735 3 163 546 2 355 294 97 237 7 704 812 DN Steyn 2 063 319 3 163 546 2 355 294 3 000 7 585 159 BG Blieden 1 337 765 3 046 366 400 000 60 888 4 845 019
10 068 812 19 675 350 10 410 000 258 797 40 412 959
Group CompanySummary 2016 2015 2016 2015Executive Directors 38 854 972 40 412 959 38 854 972 40 412 959
38 854 972 40 412 959 38 854 972 40 412 959
Prescribed officersThe prescribed officers’ appointment, terms of contract and remuneration for the year under review is as follows:
Date appointed as prescribed
officer
Date resigned as a prescribed
officer Contract expiryW Williams 1/3/2014 01/06/2015 1 month notice
Notes to the Consolidated Financial Statements - continued
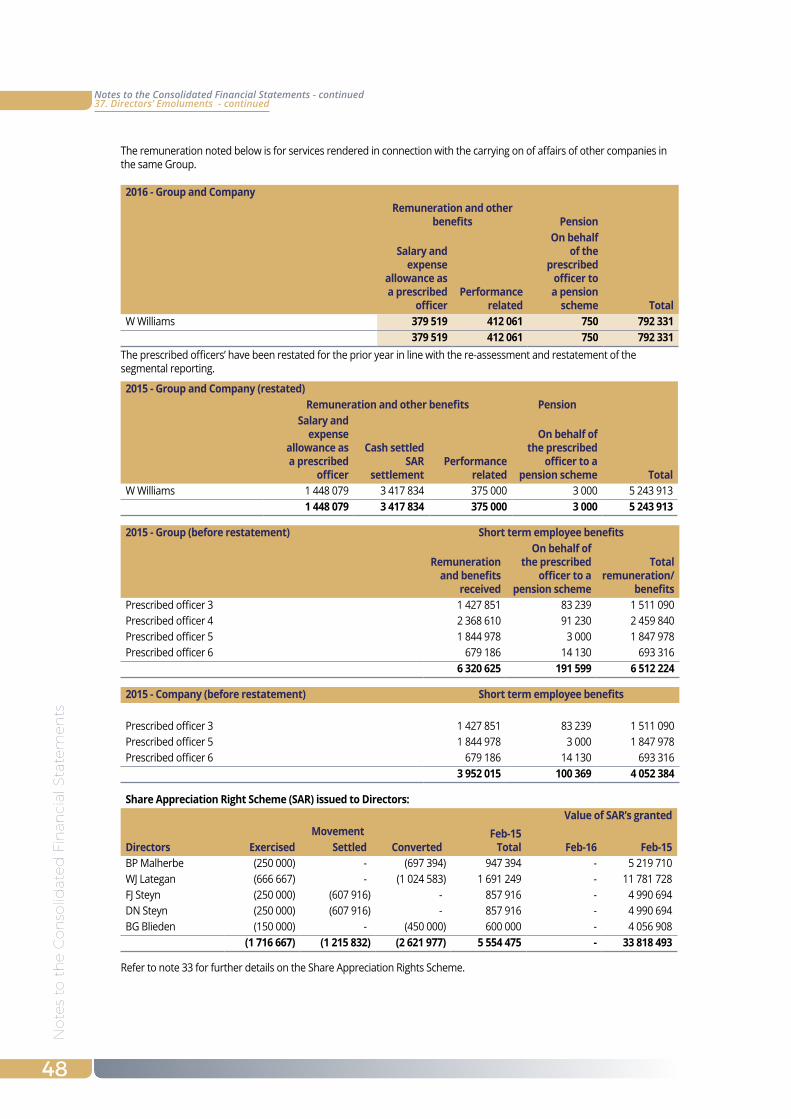
No
tes
to t
he C
on
solid
ated
Fin
anci
al S
tate
men
ts
48
The remuneration noted below is for services rendered in connection with the carrying on of affairs of other companies in the same Group.
2016 - Group and CompanyRemuneration and other
benefits Pension
Salary and expense
allowance as a prescribed
officerPerformance
related
On behalf of the
prescribed officer to a pension
scheme totalW Williams 379 519 412 061 750 792 331
379 519 412 061 750 792 331 The prescribed officers’ have been restated for the prior year in line with the re-assessment and restatement of the segmental reporting.
2015 - Group and Company (restated)Remuneration and other benefits Pension
Salary and expense
allowance as a prescribed
officer
Cash settled SAR
settlementPerformance
related
On behalf of the prescribed
officer to a pension scheme total
W Williams 1 448 079 3 417 834 375 000 3 000 5 243 913 1 448 079 3 417 834 375 000 3 000 5 243 913
2015 - Group (before restatement) Short term employee benefits
Remuneration and benefits
received
On behalf of the prescribed
officer to a pension scheme
total remuneration/
benefitsPrescribed officer 3 1 427 851 83 239 1 511 090 Prescribed officer 4 2 368 610 91 230 2 459 840 Prescribed officer 5 1 844 978 3 000 1 847 978 Prescribed officer 6 679 186 14 130 693 316
6 320 625 191 599 6 512 224
2015 - Company (before restatement) Short term employee benefits
Prescribed officer 3 1 427 851 83 239 1 511 090 Prescribed officer 5 1 844 978 3 000 1 847 978 Prescribed officer 6 679 186 14 130 693 316
3 952 015 100 369 4 052 384
Share Appreciation Right Scheme (SAR) issued to Directors:Value of SAR’s granted
Movement Feb-15total Feb-16 Feb-15Directors Exercised Settled Converted
BP Malherbe (250 000) - (697 394) 947 394 - 5 219 710 WJ Lategan (666 667) - (1 024 583) 1 691 249 - 11 781 728 FJ Steyn (250 000) (607 916) - 857 916 - 4 990 694 DN Steyn (250 000) (607 916) - 857 916 - 4 990 694 BG Blieden (150 000) - (450 000) 600 000 - 4 056 908
(1 716 667) (1 215 832) (2 621 977) 5 554 475 - 33 818 493
Refer to note 33 for further details on the Share Appreciation Rights Scheme.
37. Directors’ Emoluments - continuedNotes to the Consolidated Financial Statements - continued
No
tes to
the C
on
solid
ated
Finan
cial State
men
ts
49
38. Segment ReportingThe appointed Chief Operating Decision Maker (CODM) within the Group is the Group Executive Committee (Exco). This is because it is Exco’s responsibility to meet on a frequent basis to review budgets, allocate resources and assess the performance of its operating segments. At each Exco meeting, the progress towards strategic objectives, approving of budgets and comparing actual versus budgets for the period under review is discussed in detail.
The information provided to Exco summarises financial data and information into two tiers, these being:❚ By type of activity - Construction and Infrastructure❚ A detailed breakdown of each project currently and potentially being undertaken by the Group.
At each Exco meeting, there are discussions held with other managers who are tasked with managing each designated operating segment. Information that is provided to Exco does not analyse project detail, but rather focuses on the overall results of the business activities, as a project may use activities from one or more of the operating segments.
The feedback provided by these individuals is per activity stream but may include project related matters where relevant to gain an understanding of performance during the period under review.
Exco then makes strategic and operational decisions based on the information provided by managers of the various operating segments as well as data and information provided by internal and external parties.
Exco assesses the performance of the operating segments based on a measure of adjusted profit before tax. This measurement basis excludes the effects of non-recurring expenditure from the operating segment such as legal expenses and goodwill impairments when the impairment is the result of an isolated, non-recurring event. The measure also excludes the effects of net finance income and the share of profits from associates as this information is not reviewed by Exco.
At 29 February 2016, the Group is organised on a national basis into 1 main operating segment:
The Group’s products consist of mid to high income housing as well as integrated developments. Integrated developments comprise affordable housing, social/Grassroots affordable Peoples’ housing as well as Reconstruction and Development Project/Breaking New Ground housing. The customer base includes financial institutions and the general public.
Please refer to note 9 for detailed analysis of the associate relationships as well as note 33 for related party transactions and balances that have an impact on the financial performance, financial position and cash flows for the Calgro M3 Development Group.
As the Group consist of only one segment namely Property Development, the information in the statement of comprehensive income and statement of financial position as listed below are provided to the CODM:
Statement of comprehensive income Statement of financial positionRevenue GoodwillOperating profit/(loss) InventoriesFinance cost Construction contracts
Borrowings
39. Going ConcernThe Directors believe that the Group has adequate financial resources to continue in operation for the foreseeable future and accordingly the financial statements have been prepared on a going concern basis.
The Directors are not aware of any new material changes that may adversely impact the group. The Directors are not aware of any material non-compliance with statutory or regulatory requirements. The Board is not aware of any pending changes in litigation that may affect the Group.
40. Events After the Reporting PeriodThe Directors are not aware of any matter or circumstances arising since the end of the financial year that warrants disclosure.
Notes to the Consolidated Financial Statements - continued