Embed Size (px)
Citation preview
Calculations Related to Coexistence Curves
• One can imagine putting a volatile liquid in an empty container and seeing one of two results:
• 1. All of the volatile liquid evaporates. In this case PGas will be less than the equilibrium vapor pressure of the substance/liquid.
• 2. Only some of the liquid eventually evaporates. Here Pgas equals the equilibrium vapor pressure.

Class Example:
• 1. A total of 3.00 g of liquid water was placed in an evacuated (initially) 12.0L container maintained at a temperature of 80.0 0C. Will a liquid/gas equilibrium be established? What piece of data is required to solve this problem? If no liquid/gas equilibrium is established, determine how much additional liquid water is required to have some liquid in equilibrium with H2O(g) in the container.

Critical Points
• The normal boiling point of water is 100 oC. At this temperature the vapor pressure of water is exactly 760mm Hg (the normal average atmospheric pressure at sea level). If we heat water in a sealed container all of the steam that is formed is trapped above the liquid water. The additional steam formed increases the pressure of the gas above the liquid and “naturally” the boiling point rises.
Critical Points
• There is a limit to how high we can raise the temperature of a liquid/gas mixture and still have a well-defined two phase equilibrium. One eventually reaches a temperature/pressure point beyond which there is only one fluid phase. The specific T and P where this occurs is referred to as the critical point of the substance.

Slide 5 of 61
The Critical Point
Copyright © 2011 Pearson Canada Inc.
General Chemistry: Chapter 12
• FIGURE 12-22• Attainment of the critical point for benzene
Critical Points
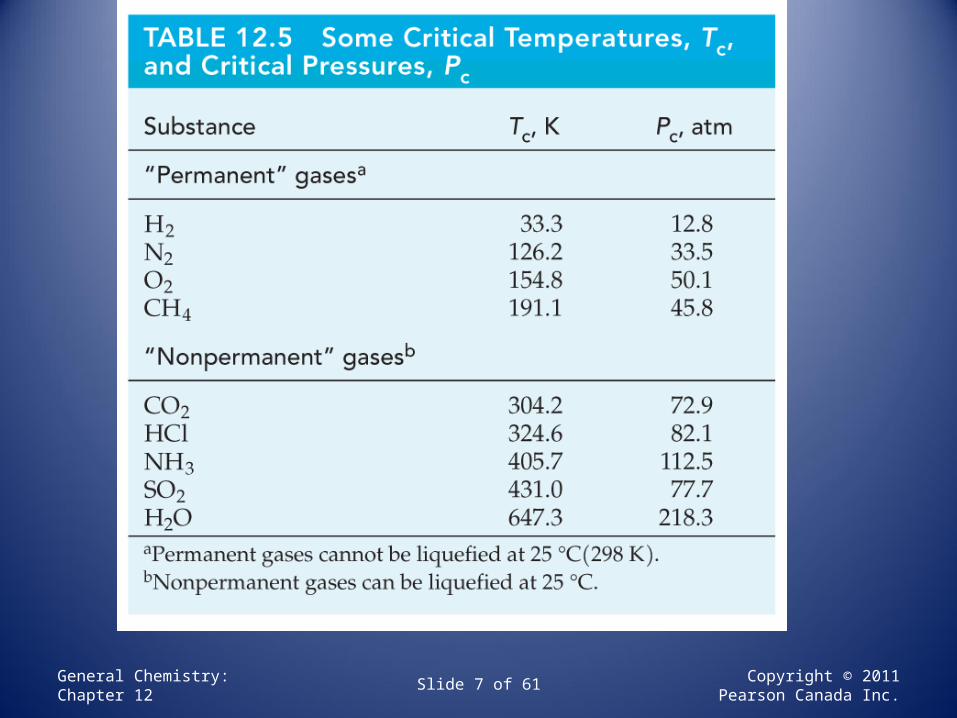
• The next slide shows critical point data for a number of substances. Do the “permanent” and “non-permanent” gases differ appreciably if one considers intermolecular forces?
Slide 7 of 61 Copyright © 2011 Pearson Canada Inc.
General Chemistry: Chapter 12

Other Coexistence Curves
• For substances such as molecular iodine which sublimes readily at ambient temperatures we can have another type of equilibrium
• I2(s) ↔ I2(g)• At a particular temperature and pressure the
vapor pressure of solid iodine is well defined. We can construct a coexistence curve illustrating the T’s and P’s where the solid and gas are in equilibrium.

Points on a Coexistence Curve
• The next slide indicates how a single point on a solid/liquid coexistence curve might be determined. At atmospheric pressure we determine the so-called normal melting point of a substance. Large pressure changes can appreciably change melting points.
Slide 10 of 61
Some Properties of Solids
Copyright © 2011 Pearson Canada Inc.
General Chemistry: Chapter 12
Figure 12-23
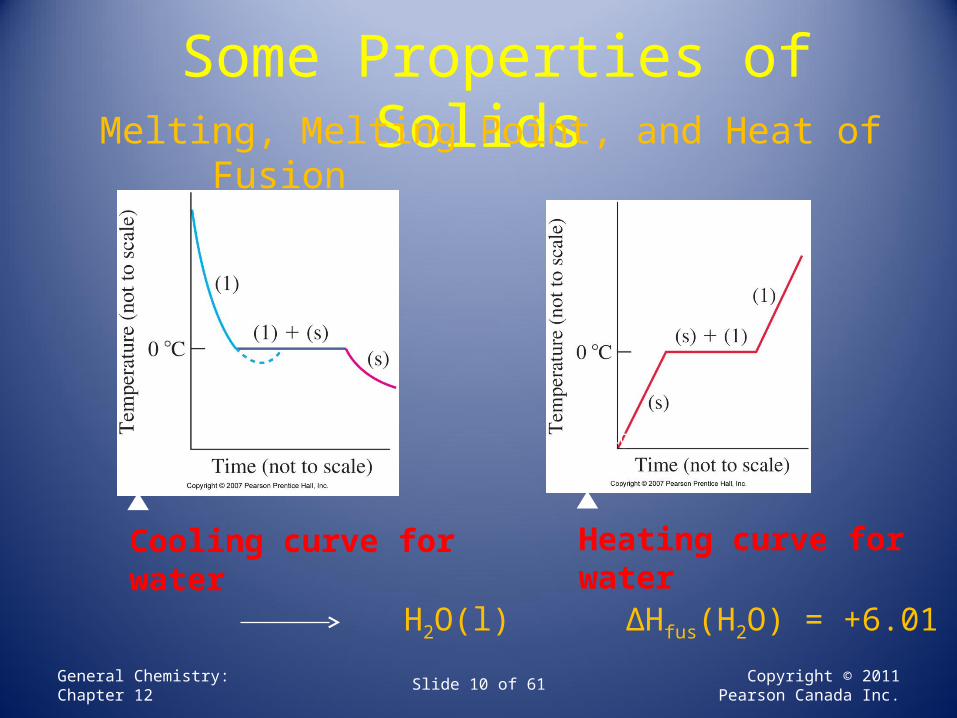
Cooling curve for water
Figure 12-24
Heating curve for water
Melting, Melting Point, and Heat of Fusion
H2O(s) H2O(l) ΔHfus(H2O) = +6.01 kJ/mol

Slide 11 of 61 Copyright © 2011 Pearson Canada Inc.
General Chemistry: Chapter 12
Slide 12 of 61
Sublimation
Copyright © 2011 Pearson Canada Inc.
General Chemistry: Chapter 12
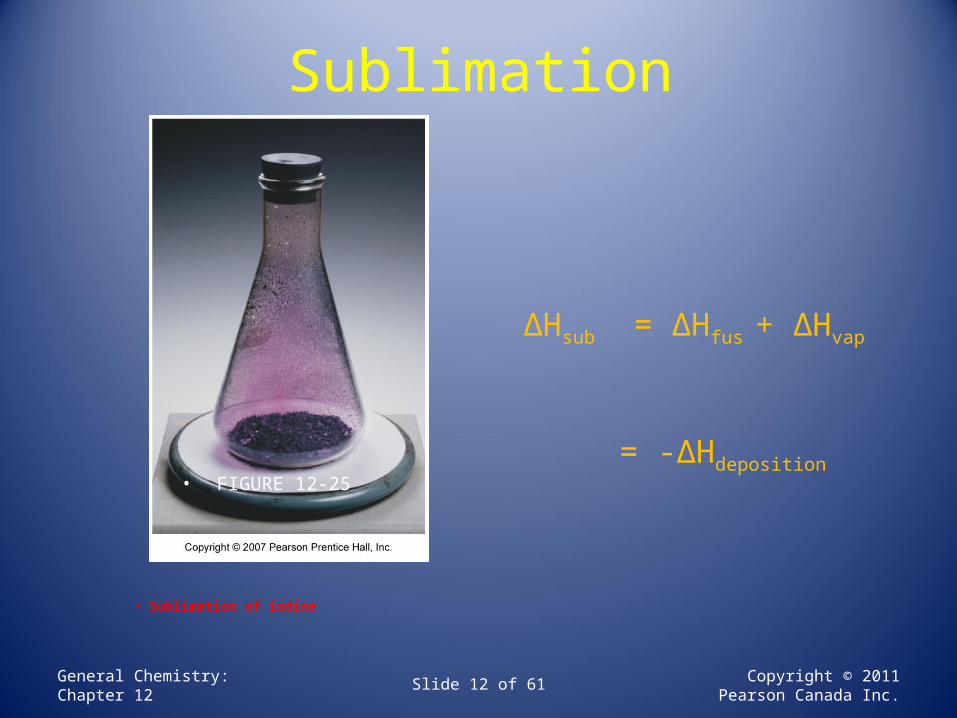
• FIGURE 12-25
• Sublimation of iodine
ΔHsub = ΔHfus + ΔHvap
= -ΔHdeposition

Phases Changes – Signs of ΔH’s:
• The left to right processes below are endothermic (remember intermolecular forces!).
• C2H5OH(s) → C2H5OH(l) → C2H5OH(g)
• The opposite processes are necessarily exothermic. We will soon see processes where ΔH for ionic deposition process is extremely exothermic (Eg. Na+(g) + Cl-(g) → NaCl(s)).
More Coexistence Curves:
• We can usually represent (s) ↔(g) and , as well, (l) ↔ (g) coexistence curves on the same graph. We can also look at (s) ↔ (l) coexistence curves – in this case we see melting point values that change very slowly as the pressure changes. Plotting all three coexistence curves (and sometimes more!) on a single graph gives us a phase diagram.

Slide 15 of 61 Copyright © 2011 Pearson Canada Inc.
General Chemistry: Chapter 12
• Phase diagram for iodine
Iodine
Slide 16 of 61
Carbon Dioxide
Copyright © 2011 Pearson Canada Inc.
General Chemistry: Chapter 12
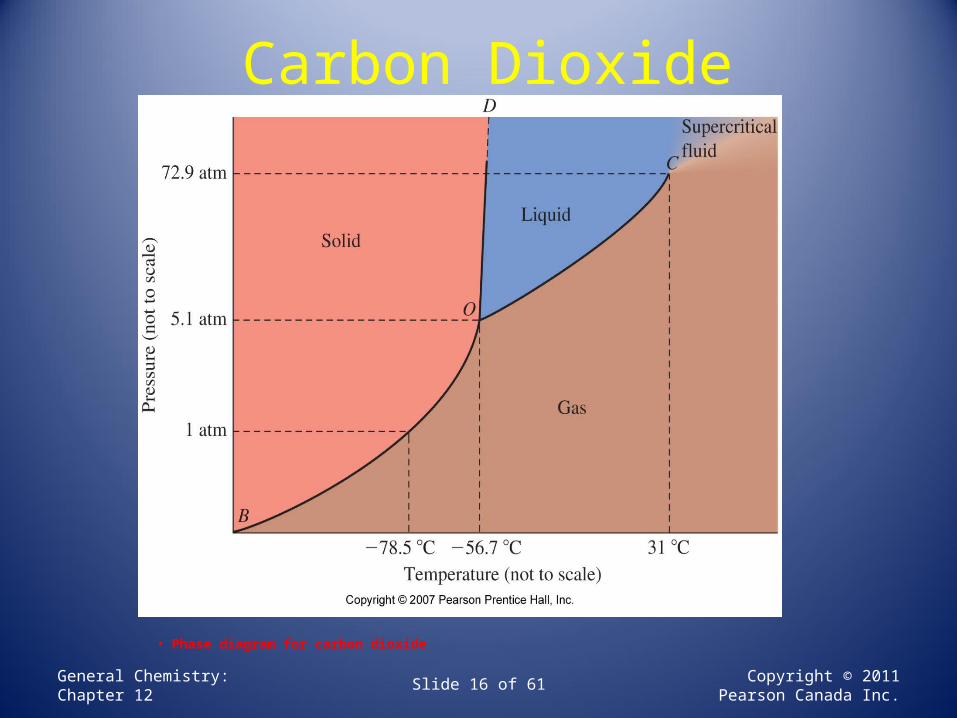
• Phase diagram for carbon dioxide
Critical Point and Triple Point
• We’ve discussed the critical point. The previous two graphs show in each case three coexistence curves meeting at one (unique!) point. This so-called triple point is well defined for a pure substance. At the triple point we have solid, liquid and gas phases simultaneously in equilibrium. What triple point is central to life in St. John’s?

Summary Slide
• The next slide summarizes a wealth of information about crystalline solids and intermolecular forces. Some familiar ideas are reiterated here – even molecules/atoms with very weak intermolecular forces can be liquefied and crystallized. In such cases liquefaction and crystallization will occur at relatively low temperatures.

Slide 19 of 61 Copyright © 2011 Pearson Canada Inc.
General Chemistry: Chapter 12

Ionic Bonding – the Born Haber Cycle
• Insight into the stability of ionic compounds can be obtained if we imagine breaking a reaction forming a binary ionic compound (from a metal and a nonmetal) into several steps. We’ll look at this for the formation of NaCl(s). In the next slide we will identify ΔH’s for familiar processes and introduce a new ΔH – the enthalpy of crystallization.
Slide 21 of 61
Energy Changes in the Formation of Ionic Crystals
Copyright © 2011 Pearson Canada Inc.
General Chemistry: Chapter 12
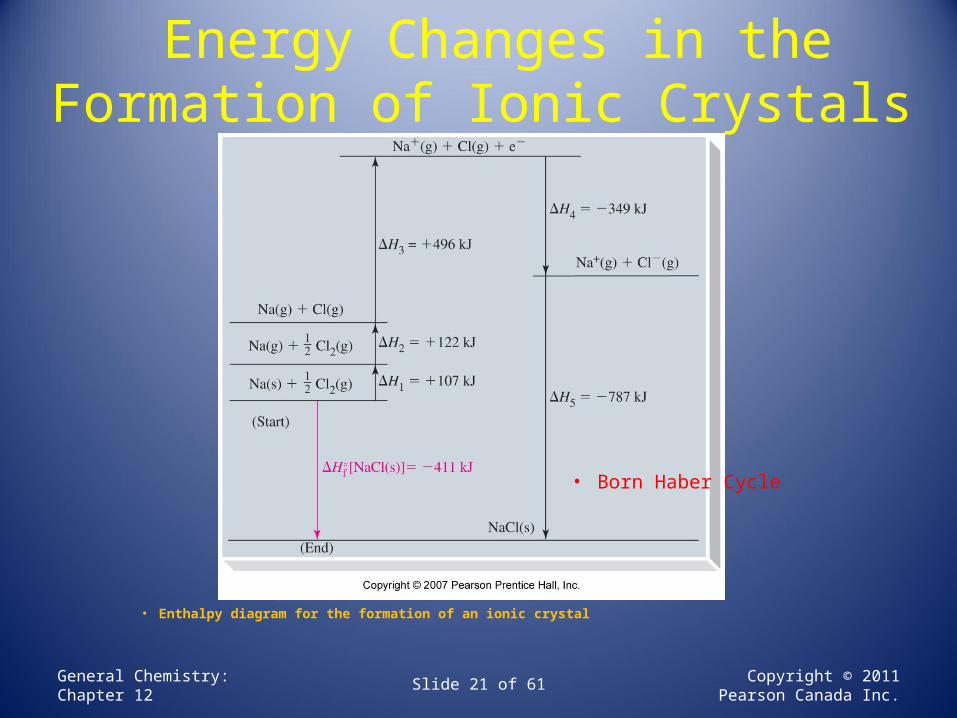
• Born Haber Cycle
• Enthalpy diagram for the formation of an ionic crystal

Born Haber Cycle - Comments• We consider a binary ionic substance being
formed from its constituent elements in their standard states. Along the way we first form neutral gaseous atoms of each element (a metal and a nonmetal) in the gas phase. We next form a metal ion (Na+(g), Mg2+(g)……) and a non-metal ion (Cl-(g), O2-(g)…..). Finally we combine the two metal ions to form an ionic crystal.
Born Haber Cycle
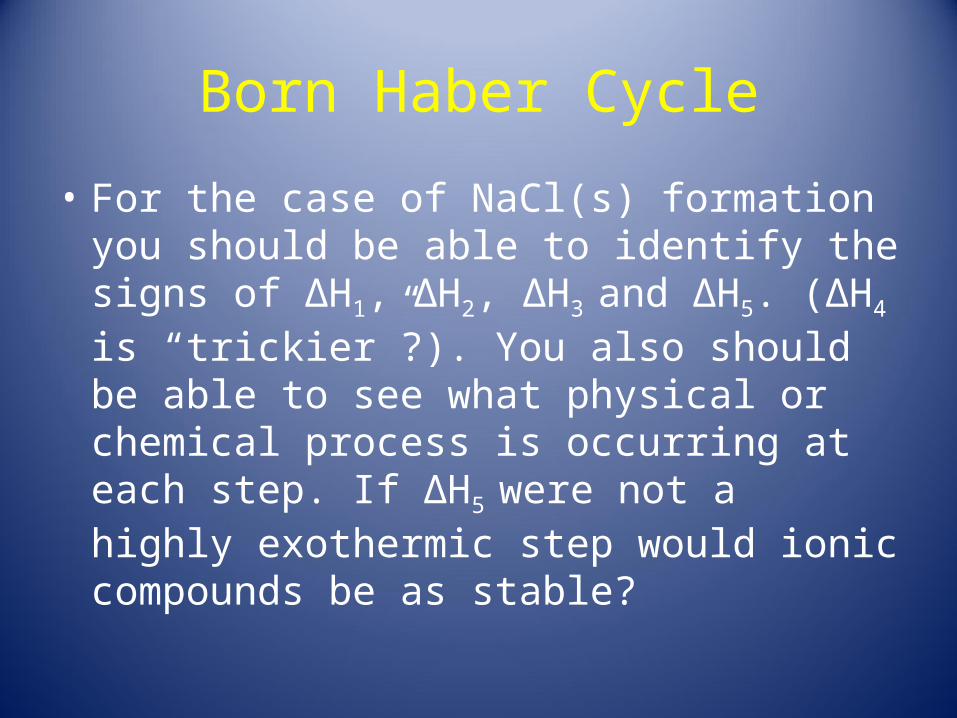
• For the case of NaCl(s) formation you should be able to identify the signs of ∆H1, ∆H2, ∆H3
and ∆H5. (∆H4 is “trickier”?). You also should be able to see what physical or chemical process is occurring at each step. If ∆H5 were not a highly exothermic step would ionic compounds be as stable?
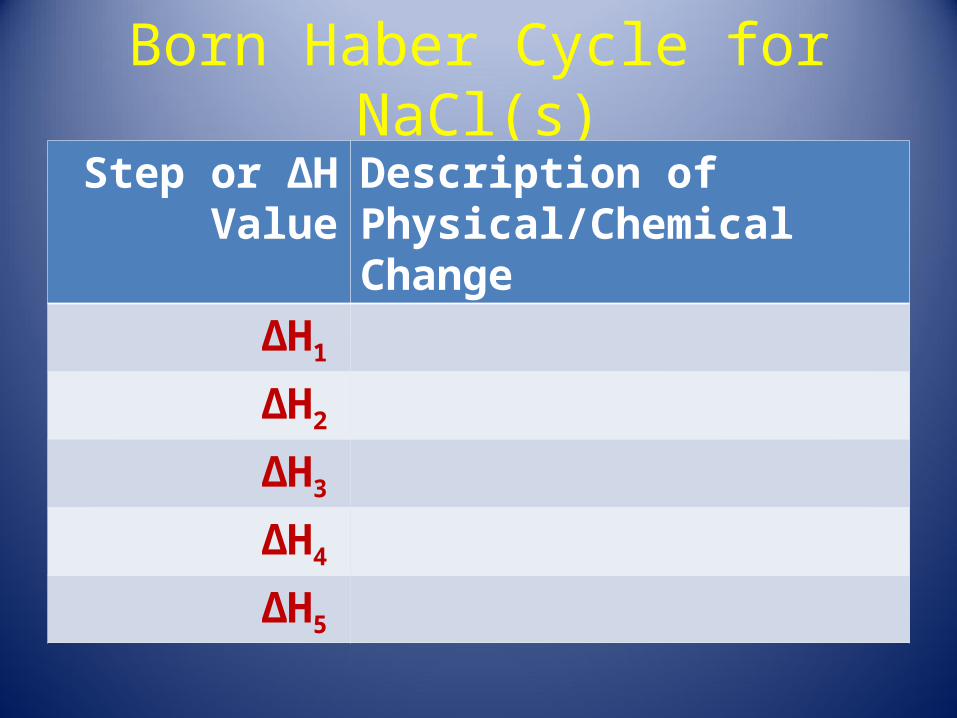
Born Haber Cycle for NaCl(s)
Step or ∆H Value
Description of Physical/Chemical Change
∆H1
∆H2
∆H3
∆H4
∆H5
Class Examples
• 1. How would the Born Haber cycle for the formation of NaBr(s) differ from the Born Haber cycle already considered for NaCl(s) formation?
• 2. How would the Born Haber cycle for the formation of MgO(s) and MgCl2(s) differ from the Born Haber cycle already considered for NaCl(s) formation?