Embed Size (px)
Citation preview

NASA Technical Memorandum 78664
Control-Surface Hinge-MomentCalculations for a High-Aspect-Ratio Supercritical Wing
Boyd Perry III
SEPTEMBER 1978
NASA
PROPERTY OF HGRUP UNIVERSITY
https://ntrs.nasa.gov/search.jsp?R=19780023100 2018-04-30T23:03:52+00:00Z

NASA Technical Memorandum 78664
Control-Surface Hinge-MomentCalculations for a High-Aspect-Ratio Supercritical Wing
Boyd Perry IIILangley Research CenterHampton, Virginia
NASANational Aeronauticsand Space Administration
Scientific and TechnicalInformation Office
1978

SUMMARY
An analytical investigation has been conducted to estimate the hingemoments, at selected flight conditions, resulting from deflecting twotrailing-edge control surfaces (one inboard and one midspan) on a high-aspect-ratio, swept, fuel-conservative wing with a supercritical airfoil.This report gives hinge-moment results obtained from procedures which employ arecently developed transonic analysis. In this procedure a three-dimensionalinviscid transonic aerodynamics computer program is combined with a two-dimensional turbulent-boundary-layer program in order to obtain an interactedsolution. These results indicate that trends of the estimated hinge moment asa function of deflection angle are similar to those from experimental hinge-moment measurements made on wind-tunnel models with swept supercritical wingstested at similar values of free-stream Mach number and angle of attack.
INTRODUCTION
The Drones for Aerodynamics and Structural Testing (DAST) Project is aNASA flight program which uses a modified Firebee II target drone vehicle as atest-bed aircraft for testing aeroelastic research wings (ARW). In the inte-grated design of the second wing (designated ARW-2), the structural integrityof the wing depends on the successful operation of several active control sys-tems. The ARW-2 design includes active controls for maneuver load alleviation(MLA), gust load alleviation (GLA), and flutter suppression (FS). All of theseactive control systems use trailing-edge control surfaces either to reduce orto redistribute the aerodynamic loads on the wing.
As part of the preliminary design of the hydraulic actuation system, whichwill be used to deflect these control surfaces, it was necessary to estimatethe maximum control-surface hinge moments at critical design conditions. There-fore, hinge-moment calculations were made for two selected trailing-edge controlsurfaces using two iteratively interacted computer programs: a recently devel-oped three-dimensional transonic aerodynamics computer program (refs. 1 and 2)and a two-dimensional turbulent boundary-layer computer program (refs. 3, 4,and 5). The procedure employed in interacting these programs is described inreference 6. The control surfaces analyzed represent an inboard surfaceintended for use with both the MLA and GLA systems and a midspan surface whichwas a candidate surface for the GLA system. The hinge moments were calculatedfor one control surface deflected at a time, and each control surface was ana-lyzed at a separate flight condition. The hinge moments for the inboard sur-face were calculated at the design condition for the GLA system (the conditionwhich sizes the hydraulic actuator). The hinge moments for the midspan surfacewere calculated at the design-cruise flight condition. The study was limitedto one flight condition for each surface.
This paper presents the results of an analytical investigation to estimatethe control-surface hinge moments for two control surfaces (one inboard and one
midspan) on a high-aspect-ratio supercritical wing. Two trailing-edge-downdeflections, zero deflection, and one trailing-edge-up deflection were ana-lyzed for each control surface. This paper includes (1) a brief discussion ofthe analytical methods used; (2) presentation of chordwise pressure distribu-tions and spanwise load distributions at the four deflection angles for bothcontrol surfaces; (3) plots of hinge moment and total wing lift as a functionof deflection angle for both control surfaces; and (4) a comparison of resultswith experimental data.
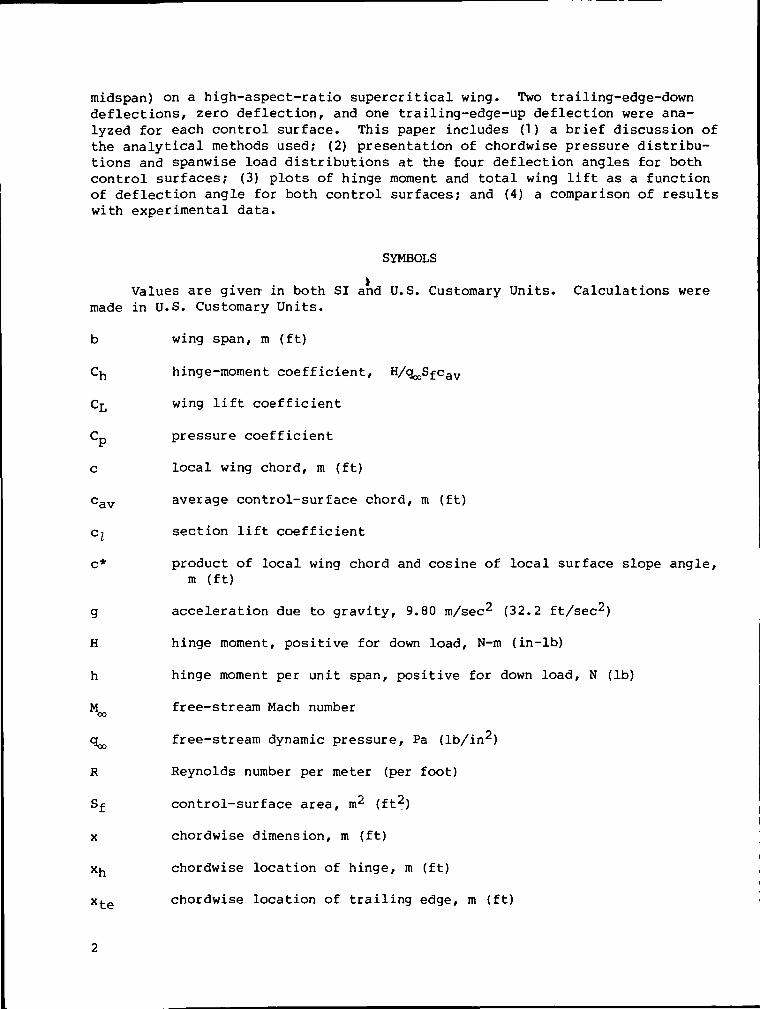
SYMBOLS
Values are given- in both SI and U.S. Customary Units. Calculations weremade in U.S. Customary Units.
b wing span, m (ft)
Cft hinge-moment coefficient, HAloSfCav
CL wing lift coefficient
Cp pressure coefficient
c local wing chord, m (ft)
cav average control-surface chord, m (ft)
GI section lift coefficient
c* product of local wing chord and cosine of local surface slope angle,m (ft)
g acceleration due to gravity, 9.80 m/sec^ (32.2 ft/sec^)
H hinge moment, positive for down load, N-m (in-lb)
h hinge moment per unit span, positive for down load, N (Ib)
M free-stream Mach numberOO
q^ free-stream dynamic pressure, Pa (Ib/in )
R Reynolds number per meter (per foot)
Sf control-surface area, m^ (ft )
x chordwise dimension, m (ft)
xn chordwise location of hinge, m (ft)
xte chordwise location of trailing edge, m (ft)
y spanwise dimension, m (ft)
a angle of attack, deg
6 control-surface deflection angle, positive trailing edge down, deg
6* boundary-layer displacement thickness, m (ft)
3 relaxed boundary layer
Subscripts:
i current iteration (see fig. 2)
I lower surface
u upper surface
CONFIGURATIONS AND ANALYSIS CONDITIONS
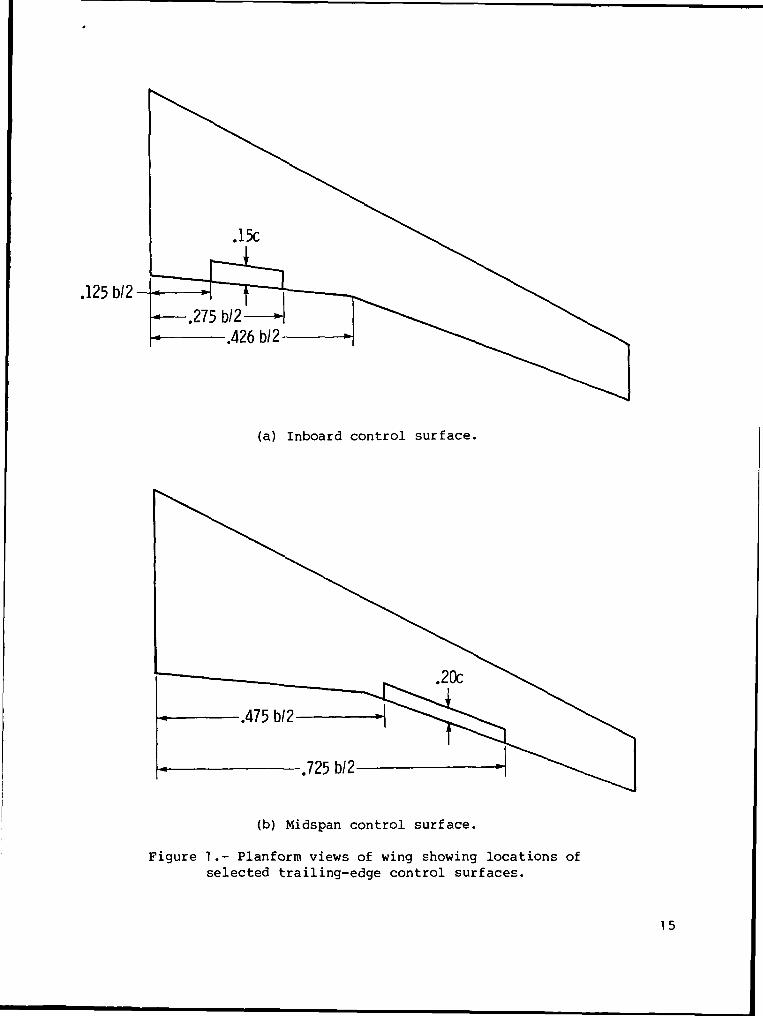
The wing analyzed in this paper is fuel-conservative; that is, one with ahigh aspect ratio, moderate sweep angle, and supercritical airfoil. The geo-metric properties of the wing are listed in table I. For the study describedin this paper, two trailing-edge control surfaces were analyzed, each at a dif-ferent flight condition. Figure 1 shows the relative sizes and locations ofboth the inboard and midspan control surfaces. The following sections andtable II describe the geometry of each control surface and the flight condi-tions at which the control-surface hinge moments were calculated.
Inboard Control Surface
The selected inboard control surface is indicated in figure 1(a). Thecontrol surface has a chord of 15 percent of the local wing chord (whichincludes the trailing-edge extension) and a span of 1 5 percent of the wingsemispan; it extends from 12.5 percent to 27.5 percent of the semispan. Theflight condition chosen for calculating the hinge moments for the inboard con-trol surface is the design condition for the GLA system. The Mach number andaltitude are 0.60 and 2134 m (7000 ft), respectively, conditions which resultin a dynamic pressure of 19.70 kPa (411.3 psf) and a Reynolds number of1.15 x 107 per meter (3.52 x 10⁶ per foot). The angle of attack is 1.63°,which is the angle of attack required for a 2.5g pull-up maneuver at a vehiclegross weight of 11 121 N (2500 Ib). The control-surface deflection anglesselected for the investigation were 6 = -5°, 0°, 5°, and 10°.
Midspan Control Surface
The selected midspan control surface is indicated in figure 1(b). It hada chord of 20 percent of the local wing chord, a span of 25 percent of the wingsemispan, and extended from 47.5 percent to 72.5 percent semispan. The flight
condition chosen for calculating the hinge moments for the midspan controlsurface is the design-cruise flight condition. The Mach number and altitudeare 0.80 and 14 021 m (46 000 ft), respectively; these conditions result ina dynamic pressure of 6.312 kPa (131.8 psf) and a Reynolds number of3.74 x 106 per meter (1.14 x TO6 per foot). The angle of attack is 1.10°,which is the angle of attack required for lg level flight at a wing lift coef-ficient of 0.53. The control-surface deflection angles selected for the inves-tigation were & = -5°, 0°, 5^, and 12°.
ANALYTICAL METHODS
Two computer programs were employed in performing the analysis describedin this paper: an aerodynamics program and a boundary-layer program. The pro-cedure for interacting these two programs had been developed (ref. 6) in orderto estimate (1) the angle of attack required for the wing at the design-cruiseflight condition and (2) the resulting detailed load distributions for thebasic wing without control surfaces. The reasonable agreement of these pre-dictions with experimental data obtained subsequently encouraged the presentapplication for control surfaces.
The aerodynamics program (FLO 22, refs. 1 and 2) analyzes inviscid, isen-tropic, transonic flow past three-dimensional swept-wing configurations. Noprovisions are included for modeling a fuselage. FLO 22 calculates chordwisepressure distributions on both the upper and lower surfaces of the wing. Fora fine-grid computational mesh (192 x 24 x 32), 21 stations are used along thesemispan (stations are spaced in increments of 5 percent semispan, starting atthe root). The following description of the program is taken from the summaryof reference 2: "The free-stream Mach number is restricted only by the isen-tropic assumption. Weak shock waves are automatically located wherever theyoccur in the flow. The finite-difference form of the full equation for thevelocity potential is solved by the method of relaxation, after the flow exte-rior to the airfoil is mapped to the upper half plane. The mapping procedureallows exact satisfaction of the boundary conditions and use of supersonicfree-stream velocities. The finite-difference operator is 'locally rotated1 insupersonic flow regions so as to properly account for the domain of dependence.The relaxation algorithm has been stabilized using criteria from a time-likeanalogy."
The boundary layer is calculated using the two-dimensional integral-methodboundary-layer formulation of Nash and Macdonald (ref. 3). The specific pro-gram used was extracted from a recent two-dimensional airfoil analysis program(ref. 4) and is basically the same as the boundary-layer program (NASHMAC)found in the airfoil program described in reference 5. NASHMAC calculatesthe boundary-layer displacement thickness along streamwise-oriented strips at11 stations on the semispan. These 11 stations are, for convenience, pickedfrom among the 21 output stations of FLO 22. Experience indicates that theboundary-layer calculation should begin in front of the assumed transition inorder to approximate the laminar boundary-layer thickness. The locations forthe start of the boundary-layer calculations are the same for both the upperand lower surfaces on the wing. Table III shows, for three stations along thespan, the chordwise locations of the assumed transition (based on oil-flow
photographs from a similar configuration) and the start of the boundary layer.These locations varied linearly along the span in two segments: from the rootto 42,6 percent semispan and from 42,6 percent semispan to the tip.
Assumptions and Limitations
Although the iterative-interactive procedure was used to investigate theeffects of deflecting trailing-edge control surfaces, the procedure (ref, 6)was not developed specifically for that application. Consequently, sometheoretical assumptions are less valid when the procedure is used to analyzedeflected control surfaces. There are other assumptions which are less validwhen the flight condition is changed from the design-cruise flight condition.As was stated earlier, the purpose of this paper is to provide analytical esti-mates of control-surface hinge moments. It is believed that none of the assump-tions and limitations in the procedure are severe enough to alter trends orcloud results, and it is believed also that the purpose of performing thesecalculations was met, A brief discussion of the major assumptions and limita-tions follows,
Wing flexibility,- Because the wing used in this analysis is a high-aspect-ratio highly flexible wing, the effects of wing flexibility should be consideredwhen the wing is analyzed at off-design flight conditions. However, because ofthe preliminary status of the ARW-2 integrated design, estimations of the wingshape (in the form of airfoil coordinates) at off-design conditions were not yetavailable. As a result, the wing shape used for all cases in this paper wasthe design-cruise shape. It is assumed that the differences in the pressuredistributions (especially in the neighborhood of the control surfaces) causedby the differences between the off-design and design shapes are small. It isalso assumed that the differences in control-surface hinge moments due to thesesmall differences in pressure distributions are small.
Boundary layer.- Assumptions have been made regarding the method used toinclude viscous effects in this analysis. The two most important are (1) thetwo-dimensional boundary-layer displacement thicknesses calculated by NASHMACadequately represent the actual three-dimensional boundary layer and (2) theempirically determined monotonic condition and the empirical separation cri-terion within NASHMAC still apply when the airfoil has a deflected controlsurface.
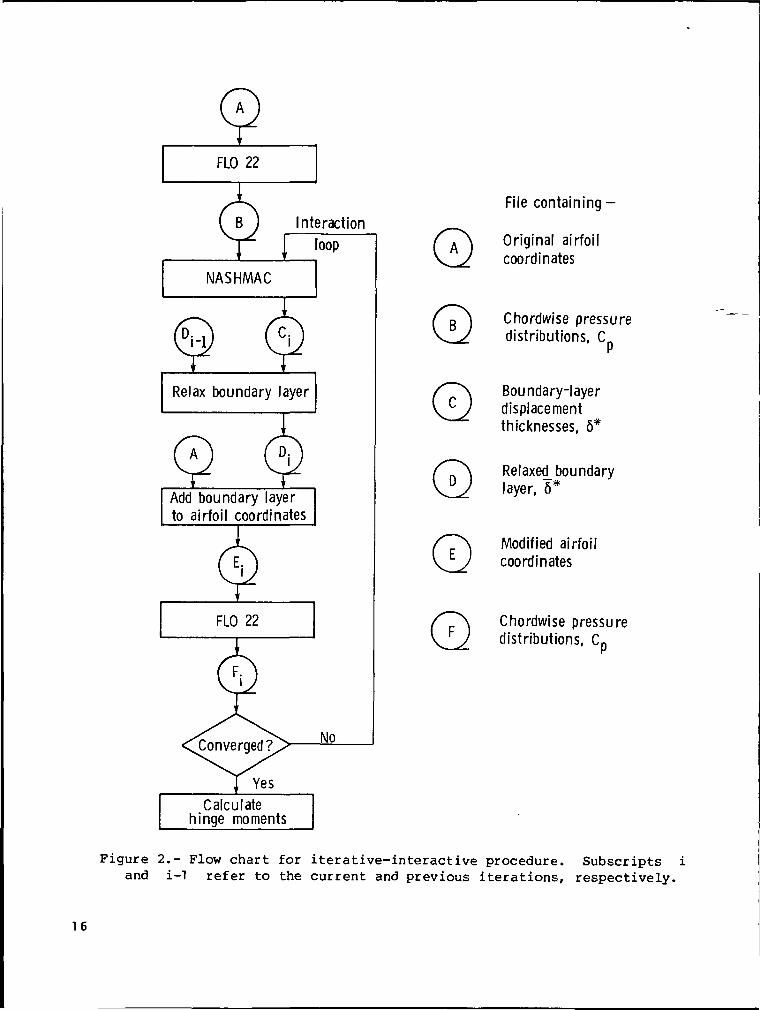
Iteration Procedure
The aerodynamics and boundary-layer computer programs are run in aniterative-interactive fashion, with the output of each one used as the input tothe other one. The details of this application differ somewhat from those citedin reference 6, For example, in the present procedure the angle of attack washeld constant. The first (inviscid) iteration starts and ends with a singlerunning of FLO 22, Succeeding iterations start with the running of NASHMAC andend with the running of FLO 22, Iterations stop, and the solution is consideredconverged, when the total lift coefficient on the wing is within 1 percent ofthe lift coefficient from the previous iteration. For the relaxation scheme
used, the lift coefficient was found to decrease with each successive iteration,so that convergence is reached when CL ^ > 0.99CL i_i . A detailed descriptionof the iteration procedure is illustrated in figure 2 and described in thissection.
To start the first iteration, the airfoil coordinates at the 11 definingstations are used as input to FLO 22, The output from FLO 22 (completing thefirst iteration) consists of chordwise pressure distributions (referred tocollectively as Cpj) at the 21 output stations and the total lift coefficientof the wing (CL -|) ,
To start the second iteration, the Cp -\ are used as input to NASHMAC.The output from NASHMAC consists of the boundary-layer displacement thicknesses(referred to collectively as 6]*) at the 11 defining stations. Within thisiteration, the 6-| * values are then multiplied by a weighting (relaxation)factor of 0,25, after which they are referred to as the relaxed boundary layer(&1 *) . The relaxed boundary layer (6-\ *) is then added to the original air-foil coordinates at the 11 defining stations, resulting in new airfoil coordi-nates which are used as input to FLO 22. The output of FLO 22 (completing thesecond iteration) consists of the new chordwise pressure distributions (Cp 2)and the new lift coefficient (CL 2)
If the convergence criterion is not met, the third iteration starts withthe Cp?2 used as input to NASHMAC. The output from NASHMAC, again, consistsof new boundary-layer displacement thicknesses (62*) at tne 11 defining sta-tions. For this iteration, the new boundary-layer displacement 62* is aweighted average of 62* with 61 * according to the following (relaxation)scheme:
62* = 0.25 x 62* + 0,75 x <$"i *
(This form_of weighted average, combining the 6i* of the current iterationwith the 6 i-i from the previous iteration, is used in all successiveiterations.) Then 62 *s added to the original airfoil coordinates at the11 defining stations, resulting in modified airfoil coordinates which are usedas input to FLO 22, The output of FLO 22 (completing the third iteration) con-sists of the new chordwise pressure distributions (Cp 3) and the new lift coef-ficient (CL 3) .
The procedure described in the previous paragraph is repeated until theconvergence criterion is met. When the convergence criterion is met, thecontrol-surface hinge moments are calculated by integrating the product of theappropriate moment arm and the chordwise pressure distributions at those outputstations corresponding to the control-surface location.
Hinge-Moment Calculation
Control-surface hinge moments are obtained in two steps: (1) chordwiseintegrations of the products of pressure distributions and appropriate momentarms to obtain a distribution of hinge moments per unit span; (2) a spanwiseintegration to obtain the total hinge moment. Both integration steps employed
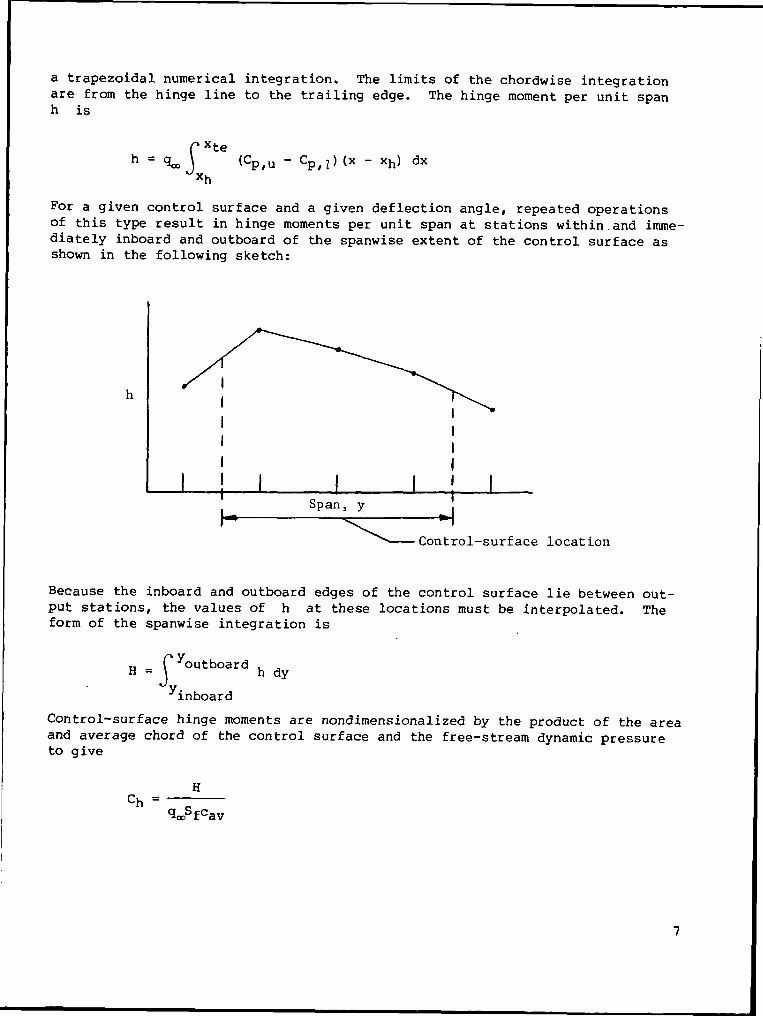
a trapezoidal numerical integration. The limits of the chordwise integrationare from the hinge line to the trailing edge. The hinge moment per unit spanh is
h =f*te
xh
- CpfZ)(x - xh) dx
For a given control surface and a given deflection angle, repeated operationsof this type result in hinge moments per unit span at stations within, and imme-diately inboard and outboard of the spanwise extent of the control surface asshown in the following sketch:
Control-surface location
Because the inboard and outboard edges of the control surface lie between out-put stations, the values of h at these locations must be interpolated. Theform of the spanwise integration is
H = outboard
yinboard
h dy
Control-surface hinge moments are nondimensionalized by the product of the areaand average chord of the control surface and the free-stream dynamic pressureto give
H
<J«>Sfcav
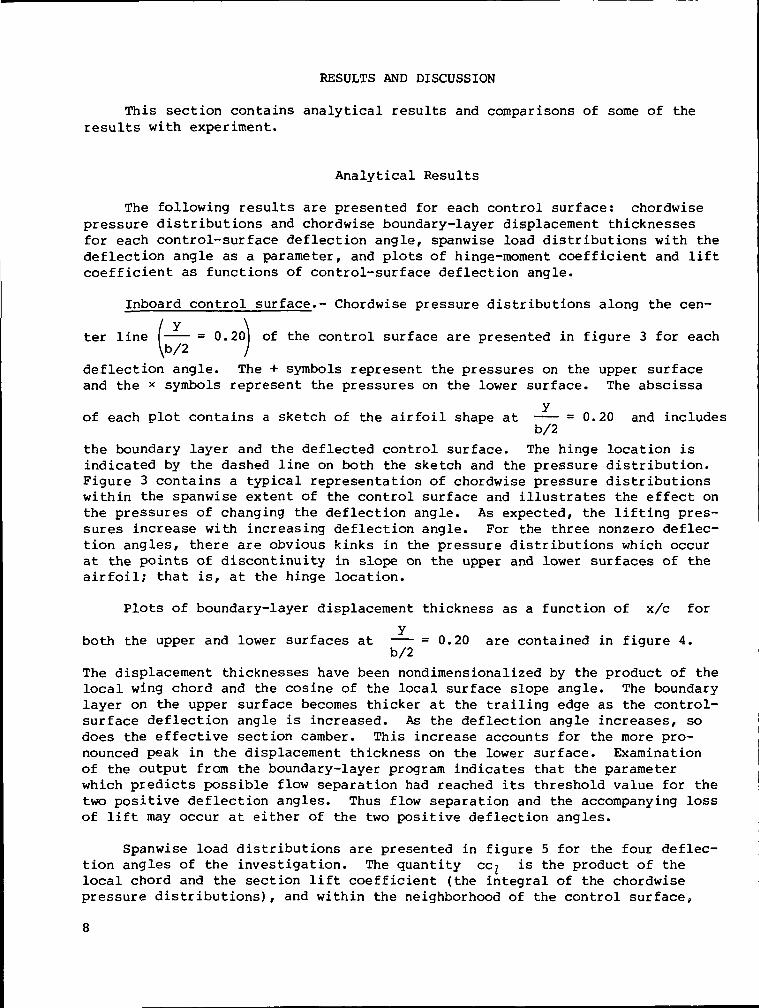
RESULTS AND DISCUSSION
This section contains analytical results and comparisons of some of theresults with experiment.
Analytical Results
The following results are presented for each control surface: chordwisepressure distributions and chordwise boundary-layer displacement thicknessesfor each control-surface deflection angle, spanwise load distributions with thedeflection angle as a parameter, and plots of hinge-moment coefficient and liftcoefficient as functions of control-surface deflection angle.
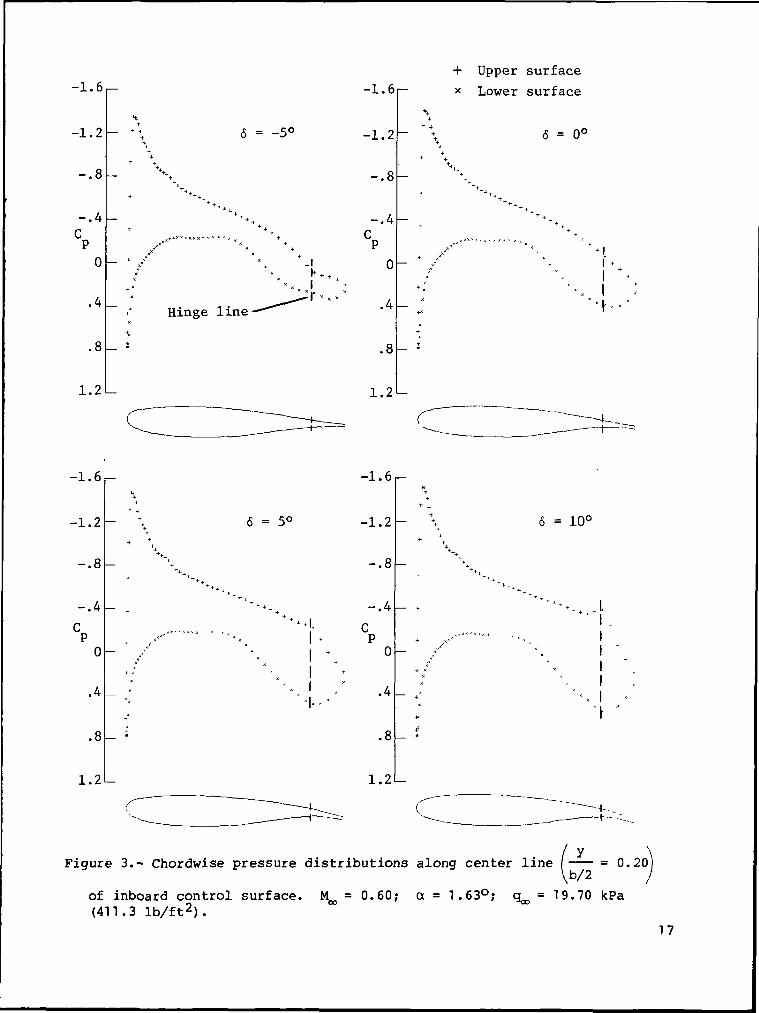
Inboard control surface.- Chordwise pressure distributions along the cen-
/ y \ter line I = 0.20 of the control surface are presented in figure 3 for each
deflection angle. The + symbols represent the pressures on the upper surfaceand the * symbols represent the pressures on the lower surface. The abscissa
yof each plot contains a sketch of the airfoil shape at = 0.20 and includes
b/2
the boundary layer and the deflected control surface. The hinge location isindicated by the dashed line on both the sketch and the pressure distribution.Figure 3 contains a typical representation of chordwise pressure distributionswithin the spanwise extent of the control surface and illustrates the effect onthe pressures of changing the deflection angle. As expected, the lifting pres-sures increase with increasing deflection angle. For the three nonzero deflec-tion angles, there are obvious kinks in the pressure distributions which occurat the points of discontinuity in slope on the upper and lower surfaces of theairfoil; that is, at the hinge location.
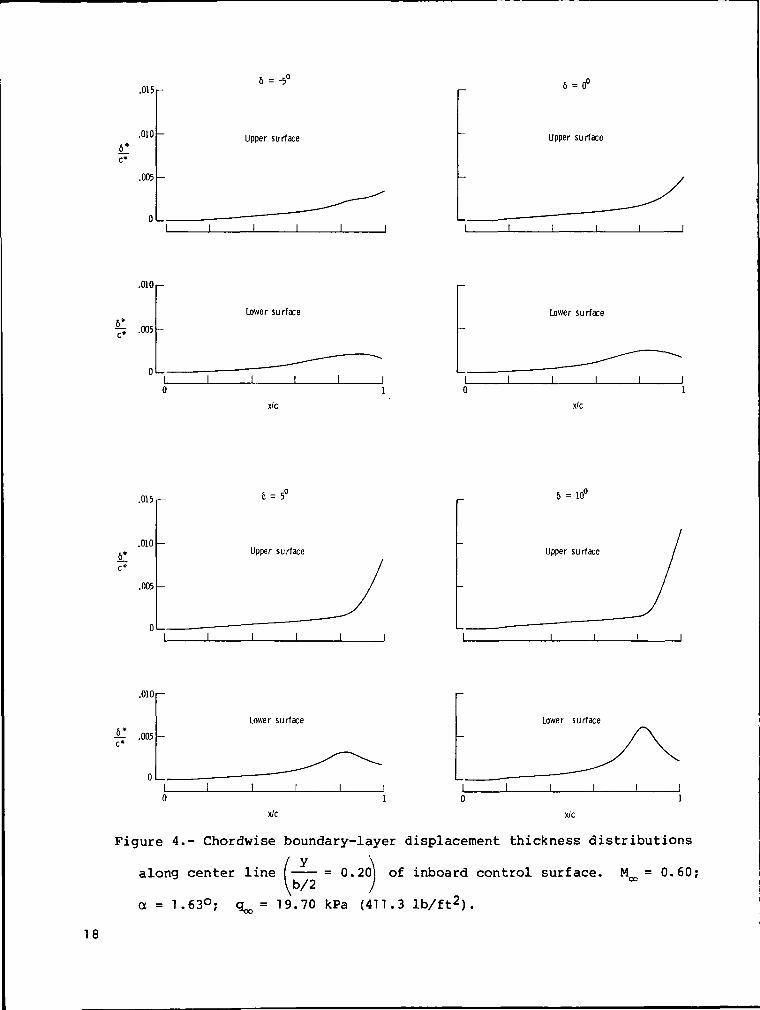
Plots of boundary-layer displacement thickness as a function of x/c for
yboth the upper and lower surfaces at = 0.20 are contained in figure 4.
b/2
The displacement thicknesses have been nondimensionalized by the product of thelocal wing chord and the cosine of the local surface slope angle. The boundarylayer on the upper surface becomes thicker at the trailing edge as the control-surface deflection angle is increased. As the deflection angle increases, sodoes the effective section camber. This increase accounts for the more pro-nounced peak in the displacement thickness on the lower surface. Examinationof the output from the boundary-layer program indicates that the parameterwhich predicts possible flow separation had reached its threshold value for thetwo positive deflection angles. Thus flow separation and the accompanying lossof lift may occur at either of the two positive deflection angles.
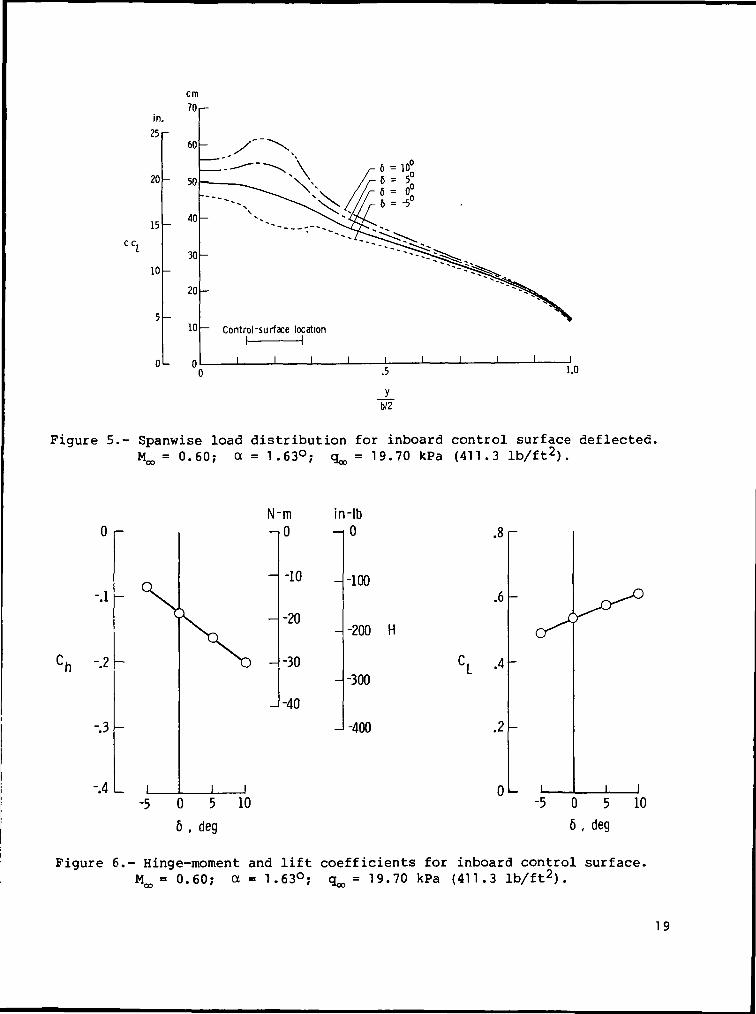
Spanwise load distributions are presented in figure 5 for the four deflec-tion angles of the investigation. The quantity cci is the product of thelocal chord and the section lift coefficient (the integral of the chordwisepressure distributions), and within the neighborhood of the control surface,
8
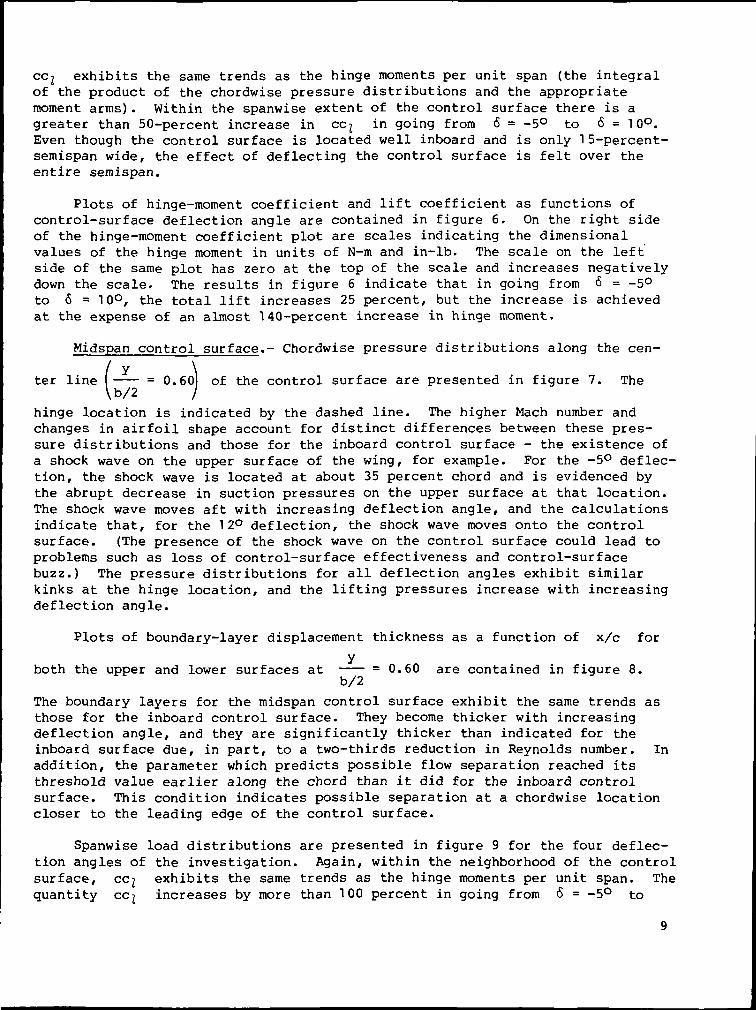
ccj exhibits the same trends as the hinge moments per unit span (the integralof the product of the chordwise pressure distributions and the appropriatemoment arms). Within the spanwise extent of the control surface there is agreater than 50-percent increase in ccj in going from 6 = -5° to <5 = 10°.Even though the control surface is located well inboard and is only 1 5-percent-semispan wide, the effect of deflecting the control surface is felt over theentire semispan.
Plots of hinge-moment coefficient and lift coefficient as functions ofcontrol-surface deflection angle are contained in figure 6. On the right sideof the hinge-moment coefficient plot are scales indicating the dimensionalvalues of the hinge moment in units of N-m and in-lb. The scale on the leftside of the same plot has zero at the top of the scale and increases negativelydown the scale. The results in figure 6 indicate that in going from <5 = -50to 6 = 10°, the total lift increases 25 percent, but the increase is achievedat the expense of an almost 140-percent increase in hinge moment.
Midspan control surface.- Chordwise pressure distributions along the cen-
/ y \ter line = 0.60 of the control surface are presented in figure 7. The\b/2 )
hinge location is indicated by the dashed line. The higher Mach number andchanges in airfoil shape account for distinct differences between these pres-sure distributions and those for the inboard control surface - the existence ofa shock wave on the upper surface of the wing, for example. For the -5° deflec-tion, the shock wave is located at about 35 percent chord and is evidenced bythe abrupt decrease in suction pressures on the upper surface at that location.The shock wave moves aft with increasing deflection angle, and the calculationsindicate that, for the 12° deflection, the shock wave moves onto the controlsurface. (The presence of the shock wave on the control surface could lead toproblems such as loss of control-surface effectiveness and control-surfacebuzz.) The pressure distributions for all deflection angles exhibit similarkinks at the hinge location, and the lifting pressures increase with increasingdeflection angle.
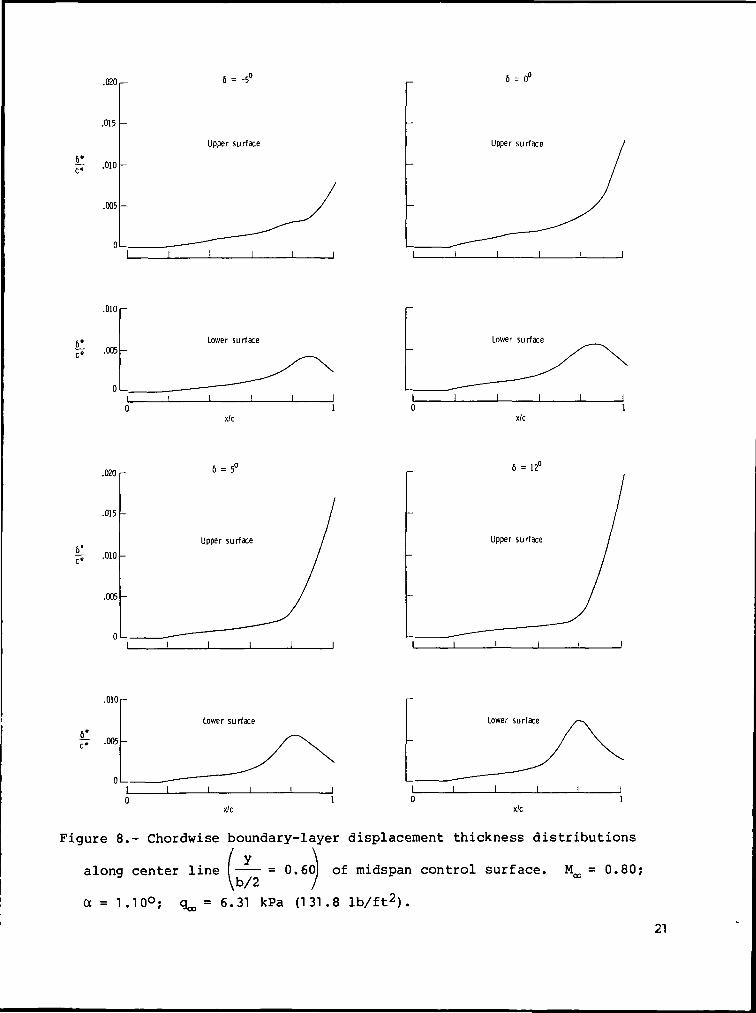
Plots of boundary-layer displacement thickness as a function of x/c for
yboth the upper and lower surfaces at = 0.60 are contained in figure 8.
b/2
The boundary layers for the midspan control surface exhibit the same trends asthose for the inboard control surface. They become thicker with increasingdeflection angle, and they are significantly thicker than indicated for theinboard surface due, in part, to a two-thirds reduction in Reynolds number. Inaddition, the parameter which predicts possible flow separation reached itsthreshold value earlier along the chord than it did for the inboard controlsurface. This condition indicates possible separation at a chordwise locationcloser to the leading edge of the control surface.
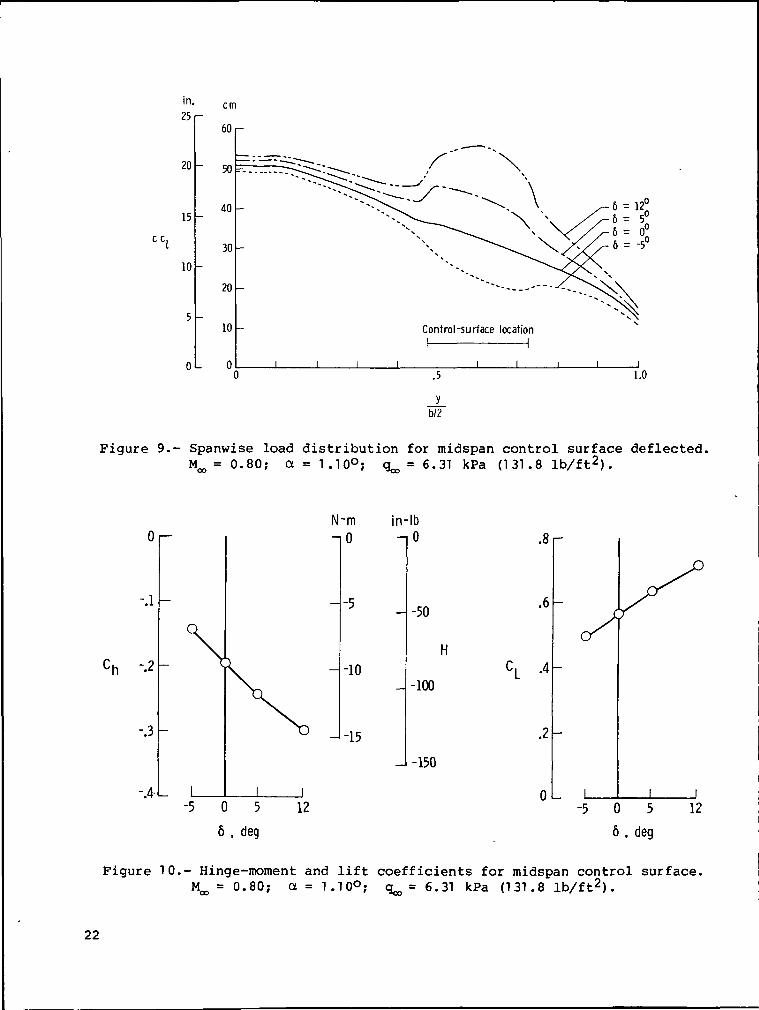
Spanwise load distributions are presented in figure 9 for the four deflec-tion angles of the investigation. Again, within the neighborhood of the controlsurface, ccj exhibits the same trends as the hinge moments per unit span. Thequantity ccj increases by more than 100 percent in going from 6 = -5° to
6 = 12°. Because of its midspan location and increased span, the midspan con-trol surface has a larger influence on the load distributions over the entirespan than the inboard control surface does.
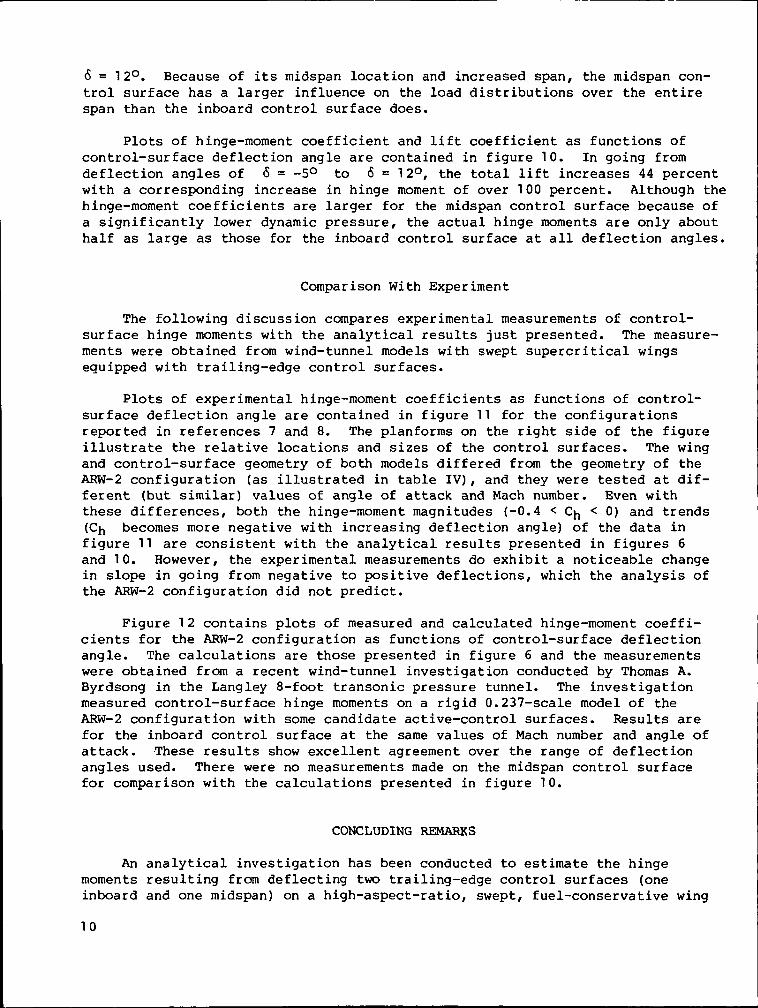
Plots of hinge-moment coefficient and lift coefficient as functions ofcontrol-surface deflection angle are contained in figure 10. In going fromdeflection angles of 6 = -5° to 6 = 12°, the total lift increases 44 percentwith a corresponding increase in hinge moment of over 100 percent. Although thehinge-moment coefficients are larger for the midspan control surface because ofa significantly lower dynamic pressure, the actual hinge moments are only abouthalf as large as those for the inboard control surface at all deflection angles.
Comparison With Experiment
The following discussion compares experimental measurements of control-surface hinge moments with the analytical results just presented. The measure-ments were obtained from wind-tunnel models with swept supercritical wingsequipped with trailing-edge control surfaces.
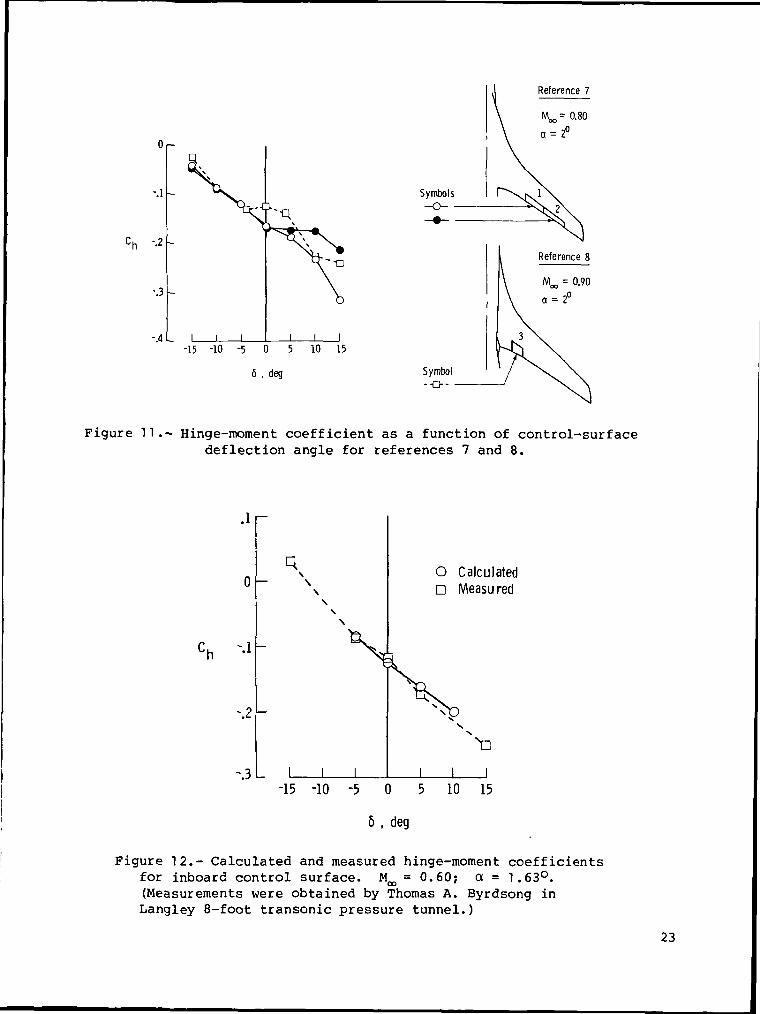
Plots of experimental hinge-moment coefficients as functions of control-surface deflection angle are contained in figure 11 for the configurationsreported in references 7 and 8. The planforms on the right side of the figureillustrate the relative locations and sizes of the control surfaces. The wingand control-surface geometry of both models differed from the geometry of theARW-2 configuration (as illustrated in table IV), and they were tested at dif-ferent (but similar) values of angle of attack and Mach number. Even withthese differences, both the hinge-moment magnitudes (-0.4 < C^ < 0) and trends(Cn becomes more negative with increasing deflection angle) of the data infigure 11 are consistent with the analytical results presented in figures 6and 10. However, the experimental measurements do exhibit a noticeable changein slope in going from negative to positive deflections, which the analysis ofthe ARW-2 configuration did not predict.
Figure 12 contains plots of measured and calculated hinge-moment coeffi-cients for the ARW-2 configuration as functions of control-surface deflectionangle. The calculations are those presented in figure 6 and the measurementswere obtained from a recent wind-tunnel investigation conducted by Thomas A.Byrdsong in the Langley 8-foot transonic pressure tunnel. The investigationmeasured control-surface hinge moments on a rigid 0.237-scale model of theARW-2 configuration with some candidate active-control surfaces. Results arefor the inboard control surface at the same values of Mach number and angle ofattack. These results show excellent agreement over the range of deflectionangles used. There were no measurements made on the midspan control surfacefor comparison with the calculations presented in figure 10.
CONCLUDING REMARKS
An analytical investigation has been conducted to estimate the hingemoments resulting from deflecting two trailing-edge control surfaces (oneinboard and one midspan) on a high-aspect-ratio, swept, fuel-conservative wing
10
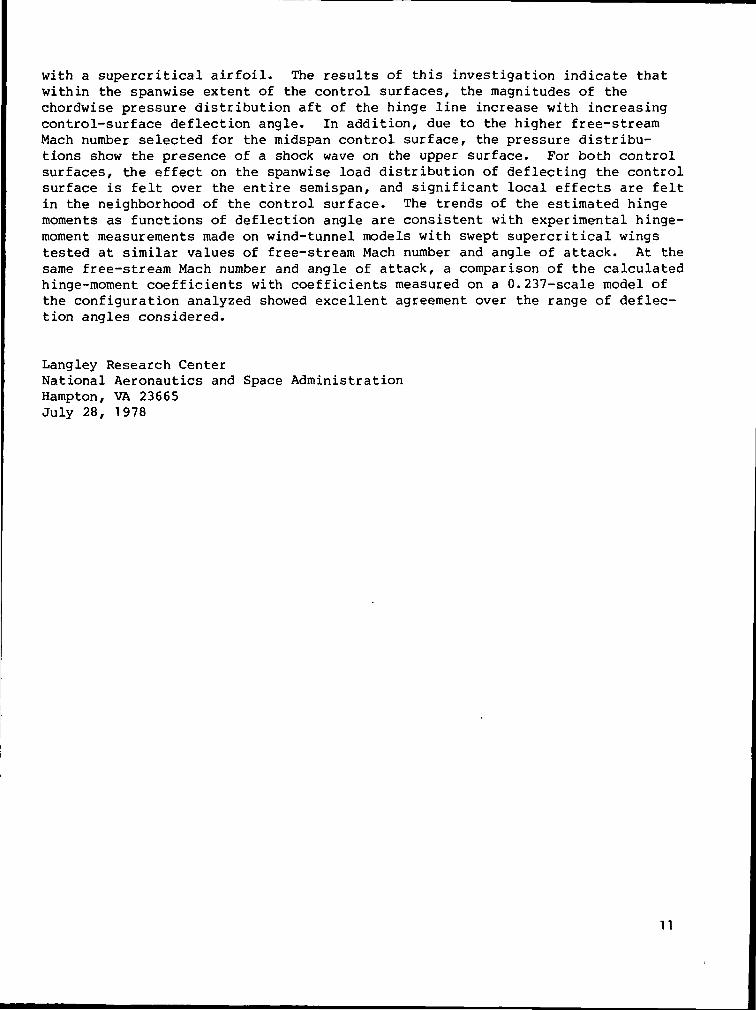
with a supercritical airfoil. The results of this investigation indicate thatwithin the spanwise extent of the control surfaces, the magnitudes of thechordwise pressure distribution aft of the hinge line increase with increasingcontrol-surface deflection angle. In addition, due to the higher free-streamMach number selected for the midspan control surface, the pressure distribu-tions show the presence of a shock wave on the upper surface. For both controlsurfaces, the effect on the spanwise load distribution of deflecting the controlsurface is felt over the entire semispan, and significant local effects are feltin the neighborhood of the control surface. The trends of the estimated hingemoments as functions of deflection angle are consistent with experimental hinge-moment measurements made on wind-tunnel models with swept supercritical wingstested at similar values of free-stream Mach number and angle of attack. At thesame free-stream Mach number and angle of attack, a comparison of the calculatedhinge-moment coefficients with coefficients measured on a 0.237-scale model ofthe configuration analyzed showed excellent agreement over the range of deflec-tion angles considered.
Langley Research CenterNational Aeronautics and Space AdministrationHampton, VA 23665July 28, 1978
11
REFERENCES
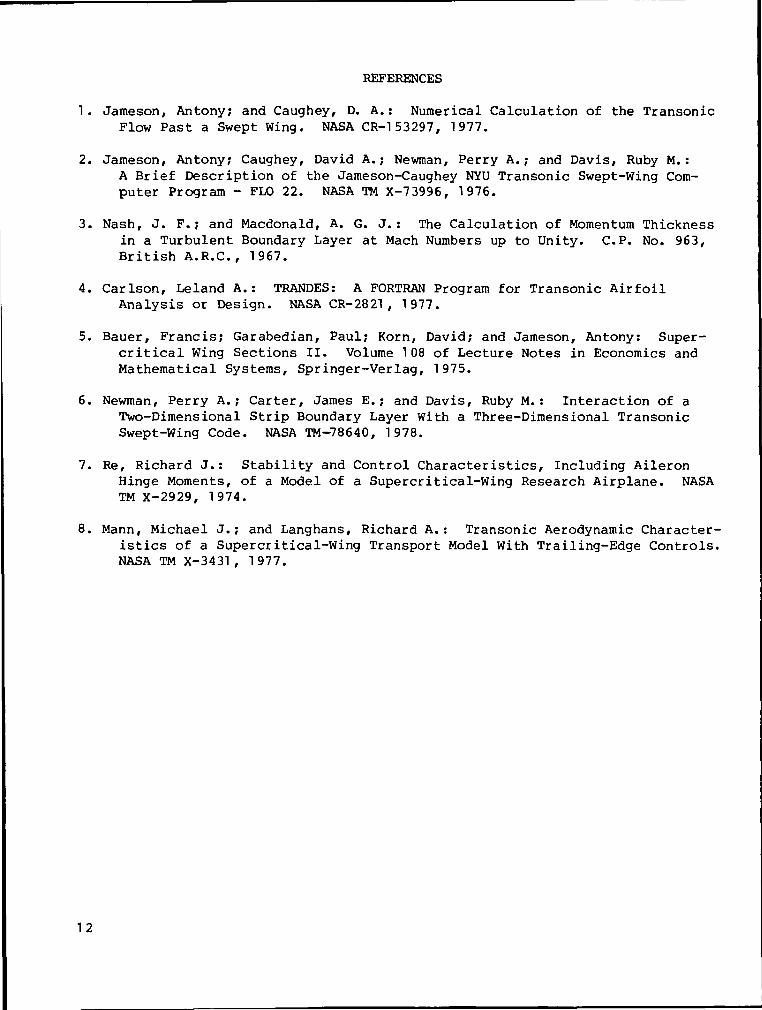
1. Jameson, Antony; and Caughey, D. A.: Numerical Calculation of the TransonicFlow Past a Swept Wing. NASA CR-1 53297, 1977.
2. Jameson, Antony; Caughey, David A.; Newman, Perry A.; and Davis, Ruby M.:A Brief Description of the Jameson-Caughey NYU Transonic Swept-Wing Com-puter Program - FLO 22. NASA TM X-73996, 1976.
3. Nash, J. F.; and Macdonald, A. G. J.: The Calculation of Momentum Thicknessin a Turbulent Boundary Layer at Mach Numbers up to Unity. C.P. No. 963,British A.R.C., 1967.
4. Carlson, Leland A.: TRANDES: A FORTRAN Program for Transonic AirfoilAnalysis or Design. NASA CR-2821 , 1977.
5. Bauer, Francis; Garabedian, Paul; Korn, David; and Jameson, Antony: Super-critical Wing Sections II. Volume 108 of Lecture Notes in Economics andMathematical Systems, Springer-Verlag, 1975.
6. Newman, Perry A.; Carter, James E.; and Davis, Ruby M.: Interaction of aTwo-Dimensional Strip Boundary Layer With a Three-Dimensional TransonicSwept-Wing Code. NASA TM-78640, 1978.
7. Re, Richard J.: Stability and Control Characteristics, Including AileronHinge Moments, of a Model of a Supercritical-Wing Research Airplane. NASATM X-2929, 1974.
8. Mann, Michael J.; and Langhans, Richard A.: Transonic Aerodynamic Character-istics of a Supercritical-Wing Transport Model With Trailing-Edge Controls.NASA TM X-3431, 1977.
12
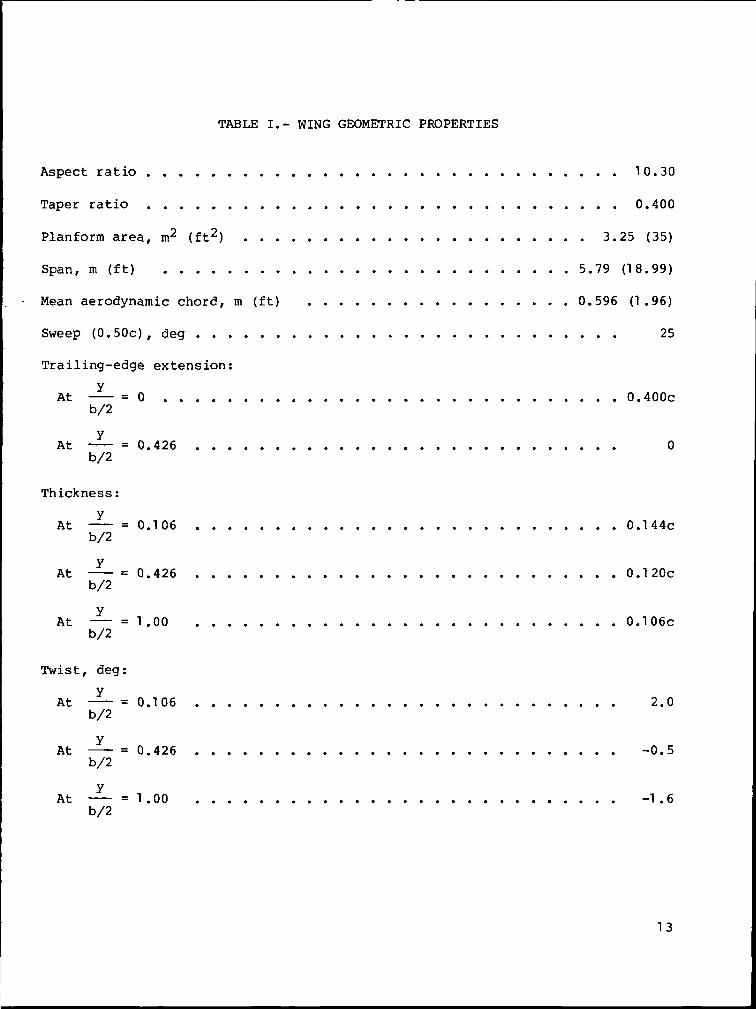
TABLE I.- WING GEOMETRIC PROPERTIES
Aspect ratio 10.30
Taper ratio 0.400
Planform area, m2 ( f t 2 ) 3.25 (35)
Span, m ( f t ) 5.79 (18.99)
Mean aerodynamic chord, m (ft) 0.596 (1.96)
Sweep (O.SOc), deg 25
Trailing-edge extension:
yA t = 0 0.400c
b/2
At = 0.426 0b/2
Thickness:
At = 0.106 0.144cb/2
At = 0 . 4 2 6 0.1 20cb/2
At = 1.00 0.106cb/2
Twist, deg:
At = 0.106 2.0b/2
At = 0.426 -0.5b/2
yAt = 1 .00 -1.6
b/2
13
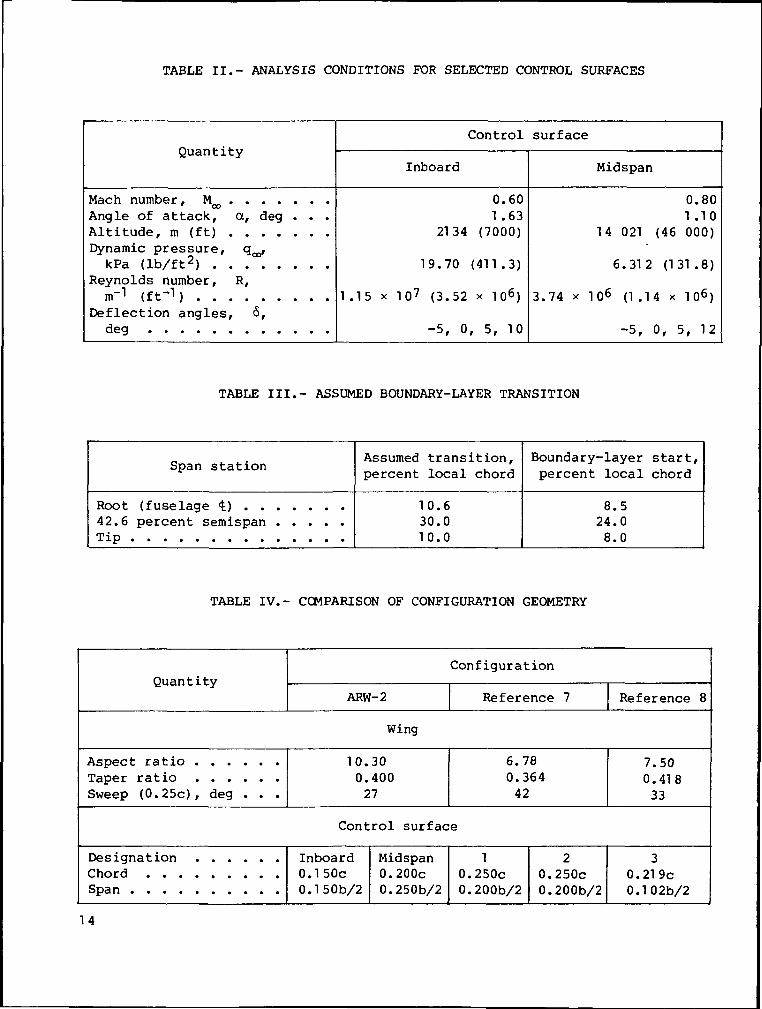
TABLE II.- ANALYSIS CONDITIONS FOR SELECTED CONTROL SURFACES
QuantityControl surface
Inboard Midspan
Mach number, M^ . . . .Angle of attack, a, degAltitude, m (ft) ....Dynamic pressure,kPa (lb/ft2)
Reynolds number, R,m-1 (ft'1)
Deflection angles, <S,deg
0.601 .63
2134 (7000)
19.70 (411.3)
1 .15 x 107 (3.52 x T O 6 )
-5, 0, 5, 10
0.801 .10
14 021 (46 000)
6.312 (131.8)
3.74 x 10⁶ (1 .14 x 106)
-5, 0, 5, 12
TABLE III.- ASSUMED BOUNDARY-LAYER TRANSITION
Span station
42.6 percent semispan .....
Assumed transition,percent local chord
10.630.010.0
Boundary-layer start,percent local chord
8. 524.08.0
TABLE IV.- COMPARISON OF CONFIGURATION GEOMETRY
QuantityConfiguration
ARW-2 Reference 7 Reference 8
Wing
Taper ratio . . . . . .Sweep (0.25c), deg . . .
10.300.400
27
6.780.364
42
7.500.418
33
Control surface
Inboard Midspan0.1 50c 0.200c0.150b/2 0.250b/2
10.250c0.200b/2
20.250c0.200b/2
30.219c0.102b/2
14
.125 b/2
(a,) Inboard control surface.
(b) Midspan control surface.
Figure 1.- Planform views of wing showing locations ofselected trailing-edge control surfaces.
15
FLO 22
Interactionloop
NASHMAC
Relax boundary layer
Add boundary layerto airfoil coordinates
Calculatehinge moments
0000
0
0
File containing -
Original airfoilcoordinates
Chordwise pressuredistributions, C
Boundary-layerdisplacementthicknesses, 6*
Relaxed_ boundarylayer, 6*
Modified airfoilcoordinates
Chordwise pressuredistributions, CP
Figure 2.- Flow chart for iterative-interactive procedure. Subscripts iand i-1 refer to the current and previous iterations, respectively.
16
+ Upper surface— j. . u
-1.2
-.8
-.4CP0
.4
.8
1.2
-1.6
-1.2
-.8
-.4
CP0
.4
.8
1.2
— -J..D
- *\ $ = -5° -1.2•i+-4-
T +.
-.8*
+
- ^ *^*+ -.4
P
-V \ *^+ 0
"~ * Hinge line — "*"
- J .8
1.2
d_ ^ r= =
-1.6
- \ 6=5° -1.2-f-
-t-
-.8*
-•--.,.,.xx,,-o-x - ., ^L C
- " / "'•. - o
-1 '"'*"-,,-': -4
_ * .8
- 1.2
CT_ ^ I -
— x Lower surface
6 = 0°-t-
+
%i*'-+
++t^^ +' + +
— + /x* ' k !'• i-H<
t
—
CI _____3IIi =
•M-
"*" -h
- \ 6 = 10°4-
—
"*""*' 4- _
•*• X1"* V "
~ ./
— *-" "
~H 1
{
^ ~. __— — — H~
/ Y
b/2= 0.20
of inboard control surface. M^ = 0.60; a = 1.63°; q^ = 19.70 kPa(411.3 lb/ft2).
17
11c*
.015
.010
.005
6 = -5°
Upper surface
6 = 0°
Upper surface
.010
** Lower surface
J I
x/c
Lower surface
J I
x/c
l!c*
.015 r-
.010
.005
01—
6 = 5"
Upper surface Upper surface
.010
fr -005Lower surface
x/c
Lower surface
x/c
Figure 4.- Chordwise boundary-layer displacement thickness distributions
/ y \along center line = 0.20) of inboard control surface. M^ = 0.60;
a = 1.63°; q = 19.70 kPa (411.3 lb/ft2).
18
cc,
in.
25
20
15
10
cm70
— Control-surf ace locationI 1
i I i i1.0
ywz
Figure 5.- Spanwise load distribution for inboard control surface deflected.M^ = 0.60; a = 1.63°; q^ = 19.70 kPa (411.3 lb/ft2).
N-m in-lbu
-.1
-.2
-.3
-.4
Q
T
—
—
I
A.
x-
U -
-10
-20
-30-
-40
-
u .8
-100.6
-200 H
CL .4-300
-400 .2
i i n
—e
cr
-
—
^cJD
Y^
i i- 5 0 5 1 0 - 5 0 5 1
6 , deg 6 , deg
Figure 6.- Hinge-moment and lift coefficients for inboard control surface.M^ = 0.60; a = 1.63°; q^ = 19.70 kPa (411.3 lb/ft2).
19

+ Upper surface
-l.b
-1.2
-.8
-.4cP0
.4
.8
1.2
-1.6
-1.2
-.8
-.4Cp
0
.4
.8
1.2
1 1 mi V t
r— -J..O
6 = ~5° -1.2
- * ~"\ -.8*- t
- f ^ + T + + . -•*^, • • • " ' " ' " " • + £
+ ,.-X''" • P
- ;' • x *l* * . o* x 1 *~
*" ^ •1" I
- ' Hinge line * ' ' -4•5
- i .8
- 1.2
cH7 __—- - - ===^r- -1.6
6 = 5° -1.2
-.8^ I
+ 4- '
- -.4CP
- .--'' " ' , * 0t-x . *
" " " . . ' - 4
.
- : -8
1.2, |
a T • V \*" t.TT ^ 1"4 1" fC«ll*»^k ^1 ^'^•••^V'Vtlti x»
— x Lower surface
6 = 0°
***>
^ 4
•t
*" 4
4 .+ *+ +
*'
•+ ,v^"X* " 1
_ / ** \
1
^
- . "I"
\
jf
—
CH " __^^
—
6 = 12°
—
—+
*- * *
r— "
r-t*
—
C ~~" ____^ — -- 4-
/ Y
\b/2
of midspan control surface. M^ = 0.80; a = 1.10°; q^ = 6.31 kPa(131 .8 lb/ft2) .
20
.020
.015
-010
.005
6 = -5"
Upper surface
6 = 0°
Upper surface
J I
.010i-
nosc* -005
OL_
Lower surface
x/c
Lower surface
I I I I I I
x/c
.020
.015
£ -010
.005
6 = 5°
Upper surface
6 = 12°
Upper surface
.010
r .005
Ol—
Lower surface
j I i I
x/c
Lower surface
Figure 8.- Chordwise boundary-layer displacement thickness distributions
I y \along center line - = 0.601 of midspan control surface. M^ = 0.80;
a = 1.10°;
b/26.31 kPa (1 31 .8 lb/ft2) .
21
cc,
in.25
20
15
10
OL
cm
60 r-
yb/2
Figure 9.- Spanwise load distribution for midspan control surface deflected.M^ = 0.80; a = 1.10°; q = 6.31 kPa (131.8 lb/ft2).
N~m jn-lbOr-
-.1
~ 3 —
-.4-L
-5
-10
12
-50
-100
-150
.8r
.6
.4
.2
-5 0 5
6 , deg
12
Figure 10.- Hinge-moment and lift coefficients for midspan control surface.M^ = 0.80; a= 1.10°; q^ = 6.31 kPa (131.8 lb/ft2).
22
Reference 7
-.1
-.3
-.4-15 -10 -5 5 10 15
6 , deg
Figure 11.- Hinge-moment coefficient as a function of control-surfacedeflection angle for references 7 and 8.
-.2
-.3 L-15 -10
O CalculatedD Measured
Figure 12.- Calculated and measured hinge-moment coefficientsfor inboard control surface. M^ = 0.60; a = 1.63°.(Measurements were obtained by Thomas A. Byrdsong inLangley 8-foot transonic pressure tunnel.)
23
1 Report No.NASA TM-78664
2 Government Accession No
4 Title and SubtitleCONTROL-SURFACE HINGE-MOMENT CALCULATIONS FOR AHIGH-ASPECT-RATIO SUPERCRITICAL WING
7 Author(s)
Boyd Perry III
9 Performing Organization Name and Address
NASA Langley Research CenterHampton, VA 23665
12 Sponsoring Agency Name and AddressNational Aeronautics and Space AdministrationWashington, DC 20546
3 Recipient's Catalog No
5 Report DateSeptember 1 978
6 Performing Organization Code
8 Performing Organization Report
L-12219
No
10. Work Unit No516-53-03-21
11 Contract or Grant No
13 Type of Report and Period CoveredTechnical Memorandum
14 Sponsoring Agency Code
15 Supplementary Notes
16 Abstract
An analytical investigation has been conducted to estimate the hinge moments, atselected flight conditions, resulting from deflecting two trailing-edge controlsurfaces (one inboard and one midspan) on a high-aspect-ratio, swept, fuel-conservative wing with a supercritical airfoil. This report gives hinge-momentresults obtained from procedures which employ a recently developed transonicanalysis. In this procedure a three-dimensional inviscid transonic aerodynamicscomputer program is combined with a two-dimensional turbulent-boundary-layerprogram in order to obtain an interacted solution. These results indicate thattrends of the estimated hinge moment as a function of deflection angle are similarto those from experimental hinge-moment measurements made on wind-tunnel modelswith swept supercritical wings tested at similar values of free-stream Mach numberand angle of attack.
17 Key Words (Suggested by Author(sl)
Transonic flowCompressible flowControl-surface hinge momentsTrailing-edge controls
19 Security Classif (of this report)
Unclassified
18 Distribution Statement
Unclassified - Unlimited
Subject Category 02
20 Security Classif (of this page) 21 No of Pages 22. Price'
Unclassified 23 §4.00
* For sale by the National Technical Information Service, Springfield, Virginia 22161NASA-Langley, 1978
National Aeronautics andSpace Administration
Washington, D.C.20546
Official BusinessPenalty for Private Use, $300
THIRD-CLASS BULK RATE Postage and Fees PaidNational Aeronautics andSpace AdministrationNASA-451
14 1 10,ft,NORTHBOP UNIVATTN: ALOHBI LIBRARY1155 BEST ARBOR VITAE STINGLEHOOD CA 90306
082178 S00673HO
NASA POSTMASTER: If Undeliverable (Section 158Postal Manual) Do Not Return