Embed Size (px)
Citation preview

Calculation of the piezoelectric and flexoelectric effects in nanowires using adecoupled finite element analysis methodZhiqiang Zhang, Dalong Geng, and Xudong Wang Citation: Journal of Applied Physics 119, 154104 (2016); doi: 10.1063/1.4946843 View online: http://dx.doi.org/10.1063/1.4946843 View Table of Contents: http://scitation.aip.org/content/aip/journal/jap/119/15?ver=pdfcov Published by the AIP Publishing Articles you may be interested in First-principles based multiscale model of piezoelectric nanowires with surface effects J. Appl. Phys. 113, 014309 (2013); 10.1063/1.4773333 Flexoelectric effect in finite samples J. Appl. Phys. 112, 044103 (2012); 10.1063/1.4745037 Radially dependent effective piezoelectric coefficient and enhanced piezoelectric potential due to geometricalstress confinement in ZnO nanowires/nanotubes Appl. Phys. Lett. 101, 013104 (2012); 10.1063/1.4731779 Dynamic nanomechanics of zinc oxide nanowires Appl. Phys. Lett. 100, 163110 (2012); 10.1063/1.4704919 Finite element method calculations of ZnO nanowires for nanogenerators Appl. Phys. Lett. 92, 122904 (2008); 10.1063/1.2903114
Reuse of AIP Publishing content is subject to the terms at: https://publishing.aip.org/authors/rights-and-permissions. Download to IP: 68.117.134.25 On: Sat, 30 Apr 2016
17:00:43

Calculation of the piezoelectric and flexoelectric effects in nanowiresusing a decoupled finite element analysis method
Zhiqiang Zhang,1,2,a) Dalong Geng,2,a) and Xudong Wang2,b)
1School of Power and Mechanical Engineering, Wuhan University, Wuhan, China2Department of Materials Science and Engineering, University of Wisconsin-Madison, Madison,Wisconsin 53706, USA
(Received 15 December 2015; accepted 3 April 2016; published online 20 April 2016)
A simple and effective decoupled finite element analysis method was developed for simulating both
the piezoelectric and flexoelectric effects of zinc oxide (ZnO) and barium titanate (BTO) nanowires
(NWs). The piezoelectric potential distribution on a ZnO NW was calculated under three
deformation conditions (cantilever, three-point, and four-point bending) and compared to the conven-
tional fully coupled method. The discrepancies of the electric potential maximums from these two
methods were found very small, validating the accuracy and effectiveness of the decoupled method.
Both ZnO and BTO NWs yielded very similar potential distributions. Comparing the potential distri-
butions induced by the piezoelectric and flexoelectric effects, we identified that the middle segment
of a four-point bending NW beam is the ideal place for measuring the flexoelectric coefficient,
because the uniform parallel plate capacitor-like potential distribution in this region is exclusively
induced by the flexoelectric effect. This decoupled method could provide a valuable guideline for ex-
perimental measurements of the piezoelectric effects and flexoelectric effects in the nanometer scale.
Published by AIP Publishing. [http://dx.doi.org/10.1063/1.4946843]
I. INTRODUCTION
Piezoelectricity is a response of electric polarization to a
mechanical strain in crystalline dielectrics with noncentrosym-
metric crystal structures. Numerous applications of direct and
reverse piezoelectric effects play important roles in modern
life. In recent years, researchers have constructed comprehen-
sive theoretical frameworks to analyze and predict the piezo-
electricity of a broad range of materials.1–9 Flexoelectricity is
a relative new electromechanical coupling phenomenon
describing the response of electric polarization to a mechanical
strain gradient.10,11 Unlike piezoelectricity, flexoelectricity
appears not only in noncentrosymmetric dielectrics but also in
centrosymmetric dielectrics because a strain gradient can
break local symmetry.12,13 Due to its very small effect in bulk
materials, flexoelectricity had not attracted much attention
since its discovery several decades ago. Strong flexoelectric
effects can be introduced by large strain gradients that were
found to be feasible in nanoscale materials. Increasing theoret-
ical analysis of the flexoelectric effect in the nanometer regime
has been explored recently.13–16
Both piezoelectricity and flexoelectricity play a key role
in the operation of nanowire (NW)-based nanogenerators
(NGs) that convert ambient mechanical energy into electric-
ity.17–22 NG is a promising technology for charging batteries,
powering wearable electronic devices and implantable bio-
medical devices.23–31 The working principle of a NW-based
NG relies on deforming the NWs to produce electric polar-
ization on the NW surfaces. While the piezoelectric
contribution has been intensively studied, little is known
about the contribution from the flexoelectricity to the per-
formance of the NGs, only a few papers discussing flexoelec-
tric effect affecting performance of NGs with analytic
method32–35 exist. Numerical analysis of the flexoelectric
response in single-crystalline nanowires and understanding
the interaction with the piezoelectric effect are one essential
step toward effective utilization of the flexoelectric effect in
NG design.
Current commercial finite element analysis (FEA) soft-
ware is capable of calculating piezoelectricity owing to its
well-developed theoretical framework. However, the function
of solving flexoelectricity is mostly absent. The main
approach that most commercial FEA software (e.g., ANSYS,
ADINA) use is the fully coupled method, which combines
the analyses of both mechanical and electric fields simultane-
ously.36 However, this method is not ideal for solving the
flexoelectric effects due to the complicity of involving flexo-
electric coefficient and strain gradients. Bradley proposed
an FEA method for solving the flexoelectricity, but was
restrained to 2-dimentional models.37 In this paper, we devel-
oped a decoupled FEA method to calculate the flexoelectric
effects of NWs under three different bending conditions.
Based on a zinc oxide (ZnO) NW model, the strain-related
piezoelectricity was calculated using both our decoupled and
conventional fully coupled methods. Very small discrepan-
cies were found between the results of these two methods af-
ter only the first calculation cycle, which validated our
decoupled method. This decoupled method was further
applied to flexoelectricity calculations. The electric potential
distributions from both piezoelectric and flexoelectric effects
were clearly distinguished for piezoelectric ZnO and
a)Z. Zhang and D. Geng contributed equally to this work.b)Email: [email protected]
0021-8979/2016/119(15)/154104/9/$30.00 Published by AIP Publishing.119, 154104-1
JOURNAL OF APPLIED PHYSICS 119, 154104 (2016)
Reuse of AIP Publishing content is subject to the terms at: https://publishing.aip.org/authors/rights-and-permissions. Download to IP: 68.117.134.25 On: Sat, 30 Apr 2016
17:00:43

ferroelectric BaTiO3 (BTO) NWs. This calculation provides
a guideline for experimentally quantifying the flexoelectric
coefficients and designing new NW-based NGs.
II. DECOUPLED FEA METHOD
To simplify the derivation, we assume that the NW
bending is very small,38 so that the electromechanical prop-
erties of piezoelectric materials can be described by the con-
stitutive equations
rij ¼ cijklekl � ekijEk; (1)
Di ¼ eiklekl þ kikEk ¼ Pi þ kikEk; (2)
where r, c, e, e, E, D, P, and k are the mechanical stress ten-
sor, the mechanical stiffness tensor, the mechanical strain
tensor, the piezoelectric coefficient matrix, the electric field,
the electric displacement, the electric polarization, and the
dielectric constant, respectively. The constitutive equations
of flexoelectricity have similar forms except strain and elec-
tric field being replaced by strain gradient and electric field
gradient. Both piezoelectric and flexoelectric effects exist in
a strained non-centrosymmetric material. Therefore, the con-
stitutive equations should describe these two effects to-
gether.39,40 In order to easily compare the results from the
two effects, here we discuss the two effects separately. The
piezoelectric coefficient, a third-rank tensor ekij is changed to
the flexoelectric coefficient lijkl, a fourth-rank tensor as well
rij ¼ cijklekl � lijklEk;j; (3)
Di ¼ lijklejk;l þ kikEk ¼ Pi þ kikEk; (4)
where the complete expansion of the strain gradient ejk;l and
the direct flexoelectric coefficient matrix lijkl can be found
in supplementary material S2.46
The decoupled FEA method was developed to take into
account strain gradient and electric field gradient in addition
to the strain and electric fields for calculating the electric
potential distribution. Unlike the fully coupled method
detailed in supplementary material S1,46 the decoupled
method deals with the displacement field and the electric
field separately. When the displacement field is considered,
only the displacement vector {ui} exists at the node in each
element. When we calculate the electric field, the only
degree of freedom is electric potential {/i}. These two proc-
esses are described in Equations (5) and (6), respectively,
½Kuu�fuig ¼ fFBg þ fFSg þ fFPg; (5)
½K;;�f;ig ¼ fQBg þ fQSg þ fQPg; (6)
where [Kuu] and [K//] are stiffness matrix and dielectric ma-
trix, respectively. {FB}, {FS}, and {FP} are body force vector,
surface force vector, and concentrated force vector, respec-
tively; {QB}, {QS}, and {QP} are body charge vector, surface
charge vector, and point charge vector, respectively. By doing
so, we can solve the displacement field first to obtain the
strain or strain gradient and then calculate the electric polar-
ization induced by the strain or strain gradient. In a complete
cycle of the decoupled method, {QB} and {QS} were
substituted in Eq. (6) to obtain {/i} and then the electric field
and electric field gradient, which will be used to calculate the
stress based on the constitutive questions of piezoelectric and
flexoelectric effects (Eqs. (1) and (3)). The stress was pre-
sented by {FB} and {FS} to calculate {ui}. This process can
be repeated until a satisfactory result is reached.
III. APPLICATION OF THE DECOUPLED FEA METHODFOR PIEZOELECTRIC POTENTIAL CALCULATION
The decoupled FEA method was first applied to the cal-
culation of the piezoelectric effects.41 Here, the constitutive
equations of the piezoelectric effects become42
frgð0Þ ¼ ½cE�fegð0Þ; (7)
fDgð1Þ ¼ ½e�fegð0Þ þ ½v�fEgð1Þ: (8)
Eq. (7) describes the relation between strain and stress without
the converse piezoelectric effect. Eq. (8) describes the direct
piezoelectric effect. The number in superscripts represents the
number of calculation iteration. Here, a piezoelectric ZnO
NW is used as a model system due to its well-known mechan-
ical and piezoelectric properties. The piezoelectric potential
distribution generated by three bending situations (cantilever,
three point, and four point bending) is calculated and com-
pared to the conventional fully coupled method.
Cantilever bending is the most common deformation sce-
nario for NWs in NG applications. Based on the Saint-Venant
theory of bending, the mechanical strain is given by34,43
ef g 0ð Þ ¼
�fyEIxx
y l� zð Þ
�fyEIxx
y l� zð Þ
� fyEIxx
y l� zð Þ
fy
Ixx
3þ 2�
4Ea2 � y2 � 1� 2�
3þ 2�x2
� �
� fy
Ixx
1þ 2�
2Exy
0
8>>>>>>>>>>>>>>>>>>>>><>>>>>>>>>>>>>>>>>>>>>:
9>>>>>>>>>>>>>>>>>>>>>=>>>>>>>>>>>>>>>>>>>>>;
: (9)
This strain matrix can be directly used to calculate the elec-
tric polarization (~PR) following Eq. (8):
~PR ¼ e½ � ef g 0ð Þ
¼
� fy
EIxx
1
2þ �
� �e15xy
fy
EIxx
3
4þ �
2
� �e15 a2 � y2 � 1� 2�
3þ 2�x2
� �
fy
EIxx2�e31 � e33ð Þy l� zð Þ
8>>>>>>>><>>>>>>>>:
9>>>>>>>>=>>>>>>>>;: (10)
By assuming no free charges in the nanowire and according
to Gauss’s law, the body charge density can be defined as
154104-2 Zhang, Geng, and Wang J. Appl. Phys. 119, 154104 (2016)
Reuse of AIP Publishing content is subject to the terms at: https://publishing.aip.org/authors/rights-and-permissions. Download to IP: 68.117.134.25 On: Sat, 30 Apr 2016
17:00:43

qR ¼ �r � ~PR ¼ fy
EIxx2 1þ �ð Þe15 þ 2�e31 � e33½ �y; (11)
and the surface charge density as
RR ¼ �~n � ð0� ~PRÞ ¼ ~n � ~PR
: (12)
Therefore, this case can be considered as an electrostatic prob-
lem, and the body charge density and the surface charge den-
sity can represent the electric polarization as boundary
conditions in the FEA model to calculate the piezoelectric
potential.
The piezoelectric potential distribution along a ZnO NW
(600 nm long, 25 nm in radius, and under a force of 80 nN on
the free end) was calculated using the decoupled FEA method
(material parameters used in the calculation were listed in sup-
plementary material S346). Figure 1(a) schematically shows
the electric dipole distribution inside the ZnO NW when the
force fy is applied on the left end. Only body charge exists in
this case. The calculated potential distribution is plotted in a
3D NW geometry, revealing a parallel plate capacitor-like
behavior (Figure 1(b)). Charges on both ends of the NW have
negligible effect on the electric field of the entire NW due to
the significantly small diameter compared to the NW’s length.
In order to validate the accuracy of the decoupled method, the
piezoelectric response of the same NW was also calculated
using the fully coupled method (supplementary material
S146). The potential distributions along the axial cross section
calculated by both methods are shown in Figures 1(c) and
1(d), respectively. These two methods yielded very similar
potential distributions. The difference between the maximum
electric potential values from the two methods was found to
be 6% (0.265 V from the decouple method versus 0.282 V
from the fully coupled method).
The same ZnO NW model (600 nm in length and 25 nm
in radius) was then analyzed under the three-point bending sit-
uation. An external force fy of 80 nN was assumed to be
applied at the middle of the NW. According to the classic
mechanics, the maximum bending strain appears at the middle
point that is bearing the external force. The shear strain exhib-
its a mirror distribution versus the center plane of the NW.
Thus, the strains of the left part {e}l and the right part {e}r of
the ZnO NW can be expressed by Eqs. (13) and (14),
respectively,
fegl ¼
�fy
2EIxxyz
�fy
2EIxxyz
� fy2EIxx
yz
� fy2Ixx
3þ 2�
4Ea2 � y2 � 1� 2�
3þ 2�x2
� �
fy2Ixx
1þ 2�
2Exy
0
8>>>>>>>>>>>>>>>>>>>><>>>>>>>>>>>>>>>>>>>>:
9>>>>>>>>>>>>>>>>>>>>=>>>>>>>>>>>>>>>>>>>>;
; (13)
fegr ¼
�fy2EIxx
y l� zð Þ
�fy2EIxx
y l� zð Þ
� fy2EIxx
y l� zð Þ
fy
2Ixx
3þ 2�
4Ea2 � y2 � 1� 2�
3þ 2�x2
� �
� fy
2Ixx
1þ 2�
2Exy
0
8>>>>>>>>>>>>>>>>>>>>>><>>>>>>>>>>>>>>>>>>>>>>:
9>>>>>>>>>>>>>>>>>>>>>>=>>>>>>>>>>>>>>>>>>>>>>;
: (14)
The body charge density of the left part and the right part
can be written as follows:
qRr ¼ �qR
l ¼fy
2EIxx2 1þ �ð Þe15 þ 2�e31 � e33½ �y: (15)
The surface charge density of the NW surface remains
neutral
XR
l
¼XR
r
¼ 0: (16)
The charge distribution can be represented by the elec-
tric dipoles inside the NW under the three-point bending
condition (Figure 1(e)), and the corresponding electric poten-
tial distribution is shown in Figure 1(f). The electric potential
distribution in each half of the NW is very much similar to
that of a parallel plate capacitor (or the cantilever beam
case). However, the signs of the electric potential in the two
sides are opposite. This symmetric distribution can be con-
sidered as if two cantilever beams were joined together
head-to-head. The opposite potential sign is a result of the
opposite polarization directions ([0001] versus [000–1] of
the ZnO NW case) of these two cantilever beams. The elec-
tric potential is zero at the center point where the external
force is applied because the induced body charges are neu-
tralized at the middle. The axial cross-sectional plots of the
decoupled and coupled methods (Figures 1(g) and 1(h),
respectively) clearly reveal that both methods can yield the
same results. The discrepancy of the maximum electric
potential between these two methods was only 0.6%
(0.133 V from the decouple method versus 0.134 V from the
fully coupled method).
The same ZnO NW model was further used to analyze
the four-point bending case. Two external forces of the
same value, 40 nN, were exerted at the two points 150 nm
away from both ends. Under this bending situation, the mid-
dle segment between the two bearing points exhibits no
shear strain but only bending strain, while the two end seg-
ments of the beam have opposite shear strain. The strain
function in the left, middle, and right segments of the ZnO
NW is presented as {e}l, {e}m, and {e}r, respective in the
following equations:
154104-3 Zhang, Geng, and Wang J. Appl. Phys. 119, 154104 (2016)
Reuse of AIP Publishing content is subject to the terms at: https://publishing.aip.org/authors/rights-and-permissions. Download to IP: 68.117.134.25 On: Sat, 30 Apr 2016
17:00:43
fegl ¼
�fy
EIxxyz
�fy
EIxxyz
� fyEIxx
yz
� fyIxx
3þ 2�
4Ea2 � y2 � 1� 2�
3þ 2�x2
� �
fyIxx
1þ 2�
2Exy
0
8>>>>>>>>>>>>>>>>>>>>><>>>>>>>>>>>>>>>>>>>>>:
9>>>>>>>>>>>>>>>>>>>>>=>>>>>>>>>>>>>>>>>>>>>;
; (17)
fegm ¼
�fyl
4EIxxy
�fyl
4EIxxy
� fyl
4EIxxy
0
0
0
8>>>>>>>>>>>>>>>>><>>>>>>>>>>>>>>>>>:
9>>>>>>>>>>>>>>>>>=>>>>>>>>>>>>>>>>>;
; (18)
fegr ¼
�fyEIxx
y l� zð Þ
�fyEIxx
y l� zð Þ
� fyEIxx
y l� zð Þ
fy
Ixx
3þ 2�
4Ea2 � y2 � 1� 2�
3þ 2�x2
� �
� fy
Ixx
1þ 2�
2Exy
0
8>>>>>>>>>>>>>>>>>>>><>>>>>>>>>>>>>>>>>>>>:
9>>>>>>>>>>>>>>>>>>>>=>>>>>>>>>>>>>>>>>>>>;
: (19)
According to the decoupled FEA method, the body
charge densities of the left and the right segments follow the
same relations described in Eq. (15), whereas the body
charge density of the middle segment is zero. Similar to the
three point bending case, the surface charge densities of the
left, middle, and right segments are all zero.
The schematic diagram of the electric dipole distribution
under the four-point bending condition is shown in Figure 1(i).
The 3D electric potential distribution calculated by the
decoupled method is illustrated in Figure 1(j). Since there is no
body charge induced in the middle segment, no piezoelectric
potential is generated there. The parallel plate capacitor-type
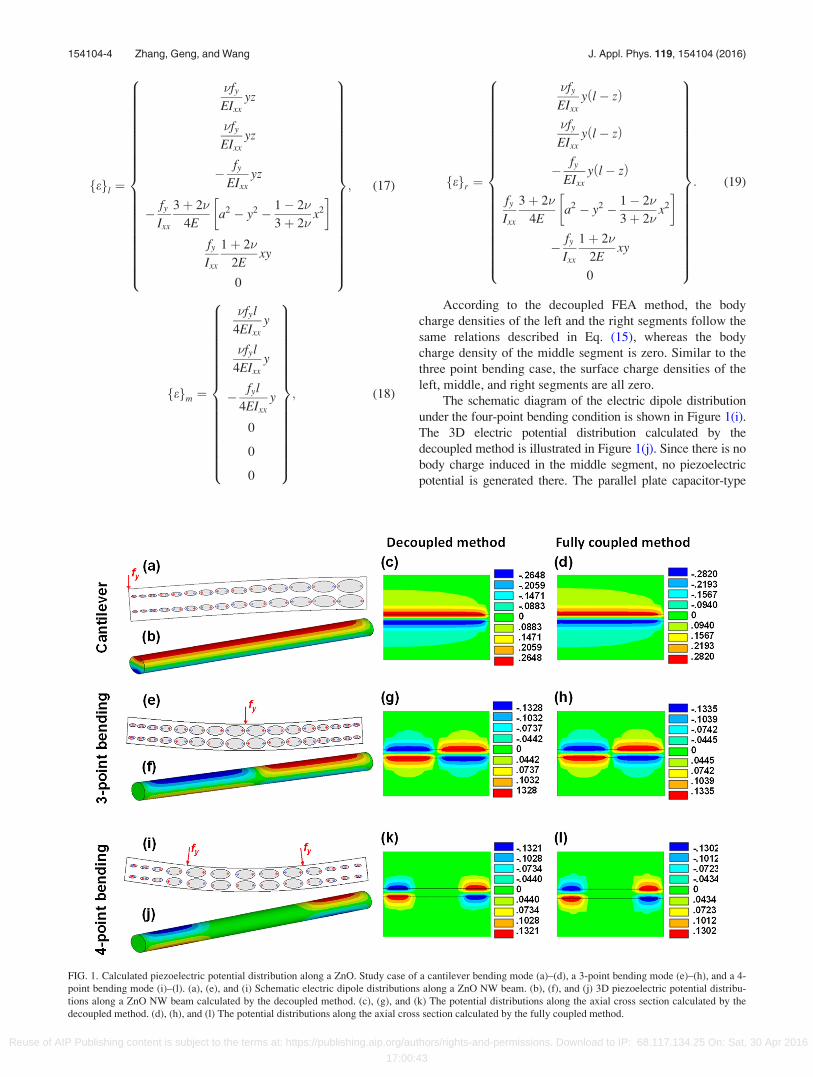
FIG. 1. Calculated piezoelectric potential distribution along a ZnO. Study case of a cantilever bending mode (a)–(d), a 3-point bending mode (e)–(h), and a 4-
point bending mode (i)–(l). (a), (e), and (i) Schematic electric dipole distributions along a ZnO NW beam. (b), (f), and (j) 3D piezoelectric potential distribu-
tions along a ZnO NW beam calculated by the decoupled method. (c), (g), and (k) The potential distributions along the axial cross section calculated by the
decoupled method. (d), (h), and (l) The potential distributions along the axial cross section calculated by the fully coupled method.
154104-4 Zhang, Geng, and Wang J. Appl. Phys. 119, 154104 (2016)
Reuse of AIP Publishing content is subject to the terms at: https://publishing.aip.org/authors/rights-and-permissions. Download to IP: 68.117.134.25 On: Sat, 30 Apr 2016
17:00:43
potential distribution is produced on both end segments with
opposite signs. This type of potential distribution can be con-
sidered similar to the case of three-point bending with an
extended central neutral potential zone. Comparing the axial
cross-sectional region from the decoupled FEA method
(Figure 1(k)) and the fully coupled FEA method (Figure 1(l))
also revealed the same potential distribution with a discrepancy
of electric potential maximum as small as 1.5% (0.132 V from
the decouple method versus 0.130 V from the fully coupled
method).
By comparing the potential distribution and the potential
maximum discrepancy between our decoupled and conven-
tional fully coupled methods, we can conclude that the
decoupled FEA method is a fairly simple and an efficient
approach to predict the electric potential distribution induced
by the piezoelectric effects.
It should be noted that in wurtzite material systems, the
second order piezoelectric effect, i.e., the nonlinear piezo-
electric component, has a profound influence on the overall
piezoelectric polarization.44,45 However, the fully coupled
FEA method cannot be used directly to calculate the nonlin-
ear effect either. Based on the established theoretical frame-
work,45 the second order piezoelectric effect of the ZnO NW
was also calculated by the decoupled FEA method under the
cantilever, three-point bending, and four-point bending con-
ditions (supplementary material S446). From the results, the
nonlinear piezoelectric effect can make a significant contri-
bution to the overall potential, especially for the cantilever’s
case under larger strain.
IV. APPLICATION OF THE DECOUPLED FEA METHODFOR FLEXOELECTRIC POTENTIAL CALCULATION
After validating the decoupled FEA method in calculat-
ing the piezoelectric response, it was then used to calculate
the flexoelectric effect, where the strain gradient and the
electric field gradient become the essential components. The
complete expansions of the strain gradient and the flexoelec-
tric coefficient are included in supplementary material S2.46
To be consistent with other calculations reported previ-
ously,32,43 we also assume that both ZnO and BTO are iso-
tropic. By applying the decoupled FEA method, the
constitutive equations of the flexoelectric effects become
frgð0Þ ¼ ½cE�fegð0Þ; (20)
fDg 1ð Þ ¼ l½ �@e@xl
� � 0ð Þþ v½ � Ef g 1ð Þ
: (21)
Here, we only consider mechanical strain in Eq. (20) and the
polarization solely induced by pure mechanical strain gradi-
ent in Eq. (21). Only one calculation cycle was applied in the
FEA process as we did in the piezoelectric effects’ case to
simplify the calculation. The same ZnO NW model was used
under the three different bending conditions for flexoelectric-
ity calculation.
In a cantilever beam mode, applying Eq. (9) of the
Saint-Venant theory of bending, Eqs. (S9) and (S10) in sup-
plementary material S2,46 to the constitutive equations
yielded the polarization induced by the flexoelectric effect
~PR ¼ l½ �
@e@xl
� � 0ð Þ¼
Px
Py
Pz
8<:
9=;; (22)
where Px ¼ l11e111 þ l14e221 þ l14e331 þ 2l111e133 þ 2l111
e122 ¼ 0, Py ¼ l14e112þ l11e222þ l14e332þ 2l111e233þ 2l111
e121 ¼ fy
EIxx1� zð Þ l14�þl11��l14ð Þ; and Pz ¼ l14e113þ l14
e223 þ l11e333 þ 2l111e232 þ 2l111e131 ¼ fy
EIxxy �2l14� þ l11½
�2l111 1 þ �ð Þ�:Similarly, we define the body charge density by
qR ¼ �r � ~PR ¼ 0; (23)
and the surface charge density by
XR ¼ �~n � ð0� ~PRÞ ¼ ~n � ~PR
: (24)
The body charge density and the surface charge density were
used as the boundary conditions in the FEA calculation.
Different from the piezoelectric responses, the flexoelectric
polarization is produced only by the surface charge, and the
body charge density becomes zero. The surface charge den-
sity on both end surfaces was ignored because it would not
induce an appreciable intrinsic electric field inside the NW
due to the NW’s large aspect ratio. The surface charge den-
sity on the cylindrical surface is given by
XR
r¼a
¼ fy
EIxxL� zð Þ l14� þ l11� � l14ð Þsin hð Þ
¼ fy
EIxxL� zð Þle sin hð Þ: (25)
Here, h is the polar angle in the radial cross section of the
NW (Figure 2(a)). The electric potential maxima appear at
the middle of the top surface (h ¼ 90�) and the middle of the
bottom surface (h ¼ 270�). The dipole distribution inside the
NW in response to the flexoelectric effect is schematically
shown in Figure 2(b-i). The dipoles inside the NW line per-
pendicularly to the NW’s axis so that the body charge is can-
celled and only surface charge exists.
For the convenience of calculation, we define an equiva-
lent flexoelectric parameter
le ¼ l14� þ l11� � l14: (26)
By assuming the external force at the free end is 80nN and
le¼�1nC/m, the electric potential distribution as a result of
the flexoelectric effect was calculated, and the 3D plot is
shown in Figure 2(b-ii). The right-hand-side is the fixed end of
the NW. The top surface of the NW is positively charged, and
the bottom surface is negatively charged. The electric potential
is at maximum immediately next to the fixed end and
decreases gradually towards the free end, which can be clearly
observed from the axial cross-sectional image (Figure 2(b-iii)).
The radial cross-sectional potential profile at the maximum
potential region is shown on the top-right inset of Figure
2(b-iii). The nonuniform electric potential distribution is corre-
lated to the strain gradient in the deflected NW cantilever
154104-5 Zhang, Geng, and Wang J. Appl. Phys. 119, 154104 (2016)
Reuse of AIP Publishing content is subject to the terms at: https://publishing.aip.org/authors/rights-and-permissions. Download to IP: 68.117.134.25 On: Sat, 30 Apr 2016
17:00:43

beam, where the maximum of the strain gradient occurs at the
fixed point. Strained ZnO structures have both piezoelectric
and flexoelectric effects. Reference 32 provided an analytic
result of electric potential distribution in ZnO considering both
effects at the same time. In order to validate our decoupled
method, an identical set of parameters were used in our calcu-
lation, and the results matched very well to those reported in
Ref. 32 (see supplementary material S546).
When the ZnO NW is under the three-point bending
condition, the dipole distribution induced by the flexoelectric
effect is schematically shown in Figure 2(c-i). Based on the
strain formula (13) and (14), the surface charge density of
the NW surface is given by
XR
r¼a
¼ fy
EIxxzle sin hð Þ; 0 < z < l=2ð Þ; (27)
XR
r¼a
¼ fy
EIxxl� zð Þle sin hð Þ; l=2 < z < lð Þ: (28)
When an external force of 80 nN is exerted at the center
point of the ZnO NW, the flexoelectric effect-generated elec-
tric potential distribution is shown in Figure 2(c-ii). Opposite
to the piezoelectric case, the maximum potential is located at
the center force-bearing point. The potential decreases sym-
metrically towards both ends and reaches the zero point, as
illustrated by the axial cross-sectional potential profile in
Figure 2(c-iii). This potential distribution is in accordance
with the strain gradient distribution in the three-point bend-
ing condition, where the maximum strain gradient is located
at the center force-bearing point. The right inset of Figure
2(c-iii) shows the radial cross-sectional potential profile at
the center point, revealing the maximum potential that can
be produced by the flexoelectric effect.
A similar procedure was then applied to calculate the
flexoelectric effect of the ZnO NW in a four-point bending
case, where two external forces of 40 nN each were applied to
the l/4 and 3 l/4 points on the NW beam. The corresponding
dipole distribution is schematically shown in Figure 2(d-i).
From strain formula in Eqs. (17)–(19), the electric polariza-
tion can be obtained from the strain gradient, and the surface
charge density on the NW surface is given by
XR
r¼a
¼ fy
EIxxzle sin hð Þ; 0 < z <
l
4
� �; (29)
XR
r¼a
¼ fy
EIxxl� zð Þle sin hð Þ; 3l
4< z < l
� �; (30)
XR
r¼a
¼ fyl
4EIxxle sin hð Þ; l
4< z <
3l
4
� �: (31)
As shown by the 3D plot (Figure 2(d-ii)) and axial cross-
section (Figure 2(d-iii)) of the electric potential distribution,
the uniform bending segment (center segment) exhibits a
parallel plate capacitor-type electric potential profile with
the maximum value at the top and bottom surfaces. This is
well coordinated with the maximum and uniform strain gra-
dient between the two force bearing points. In the left and
right segments, the electric potential drops rapidly to zero to-
ward both ends, similar to the three-point bending case.
Recall the piezoelectric case, the center segment exhibits no
electric potential. The large and uniform potential in the cen-
ter segment is purely the result of the flexoelectric effect,
which offers an ideal scenario for characterizing the flexo-
electric effect.
V. APPLICATION OF THE DECOUPLED FEA METHODTO CALCULATING BaTiO3 NWs
BaTiO3 (BTO) is a ferroelectric material and has differ-
ent crystal structures and piezoelectric/flexoelectric proper-
ties compared to ZnO. The decoupled FEA method will be
further applied to BTO NWs to calculate the piezoelectric
FIG. 2. (a) Schematic of the surface charge distribution on the radial cross-section of a cylindrical NW. (b) Flexoelectric effect-induced polarization in a canti-
lever mode. (c) Flexoelectric effect-induced polarization in a 3-point bending mode. (d) Flexoelectric effect-induced polarization in a 4-point bending mode.
In (b)–(d), (i) schematic electric dipole distribution; (ii) 3D potential distributions along a ZnO NW beam; and (iii) the potential distributions along the axial
cross section. The top-right inset is the radial cross-sectional potential profile at the maximum potential region.
154104-6 Zhang, Geng, and Wang J. Appl. Phys. 119, 154104 (2016)
Reuse of AIP Publishing content is subject to the terms at: https://publishing.aip.org/authors/rights-and-permissions. Download to IP: 68.117.134.25 On: Sat, 30 Apr 2016
17:00:43

and flexoelectric responses under the three different bending
conditions. According to the crystal structure (perovskite),
the cross section of a BaTiO3 (BTO) NW is defined as a
square. The size of the BTO NW used in our simulation is
defined as 300 nm in length and 10 nm in width, and the
external force is assumed to be 80 nN.
The piezoelectric potential distributions were calculated
based on the rectangular BTO NW under the cantilever,
three-point, and four-point bending conditions, respectively.
The strain of a BTO NW cantilever and the electric polariza-
tion induced by the piezoelectric effect are given by the fol-
lowing relations:
ef g 0ð Þ ¼
�fy
EIxxy l� zð Þ
�fy
EIxxy l� zð Þ
� fy
EIxxy l� zð Þ
fy 1þ �ð ÞEIxx
y2 � 1
4b2
� �5nx4 þ 3 m� 1
4b2n
� �x2 � 1
4b2m� 1
� �
� 2fy 1þ �ð ÞEIxx
y nx5 þ m� 1
4b2n
� �x3 � 1
4b2mx
� �
0
8>>>>>>>>>>>>>>>>>>>>><>>>>>>>>>>>>>>>>>>>>>:
9>>>>>>>>>>>>>>>>>>>>>=>>>>>>>>>>>>>>>>>>>>>;
; (32)
~PR ¼ e½ � ef g 0ð Þ ¼
� 2fy 1þ �ð ÞEIxx
e15 nx5 þ m� 1
4b2n
� �x3 � 1
4b2mx
� �
fy 1þ �ð ÞEIxx
e15 y2 � 1
4b2
� �5nx4 þ 3 m� 1
4b2n
� �x2 � 1
4b2m� 1
� �
fyEIxx
2�e31 � e33ð Þy l� zð Þ
2666666664
3777777775: (33)
The body charge density can be calculated following
Eq. (11) in the ZnO NW case. As for the three-point and
four-point bending cases, the same corresponding equations
in the ZnO NW case can also be directly applied. As shown
in Figures 3(a)–3(c), the calculated electric potential distri-
butions are very similar to those calculated from the ZnO
NWs, and the parallel plate capacitor-like behavior was
obtained as a result of the piezoelectric effect. In addition, to
compare these two methods, the results of the piezoelectric
effect of BTO NW under the three different bending condi-
tions were calculated using the two methods (supplementary
material S646). The results from the two methods matched
very well, suggesting our decoupled method is indeed simple
and effective.
For potential calculation induced by the flexoelectric
effect, the same process was then applied to calculate the
potential distribution in the BTO NW. In the cantilever
mode, Eq. (22) is used to calculate the electric polarization,
and the surface charge density can thus be given as
XR
y¼6b=2
¼ 6fy
EIxxl� zð Þle: (34)
Under the three-point bending condition, the flexoelectric
effect-induced surface charge density along the BTO NW
can be given in two halves as
XR
y¼6b=2
¼ 6fy
EIxxzle; 0 < z < l=2ð Þ; (35)
XR
y¼6b=2
¼ 6fy
EIxxl� zð Þle; l=2 < z < lð Þ: (36)
For the four-point bending condition, the surface charge den-
sity is given in three segments where the BTO NW exhibits
gradient and uniform strains
XR
y¼6b=2
¼ 6fy
EIxxzle; 0 < z <
l
4
� �; (37)
XR
y¼6b=2
¼ 6fyl
4EIxxle;
l
4< z <
3l
4
� �; (38)
XR
y¼6b=2
¼ 6fy
EIxxl� zð Þle;
3l
4< z < l
� �: (39)
The corresponding calculated electric potential distributions
are shown in Figures 3(d)–3(f) for the cantilever, three-point,
and four-point bending conditions, respectively. The con-
stants used in our calculation are included in supplementary
material S3.46 It can be clearly seen that the BTO NW exhib-
its similar potential distribution as those calculated from the
154104-7 Zhang, Geng, and Wang J. Appl. Phys. 119, 154104 (2016)
Reuse of AIP Publishing content is subject to the terms at: https://publishing.aip.org/authors/rights-and-permissions. Download to IP: 68.117.134.25 On: Sat, 30 Apr 2016
17:00:43
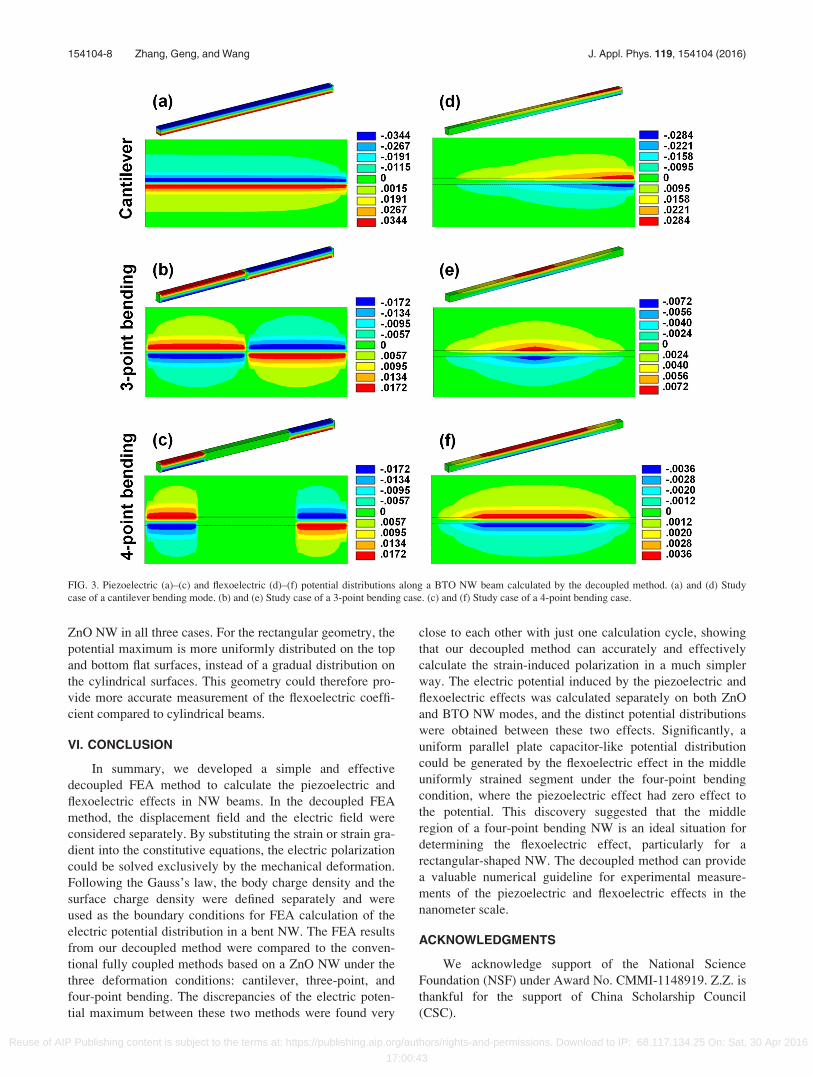
ZnO NW in all three cases. For the rectangular geometry, the
potential maximum is more uniformly distributed on the top
and bottom flat surfaces, instead of a gradual distribution on
the cylindrical surfaces. This geometry could therefore pro-
vide more accurate measurement of the flexoelectric coeffi-
cient compared to cylindrical beams.
VI. CONCLUSION
In summary, we developed a simple and effective
decoupled FEA method to calculate the piezoelectric and
flexoelectric effects in NW beams. In the decoupled FEA
method, the displacement field and the electric field were
considered separately. By substituting the strain or strain gra-
dient into the constitutive equations, the electric polarization
could be solved exclusively by the mechanical deformation.
Following the Gauss’s law, the body charge density and the
surface charge density were defined separately and were
used as the boundary conditions for FEA calculation of the
electric potential distribution in a bent NW. The FEA results
from our decoupled method were compared to the conven-
tional fully coupled methods based on a ZnO NW under the
three deformation conditions: cantilever, three-point, and
four-point bending. The discrepancies of the electric poten-
tial maximum between these two methods were found very
close to each other with just one calculation cycle, showing
that our decoupled method can accurately and effectively
calculate the strain-induced polarization in a much simpler
way. The electric potential induced by the piezoelectric and
flexoelectric effects was calculated separately on both ZnO
and BTO NW modes, and the distinct potential distributions
were obtained between these two effects. Significantly, a
uniform parallel plate capacitor-like potential distribution
could be generated by the flexoelectric effect in the middle
uniformly strained segment under the four-point bending
condition, where the piezoelectric effect had zero effect to
the potential. This discovery suggested that the middle
region of a four-point bending NW is an ideal situation for
determining the flexoelectric effect, particularly for a
rectangular-shaped NW. The decoupled method can provide
a valuable numerical guideline for experimental measure-
ments of the piezoelectric and flexoelectric effects in the
nanometer scale.
ACKNOWLEDGMENTS
We acknowledge support of the National Science
Foundation (NSF) under Award No. CMMI-1148919. Z.Z. is
thankful for the support of China Scholarship Council
(CSC).
FIG. 3. Piezoelectric (a)–(c) and flexoelectric (d)–(f) potential distributions along a BTO NW beam calculated by the decoupled method. (a) and (d) Study
case of a cantilever bending mode. (b) and (e) Study case of a 3-point bending case. (c) and (f) Study case of a 4-point bending case.
154104-8 Zhang, Geng, and Wang J. Appl. Phys. 119, 154104 (2016)
Reuse of AIP Publishing content is subject to the terms at: https://publishing.aip.org/authors/rights-and-permissions. Download to IP: 68.117.134.25 On: Sat, 30 Apr 2016
17:00:43
1A. Beya-Wakata, P. Y. Prodhomme, and G. Bester, Phys. Rev. B 84,
195207 (2011).2Y. F. Duan, G. Tang, C. Q. Chen, T. J. Lu, and Z. G. Wu, Phys. Rev. B 85,
054108 (2012).3A. Erba, K. E. El-Kelany, M. Ferrero, I. Baraille, and M. Rerat, Phys. Rev.
B 88, 035102 (2013).4A. Roy, M. Stengel, and D. Vanderbilt, Phys. Rev. B 81, 014102 (2010).5G. Saghi-Szabo, R. E. Cohen, and H. Krakauer, Phys. Rev. B 59, 12771
(1999).6N. Sai and E. J. Mele, Phys. Rev. B 68, 241405 (2003).7C. W. Swartz and X. F. Wu, Phys. Rev. B 85, 054102 (2012).8Z. C. Tu and X. Hu, Phys. Rev. B 74, 035434 (2006).9Z. G. Wu and H. Krakauer, Phys. Rev. B 68, 014112 (2003).
10V. L. Indenbom, E. B. Loginov, and M. A. Osipov, Kristallografiya 26,
1157 (1981).11A. K. Tagantsev, Phys. Rev. B 34, 5883 (1986).12P. Zubko, G. Catalan, A. Buckley, P. R. L. Welche, and J. F. Scott, Phys.
Rev. Lett. 99, 167601 (2007).13M. S. Majdoub, P. Sharma, and T. Cagin, Phys. Rev. B 77, 125424 (2008).14G. Catalan, B. Noheda, J. McAneney, L. J. Sinnamon, and J. M. Gregg,
Phys. Rev. B 72, 020102 (2005).15S. V. Kalinin and V. Meunier, Phys. Rev. B 77, 033403 (2008).16M. S. Majdoub, R. Maranganti, and P. Sharma, Phys. Rev. B 79, 115412
(2009).17B. Kumar and S. W. Kim, Nano Energy 1, 342 (2012).18Y. Qin, X. Wang, and Z. L. Wang, Nature 457, 340 (2009).19X. D. Wang, Nano Energy 1, 13 (2012).20X. D. Wang, Y. F. Gao, Y. G. Wei, and Z. L. Wang, Nano Res. 2, 177 (2009).21X. D. Wang, J. H. Song, J. Liu, and Z. L. Wang, Science 316, 102 (2007).22Z. L. Wang and J. H. Song, Science 312, 242 (2006).23A. P. Chandrakasan, N. Verma, and D. C. Daly, Annu. Rev. Biomed. Eng.
10, 247 (2008).24J. M. Donelan, Q. Li, V. Naing, J. A. Hoffer, D. J. Weber, and A. D. Kuo,
Science 319, 807 (2008).25J. Granstrom, J. Feenstra, H. A. Sodano, and K. Farinholt, Smart Mater.
Struct. 16, 1810 (2007).
26G. K. Ottman, H. F. Hofmann, A. C. Bhatt, and G. A. Lesieutre, IEEE
Trans. Power Electron. 17, 669 (2002).27J. A. Paradiso and T. Starner, IEEE Pervasive Comput. 4, 18 (2005).28S. Priya, J. Electroceram. 19, 167 (2007).29C. Xu, C. F. Pan, Y. Liu, and Z. L. Wang, Nano Energy 1, 259 (2012).30R. Yang, Y. Qin, C. Li, G. Zhu, and Z. L. Wang, Nano Lett. 9, 1201
(2009).31H. L. Zhang, Y. Yang, T. C. Hou, Y. J. Su, C. G. Hu, and Z. L. Wang,
Nano Energy 2, 1019 (2013).32Q. Deng, M. Kammoun, A. Erturk, and P. Sharma, Int. J. Solids Struct. 51,
3218 (2014).33X. Jiang, W. Huang, and S. Zhang, Nano Energy 2, 1079 (2013).34C. Liu, S. Hu, and S. Shen, Smart Mater. Struct. 21, 115024 (2012).35Y. Xu, S. Hu, and S. Shen, Comput. Modell. Eng. Sci. 91, 397 (2013).36H. Allik and T. J. R. Hughes, Int. J. Numer. Methods Eng. 2, 151 (1970).37B. T. Darrall, A. R. Hadjesfandiari, and G. F. Dargush, Eur. J. Mech. A-
Solids 49, 308 (2015).38Y. Gao and Z. L. Wang, Nano Lett. 9, 1103 (2009).39X. Liang, S. Hu, and S. Shen, Smart Mater. Struct. 24, 105012 (2015).40P. V. Yudin and A. K. Tagantsev, Nanotechnology 24, 432001 (2013).41A. Safari and E. K. Akdogan, Piezoelectric and Acoustic Materials for
Transducer Applications (Springer US, 2008).42Y. Gao and Z. L. Wang, Nano Lett. 7, 2499 (2007).43C. L. Sun, J. A. Shi, and X. D. Wang, J. Appl. Phys. 108, 034309 (2010).44H. Grimmer, Acta Crystallogr., Sect. A: Found. Crystallogr. 63, 441
(2007).45P.-Y. Prodhomme, A. Beya-Wakata, and G. Bester, Phys. Rev. B 88,
121304 (2013).46See supplementary material at http://dx.doi.org/10.1063/1.4946843 for
details of fully coupled FEA method, the linear piezoelectric coefficient
matrix, the complete expansion of the strain gradient, the direct flexoelec-
tric coefficient matrix, material constants used in calculation, supportive
calculation of nonlinear piezoelectric potential distribution along a ZnO
NW, piezoelectric and flexoelectric potential distributions along a ZnO
NW, and comparison of piezoelectric potential distribution along a BTO
NW calculated by the two methods.
154104-9 Zhang, Geng, and Wang J. Appl. Phys. 119, 154104 (2016)
Reuse of AIP Publishing content is subject to the terms at: https://publishing.aip.org/authors/rights-and-permissions. Download to IP: 68.117.134.25 On: Sat, 30 Apr 2016
17:00:43