Embed Size (px)
Citation preview

Calculation of the Functional Size and Productivity with the IFPUG method (CPM 4.3.1).
The DDway experience with WebRatio
Copyright © DDway s.r.l. All rights reserved. No part of this document can be used or reproduced in any forms or with any means (including photocopies, magnetic recordings or other), without the express written consent of DDWAY.
This document contains material that has been extracted from the IFPUG Counting Practices Manual.
It is reproduced in this document with permission of IFPUG.
Calculation of the Functional Dimension and Productivity using the IFPUG method (CPM 4.3.1) – The DDway experience with WebRatio
Page 2 of 16
INDEX
1. Introduction ................................................................................................................ 3
1.1 Objective of the document ............................................................................................................. 4 1.2 Function Point Analysis (FPA) ......................................................................................................... 4 1.3 Structure of the document ............................................................................................................. 4
2. Case Study of calculation in Function Point ................................................................ 5 2.1 Description of the Scenario ............................................................................................................ 5
2.1.1 Purpose of the Count and Counting Scope ........................................................................................................ 5 2.1.2 Determining the application boundaries ........................................................................................................... 5 2.1.3 Identifying the Functional User Requirements ................................................................................................... 6
2.2 Functional Size Measurement (FSM) ................................................................................................ 7 2.2.1 Identifying and measuring the Data Functions .................................................................................................. 7 2.2.2 Identifying and measuring the Transactional Functions ..................................................................................... 9 2.2.3 Calculating the Functional Size ...................................................................................................................... 13
3. Determining the Productivity .................................................................................... 14 3.1 Identification of the sample .......................................................................................................... 14 3.2 Calculation of productivity ............................................................................................................ 14
4. Benchmark ................................................................................................................ 15 4.1 The study ................................................................................................................................... 15 4.2 Comparative Chart ...................................................................................................................... 15 4.3 Sources ...................................................................................................................................... 15
Figure 1: Graphical overview of the function point counting process ..................................................... 5
Figure 2: Application boundaries ............................................................................................................. 6
Chart 3: Data function complexity and size ............................................................................................. 8
Figure 4: Reference Scenario .................................................................................................................. 9
Chart 5: Transactional function complexity and size ............................................................................. 11

Calculation of the Functional Dimension and Productivity using the IFPUG method (CPM 4.3.1) – The DDway experience with WebRatio
Page 3 of 16
1. INTRODUCTION
The International Function Point Users’ Group (IFPUG) is a nonprofit organization. The mission of IFPUG is to be a recognized leader in promoting and encouraging the effective management of application software development and maintenance activities through the use of Function Point Analysis (FPA) and other software measurement techniques.
This document refers to the Function Point Counting Practices Manual (CPM) Release 4.3.1 (ISBN 978-0-9753783-4-2). As usual in these kinds of studies, the practical application of the method is interspersed in wide areas where the method is detailed.
For more information about IFPUG, FPA and CPM you can consult http://www.ifpug.org/
DDway S.r.l. is the System Integration and consulting company of Dedagroup ICT Network, which operates in the ICT market providing software solutions, services for banks and financial institutions, public administration and manufacturing.
DDway is UNI EN ISO 9001:2008 certified in the Sector 33 – 35.
The centre of methodological competence has more than 200 resources with methodological competences and 160 certifications on approximately 30 different frameworks for the management of IT services and IT projects such as PMI, ITIL, ISO/IEC, IFPUG, etc.
As of today 14 resources among the CFPS Fellow, CFPS and CFPP are IFPUG certified.
As a member of IFPUG, DDway s.r.l. can reproduce parts of the Function Point Counting Practices Manual (CPM) within its own counting practices manuals.
For more information on DDway s.r.l. you can consult http://www.ddway.it/
WebRatio s.r.l. is a software development company born in 2001 with competences in optimization and growth of productivity in applications development processes and has created the IFML programming language (Interaction Flow Modeling Language) that visually defines the applications without writing any programming codes and is independent from the used technology.
WebRatio offers Web and mobile development platforms, such as WebRatio Web Platform, an integrated environment (IDE) on the Eclipse platform that makes an “intensive” use of the IFML standard to define the interaction flow of the user with the application. WebRatio Platform generates Web application for use on any Java Application Server. The generated code is open and based on standards, without using any proprietary run-time, both from the client and server sides.
For more information on WebRatio you can consult http://www.webratio.com/
DDway is a WebRatio partner and owns a WebRatio Competence Centre with IFML certified resources.

Calculation of the Functional Dimension and Productivity using the IFPUG method (CPM 4.3.1) – The DDway experience with WebRatio
Page 4 of 16
1.1 PURPOSE OF THE DOCUMENT
The aim of the paper is to evaluate the productivity level of projects developed and deployed with the application development platform IFML WebRatio by our Competence Center.
We use this information in order to evaluate the productivity growth compared to traditional development platforms.
To reach this objective we determine the size of a typical enhancement project, as an example for other developed or enhancement projects.
The functional size of the project has been calculated using the Function Point Analysis (FPA).
1.2 FUNCTION POINT ANALYSIS (FPA)
The IFPUG functional size measurement method is known as Function Point Analysis (FPA) and its measurement units are named Function Points.
Organizations can apply this International Standard to measure the size of a software product to:
support quality and productivity analysis;
estimate cost and resources required for software development, enhancement and maintenance;
provide a normalization factor for software comparison;
determine the size of a purchased application package by functionally sizing all the functions included in the package;
assist users in determining the benefit of an application package to their organization by functionally sizing functions that specifically meet their requirements.
The objectives of the function point analysis are to measure functionality:
implemented in software, that the user requests and receives;
impacted by software development, enhancement and maintenance independently of technology used for the implementation.
This modality is in compliance with the Counting Practises Manual defined by the International Function Point Users Group (IFPUG) in 4.3.1 release. This International Standard is, at the moment, the latest release in the continually improving IFPUG method that promotes the consistent interpretation of functional size measurement in conformance with ISO/IEC 14143-1:2007.
1.3 STRUCTURE OF THE DOCUMENT
This document contains the following parts:
Introduction
Description of the Scenario: • Purpose of the Count and Counting Scope • Determining the application boundaries • Identifying the Functional User Requirements
Functional Size Measurement - FSM: • Identifying and measuring the data functions • Identifying and measuring the transactional functions • Calculating the Functional Size
Determining the productivity
Comparison with the Benchmarks

Calculation of the Functional Dimension and Productivity using the IFPUG method (CPM 4.3.1) – The DDway experience with WebRatio
Page 5 of 16
2. CASE STUDY OF CALCULATION IN FUNCTION POINT
2.1 DESCRIPTION OF THE SCENARIO
To conduct a function point count, the following activities shall be performed to identify and classify the basic functional components (ILF, EIF, EI, EO, EQ) following the practices established by the IFPUG:
a. gather the available documentation, b. determine the counting scope and boundary and identify Functional User Requirement, c. measure data functions (ILF, EIF), d. measure transactional functions (EI, EO, EQ), e. calculate the functional size, f. document the function point count, g. report the result of the function point count.
Figure 1: Graphical overview of the function point counting process
2.1.1 Purpose of the Count and Counting Scope
This function point count is conducted to evaluate the productivity level carried out with a particular software platform by our work team.
To achieve this it is necessary to determine the size of a typical enhancement project, as an example to other enhancement projects.
This type of project is better suited to determine a productivity value based on Function Points because almost all the work made is functional work and so it is simpler to determine the related work effort.
The enhancement project is a project to develop and deliver adaptive maintenance. An enhancement project can also develop and deliver corrective and perfective maintenance, but these do not contribute to the enhancement project functional size.
The functional size of an Enhancement Project measures the project’s modifications to the existing installed application that add, change or delete user functions. The changes in functionality might result from new or revised user requirements, statutory/regulatory changes or new users.
2.1.2 Determining the application boundaries
The system “Work Planner” has the objective of managing work orders and validates the scheduling through approvals.
The system is triggered by a “Central Master Data” relating to the data elements on which work is carried out.
The Work Orders, after being approved, are transmitted from the Work Planner system to the external “Workforce Management” system to be processed.
The following figure represents the application boundaries of the enhancement project that is the object of measurement.

Calculation of the Functional Dimension and Productivity using the IFPUG method (CPM 4.3.1) – The DDway experience with WebRatio
Page 6 of 16
Figure 2: Application boundaries
2.1.3 Identifying the Functional User Requirements
During the analysis with the functional users the project scope has been established by identifying the functions that need to be modified or added to the pre-existing application.
The object of the project stems from the necessity to integrate the existing functions of the system with the possibility to manage the work orders for a particular detail of the Central Master Data, a sub-element called Group.
In particular, the following changes were requested:
Extraction of new sub-elements from the Central Master Data;
Creation of a new data store for sub-elements to be maintained by the application;
Modification of the entities “Work Order”, “Work” and “Work Approval”;
Modifications to the process of creating, updating, transmitting, accepting and approving work orders for the management of the sub-elements;
Modifications to the visualization functions to display the new data;
New export functions;
Implementation of new controls.
User
Work Planner
Central Master Data
WorkforceManagement
System

Calculation of the Functional Dimension and Productivity using the IFPUG method (CPM 4.3.1) – The DDway experience with WebRatio
Page 7 of 16
2.2 FUNCTIONAL SIZE MEASUREMENT (FSM)
2.2.1 Identifying and measuring the Data Functions
The identification of the data functions has been performed on the basis of the following rules:
1. Classify as an ILF if the data is maintained by the application being measured. 2. Classify as an EIF if the data:
a. Is referenced, but not maintained, by the application being measured and b. Is identified in an ILF in one or more other applications
The following data functions were added or modified during the enhancement project:
Description of the data function Type
Sub-elements master data EIF
Sub-elements data ILF
Work order ILF
Work ILF
Work approval ILF
The Sub-elements master data is a new referenced EIF because it is referenced, but not maintained, by the application.
For each ILF and EIF the number of RET and DET has been counted to determine the complexity.
To count Data Element Types (DETs) for a data function, the following rules have been performed:
1. Count one DET for each unique user recognizable, non-repeated attribute maintained in or retrieved from the data function through the execution of all elementary processes within the counting scope.
2. Count only those DETs being used by the application being measured when two or more applications maintain and/or reference the same data function.
3. Count one DET for each attribute required by the user to establish a relationship with another data function.
4. Review related attributes to determine if they are grouped and counted as a single DET or whether they are counted as multiple DETs; grouping will depend on how the elementary processes use the attributes within the application.
To count Record Element Types (RETs) for a data function, the following rules have been performed:
1. Count one RET for each data function (i.e., by default, each data function has one sub-group of DETs to be counted as one RET).
2. Count one additional RET for each of the following additional logical sub-groups of DETs (within the data function) that contains more than one DET:
a. associative entity with non-key attributes b. sub-type (other than the first sub-type) and c. attributive entity, in a relationship other than mandatory 1-1
The register of sub-elements is a new group of data maintained by the application.
The sub-element is a sub-type of the element; the data group is therefore not a new ILF but a RET added to the elements data function.

Calculation of the Functional Dimension and Productivity using the IFPUG method (CPM 4.3.1) – The DDway experience with WebRatio
Page 8 of 16
The following chart shows the RET and the DET for each data function that need to be modified during the enhancement project:
Description Mod Type
Type RET DET
Sub-elements master data ADD EIF 1 16
Elements CHG ILF 2 30
Work order CHG ILF 1 45
Work CHG ILF 1 70
Work approval CHG ILF 1 47
On the basis of the DET and RET numbers the functional complexity and size of the ILF and EIF is determined using the following rules:
ILF/EIF DET
Type
1-19 20-50 >50
EIF ILF
RET
1 Low Low Medium
Functional Complexity
Low 5 7
2-5 Low Medium High
Medium 7 10
>5 Medium High High
High 10 15
Chart 3: Data function complexity and size
The following chart shows the count of the FP for each data function that needs to be modified during the enhancement project:
Description Type RET DET Complexity Function
Points
Sub-elements master data EIF 1 16 Low 5
Elements ILF 2 30 Medium 10
Work order ILF 1 45 Low 7
Work ILF 1 70 Medium 10
Work approval ILF 1 47 Low 7

Calculation of the Functional Dimension and Productivity using the IFPUG method (CPM 4.3.1) – The DDway experience with WebRatio
Page 9 of 16
2.2.2 Identifying and measuring the Transactional Functions
In our reference scenario the ILF and the EIF that are supported within the application are represented together with the transactional functions:
Figure 4: Reference Scenario
The transactional functions have been then analyzed applying the FPA rules:
Identify each Elementary Process (EP) required by the user
Determine unique EPs
Classify each EP as an External Input (EI), External Output (EO), or External Inquiry (EQ)
Count the File Types Referenced (FTRs) for each transactional function
Count the Data Element Types (DETs) for each transactional function
Determine the functional complexity for each transactional function
Determine the functional size of each transactional function
To identify each elementary process, the following activities have been performed:
1. Compose and/or decompose the Functional User Requirements into the smallest unit of activity, which satisfies all of the following: a. is meaningful to the user; b. constitutes a complete transaction; c. is self-contained; d. leaves the business of the application being counted in a consistent state;
2. Identify an elementary process for each unit of activity identified that meets all the above mentioned criteria.
View Work Order – EQExport Work Order List – EQ
View Work Approval– EQExport Work Approval List – EO
View Work – EQExport Work List – EO
Load Sub-Elements - EI
Work Acceptance – EI
Work Approval - EI
Modify Work Approval – EI
New Work Order– EIModify Work Order – EI
ILF/EIF in read only
ILF in reading and editing mode
SubElementMaster Data
(EIF)
Element(ILF)
Work Order(ILF)
Work(ILF)
WorkApproval
(ILF)

Calculation of the Functional Dimension and Productivity using the IFPUG method (CPM 4.3.1) – The DDway experience with WebRatio
Page 10 of 16
Once identified, the elementary processes are classified in EI, EO, or EQ.
The elementary process is an EI, if it:
1. has a primary intent of • maintaining one or more ILFs, or • altering the behavior of the application,
2. includes processing logic to accept data or control information that enters the boundary of the application.
The elementary process is an EO, if it:
1. has the primary intent of presenting information to the user, 2. includes at least one of the following forms of processing logic:
• mathematical calculations are performed, • one or more ILFs are updated, • derived data is created, • the behavior of the application is altered.
The elementary process is an EQ, if it:
1. has the primary intent of presenting information to the user, 2. references a data function to retrieve data or control information, 3. does not satisfy the criteria to be classified as an EO.
The application baseline is composed by the following transactional functions, modified during the enhancement project.
Description Mod Type
Type
New Work Order for sub-element ADD EI
Modify Work Order for sub-element ADD EI
View Work Order CHG EQ
Export Work Order list ADD EQ
Work Acceptance CHG EI
View Work CHG EQ
Export Work list ADD EO
Work Approval CHG EI
Modify Work Approval ADD EI
View Work Approval CHG EQ
Export Work Approval list ADD EO
Load sub-elements ADD EI
The implementation of the new required controls is not an elementary process since it is not an autonomous activity.
The new required functions of exporting Works and Approvals are External Outputs since derived data is present.
Once the transactional functions have been indentified, the File Types Referenced (FTR) and the Data Element Types (DET) are counted using the following rules:
1. Count one FTR for each unique data function that is accessed (read from and/or written to) by the transactional function.

Calculation of the Functional Dimension and Productivity using the IFPUG method (CPM 4.3.1) – The DDway experience with WebRatio
Page 11 of 16
2. Count one DET for each unique user recognizable, non-repeated attribute that crosses (enters and/or exits) the boundary during the processing of the transactional function,
3. Count only one DET per transactional function for the ability to send an application response message even if there are multiple messages,
4. Count only one DET per transactional function for the ability to initiate action(s) even if there are multiple means to do so,
5. Do not count the following items as DETs: • literals such as report titles, screen or panel identifiers, column headings and attribute titles; • application generated stamps such as date and time attributes; • paging variables, page numbers and positioning information; e.g., ‘Rows 37 to 54 of 211’; • navigation aids such as the ability to navigate within a list using “previous”, “next”, “first”, “last”
and their graphical equivalents; • attributes generated within the boundary by a transactional function and saved to an ILF without
exiting the boundary; • attributes retrieved or referenced from an ILF or EIF for participation in the processing without
exiting the boundary.
In the following chart you can see the FTR and the DET counted on the project baseline for each data function.
Description Type FTR DET
New Work Order for sub-element EI 2 40
Modify Work Order for sub-element EI 2 41
View Work Order EQ 2 37
Export Work Order list EQ 2 28
Work Acceptance EI 3 40
View Work EQ 2 54
Export Work list EO 2 32
Work Approval EI 3 58
Modify Work Approval EI 3 37
View Work Approval EQ 2 18
Export Work Approval list EO 2 28
Load sub-elements EI 2 18
On the base of the number of FTR and DET it has been determined the functional complexity applying the following rules:
EI
DET
EO/EQ
DET
Type
1-4 5-15 >15 1-5 6-19 >19 EI EO EQ
FTR
0-1 Low Low Medium
FTR
0-1 Low Low Medium
Functional Complexity
Low 3 4 3
2 Low Medium High 2-3 Low Medium High Medium 4 5 4
>2 Medium High High >3 Medium High High High 6 7 6
Chart 5: Transactional function complexity and size
In the following chart you can see the FP calculation of the baseline with regards to the transactional functions:
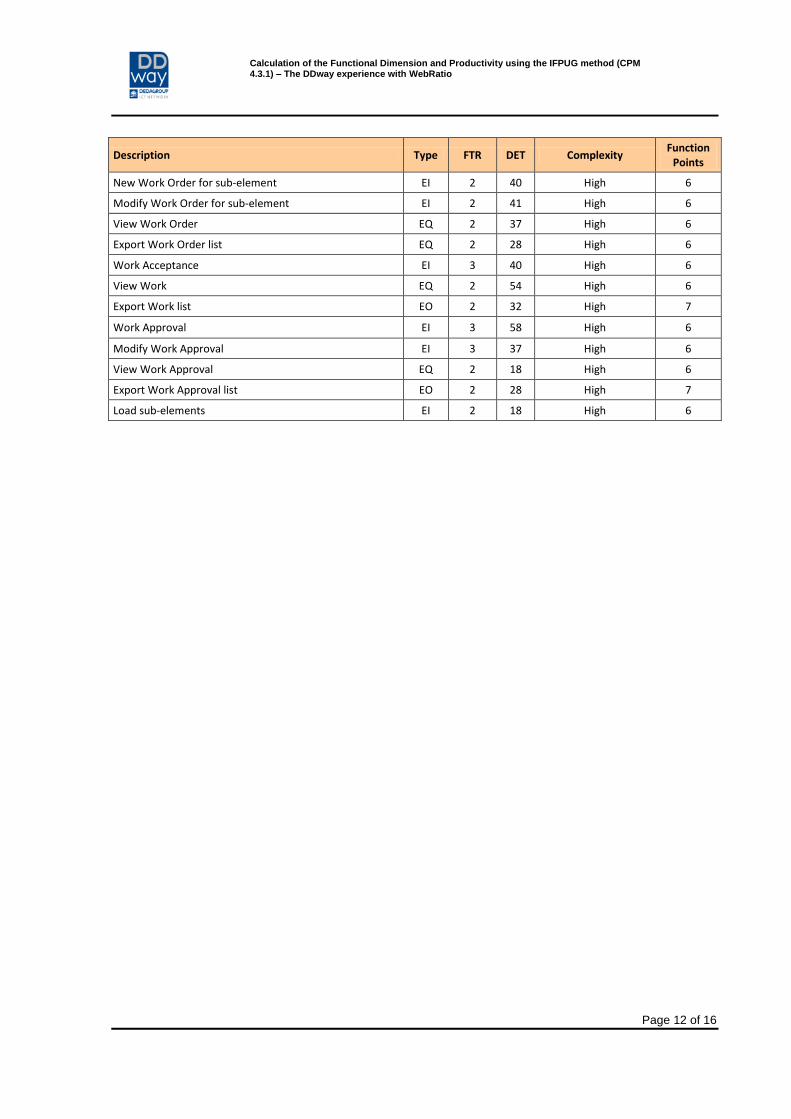
Calculation of the Functional Dimension and Productivity using the IFPUG method (CPM 4.3.1) – The DDway experience with WebRatio
Page 12 of 16
Description Type FTR DET Complexity Function
Points
New Work Order for sub-element EI 2 40 High 6
Modify Work Order for sub-element EI 2 41 High 6
View Work Order EQ 2 37 High 6
Export Work Order list EQ 2 28 High 6
Work Acceptance EI 3 40 High 6
View Work EQ 2 54 High 6
Export Work list EO 2 32 High 7
Work Approval EI 3 58 High 6
Modify Work Approval EI 3 37 High 6
View Work Approval EQ 2 18 High 6
Export Work Approval list EO 2 28 High 7
Load sub-elements EI 2 18 High 6
Calculation of the Functional Dimension and Productivity using the IFPUG method (CPM 4.3.1) – The DDway experience with WebRatio
Page 13 of 16
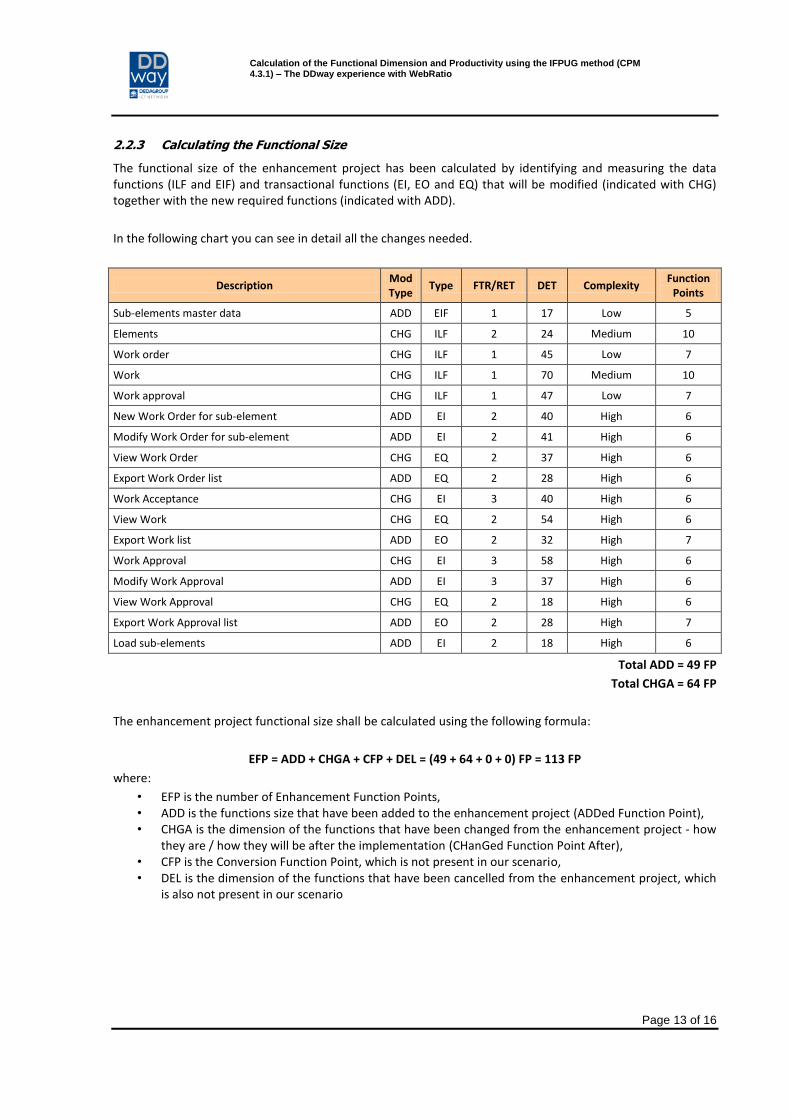
2.2.3 Calculating the Functional Size
The functional size of the enhancement project has been calculated by identifying and measuring the data functions (ILF and EIF) and transactional functions (EI, EO and EQ) that will be modified (indicated with CHG) together with the new required functions (indicated with ADD).
In the following chart you can see in detail all the changes needed.
Description Mod Type
Type FTR/RET DET Complexity Function
Points
Sub-elements master data ADD EIF 1 17 Low 5
Elements CHG ILF 2 24 Medium 10
Work order CHG ILF 1 45 Low 7
Work CHG ILF 1 70 Medium 10
Work approval CHG ILF 1 47 Low 7
New Work Order for sub-element ADD EI 2 40 High 6
Modify Work Order for sub-element ADD EI 2 41 High 6
View Work Order CHG EQ 2 37 High 6
Export Work Order list ADD EQ 2 28 High 6
Work Acceptance CHG EI 3 40 High 6
View Work CHG EQ 2 54 High 6
Export Work list ADD EO 2 32 High 7
Work Approval CHG EI 3 58 High 6
Modify Work Approval ADD EI 3 37 High 6
View Work Approval CHG EQ 2 18 High 6
Export Work Approval list ADD EO 2 28 High 7
Load sub-elements ADD EI 2 18 High 6
Total ADD = 49 FP
Total CHGA = 64 FP
The enhancement project functional size shall be calculated using the following formula:
EFP = ADD + CHGA + CFP + DEL = (49 + 64 + 0 + 0) FP = 113 FP
where:
• EFP is the number of Enhancement Function Points, • ADD is the functions size that have been added to the enhancement project (ADDed Function Point), • CHGA is the dimension of the functions that have been changed from the enhancement project - how
they are / how they will be after the implementation (CHanGed Function Point After), • CFP is the Conversion Function Point, which is not present in our scenario, • DEL is the dimension of the functions that have been cancelled from the enhancement project, which
is also not present in our scenario

Calculation of the Functional Dimension and Productivity using the IFPUG method (CPM 4.3.1) – The DDway experience with WebRatio
Page 14 of 16
3. DETERMINING THE PRODUCTIVITY
3.1 IDENTIFICATION OF THE SAMPLE
The objective of this case study is to evaluate the productivity level of projects developed and deployed with the application development platform IFML WebRatio by our Competence Center.
To reach this objective we determine the size of a typical enhancement project. This type of project is better suited to determine a productivity value based on Function Points because almost all the work made is functional work and so it is simpler to determine the related work effort.
The significance of the sample(s) is essential in order to obtain measures that are truly representative of productivity. The kind of project selected for the calculation concerns the implementation of new functions on a consolidated baseline. It is indeed a particular case of an enhancement project whose functional size needs to be calculated with the following formula:
EFP = ADD + CHGA + CFP + DEL
Where in our case the CFP and DEL values are null and therefore:
EFP = ADD + CHGA
This type of project is better suited to determine a productivity value based on Function Points because:
It avoids including in the estimate the necessary work in the realization of non-functional components that occur in a more significant way when a new application is developed in a new field and that are less critical on enhancement projects;
It avoids measuring cancellation activities of pre-existing functions in the calculation of productivity; complying with the method, the size of the Function Points of a given function that needs to be cancelled is the same as its creation.
3.2 CALCULATION OF PRODUCTIVITY
In the case study the number of FP is:
EFP = (49 + 64 + 0 + 0) FP = 113 FP
The team that developed the enhancement project (design, coding. internal and acceptance test, release) was composed by two WebRatio specialists that were allocated on a full-time basis for 8 working days.
For the realization of the project the two specialists took a total of 16 working days with a mean productivity of:
113 FP/16 days = 7,06 FP per day = 148 FP per month (1)
= 1,13 hours per FP
The productivity of our sample has been compared with the productivity of other projects with similar functional sizing developed by the Competence Center with WebRatio always obtaining similar values and within a ±10% range.
(1) For statistical purposes it is assumed that one month corresponds to 21 days.
Calculation of the Functional Dimension and Productivity using the IFPUG method (CPM 4.3.1) – The DDway experience with WebRatio
Page 15 of 16
4. BENCHMARK
Following is presented a comparison of the result of the analysis carried out on the productive efficiency calculated in FP with the development productivity in projects that are created with a traditional approach.
4.1 THE STUDY
ISBSG, a not-profit research centre for the collection of data and analysis in the IT sector, has carried out a study on more than 6000 projects using the Function Points measurement in order to determine the complexity and the dimensions of the projects. Thanks to the collection and the comparison of the data, ISBSG has obtained a productivity measure of the projects, which is called Product Delivery Rate (PDR), which is equal to the amount of hours needed to release a Function Point.
http://www.isbsg.org/ISBSGnew.nsf/WebPages/BC9AD66DEC719C2BCA25745D001A2256
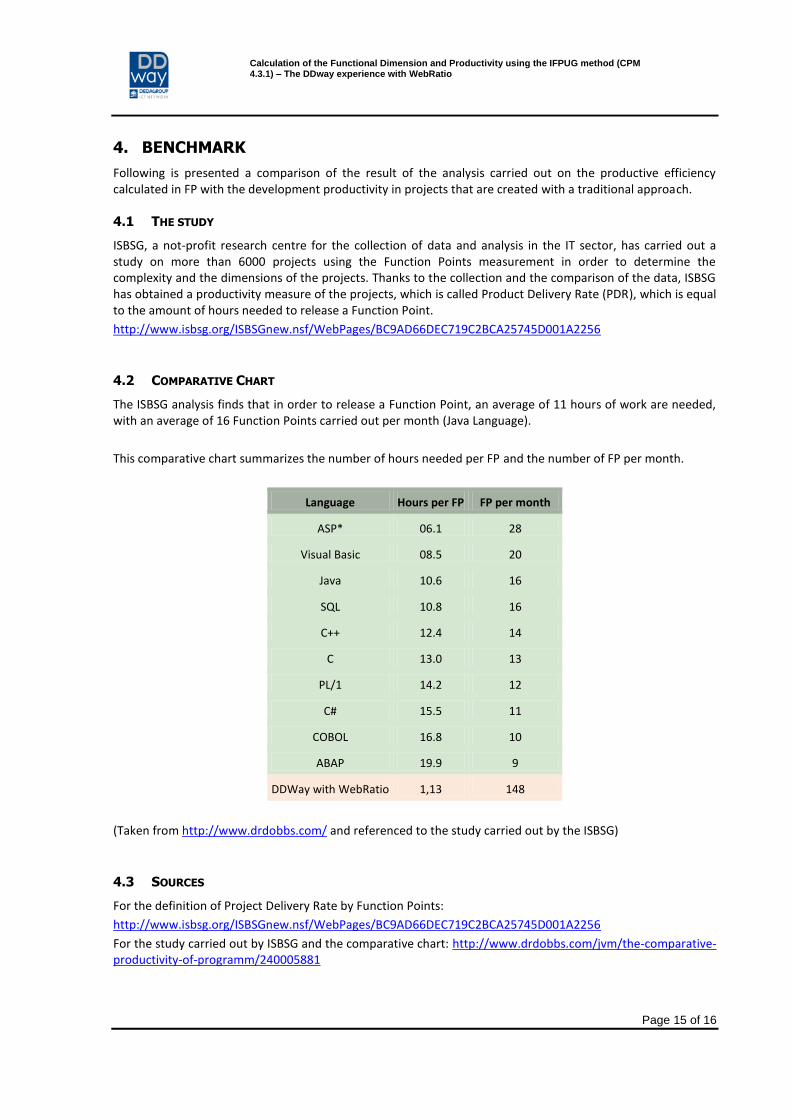
4.2 COMPARATIVE CHART
The ISBSG analysis finds that in order to release a Function Point, an average of 11 hours of work are needed, with an average of 16 Function Points carried out per month (Java Language).
This comparative chart summarizes the number of hours needed per FP and the number of FP per month.
Language Hours per FP FP per month
ASP* 06.1 28
Visual Basic 08.5 20
Java 10.6 16
SQL 10.8 16
C++ 12.4 14
C 13.0 13
PL/1 14.2 12
C# 15.5 11
COBOL 16.8 10
ABAP 19.9 9
DDWay with WebRatio 1,13 148
(Taken from http://www.drdobbs.com/ and referenced to the study carried out by the ISBSG)
4.3 SOURCES
For the definition of Project Delivery Rate by Function Points:
http://www.isbsg.org/ISBSGnew.nsf/WebPages/BC9AD66DEC719C2BCA25745D001A2256
For the study carried out by ISBSG and the comparative chart: http://www.drdobbs.com/jvm/the-comparative-productivity-of-programm/240005881

DDway srl Head office: Via di Spini, 50 – 38121 Trento (TN) Tel.: +39 06 515061 – Fax: +39 06 51506302 - [email protected] CF/N° R.I. 07374190580 - P.IVA 11300260152 Corporation Stock Euro 6.750.000 Soc. contr. art. 2497 C.C. of Dedagroup Spa (TN)
BRANCHES
Assago (MI) Centro Direzionale Milanofiori Strada 3, Palazzo B1
20090 Assago (MI) T. +39 02 577751 - F. +39 02 89202077
Roma Via Paolo di Dono, 73
00142 Roma
T. +39 06 515061 - F. 06 51506302
Padova Via San Crispino, 28 35129 Padova
T. +39 049 69831 - F. +39 049 773873
Torino Strada Pianezza, 289
10151 Torino T. +39 011 49041 - F. +39 011 4904300
copyright © DDway S.r.l. | P.Iva 11300260152
Head Office: Via di Spini, 50 – 38121 Trento (TN) – T. +39 06 515061 – F. +39 06 51506302 Email. [email protected]