Embed Size (px)
Citation preview

Just Economics for BT, June 2014Valuing Digital Inclusion: Calculating the social value to individuals of going online
Valuing Digital Inclusion
Calculating the social value to individuals of going onlineWritten by Eilís Lawlor for the BT Get IT Together Projectwww.justeconomics.co.uk
June 2014
2Just Economics for BT, June 2014Valuing Digital Inclusion: Calculating the social value to individuals of going online
ContentsKey findings .......................................................................................................................... 3
1. Introduction ................................................................................................................... 4
2. Putting the research in context ....................................................................................... 5
Link to SROI.................................................................................................................... 5
Challenges and caveats ................................................................................................... 5
3. Review of valuation methodologies ................................................................................. 6
Why we value public goods ............................................................................................. 6
Valuation methods ......................................................................................................... 7
Revealed preference ....................................................................................................... 8
Conclusions ................................................................................................................... 9
4. Categorisation of users and counterfactuals .................................................................... 10
5. Valuing Digital Inclusion: Our findings ............................................................................. 12
Calculation for a new user ............................................................................................... 12
Calculation for an advanced user ..................................................................................... 15
Calculation for a professional user ................................................................................... 16
Conclusion ........................................................................................................................... 16
References ............................................................................................................................ 17

3Just Economics for BT, June 2014Valuing Digital Inclusion: Calculating the social value to individuals of going online
Key findings• Digital inclusion is challenging to value because there is not a binary online/offline state but a
continuum of experience and levels of inequality of access and experience
• There are three main types of valuation methodologies used in economics to value non-traded goods. Some of these methods have been applied to social aspects of information and communication technologies (ICTs) but have mainly looked at things like the roll-out of broadband
• We have used a ‘bottom-up’ methodology where we have built up the total value from individual experience, drawing on the findings from the wider BT SROI analysis
• We have categorised users as: ‘new’ – previously not online – ‘advanced’ – online but not using IT in their job – and ‘professional’ – an advanced user that is also using IT at work. This has allowed us to value the different experiences discreetly
• The status for which the greatest benefits are realised are for the new user, as the alternative is complete digital exclusion. The second most valuable status is to be a professional user, as people who use IT in work can command significantly higher salaries but usually have the benefits of being an advanced user. An advanced user already has the benefits of a new user but uses IT more frequently and for more things
• We estimate the value of digital inclusion for a new user as £1,064 per annum. This comes from having more confidence, making financial savings online, less boredom, opportunities to pursue hobbies, new jobseeking skills, and a reduction in social isolation
• We estimate the additional value of digital inclusion for an advanced user as £1,756. This comes from being online more and being able to do more activities
• We estimate the additional value of digital inclusion for a professional user as £3,568 when combined with the benefits for an advanced user. This comes from being able to work remotely and the wage premium available to those who use IT at work

4Just Economics for BT, June 2014Valuing Digital Inclusion: Calculating the social value to individuals of going online
1. IntroductionFor many people, the internet and the personal computer have both become a central part of everyday life, despite only emerging about 25 years ago. They have transformed professional and private life, and the number of services and areas of life that they touch has continued to grow. But what is being online and digitally connected worth to people, society, and the environment? This is a challenging question to answer, not least because the internet is now so ubiquitous and central to many people’s lives that, for some, picturing what life would be like without it is extremely difficult.
Digital inclusion, defined as have the skills, motivation and access to go online (Dutton and Helsper, 2007; Warschauer, 2002; White and Selwyn, 2013) is perceived by many to be extremely valuable, not only to individuals, but also to businesses, the state, and society as a whole. The purpose of this paper is to try to put some figures on what being ‘digitally included’ is worth to the individual, ie what difference it makes in someone’s life to go from being offline to online and what value can be placed on that change.
Much of the available literature in this area focuses specifically on the value of the internet, and with a particular emphasis on broadband, rather than on the more holistic concept of digital inclusion. In order therefore to try to value digital inclusion as a whole, the approach taken in this paper is to try to value each of the incremental steps involved in becoming digitally included.
There are two ways of approaching this challenge, referred to here as the ‘top down’ and ‘bottom up’ approaches (Van der Wee et al., 2014). The top down approach tries to calculate what a benefit is worth at some macro-level, whether it is country, city or global level, and draws on data related to relevant dependent variables such as changes in output, employment, education and carbon emissions etc. In some instances it is possible to use these findings to calculate the benefits to individuals (Crandall et al., 2007; Greenstein and McDevitt, 2011; Koutroumpis, 2009; SQW Consulting, 2013).
The bottom up approach is more similar to the approach take in the SROI analysis of which this paper forms a part. This approach identifies benefits to the individual and then aggregates these for a larger population.
The benefit of the top down approach is that the larger samples provide greater statistical power, but the limitation is that the analysis is reliant on those outcomes for which data exists and as such, misses out the benefits to specific groups of users, or potential users – a limitation addressed by the bottom up approach.
In this paper we will draw on examples from both approaches, taking care not to double-count the benefits.
This paper begins by setting this paper in the context of the overall SROI project and highlights some challenges and caveats and how these will be addressed in the methodology. It then summarises the valuation literature in economics before presenting the findings from the study.

5Just Economics for BT, June 2014Valuing Digital Inclusion: Calculating the social value to individuals of going online
2. Putting the research in context
Link to SROIThe social return on investment (SROI) project of which this paper forms a part, set out to assess whether the BT Get IT Together programme was good value for money in terms of the return on investment to society and individuals that benefit from it. This paper serves a different purpose, which is to attempt to put a value on what being digitally included means, irrespective of what means you have gone through to get online. It is not connected to the effectiveness of the BT Get IT Together programme but imagines what the benefits to someone being online might be and what they might be worth to them. It does not attempt to capture the wider benefits, such as those to the state as a whole, as that would overlap with the SROI. Many of the calculations in this paper are drawn from the SROI analysis as it provides a unique piece of research into the changes to people’s lives from getting online but it also builds on that by moving on to more advanced levels of usage that have not been covered in the SROI.
Challenges and caveatsThe primary challenge with valuing digital inclusion is that there is much opposition in the academic literature to the concept of an absolute ‘digital divide’, with ‘haves’ and ‘have nots’ in terms of access to technology. Sociologists prefer to think of inequality in this area as a) a continuum of experiences (Warschauer 2004), or a series of digital divides (Van Dijk 2005; DiMaggio et al. 2004; White and Selwyn 2013) and b) being rooted in, and inextricably linked to social and economic inequalities. These arguments are used as explanation for why digital exclusion persists within certain groups. For example, that previous policies to reduce the digital divide were ineffective because they focused exclusively on access (White and Selwyn 2013), rather than a combination of access, skills and motivation. In addition, that because digital exclusion is a by-product of deeper economic inequalities, it can only be addressed by addressing those inequalities directly.
We have addressed the first point in the methodology by constructing three stages of engagement and valuing each in an incremental way. This research, or the programme to which it relates cannot address the second of these points. But it should be borne in mind that ‘supply side’ measures such as skills development has limitations, which might act a barrier to digital inclusion.
Whilst it is necessary to appreciate these complexities they should not act as a barrier to doing the analysis in the first place. Knowing the value of something, whilst keeping in mind its caveats, helps to guide policy and investment decisions, not just about what should be funded by how much and where, but also the mix of investment and resources it requires.
6Just Economics for BT, June 2014Valuing Digital Inclusion: Calculating the social value to individuals of going online
3. Review of valuation methodologies
Why we value public goodsPublic goods are goods that are under-provided by the market but are of such public value that governments see fit to intervene.
Economists have carried out a substantial amount of work to value public goods. Where markets for public goods do exist, price signals usually don’t convey a good measure of the value to users of the service because they are heavily subsidised, or the price is regulated to ensure the widest access. As such, shadow prices, or financial proxies are generated to attempt to value them. A well-known example is the valuation of carbon emissions to build pollution and environmental degradation into investment decisions. Valuation is a key part of social cost benefit analysis, as it is with SROI, because these methods are generally concerned with public goods in one form or another.
Access to broadband is increasingly considered as a public good [1] due to its widely reported economic benefits (Crandall et al., 2007; Greenstein and McDevitt, 2011; Koutroumpis, 2009; SQW Consulting, 2013), newly emerging recognition of the social benefits[2], and government involvement in subsidising provision in under-served markets (Grove, 2010).
Telecommunications are also public goods in that they exhibit strong network effects. The internet, for example, needs a minimum number of users for it to work and the net benefits increase as more users come on stream. Prior to the rollout of broadband, it was (correctly) argued that getting people connected would have positive indirect network externalities in that suppliers would create new forms of content that would attract even more internet users (Cremer, 2000). In this sense broadband increases the pool of internet users as well as improving their experience and is in itself a potential tool to reduce digital exclusion.

7Just Economics for BT, June 2014Valuing Digital Inclusion: Calculating the social value to individuals of going online
Valuation methodsThere are two main methods for uncovering people’s valuations of non-traded or partially-traded goods: the Revealed Preference Method (RPM) and the Stated Preference Method (SPM). Bateman’s graph shown in Figure 1 describes the methods that come under each (Bateman et al., 2002). These methods do not require a full explanation here so we just provide a brief description of those that are most relevant. A more recent method, which is not included in Figure 1 but is increasingly used in SROI is the Life Satisfaction method, so this is also included in the overview below.
Figure 1: Total economic value
Source: (Bateman et al., 2002)
Use Value
Revealed Preferencesconventional and proxy markets
Travel Cost Method (WTP)
Non-use Value
Total Economic Value
Dose Response / Product Functions Stated Preferenceshypothetical markets
Market Prices (WTP)
Choice Modelling (WTP/WTA)
Property Market (WTP)
Choice Experiments
Contingent Ranking
Benefits Transfer
Random Utility/Discrete Choice Models (WTP)
Contingent Valuation (WTP/WTA)
Paired Comparisons
Contingent (conjoint) Ranking
Hedonic Pricing
Averting Behaviour (WTP)
Labour Market (WTP)
[1] It is more accurately a quasi-public good, rather than a pure public good because although is non-rivalrous, it isn’t non-excludable i.e. it still requires people to pay for its use but it is similar to other public utilities in that regard.
[2] These are described in detail in the previous literature review carried out for the SROI

8Just Economics for BT, June 2014Valuing Digital Inclusion: Calculating the social value to individuals of going online
Revealed preferenceThe Revealed Preference Method (RPM) uses market transactions to reveal the value of related non-market goods. Actual transaction data can therefore be used to impute people’s ‘Willingness to Pay’ for related goods. For example, the amount people are prepared to spend on entrance fees for national parks may reveal a willingness to pay for nature conservation. There are also other sub-methodologies that can be grouped under RPM:
• Hedonic pricing isolates an attribute of a commodity, which carries an additional cost or a premium, as a value for that attribute. An example might be the premium people are prepared to pay for fairly traded goods as a proxy for the value they place on decent wages. Variations in house prices that reflect local characteristics – noise or air pollution and even sunsets – are common examples.
• The travel cost method calculates how much people are prepared to spend on travel to use a facility or consume a good
• Changes in wages or income that people require, or are prepared to accept, have been used to value everything from crime to life.
Stated preferenceThe Stated Preference Method (SPM) refers to a family of tools and techniques that have been created to arrive at valuations, usually of intangible or hypothetical goods. There are two main approaches: Contingent Valuation (CV) and Choice Modelling (CM), which are related and which do not require explanation here. The SPM is very popular amongst environmental economists. However, more relevant to this research, this method is also often used to assess the value of new products or services. For example, it has been used to assess whether consumers would be willing to pay for online content in a subscription model (eg sports results, newspapers) (Chyi, 2005; Dou, 2004; Theysohn, 2006).
Life satisfaction methodThe life satisfaction method correlates the degree of public ‘goods’ or ‘bads’ with individual’s reported subjective wellbeing and evaluates them directly in terms of life satisfaction, as well as relative to the effect of income (Frey et al., 2004). In practice, this means calculating the equivalent income that would be required to achieve the same wellbeing benefit as the good or service being valued. Conversely, it can be used to put a cost on goods or services that limit our wellbeing.
Applying valuation techniques to ICTsThere are a number of SPM studies on extending broadband to under-served markets (Goolsbee, 2002) and the rollout of fibre (refs). However, it is difficult for the research to keep up with the changing nature of technology and preferences and expectations in this area. A recent US report attempted to measure people’s willingness to pay for improvements in broadband speed, calculating that a representative household would be willing to pay about $59 per month for a less reliable internet service with fast speed (‘Basic’), about $85 for a reliable internet service with fast speed and the priority feature (‘Premium’), and about $98 for a reliable internet service with fast speed plus all other activities (‘Premium Plus’). An improvement to very fast speed adds about $3 per month to these estimates (Rosston et al., 2011).
There are many critiques of these approaches, which we will not summarise here. However, an obvious problem from a digital exclusion point of view is that an emphasis on what people are able or prepared to pay prioritises those that can either afford to pay more, or who are willing to pay more. Indeed, studies have found that those with less experience of using the internet were prepared to pay less. This is one of the reasons why SROI, although it uses these approaches, is more radical in how valuation is done to ensure that inequalities in initial conditions are corrected for.
9Just Economics for BT, June 2014Valuing Digital Inclusion: Calculating the social value to individuals of going online
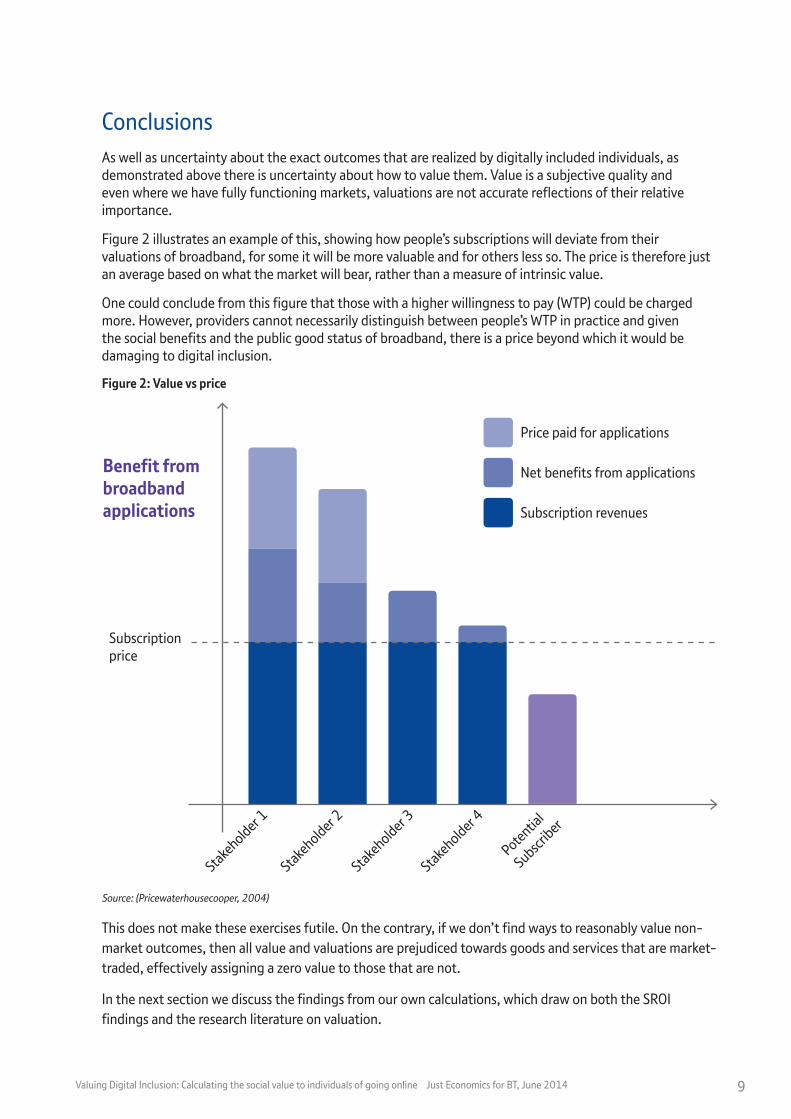
Conclusions As well as uncertainty about the exact outcomes that are realized by digitally included individuals, as demonstrated above there is uncertainty about how to value them. Value is a subjective quality and even where we have fully functioning markets, valuations are not accurate reflections of their relative importance.
Figure 2 illustrates an example of this, showing how people’s subscriptions will deviate from their valuations of broadband, for some it will be more valuable and for others less so. The price is therefore just an average based on what the market will bear, rather than a measure of intrinsic value.
One could conclude from this figure that those with a higher willingness to pay (WTP) could be charged more. However, providers cannot necessarily distinguish between people’s WTP in practice and given the social benefits and the public good status of broadband, there is a price beyond which it would be damaging to digital inclusion.
Figure 2: Value vs price
Source: (Pricewaterhousecooper, 2004)
This does not make these exercises futile. On the contrary, if we don’t find ways to reasonably value non-market outcomes, then all value and valuations are prejudiced towards goods and services that are market-traded, effectively assigning a zero value to those that are not.
In the next section we discuss the findings from our own calculations, which draw on both the SROI findings and the research literature on valuation.
Price paid for applications
Net benefits from applications
Subscription revenues
Stakeholder 1
Stakeholder 2
Stakeholder 3
Stakeholder 4
Potential
Subscriber
Subscription price
Benefit from broadband applications

10Just Economics for BT, June 2014Valuing Digital Inclusion: Calculating the social value to individuals of going online
4. Categorisation of users and counterfactualsTo ensure that the analysis is sufficiently subtle to capture the range of experiences, we have categorised users into three categories:
• New user
• Advanced user
• Professional user
Figure 3 describes what we mean by each of these categories. We have also identified a comparator group for each i.e. the counterfactual that we are comparing the value to.
Figure 3: Categories of user
It is important to note that this does not assume that an individual moves from left to right in a linear fashion, or at all. Nor is the intention to suggest that becoming a professional user is a final outcome, as someone can get the full benefits of information and communication technologies (ICTs) without using them in their work (indeed perhaps arguably more) but the nature of those benefits differs, as will be discussed. There are many further breakdowns of user types such as rural/urban, old/young etc. but to keep the analysis manageable, we have restricted it to these three groups.
This study specifically focuses on the current benefits to individuals, but it should be remembered that the valuations will change over time, as will the number of relevant outcomes from the technology. A further stage of the analysis would be to calculate potential future benefits for individuals in relation to e-health and e-learning etc. that have not yet been realised.
The study also focuses solely on the benefits to individuals of getting online, rather than the internet as an enabler or policy goals in health, education and climate change, as there are numerous attempts to place values on that already (see, for example (Pricewaterhousecooper, 2004).
1. New User
Profile• Basic skills
• Some access to the internet
• Frequent user, at least once per week
Counterfactual• No use of
computers or the internet
2. Advanced User
Profile• High level of skill
• Broadband and home device
• Regular user, at least once per day
Counterfactual• New user
3. Professional User
Profile• Skill access and
usage of advanced
• Uses ICTs at work and / or is teleworking
Counterfactual• Advanced user
11Just Economics for BT, June 2014Valuing Digital Inclusion: Calculating the social value to individuals of going online
Finally, this study only takes into consideration the positive contributions that ICTs make to people’s lives but it is important to recognise that there may be ‘dis-benefits’, not least in its most basic form, the costs to people of internet subscriptions. The study does also not include the costs of complementary investments aimed at combating digital exclusion, such as the Get IT Together programme. A more thorough or comprehensive approach may attempt to capture these.
As mentioned at the outset, valuing a concept like digital inclusion is challenging. To ensure that the reader is clear on how the valuations were reached we aim to be as transparent as possible.
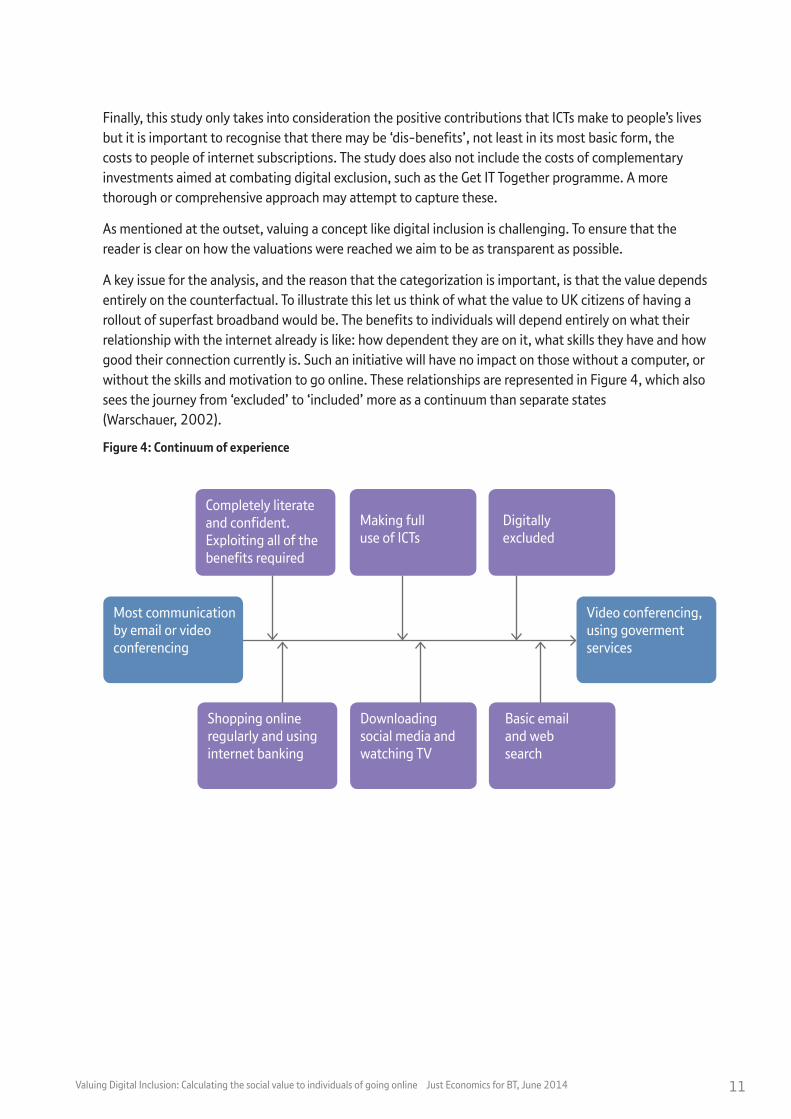
A key issue for the analysis, and the reason that the categorization is important, is that the value depends entirely on the counterfactual. To illustrate this let us think of what the value to UK citizens of having a rollout of superfast broadband would be. The benefits to individuals will depend entirely on what their relationship with the internet already is like: how dependent they are on it, what skills they have and how good their connection currently is. Such an initiative will have no impact on those without a computer, or without the skills and motivation to go online. These relationships are represented in Figure 4, which also sees the journey from ‘excluded’ to ‘included’ more as a continuum than separate states (Warschauer, 2002).
Figure 4: Continuum of experience
Video conferencing, using goverment services
Completely literate and confident. Exploiting all of the benefits required
Making full use of ICTs
Digitally excluded
Shopping online regularly and using internet banking
Downloading social media and watching TV
Basic email and web search
Most communication by email or video conferencing

12Just Economics for BT, June 2014Valuing Digital Inclusion: Calculating the social value to individuals of going online
5. Valuing Digital Inclusion: Our findingsThe valuation approaches previously described could largely be described as top-down, as they deal with country or region level analyses using surveys or other quantitative methods. There are fewer studies that build up the benefit from the individual and aggregate. One reason is that people are cautious about extrapolating for larger populations. However, what the top-down studies miss is the specificity of the experience for different sections of society, which is what this paper is concerned with. Some studies such as the PWC Cost Benefit Analyses (PricewaterhouseCoopers, 2009) combine top-down and bottom-up approaches, but there is a risk of double counting benefits when both approaches are taken simultaneously.
In this section we present the findings from the calculations that have been carried out for this paper. Most are drawn from data that has been gathered for the BT SROI project[3]. We have supplemented this with data from other literature on the benefits of use of ICTs, particularly for the advanced and professional users.
Calculation for a new user
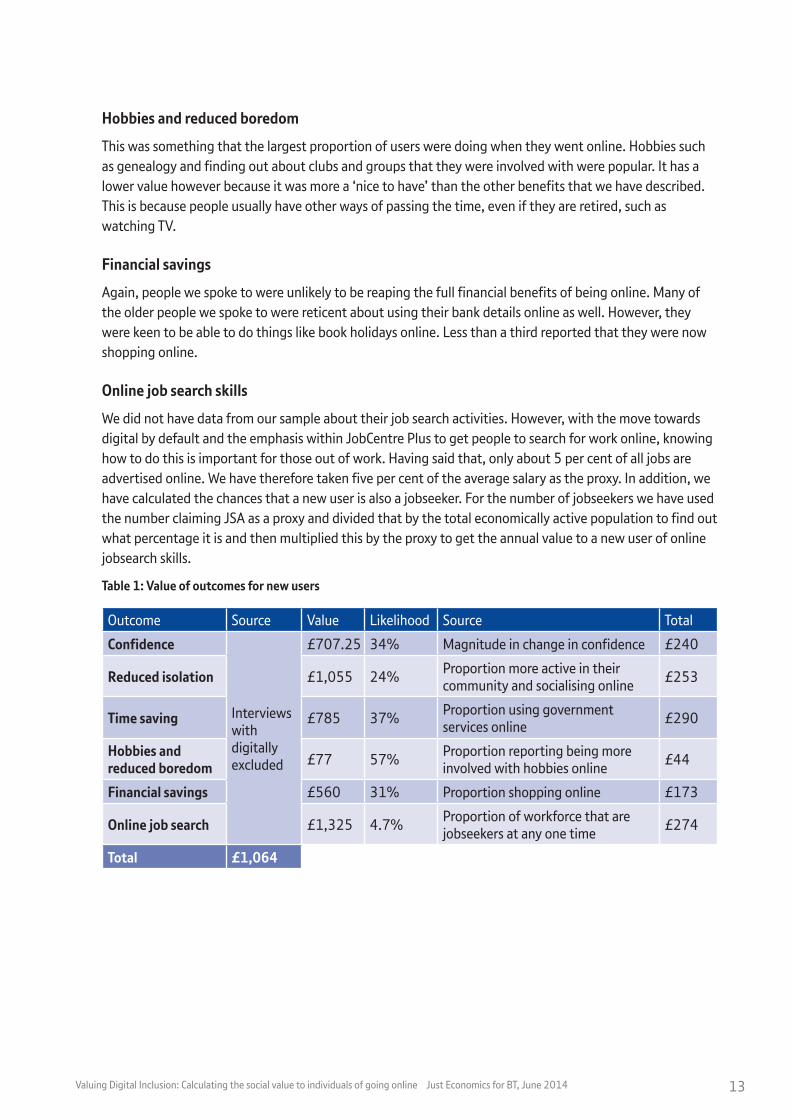
A new user is someone who has previously had low levels of digital literacy and has started to use the internet frequently (at least once a week). Six outcomes have been identified for this group. These have been taken from stakeholder interviews with digitally excluded people – older people and unemployed people – carried out as part of the BT SROI project. Here we describe them, and how each was measured. They are also set out in Table 1.
Confidence
For many it is hard to imagine living in a world without the internet and regular access to ICTs. However, for those that have never taken part in the digital world, it can be isolating and damaging to people’s self-image. People who had taken part in IT skills training later in life described getting a substantial confidence boost as a result. In our sample, there was an average increase in confidence of 34 per cent when scores before and after the course were compared. This was valued using a financial proxy drawn from other research using the life satisfaction method (see Table 2).
Reduced social isolation
As this research was predominantly with older people, social isolation was an important outcome for them. They really appreciated learning how to use internet communication tools, such as video conferencing, sharing photographs, email and social media. The proportion doing so was also drawn from primary research.
Time saving
Most of the people that we spoke to were not sufficiently proficient to really benefit from the time saving aspects of using ICTs. However, over a third of those using the internet were now using government services online.
[3] For a full description of the methodology, please see the SROI report.
13Just Economics for BT, June 2014Valuing Digital Inclusion: Calculating the social value to individuals of going online
Hobbies and reduced boredom
This was something that the largest proportion of users were doing when they went online. Hobbies such as genealogy and finding out about clubs and groups that they were involved with were popular. It has a lower value however because it was more a ‘nice to have’ than the other benefits that we have described. This is because people usually have other ways of passing the time, even if they are retired, such as watching TV.
Financial savings
Again, people we spoke to were unlikely to be reaping the full financial benefits of being online. Many of the older people we spoke to were reticent about using their bank details online as well. However, they were keen to be able to do things like book holidays online. Less than a third reported that they were now shopping online.
Online job search skills
We did not have data from our sample about their job search activities. However, with the move towards digital by default and the emphasis within JobCentre Plus to get people to search for work online, knowing how to do this is important for those out of work. Having said that, only about 5 per cent of all jobs are advertised online. We have therefore taken five per cent of the average salary as the proxy. In addition, we have calculated the chances that a new user is also a jobseeker. For the number of jobseekers we have used the number claiming JSA as a proxy and divided that by the total economically active population to find out what percentage it is and then multiplied this by the proxy to get the annual value to a new user of online jobsearch skills.
Table 1: Value of outcomes for new users
Outcome Source Value Likelihood Source Total
Confidence
Interviews with digitally excluded
£707.25 34% Magnitude in change in confidence £240
Reduced isolation £1,055 24% Proportion more active in their community and socialising online £253
Time saving £785 37% Proportion using government services online £290
Hobbies and reduced boredom £77 57% Proportion reporting being more
involved with hobbies online £44
Financial savings £560 31% Proportion shopping online £173
Online job search £1,325 4.7% Proportion of workforce that are jobseekers at any one time £274
Total £1,064

14Just Economics for BT, June 2014Valuing Digital Inclusion: Calculating the social value to individuals of going online
Table 2: Financial proxy descriptions [4]
Outcome Financial proxy description
Value Proxy type Source
Confidence
The value of feeling more confident in being with family and other people as a result of taking part in an adult learning course
£690 Life satisfaction method
Department for Business Innovation and Skills, Valuing Adult Learning: Comparing Well-being Valuation to Contingent Valuation – http://www.bis.gov.uk/assets/biscore/further-education-skills/docs/v/12-1127-valuing-adult-learning-comparing-wellbeing-to-contingent
Reduced social isolation
The annual amount that single retired households who are mainly dependent on the State Pension spend on ‘recreation and culture’.
£988 Revealed preference
ONS Family Spending survey, 2012. Table 3.9, average income quintile group http://www.ons.gov.uk/ons/rel/family-spending/family-spending/family-spending-2012-edition/index.html
Hobbies
Annual figure based on the value of time spent using the internet for ‘lifestyle reasons’. Calculation based on 2 minutes per day for 67% of users aged 55-64 years old who use the internet on a daily basis, multiplied by an hourly rate of £3.68.
£77.87 Experian, 2013 Digital Marketer Report http://press.experian.com/United-States/Press-Release/experian-marketing-services-reveals-27-percent-of-time-spent-online-is-on-social-networking.aspx Office for National Statistics UK Online – https://docs.google.com/spreadsheet/ccc?key=0At6CC4x_yBnMdHdsRWhkQld3dms5U1pHMzlWUW03a1E&usp=sharing#gid=14
Cost savingsCalculation of average saving from using online shops and services
£560 Market prices
(PriceWaterhouseCoopers LLP 2009)
Convenience
Time saving from using government services and online banking. These two were chosen as two activities with the most data but this proxy could be improved with better analysis of what people use their time online for
£348 Time value method
Based on estimated saving per government transaction of 30 mins (Secure Identify Alliance – http://www.secureidentityalliance.org/files/13-11-19-SIA_eGov_Study.pdf) and 54 transactions per person (Government Digital Service https://gds.blog.gov.uk/2011/05/10/digital-by-default/ ). This is a saving of 27 hours per year. According to One Economy 33 hours are saved each year through online banking in the US – http://www.thebeehive.org/money/save-it/online-banking-and-saving These estimates were multiplied by the minimum wage.
Online job-search skills
5% of all jobseekers get jobs through ads. Most of these will be advertised through ads.
£1,325 Market prices
http://www.quintcareers.com/job-hunting_myths.html
[4] All figures have been uprated to 2013 prices

15Just Economics for BT, June 2014Valuing Digital Inclusion: Calculating the social value to individuals of going online
Calculation for an advanced userAn advanced user has all of the benefits of a new user but to a greater extent. The difference in benefit is smaller because the underlying counterfactual is a new user, who is already getting a large proportion of the benefit. It is difficult to isolate the specific activities that an advanced user is likely to be doing. However, there is a very good chance that they have a broadband connection.
Our first proxy therefore, is the difference in subscription costs of broadband, as a measure of willingness to pay. There have been many attempts to value broadband (for a review of these see Hayes, 2011). We have used two estimates from different studies. The second proxy is the house price premium people are prepared to pay for broadband. See Box 1 for more detail on how we did the calculations.
Box 1The first proxy is an example of revealed preference. The two measures of the amount people are willing to pay for broadband are both taken from research in the US. In separate studies Savage and Waldman (Savage and Waldman, 2005) and Greenstein and McDevitt (Greenstein and McDevitt, 2011) both compare the amount people are willing to pay for broadband relative to dialup. In both instances it is about $20 per month. This works out at an annual premium of £144 ($240).
The second proxy is an example of hedonic pricing. A recent study by Halifax found that house buyers in the UK were prepared to pay more for properties with broadband. Of those who would consider paying more for good broadband, 67% would pay up to 3% more for a property with a good broadband signal and 22% would pay between 4%-10% more. With the average house in the UK now costing £162,932, this would mean nearly a quarter of people would be willing to pay up to £16,293 extra to buy a home with good broadband. On average this works out at a premium of £231 per year, assuming an average mortgage of 25 years[5].
In addition to this, we have taken account of the fact that the advanced user takes greater advantage of the social, convenience, economic and information benefits of the internet. As a result, we have assumed the same set of outcomes but a higher incidence of use. We have taken data from (White and Selwyn, 2013) who have calculated what activities people with internet access use it for. These estimates are higher than our sample of digitally excluded people, which is to be expected. In their study the average usage of the internet for banking, government and purchasing is 40 per cent, 38 per cent and 48 per cent. We have used these percentages where appropriate and used the differences between this sample and ours to estimate the increases in areas where we do not have data. The benefit to an advanced user is £1,381.
Total value to advanced user: £1,756
[5] http://www.ispreview.co.uk/index.php/2013/02/halifax-study-claims-access-to-good-broadband-boosts-uk-house-sales.html
16Just Economics for BT, June 2014Valuing Digital Inclusion: Calculating the social value to individuals of going online
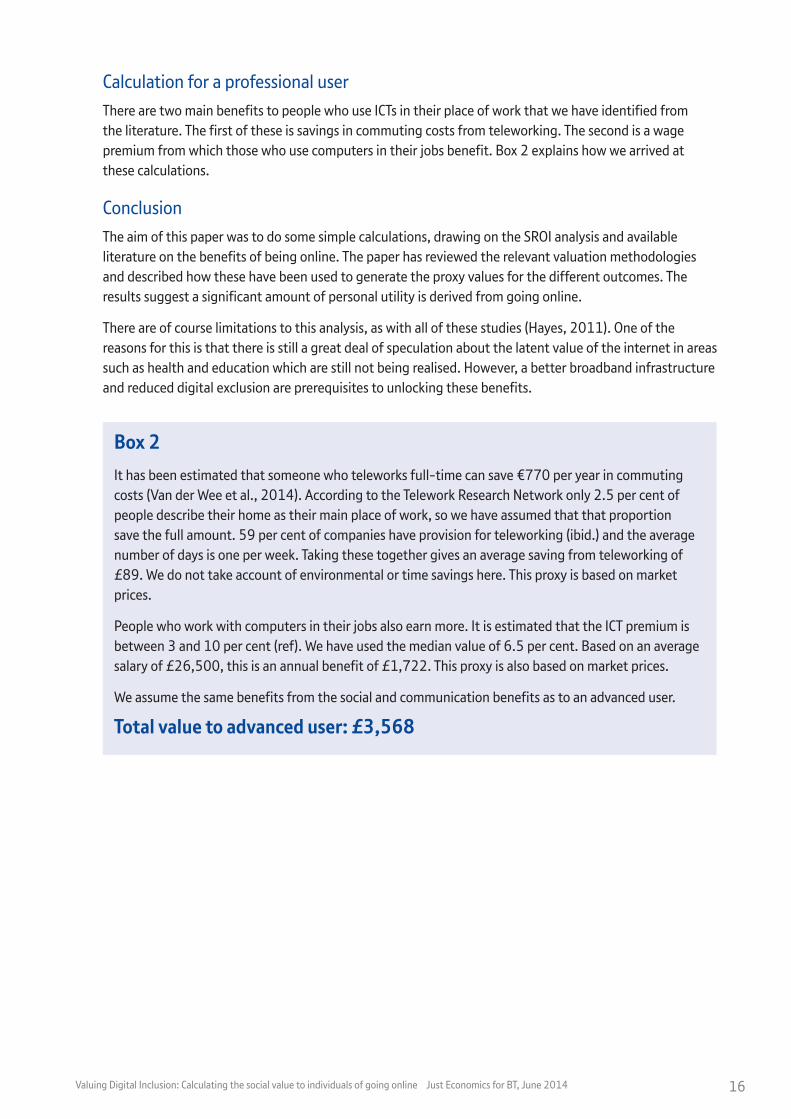
Calculation for a professional userThere are two main benefits to people who use ICTs in their place of work that we have identified from the literature. The first of these is savings in commuting costs from teleworking. The second is a wage premium from which those who use computers in their jobs benefit. Box 2 explains how we arrived at these calculations.
Conclusion The aim of this paper was to do some simple calculations, drawing on the SROI analysis and available literature on the benefits of being online. The paper has reviewed the relevant valuation methodologies and described how these have been used to generate the proxy values for the different outcomes. The results suggest a significant amount of personal utility is derived from going online.
There are of course limitations to this analysis, as with all of these studies (Hayes, 2011). One of the reasons for this is that there is still a great deal of speculation about the latent value of the internet in areas such as health and education which are still not being realised. However, a better broadband infrastructure and reduced digital exclusion are prerequisites to unlocking these benefits.
Box 2It has been estimated that someone who teleworks full-time can save €770 per year in commuting costs (Van der Wee et al., 2014). According to the Telework Research Network only 2.5 per cent of people describe their home as their main place of work, so we have assumed that that proportion save the full amount. 59 per cent of companies have provision for teleworking (ibid.) and the average number of days is one per week. Taking these together gives an average saving from teleworking of £89. We do not take account of environmental or time savings here. This proxy is based on market prices.
People who work with computers in their jobs also earn more. It is estimated that the ICT premium is between 3 and 10 per cent (ref). We have used the median value of 6.5 per cent. Based on an average salary of £26,500, this is an annual benefit of £1,722. This proxy is also based on market prices.
We assume the same benefits from the social and communication benefits as to an advanced user.
Total value to advanced user: £3,568

17Just Economics for BT, June 2014Valuing Digital Inclusion: Calculating the social value to individuals of going online
ReferencesBateman, I.J., Carson, R.T., Day, B., Hanemann, M., Hanley, N., Hett, T., Jones-Lee, M., Loomes, G., Mourato, S., Özdemiroglu, E., 2002. Economic valuation with stated preference techniques: a manual. Economic valuation with stated preference techniques: a manual.
Chyi, H.I., 2005. Willingness to pay for online news: An empirical study on the viability of the subscription model. Journal of Media Economics 18, 131–142.
Crandall, R.W., Lehr, W., Litan, R.E., 2007. The effects of broadband deployment on output and employment: a cross-sectional analysis of US data. Brookings Institution.
Cremer, J., 2000. Network externalities and universal service obligation in the internet. European Economic Review 44, 1021–1031.
Dou, W., 2004. Will internet users pay for online content. Journal of Advertising Research 44, 349–359.
Dutton, W., Helsper, E., 2007. Internet in Britain: 2007.
Frey, B.S., Luechinger, S., Stutzer, A., 2004. Valuing public goods: The life satisfaction approach. CESifo Working Paper.
Goolsbee, A., 2002. Subsidies, the value of broadband, and the importance of fixed costs. Broadband: Should we regulate high-speed internet access 278–294.
Greenstein, S., McDevitt, R.C., 2011. The broadband bonus: Estimating broadband Internet’s economic value. Telecommunications Policy 35, 617–632.
Grove, A.P.N., 2010. Closing gaps in the information society: providing high-speed broadband access to rural areas.
Hayes, R., 2011. Valuing broadband benefits: A selective report on issues and options. Available at SSRN 1856378.
Koutroumpis, P., 2009. The economic impact of broadband on growth: A simultaneous approach. Telecommunications Policy 33, 471–485.
Pricewaterhousecooper, 2004. Final Report: A Cost benefit Analysis for Broadband connectivity in Europe [WWW Document]. URL http://telecom.esa.int/telecom/www/object/index.cfm?fobjectid=14864 (accessed 3.21.14).
PricewaterhouseCoopers, L.L.P., 2009. Champion for Digital Inclusion: The Economic Case for Digital Inclusion. London: PricewaterhouseCoopers LLP. Available from: http://www. parliamentandinternet. org. uk/uploads/Final_report. pdf (December 2013).
Rosston, G., Savage, S., Waldman, D., 2011. Household demand for broadband internet service. Communications of the ACM 54, 29–31.
Savage, S.J., Waldman, D., 2005. “Broadband Internet access, awareness, and use: Analysis of United States household data”. Telecommun. Policy 29, 615–633.
SQW Consulting, 2013. The UK Broadband Impact Study.
Theysohn, S., 2006. Willingness to pay for soccer reports on the internet. International Journal of Sports Marketing & Sponsorship 8.
Van der Wee, M., Verbrugge, S., Sadowski, B., Driesse, M., Pickavet, M., 2014. Identifying and quantifying the indirect benefits of broadband networks for e-government and e-business: A bottom-up approach. Telecommunications Policy.
Warschauer, M., 2002. Reconceptualizing the digital divide. First Monday 7.
White, P., Selwyn, N., 2013. Moving on-Line? an Analysis of Patterns of Adult Internet Use in the Uk, 2002–2010. Information, Communication & Society 16, 1–27. doi:10.1080/1369118X.2011.611816

Just Economics for BT, June 2014Valuing Digital Inclusion: Calculating the social value to individuals of going online
Offices worldwide
The telecommunications services described in this publication are subject to availability and may be modified from time to time. Services and equipment are provided subject to British Telecommunications plc’s respective standard conditions of contract. Nothing in this publication forms any part of any contract.
© British Telecommunications plc 2014Registered office: 81 Newgate Street, London EC1A 7AJRegistered in England No: 1800000