Embed Size (px)
Citation preview
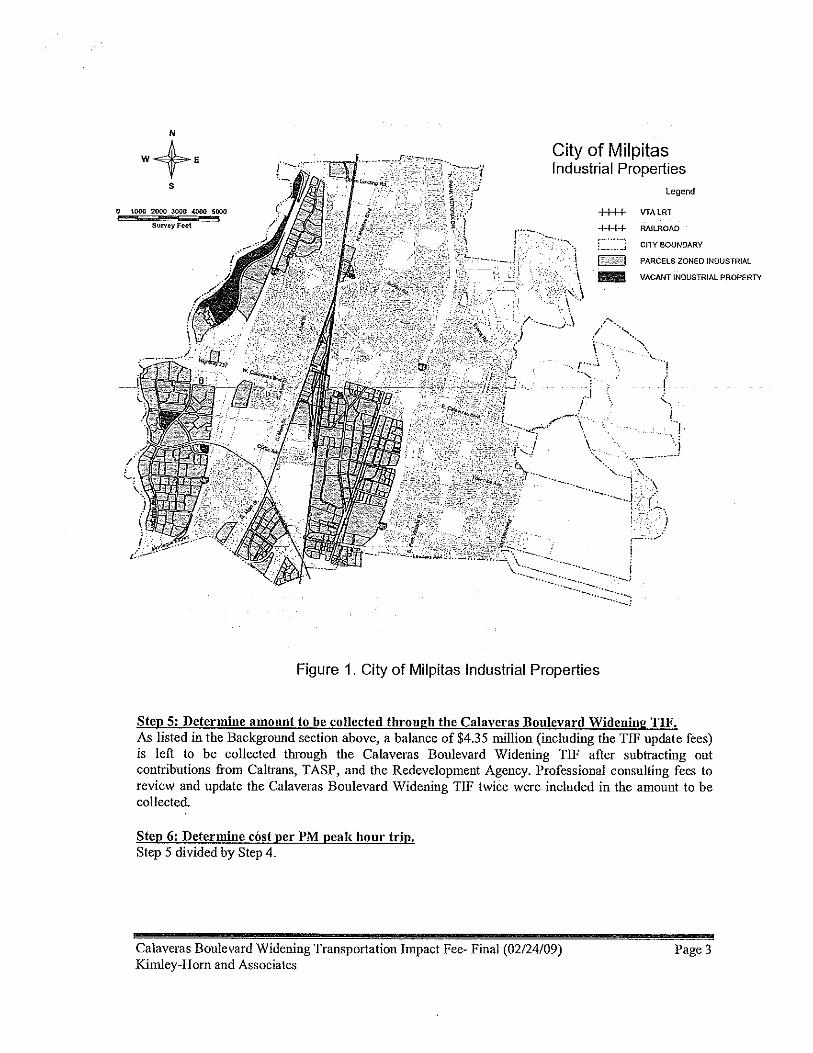
January 28, 2021 Mr. Steve Chan T.E., E.E. City of Milpitas, Engineering Division 455 East Calaveras Boulevard Milpitas, CA 95035 Subject: Update of the Calaveras Widening Transportation Impact Fee Dear Mr. Chan: Per your request, Hexagon Transportation Consultants, Inc. has completed this update of the Calaveras Boulevard widening transportation impact fee (TIF) program. This report is intended to supplement the original TIF document entitled City of Milpitas Calaveras Boulevard Widening Project Transportation Impact Fee, February 24, 2009 (hereafter referred to as the 2009 TIF study). Background The Calaveras Boulevard widening transportation impact fee is intended to cover a portion of the costs for the infrastructure required to widen of Calaveras Boulevard from 4 lanes to 6 lanes between Town Center Drive and Abel Street. It also includes reconstruction of two bridge structures over North Main Street and the Union Pacific railroad tracks. The existing TIF fee program was established in 2009 and resulted in City Resolution 7894. Periodic updates of TIF programs are required to (1) ensure an accurate measurement of project costs, (2) update underlying land use and trip generation assumptions that may have changed, and (3) re-establish the nexus between the fee program and its beneficiaries. This update retains the original methodology outlined in the 2009 TIF study (see also attached 2009 TIF study for additional background). Project Costs and Funding Sources The original cost of the Calaveras Boulevard widening project was estimated in the 2009 TIF study as $55,000,000. City of Milpitas Resolution 7894 stipulates that the cost of the project shall be adjusted in accordance with the Engineering News Record (ENR) Construction Cost Index for the San Francisco Bay Area. Applying this methodology, the cost of the project, in constant 2021 dollars, was estimated to be $74,300,000. In addition, the 2009 TIF fee includes provisions for periodic updates to the fee program (such as this one) to verify project assumptions and costs. The cost of two updates over the next 10 years is estimated to be $100,000. When this is considered, the total cost of the project, in constant 2021 dollars, is estimated to be $74,400,000. The 2009 TIF program identified several funding sources for the project. The City is implementing the Calaveras Widening TIF to supplement the State Transportation Improvement Program (STIP), which is estimated to fund 80% of the total improvement cost, or $59,520,000. In addition, the City redevelopment agency is contributing $1,500,000 from the Carlo Street ramp conversion project, and the City is collecting $5,200,000 from development within the Milpitas Transit Area
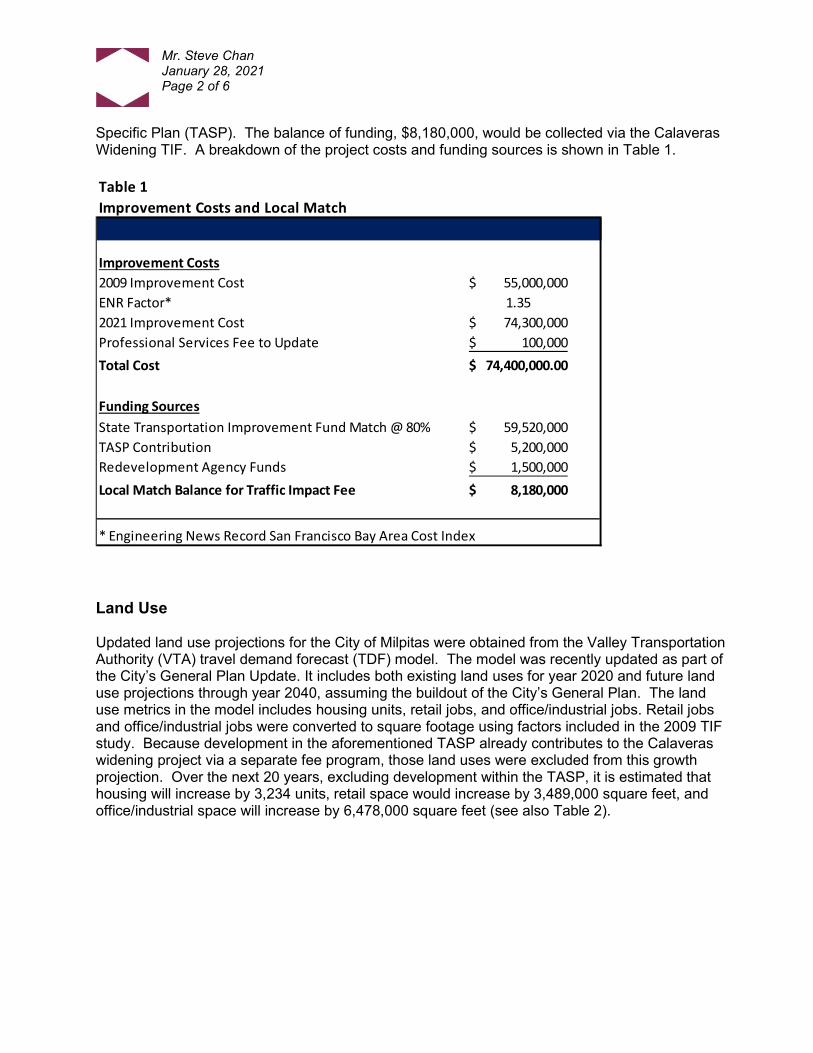
Mr. Steve Chan January 28, 2021 Page 2 of 6
Specific Plan (TASP). The balance of funding, $8,180,000, would be collected via the Calaveras Widening TIF. A breakdown of the project costs and funding sources is shown in Table 1.
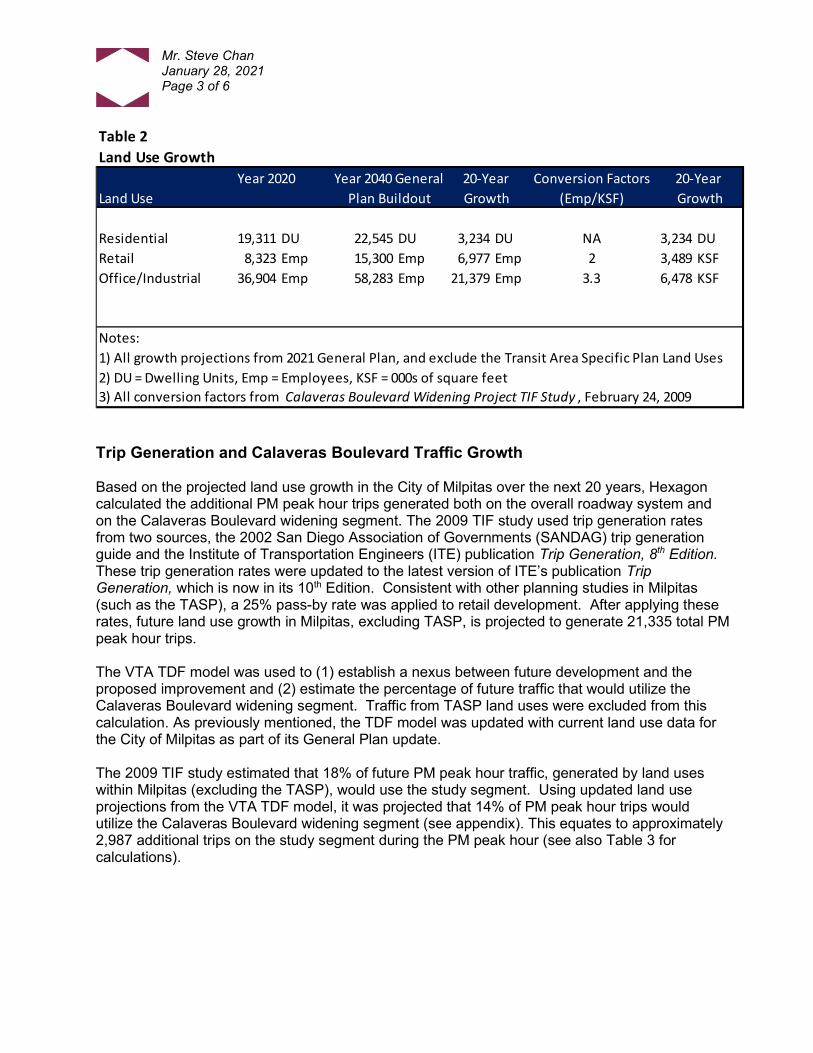
Land Use Updated land use projections for the City of Milpitas were obtained from the Valley Transportation Authority (VTA) travel demand forecast (TDF) model. The model was recently updated as part of the City’s General Plan Update. It includes both existing land uses for year 2020 and future land use projections through year 2040, assuming the buildout of the City’s General Plan. The land use metrics in the model includes housing units, retail jobs, and office/industrial jobs. Retail jobs and office/industrial jobs were converted to square footage using factors included in the 2009 TIF study. Because development in the aforementioned TASP already contributes to the Calaveras widening project via a separate fee program, those land uses were excluded from this growth projection. Over the next 20 years, excluding development within the TASP, it is estimated that housing will increase by 3,234 units, retail space would increase by 3,489,000 square feet, and office/industrial space will increase by 6,478,000 square feet (see also Table 2).
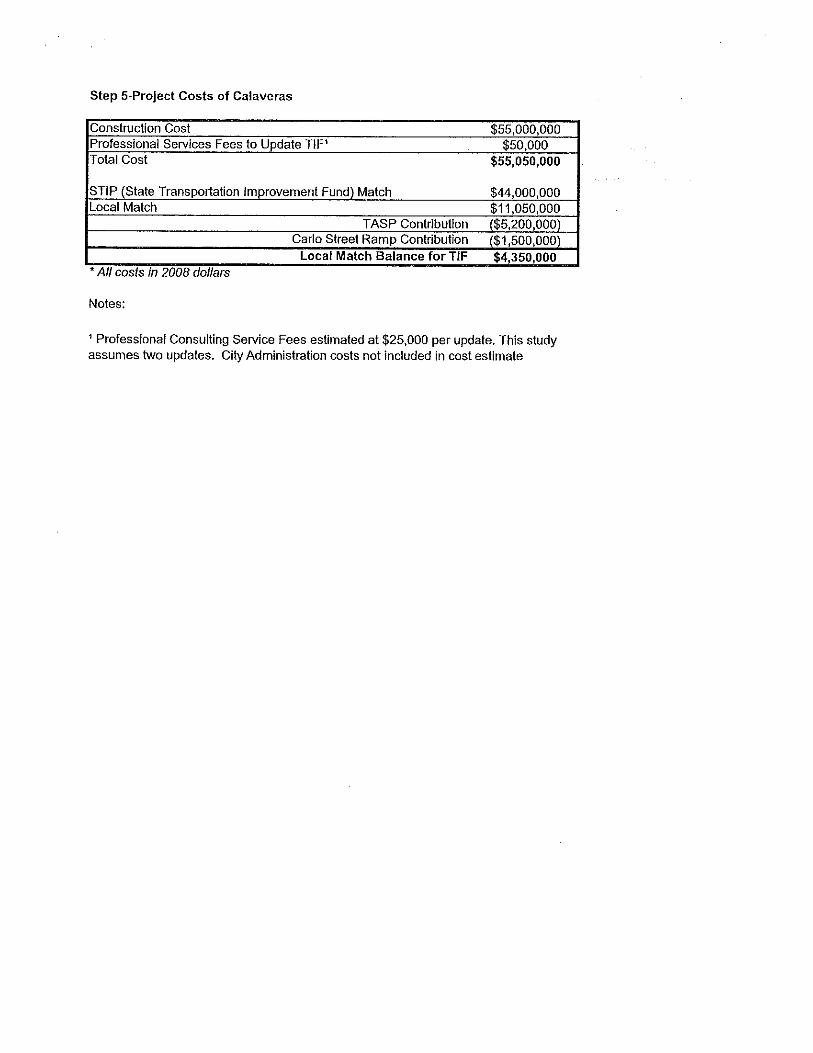
Table 1Improvement Costs and Local Match
Improvement Costs2009 Improvement Cost 55,000,000$ ENR Factor* 1.352021 Improvement Cost 74,300,000$ Professional Services Fee to Update 100,000$
Total Cost 74,400,000.00$
Funding SourcesState Transportation Improvement Fund Match @ 80% 59,520,000$ TASP Contribution 5,200,000$ Redevelopment Agency Funds 1,500,000$
Local Match Balance for Traffic Impact Fee 8,180,000$
* Engineering News Record San Francisco Bay Area Cost Index
Mr. Steve Chan January 28, 2021 Page 3 of 6
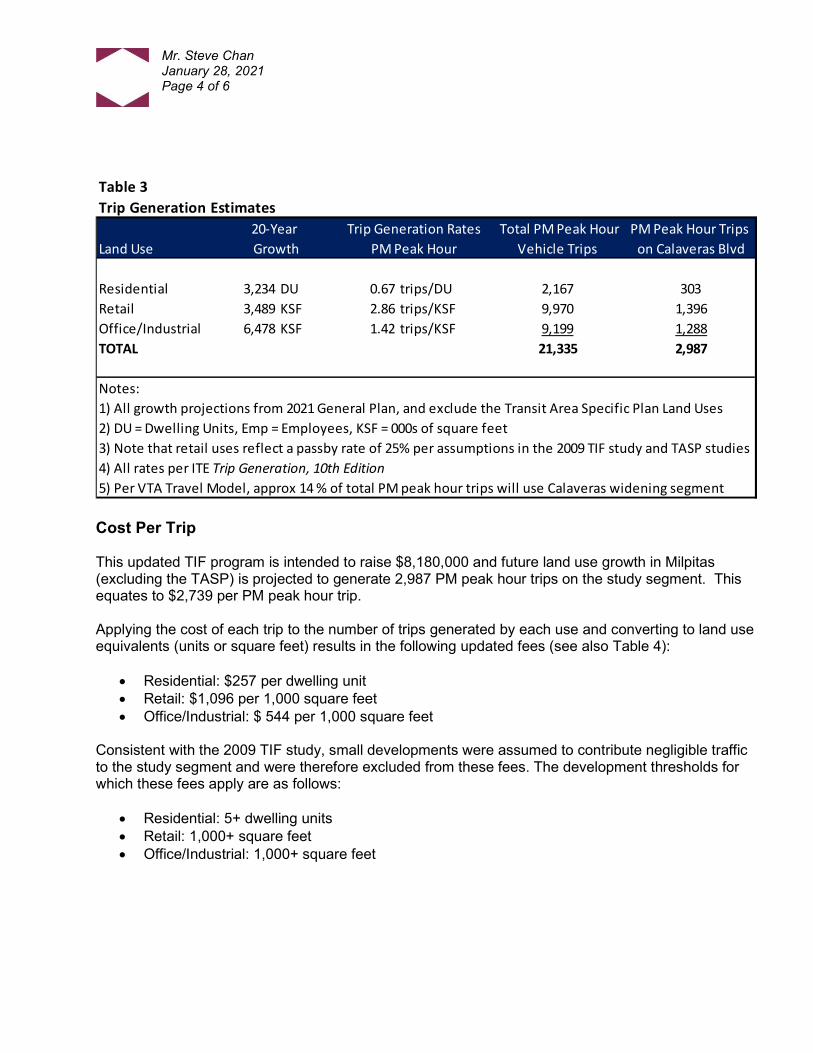
Trip Generation and Calaveras Boulevard Traffic Growth Based on the projected land use growth in the City of Milpitas over the next 20 years, Hexagon calculated the additional PM peak hour trips generated both on the overall roadway system and on the Calaveras Boulevard widening segment. The 2009 TIF study used trip generation rates from two sources, the 2002 San Diego Association of Governments (SANDAG) trip generation guide and the Institute of Transportation Engineers (ITE) publication Trip Generation, 8th Edition. These trip generation rates were updated to the latest version of ITE’s publication Trip Generation, which is now in its 10th Edition. Consistent with other planning studies in Milpitas (such as the TASP), a 25% pass-by rate was applied to retail development. After applying these rates, future land use growth in Milpitas, excluding TASP, is projected to generate 21,335 total PM peak hour trips. The VTA TDF model was used to (1) establish a nexus between future development and the proposed improvement and (2) estimate the percentage of future traffic that would utilize the Calaveras Boulevard widening segment. Traffic from TASP land uses were excluded from this calculation. As previously mentioned, the TDF model was updated with current land use data for the City of Milpitas as part of its General Plan update. The 2009 TIF study estimated that 18% of future PM peak hour traffic, generated by land uses within Milpitas (excluding the TASP), would use the study segment. Using updated land use projections from the VTA TDF model, it was projected that 14% of PM peak hour trips would utilize the Calaveras Boulevard widening segment (see appendix). This equates to approximately 2,987 additional trips on the study segment during the PM peak hour (see also Table 3 for calculations).
Table 2Land Use Growth
Conversion FactorsLand Use (Emp/KSF)
Residential 19,311 DU 22,545 DU 3,234 DU NA 3,234 DURetail 8,323 Emp 15,300 Emp 6,977 Emp 2 3,489 KSFOffice/Industrial 36,904 Emp 58,283 Emp 21,379 Emp 3.3 6,478 KSF
Notes:1) All growth projections from 2021 General Plan, and exclude the Transit Area Specific Plan Land Uses2) DU = Dwelling Units, Emp = Employees, KSF = 000s of square feet3) All conversion factors from Calaveras Boulevard Widening Project TIF Study , February 24, 2009
Year 2020 Year 2040 General 20-Year Growth
20-Year GrowthPlan Buildout
Mr. Steve Chan January 28, 2021 Page 4 of 6
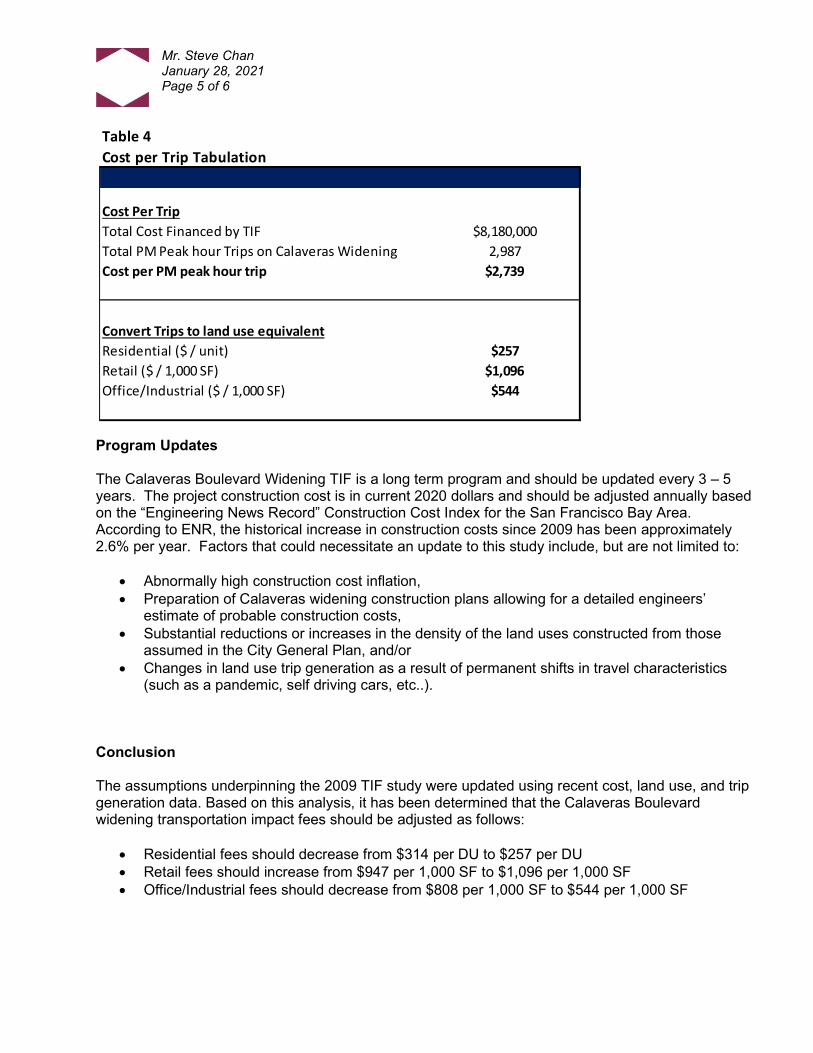
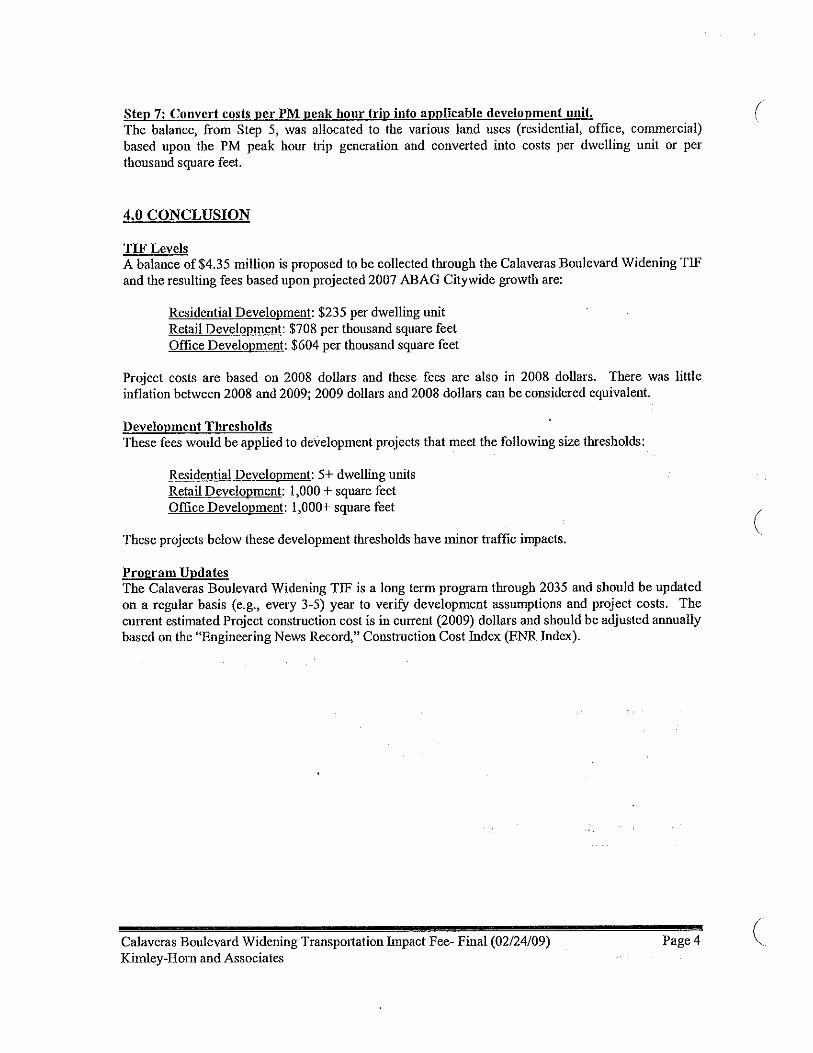
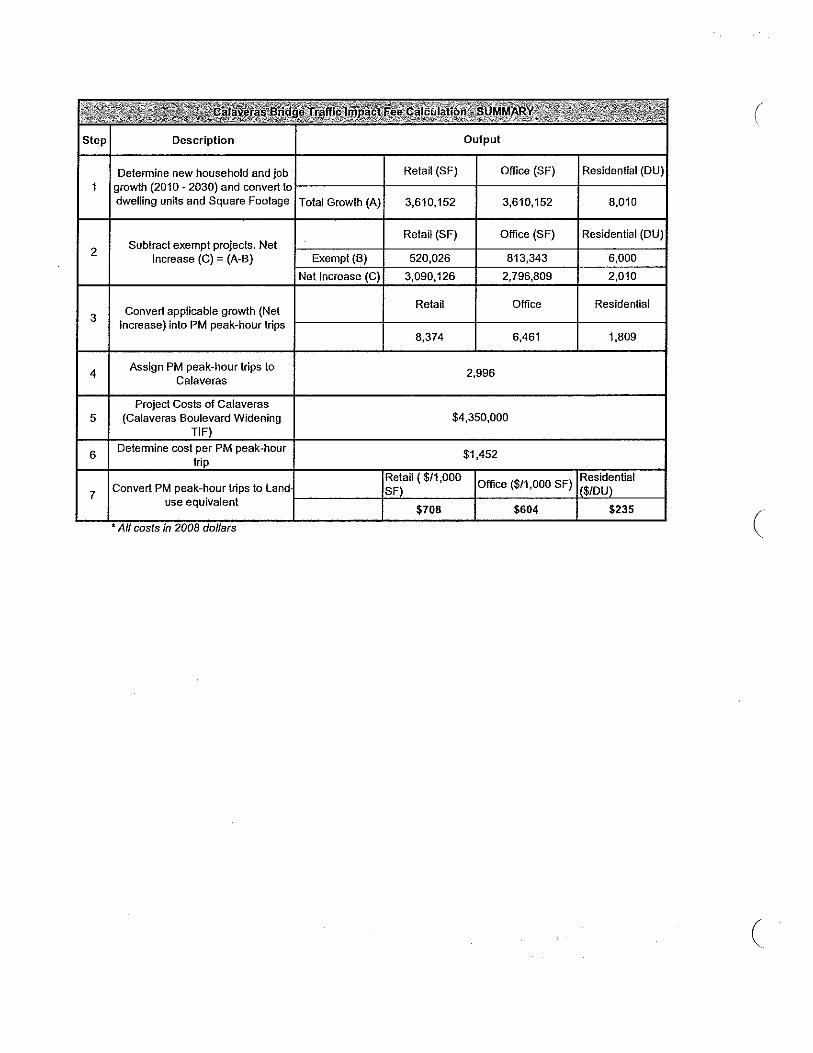
Cost Per Trip This updated TIF program is intended to raise $8,180,000 and future land use growth in Milpitas (excluding the TASP) is projected to generate 2,987 PM peak hour trips on the study segment. This equates to $2,739 per PM peak hour trip. Applying the cost of each trip to the number of trips generated by each use and converting to land use equivalents (units or square feet) results in the following updated fees (see also Table 4):
Residential: $257 per dwelling unit Retail: $1,096 per 1,000 square feet Office/Industrial: $ 544 per 1,000 square feet
Consistent with the 2009 TIF study, small developments were assumed to contribute negligible traffic to the study segment and were therefore excluded from these fees. The development thresholds for which these fees apply are as follows:
Residential: 5+ dwelling units Retail: 1,000+ square feet Office/Industrial: 1,000+ square feet
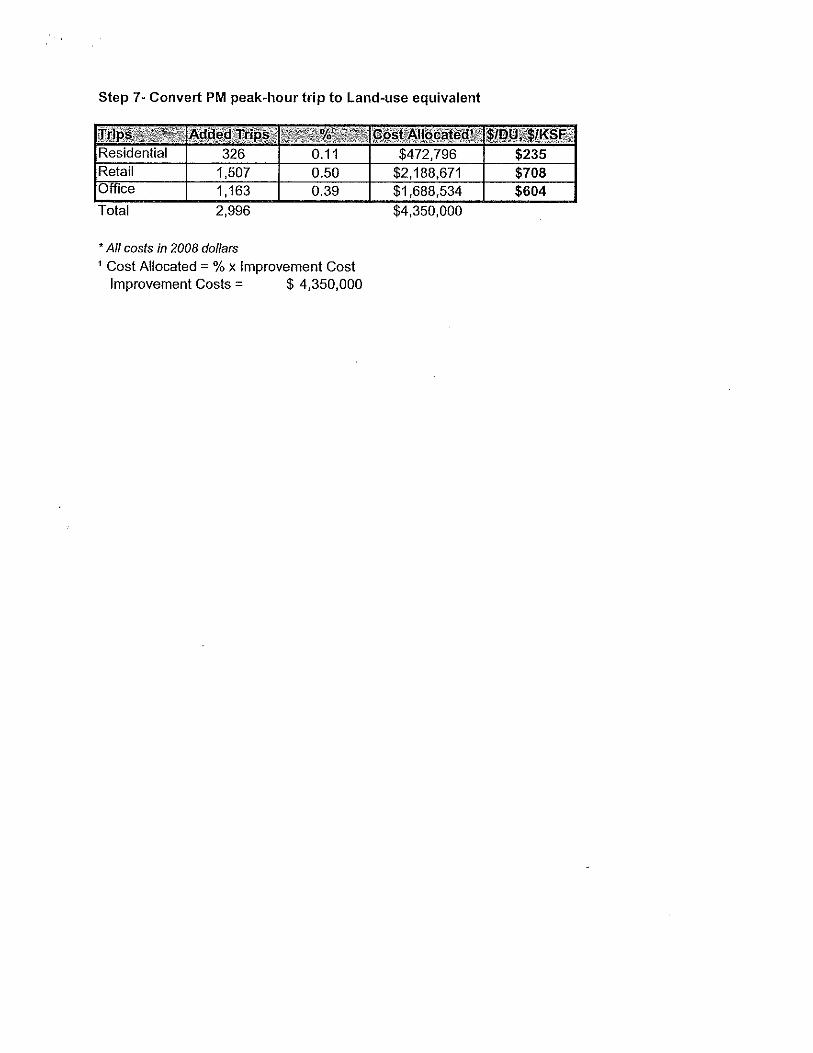
Table 3Trip Generation Estimates
Total PM Peak Hour PM Peak Hour Trips Land Use Vehicle Trips on Calaveras Blvd
Residential 3,234 DU 0.67 trips/DU 2,167 303Retail 3,489 KSF 2.86 trips/KSF 9,970 1,396Office/Industrial 6,478 KSF 1.42 trips/KSF 9,199 1,288TOTAL 21,335 2,987
Notes:1) All growth projections from 2021 General Plan, and exclude the Transit Area Specific Plan Land Uses2) DU = Dwelling Units, Emp = Employees, KSF = 000s of square feet3) Note that retail uses reflect a passby rate of 25% per assumptions in the 2009 TIF study and TASP studies4) All rates per ITE Trip Generation, 10th Edition5) Per VTA Travel Model, approx 14 % of total PM peak hour trips will use Calaveras widening segment
Growth PM Peak Hour20-Year Trip Generation Rates
Mr. Steve Chan January 28, 2021 Page 5 of 6
Program Updates The Calaveras Boulevard Widening TIF is a long term program and should be updated every 3 – 5 years. The project construction cost is in current 2020 dollars and should be adjusted annually based on the “Engineering News Record” Construction Cost Index for the San Francisco Bay Area. According to ENR, the historical increase in construction costs since 2009 has been approximately 2.6% per year. Factors that could necessitate an update to this study include, but are not limited to:
Abnormally high construction cost inflation, Preparation of Calaveras widening construction plans allowing for a detailed engineers’
estimate of probable construction costs, Substantial reductions or increases in the density of the land uses constructed from those
assumed in the City General Plan, and/or Changes in land use trip generation as a result of permanent shifts in travel characteristics
(such as a pandemic, self driving cars, etc..). Conclusion The assumptions underpinning the 2009 TIF study were updated using recent cost, land use, and trip generation data. Based on this analysis, it has been determined that the Calaveras Boulevard widening transportation impact fees should be adjusted as follows:
Residential fees should decrease from $314 per DU to $257 per DU Retail fees should increase from $947 per 1,000 SF to $1,096 per 1,000 SF Office/Industrial fees should decrease from $808 per 1,000 SF to $544 per 1,000 SF
Table 4Cost per Trip Tabulation
Cost Per TripTotal Cost Financed by TIF $8,180,000Total PM Peak hour Trips on Calaveras Widening 2,987Cost per PM peak hour trip $2,739
Convert Trips to land use equivalentResidential ($ / unit) $257Retail ($ / 1,000 SF) $1,096Office/Industrial ($ / 1,000 SF) $544
Mr. Steve Chan January 28, 2021 Page 6 of 6
Thank you for the opportunity to serve the City of Milpitas on this project. If you have any questions, please do not hesitate to call. Sincerely, HEXAGON TRANSPORTATION CONSULTANTS, INC.
Brett Walinski T.E. Vice President and Principal Associate Attachments: Calaveras Boulevard Widening Project Transportation Impact Fee, February 24, 2009, Milpitas TDF Model Output Summary
VTA TDF Model Ouput
TASP = Transit Area Specific PlanMILP = Milpitas, EXCLUDING TASPREGION= Rest of Bay Area
Project:Calaveras Roadway Segments between Town Center Drive and Abel Street Trips on the Project: PM peak hour trips starting and/or ending in Milpitas using any portion of the Project
2020 PM Peak Hour Trips 2040 PR GP PM Peak Hour TripsFrom/To TASP MILP REGION TOTAL From/To TASP MILP REGION TOTALTASP 163 440 1,479 2,082 TASP 766 1,284 4,386 6,437MILP 521 4,620 12,069 17,210 MILP 1,298 5,995 17,859 25,153REGION 1,660 10,519 1,884,215 1,896,394 REGION 3,964 13,337 2,178,964 2,196,264TOTAL 2,344 15,579 1,897,763 1,915,686 TOTAL 6,028 20,616 2,201,209 2,227,854
Start 17,210 Start 25,153End 15,579 End 20,616Total 32,789 Total 45,769
2020 PM Peak Hour Trips on the Project 2040 PR GP PM Peak Hour Trips on the ProjectFrom/To TASP MILP REGION TOTAL From/To TASP MILP REGION TOTALTASP 0 11 1 12 TASP 0 131 137 269MILP 13 550 1,265 1,828 MILP 128 964 1,680 2,772REGION 3 1,262 1,754 3,019 REGION 186 1,623 935 2,744TOTAL 16 1,823 3,020 4,859 TOTAL 315 2,719 2,751 5,785
Start 1,828 Start 2,772End 1,823 End 2,719Total 3,651 Total 5,491
Increase in PM Peak Hour Trips (2040 - 2020) 12,980Increase in PM Peak Hour Trips on the Project (2040 - 2020) 1,840Percent Increase attributable to growth 14%