Embed Size (px)
Citation preview
CAE Inc. For the year ending March 31, 2004
TSX/S&P Industry Class = 20 2004 Annual Revenue = Canadian $1,093.2 million 2004 Year End Assets = Canadian $2,293.3 million Web Page (October, 2005) = www.cae.com 2005 Financial Reporting In Canada Survey Company Number 28
CAE ANNUAL REPORT 2004 MANAGEMENT AND AUDITORS’ REPORTS 29
MANAGEMENT’S STATEMENT OF RESPONSIBILITYThe consolidated financial statements contained in this Annual Report are the responsibility of management, and havebeen prepared in accordance with Canadian generally accepted accounting principles and include when necessarysome estimates based on management best judgment. Financial information presented elsewhere in the Annual Reportis under management responsibilities and consistent with that contained in the accompanying financial statements.
CAE’s policy is to maintain internal accounting and administrative systems, combined with disclosure control ofhigh quality consistent with reasonable cost. Such systems are designed to provide reasonable assurance as to thereliability of financial information and the safeguarding of assets.
The Board of Directors is responsible for ensuring that Management fulfils its responsibilities for financial report-ing and is ultimately responsible for reviewing and approving the consolidated financial statements through its AuditCommittee, consisting solely of outside directors, which reviews the consolidated financial statements and reportsthereon to the Board. The Committee meets periodically with the external auditors, internal auditors and managementto review their respective activities and to satisfy itself that each party is properly discharging its responsibilities. Bothexternal auditors and internal auditors have free access to the Committee, with or without management, to discussthe scope of their audits, the adequacy of the system of internal controls and financial reporting.
The financial statements have been reviewed by the Audit Committee and, together with the other required infor-mation in the Annual Report, approved by the Board of Directors. In addition, the consolidated financial statementshave been audited by PricewaterhouseCoopers LLP, whose report is provided below.
D.H. Burney P.G. RenaudPresident and Chief Executive Officer Executive Vice President,
Chief Financial Officer and SecretaryMontreal, CanadaMay 11, 2004
MANAGEMENT AND AUDITORS’ REPORTS
AUDITORS’ REPORT To the Shareholders of CAE Inc.We have audited the Consolidated Balance Sheets of CAE Inc. as at March 31, 2004 and 2003, and the consolidatedstatements of earnings, retained earnings and cash flows for each of the years in the three-year period endedMarch 31, 2004. These financial statements are the responsibility of the Company’s management. Our responsibility isto express an opinion on these financial statements based on our audits.
We conducted our audits in accordance with Canadian generally accepted auditing standards. Those standardsrequire that we plan and perform an audit to obtain reasonable assurance whether the financial statements are free ofmaterial misstatement. An audit includes examining, on a test basis, evidence supporting the amounts and disclo-sures in the financial statements. An audit also includes assessing the accounting principles used and significantestimates made by management, as well as evaluating the overall financial statement presentation.
In our opinion, these consolidated financial statements present fairly, in all material respects, the financial positionof the Company as at March 31, 2004 and 2003, and the results of its operations and cash flows for each of the years inthe three-year period ended March 31, 2004 in accordance with Canadian generally accepted accounting principles.
PricewaterhouseCoopers LLPChartered Accountants Montreal, CanadaMay 11, 2004
Comments by Auditors for US Readers on Canada-US Reporting DifferenceIn the United States, reporting standards for auditors require the addition of an explanatory paragraph (following theopinion paragraph) when there is a change in accounting principles that has a material effect on the comparability ofthe company’s financial statements, such as the changes described in note 1 to the consolidated financial statements.Our report to the shareholders dated May 11, 2004 is expressed in accordance with Canadian reporting standardswhich do not require a reference to such a change in accounting principles in the auditors’ report when the change isproperly accounted for and adequately disclosed in the financial statements.
PricewaterhouseCoopers LLPChartered AccountantsMontreal, CanadaMay 11, 2004
4011 CAE AR E 29-64 v.2+PWC 6/22/04 3:02 PM Page 29
30 CAE ANNUAL REPORT 2004CONSOLIDATED FINANCIAL STATEMENTS
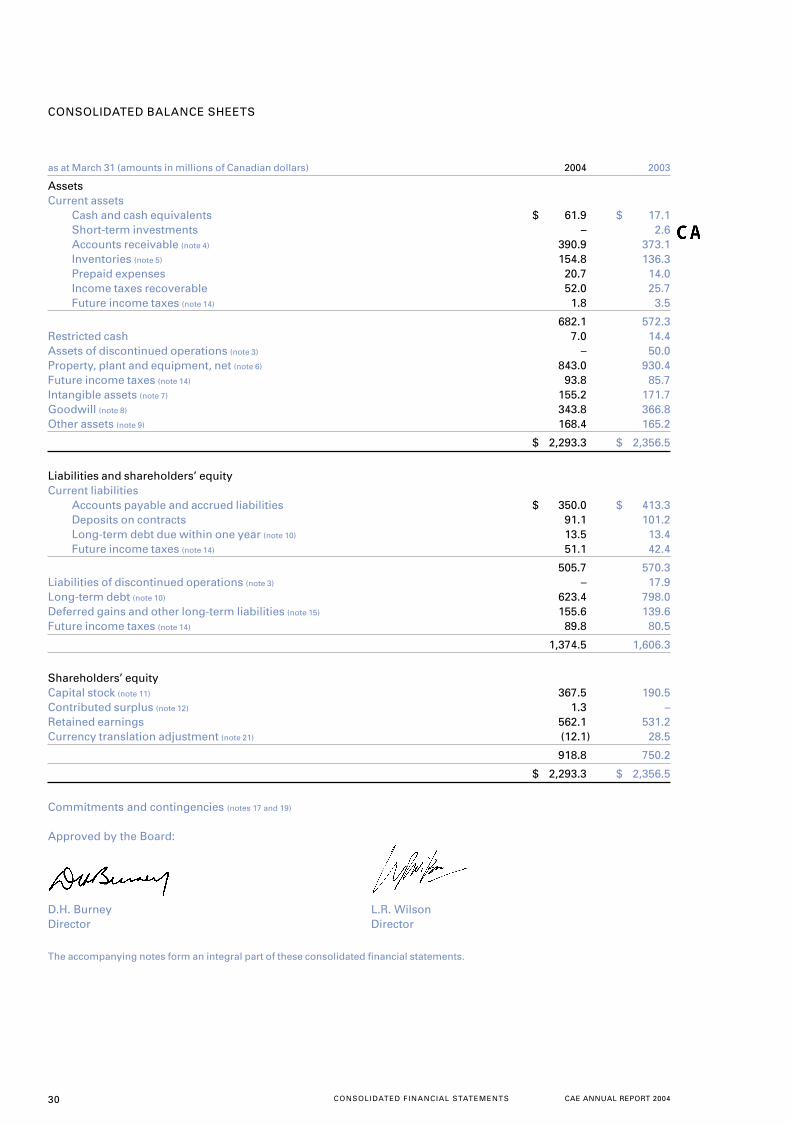
as at March 31 (amounts in millions of Canadian dollars) 2004 2003
Assets Current assets
Cash and cash equivalents $ 61.9 $ 17.1Short-term investments – 2.6 Accounts receivable (note 4) 390.9 373.1Inventories (note 5) 154.8 136.3Prepaid expenses 20.7 14.0Income taxes recoverable 52.0 25.7Future income taxes (note 14) 1.8 3.5
682.1 572.3Restricted cash 7.0 14.4Assets of discontinued operations (note 3) – 50.0 Property, plant and equipment, net (note 6) 843.0 930.4Future income taxes (note 14) 93.8 85.7 Intangible assets (note 7) 155.2 171.7Goodwill (note 8) 343.8 366.8 Other assets (note 9) 168.4 165.2
$ 2,293.3 $ 2,356.5
Liabilities and shareholders’ equityCurrent liabilities
Accounts payable and accrued liabilities $ 350.0 $ 413.3Deposits on contracts 91.1 101.2Long-term debt due within one year (note 10) 13.5 13.4Future income taxes (note 14) 51.1 42.4
505.7 570.3 Liabilities of discontinued operations (note 3) – 17.9Long-term debt (note 10) 623.4 798.0Deferred gains and other long-term liabilities (note 15) 155.6 139.6Future income taxes (note 14) 89.8 80.5
1,374.5 1,606.3
Shareholders’ equity Capital stock (note 11) 367.5 190.5Contributed surplus (note 12) 1.3 –Retained earnings 562.1 531.2Currency translation adjustment (note 21) (12.1) 28.5
918.8 750.2
$ 2,293.3 $ 2,356.5
Commitments and contingencies (notes 17 and 19)
Approved by the Board:
D.H. Burney L.R. WilsonDirector Director
The accompanying notes form an integral part of these consolidated financial statements.
CONSOLIDATED BALANCE SHEETS
CAE ANNUAL REPORT 2004 CONSOLIDATED FINANCIAL STATEMENTS 31
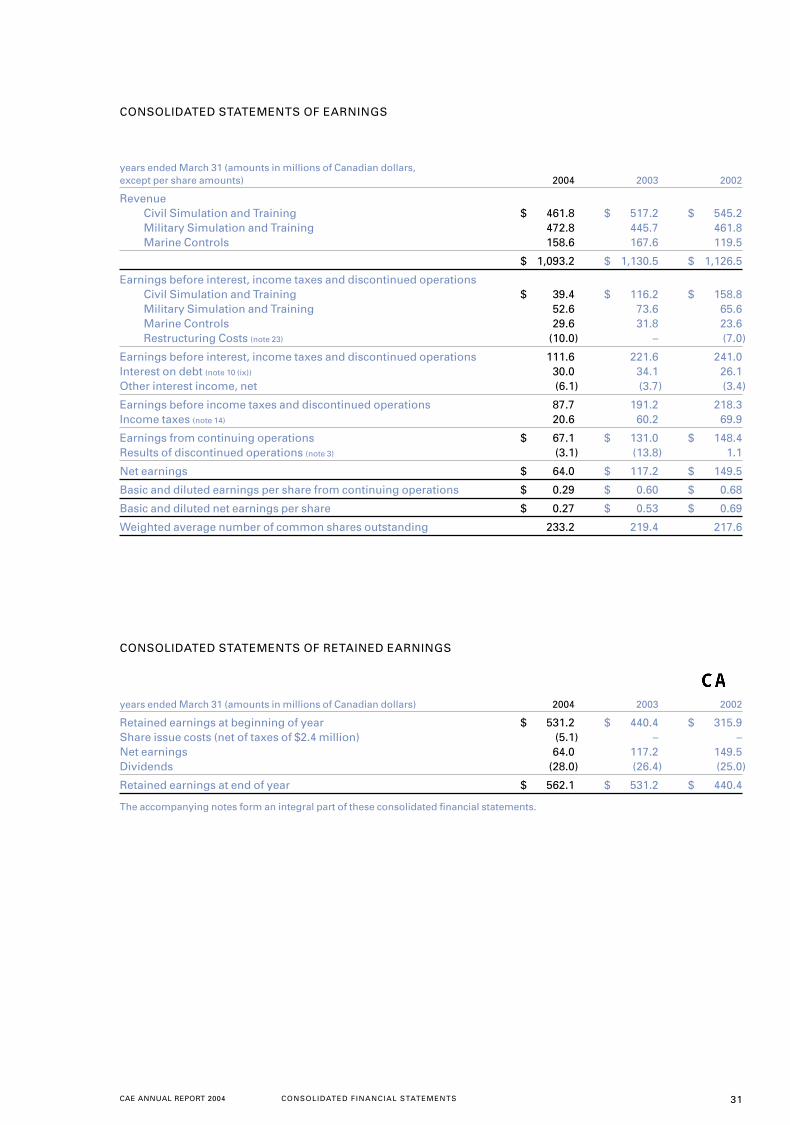
years ended March 31 (amounts in millions of Canadian dollars, except per share amounts) 2004 2003 2002
RevenueCivil Simulation and Training $ 461.8 $ 517.2 $ 545.2Military Simulation and Training 472.8 445.7 461.8Marine Controls 158.6 167.6 119.5
$ 1,093.2 $ 1,130.5 $ 1,126.5
Earnings before interest, income taxes and discontinued operationsCivil Simulation and Training $ 39.4 $ 116.2 $ 158.8Military Simulation and Training 52.6 73.6 65.6Marine Controls 29.6 31.8 23.6Restructuring Costs (note 23) (10.0) – (7.0)
Earnings before interest, income taxes and discontinued operations 111.6 221.6 241.0Interest on debt (note 10 (ix)) 30.0 34.1 26.1Other interest income, net (6.1) (3.7) (3.4)
Earnings before income taxes and discontinued operations 87.7 191.2 218.3Income taxes (note 14) 20.6 60.2 69.9
Earnings from continuing operations $ 67.1 $ 131.0 $ 148.4Results of discontinued operations (note 3) (3.1) (13.8) 1.1
Net earnings $ 64.0 $ 117.2 $ 149.5
Basic and diluted earnings per share from continuing operations $ 0.29 $ 0.60 $ 0.68
Basic and diluted net earnings per share $ 0.27 $ 0.53 $ 0.69
Weighted average number of common shares outstanding 233.2 219.4 217.6
CONSOLIDATED STATEMENTS OF RETAINED EARNINGS
years ended March 31 (amounts in millions of Canadian dollars) 2004 2003 2002
Retained earnings at beginning of year $ 531.2 $ 440.4 $ 315.9Share issue costs (net of taxes of $2.4 million) (5.1) – –Net earnings 64.0 117.2 149.5 Dividends (28.0) (26.4) (25.0)
Retained earnings at end of year $ 562.1 $ 531.2 $ 440.4
The accompanying notes form an integral part of these consolidated financial statements.
CONSOLIDATED STATEMENTS OF EARNINGS
32 CAE ANNUAL REPORT 2004CONSOLIDATED FINANCIAL STATEMENTS
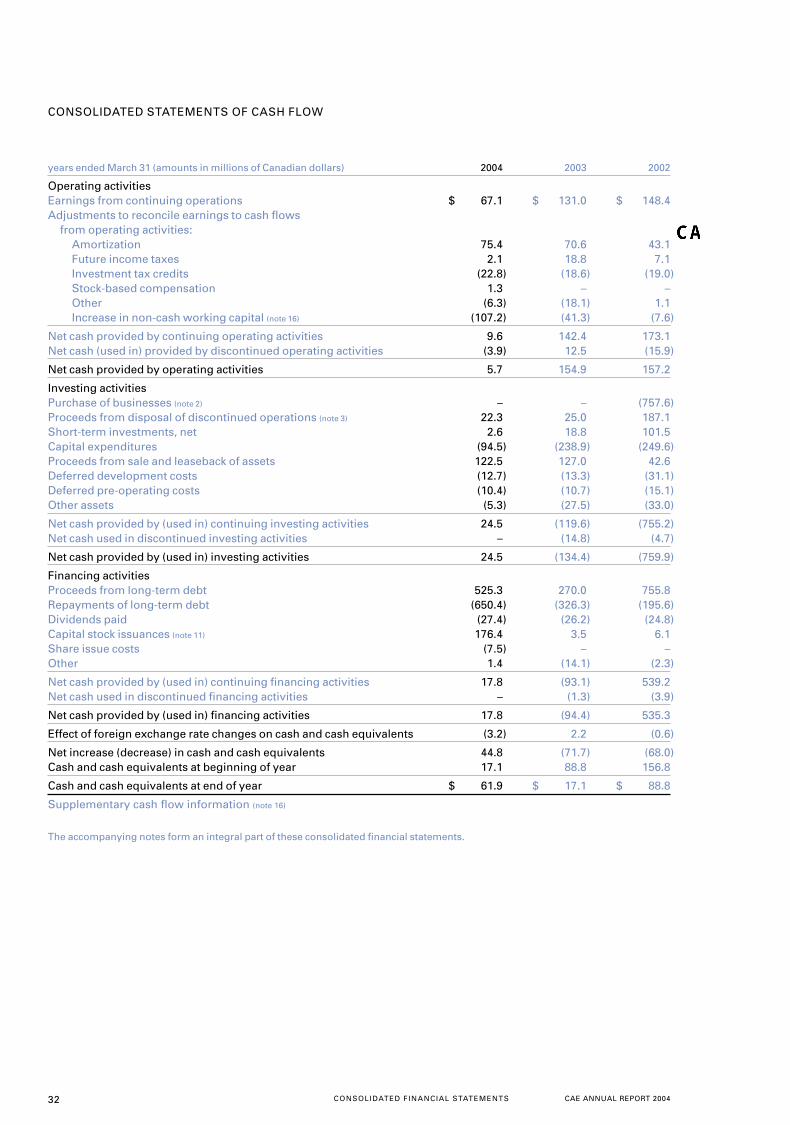
years ended March 31 (amounts in millions of Canadian dollars) 2004 2003 2002
Operating activitiesEarnings from continuing operations $ 67.1 $ 131.0 $ 148.4Adjustments to reconcile earnings to cash flows
from operating activities:Amortization 75.4 70.6 43.1Future income taxes 2.1 18.8 7.1 Investment tax credits (22.8) (18.6) (19.0)Stock-based compensation 1.3 – –Other (6.3) (18.1) 1.1Increase in non-cash working capital (note 16) (107.2) (41.3) (7.6)
Net cash provided by continuing operating activities 9.6 142.4 173.1Net cash (used in) provided by discontinued operating activities (3.9) 12.5 (15.9)
Net cash provided by operating activities 5.7 154.9 157.2
Investing activitiesPurchase of businesses (note 2) – – (757.6)Proceeds from disposal of discontinued operations (note 3) 22.3 25.0 187.1 Short-term investments, net 2.6 18.8 101.5 Capital expenditures (94.5) (238.9) (249.6)Proceeds from sale and leaseback of assets 122.5 127.0 42.6 Deferred development costs (12.7) (13.3) (31.1)Deferred pre-operating costs (10.4) (10.7) (15.1)Other assets (5.3) (27.5) (33.0)
Net cash provided by (used in) continuing investing activities 24.5 (119.6) (755.2)Net cash used in discontinued investing activities – (14.8) (4.7)
Net cash provided by (used in) investing activities 24.5 (134.4) (759.9)
Financing activitiesProceeds from long-term debt 525.3 270.0 755.8Repayments of long-term debt (650.4) (326.3) (195.6)Dividends paid (27.4) (26.2) (24.8)Capital stock issuances (note 11) 176.4 3.5 6.1Share issue costs (7.5) – –Other 1.4 (14.1) (2.3)
Net cash provided by (used in) continuing financing activities 17.8 (93.1) 539.2Net cash used in discontinued financing activities – (1.3) (3.9)
Net cash provided by (used in) financing activities 17.8 (94.4) 535.3
Effect of foreign exchange rate changes on cash and cash equivalents (3.2) 2.2 (0.6)
Net increase (decrease) in cash and cash equivalents 44.8 (71.7) (68.0)Cash and cash equivalents at beginning of year 17.1 88.8 156.8
Cash and cash equivalents at end of year $ 61.9 $ 17.1 $ 88.8
Supplementary cash flow information (note 16)
The accompanying notes form an integral part of these consolidated financial statements.
CONSOLIDATED STATEMENTS OF CASH FLOW
CAE ANNUAL REPORT 2004 NOTES TO CONSOLIDATED FINANCIAL STATEMENTS 33
NOTE 1 – SUMMARY OF SIGNIFICANT ACCOUNTING POLICIES
The accounting policies of CAE Inc. and its subsidiaries (“CAE” or “the Company”) conform with Canadian generallyaccepted accounting principles (Canadian GAAP). These accounting principles are different in some respects fromUnited States generally accepted accounting principles (U.S. GAAP). The significant differences are described innote 24.
NATURE OF OPERATIONS
CAE designs and provides simulation equipment and services and develops integrated training solutions for the mili-tary, commercial airlines, business aircraft operators, aircraft manufacturers and marine vessel operators.
CAE’s flight simulators replicate aircraft performance in normal and abnormal operations and a comprehensiveset of environmental conditions, utilizing visual systems with an extensive database of airports, other landing areasand flying environments and motion and sound cues to create a fully immersive training environment. The Companyoffers a full range of flight training devices based on the same software used in its simulators. CAE operates a globalnetwork of training centres in locations around the world.
The Company also provides simulators and training services for sea- and land-based activities and suppliesmarine automation systems for military and civil applications. CAE’s marine control systems monitor and controlpropulsion, electrical steering, ancillary, auxiliary and damage control systems.
CONSOLIDATION
The consolidated financial statements include the accounts of CAE Inc. and all subsidiaries. All inter-corporateaccounts and transactions have been eliminated. Acquisitions are accounted for using the purchase method and,accordingly, the results of operations of subsidiaries are included from the respective dates of acquisition. Portfolioinvestments are accounted for using the cost method.
REVENUE RECOGNITION
Revenue from long-term contracts for building simulators and controls systems is recognized using the percentage-of-completion method where revenue, earnings and unbilled accounts receivable are recorded as related costs areincurred, on the basis of the percentage of actual costs incurred to date on a contract, relative to the estimated totalcosts to complete that contract. Revisions in cost and earnings estimates during the term of the contract are reflectedin the period in which the need for revision becomes known. Losses, if any, are recognized fully when first anticipated.Generally, the terms of long-term contracts provide for progress billings based on completion of certain phases ofwork. Warranty provisions are recorded at the time revenue is recognized, based on past experience. No right ofreturn or complimentary upgrades are provided to customers. Post-delivery customer support is billed separately andrevenue is recorded ratably over the support period.
Training service revenues are recognized in the period such services are provided. All other revenue is recordedand related costs transferred to cost of sales at the time the product is delivered and the benefits and the risks ofownership associated with the product are transferred to the customer.
CASH AND CASH EQUIVALENTS
Cash consists of cash and cash equivalents, which are short-term, highly liquid investments with original terms tomaturity of 90 days or less.
SHORT-TERM INVESTMENTS
Short-term investments include money market instruments and commercial paper carried at the lower of cost or market value.
INVENTORIES
Raw materials are valued at the lower of cost and replacement cost. Work in process is stated at the lower of averagecost and net realizable value. The cost of work in process includes material, labour and an allocation of manufacturingoverhead.
RESTRICTED CASH
Under the terms of subsidiaries external bank financing and some government-related sales contracts, the Companyis required to hold a defined amount of cash as collateral.
NOTES TO CONSOLIDATED FINANCIAL STATEMENTS
years ended March 31, 2004, 2003 and 2002 (amounts in millions of Canadian dollars)
34 CAE ANNUAL REPORT 2004NOTES TO CONSOLIDATED FINANCIAL STATEMENTS
PROPERTY, PLANT AND EQUIPMENT
Property, plant and equipment are stated at amortized cost. The declining balance and straight-line methods are usedin computing amortization over the estimated useful lives of the assets. Useful lives are estimated as follows:
Building and improvements 20 to 40 yearsMachinery and equipment 3 to 10 yearsSimulators 12 to 25 years
In fiscal year 2003, the Company changed the amortization period for Civil simulation equipment from 20 years to25 years, to reflect the approximated useful life of the simulators. That change reduced the amortization expense by$3.7 million in fiscal 2003 as compared to fiscal 2002.
LEASES
Leases entered into by the Company in which substantially all the benefits and risks of ownership are transferred tothe Company are recorded as capital leases and classified as property, plant and equipment and long-term borrow-ings. All other leases are classified as operating leases under which leasing costs are expensed in the period in whichthey are incurred. Gains on the sale and leaseback of simulators are deferred and the gains in excess of the residualvalue guarantees are amortized over the term of the lease.
The residual value guarantees are to be recognized in the Company’s earnings upon expiry of the related saleand leaseback agreement.
BUSINESS COMBINATIONS, GOODWILL AND INTANGIBLE ASSETS
The Company accounts for its business acquisitions using the purchase method. Goodwill represents the cost ofinvestments in subsidiaries in excess of the fair value of the net identifiable assets acquired. Goodwill acquired in abusiness combination is accounted for under CICA Handbook Section 3062, Goodwill and Other Intangible Assets.This section requires that goodwill not be amortized. The fair value is to be assessed at least annually and, if neces-sary, is written down to such fair value for any impairment.
Intangible assets are recorded at their fair value at the date of acquisition of the related operating companies.Amortization is provided for all intangible assets on a straight-line basis over their estimated useful lives as follows:
WeightedAverage
Amortization AmortizationPeriod Period
Trade names 20 to 25 years 21Backlog and contractual agreements 1 to 20 years 10Customer relationships 10 to 25 years 24Other 12 to 20 years 16
INTEREST CAPITALIZATION
Interest costs relating to the construction of simulators and buildings for training centres are capitalized as part of thecost of property, plant and equipment. Capitalization of interest ceases when the simulator is completed and ready forproductive use.
FOREIGN CURRENCY TRANSLATION
The functional currency of the Company and each of its subsidiaries is the local currency. Monetary assets and liabili-ties denominated in currencies other than the functional currency are translated at exchange rates in effect at thebalance sheet date. Non-monetary assets and liabilities denominated in currencies other than the functional currencyare translated into the functional currency using the exchange rate prevailing at the dates of the respective transac-tions. Revenue and expense items are translated at average rates of exchange for the year. Translation gains or lossesare included in the determination of earnings, except for gains or losses arising on translation of accounts of foreignsubsidiaries considered self-sustaining, exchange gains and losses on inter-company account balances that form partof the net investment in foreign operations and gains or losses arising from the translation of foreign currency debtthat has been designated as a hedge of the net investment in subsidiaries, which are reflected as a separate compo-nent of shareholders’ equity.
Earnings from continuing operations include a net foreign exchange gain of $10.6 million in 2004 or 5 cents pershare (2003 – net foreign exchange gain of $6.1 million or 3 cents per share, 2002 – net foreign exchange loss of$1.2 million or 1 cent per share).
RESEARCH AND DEVELOPMENT COSTS
Research costs are charged to earnings in the periods in which they are incurred. Development costs are also chargedto earnings in the period incurred unless they meet the criteria for deferral. Government assistance arising fromresearch and development costs is deducted from the related costs. Amortization of development costs deferred tofuture periods commences with the commercial production of the product and is charged to earnings based on antic-ipated sales of the product, over a period not exceeding five years.
CAE ANNUAL REPORT 2004 NOTES TO CONSOLIDATED FINANCIAL STATEMENTS 35
PRE-OPERATING COSTS
The Company defers expenditures incurred during the pre-operating period for all new training centres. Expendituresdirectly related to placing a new training centre into commercial service are incremental in nature and are consideredby management to be recoverable from the future operations of the new training centre. Capitalization ceases at theopening of the training centre. Amortization of the deferred costs is taken over five years in respect to civil trainingoperations and marine operations and over 20 years for the Medium Support Helicopter project, matching the term ofthe contract.
DEFERRED FINANCING COSTS
Costs incurred relating to the issuance of long-term debt are deferred and amortized over the term of the related debt.
INCOME TAXES
Future income taxes relate to the expected future tax consequences of differences between the carrying amount ofbalance sheet items and their corresponding tax values. A valuation allowance is recognized to the extent that, in theopinion of management, it is more likely than not that the future income tax assets will not be realized. Future incometax assets and liabilities are adjusted for the effects of subsequent changes in tax laws and rates on the date of enact-ment or substantive enactment.
Investment tax credits arising from research and development activities are deducted from the related costs andare accordingly included in the determination of earnings in the same year as the related costs. Investment tax creditsarising from the acquisition of property, plant and equipment and deferred development costs are deducted from thecost of those assets with amortization calculated on the net amount.
The Company is subject to examination by taxation authorities in various jurisdictions. The determination of taxliabilities involved certain uncertainties in the interpretation of complex tax regulations. Therefore, the Company pro-vides for potential tax liabilities based on management’s best estimates. Differences between the estimates and theultimate amounts of taxes and investment tax credits are recorded in earnings at the time they can be determined.
PENSIONS
The Company accrues its obligations under employee pension plans and the related costs, net of plan assets. The costof pensions is actuarially determined using the projected benefits method calculated based on employee service,salary escalation and retirement age, together with the expected return on plan assets. For the purpose of calculatingthe expected return on plan assets, those assets are valued at fair market value.
The excess of the net actuarial gain (loss) over 10% of the greater of the benefit obligation and the fair value ofplan assets is amortized over the remaining service period of active employees.
STOCK-BASED COMPENSATION PLANS
The Company’s stock-based compensation plans consist of an Employee Stock Option Plan (ESOP), an Employee StockPurchase Plan (ESPP), a Deferred Share Unit (DSU) plan for executives and on April 1, 2003, the Company adopted aLong-Term Incentive Deferred Share Unit Plan (LTI-DSU), both of which (DSU and LTI-DSU) are described in note 12.
In fiscal 2004, the Company adopted on a prospective basis the CICA recommendations issued in June 2003 andexpensed prospectively the cost of stock options granted to employees using the fair value based method. A com-pensation expense is recognized for the Company’s portion of the contributions made under the ESPP and foramounts due under the DSU and LTI-DSU plans. In fiscal 2004, compensation cost for CAE’s stock options was recog-nized in net earnings with a corresponding credit of $1.3 million to contributed surplus using the fair value method ofaccounting for awards that were granted in May 2003.
In fiscal 2003, CAE adopted the initial recommendations of CICA Section 3870, Stock-based Compensation andOther Stock-based Payments. The standard encouraged, but did not require, that the fair value based method forvaluing stock options be used for transactions with employees. Under the fair value method, compensation expenseis measured at the grant date and recognized over the service period. In note 12, pro forma net earnings and proforma basic and diluted net earnings per share figures are presented as if the fair value based method of accountinghad been used to account for stock options granted to employees during fiscal 2003. CAE’s practice is to issue optionsin May of each fiscal year, whereby these options vest equally over four years. Any consideration paid by plan partici-pants on the exercise of share options or the purchase of shares is credited to share capital together with any relatedstock-based compensation expense.
DERIVATIVE FINANCIAL INSTRUMENTS
The Company enters into forward, swap and option contracts to manage its exposure to fluctuations in interest ratesand foreign exchange rates. CAE assesses on an ongoing basis whether the derivatives that are used in hedgingtransactions are effective in offsetting changes in fair values or cash flows of hedged items. The Company does nothold or issue derivative financial instruments for speculative trading purposes.
The foreign currency risk associated with certain purchase and sale commitments denominated in a foreign cur-rency is hedged through a combination of forward contracts and options. The foreign currency realized andunrealized gains or losses associated with derivative instruments, which have been terminated or cease to be effec-tive prior to maturity, are deferred under other current, or non-current, assets or liabilities on the balance sheet andrecognized in income in the period in which the underlying hedged transaction is recognized. In the event a desig-nated hedged item is sold, extinguished or matures prior to the termination of the related derivative instrument, anyrealized or unrealized gain or loss on such derivative instrument is recognized in income.
36 CAE ANNUAL REPORT 2004NOTES TO CONSOLIDATED FINANCIAL STATEMENTS
Interest rate swap contracts are designated as hedges of the interest rate of certain financial instruments. Theinterest payments relating to swap contracts are recorded in net earnings over the life of the underlying transactionon an accrual basis as an adjustment to interest income or interest expense.
EARNINGS PER SHARE
The calculation of basic earnings per share is based on the weighted average number of shares issued and outstand-ing. Diluted earnings per share is calculated by dividing net earnings available to common shareholders by theweighted average number of shares used in the basic earnings per share calculation plus the number of commonshares that would be issued assuming exercise or conversion of all dilutive potential common shares outstandingduring the year using the treasury stock method.
USE OF ESTIMATES
The preparation of financial statements in conformity with GAAP requires management to make estimates andassumptions that affect the reported amounts of assets and liabilities and disclosure of contingent assets and liabili-ties at the date of the financial statements and the reported amounts of revenues and expenses for the periodreported. Actual results could differ from those estimates.
RECENTLY ADOPTED ACCOUNTING STANDARDS
Impairment of long-lived assetsOn April 1, 2003, the Company adopted CICA Handbook Section 3063, Impairment of Long-Lived Assets, whichrequires the recognition of an impairment loss for a long-lived asset to be held and used when events or changes incircumstances cause its carrying value to exceed the total undiscounted cash flows expected from its use and even-tual disposition. An impairment loss, if any, is determined as the excess of the carrying value of the asset over its fairvalue. It replaces the impairment provision in Section 3061, Property, Plant and Equipment.
The adoption of this standard did not have any material effect on consolidated financial statements.
Disposal of long-lived assets and discontinued operationsOn April 1, 2003, the Company adopted CICA Handbook Section 3475, Disposal of Long-Lived Assets and Discon-tinued Operations, which provides guidance on recognizing, measuring, presenting and disclosing long-lived assetsto be disposed of. It supersedes the former Section 3475, Discontinued Operations.
Under this section, an asset classified as held for sale is measured at the lower of its carrying amount or fair valueless disposal costs, and is not depreciated while classified as held for sale. The adoption of this standard did not haveany material effect on CAE’s consolidated financial statements.
Severance, termination benefits and costs associated with exit and disposal activitiesOn April 1, 2003, the Company prospectively adopted the new CICA Emerging Issues Committee Abstract 134 (EIC-134), Accounting for Severance and Termination Benefits, and EIC-135, Accounting for Costs Associated with Exit and Disposal Activities (Including Costs Incurred in a Restructuring), relating to exit or disposal activities afterMarch 31, 2003. These abstracts provide guidance on the timing of recognition and measurement of liabilities as wellas disclosures for the various types of severance and termination benefits related to the termination of employees’services prior to normal retirement and costs associated with an exit or disposal activity. Under this new guidance,liabilities for these costs are to be recognized in the period when they are incurred and measured at their fair value.
CAE applied these guidelines for severance and other costs as described in note 23.
FUTURE CHANGES TO ACCOUNTING STANDARDS
Hedging relationshipsThe CICA amended in November 2002 and June 2003 its Accounting Guideline (AcG – 13), Hedging Relationships.It provides the views of the Accounting Standards Board on the identification, designation, documentation and effec-tiveness of hedging relationships for the purpose of applying hedge accounting, and the discontinuance of hedgeaccounting. Under this guideline, complete documentation of the information related to hedging relationships isrequired and the effectiveness of the hedges must be demonstrated and documented. This new Section is applicablefor the Company on April 1, 2004.
On April 1, 2004, CAE will continue to apply hedge accounting in accordance with the requirements prescribed bythe Guideline.
Consolidation of variable interest entitiesIn March 2004, the CICA issued proposed amendments to its Accounting Guideline (AcG – 15) titled Consolidation ofVariable Interest Entities. The resulting guideline will be harmonized with the recently issued US guidance (FIN 46R)(see note 24), and is expected to be applicable for interim and annual periods beginning on or after November 1, 2004.The guideline requires that an enterprise holding other than a voting interest in a Variable Interest Entity (VIE) could,subject to certain conditions, be required to consolidate the VIE if such enterprise is considered its primary beneficiarywhereby it would absorb the majority of the VIE’s expected losses and/or receive the majority of its expected residualreturns. The Company is currently evaluating the impact of this draft guideline on its financial statements.
CAE ANNUAL REPORT 2004 NOTES TO CONSOLIDATED FINANCIAL STATEMENTS 37
Employee future benefitsIn December 2003, new disclosure requirements for pensions and other employee future benefits were issued. Thenew required disclosures include items such as a narrative description of each type of plan, the measurement date ofthe plan asset and liability, the effective date of the last actuarial evaluation, and the detail of the plan asset by majorcategory. This requirement will be applicable for CAE in the first quarter of fiscal 2005.
Generally Accepted Accounting Principles and financial statement presentationThe CICA issued new Handbook Sections 1100, Generally Accepted Accounting Principles, and 1400, GeneralStandards of Financial Statement Presentation. Section 1100 describes what constitutes Canadian GAAP and itssources, and provides guidance on sources to consult when selecting accounting policies and appropriate disclosurewhen a matter is not dealt with explicitly in the primary sources of GAAP, thereby recodifying the Canadian GAAPhierarchy. Section 1400 clarifies what is fair presentation in accordance with GAAP and provides general guidance onfinancial presentation. The Company does not expect any significant impact on its consolidated financial statementswith the adoption on April 1, 2004 of this new Section.
NOTE 2 – BUSINESS ACQUISITIONS
On March 31, 2003, the Company completed a technology investment in the marine navigation business by acquiringall of the issued and outstanding shares of the Norway-based HiTec Marine Automation AS (HiTec). No considerationwas given for the purchase of the shares. The business provides marine navigation products and capabilities for bothnaval and commercial marine markets. This technology investment complements the Company’s existing marineproducts and capabilities.
During fiscal 2002, the Company completed four strategic acquisitions, two of which accelerated the Company’smove into aviation training, one which significantly improved the Company’s access to the US defence market andone which provided immediate entry into the commercial marine control systems market. A summary description ofeach acquisition follows:
On April 2, 2001, the Company acquired all of the issued and outstanding shares of BAE Systems Flight Simulationand Training Inc. (BAE Systems) located in Tampa, Florida, for a total cash consideration of US$76.0 million. The busi-ness has a well-established position in the US defence market for the manufacture of transport and helicoptersimulation equipment and has significant training and support service activities for both civil and military markets.
On August 1, 2001, the Company acquired all of the issued and outstanding shares of Valmarine AS of Norway(Valmarine), for a cash consideration of NOK238.6 million and a CAE share issuance of NOK125.4 million (or 1,419,919common shares), based on the average closing price of CAE’s shares for the 10 days prior to August 1. Valmarine isthe global leader for marine control systems for the commercial market.
On August 24, 2001, the Company acquired all of the issued and outstanding shares of the Netherland-basedSchreiner Aviation Training B.V. (Schreiner) for total cash consideration of €193.4 million. The business providessimulator and ground-school civil aviation training.
On December 31, 2001, the Company acquired all of the issued and outstanding shares of SimuFlite TrainingInternational Inc. (SimuFlite), based in Dallas, Texas, for a total cash consideration of US$210.9 million. In addition,equipment in the amount of US$54.0 million was sold and leased back. SimuFlite is the world’s second largestprovider of business aviation training.
These acquisitions were accounted for under the purchase method and their operating results have beenincluded from the respective acquisition dates.
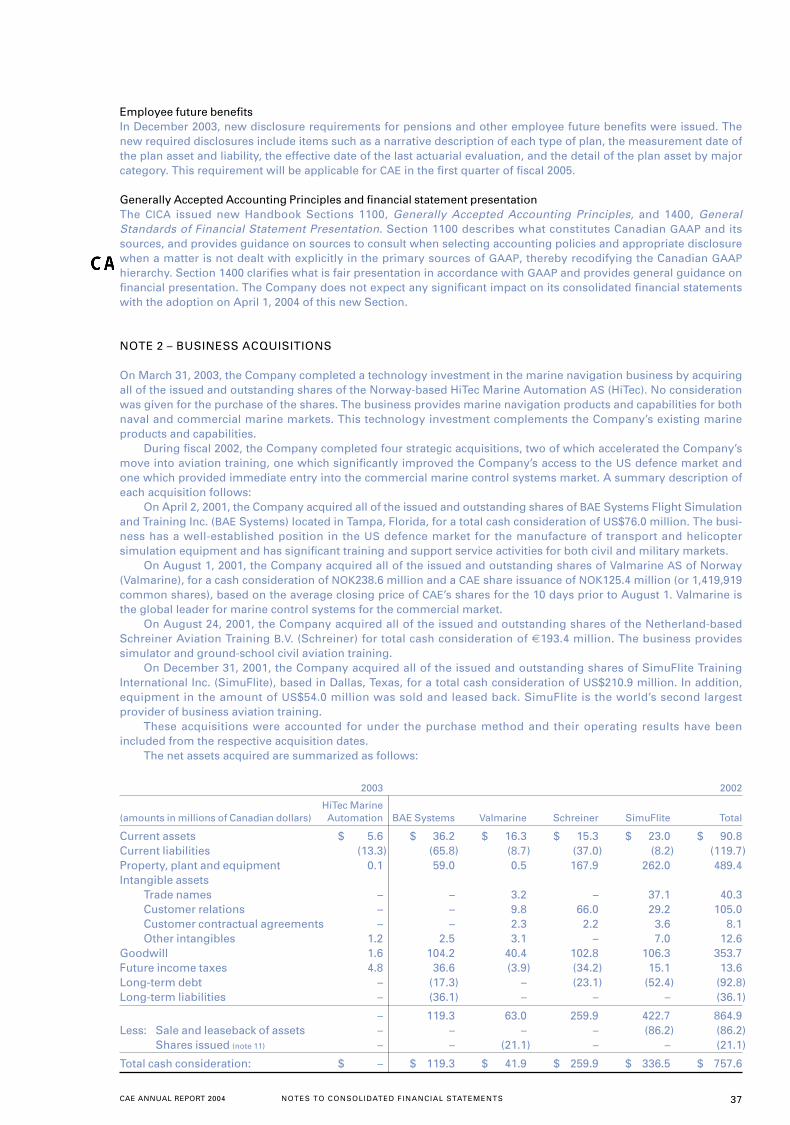
The net assets acquired are summarized as follows:
2003 2002
HiTec Marine (amounts in millions of Canadian dollars) Automation BAE Systems Valmarine Schreiner SimuFlite Total
Current assets $ 5.6 $ 36.2 $ 16.3 $ 15.3 $ 23.0 $ 90.8Current liabilities (13.3) (65.8) (8.7) (37.0) (8.2) (119.7)Property, plant and equipment 0.1 59.0 0.5 167.9 262.0 489.4Intangible assets
Trade names – – 3.2 – 37.1 40.3Customer relations – – 9.8 66.0 29.2 105.0Customer contractual agreements – – 2.3 2.2 3.6 8.1Other intangibles 1.2 2.5 3.1 – 7.0 12.6
Goodwill 1.6 104.2 40.4 102.8 106.3 353.7Future income taxes 4.8 36.6 (3.9) (34.2) 15.1 13.6Long-term debt – (17.3) – (23.1) (52.4) (92.8)Long-term liabilities – (36.1) – – – (36.1)
– 119.3 63.0 259.9 422.7 864.9 Less: Sale and leaseback of assets – – – – (86.2) (86.2)
Shares issued (note 11) – – (21.1) – – (21.1)
Total cash consideration: $ – $ 119.3 $ 41.9 $ 259.9 $ 336.5 $ 757.6
38 CAE ANNUAL REPORT 2004NOTES TO CONSOLIDATED FINANCIAL STATEMENTS
The net assets of Schreiner, SimuFlite and approximately 10% of the net assets of BAE Systems are included inthe Civil Simulation and Training segment. The balance of the net assets of BAE Systems is included in the MilitarySimulation and Training segment. Net assets of Valmarine and HiTec are included in the Marine Controls segment.
The goodwill on the SimuFlite acquisition is the sole deductible goodwill for tax purposes.There were certain adjustments to the assets and liabilities recorded in fiscal 2003 for certain of the businesses
acquired. For Valmarine, the adjustment related to the final evaluation of other intangible assets. For Schreiner, theadjustment pertained to the accounting for simulators that were being built at the time the acquisition was com-pleted. For SimuFlite, the adjustment resulted from a purchase price arbitration settlement. HiTec Marine Automationwas adjusted in fiscal 2004, with the final evaluation of the tax liabilities and integration costs.
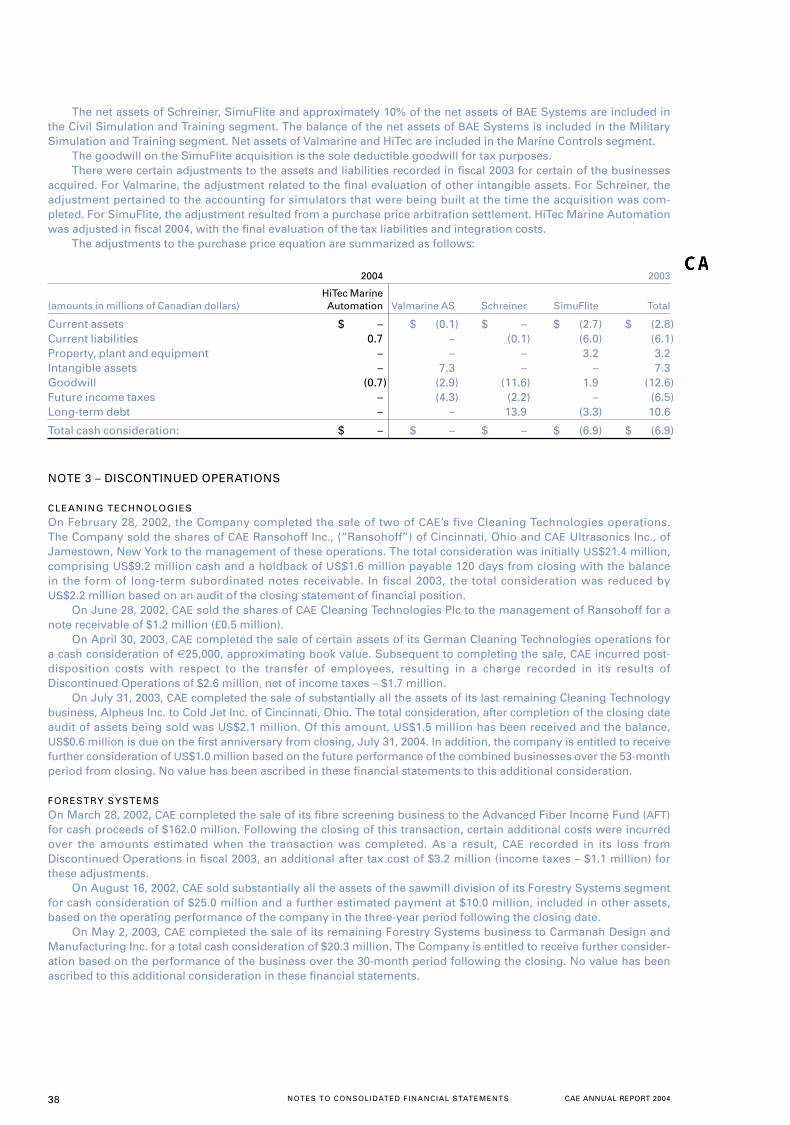
The adjustments to the purchase price equation are summarized as follows:
2004 2003
HiTec Marine(amounts in millions of Canadian dollars) Automation Valmarine AS Schreiner SimuFlite Total
Current assets $ – $ (0.1) $ – $ (2.7) $ (2.8)Current liabilities 0.7 – (0.1) (6.0) (6.1)Property, plant and equipment – – – 3.2 3.2Intangible assets – 7.3 – – 7.3Goodwill (0.7) (2.9) (11.6) 1.9 (12.6)Future income taxes – (4.3) (2.2) – (6.5)Long-term debt – – 13.9 (3.3) 10.6
Total cash consideration: $ – $ – $ – $ (6.9) $ (6.9)
NOTE 3 – DISCONTINUED OPERATIONS
CLEANING TECHNOLOGIES
On February 28, 2002, the Company completed the sale of two of CAE’s five Cleaning Technologies operations.The Company sold the shares of CAE Ransohoff Inc., (“Ransohoff”) of Cincinnati, Ohio and CAE Ultrasonics Inc., ofJamestown, New York to the management of these operations. The total consideration was initially US$21.4 million,comprising US$9.2 million cash and a holdback of US$1.6 million payable 120 days from closing with the balancein the form of long-term subordinated notes receivable. In fiscal 2003, the total consideration was reduced byUS$2.2 million based on an audit of the closing statement of financial position.
On June 28, 2002, CAE sold the shares of CAE Cleaning Technologies Plc to the management of Ransohoff for anote receivable of $1.2 million (£0.5 million).
On April 30, 2003, CAE completed the sale of certain assets of its German Cleaning Technologies operations fora cash consideration of €25,000, approximating book value. Subsequent to completing the sale, CAE incurred post-disposition costs with respect to the transfer of employees, resulting in a charge recorded in its results ofDiscontinued Operations of $2.6 million, net of income taxes – $1.7 million.
On July 31, 2003, CAE completed the sale of substantially all the assets of its last remaining Cleaning Technologybusiness, Alpheus Inc. to Cold Jet Inc. of Cincinnati, Ohio. The total consideration, after completion of the closing dateaudit of assets being sold was US$2.1 million. Of this amount, US$1.5 million has been received and the balance,US$0.6 million is due on the first anniversary from closing, July 31, 2004. In addition, the company is entitled to receivefurther consideration of US$1.0 million based on the future performance of the combined businesses over the 53-monthperiod from closing. No value has been ascribed in these financial statements to this additional consideration.
FORESTRY SYSTEMS
On March 28, 2002, CAE completed the sale of its fibre screening business to the Advanced Fiber Income Fund (AFT)for cash proceeds of $162.0 million. Following the closing of this transaction, certain additional costs were incurredover the amounts estimated when the transaction was completed. As a result, CAE recorded in its loss fromDiscontinued Operations in fiscal 2003, an additional after tax cost of $3.2 million (income taxes – $1.1 million) forthese adjustments.
On August 16, 2002, CAE sold substantially all the assets of the sawmill division of its Forestry Systems segmentfor cash consideration of $25.0 million and a further estimated payment at $10.0 million, included in other assets,based on the operating performance of the company in the three-year period following the closing date.
On May 2, 2003, CAE completed the sale of its remaining Forestry Systems business to Carmanah Design andManufacturing Inc. for a total cash consideration of $20.3 million. The Company is entitled to receive further consider-ation based on the performance of the business over the 30-month period following the closing. No value has beenascribed to this additional consideration in these financial statements.
CAE ANNUAL REPORT 2004 NOTES TO CONSOLIDATED FINANCIAL STATEMENTS 39
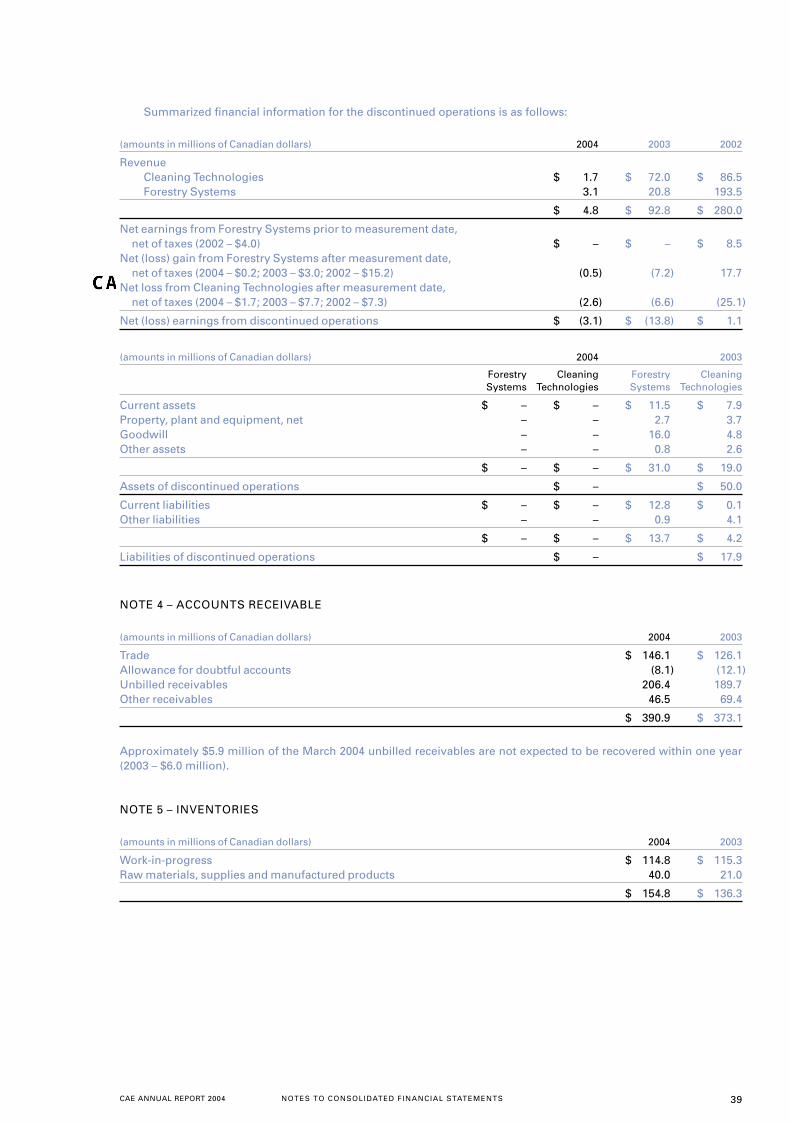
Summarized financial information for the discontinued operations is as follows:
(amounts in millions of Canadian dollars) 2004 2003 2002
RevenueCleaning Technologies $ 1.7 $ 72.0 $ 86.5Forestry Systems 3.1 20.8 193.5
$ 4.8 $ 92.8 $ 280.0
Net earnings from Forestry Systems prior to measurement date, net of taxes (2002 – $4.0) $ – $ – $ 8.5
Net (loss) gain from Forestry Systems after measurement date, net of taxes (2004 – $0.2; 2003 – $3.0; 2002 – $15.2) (0.5) (7.2) 17.7
Net loss from Cleaning Technologies after measurement date, net of taxes (2004 – $1.7; 2003 – $7.7; 2002 – $7.3) (2.6) (6.6) (25.1)
Net (loss) earnings from discontinued operations $ (3.1) $ (13.8) $ 1.1
(amounts in millions of Canadian dollars) 2004 2003
Forestry Cleaning Forestry CleaningSystems Technologies Systems Technologies
Current assets $ – $ – $ 11.5 $ 7.9Property, plant and equipment, net – – 2.7 3.7Goodwill – – 16.0 4.8Other assets – – 0.8 2.6
$ – $ – $ 31.0 $ 19.0
Assets of discontinued operations $ – $ 50.0
Current liabilities $ – $ – $ 12.8 $ 0.1Other liabilities – – 0.9 4.1
$ – $ – $ 13.7 $ 4.2
Liabilities of discontinued operations $ – $ 17.9
NOTE 4 – ACCOUNTS RECEIVABLE
(amounts in millions of Canadian dollars) 2004 2003
Trade $ 146.1 $ 126.1Allowance for doubtful accounts (8.1) (12.1)Unbilled receivables 206.4 189.7Other receivables 46.5 69.4
$ 390.9 $ 373.1
Approximately $5.9 million of the March 2004 unbilled receivables are not expected to be recovered within one year(2003 – $6.0 million).
NOTE 5 – INVENTORIES
(amounts in millions of Canadian dollars) 2004 2003
Work-in-progress $ 114.8 $ 115.3Raw materials, supplies and manufactured products 40.0 21.0
$ 154.8 $ 136.3
40 CAE ANNUAL REPORT 2004NOTES TO CONSOLIDATED FINANCIAL STATEMENTS
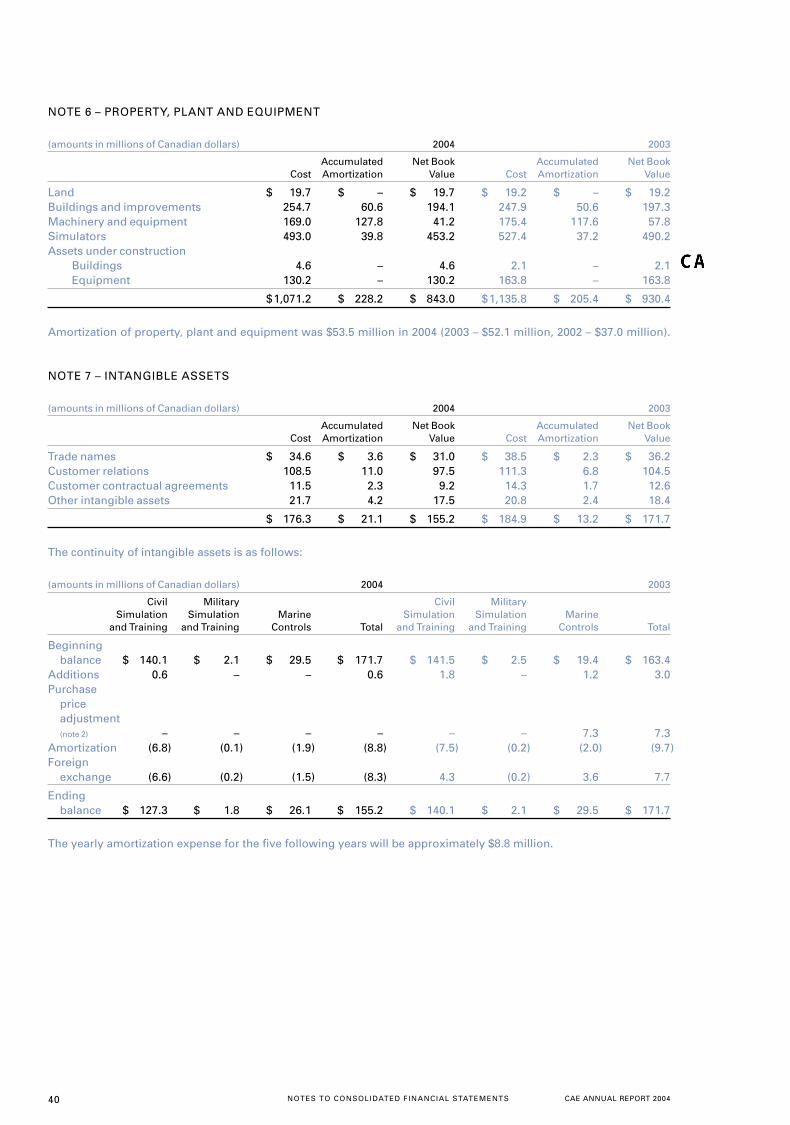
NOTE 6 – PROPERTY, PLANT AND EQUIPMENT
(amounts in millions of Canadian dollars) 2004 2003
Accumulated Net Book Accumulated Net BookCost Amortization Value Cost Amortization Value
Land $ 19.7 $ – $ 19.7 $ 19.2 $ – $ 19.2Buildings and improvements 254.7 60.6 194.1 247.9 50.6 197.3Machinery and equipment 169.0 127.8 41.2 175.4 117.6 57.8Simulators 493.0 39.8 453.2 527.4 37.2 490.2Assets under construction
Buildings 4.6 – 4.6 2.1 – 2.1Equipment 130.2 – 130.2 163.8 – 163.8
$1,071.2 $ 228.2 $ 843.0 $1,135.8 $ 205.4 $ 930.4
Amortization of property, plant and equipment was $53.5 million in 2004 (2003 – $52.1 million, 2002 – $37.0 million).
NOTE 7 – INTANGIBLE ASSETS
(amounts in millions of Canadian dollars) 2004 2003
Accumulated Net Book Accumulated Net BookCost Amortization Value Cost Amortization Value
Trade names $ 34.6 $ 3.6 $ 31.0 $ 38.5 $ 2.3 $ 36.2Customer relations 108.5 11.0 97.5 111.3 6.8 104.5Customer contractual agreements 11.5 2.3 9.2 14.3 1.7 12.6Other intangible assets 21.7 4.2 17.5 20.8 2.4 18.4
$ 176.3 $ 21.1 $ 155.2 $ 184.9 $ 13.2 $ 171.7
The continuity of intangible assets is as follows:
(amounts in millions of Canadian dollars) 2004 2003
Civil Military Civil MilitarySimulation Simulation Marine Simulation Simulation Marine
and Training and Training Controls Total and Training and Training Controls Total
Beginningbalance $ 140.1 $ 2.1 $ 29.5 $ 171.7 $ 141.5 $ 2.5 $ 19.4 $ 163.4
Additions 0.6 – – 0.6 1.8 – 1.2 3.0Purchase
price adjustment(note 2) – – – – – – 7.3 7.3
Amortization (6.8) (0.1) (1.9) (8.8) (7.5) (0.2) (2.0) (9.7)Foreign
exchange (6.6) (0.2) (1.5) (8.3) 4.3 (0.2) 3.6 7.7
Endingbalance $ 127.3 $ 1.8 $ 26.1 $ 155.2 $ 140.1 $ 2.1 $ 29.5 $ 171.7
The yearly amortization expense for the five following years will be approximately $8.8 million.
CAE ANNUAL REPORT 2004 NOTES TO CONSOLIDATED FINANCIAL STATEMENTS 41
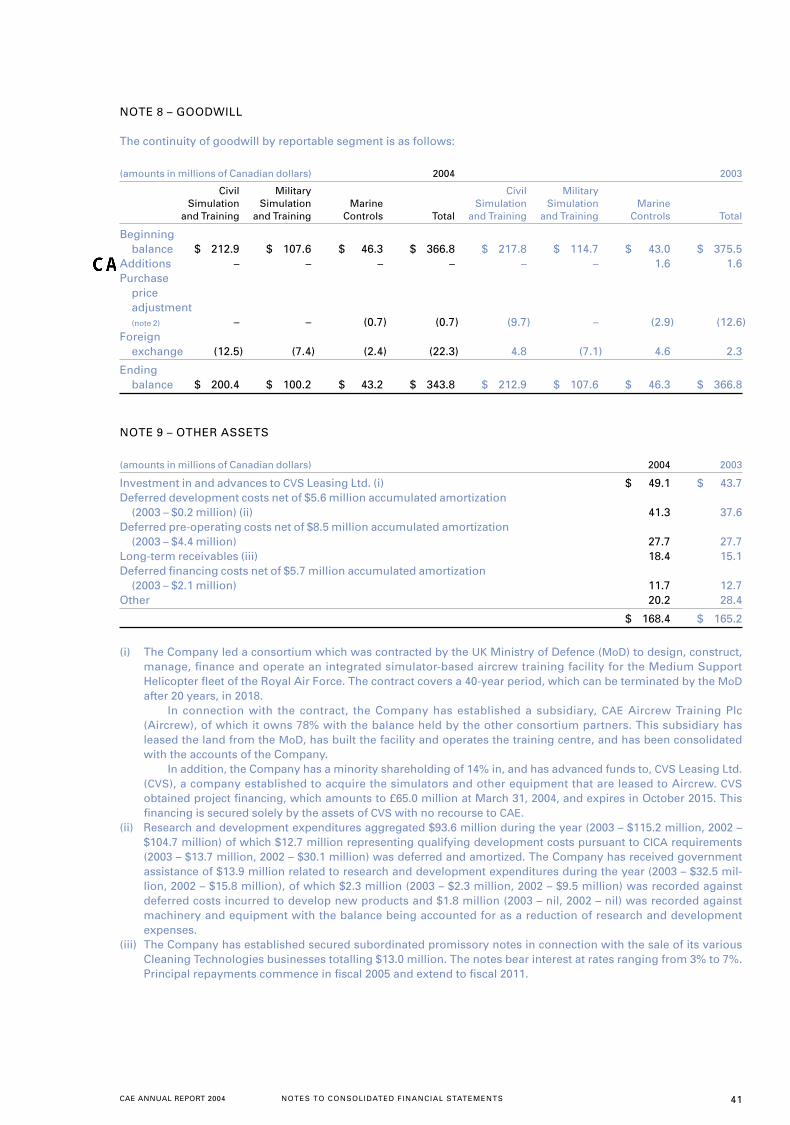
NOTE 8 – GOODWILL
The continuity of goodwill by reportable segment is as follows:
(amounts in millions of Canadian dollars) 2004 2003
Civil Military Civil MilitarySimulation Simulation Marine Simulation Simulation Marine
and Training and Training Controls Total and Training and Training Controls Total
Beginningbalance $ 212.9 $ 107.6 $ 46.3 $ 366.8 $ 217.8 $ 114.7 $ 43.0 $ 375.5
Additions – – – – – – 1.6 1.6Purchase
priceadjustment(note 2) – – (0.7) (0.7) (9.7) – (2.9) (12.6)
Foreign exchange (12.5) (7.4) (2.4) (22.3) 4.8 (7.1) 4.6 2.3
Endingbalance $ 200.4 $ 100.2 $ 43.2 $ 343.8 $ 212.9 $ 107.6 $ 46.3 $ 366.8
NOTE 9 – OTHER ASSETS
(amounts in millions of Canadian dollars) 2004 2003
Investment in and advances to CVS Leasing Ltd. (i) $ 49.1 $ 43.7Deferred development costs net of $5.6 million accumulated amortization
(2003 – $0.2 million) (ii) 41.3 37.6Deferred pre-operating costs net of $8.5 million accumulated amortization
(2003 – $4.4 million) 27.7 27.7Long-term receivables (iii) 18.4 15.1Deferred financing costs net of $5.7 million accumulated amortization
(2003 – $2.1 million) 11.7 12.7Other 20.2 28.4
$ 168.4 $ 165.2
(i) The Company led a consortium which was contracted by the UK Ministry of Defence (MoD) to design, construct,manage, finance and operate an integrated simulator-based aircrew training facility for the Medium SupportHelicopter fleet of the Royal Air Force. The contract covers a 40-year period, which can be terminated by the MoDafter 20 years, in 2018.
In connection with the contract, the Company has established a subsidiary, CAE Aircrew Training Plc(Aircrew), of which it owns 78% with the balance held by the other consortium partners. This subsidiary hasleased the land from the MoD, has built the facility and operates the training centre, and has been consolidatedwith the accounts of the Company.
In addition, the Company has a minority shareholding of 14% in, and has advanced funds to, CVS Leasing Ltd.(CVS), a company established to acquire the simulators and other equipment that are leased to Aircrew. CVSobtained project financing, which amounts to £65.0 million at March 31, 2004, and expires in October 2015. Thisfinancing is secured solely by the assets of CVS with no recourse to CAE.
(ii) Research and development expenditures aggregated $93.6 million during the year (2003 – $115.2 million, 2002 –$104.7 million) of which $12.7 million representing qualifying development costs pursuant to CICA requirements(2003 – $13.7 million, 2002 – $30.1 million) was deferred and amortized. The Company has received governmentassistance of $13.9 million related to research and development expenditures during the year (2003 – $32.5 mil-lion, 2002 – $15.8 million), of which $2.3 million (2003 – $2.3 million, 2002 – $9.5 million) was recorded againstdeferred costs incurred to develop new products and $1.8 million (2003 – nil, 2002 – nil) was recorded againstmachinery and equipment with the balance being accounted for as a reduction of research and developmentexpenses.
(iii) The Company has established secured subordinated promissory notes in connection with the sale of its variousCleaning Technologies businesses totalling $13.0 million. The notes bear interest at rates ranging from 3% to 7%.Principal repayments commence in fiscal 2005 and extend to fiscal 2011.
42 CAE ANNUAL REPORT 2004NOTES TO CONSOLIDATED FINANCIAL STATEMENTS
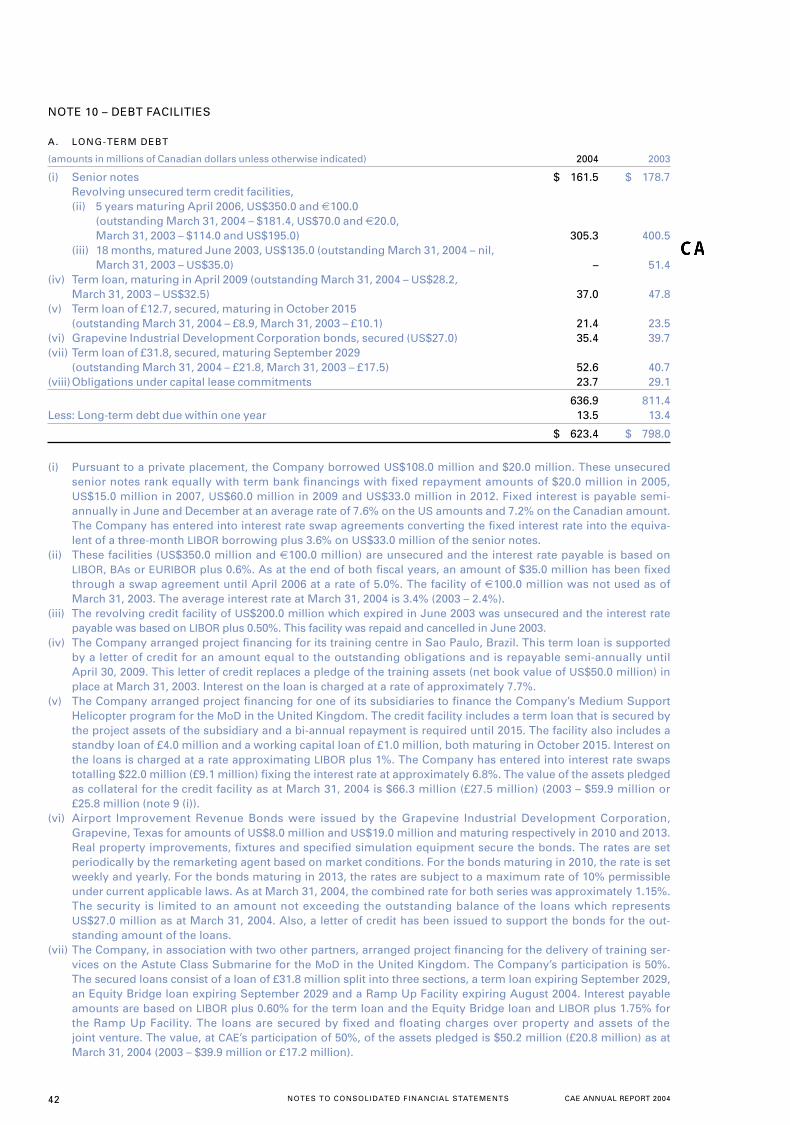
NOTE 10 – DEBT FACILITIES
A. LONG-TERM DEBT
(amounts in millions of Canadian dollars unless otherwise indicated) 2004 2003
(i) Senior notes $ 161.5 $ 178.7Revolving unsecured term credit facilities,(ii) 5 years maturing April 2006, US$350.0 and €100.0
(outstanding March 31, 2004 – $181.4, US$70.0 and €20.0, March 31, 2003 – $114.0 and US$195.0) 305.3 400.5
(iii) 18 months, matured June 2003, US$135.0 (outstanding March 31, 2004 – nil, March 31, 2003 – US$35.0) – 51.4
(iv) Term loan, maturing in April 2009 (outstanding March 31, 2004 – US$28.2, March 31, 2003 – US$32.5) 37.0 47.8
(v) Term loan of £12.7, secured, maturing in October 2015 (outstanding March 31, 2004 – £8.9, March 31, 2003 – £10.1) 21.4 23.5
(vi) Grapevine Industrial Development Corporation bonds, secured (US$27.0) 35.4 39.7(vii) Term loan of £31.8, secured, maturing September 2029
(outstanding March 31, 2004 – £21.8, March 31, 2003 – £17.5) 52.6 40.7(viii)Obligations under capital lease commitments 23.7 29.1
636.9 811.4Less: Long-term debt due within one year 13.5 13.4
$ 623.4 $ 798.0
(i) Pursuant to a private placement, the Company borrowed US$108.0 million and $20.0 million. These unsecuredsenior notes rank equally with term bank financings with fixed repayment amounts of $20.0 million in 2005,US$15.0 million in 2007, US$60.0 million in 2009 and US$33.0 million in 2012. Fixed interest is payable semi-annually in June and December at an average rate of 7.6% on the US amounts and 7.2% on the Canadian amount.The Company has entered into interest rate swap agreements converting the fixed interest rate into the equiva-lent of a three-month LIBOR borrowing plus 3.6% on US$33.0 million of the senior notes.
(ii) These facilities (US$350.0 million and €100.0 million) are unsecured and the interest rate payable is based onLIBOR, BAs or EURIBOR plus 0.6%. As at the end of both fiscal years, an amount of $35.0 million has been fixedthrough a swap agreement until April 2006 at a rate of 5.0%. The facility of €100.0 million was not used as ofMarch 31, 2003. The average interest rate at March 31, 2004 is 3.4% (2003 – 2.4%).
(iii) The revolving credit facility of US$200.0 million which expired in June 2003 was unsecured and the interest ratepayable was based on LIBOR plus 0.50%. This facility was repaid and cancelled in June 2003.
(iv) The Company arranged project financing for its training centre in Sao Paulo, Brazil. This term loan is supportedby a letter of credit for an amount equal to the outstanding obligations and is repayable semi-annually untilApril 30, 2009. This letter of credit replaces a pledge of the training assets (net book value of US$50.0 million) inplace at March 31, 2003. Interest on the loan is charged at a rate of approximately 7.7%.
(v) The Company arranged project financing for one of its subsidiaries to finance the Company’s Medium SupportHelicopter program for the MoD in the United Kingdom. The credit facility includes a term loan that is secured bythe project assets of the subsidiary and a bi-annual repayment is required until 2015. The facility also includes astandby loan of £4.0 million and a working capital loan of £1.0 million, both maturing in October 2015. Interest onthe loans is charged at a rate approximating LIBOR plus 1%. The Company has entered into interest rate swapstotalling $22.0 million (£9.1 million) fixing the interest rate at approximately 6.8%. The value of the assets pledgedas collateral for the credit facility as at March 31, 2004 is $66.3 million (£27.5 million) (2003 – $59.9 million or £25.8 million (note 9 (i)).
(vi) Airport Improvement Revenue Bonds were issued by the Grapevine Industrial Development Corporation,Grapevine, Texas for amounts of US$8.0 million and US$19.0 million and maturing respectively in 2010 and 2013.Real property improvements, fixtures and specified simulation equipment secure the bonds. The rates are setperiodically by the remarketing agent based on market conditions. For the bonds maturing in 2010, the rate is setweekly and yearly. For the bonds maturing in 2013, the rates are subject to a maximum rate of 10% permissibleunder current applicable laws. As at March 31, 2004, the combined rate for both series was approximately 1.15%.The security is limited to an amount not exceeding the outstanding balance of the loans which representsUS$27.0 million as at March 31, 2004. Also, a letter of credit has been issued to support the bonds for the out-standing amount of the loans.
(vii) The Company, in association with two other partners, arranged project financing for the delivery of training ser-vices on the Astute Class Submarine for the MoD in the United Kingdom. The Company’s participation is 50%.The secured loans consist of a loan of £31.8 million split into three sections, a term loan expiring September 2029,an Equity Bridge loan expiring September 2029 and a Ramp Up Facility expiring August 2004. Interest payableamounts are based on LIBOR plus 0.60% for the term loan and the Equity Bridge loan and LIBOR plus 1.75% forthe Ramp Up Facility. The loans are secured by fixed and floating charges over property and assets of the joint venture. The value, at CAE’s participation of 50%, of the assets pledged is $50.2 million (£20.8 million) as atMarch 31, 2004 (2003 – $39.9 million or £17.2 million).
CAE ANNUAL REPORT 2004 NOTES TO CONSOLIDATED FINANCIAL STATEMENTS 43
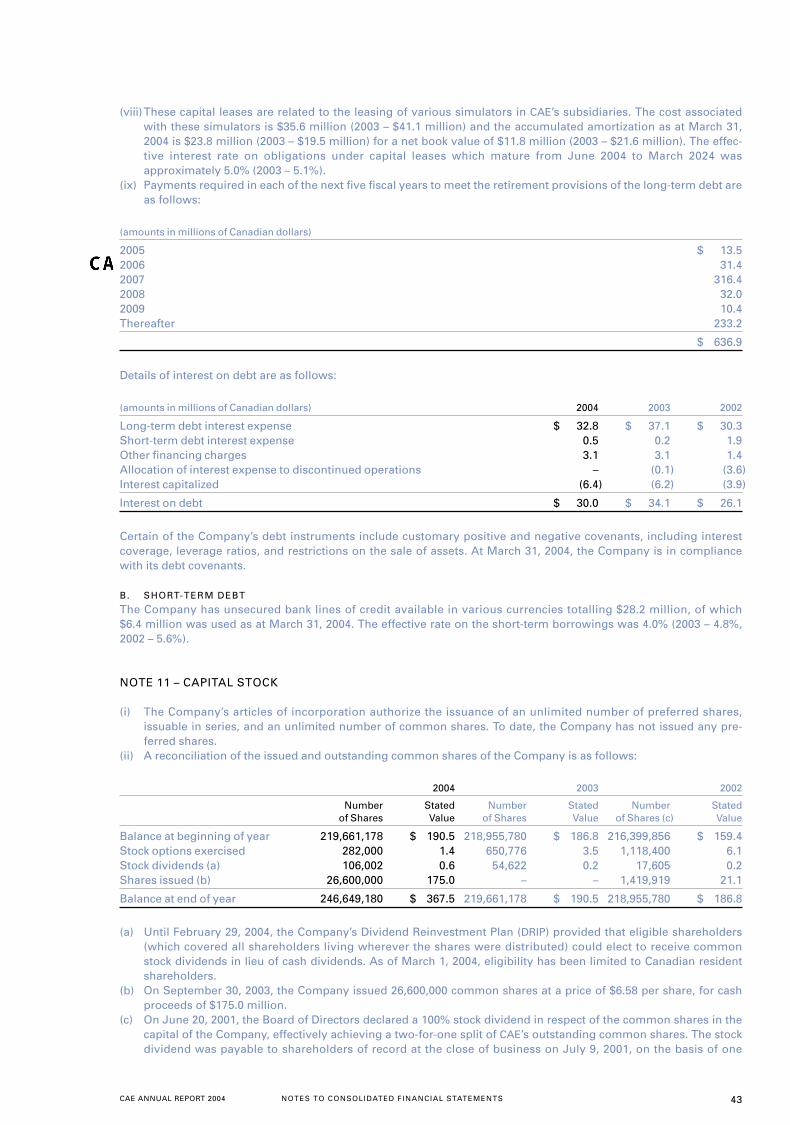
(viii)These capital leases are related to the leasing of various simulators in CAE’s subsidiaries. The cost associatedwith these simulators is $35.6 million (2003 – $41.1 million) and the accumulated amortization as at March 31,2004 is $23.8 million (2003 – $19.5 million) for a net book value of $11.8 million (2003 – $21.6 million). The effec-tive interest rate on obligations under capital leases which mature from June 2004 to March 2024 wasapproximately 5.0% (2003 – 5.1%).
(ix) Payments required in each of the next five fiscal years to meet the retirement provisions of the long-term debt areas follows:
(amounts in millions of Canadian dollars)
2005 $ 13.52006 31.42007 316.42008 32.02009 10.4Thereafter 233.2
$ 636.9
Details of interest on debt are as follows:
(amounts in millions of Canadian dollars) 2004 2003 2002
Long-term debt interest expense $ 32.8 $ 37.1 $ 30.3Short-term debt interest expense 0.5 0.2 1.9Other financing charges 3.1 3.1 1.4Allocation of interest expense to discontinued operations – (0.1) (3.6)Interest capitalized (6.4) (6.2) (3.9)
Interest on debt $ 30.0 $ 34.1 $ 26.1
Certain of the Company’s debt instruments include customary positive and negative covenants, including interestcoverage, leverage ratios, and restrictions on the sale of assets. At March 31, 2004, the Company is in compliancewith its debt covenants.
B. SHORT-TERM DEBT
The Company has unsecured bank lines of credit available in various currencies totalling $28.2 million, of which$6.4 million was used as at March 31, 2004. The effective rate on the short-term borrowings was 4.0% (2003 – 4.8%,2002 – 5.6%).
NOTE 11 – CAPITAL STOCK
(i) The Company’s articles of incorporation authorize the issuance of an unlimited number of preferred shares,issuable in series, and an unlimited number of common shares. To date, the Company has not issued any pre-ferred shares.
(ii) A reconciliation of the issued and outstanding common shares of the Company is as follows:
2004 2003 2002
Number Stated Number Stated Number Stated of Shares Value of Shares Value of Shares (c) Value
Balance at beginning of year 219,661,178 $ 190.5 218,955,780 $ 186.8 216,399,856 $ 159.4Stock options exercised 282,000 1.4 650,776 3.5 1,118,400 6.1Stock dividends (a) 106,002 0.6 54,622 0.2 17,605 0.2Shares issued (b) 26,600,000 175.0 – – 1,419,919 21.1
Balance at end of year 246,649,180 $ 367.5 219,661,178 $ 190.5 218,955,780 $ 186.8
(a) Until February 29, 2004, the Company’s Dividend Reinvestment Plan (DRIP) provided that eligible shareholders(which covered all shareholders living wherever the shares were distributed) could elect to receive commonstock dividends in lieu of cash dividends. As of March 1, 2004, eligibility has been limited to Canadian residentshareholders.
(b) On September 30, 2003, the Company issued 26,600,000 common shares at a price of $6.58 per share, for cashproceeds of $175.0 million.
(c) On June 20, 2001, the Board of Directors declared a 100% stock dividend in respect of the common shares in thecapital of the Company, effectively achieving a two-for-one split of CAE’s outstanding common shares. The stockdividend was payable to shareholders of record at the close of business on July 9, 2001, on the basis of one
44 CAE ANNUAL REPORT 2004NOTES TO CONSOLIDATED FINANCIAL STATEMENTS
additional share for each common share held as of the Record Date. CAE’s common shares commenced tradingon a split basis on July 5, 2001 on the Toronto Stock Exchange. The Company ascribed no monetary value to thestock dividend. The number of shares and options, the option exercise prices and the basic and diluted net earn-ings per share figures have been restated retroactively to reflect the stock dividend.
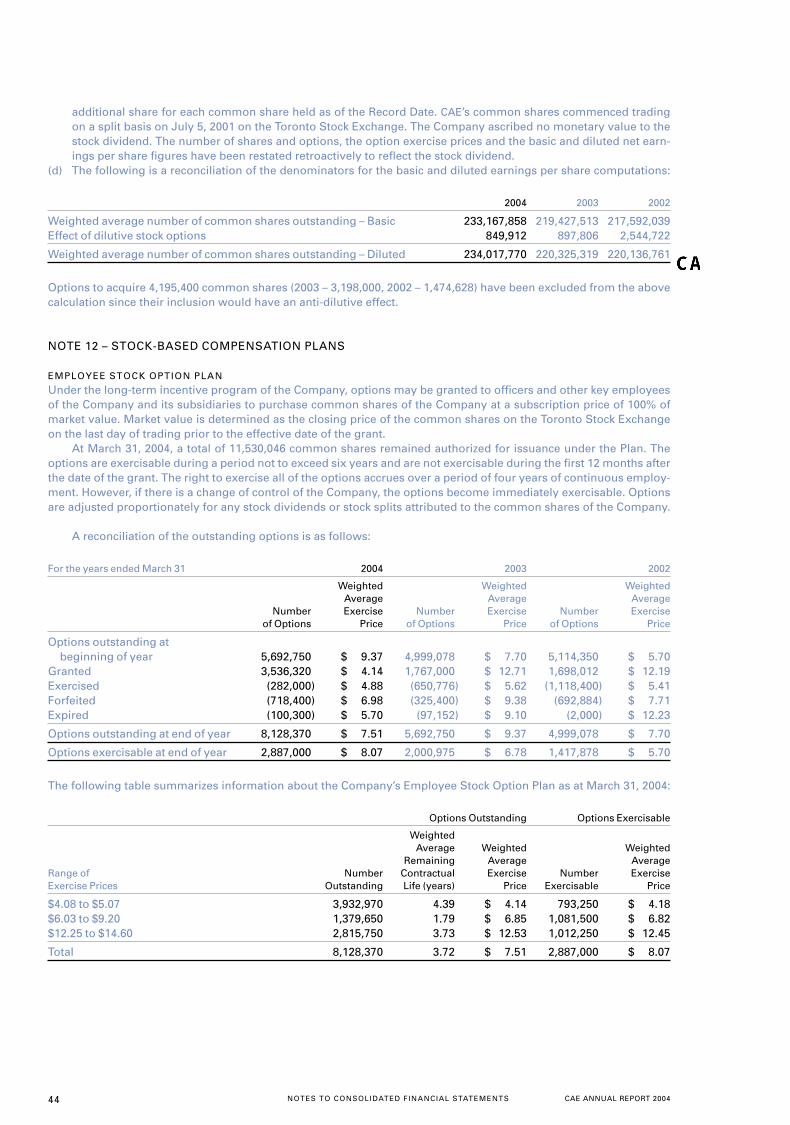
(d) The following is a reconciliation of the denominators for the basic and diluted earnings per share computations:
2004 2003 2002
Weighted average number of common shares outstanding – Basic 233,167,858 219,427,513 217,592,039Effect of dilutive stock options 849,912 897,806 2,544,722
Weighted average number of common shares outstanding – Diluted 234,017,770 220,325,319 220,136,761
Options to acquire 4,195,400 common shares (2003 – 3,198,000, 2002 – 1,474,628) have been excluded from the abovecalculation since their inclusion would have an anti-dilutive effect.
NOTE 12 – STOCK-BASED COMPENSATION PLANS
EMPLOYEE STOCK OPTION PLAN
Under the long-term incentive program of the Company, options may be granted to officers and other key employeesof the Company and its subsidiaries to purchase common shares of the Company at a subscription price of 100% ofmarket value. Market value is determined as the closing price of the common shares on the Toronto Stock Exchangeon the last day of trading prior to the effective date of the grant.
At March 31, 2004, a total of 11,530,046 common shares remained authorized for issuance under the Plan. Theoptions are exercisable during a period not to exceed six years and are not exercisable during the first 12 months afterthe date of the grant. The right to exercise all of the options accrues over a period of four years of continuous employ-ment. However, if there is a change of control of the Company, the options become immediately exercisable. Optionsare adjusted proportionately for any stock dividends or stock splits attributed to the common shares of the Company.
A reconciliation of the outstanding options is as follows:
For the years ended March 31 2004 2003 2002
Weighted Weighted WeightedAverage Average Average
Number Exercise Number Exercise Number Exerciseof Options Price of Options Price of Options Price
Options outstanding at beginning of year 5,692,750 $ 9.37 4,999,078 $ 7.70 5,114,350 $ 5.70
Granted 3,536,320 $ 4.14 1,767,000 $ 12.71 1,698,012 $ 12.19Exercised (282,000) $ 4.88 (650,776) $ 5.62 (1,118,400) $ 5.41Forfeited (718,400) $ 6.98 (325,400) $ 9.38 (692,884) $ 7.71Expired (100,300) $ 5.70 (97,152) $ 9.10 (2,000) $ 12.23
Options outstanding at end of year 8,128,370 $ 7.51 5,692,750 $ 9.37 4,999,078 $ 7.70
Options exercisable at end of year 2,887,000 $ 8.07 2,000,975 $ 6.78 1,417,878 $ 5.70
The following table summarizes information about the Company’s Employee Stock Option Plan as at March 31, 2004:
Options Outstanding Options Exercisable
WeightedAverage Weighted Weighted
Remaining Average AverageRange of Number Contractual Exercise Number ExerciseExercise Prices Outstanding Life (years) Price Exercisable Price
$4.08 to $5.07 3,932,970 4.39 $ 4.14 793,250 $ 4.18$6.03 to $9.20 1,379,650 1.79 $ 6.85 1,081,500 $ 6.82 $12.25 to $14.60 2,815,750 3.73 $ 12.53 1,012,250 $ 12.45
Total 8,128,370 3.72 $ 7.51 2,887,000 $ 8.07
CAE ANNUAL REPORT 2004 NOTES TO CONSOLIDATED FINANCIAL STATEMENTS 45
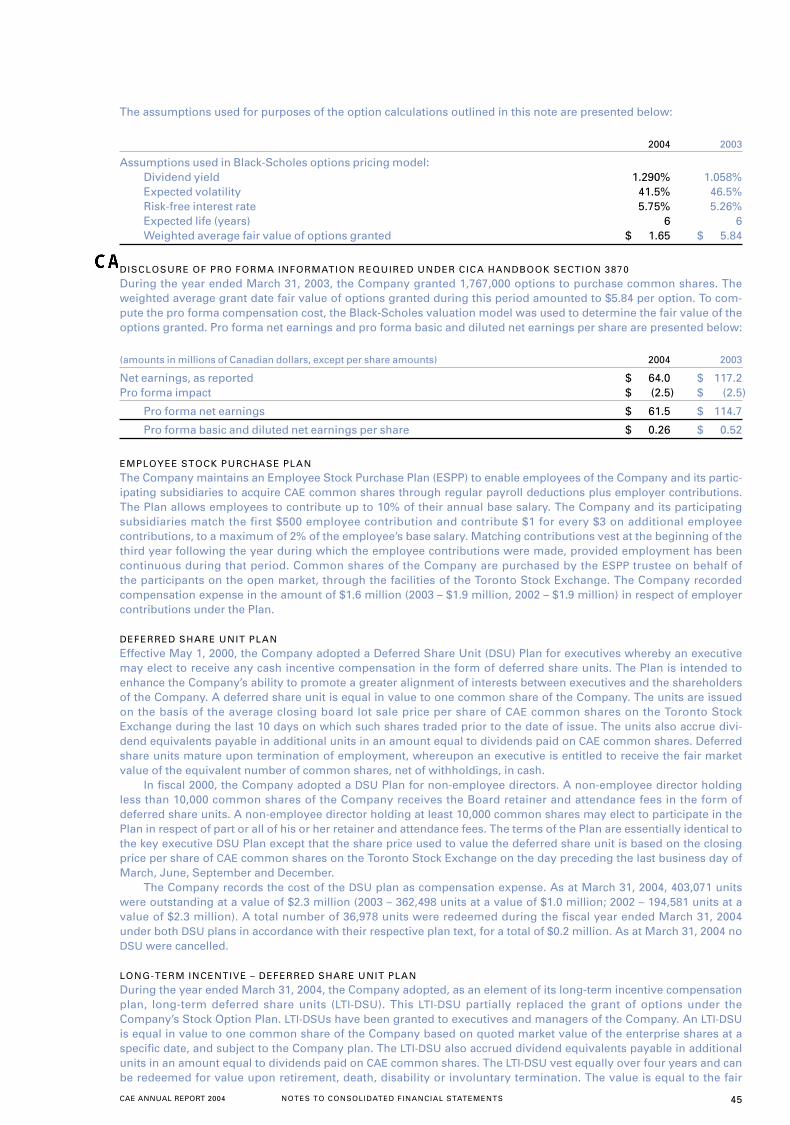
The assumptions used for purposes of the option calculations outlined in this note are presented below:
2004 2003
Assumptions used in Black-Scholes options pricing model:Dividend yield 1.290% 1.058%Expected volatility 41.5% 46.5%Risk-free interest rate 5.75% 5.26%Expected life (years) 6 6Weighted average fair value of options granted $ 1.65 $ 5.84
DISCLOSURE OF PRO FORMA INFORMATION REQUIRED UNDER CICA HANDBOOK SECTION 3870
During the year ended March 31, 2003, the Company granted 1,767,000 options to purchase common shares. Theweighted average grant date fair value of options granted during this period amounted to $5.84 per option. To com-pute the pro forma compensation cost, the Black-Scholes valuation model was used to determine the fair value of theoptions granted. Pro forma net earnings and pro forma basic and diluted net earnings per share are presented below:
(amounts in millions of Canadian dollars, except per share amounts) 2004 2003
Net earnings, as reported $ 64.0 $ 117.2Pro forma impact $ (2.5) $ (2.5)
Pro forma net earnings $ 61.5 $ 114.7
Pro forma basic and diluted net earnings per share $ 0.26 $ 0.52
EMPLOYEE STOCK PURCHASE PLAN
The Company maintains an Employee Stock Purchase Plan (ESPP) to enable employees of the Company and its partic-ipating subsidiaries to acquire CAE common shares through regular payroll deductions plus employer contributions.The Plan allows employees to contribute up to 10% of their annual base salary. The Company and its participatingsubsidiaries match the first $500 employee contribution and contribute $1 for every $3 on additional employeecontributions, to a maximum of 2% of the employee’s base salary. Matching contributions vest at the beginning of thethird year following the year during which the employee contributions were made, provided employment has beencontinuous during that period. Common shares of the Company are purchased by the ESPP trustee on behalf ofthe participants on the open market, through the facilities of the Toronto Stock Exchange. The Company recordedcompensation expense in the amount of $1.6 million (2003 – $1.9 million, 2002 – $1.9 million) in respect of employercontributions under the Plan.
DEFERRED SHARE UNIT PLAN
Effective May 1, 2000, the Company adopted a Deferred Share Unit (DSU) Plan for executives whereby an executivemay elect to receive any cash incentive compensation in the form of deferred share units. The Plan is intended toenhance the Company’s ability to promote a greater alignment of interests between executives and the shareholdersof the Company. A deferred share unit is equal in value to one common share of the Company. The units are issuedon the basis of the average closing board lot sale price per share of CAE common shares on the Toronto StockExchange during the last 10 days on which such shares traded prior to the date of issue. The units also accrue divi-dend equivalents payable in additional units in an amount equal to dividends paid on CAE common shares. Deferredshare units mature upon termination of employment, whereupon an executive is entitled to receive the fair marketvalue of the equivalent number of common shares, net of withholdings, in cash.
In fiscal 2000, the Company adopted a DSU Plan for non-employee directors. A non-employee director holdingless than 10,000 common shares of the Company receives the Board retainer and attendance fees in the form ofdeferred share units. A non-employee director holding at least 10,000 common shares may elect to participate in thePlan in respect of part or all of his or her retainer and attendance fees. The terms of the Plan are essentially identical tothe key executive DSU Plan except that the share price used to value the deferred share unit is based on the closingprice per share of CAE common shares on the Toronto Stock Exchange on the day preceding the last business day ofMarch, June, September and December.
The Company records the cost of the DSU plan as compensation expense. As at March 31, 2004, 403,071 unitswere outstanding at a value of $2.3 million (2003 – 362,498 units at a value of $1.0 million; 2002 – 194,581 units at avalue of $2.3 million). A total number of 36,978 units were redeemed during the fiscal year ended March 31, 2004under both DSU plans in accordance with their respective plan text, for a total of $0.2 million. As at March 31, 2004 noDSU were cancelled.
LONG-TERM INCENTIVE – DEFERRED SHARE UNIT PLAN
During the year ended March 31, 2004, the Company adopted, as an element of its long-term incentive compensationplan, long-term deferred share units (LTI-DSU). This LTI-DSU partially replaced the grant of options under theCompany’s Stock Option Plan. LTI-DSUs have been granted to executives and managers of the Company. An LTI-DSUis equal in value to one common share of the Company based on quoted market value of the enterprise shares at aspecific date, and subject to the Company plan. The LTI-DSU also accrued dividend equivalents payable in additionalunits in an amount equal to dividends paid on CAE common shares. The LTI-DSU vest equally over four years and canbe redeemed for value upon retirement, death, disability or involuntary termination. The value is equal to the fair
46 CAE ANNUAL REPORT 2004NOTES TO CONSOLIDATED FINANCIAL STATEMENTS
market value of the equivalent number of common shares of the Company, net of withholdings, in cash. In May 2003,the Company issued 1,441,011 LTI-DSU units. The expense recorded in fiscal 2004 with respect to these units was$1.4 million. On March 15, 2004, the Company entered into a hedging contract to reduce its earnings exposure to thefluctuations in the Company’s share price (see note 13).
NOTE 13 – FINANCIAL INSTRUMENTS
FOREIGN CURRENCY RISK
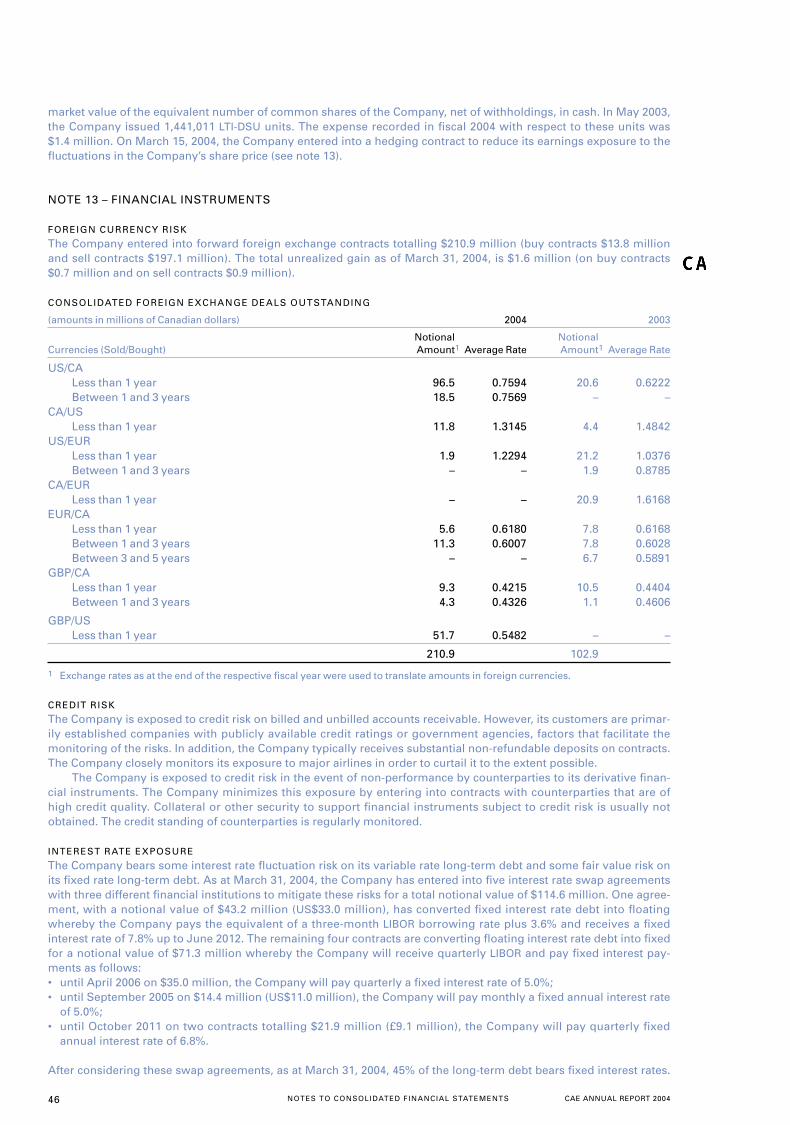
The Company entered into forward foreign exchange contracts totalling $210.9 million (buy contracts $13.8 millionand sell contracts $197.1 million). The total unrealized gain as of March 31, 2004, is $1.6 million (on buy contracts$0.7 million and on sell contracts $0.9 million).
CONSOLIDATED FOREIGN EXCHANGE DEALS OUTSTANDING
(amounts in millions of Canadian dollars) 2004 2003
Notional NotionalCurrencies (Sold/Bought) Amount1 Average Rate Amount1 Average Rate
US/CALess than 1 year 96.5 0.7594 20.6 0.6222Between 1 and 3 years 18.5 0.7569 – –
CA/USLess than 1 year 11.8 1.3145 4.4 1.4842
US/EURLess than 1 year 1.9 1.2294 21.2 1.0376Between 1 and 3 years – – 1.9 0.8785
CA/EURLess than 1 year – – 20.9 1.6168
EUR/CALess than 1 year 5.6 0.6180 7.8 0.6168Between 1 and 3 years 11.3 0.6007 7.8 0.6028Between 3 and 5 years – – 6.7 0.5891
GBP/CALess than 1 year 9.3 0.4215 10.5 0.4404Between 1 and 3 years 4.3 0.4326 1.1 0.4606
GBP/USLess than 1 year 51.7 0.5482 – –
210.9 102.9
1 Exchange rates as at the end of the respective fiscal year were used to translate amounts in foreign currencies.
CREDIT RISK
The Company is exposed to credit risk on billed and unbilled accounts receivable. However, its customers are primar-ily established companies with publicly available credit ratings or government agencies, factors that facilitate themonitoring of the risks. In addition, the Company typically receives substantial non-refundable deposits on contracts.The Company closely monitors its exposure to major airlines in order to curtail it to the extent possible.
The Company is exposed to credit risk in the event of non-performance by counterparties to its derivative finan-cial instruments. The Company minimizes this exposure by entering into contracts with counterparties that are ofhigh credit quality. Collateral or other security to support financial instruments subject to credit risk is usually notobtained. The credit standing of counterparties is regularly monitored.
INTEREST RATE EXPOSURE
The Company bears some interest rate fluctuation risk on its variable rate long-term debt and some fair value risk onits fixed rate long-term debt. As at March 31, 2004, the Company has entered into five interest rate swap agreementswith three different financial institutions to mitigate these risks for a total notional value of $114.6 million. One agree-ment, with a notional value of $43.2 million (US$33.0 million), has converted fixed interest rate debt into floatingwhereby the Company pays the equivalent of a three-month LIBOR borrowing rate plus 3.6% and receives a fixedinterest rate of 7.8% up to June 2012. The remaining four contracts are converting floating interest rate debt into fixedfor a notional value of $71.3 million whereby the Company will receive quarterly LIBOR and pay fixed interest pay-ments as follows:• until April 2006 on $35.0 million, the Company will pay quarterly a fixed interest rate of 5.0%;• until September 2005 on $14.4 million (US$11.0 million), the Company will pay monthly a fixed annual interest rate
of 5.0%;• until October 2011 on two contracts totalling $21.9 million (£9.1 million), the Company will pay quarterly fixed
annual interest rate of 6.8%.
After considering these swap agreements, as at March 31, 2004, 45% of the long-term debt bears fixed interest rates.
CAE ANNUAL REPORT 2004 NOTES TO CONSOLIDATED FINANCIAL STATEMENTS 47
STOCK BASED COMPENSATION COST
In March 2004, the Company entered into an equity swap agreement with a major Canadian institution to reduce itscash and earnings exposure to fluctuation in the Company’s share price relating to the DSU and LTI-DSU programs.Pursuant to the agreement, the Company receives on a monthly basis the economic benefit of dividends and shareprice appreciation while providing payments to the financial institution for the institution’s cost of funds and anyshare price depreciation. The net effect of the equity swap partially offsets movements in the Company’s share priceimpacting the cost of the DSU and LTI-DSU programs. As at March 31, 2004, the equity swap agreement covered700,000 shares of the Company.
FAIR VALUE OF FINANCIAL INSTRUMENTS
The following methods and assumptions have been used to estimate the fair value of the financial instruments:• cash and short-term investments, accounts receivable, accounts payable and accrued liabilities are valued at their
carrying amounts on the balance sheet, which represent an appropriate estimate of their fair values due to theirnear-term maturities;
• capital leases are valued using the discounted cash flow method;• long-term debt value is estimated based on discounted cash flows using current interest rates for debt with similar
terms and remaining maturities;• interest rate and currency swap contracts reflect the present value of the potential gain or loss if settlement were to
take place at the balance sheet date;• the forward foreign exchange contracts are represented by the estimated amounts that the Company would receive
or pay to settle the contracts at the balance sheet date.
The fair value and the carrying amount of the financial instruments as at March 31 is as follows:
(amounts in millions of Canadian dollars) 2004 2003
Carrying CarryingFair Value Amount Fair Value Amount
Long-term debt $ 664.6 $ 636.9 $ 837.8 $ 811.4Net forward foreign exchange contracts 1.6 – 2.7 –Interest rate swap contracts (2.6) – (10.3) –
LETTERS OF CREDIT AND GUARANTEES
As at March 31, 2004, CAE had outstanding letters of credit and performance guarantees in the amount of $207.7 mil-lion (2003 – $195.1 million) issued in the normal course of business. These guarantees are issued under standbyfacilities available to the Company through various financial institutions.
The advance payment guarantees are related to progress/milestone payments made by our customers and arereduced or eliminated upon delivery of the product. The contract performance guarantees are linked to the comple-tion of the intended product or service rendered by CAE and at the satisfaction of the customer. It represents 10% to20% of the overall contract amount. The customer releases the Company from these guarantees at the signature of acertificate of completion. The operating lease obligation provides credit support for the benefit of the owner partici-pant in the September 30, 2003 sale and leaseback transaction.
(amounts in millions of Canadian dollars) 2004 2003
Advance payment $ 146.4 $ 159.9Contract performance 22.5 32.4Operating lease obligation 31.1 –Others 7.7 2.8
Total $ 207.7 $ 195.1
RESIDUAL VALUE GUARANTEES – SALE AND LEASEBACK TRANSACTIONS
Following certain sale and leaseback transactions, the Company has agreed to guarantee the residual value of theunderlying equipment in the event that the equipment is returned to the lessor and the net proceeds of any eventualsale do not cover the guaranteed amount. The maximum amount of exposure is $52.3 million of which $22.6 millionmatures in 2007, $12.3 million matures in 2008, $8.2 million in 2020 and $9.2 million in 2023. Of this amount, as atMarch 31, 2004, $33.1 million is recorded as deferred gain (2003 – $22.6 million).
INDEMNIFICATIONS
In certain instances when CAE sells businesses, the Company may retain certain liabilities for known exposures andprovide indemnification to the buyer with respect to future claims for certain unknown liabilities existing, or arisingfrom events occurring, prior to the sale date, including liabilities for taxes, legal matters, environmental exposures,product liability, and other obligations. The terms of the indemnifications vary in duration, from one to two yearsfor certain types of indemnities, terms for tax indemnifications that are generally aligned to the applicable statute oflimitations for the jurisdiction in which the divestiture occurred, and terms for environmental liabilities that typicallydo not expire. The maximum potential future payments that the Company could be required to make under these
48 CAE ANNUAL REPORT 2004NOTES TO CONSOLIDATED FINANCIAL STATEMENTS
indemnifications are either contractually limited to a specified amount or unlimited. The Company believes that themaximum potential future payments that the Company could be required to make under these indemnifications arenot determinable at this time, as any future payments would be dependent on the type and extent of the relatedclaims, and all available defences, which are not estimable. However, costs incurred to settle claims related to theseindemnifications have not been material to the Company’s financial position, results of operations or cash flows.
NOTE 14 – INCOME TAXES
A reconciliation of income taxes at Canadian statutory rates with the reported income taxes is as follows:
(amounts in millions of Canadian dollars) 2004 2003 2002
Earnings before income taxes and discontinued operations $ 87.7 $ 191.2 $ 218.3
Statutory income tax rates in Canada 32.8% 34.7% 37.4%Income taxes at Canadian statutory rates $ 28.7 $ 66.3 $ 81.6Difference between Canadian statutory rates and those
applicable to foreign subsidiaries (2.7) 0.7 5.3Manufacturing and processing allowance (0.5) (3.5) (13.1)Losses not tax effected 0.2 1.0 11.0Tax benefit of losses not previously recognized (5.6) (1.1) (6.7)Non-taxable capital gain (0.2) (0.7) (9.0)Non-deductible items 3.3 (0.4) 1.8Prior years’ tax adjustments and assessments (3.6) (0.9) 1.1Impact of change in income tax rates on future income taxes 0.7 (1.7) 0.4Non-taxable research and development tax credits (0.6) (0.5) (3.0)Other 0.9 1.0 0.5
Total income tax expense $ 20.6 $ 60.2 $ 69.9
Significant components of the provision for income tax expense attributable to continuing operations are as follows:
(amounts in millions of Canadian dollars) 2004 2003 2002
Current income tax expense $ 17.0 $ 41.4 $ 62.8Future income tax expense 3.6 18.8 7.1
Total income tax expense $ 20.6 $ 60.2 $ 69.9
The tax effects of temporary differences that gave rise to future tax liabilities and assets are as follows:
(amounts in millions of Canadian dollars) 2004 2003
Non-capital loss carryforwards $ 76.9 $ 91.1Capital loss carryforwards 0.9 –Investment tax credits (14.3) (18.9) Property, plant and equipment (62.2) (56.0) Employee pension plans – (2.0) Amounts not currently deductible 13.7 21.1Percentage of completion versus completed contract (45.3) (35.2) Other 11.6 (2.8)
$ (18.7) $ (2.7)
Valuation allowance (26.6) (31.0)
Net future income tax liabilities $ (45.3) $ (33.7)
As of March 31, 2004, the Company has accumulated non-capital losses carried forward relating to operations in theUnited States for approximately $171.3 million (US$130.7 million). For financial reporting purposes, a net future taxincome asset of $38.6 million (US$29.5 million) has been recognized in respect of these loss carryforwards.
The Company has accumulated non-capital tax losses carried forward relating to its operations in other countriesof approximately $57.4 million. For financial reporting purposes, a net future income tax asset of $11.7 million hasbeen recognized.
CAE ANNUAL REPORT 2004 NOTES TO CONSOLIDATED FINANCIAL STATEMENTS 49
The losses for income tax purposes expire as follows:
(amounts in millions of Canadian dollars)
Other United States Countries
Year of expiration (US$) (C$)
2005 – –2006 16.5 –2007 44.5 –2008 27.2 –2009 6.0 –2010–2021 36.5 14.5No expiration – 42.9
130.7 57.4
The valuation allowance relates principally to loss carryforward benefits where realization is not likely due to a historyof loss carryforwards and to the uncertainty of sufficient taxable earnings in the future, together with time limitationsin the tax legislation giving rise to the potential benefit. In 2004, $5.7 million (2003 – $21.1 million) of the valuationallowance balance was reversed when it became more likely than not that benefits would be realized.
NOTE 15 – DEFERRED GAINS AND OTHER LONG-TERM LIABILITIES
(amounts in millions of Canadian dollars) 2004 2003
Deferred gains on sale and leasebacks (i) $ 90.5 $ 75.6Deferred revenue and gains 33.9 33.1Long-term portion of employee benefits obligation 10.9 11.2Government cost sharing (note 18) 7.2 4.6Other 13.1 15.1
$ 155.6 $ 139.6
(i) The related amortization for the year amounts to $3.2 million (2003 – $2.1 million).
NOTE 16 – SUPPLEMENTARY CASH FLOW INFORMATION
Cash provided by (used in) non-cash working capital is as follows:
(amounts in millions of Canadian dollars) 2004 2003 2002
Accounts receivable $ (21.3) $ 22.3 $ (50.4)Inventories (19.0) (3.1) (23.8)Prepaid expenses (6.6) (6.0) 1.9Income taxes recoverable 4.8 23.1 36.9Accounts payable and accrued liabilities (56.4) 13.7 27.9Deposits on contracts (8.7) (91.3) (0.1)
$ (107.2) $ (41.3) $ (7.6)
Interest paid $ 41.0 $ 38.8 $ 25.3Income taxes paid $ 8.3 $ 3.5 $ 8.2Amortization of other assets $ 13.1 $ 8.8 $ 3.2
NOTE 17 – CONTINGENCIES
Through the normal course of operations, the Company is party to a number of lawsuits, claims and contingencies.Accruals are made in instances where it is probable that liabilities will be incurred and where such liabilities can bereasonably estimated. Although it is possible that liabilities may be incurred in instances for which no accruals havebeen made, the Company has no reason to believe that the ultimate outcome of these matters will have a materialimpact on its financial position.
50 CAE ANNUAL REPORT 2004NOTES TO CONSOLIDATED FINANCIAL STATEMENTS
NOTE 18 – GOVERNMENT COST SHARING
The Company has signed agreements with the Government of Canada whereby the latter shares in the cost, based onexpenditures incurred by the Company, of certain research and development programs for visual systems andadvanced flight simulation technology for civil applications and networked simulation for military applications.Funding in the amount of $31.2 million related to the visual research and development programs was completed in2001. Royalty payments for this program are estimated at $0.4 million in fiscal 2004 (2003 – $1.6 million). In fiscal 2002,funding of $41.4 million was approved for advanced civil flight simulation. In fiscal 2003, funding of $39.0 million wasalso approved to develop a military network simulation. The Company provided for $10.2 million of future repay-ments on these two programs in fiscal 2004. Funding for these programs is based on expenditures incurred by theCompany. The amount of funding received in fiscal 2004 was $5.4 million (2003 – $20.2 million, 2002 – $15.8 million)and is now complete for the civil program and $8.5 million (2003 – $12.3 million, 2002 – nil) for the military program.
These programs are repayable in the form of royalties to March 2013 based on future sales. The maximumamount of royalties payable under the visual program is $41.4 million. The maximum payment under the civil or mili-tary simulation programs, based on future sales, is $66.0 million and $53.6 million respectively.
NOTE 19 – OPERATING LEASE COMMITMENTS
Future minimum lease payments under operating leases are as follows:
Civil Military Simulation Simulation Marine
(amounts in millions of Canadian dollars) and Training and Training Controls Total
Years ending March 31,2005 $ 53.0 $ 37.8 $ 1.4 $ 92.22006 50.6 32.9 1.1 84.62007 65.2 24.1 0.2 89.52008 52.7 23.6 0.1 76.42009 35.5 22.8 0.1 58.4Thereafter 313.5 100.1 0.1 413.7
$ 570.5 $ 241.3 $ 3.0 $ 814.8
NOTE 20 – PENSIONS
The Company has two registered defined benefit plans in Canada (one for employees and one for designated execu-tives) that provide benefits based on length of service and final average earnings. In addition, the Company maintainsa supplemental arrangement to provide defined benefits for designated executives. This supplemental arrangementis solely the obligation of the Company and there is no requirement to fund it. The Company, however, is obligated topay the benefits when they become due. Once the designated executive retires from the Company, the Company isrequired to secure the obligation for that executive. As at March 31, 2004, the Company has issued letters of credittotalling $11.9 million to secure the obligations under the Supplementary Plan.
Contributions reflect actuarial assumptions concerning future investment returns, salary projections and futureservice benefits. Plan assets are represented primarily by Canadian and foreign equities and government and corpo-rate bonds.
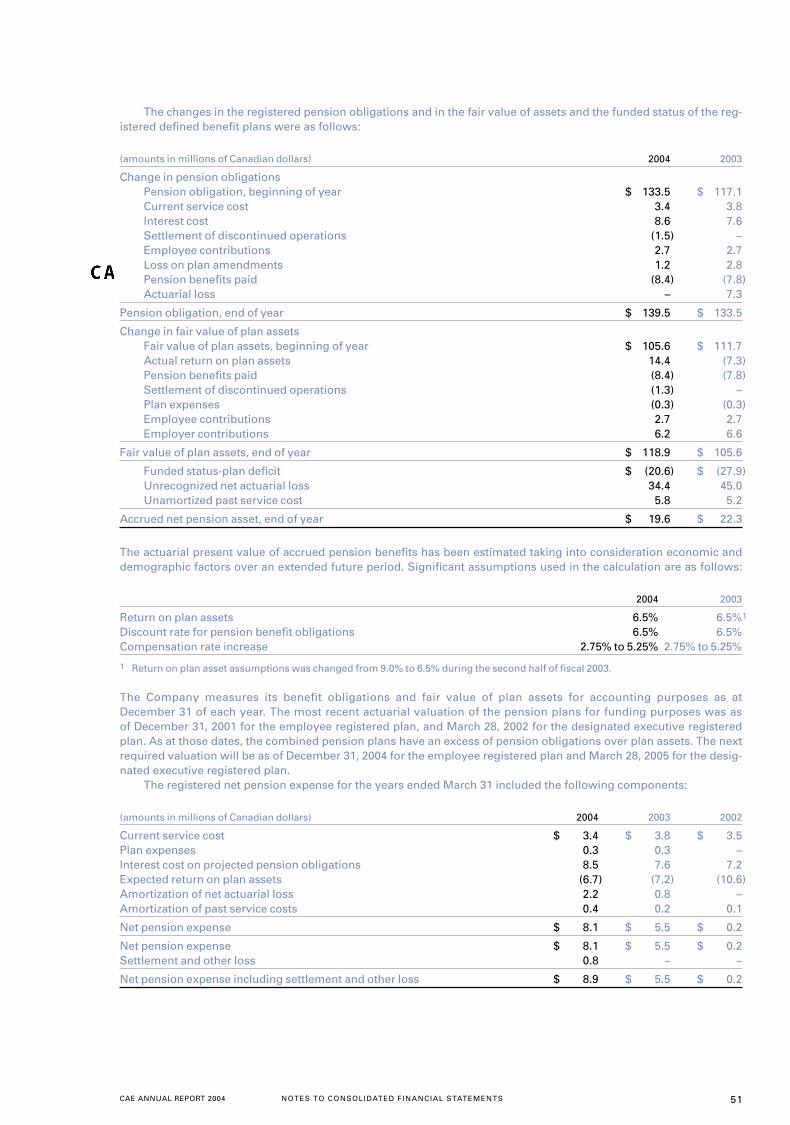
CAE ANNUAL REPORT 2004 NOTES TO CONSOLIDATED FINANCIAL STATEMENTS 51
The changes in the registered pension obligations and in the fair value of assets and the funded status of the reg-istered defined benefit plans were as follows:
(amounts in millions of Canadian dollars) 2004 2003
Change in pension obligationsPension obligation, beginning of year $ 133.5 $ 117.1Current service cost 3.4 3.8Interest cost 8.6 7.6Settlement of discontinued operations (1.5) –Employee contributions 2.7 2.7Loss on plan amendments 1.2 2.8Pension benefits paid (8.4) (7.8)Actuarial loss – 7.3
Pension obligation, end of year $ 139.5 $ 133.5
Change in fair value of plan assetsFair value of plan assets, beginning of year $ 105.6 $ 111.7Actual return on plan assets 14.4 (7.3)Pension benefits paid (8.4) (7.8)Settlement of discontinued operations (1.3) –Plan expenses (0.3) (0.3)Employee contributions 2.7 2.7Employer contributions 6.2 6.6
Fair value of plan assets, end of year $ 118.9 $ 105.6
Funded status-plan deficit $ (20.6) $ (27.9)Unrecognized net actuarial loss 34.4 45.0Unamortized past service cost 5.8 5.2
Accrued net pension asset, end of year $ 19.6 $ 22.3
The actuarial present value of accrued pension benefits has been estimated taking into consideration economic anddemographic factors over an extended future period. Significant assumptions used in the calculation are as follows:
2004 2003
Return on plan assets 6.5% 6.5%1
Discount rate for pension benefit obligations 6.5% 6.5%Compensation rate increase 2.75% to 5.25% 2.75% to 5.25%
1 Return on plan asset assumptions was changed from 9.0% to 6.5% during the second half of fiscal 2003.
The Company measures its benefit obligations and fair value of plan assets for accounting purposes as atDecember 31 of each year. The most recent actuarial valuation of the pension plans for funding purposes was asof December 31, 2001 for the employee registered plan, and March 28, 2002 for the designated executive registeredplan. As at those dates, the combined pension plans have an excess of pension obligations over plan assets. The nextrequired valuation will be as of December 31, 2004 for the employee registered plan and March 28, 2005 for the desig-nated executive registered plan.
The registered net pension expense for the years ended March 31 included the following components:
(amounts in millions of Canadian dollars) 2004 2003 2002
Current service cost $ 3.4 $ 3.8 $ 3.5Plan expenses 0.3 0.3 –Interest cost on projected pension obligations 8.5 7.6 7.2Expected return on plan assets (6.7) (7.2) (10.6)Amortization of net actuarial loss 2.2 0.8 –Amortization of past service costs 0.4 0.2 0.1
Net pension expense $ 8.1 $ 5.5 $ 0.2
Net pension expense $ 8.1 $ 5.5 $ 0.2Settlement and other loss 0.8 – –
Net pension expense including settlement and other loss $ 8.9 $ 5.5 $ 0.2
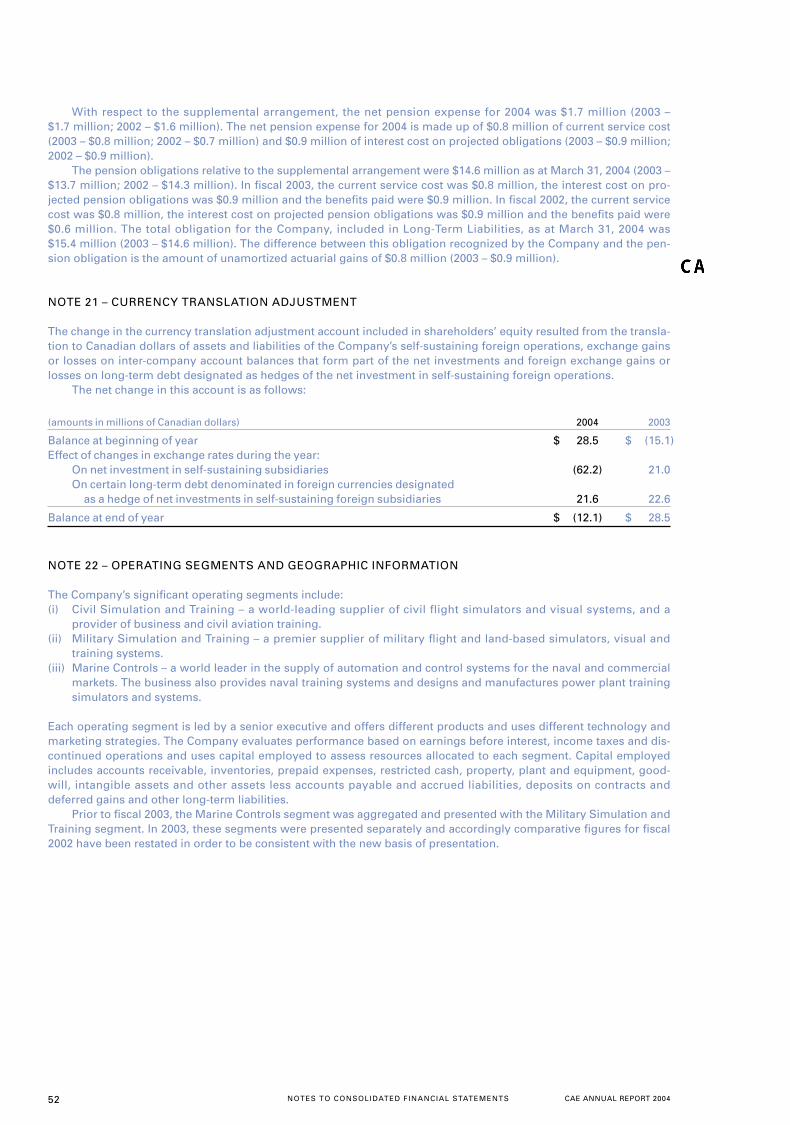
52 CAE ANNUAL REPORT 2004NOTES TO CONSOLIDATED FINANCIAL STATEMENTS
With respect to the supplemental arrangement, the net pension expense for 2004 was $1.7 million (2003 –$1.7 million; 2002 – $1.6 million). The net pension expense for 2004 is made up of $0.8 million of current service cost(2003 – $0.8 million; 2002 – $0.7 million) and $0.9 million of interest cost on projected obligations (2003 – $0.9 million;2002 – $0.9 million).
The pension obligations relative to the supplemental arrangement were $14.6 million as at March 31, 2004 (2003 –$13.7 million; 2002 – $14.3 million). In fiscal 2003, the current service cost was $0.8 million, the interest cost on pro-jected pension obligations was $0.9 million and the benefits paid were $0.9 million. In fiscal 2002, the current servicecost was $0.8 million, the interest cost on projected pension obligations was $0.9 million and the benefits paid were$0.6 million. The total obligation for the Company, included in Long-Term Liabilities, as at March 31, 2004 was$15.4 million (2003 – $14.6 million). The difference between this obligation recognized by the Company and the pen-sion obligation is the amount of unamortized actuarial gains of $0.8 million (2003 – $0.9 million).
NOTE 21 – CURRENCY TRANSLATION ADJUSTMENT
The change in the currency translation adjustment account included in shareholders’ equity resulted from the transla-tion to Canadian dollars of assets and liabilities of the Company’s self-sustaining foreign operations, exchange gainsor losses on inter-company account balances that form part of the net investments and foreign exchange gains orlosses on long-term debt designated as hedges of the net investment in self-sustaining foreign operations.
The net change in this account is as follows:
(amounts in millions of Canadian dollars) 2004 2003
Balance at beginning of year $ 28.5 $ (15.1)Effect of changes in exchange rates during the year:
On net investment in self-sustaining subsidiaries (62.2) 21.0On certain long-term debt denominated in foreign currencies designated
as a hedge of net investments in self-sustaining foreign subsidiaries 21.6 22.6
Balance at end of year $ (12.1) $ 28.5
NOTE 22 – OPERATING SEGMENTS AND GEOGRAPHIC INFORMATION
The Company’s significant operating segments include:(i) Civil Simulation and Training – a world-leading supplier of civil flight simulators and visual systems, and a
provider of business and civil aviation training.(ii) Military Simulation and Training – a premier supplier of military flight and land-based simulators, visual and
training systems.(iii) Marine Controls – a world leader in the supply of automation and control systems for the naval and commercial
markets. The business also provides naval training systems and designs and manufactures power plant trainingsimulators and systems.
Each operating segment is led by a senior executive and offers different products and uses different technology andmarketing strategies. The Company evaluates performance based on earnings before interest, income taxes and dis-continued operations and uses capital employed to assess resources allocated to each segment. Capital employedincludes accounts receivable, inventories, prepaid expenses, restricted cash, property, plant and equipment, good-will, intangible assets and other assets less accounts payable and accrued liabilities, deposits on contracts anddeferred gains and other long-term liabilities.
Prior to fiscal 2003, the Marine Controls segment was aggregated and presented with the Military Simulation andTraining segment. In 2003, these segments were presented separately and accordingly comparative figures for fiscal2002 have been restated in order to be consistent with the new basis of presentation.
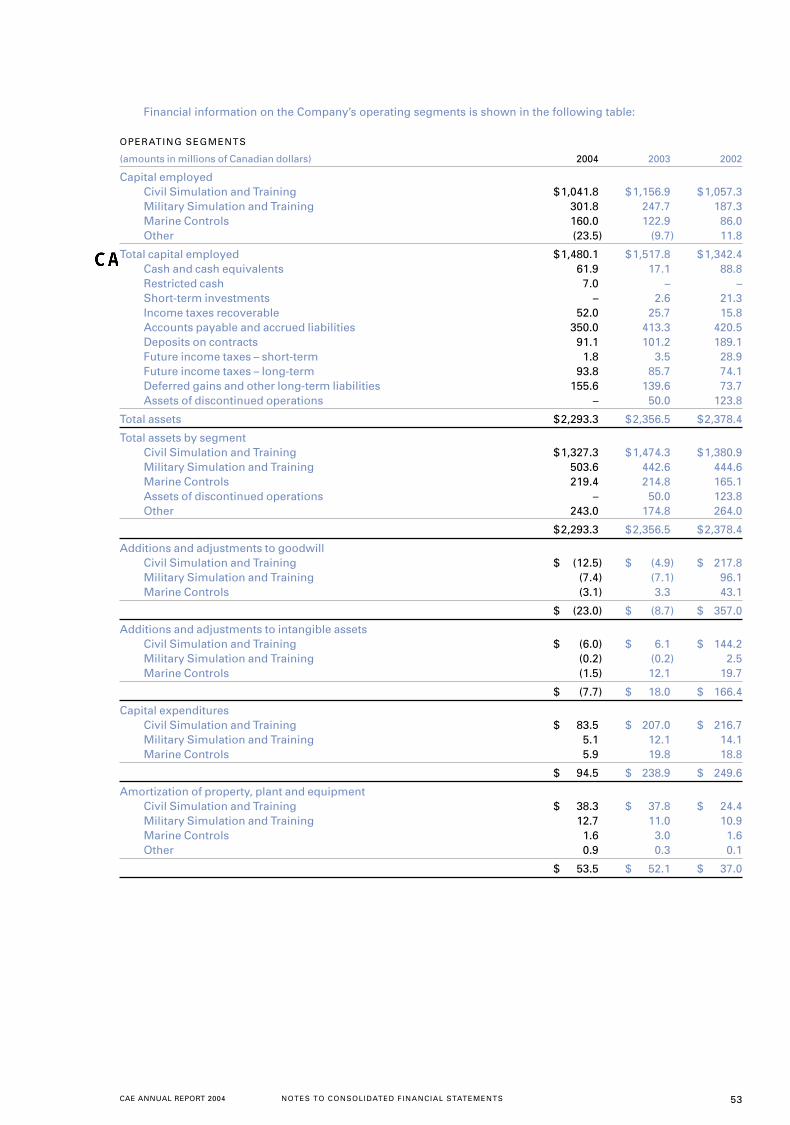
CAE ANNUAL REPORT 2004 NOTES TO CONSOLIDATED FINANCIAL STATEMENTS 53
Financial information on the Company’s operating segments is shown in the following table:
OPERATING SEGMENTS
(amounts in millions of Canadian dollars) 2004 2003 2002
Capital employedCivil Simulation and Training $1,041.8 $1,156.9 $1,057.3Military Simulation and Training 301.8 247.7 187.3Marine Controls 160.0 122.9 86.0Other (23.5) (9.7) 11.8
Total capital employed $1,480.1 $1,517.8 $1,342.4Cash and cash equivalents 61.9 17.1 88.8Restricted cash 7.0 – –Short-term investments – 2.6 21.3Income taxes recoverable 52.0 25.7 15.8Accounts payable and accrued liabilities 350.0 413.3 420.5Deposits on contracts 91.1 101.2 189.1Future income taxes – short-term 1.8 3.5 28.9Future income taxes – long-term 93.8 85.7 74.1Deferred gains and other long-term liabilities 155.6 139.6 73.7Assets of discontinued operations – 50.0 123.8
Total assets $2,293.3 $2,356.5 $2,378.4
Total assets by segmentCivil Simulation and Training $1,327.3 $1,474.3 $1,380.9Military Simulation and Training 503.6 442.6 444.6Marine Controls 219.4 214.8 165.1Assets of discontinued operations – 50.0 123.8Other 243.0 174.8 264.0
$2,293.3 $2,356.5 $2,378.4
Additions and adjustments to goodwillCivil Simulation and Training $ (12.5) $ (4.9) $ 217.8Military Simulation and Training (7.4) (7.1) 96.1Marine Controls (3.1) 3.3 43.1
$ (23.0) $ (8.7) $ 357.0
Additions and adjustments to intangible assetsCivil Simulation and Training $ (6.0) $ 6.1 $ 144.2Military Simulation and Training (0.2) (0.2) 2.5Marine Controls (1.5) 12.1 19.7
$ (7.7) $ 18.0 $ 166.4
Capital expendituresCivil Simulation and Training $ 83.5 $ 207.0 $ 216.7Military Simulation and Training 5.1 12.1 14.1Marine Controls 5.9 19.8 18.8
$ 94.5 $ 238.9 $ 249.6
Amortization of property, plant and equipmentCivil Simulation and Training $ 38.3 $ 37.8 $ 24.4Military Simulation and Training 12.7 11.0 10.9Marine Controls 1.6 3.0 1.6Other 0.9 0.3 0.1
$ 53.5 $ 52.1 $ 37.0
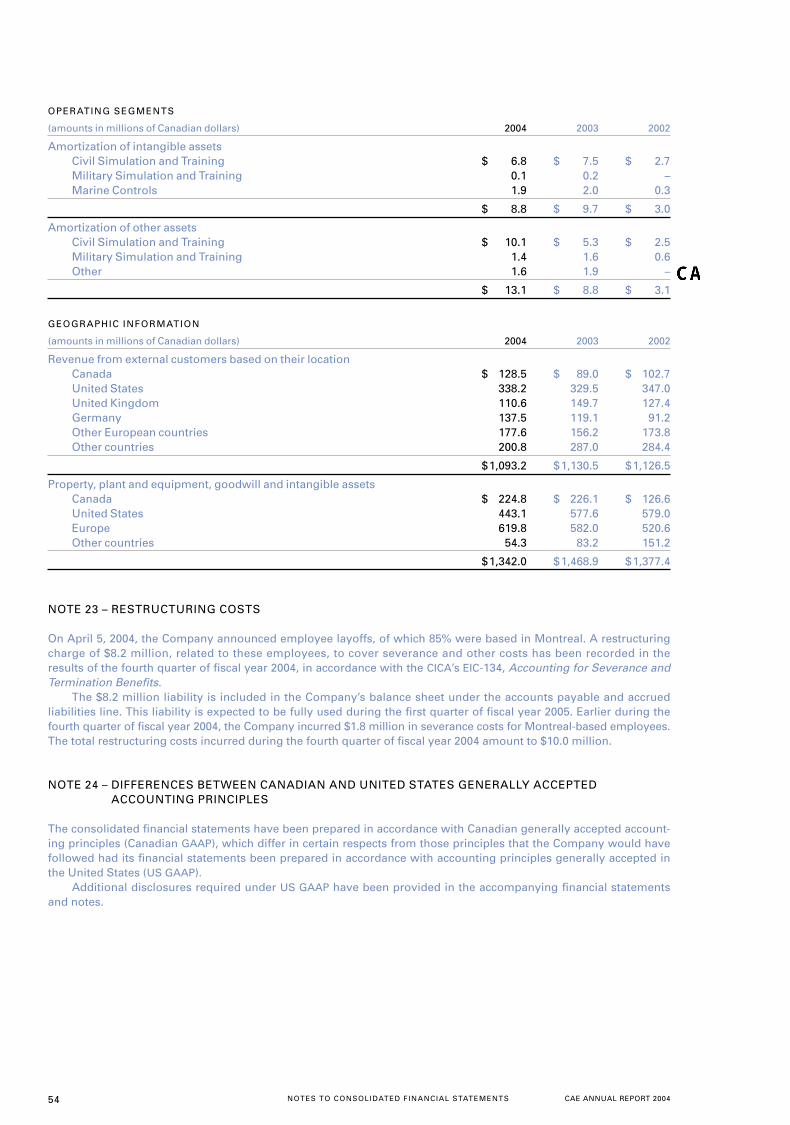
54 CAE ANNUAL REPORT 2004NOTES TO CONSOLIDATED FINANCIAL STATEMENTS
OPERATING SEGMENTS
(amounts in millions of Canadian dollars) 2004 2003 2002
Amortization of intangible assetsCivil Simulation and Training $ 6.8 $ 7.5 $ 2.7Military Simulation and Training 0.1 0.2 –Marine Controls 1.9 2.0 0.3
$ 8.8 $ 9.7 $ 3.0
Amortization of other assetsCivil Simulation and Training $ 10.1 $ 5.3 $ 2.5Military Simulation and Training 1.4 1.6 0.6Other 1.6 1.9 –
$ 13.1 $ 8.8 $ 3.1
GEOGRAPHIC INFORMATION
(amounts in millions of Canadian dollars) 2004 2003 2002
Revenue from external customers based on their locationCanada $ 128.5 $ 89.0 $ 102.7United States 338.2 329.5 347.0United Kingdom 110.6 149.7 127.4Germany 137.5 119.1 91.2Other European countries 177.6 156.2 173.8Other countries 200.8 287.0 284.4
$1,093.2 $1,130.5 $1,126.5
Property, plant and equipment, goodwill and intangible assetsCanada $ 224.8 $ 226.1 $ 126.6United States 443.1 577.6 579.0Europe 619.8 582.0 520.6Other countries 54.3 83.2 151.2
$1,342.0 $1,468.9 $1,377.4
NOTE 23 – RESTRUCTURING COSTS
On April 5, 2004, the Company announced employee layoffs, of which 85% were based in Montreal. A restructuringcharge of $8.2 million, related to these employees, to cover severance and other costs has been recorded in theresults of the fourth quarter of fiscal year 2004, in accordance with the CICA’s EIC-134, Accounting for Severance andTermination Benefits.
The $8.2 million liability is included in the Company’s balance sheet under the accounts payable and accruedliabilities line. This liability is expected to be fully used during the first quarter of fiscal year 2005. Earlier during thefourth quarter of fiscal year 2004, the Company incurred $1.8 million in severance costs for Montreal-based employees.The total restructuring costs incurred during the fourth quarter of fiscal year 2004 amount to $10.0 million.
NOTE 24 – DIFFERENCES BETWEEN CANADIAN AND UNITED STATES GENERALLY ACCEPTEDACCOUNTING PRINCIPLES
The consolidated financial statements have been prepared in accordance with Canadian generally accepted account-ing principles (Canadian GAAP), which differ in certain respects from those principles that the Company would havefollowed had its financial statements been prepared in accordance with accounting principles generally accepted inthe United States (US GAAP).
Additional disclosures required under US GAAP have been provided in the accompanying financial statementsand notes.
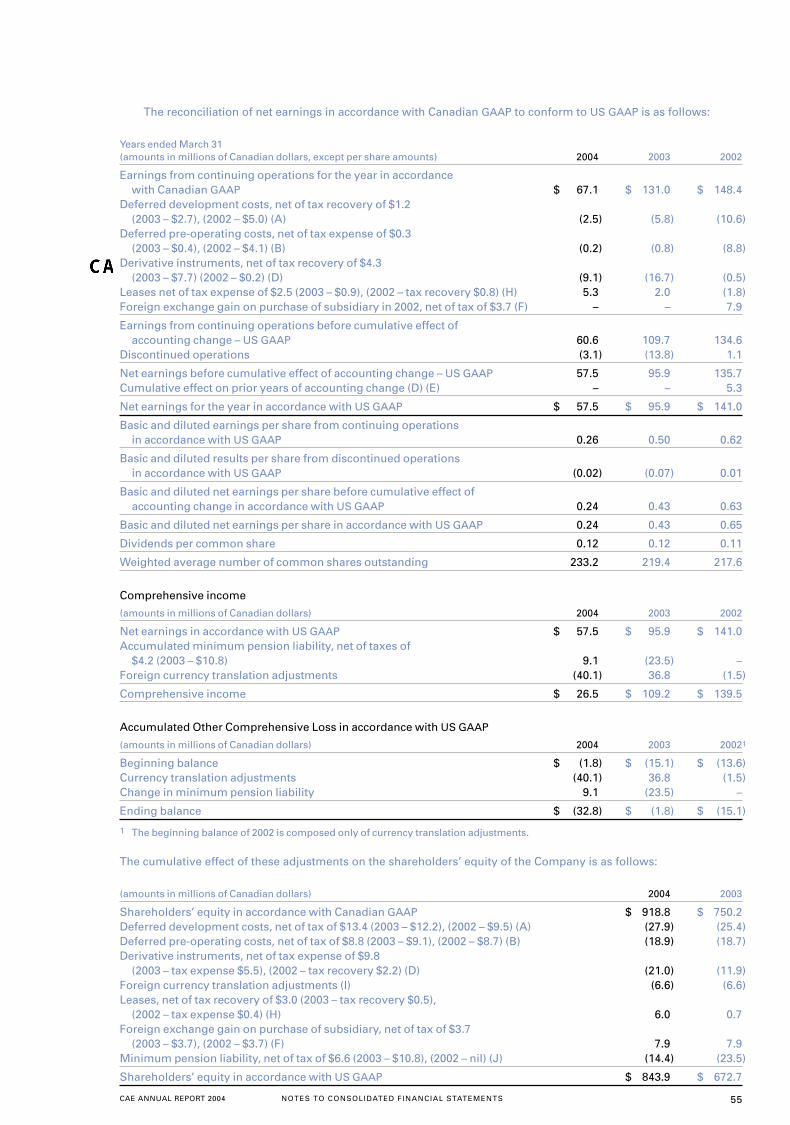
CAE ANNUAL REPORT 2004 NOTES TO CONSOLIDATED FINANCIAL STATEMENTS 55
The reconciliation of net earnings in accordance with Canadian GAAP to conform to US GAAP is as follows:
Years ended March 31(amounts in millions of Canadian dollars, except per share amounts) 2004 2003 2002
Earnings from continuing operations for the year in accordance with Canadian GAAP $ 67.1 $ 131.0 $ 148.4
Deferred development costs, net of tax recovery of $1.2 (2003 – $2.7), (2002 – $5.0) (A) (2.5) (5.8) (10.6)
Deferred pre-operating costs, net of tax expense of $0.3(2003 – $0.4), (2002 – $4.1) (B) (0.2) (0.8) (8.8)
Derivative instruments, net of tax recovery of $4.3 (2003 – $7.7) (2002 – $0.2) (D) (9.1) (16.7) (0.5)
Leases net of tax expense of $2.5 (2003 – $0.9), (2002 – tax recovery $0.8) (H) 5.3 2.0 (1.8)Foreign exchange gain on purchase of subsidiary in 2002, net of tax of $3.7 (F) – – 7.9
Earnings from continuing operations before cumulative effect of accounting change – US GAAP 60.6 109.7 134.6
Discontinued operations (3.1) (13.8) 1.1
Net earnings before cumulative effect of accounting change – US GAAP 57.5 95.9 135.7Cumulative effect on prior years of accounting change (D) (E) – – 5.3
Net earnings for the year in accordance with US GAAP $ 57.5 $ 95.9 $ 141.0
Basic and diluted earnings per share from continuing operations in accordance with US GAAP 0.26 0.50 0.62
Basic and diluted results per share from discontinued operations in accordance with US GAAP (0.02) (0.07) 0.01
Basic and diluted net earnings per share before cumulative effect of accounting change in accordance with US GAAP 0.24 0.43 0.63
Basic and diluted net earnings per share in accordance with US GAAP 0.24 0.43 0.65
Dividends per common share 0.12 0.12 0.11
Weighted average number of common shares outstanding 233.2 219.4 217.6
Comprehensive income
(amounts in millions of Canadian dollars) 2004 2003 2002
Net earnings in accordance with US GAAP $ 57.5 $ 95.9 $ 141.0Accumulated minimum pension liability, net of taxes of
$4.2 (2003 – $10.8) 9.1 (23.5) –Foreign currency translation adjustments (40.1) 36.8 (1.5)
Comprehensive income $ 26.5 $ 109.2 $ 139.5
Accumulated Other Comprehensive Loss in accordance with US GAAP
(amounts in millions of Canadian dollars) 2004 2003 20021
Beginning balance $ (1.8) $ (15.1) $ (13.6)Currency translation adjustments (40.1) 36.8 (1.5)Change in minimum pension liability 9.1 (23.5) –
Ending balance $ (32.8) $ (1.8) $ (15.1)
1 The beginning balance of 2002 is composed only of currency translation adjustments.
The cumulative effect of these adjustments on the shareholders’ equity of the Company is as follows:
(amounts in millions of Canadian dollars) 2004 2003
Shareholders’ equity in accordance with Canadian GAAP $ 918.8 $ 750.2Deferred development costs, net of tax of $13.4 (2003 – $12.2), (2002 – $9.5) (A) (27.9) (25.4)Deferred pre-operating costs, net of tax of $8.8 (2003 – $9.1), (2002 – $8.7) (B) (18.9) (18.7)Derivative instruments, net of tax expense of $9.8
(2003 – tax expense $5.5), (2002 – tax recovery $2.2) (D) (21.0) (11.9)Foreign currency translation adjustments (I) (6.6) (6.6)Leases, net of tax recovery of $3.0 (2003 – tax recovery $0.5),
(2002 – tax expense $0.4) (H) 6.0 0.7Foreign exchange gain on purchase of subsidiary, net of tax of $3.7
(2003 – $3.7), (2002 – $3.7) (F) 7.9 7.9Minimum pension liability, net of tax of $6.6 (2003 – $10.8), (2002 – nil) (J) (14.4) (23.5)
Shareholders’ equity in accordance with US GAAP $ 843.9 $ 672.7
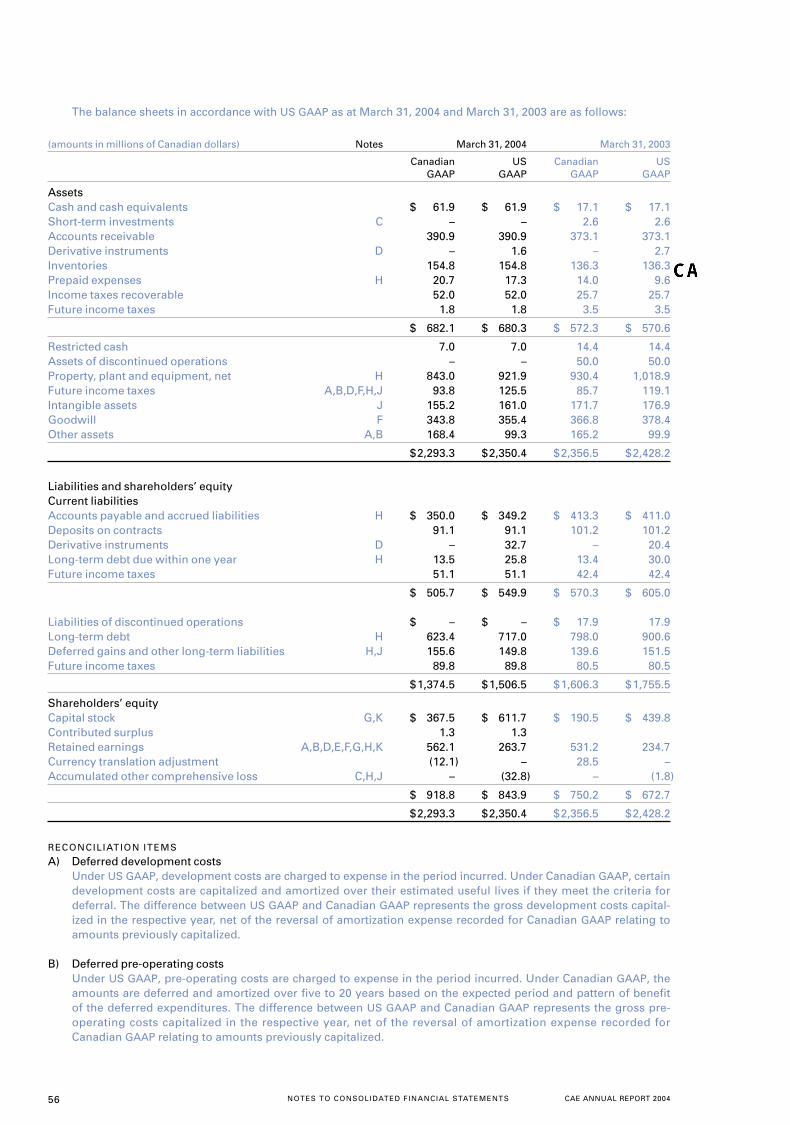
56 CAE ANNUAL REPORT 2004NOTES TO CONSOLIDATED FINANCIAL STATEMENTS
The balance sheets in accordance with US GAAP as at March 31, 2004 and March 31, 2003 are as follows:
(amounts in millions of Canadian dollars) Notes March 31, 2004 March 31, 2003
Canadian US Canadian USGAAP GAAP GAAP GAAP
AssetsCash and cash equivalents $ 61.9 $ 61.9 $ 17.1 $ 17.1Short-term investments C – – 2.6 2.6Accounts receivable 390.9 390.9 373.1 373.1Derivative instruments D – 1.6 – 2.7Inventories 154.8 154.8 136.3 136.3Prepaid expenses H 20.7 17.3 14.0 9.6Income taxes recoverable 52.0 52.0 25.7 25.7Future income taxes 1.8 1.8 3.5 3.5
$ 682.1 $ 680.3 $ 572.3 $ 570.6
Restricted cash 7.0 7.0 14.4 14.4Assets of discontinued operations – – 50.0 50.0Property, plant and equipment, net H 843.0 921.9 930.4 1,018.9Future income taxes A,B,D,F,H,J 93.8 125.5 85.7 119.1Intangible assets J 155.2 161.0 171.7 176.9Goodwill F 343.8 355.4 366.8 378.4Other assets A,B 168.4 99.3 165.2 99.9
$2,293.3 $2,350.4 $2,356.5 $2,428.2
Liabilities and shareholders’ equityCurrent liabilitiesAccounts payable and accrued liabilities H $ 350.0 $ 349.2 $ 413.3 $ 411.0Deposits on contracts 91.1 91.1 101.2 101.2Derivative instruments D – 32.7 – 20.4Long-term debt due within one year H 13.5 25.8 13.4 30.0Future income taxes 51.1 51.1 42.4 42.4
$ 505.7 $ 549.9 $ 570.3 $ 605.0
Liabilities of discontinued operations $ – $ – $ 17.9 17.9Long-term debt H 623.4 717.0 798.0 900.6Deferred gains and other long-term liabilities H,J 155.6 149.8 139.6 151.5Future income taxes 89.8 89.8 80.5 80.5
$1,374.5 $1,506.5 $1,606.3 $1,755.5
Shareholders’ equityCapital stock G,K $ 367.5 $ 611.7 $ 190.5 $ 439.8Contributed surplus 1.3 1.3Retained earnings A,B,D,E,F,G,H,K 562.1 263.7 531.2 234.7Currency translation adjustment (12.1) – 28.5 –Accumulated other comprehensive loss C,H,J – (32.8) – (1.8)
$ 918.8 $ 843.9 $ 750.2 $ 672.7
$2,293.3 $2,350.4 $2,356.5 $2,428.2
RECONCILIATION ITEMS
A) Deferred development costsUnder US GAAP, development costs are charged to expense in the period incurred. Under Canadian GAAP, certaindevelopment costs are capitalized and amortized over their estimated useful lives if they meet the criteria fordeferral. The difference between US GAAP and Canadian GAAP represents the gross development costs capital-ized in the respective year, net of the reversal of amortization expense recorded for Canadian GAAP relating toamounts previously capitalized.
B) Deferred pre-operating costsUnder US GAAP, pre-operating costs are charged to expense in the period incurred. Under Canadian GAAP, theamounts are deferred and amortized over five to 20 years based on the expected period and pattern of benefitof the deferred expenditures. The difference between US GAAP and Canadian GAAP represents the gross pre-operating costs capitalized in the respective year, net of the reversal of amortization expense recorded forCanadian GAAP relating to amounts previously capitalized.
CAE ANNUAL REPORT 2004 NOTES TO CONSOLIDATED FINANCIAL STATEMENTS 57
C) Portfolio investmentsUnder Canadian GAAP, portfolio investments (short-term investments) are accounted for at the least of cost andmarket value. Under US GAAP, portfolio investments are classified as held to maturity and thus are recorded atamortized cost. There is no material difference for US GAAP purposes. The investments held at March 31, 2003had maturity dates of within one month of March 31, 2003.
D) Derivative financial instruments Under Canadian GAAP, the nature and fair values of derivative financial instruments, all of which are entered intofor hedging purposes, are disclosed. The Company recognizes the gains and losses on forward contracts inincome concurrently with the recognition of the transactions being hedged. The interest payments relating toswap contracts are recorded in net earnings over the life of the underlying transaction on an accrual basis as anadjustment to interest income or interest expense. Under US GAAP, all derivatives are recorded on the balancesheet at fair value. Realized and unrealized gains and losses resulting from the valuation of derivatives (includingembedded derivatives in purchase and sale contracts) at market value are recognized (against interest expensefor interest rate swap and against revenues or cost of goods sold for the foreign exchange contracts) as the gainsand losses arise and not concurrently with the recognition of the transactions being hedged, as the Companydoes not apply the optional hedge accounting provisions of SFAS 133 and 138.
Upon the initial adoption of SFAS 133 and 138 on April 1, 2001, the cumulative effect of the accountingchange resulted in an increase in net earnings of $5.3 million net of taxes of $2.4 million.
E) Adjustments for changes in accounting policiesUnder US GAAP, the cumulative effect of certain accounting changes must be included in earnings in the year ofthe change. Under Canadian GAAP, the impact is reflected through retained earnings.
F) Foreign exchange gain on purchase of subsidiaryUnder Canadian GAAP, upon the purchase of Schreiner, a foreign exchange gain was recorded in fiscal 2002 asa reduction of goodwill on the forward contract hedge of the foreign currency denominated purchase price.Under US GAAP, this gain was recorded in earnings.
G) Reduction in stated capitalOn July 7, 1994, the Company applied a portion of its deficit as a reduction of its stated capital in the amount of$249.3 million. Under US GAAP, the reduction of stated capital would not be permitted.
H) LeasesUnder Canadian GAAP, certain of the Company’s leases of simulators, with aggregate minimum future lease pay-ments of $133.5 million are accounted for as operating leases.
Under these agreements, the lessors hold the simulators under lease and have arranged financing throughSpecial Purposes Entities (SPEs). Under US GAAP, since the legal stated capital of these (SPEs) represent less than3% of the assets of those (SPEs), the assets, liabilities, results of operations and cash flows of the SPE must beconsolidated into those of the Company. Amortization expense related to these leases amounts to $3.8 million in2004 (2003 – $4.4 million, 2002 – $2.0 million) and interest expense related to the financing arrangement amountsto $7.6 million in 2004 (2003 – $8.3 million, 2002 – $6.0 million). Currency translation adjustments resulting fromthe consolidation of a foreign SPE considered self-sustaining amount to $0.5 million in 2004 (2003 – $6.6 million).
I) Comprehensive income US GAAP requires disclosure of comprehensive income, which comprises income and other components of comprehensive income. Other comprehensive income includes items that cause changes in shareholders’ equitybut are not related to share capital or net earnings which, for the Company, comprises currency translationadjustments and change in minimum pension liability. Under Canadian GAAP, there is no requirement to reportcomprehensive income.
J) Minimum pension liabilityUnder US GAAP, if the accumulated benefit obligation exceeds the market value of plan assets, a minimum pen-sion liability for the excess is recognized to the extent that the liability recorded in the balance sheet is less thanthe minimum liability. Any portion of the additional liability that relates to unrecognized past service costs is recognized as an intangible asset while the remainder is charged to comprehensive income. The concept of addi-tional minimum liability does not exist under Canadian GAAP.
K) Share issue costsUnder Canadian GAAP, costs related to share issuance can be presented in retained earnings, net of taxes. UnderUS GAAP, these costs were recorded as a reduction of capital stock.
CONSOLIDATED STATEMENT OF CASH FLOWS
Under US GAAP reporting, separate subtotals within operating, financing and investment activities would not be presented.
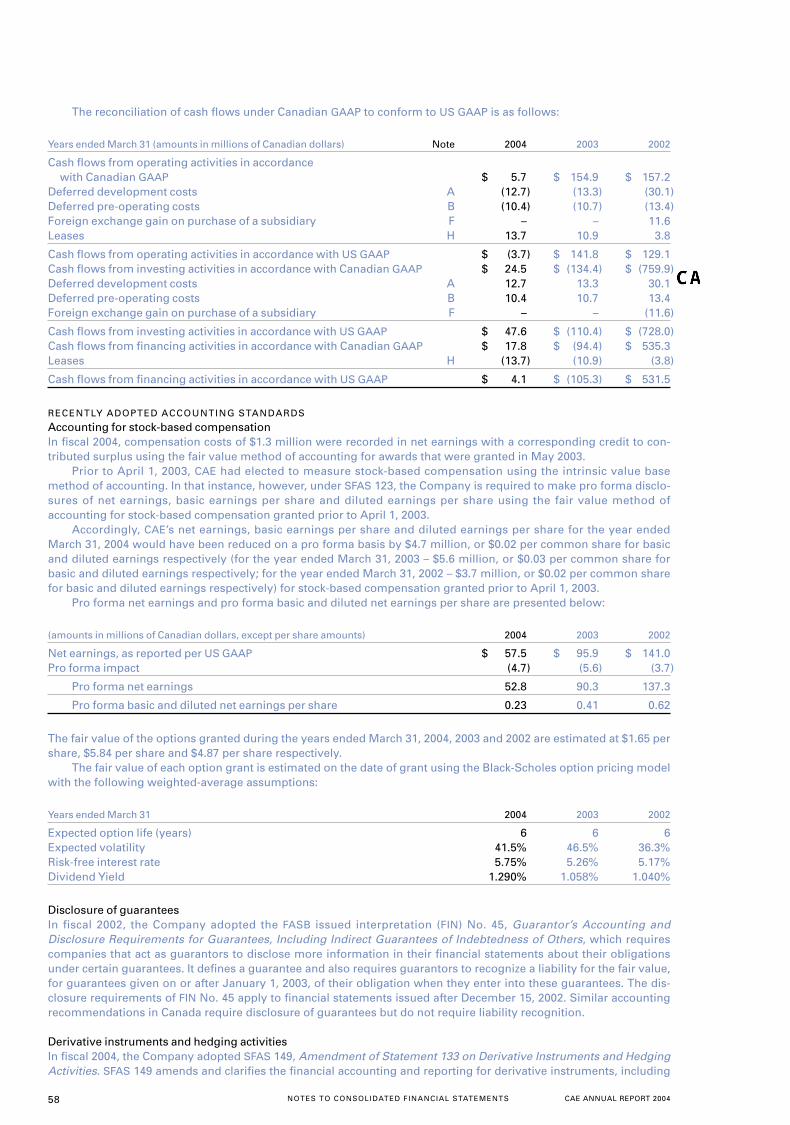
58 CAE ANNUAL REPORT 2004NOTES TO CONSOLIDATED FINANCIAL STATEMENTS
The reconciliation of cash flows under Canadian GAAP to conform to US GAAP is as follows:
Years ended March 31 (amounts in millions of Canadian dollars) Note 2004 2003 2002
Cash flows from operating activities in accordance with Canadian GAAP $ 5.7 $ 154.9 $ 157.2
Deferred development costs A (12.7) (13.3) (30.1)Deferred pre-operating costs B (10.4) (10.7) (13.4)Foreign exchange gain on purchase of a subsidiary F – – 11.6Leases H 13.7 10.9 3.8
Cash flows from operating activities in accordance with US GAAP $ (3.7) $ 141.8 $ 129.1Cash flows from investing activities in accordance with Canadian GAAP $ 24.5 $ (134.4) $ (759.9)Deferred development costs A 12.7 13.3 30.1Deferred pre-operating costs B 10.4 10.7 13.4Foreign exchange gain on purchase of a subsidiary F – – (11.6)
Cash flows from investing activities in accordance with US GAAP $ 47.6 $ (110.4) $ (728.0)Cash flows from financing activities in accordance with Canadian GAAP $ 17.8 $ (94.4) $ 535.3Leases H (13.7) (10.9) (3.8)
Cash flows from financing activities in accordance with US GAAP $ 4.1 $ (105.3) $ 531.5
RECENTLY ADOPTED ACCOUNTING STANDARDS
Accounting for stock-based compensation In fiscal 2004, compensation costs of $1.3 million were recorded in net earnings with a corresponding credit to con-tributed surplus using the fair value method of accounting for awards that were granted in May 2003.
Prior to April 1, 2003, CAE had elected to measure stock-based compensation using the intrinsic value basemethod of accounting. In that instance, however, under SFAS 123, the Company is required to make pro forma disclo-sures of net earnings, basic earnings per share and diluted earnings per share using the fair value method ofaccounting for stock-based compensation granted prior to April 1, 2003.
Accordingly, CAE’s net earnings, basic earnings per share and diluted earnings per share for the year endedMarch 31, 2004 would have been reduced on a pro forma basis by $4.7 million, or $0.02 per common share for basicand diluted earnings respectively (for the year ended March 31, 2003 – $5.6 million, or $0.03 per common share forbasic and diluted earnings respectively; for the year ended March 31, 2002 – $3.7 million, or $0.02 per common sharefor basic and diluted earnings respectively) for stock-based compensation granted prior to April 1, 2003.
Pro forma net earnings and pro forma basic and diluted net earnings per share are presented below:
(amounts in millions of Canadian dollars, except per share amounts) 2004 2003 2002
Net earnings, as reported per US GAAP $ 57.5 $ 95.9 $ 141.0Pro forma impact (4.7) (5.6) (3.7)
Pro forma net earnings 52.8 90.3 137.3
Pro forma basic and diluted net earnings per share 0.23 0.41 0.62
The fair value of the options granted during the years ended March 31, 2004, 2003 and 2002 are estimated at $1.65 pershare, $5.84 per share and $4.87 per share respectively.
The fair value of each option grant is estimated on the date of grant using the Black-Scholes option pricing modelwith the following weighted-average assumptions:
Years ended March 31 2004 2003 2002
Expected option life (years) 6 6 6Expected volatility 41.5% 46.5% 36.3%Risk-free interest rate 5.75% 5.26% 5.17%Dividend Yield 1.290% 1.058% 1.040%
Disclosure of guaranteesIn fiscal 2002, the Company adopted the FASB issued interpretation (FIN) No. 45, Guarantor’s Accounting andDisclosure Requirements for Guarantees, Including Indirect Guarantees of Indebtedness of Others, which requirescompanies that act as guarantors to disclose more information in their financial statements about their obligationsunder certain guarantees. It defines a guarantee and also requires guarantors to recognize a liability for the fair value,for guarantees given on or after January 1, 2003, of their obligation when they enter into these guarantees. The dis-closure requirements of FIN No. 45 apply to financial statements issued after December 15, 2002. Similar accountingrecommendations in Canada require disclosure of guarantees but do not require liability recognition.
Derivative instruments and hedging activitiesIn fiscal 2004, the Company adopted SFAS 149, Amendment of Statement 133 on Derivative Instruments and HedgingActivities. SFAS 149 amends and clarifies the financial accounting and reporting for derivative instruments, including
CAE ANNUAL REPORT 2004 NOTES TO CONSOLIDATED FINANCIAL STATEMENTS 59
certain derivative instruments embedded in other contracts and for hedging activities under SFAS 133. SFAS 149 hadno impact on CAE’s financial position as at March 31, 2004.
Consolidation of variable interest entitiesIn January 2003, the FASB issued FIN No. 46, Consolidation of Variable Interest Entities. This interpretation clarifiedhow to apply Accounting Research Bulletin No. 51, Consolidated Financial Statements to those entities defined as“Variable Interest Entities”, when equity investors are not considered to have a controlling financial interest or theyhave not invested enough equity to allow the entity to finance its activities without additional subordinated financialsupport from other parties.
This interpretation requires that existing unconsolidated variable interest entities be consolidated by their pri-mary beneficiaries if the entities do not effectively disperse risks among parties involved. An entity that holds asignificant variable interest but is not the primary beneficiary is subject to specific disclosure requirements.
In December 2003, the FASB issued FIN No. 46R, which modifies the scope exceptions provided in FIN No. 46.The Company is required to replace FIN No. 46 provisions with FIN No. 46R provisions to all newly created post-January 31, 2003 entities as of the end of the first period ending after March 15, 2005. As a foreign private issuer, thecompany will apply the provisions of FIN 46R to entities created before February 1, 2003, starting April 1, 2004.
Costs relating to exits and disposalsOn April 1, 2003, the Company adopted SFAS 146, Accounting for Costs Associated with Exit or Disposal Activities,which requires that a liability for a cost associated with an exit or disposal activity be recognized and measured ini-tially at fair value only when a liability is incurred. Similar accounting recommendations under Canadian GAAP havebeen adopted for exit and disposal activities after April 1, 2003 (note 1).
Pension and other retirement benefits During 2003, the Financial Accounting Standards Board revised SFAS 132, Employers’ Disclosures about Pensionsand Other Postretirement Benefits. The revised SFAS 132 retains and revises the disclosure requirements contained inthe original SFAS 132. It also requires additional disclosures about the assets, obligations, cash flows, and net peri-odic benefit cost of defined benefit pension plans and other postretirement benefit plans.
CAE adopted revised SFAS 132, as it is required for fiscal year ending after December 15, 2003.
ADDITIONAL DISCLOSURES
Additional disclosures required under US GAAP are as follows:
i) Statements of earnings
For the years ended March 31 (amounts in millions of Canadian dollars) 2004 2003 2002
Canadian US Canadian US Canadian USGAAP GAAP GAAP GAAP GAAP GAAP
Revenues from sales of simulators and controls systems $ 610.9 $ 588.5 $ 684.3 $ 668.1 $ 842.5 $ 846.6
Revenues from sales of services $ 482.3 $ 482.3 $ 446.2 $ 446.2 $ 284.0 $ 284.0Cost of sales from simulators and
controls systems $ 386.2 $ 385.0 $ 338.2 $ 338.2 $ 465.3 $ 470.3Cost of sales from services $ 277.6 $ 269.1 $ 240.1 $ 244.2 $ 167.9 $ 169.5Research and development expenses $ 81.0 $ 84.6 $ 108.3 $ 116.8 $ 74.6 $ 90.2Rental expenses $ 92.5 $ 79.7 $ 88.1 $ 73.9 $ 52.0 $ 43.6Selling, general and
administrative expenses $ 134.4 $ 134.4 $ 134.2 $ 134.2 $ 125.6 $ 125.9Restructuring costs $ 10.0 $ 10.0 $ – $ – $ – $ –Interest expense $ 23.9 $ 23.6 $ 30.4 $ 46.8 $ 22.7 $ 33.5
ii) Balance sheetAccounts payable and accrued liabilities as per Canadian GAAP are presented below:
As at March 31 (amounts in millions of Canadian dollars) 2004 2003
Accounts payable trade $ 103.8 $ 141.9Contract liabilities $ 101.9 $ 102.7Income tax payable $ 23.9 $ 26.4Other accrued liabilities $ 120.4 $ 142.3
Accounts payable and accrued liabilities $ 350.0 $ 413.3
Accounts receivable from government amounted to $34.9 million as of March 31, 2004 (2003 – $35.4 million).
60 CAE ANNUAL REPORT 2004NOTES TO CONSOLIDATED FINANCIAL STATEMENTS
iii) Income taxesThe components of earnings from continuing operations and income taxes on a Canadian GAAP basis are as follows:
For the years ended March 31(amounts in millions of Canadian dollars) 2004 2003 2002
Earnings before income taxes and other itemsCanada $ 6.3 $ 114.0 $ 179.0Other countries 81.4 77.2 39.3
$ 87.7 $ 191.2 $ 218.3
Current income taxesCanada $ 4.5 $ 43.0 $ 59.3Other countries 12.6 (1.6) 3.5
$ 17.1 $ 41.4 $ 62.8
Future income taxesCanada $ (3.3) $ (1.1) $ (2.0)Other countries 6.8 19.9 9.1
$ 3.5 $ 18.8 $ 7.1
Income tax provision $ 20.6 $ 60.2 $ 69.9
iv) Business combinationsThe following unaudited pro forma information for the fiscal years ended March 31, 2003 and 2002 presents a sum-mary of the pro forma consolidated statement of earnings for the Company as if business acquisitions performedduring their respective fiscal year referred to in note 2 had occurred on April 1 of the preceding fiscal year. Thispro forma information is based on available information and includes certain assumptions and adjustments, whichthe management of CAE believes to be reasonable. The pro forma information does not give effect to any cost savingsor synergies that CAE may enjoy as a result of these acquisitions. Accordingly, the pro forma information is not nec-essarily indicative of the results that might have been achieved, if the transactions reflected therein had been effectiveas at the beginning of the period presented, or of the results which may be obtained in the future. This pro formafinancial information has been prepared for comparative purposes only and is measured in accordance withCanadian GAAP.
Pro forma
Years ended March 31(amounts in millions of Canadian dollars, except per share amounts) 2003 2002
(Unaudited) (Unaudited)Revenue
Civil Simulation and Training $ 517.2 $ 618.6 Military Simulation and Training 445.7 461.8Marine Controls 175.8 132.0
$1,138.7 $1,212.4
Earnings before interest, income taxes and discontinued operationsCivil Simulation and Training $ 116.2 $ 148.3 Military Simulation and Training 73.6 65.6Marine Controls 31.9 25.4
Earnings before interest, income taxes and discontinued operations 221.7 239.3Interest expense, net 31.4 44.6
Earnings before income taxes and discontinued operations 190.3 194.7Income taxes 60.2 61.0
Earnings from continuing operations $ 130.1 $ 133.7Results of discontinued operations (note 3) (13.8) 1.1
Net earnings $ 116.3 $ 134.8
Earnings and diluted earnings per share from continuing operations $ 0.59 $ 0.61
Net earnings and diluted net earnings per share $ 0.53 $ 0.62
Average number of shares outstanding 219.4 218.2
v) Product warranty costsThe Company has warranty obligations in connection to the sale of its civil and military simulators and marine sys-tems. The original warranty period is usually for a two-year period. The cost incurred to provide for these warrantyobligations are estimated and recorded as an accrued liability at the time revenue is recognized. The Company esti-mates its warranty cost for a given product based on past experience. The changes in the Company’s accruedwarranty liability as at March 31 are as follows:
CAE ANNUAL REPORT 2004 NOTES TO CONSOLIDATED FINANCIAL STATEMENTS 61
(amounts in millions of Canadian dollars) 2004 2003
Accrued warranty liability at beginning of year $ 11.5 $ 12.4Warranty settlements during the year (8.6) (7.2)Warranty provisions 4.4 2.5Adjustments for changes in estimates 0.4 3.8
Accrued warranty obligations at the end of the year $ 7.7 $ 11.5
vi) Variable interest entityIn the second quarter of Fiscal 2003, CAE entered into an agreement with a Trust company which was funded by otherarms-length third parties to conclude a sale and leaseback transaction of five simulators. This Trust constitutes aVariable Interest Entity.
The net value of this transaction was approximately US$70.0 million. The activities of this Trust company are tolease the five simulators to CAE and collect on a quarterly basis the lease payments for remittance to the owner par-ticipant and the lenders.
CAE’s maximum exposure of loss as a result of its involvement with the Trust company is limited to US$14.0 million.
vii) PensionObligations and funded status:The accumulated benefit obligation (ABO) for all defined benefit pension plans was $139.8 million for March 31, 2004and $133.5 million for March 31, 2003. At these dates, all plans had accumulated benefit obligation in excess ofplan assets.
Assumptions:Weighted-average assumptions used to determine net periodic benefit cost for years ended March 31 are describedbelow:
2004 2003
Expected return on plan assets 6.5% 6.5%Discount rate 6.5% 6.5%Compensation rate increase 4.5% 4.5%
For the purpose of calculating the expected return on plan assets, historical and expected future returns were consid-ered separately for each class of asset based on the asset allocation. Also, in light of the investment policies andstrategies, an additional percentage was added to the expected return of equities to reflect the added value of theinvestment manager.
Plan assets:CAE pension plan weighted-average asset allocations by asset category are as follows:
Plan Assets at Measurement Dates
December 31, December 31,Asset Category 2003 2002
Equity securities 64% 64%Debt securities 36% 36%Real estate –% –%Other –% –%
Total 100% 100%
There is a target allocation percentage for equity securities of 64%, which includes a mix of Canadian, US and interna-tional equities, and for the debt securities of 36%, which must be rated BBB or higher. Individual asset classes areallowed to fluctuate slightly, and are rebalanced regularly to the target mix. Fund managers are responsible forinvesting the assets so as to achieve return appropriate to its mandate.
Contributions:In the next fiscal year, CAE expects to contribute $6.4 million to its registered pension plans and an additional $0.8 mil-lion to the Supplementary Plan.
NOTE 25 – COMPARATIVE FINANCIAL STATEMENTS
Certain comparative figures for 2003 and before have been reclassified to conform to the presentation adoptedin 2004.