Embed Size (px)
Citation preview
10 DUKE OF YORK SQUARE
LONDON SW3 4LY
T. 020 7730 4567
WWW.CADOGAN.CO.UK
ANNUAL REPORT 2016
CADOGAN GROUP LIMITED
ANNUAL REPORT 2016
CADOGAN GROUP LIMITED
ANNUAL REPORT 2016
CADOGAN GROUP LIMITED 1CADOGAN GROUP LIMITED
CONTENTS
2 - 3 Directors and secretary
4 - 5 The Cadogan Estate today and our core objectives
6 - 7 Our business model and financial highlights
8 - 9 The Cadogan Estate community
10 - 11 Chairman’s statement
12 - 37 Strategic report
38 - 39 Directors’ report
40 - 41 Independent auditor’s report
42 Consolidated income statement
43 Statements of comprehensive income
44 Statements of changes in equity
45 - 46 Statements of financial position
47 Consolidated statement of cash flows
48 - 68 Notes on the financial statements
69 Five year summary
CONTENTS
2 CADOGAN GROUP LIMITED
ANNUAL REPORT 2016
CADOGAN GROUP LIMITED 3
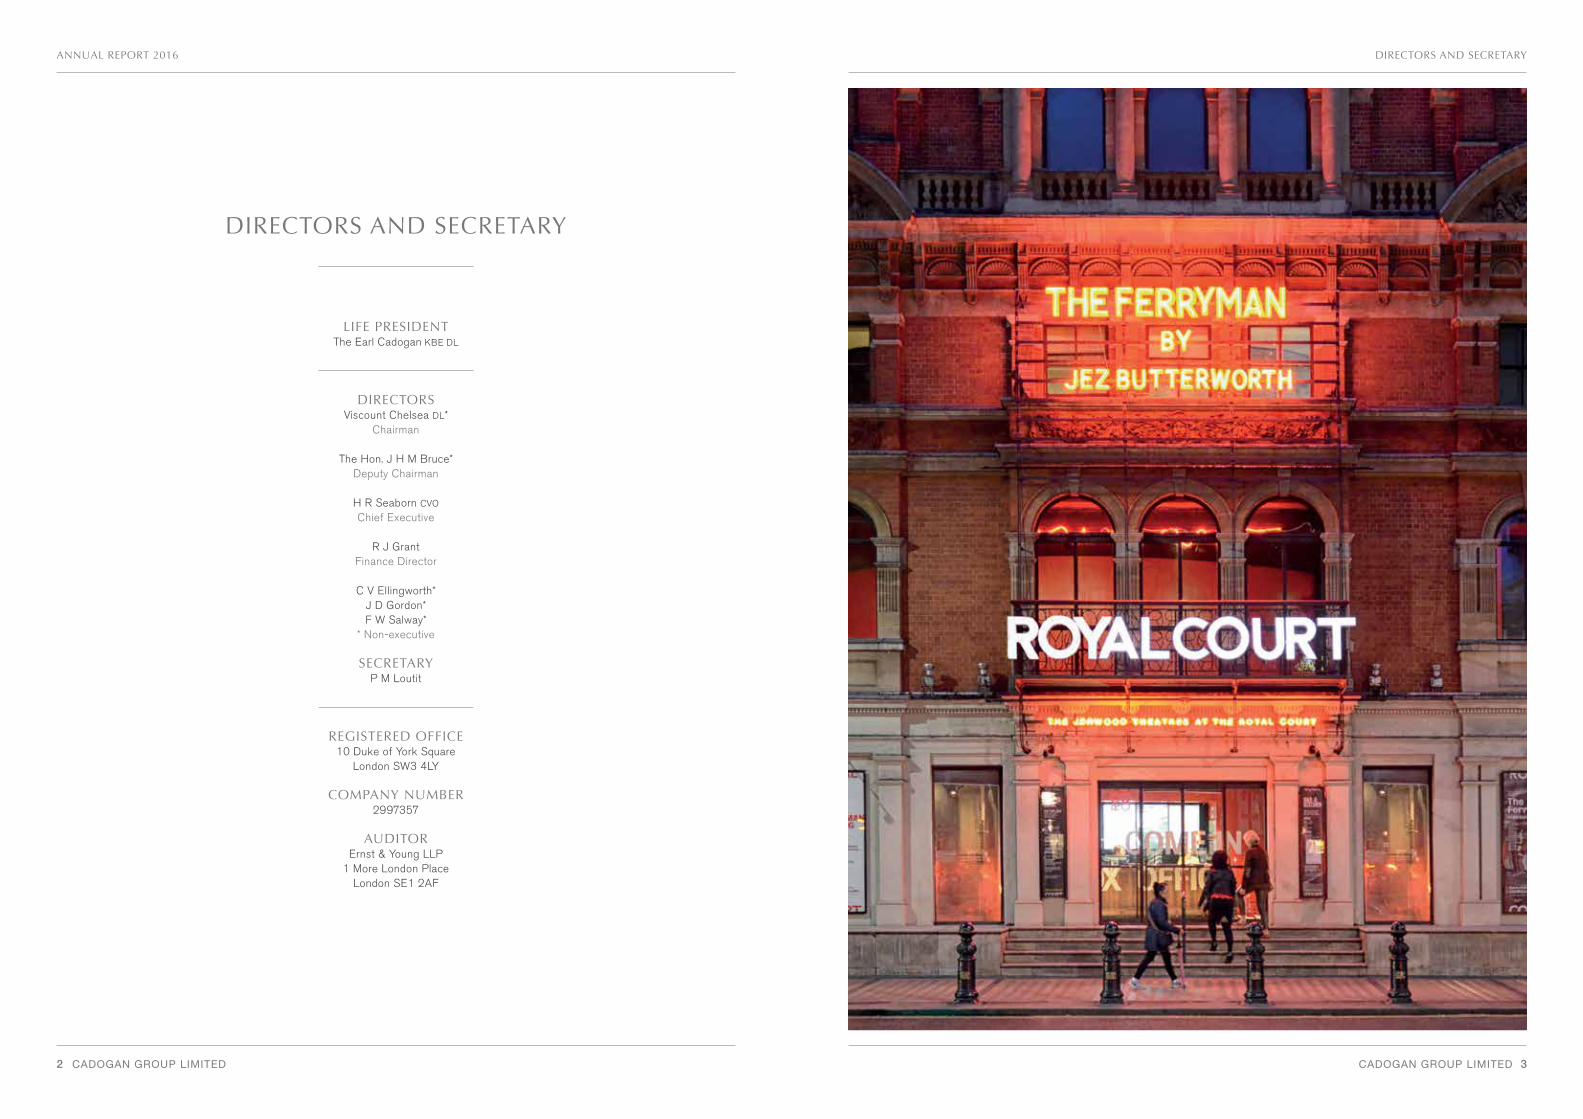
DIRECTORS AND SECRETARY
LIFE PRESIDENTThe Earl Cadogan KBE DL
DIRECTORSViscount Chelsea DL*
Chairman
The Hon. J H M Bruce*Deputy Chairman
H R Seaborn CVO Chief Executive
R J GrantFinance Director
C V Ellingworth*J D Gordon*F W Salway*
* Non-executive
SECRETARYP M Loutit
REGISTERED OFFICE10 Duke of York Square
London SW3 4LY
COMPANY NUMBER2997357
AUDITORErnst & Young LLP
1 More London Place London SE1 2AF
DIRECTORS AND SECRETARY
4 CADOGAN GROUP LIMITED CADOGAN GROUP LIMITED 5
ANNUAL REPORT 2016 THE CADOGAN ESTATE TODAY AND OUR CORE OBJECTIVES
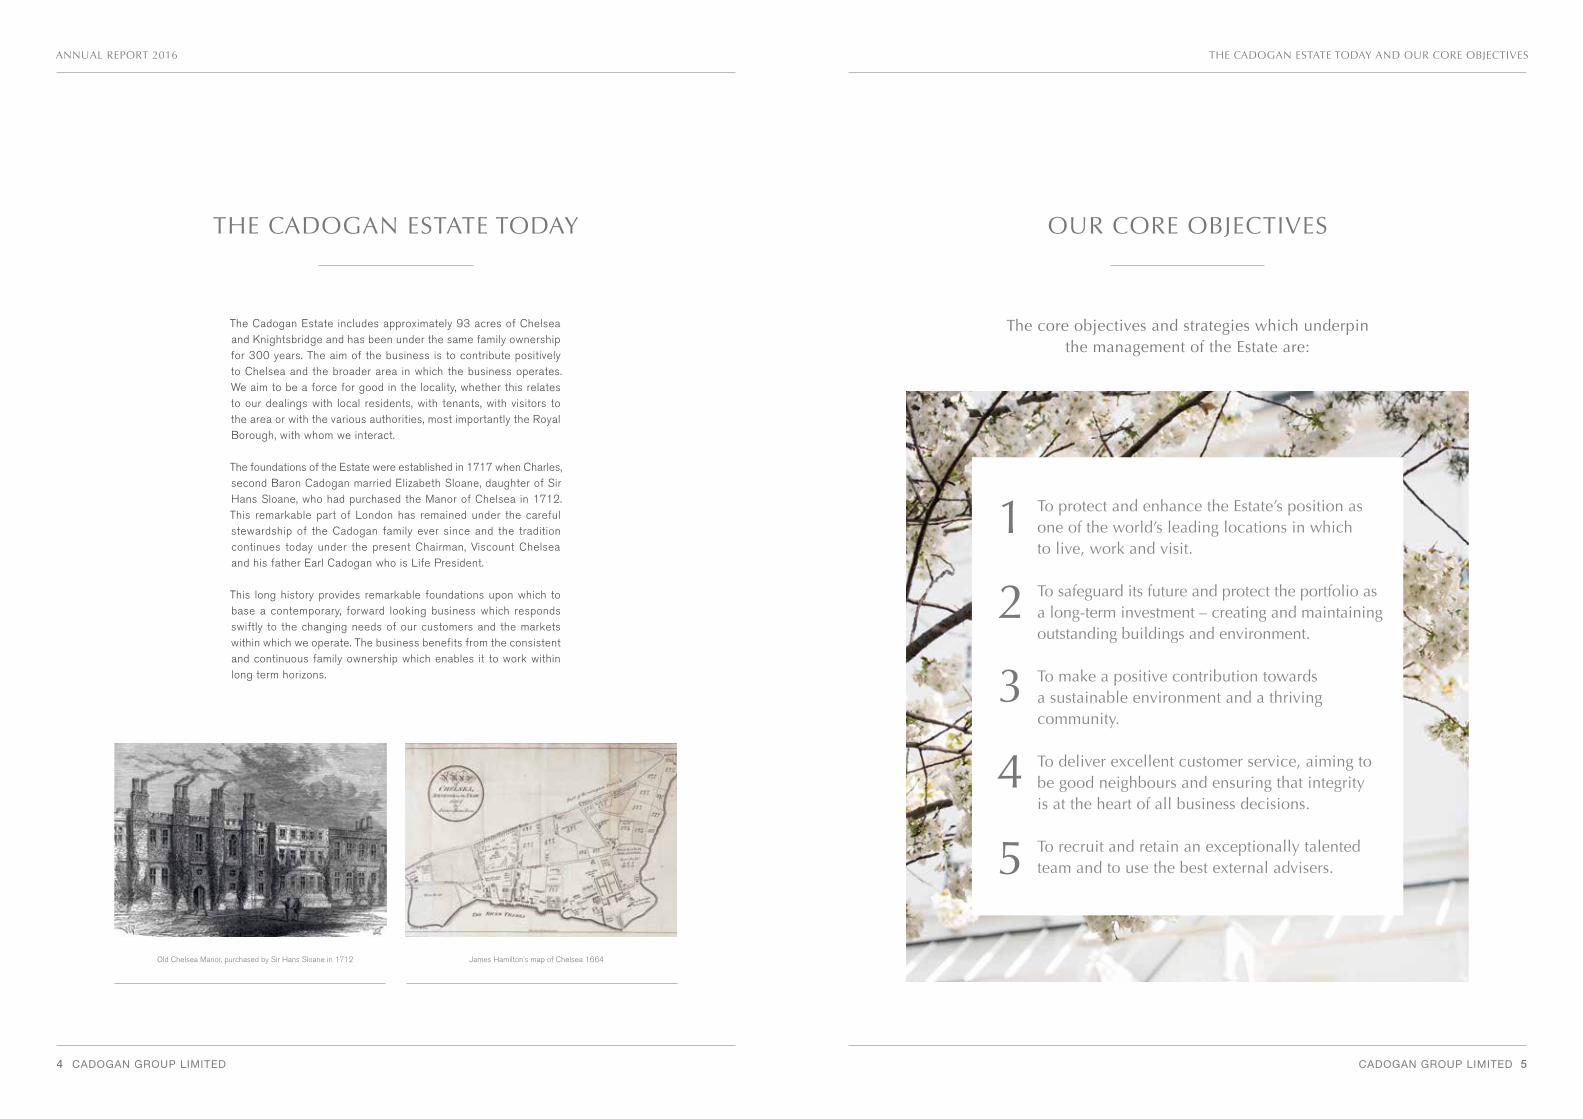
THE CADOGAN ESTATE TODAY
The Cadogan Estate includes approximately 93 acres of Chelsea and Knightsbridge and has been under the same family ownership for 300 years. The aim of the business is to contribute positively to Chelsea and the broader area in which the business operates. We aim to be a force for good in the locality, whether this relates to our dealings with local residents, with tenants, with visitors to the area or with the various authorities, most importantly the Royal Borough, with whom we interact.
The foundations of the Estate were established in 1717 when Charles, second Baron Cadogan married Elizabeth Sloane, daughter of Sir Hans Sloane, who had purchased the Manor of Chelsea in 1712. This remarkable part of London has remained under the careful stewardship of the Cadogan family ever since and the tradition continues today under the present Chairman, Viscount Chelsea and his father Earl Cadogan who is Life President.
This long history provides remarkable foundations upon which to base a contemporary, forward looking business which responds swiftly to the changing needs of our customers and the markets within which we operate. The business benefits from the consistent and continuous family ownership which enables it to work within long term horizons.
OUR CORE OBJECTIVES
The core objectives and strategies which underpin the management of the Estate are:
To protect and enhance the Estate’s position as one of the world’s leading locations in which to live, work and visit.
To safeguard its future and protect the portfolio as a long-term investment – creating and maintaining outstanding buildings and environment.
To make a positive contribution towards a sustainable environment and a thriving community.
To deliver excellent customer service, aiming to be good neighbours and ensuring that integrity is at the heart of all business decisions.
To recruit and retain an exceptionally talented team and to use the best external advisers.
Old Chelsea Manor, purchased by Sir Hans Sloane in 1712 James Hamilton’s map of Chelsea 1664
6 CADOGAN GROUP LIMITED CADOGAN GROUP LIMITED 7
ANNUAL REPORT 2016 OUR BUSINESS MODEL AND FINANCIAL HIGHLIGHTS
OUR BUSINESS MODEL FINANCIAL HIGHLIGHTS
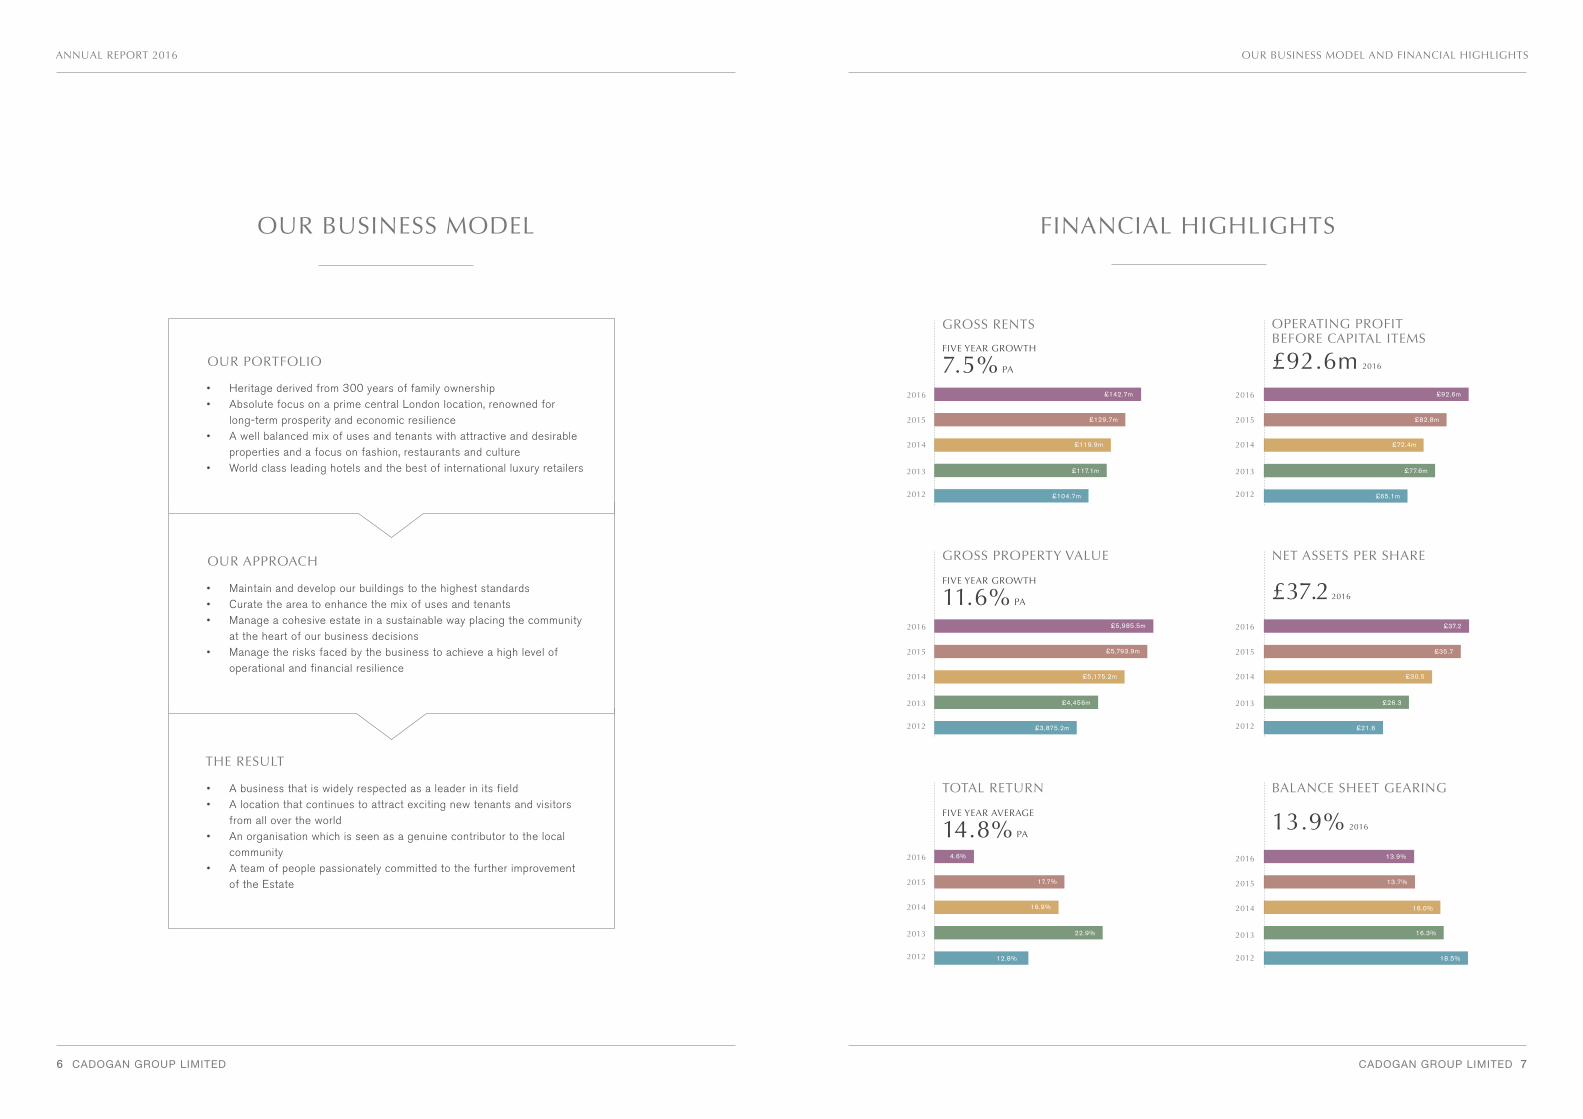
GROSS RENTS OPERATING PROFIT BEFORE CAPITAL ITEMS
2016
2015
2014
2013
2012
2016
2015
2014
2013
2012
£142.7m £92.6m
FIVE YEAR GROWTH
7.5% PA £92.6m 2016
GROSS PROPERTY VALUE NET ASSETS PER SHARE
2016
2015
2014
2013
2012
2016
2015
2014
2013
2012
£37.2£5,985.5m
FIVE YEAR GROWTH
11.6% PA £37.2 2016
TOTAL RETURN BALANCE SHEET GEARING
2016
2015
2014
2013
2012
2016
2015
2014
2013
2012
13.9%4.6%
FIVE YEAR AVERAGE
14.8% PA 13.9% 2016
£129.7m
£119.9m
£117.1m
£104.7m
£82.8m
£72.4m
£77.6m
£65.1m
£5,793.9m
£5,175.2m
£4,456m
£3,875.2m
£35.7
£30.5
£26.3
£21.6
17.7%
16.9%
22.9%
12.8%
13.7%
16.0%
16.3%
18.5%
• A business that is widely respected as a leader in its field• A location that continues to attract exciting new tenants and visitors
from all over the world• An organisation which is seen as a genuine contributor to the local
community• A team of people passionately committed to the further improvement
of the Estate
THE RESULT
• Maintain and develop our buildings to the highest standards• Curate the area to enhance the mix of uses and tenants• Manage a cohesive estate in a sustainable way placing the community
at the heart of our business decisions• Manage the risks faced by the business to achieve a high level of
operational and financial resilience
OUR APPROACH
• Heritage derived from 300 years of family ownership• Absolute focus on a prime central London location, renowned for
long-term prosperity and economic resilience• A well balanced mix of uses and tenants with attractive and desirable
properties and a focus on fashion, restaurants and culture• World class leading hotels and the best of international luxury retailers
OUR PORTFOLIO

CADOGAN GROUP LIMITED 9
THE CADOGAN ESTATE COMMUNITY
8 CADOGAN GROUP LIMITED
ANNUAL REPORT 2016
Pavilion Road food haven
Following consultation with the local community Cadogan have createda retail destination for independent artisan traders welcoming a traditional family butcher, a fine wine shop, a bakery and school, a greengrocer and a cheesemonger
Duke of York Square Fine Food Market
Recognised as one of London’s finest farmers food markets offering a range of fresh produce together with an eclectic range of international eating experiences
THE CADOGAN ESTATE COMMUNITY
Cadogan Hall
Cadogan Hall, home of the Royal Philharmonic Orchestra, where a rich and varied programme of musical events is available
Churches in Chelsea
St Luke’s Church is one of four local churches supported by Cadogan
Cadogan gardens
Cadogan have created and nurtured some of London’s most beautiful gardens in the heart of Kensington and Chelsea
The Royal Court Theatre
Energetically cultivates both established and emerging writers, creating provocative and exciting performances
Christmas lights
Funded by Cadogan, the Christmas lights bring festive cheer to all of our communities
Chelsea schools
There are five schools on the Cadogan Estate with total pupil numbers of c.1,700 providing a vital role in engendering a local community feel
The Saatchi Gallery
The Saatchi Gallery, a unique and exciting space for contemporary art
Cadogan is an integral part of Chelsea,whose aim is to maintain the local
community at the centre of residents andvisitors lives, whilst enhancing, supportingand promoting a wide variety of exciting
community events, local attractions and activities
10 CADOGAN GROUP LIMITED
ANNUAL REPORT 2016
CADOGAN GROUP LIMITED 11
programme of investment into all parts of the property portfolio. In the last three years we have spent over £330m on the purchase of properties and interests and on refurbishment and redevelopment expenditure on existing assets. This is a most tangible sign of our commitment to London in these uncertain times.
With good demand for our properties across all sectors we have been able to convert this investment into strong recurring rental cash flows, bringing high quality occupiers into the area who are able to refresh our retail offering and provide new reasons to attract shoppers and other visitors.
Cadogan’s involvement in Chelsea goes back nearly 300 years and this leads to deep roots in the local community which guide much of our activities today. We are a large landowner with a significant
concentration of ownership in a relatively small part of central London. Thus we have the potential to have a major impact on the local community and we recognise that it is our responsibility to safeguard and enhance the well-being of all those who live, work and visit in this area both now and in future. We see this as a form of stewardship, and we regard ourselves as stewards with the aim being to maintain and enhance the area for the long term.
Spread throughout this report we have highlighted some of the projects and events with which we have been involved in 2016, which are designed to contribute to the local community and to enhance the locality. Among many activities and events, these include financial contributions to the local community and to local charities, organisation of local events both to raise money for charities and to provide local community activities, projects to enhance the local environment, including improvements to the public realm and the creation of a new neighbourhood shopping area. In addition, in the built environment we have been working hard to maximise sustainability in our
2016 has been an interesting year for Cadogan, and I am delighted to be presenting my statement covering our business and our progress during the year.
In terms of the general economic background, 2016 has seen a significant break with the pattern which marked the recovery from the 2007 – 2008 financial crisis. Fuelled largely by continuing low interest rates and loose monetary policy throughout the developed world, the values of property assets have soared and Cadogan’s central London property holdings have been a substantial beneficiary. In the last five years the gross value of Cadogan’s gross property investments have risen from £3.87 billion to £5.99 billion, an annual average growth rate of 11.6%.
In 2016 this growth came to an end. Although interest rates generally have remained lower for longer than anyone’s expectations, it has been clear for some time that, led by the US, interest rates and inflation in the UK and US economies are on the upturn. In the UK the largely unexpected outcome of the Brexit vote has added significant economic uncertainty to this shifting background. The impact of these changes is clear to see – for 2016 we are reporting an overall increase in values of only 2.4% across our whole portfolio; and the only sector with a significant increase was retail which grew by 6.0%. Residential, office and leisure values were flat or marginally negative.
In spite of this uncertain background and clear slowdown I am delighted to say that 2016 was an excellent year for Cadogan. From a financial perspective one of the most pleasing aspects of our performance has been the continuing growth in rental income and in revenue profit. Rental income is up 10.0% on 2015 and revenue profit up slightly more at 11.9%. This follows increases of 8.2% and 14.3% respectively last year. This growth in the top line and in profitability reflects the continued
CHAIRMAN’S STATEMENT
sourcing of materials, to improve the level of recycling in waste and to minimise the consumption of energy in those buildings where we have management control.
We are also very conscious of the need to communicate well at all times with all constituencies. By being open and transparent we can engender trust in our activities. We have a regular programme of meetings with our retail tenants in all our major shopping locations, we meet local residents associations frequently and we have a carefully planned communication and consultation program in place in relation to planning and redevelopment.
We have illustrated many of these activities in this report and we hope that all of these will help us to be regarded as a force for good in the local area and to be trusted as a neighbour, partner or developer.
Looking forward we are clearly in less certain times. Although the UK economy is proving more resilient than many anticipated, most economic commentators are agreed that we are looking at more modest growth than we have achieved in recent years. Government spending remains constrained and it is proving more and more difficult for the government to raise tax revenues. The one certain outcome of the Brexit vote has been a significant reduction in the value of sterling and we have already seen the beneficial impact of this on tourist spending for our retailers and in our restaurants and hotels. The unexpected decision to call a general election may
have some short term impact on economic confidence, but barring a surprise result we would anticipate a continuation of existing policies.
Overall we look forward with cautious optimism. Transaction levels in the property market, both residential and commercial are down on previous years, and demand for commercial space is less certain and more selective than ever. However Cadogan remains well placed as a business, with top-quality locations and properties, strong finances and an excellent team. I am confident that we will be able to continue to develop the business for the benefit of all our stakeholders.
I would like to extend my thanks to my fellow board directors for their constant support and wise counsel and to my chief executive Hugh Seaborn for driving the business and leading an exceptional team. Above all, I would like to use this opportunity to pay tribute to Richard Grant who retires this year and has been finance director for 23 years. Over this period he has seen immense change in the business while ensuring we have steered a reassuringly steady and conservative course from a financial perspective. On behalf of the entire board I express my appreciation for his dedicated and loyal service to Cadogan.
Viscount Chelsea28 April 2017
CHAIRMAN’S STATEMENT
Viscount ChelseaChairman
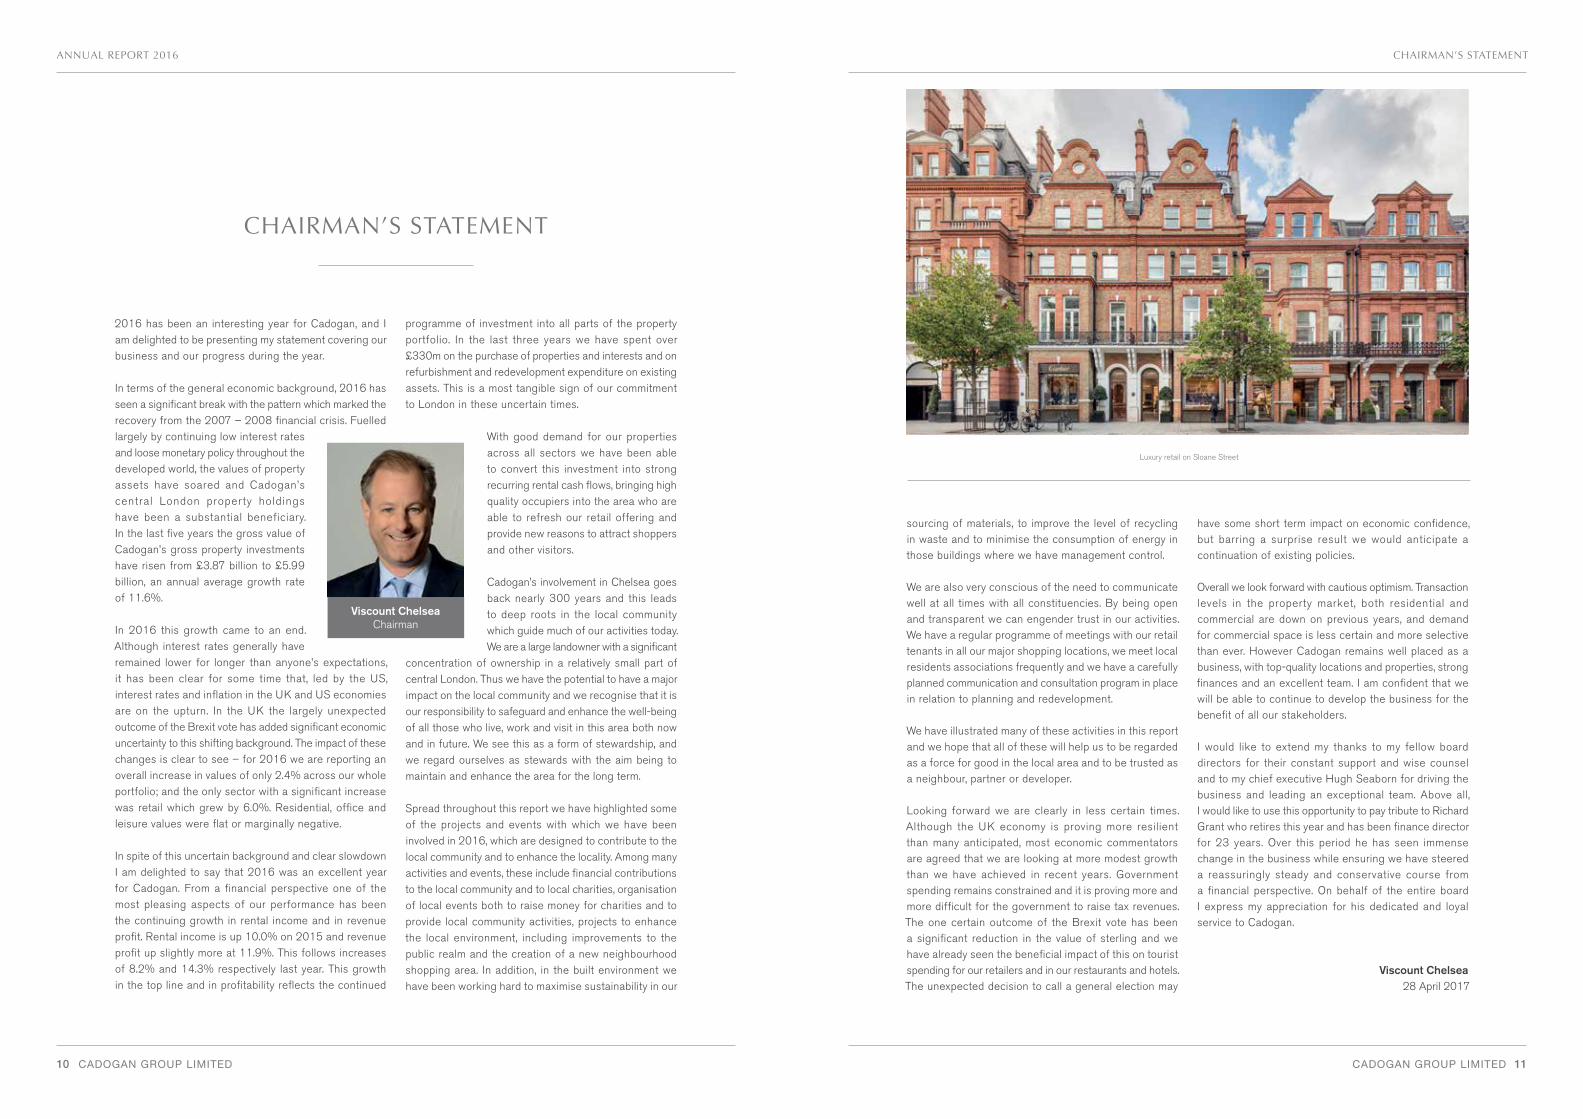
Luxury retail on Sloane Street
12 CADOGAN GROUP LIMITED
ANNUAL REPORT 2016
CADOGAN GROUP LIMITED 13
Even before the outcome of the EU referendum was known, it was apparent that the growth in property values and the strong returns which the business has enjoyed over the last few years, would not continue. In the five years to the end of 2015 Cadogan generated annualised returns of 19.1%; our total return in 2016 was 4.6%. Our five year annualised return to the end of 2016 has dropped as a result to 14.8%.
In an era of increased uncertainty ushered in by the Brexit vote, this still looks a most creditable achievement. Against a background where property values have not continued their rapid rise of the last few years, I am pleased to be reporting a successful year.
The clearest demonstration of our continued progress has been the growth in rental income and in revenue profit, both of which have reached record levels. Rental income has increased from £129.7m to £142.7m, an overall increase of 10.0%. Revenue profit, which is operating profit, excluding profits on the sale of investment properties and revaluation movements, has increased from £82.8m to £92.6m, an increase of 11.9%. With continued close control over operational expenditure and with no increase in our funding levels we have been able to improve operational profitability and maintain overall financial resilience.
The growth in rental income and revenue profit show the benefit of the investments we have been making in recent years. In 2016 we invested nearly £100m in property acquisitions and development expenditure, and there are further increases in rental income resulting from this to come across the portfolio. Our absolute focus on quality, both in the built environment and in our tenant mix, continues to produce outstanding results.
Standout achievements amongst a wide range of activity have included the completion and letting of George
House on Sloane Street, the connected completion of the new neighbourhood shopping destination in Pavilion Road and, in partnership with the Royal Borough of Kensington and Chelsea, further progress of our plans for the extensive improvement of the public realm in Sloane Street.
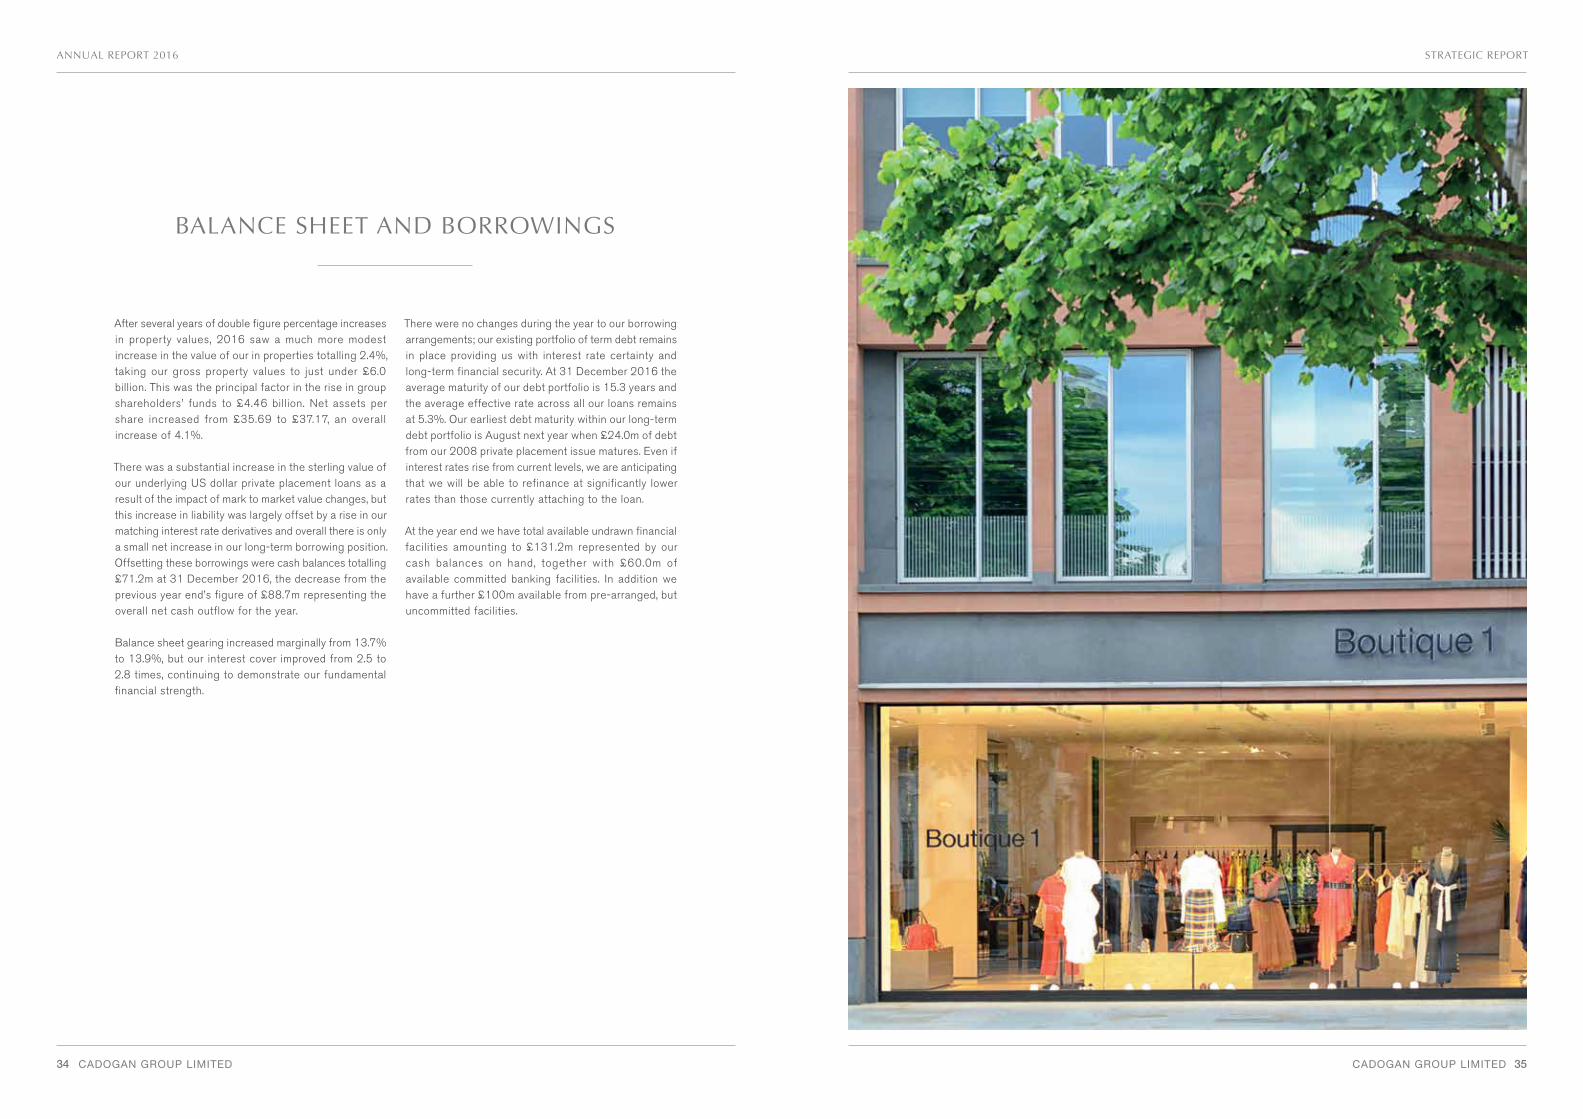
I am proud of George House, the building we have created in Sloane Street, which has now become the home of Marshall Wace, one of the world’s leading alternative asset management businesses. Retail units within the building include leading international luxury fashion brands Boutique 1, Delpozo, and Valentino Red. From a financial perspective this has been a most successful development, while at the same time enhancing the wider area, creating a new destination and bringing top end occupiers to this
important location.
Our proposals for the improvement of the public realm in Sloane Street have the potential to dramatically enhance the physical environment of this important London residential and shopping street. Most significantly, we want to create more and better space for pedestrians and a greener and more elegant street. We would like to introduce new trees, attractive planting and remove street clutter. Through renewing surfaces, lighting and street furniture we will enhance the visual character and appearance of the street. All this can be achieved without impacting adversely on vehicular traffic.
The Royal Borough of Kensington and Chelsea has recently completed the second stage consultation on these proposals. This has included distributing details to 12,000 households in the local area, a public exhibition and detailed consultations with many local stakeholders. Subject to the conclusions of the consultation, we would hope to be able to start work next year.
STRATEGIC REPORT
STRATEGIC REPORT
Hugh SeabornChief Executive
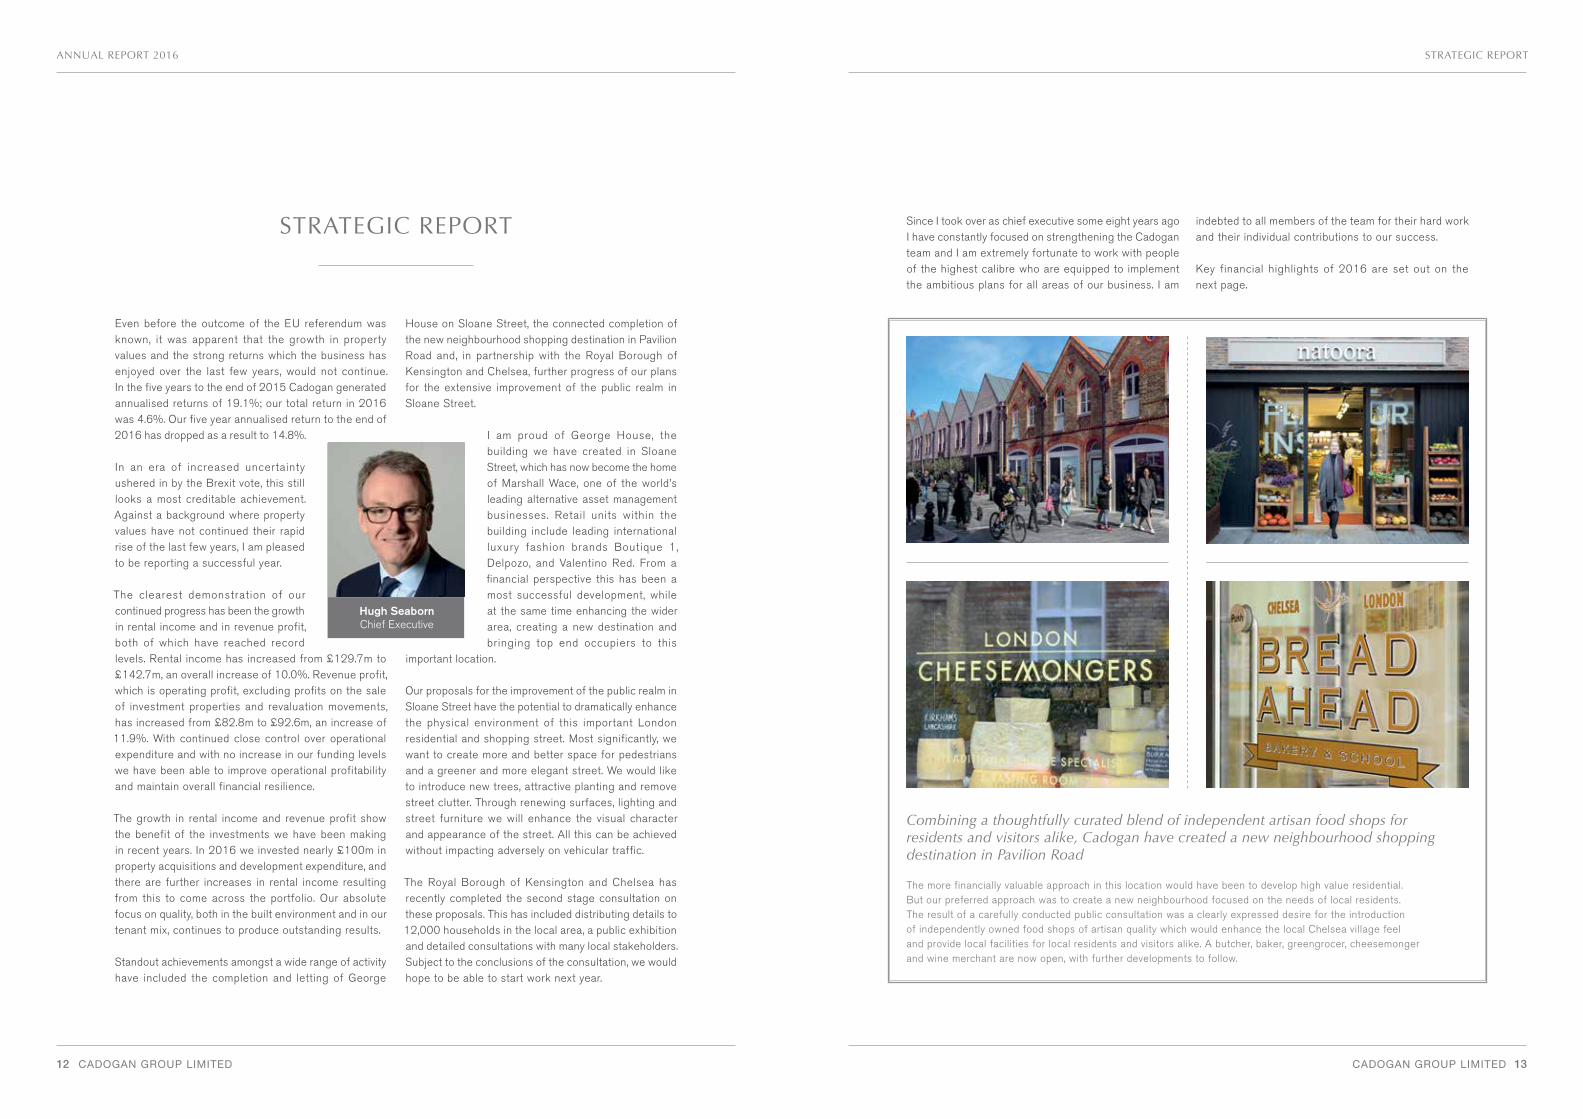
Combining a thoughtfully curated blend of independent artisan food shops for residents and visitors alike, Cadogan have created a new neighbourhood shopping destination in Pavilion Road
The more financially valuable approach in this location would have been to develop high value residential. But our preferred approach was to create a new neighbourhood focused on the needs of local residents. The result of a carefully conducted public consultation was a clearly expressed desire for the introduction of independently owned food shops of artisan quality which would enhance the local Chelsea village feel and provide local facilities for local residents and visitors alike. A butcher, baker, greengrocer, cheesemonger and wine merchant are now open, with further developments to follow.
Since I took over as chief executive some eight years ago I have constantly focused on strengthening the Cadogan team and I am extremely fortunate to work with people of the highest calibre who are equipped to implement the ambitious plans for all areas of our business. I am
indebted to all members of the team for their hard work and their individual contributions to our success.
Key financial highlights of 2016 are set out on the next page.
14 CADOGAN GROUP LIMITED
ANNUAL REPORT 2016
CADOGAN GROUP LIMITED 15
4.2%
STRATEGIC REPORT
After several years of double digit growth in values, 2016 saw a marked slowdown across all property sectors. This was well signalled in advance and the headwinds facing all the London property markets were widely commented on even before the outcome of the Brexit vote was known. As last year the retail portfolio was our best performing sector in capital value terms, rising 6.0%. Good demand for space from the top international luxury brands in Sloane Street enabled us to capture some further rental growth, but incremental compression in yields was limited.
Office rents have come off the peak levels which we were able to achieve in a number of lettings in 2014 and 2015 and the reduction in rental values has resulted in a small, 1.4% decrease in our overall office values.
The remainder of the commercial portfolio, which includes leisure and other uses, was also virtually flat, showing a small increase of just 0.6% in capital value. We are continuing a major refurbishment of the Cadogan Hotel on Sloane Street, and we completed a minor refurbishment of the boutique hotel at 11 Cadogan Gardens, but it is too early yet to capture the enhancement in values from these investments.
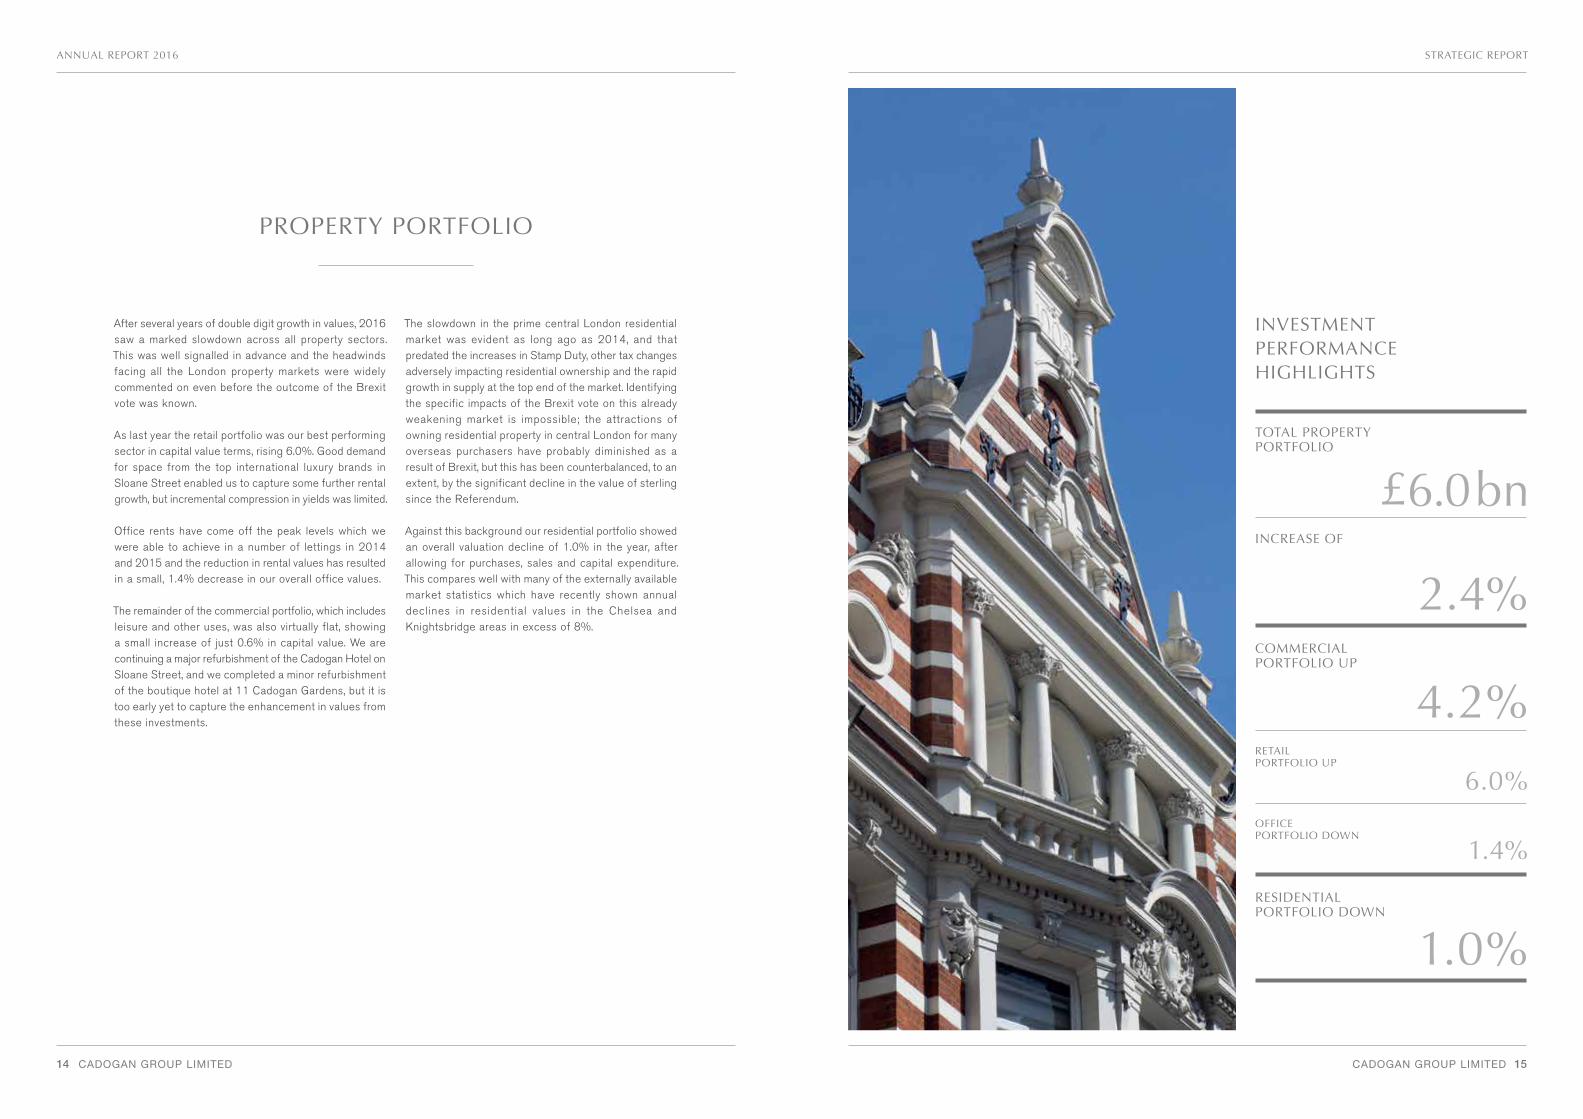
TOTAL PROPERTY PORTFOLIO
INCREASE OF
RESIDENTIAL PORTFOLIO DOWN
COMMERCIAL PORTFOLIO UP
RETAIL PORTFOLIO UP
OFFICE PORTFOLIO DOWN
The slowdown in the prime central London residential market was evident as long ago as 2014, and that predated the increases in Stamp Duty, other tax changes adversely impacting residential ownership and the rapid growth in supply at the top end of the market. Identifying the specific impacts of the Brexit vote on this already weakening market is impossible; the attractions of owning residential property in central London for many overseas purchasers have probably diminished as a result of Brexit, but this has been counterbalanced, to an extent, by the significant decline in the value of sterling since the Referendum.
Against this background our residential portfolio showed an overall valuation decline of 1.0% in the year, after allowing for purchases, sales and capital expenditure. This compares well with many of the externally available market statistics which have recently shown annual declines in residential values in the Chelsea and Knightsbridge areas in excess of 8%.
PROPERTY PORTFOLIO
INVESTMENT PERFORMANCE HIGHLIGHTS
6.0%
1.4%
1.0%
£6.0bn
2.4%
16 CADOGAN GROUP LIMITED
ANNUAL REPORT 2016
CADOGAN GROUP LIMITED 17
STRATEGIC REPORT
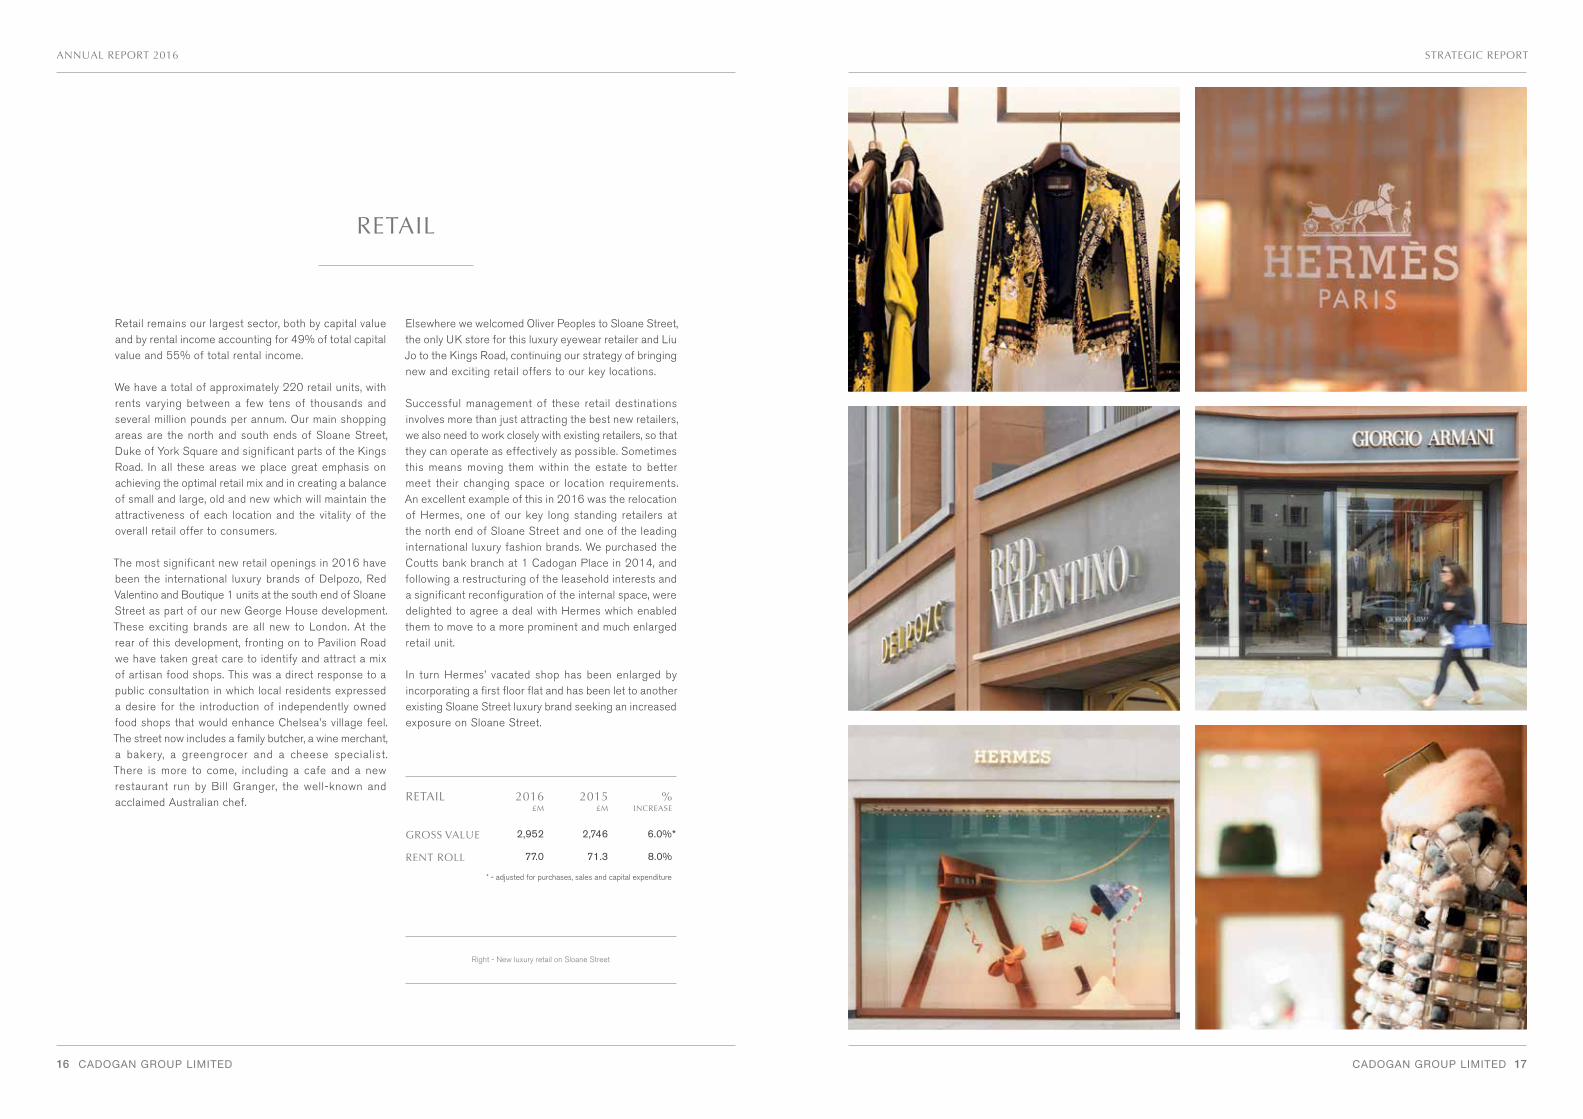
Retail remains our largest sector, both by capital value and by rental income accounting for 49% of total capital value and 55% of total rental income.
We have a total of approximately 220 retail units, with rents varying between a few tens of thousands and several million pounds per annum. Our main shopping areas are the north and south ends of Sloane Street, Duke of York Square and significant parts of the Kings Road. In all these areas we place great emphasis on achieving the optimal retail mix and in creating a balance of small and large, old and new which will maintain the attractiveness of each location and the vitality of the overall retail offer to consumers.
The most significant new retail openings in 2016 have been the international luxury brands of Delpozo, Red Valentino and Boutique 1 units at the south end of Sloane Street as part of our new George House development. These exciting brands are all new to London. At the rear of this development, fronting on to Pavilion Road we have taken great care to identify and attract a mix of artisan food shops. This was a direct response to a public consultation in which local residents expressed a desire for the introduction of independently owned food shops that would enhance Chelsea’s village feel. The street now includes a family butcher, a wine merchant, a bakery, a greengrocer and a cheese specialist. There is more to come, including a cafe and a new restaurant run by Bill Granger, the well-known and acclaimed Australian chef.
Elsewhere we welcomed Oliver Peoples to Sloane Street, the only UK store for this luxury eyewear retailer and Liu Jo to the Kings Road, continuing our strategy of bringing new and exciting retail offers to our key locations.
Successful management of these retail destinations involves more than just attracting the best new retailers, we also need to work closely with existing retailers, so that they can operate as effectively as possible. Sometimes this means moving them within the estate to better meet their changing space or location requirements. An excellent example of this in 2016 was the relocation of Hermes, one of our key long standing retailers at the north end of Sloane Street and one of the leading international luxury fashion brands. We purchased the Coutts bank branch at 1 Cadogan Place in 2014, and following a restructuring of the leasehold interests and a significant reconfiguration of the internal space, were delighted to agree a deal with Hermes which enabled them to move to a more prominent and much enlarged retail unit.
In turn Hermes’ vacated shop has been enlarged by incorporating a first floor flat and has been let to another existing Sloane Street luxury brand seeking an increased exposure on Sloane Street.
RETAIL
Right - New luxury retail on Sloane Street
RETAIL 2016£M
2015£M
% INCREASE
GROSS VALUE 2,952 2,746 6.0%*
RENT ROLL 77.0 71.3 8.0%
* - adjusted for purchases, sales and capital expenditure
18 CADOGAN GROUP LIMITED
ANNUAL REPORT 2016
CADOGAN GROUP LIMITED 19
Chelsea in Bloom was created to extend a unique event – the Chelsea Flower Show – into the local neighbourhood. Retailers across Chelsea take part in a competition during the Flower Show week to produce the best floral displays, organised by Cadogan in close collaboration with the RHS.
It drives further international profile for the area, along with footfall and spend for our retailers and restaurants. In 2016, the Chelsea in Bloom press campaign had a reach of 15 million and footfall increased by 24% year on year – a clear demonstration of the benefits which well-coordinated destination marketing can bring for all our retailers.
STRATEGIC REPORT
We continue to add selectively to our retail ownership in key locations and were delighted to acquire two adjacent retail units in the Kings Road in separate transactions. The total cost of these two acquisitions was approximately £30.0m and these will assist in enhancing the retail tenant mix in this important retail location.
Retailers today face an ever more challenging environment, with online sales continuing to take a greater proportion of total retail spend, and bricks and mortar stores having to cope with changing shopping patterns and, in many areas, with rising business rates and inflation in input prices. According to the Centre for Retail Research at the University of Nottingham the proportion of all retail sales made online is running at approximately 16%. It is forecast to rise to 20% by 2021.
Against this background we work alongside our retailers to provide them with strong support. We are continuing to further strengthen our destination marketing and to improve our knowledge of local footfall, spending patterns and promotional methods.
We hold regular briefing sessions with retailers to share intelligence and coordinate marketing and promotional activity. Not only does this provide benefits to their business activities, but it also helps to engender a feeling of community within our occupier base. We monitor footfall in all key retail locations and are
pleased to report that total footfall across Cadogan’s retail destinations showed an increase of 3.5% over 2015 which compared well with the overall London high street footfall index which reported a decrease of 1.6% over the same period. (Source – Central London High Street index by Springboard)
Through the curation of the tenant mix we aim to maintain enticing and vital retail destinations. With the introduction of more food and beverage we can enhance the overall offer in response to the increasing desire from consumers for a broader retailing experience. Coupled to exceptional public realm, visitors to the area and local residents are able to have a high quality visceral experience which sets this part of London apart from anything available online and indeed I would argue, other destinations.
The outlook for many retailers appears somewhat mixed. There is a continuing flight to quality, whether on a regional or national basis, and the best retail centres, and in particular the premium locations in central London, continue to see demand from top-quality retailers. The fall in sterling following the Brexit referendum is benefiting locations with significant overseas visitor footfall, although this is mitigated by imported inflation, and while further growth in rental values will be moderate in the short term, we are experiencing strong support from good quality brands at current rental values in our principal locations.
As part of our retail promotion activities, and also to help raise festive spirit in the local community we provide a complimentary Christmas grotto on Duke of York Square. Visits to the grotto were free, but an optional £5 donation was suggested to visitors to help raise money for a local charity.
As a result £5,540 was raised for the Chelsea Community Hospital School. The school provides education for children and young people while they are in hospital, as well as teaching students who cannot access mainstream education due to their medical or mental health conditions.
The charity was carefully selected by Cadogan and the Kensington & Chelsea Foundation, which works with 300 grassroots charities across the Royal Borough to provide support and help raise funds to benefit the local community.
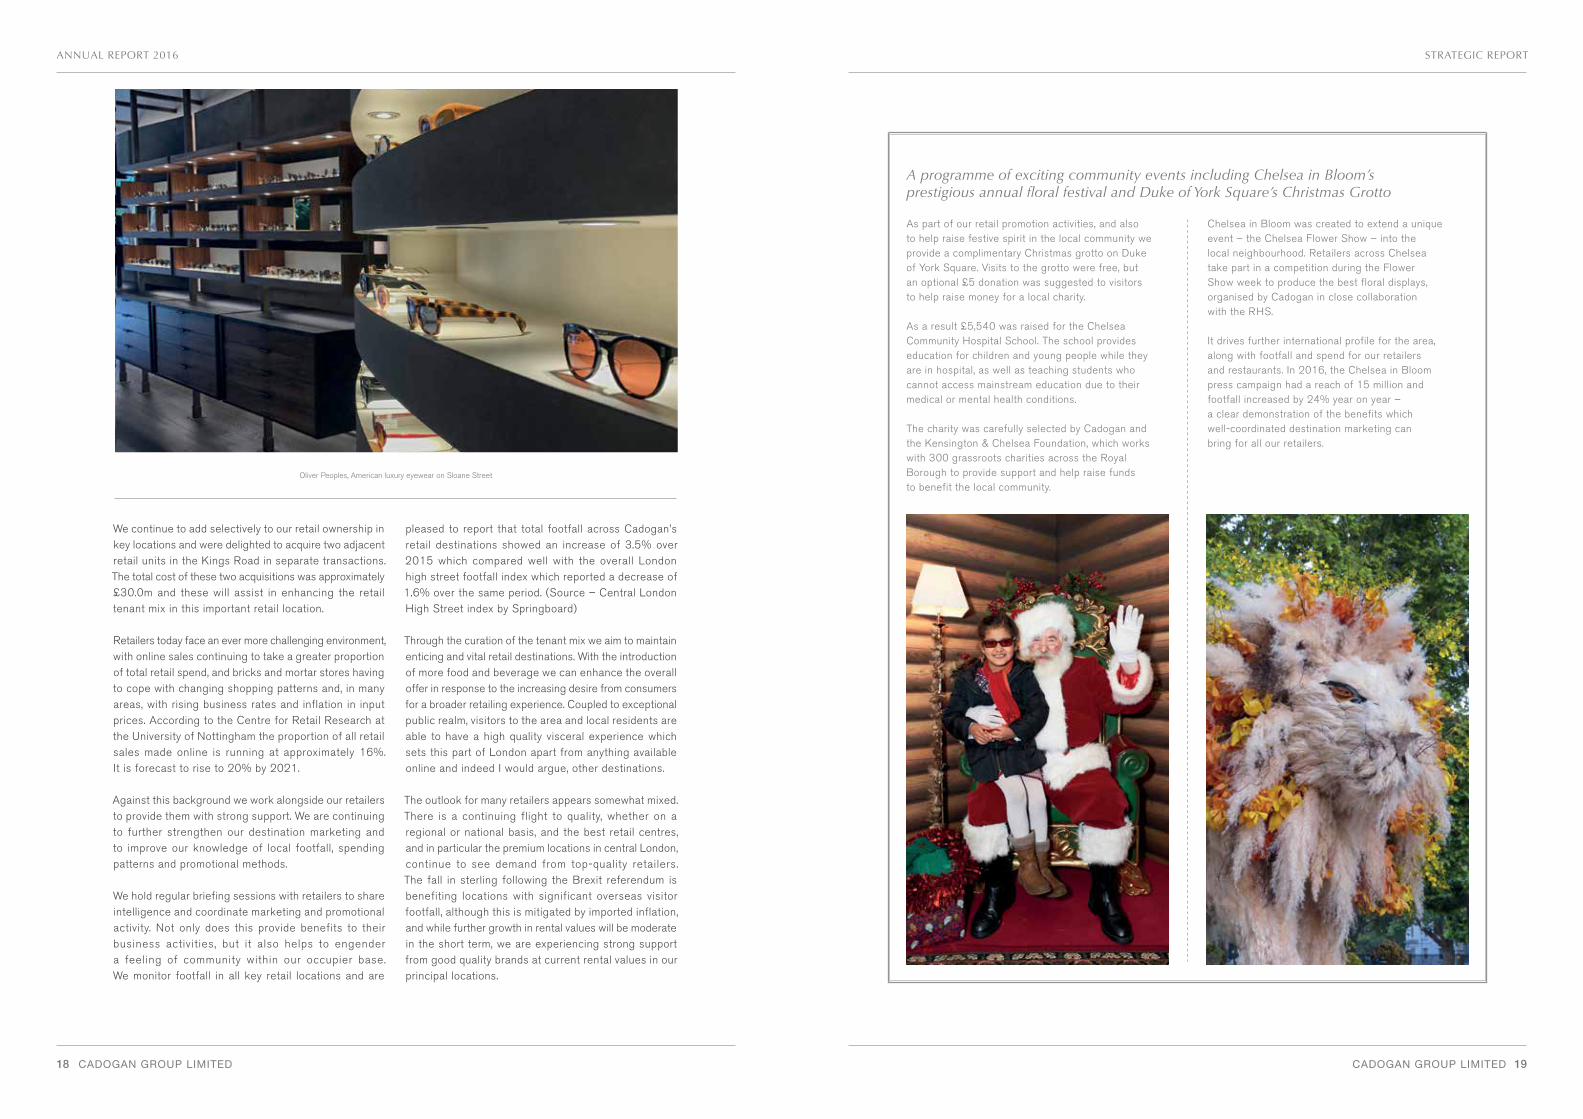
Oliver Peoples, American luxury eyewear on Sloane Street
A programme of exciting community events including Chelsea in Bloom’sprestigious annual floral festival and Duke of York Square’s Christmas Grotto
20 CADOGAN GROUP LIMITED
ANNUAL REPORT 2016
CADOGAN GROUP LIMITED 21
STRATEGIC REPORT
OFFICES
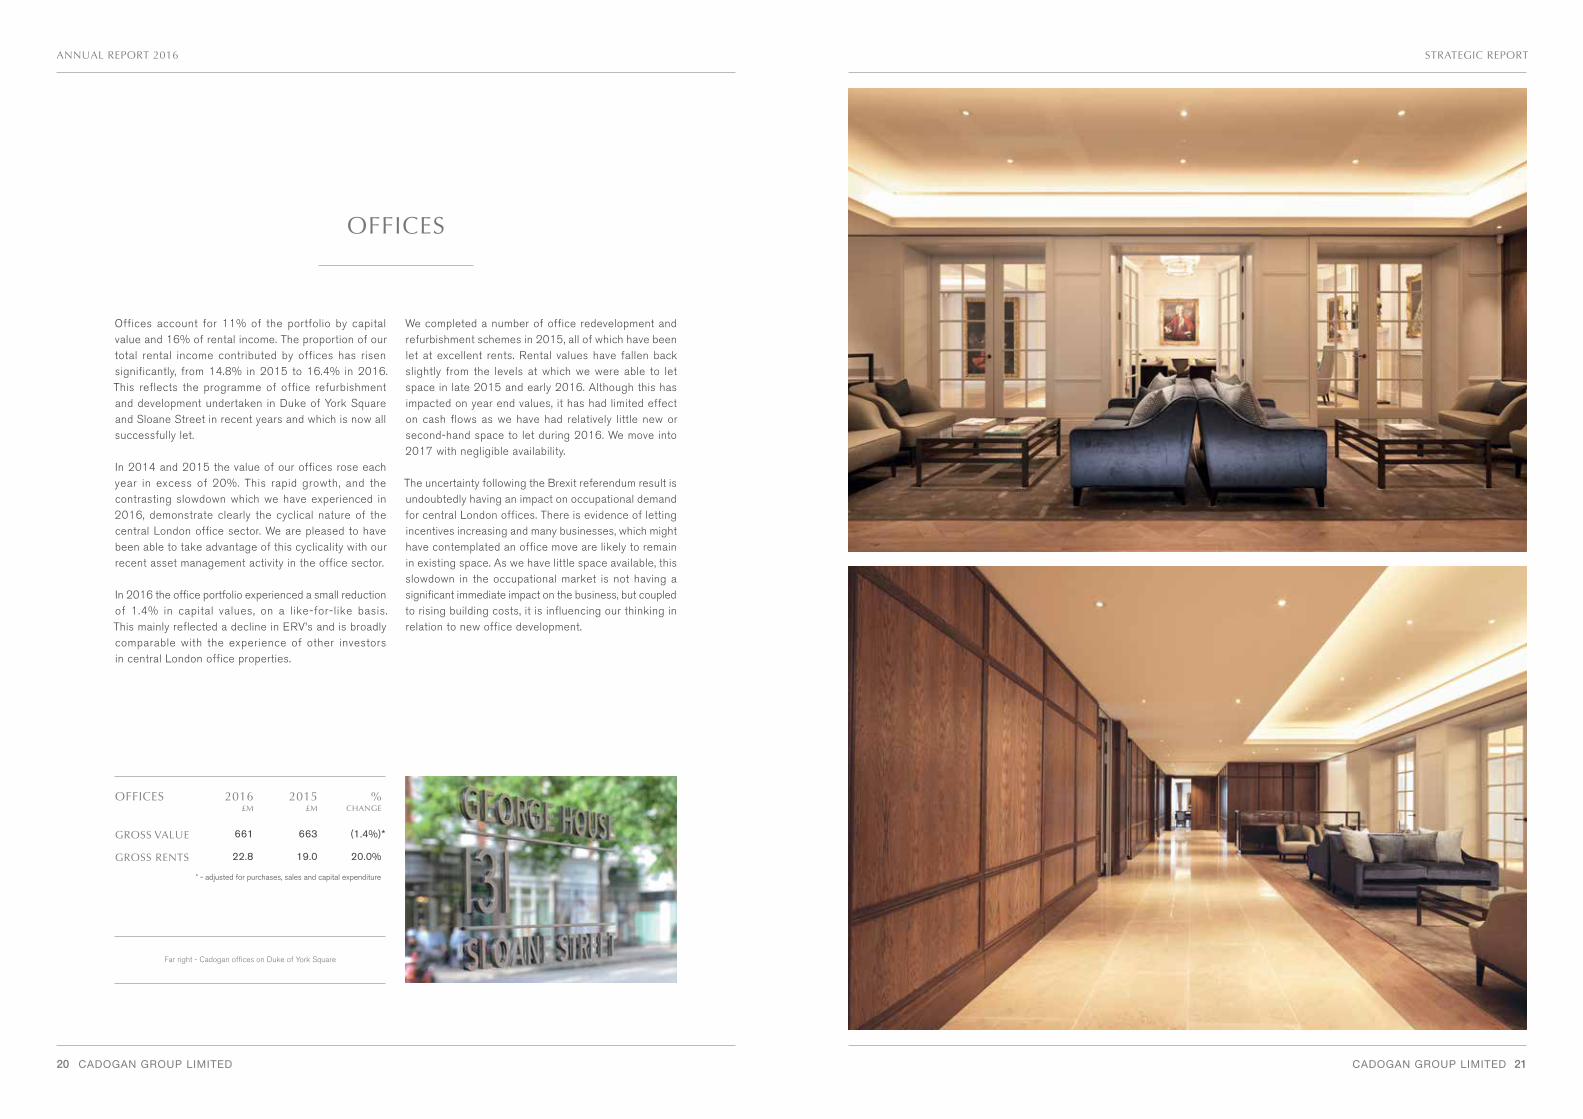
Offices account for 11% of the portfolio by capital value and 16% of rental income. The proportion of our total rental income contributed by offices has risen significantly, from 14.8% in 2015 to 16.4% in 2016. This reflects the programme of office refurbishment and development undertaken in Duke of York Square and Sloane Street in recent years and which is now all successfully let.
In 2014 and 2015 the value of our offices rose each year in excess of 20%. This rapid growth, and the contrasting slowdown which we have experienced in 2016, demonstrate clearly the cyclical nature of the central London office sector. We are pleased to have been able to take advantage of this cyclicality with our recent asset management activity in the office sector.
In 2016 the office portfolio experienced a small reduction of 1.4% in capital values, on a like-for-like basis. This mainly reflected a decline in ERV’s and is broadly comparable with the experience of other investors in central London office properties.
We completed a number of office redevelopment and refurbishment schemes in 2015, all of which have been let at excellent rents. Rental values have fallen back slightly from the levels at which we were able to let space in late 2015 and early 2016. Although this has impacted on year end values, it has had limited effect on cash flows as we have had relatively little new or second-hand space to let during 2016. We move into 2017 with negligible availability.
The uncertainty following the Brexit referendum result is undoubtedly having an impact on occupational demand for central London offices. There is evidence of letting incentives increasing and many businesses, which might have contemplated an office move are likely to remain in existing space. As we have little space available, this slowdown in the occupational market is not having a significant immediate impact on the business, but coupled to rising building costs, it is influencing our thinking in relation to new office development.
OFFICES 2016£M
2015£M
% CHANGE
GROSS VALUE 661 663 (1.4%)*
GROSS RENTS 22.8 19.0 20.0%
* - adjusted for purchases, sales and capital expenditure
Far right - Cadogan offices on Duke of York Square
22 CADOGAN GROUP LIMITED
ANNUAL REPORT 2016
CADOGAN GROUP LIMITED 23
STRATEGIC REPORT
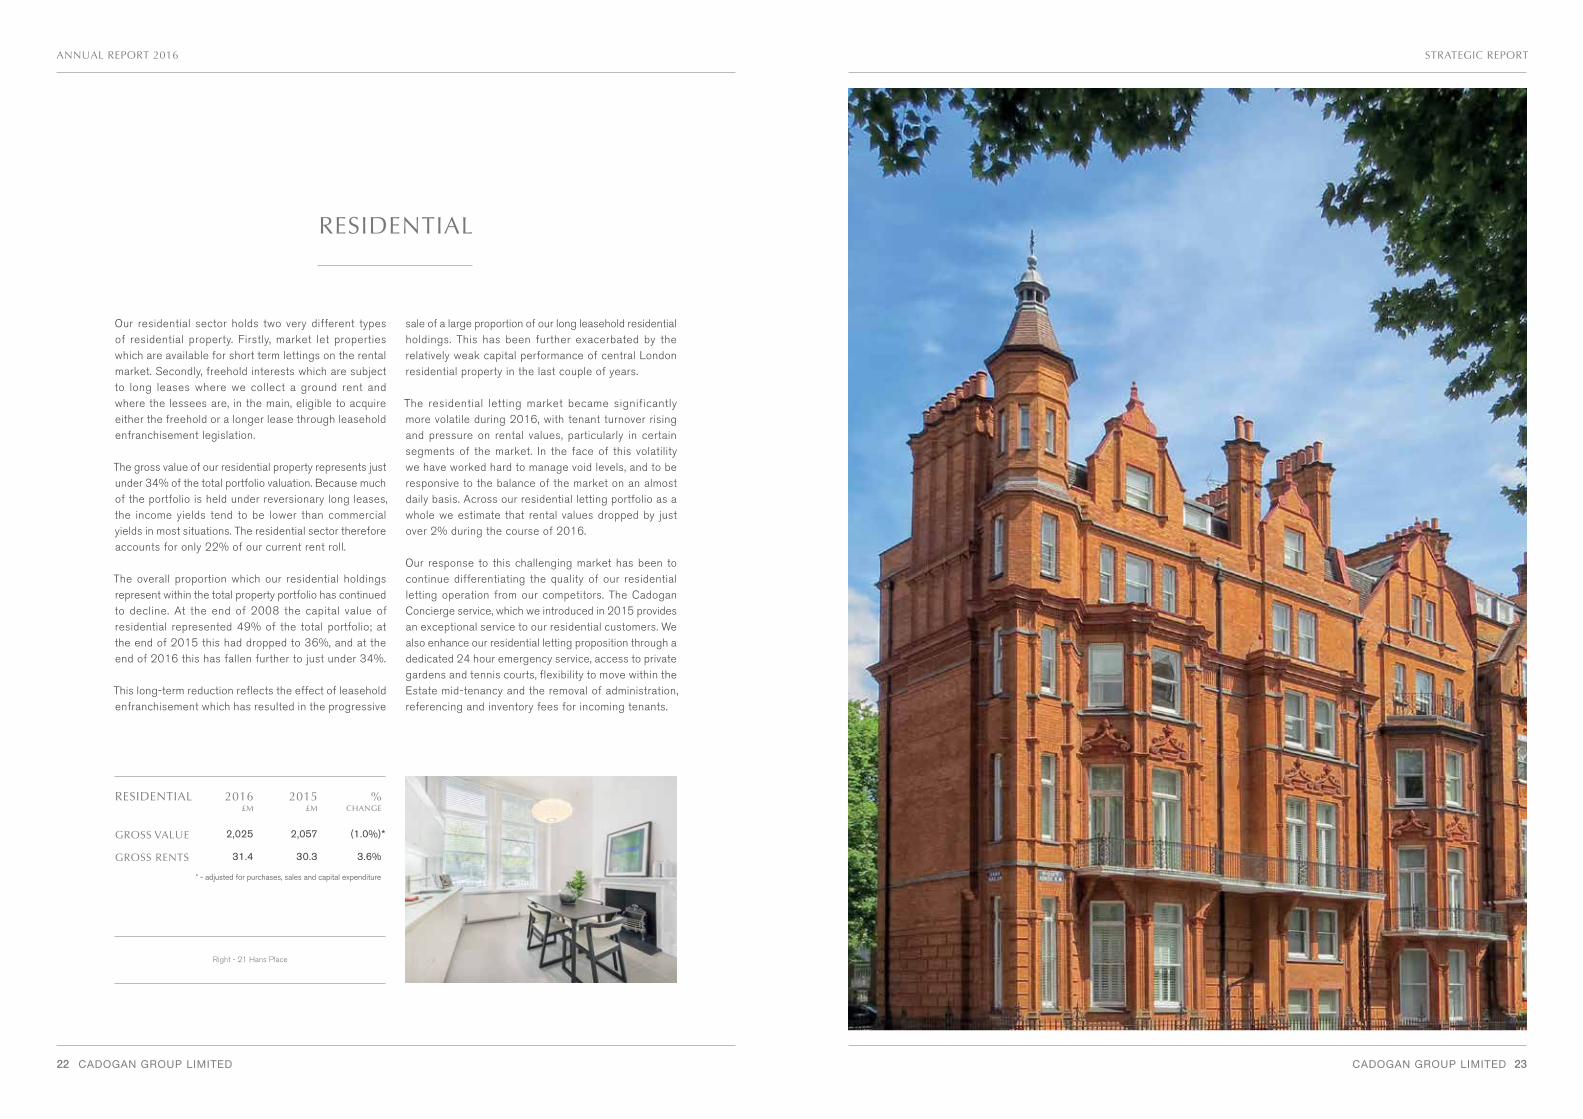
Our residential sector holds two very different types of residential property. Firstly, market let properties which are available for short term lettings on the rental market. Secondly, freehold interests which are subject to long leases where we collect a ground rent and where the lessees are, in the main, eligible to acquire either the freehold or a longer lease through leasehold enfranchisement legislation.
The gross value of our residential property represents just under 34% of the total portfolio valuation. Because much of the portfolio is held under reversionary long leases, the income yields tend to be lower than commercial yields in most situations. The residential sector therefore accounts for only 22% of our current rent roll.
The overall proportion which our residential holdings represent within the total property portfolio has continued to decline. At the end of 2008 the capital value of residential represented 49% of the total portfolio; at the end of 2015 this had dropped to 36%, and at the end of 2016 this has fallen further to just under 34%.
This long-term reduction reflects the effect of leasehold enfranchisement which has resulted in the progressive
sale of a large proportion of our long leasehold residential holdings. This has been further exacerbated by the relatively weak capital performance of central London residential property in the last couple of years.
The residential letting market became significantly more volatile during 2016, with tenant turnover rising and pressure on rental values, particularly in certain segments of the market. In the face of this volatility we have worked hard to manage void levels, and to be responsive to the balance of the market on an almost daily basis. Across our residential letting portfolio as a whole we estimate that rental values dropped by just over 2% during the course of 2016.
Our response to this challenging market has been to continue differentiating the quality of our residential letting operation from our competitors. The Cadogan Concierge service, which we introduced in 2015 provides an exceptional service to our residential customers. We also enhance our residential letting proposition through a dedicated 24 hour emergency service, access to private gardens and tennis courts, flexibility to move within the Estate mid-tenancy and the removal of administration, referencing and inventory fees for incoming tenants.
RESIDENTIAL
* - adjusted for purchases, sales and capital expenditure
RESIDENTIAL 2016£M
2015£M
% CHANGE
GROSS VALUE 2,025 2,057 (1.0%)*
GROSS RENTS 31.4 30.3 3.6%
Right - 21 Hans Place
24 CADOGAN GROUP LIMITED
ANNUAL REPORT 2016
CADOGAN GROUP LIMITED 25
STRATEGIC REPORT
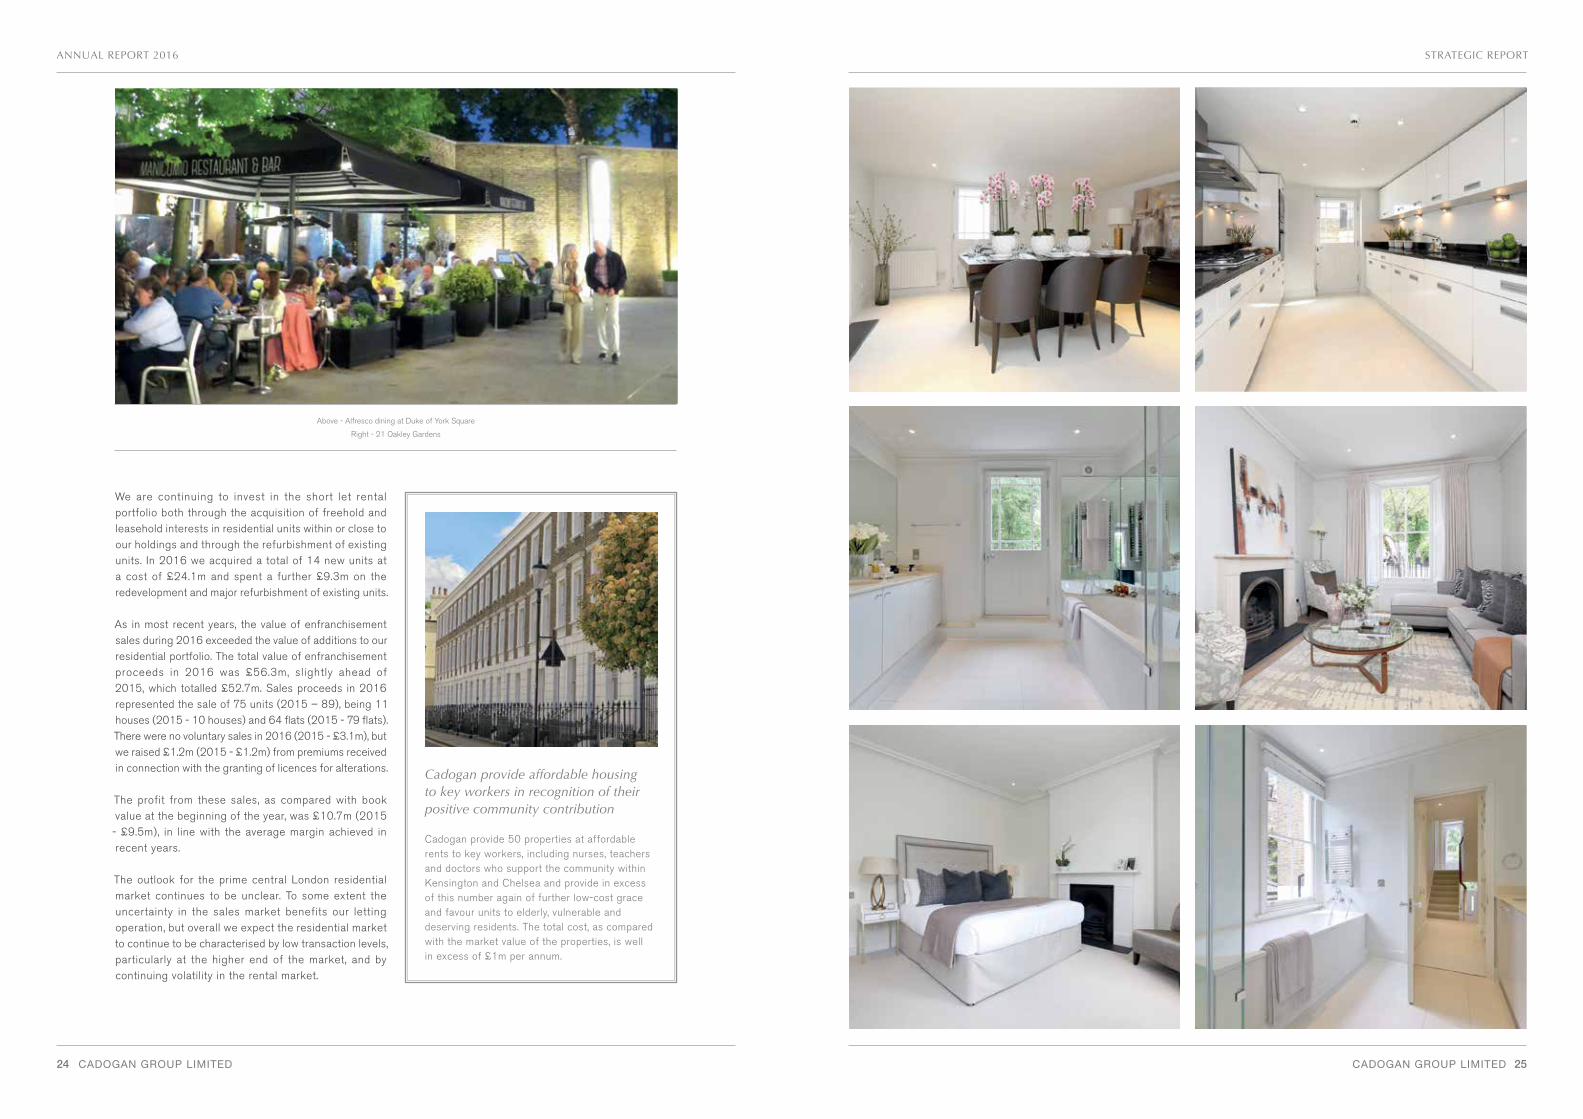
We are continuing to invest in the short let rental portfolio both through the acquisition of freehold and leasehold interests in residential units within or close to our holdings and through the refurbishment of existing units. In 2016 we acquired a total of 14 new units at a cost of £24.1m and spent a further £9.3m on the redevelopment and major refurbishment of existing units.
As in most recent years, the value of enfranchisement sales during 2016 exceeded the value of additions to our residential portfolio. The total value of enfranchisement proceeds in 2016 was £56.3m, slightly ahead of 2015, which totalled £52.7m. Sales proceeds in 2016 represented the sale of 75 units (2015 – 89), being 11 houses (2015 - 10 houses) and 64 flats (2015 - 79 flats). There were no voluntary sales in 2016 (2015 - £3.1m), but we raised £1.2m (2015 - £1.2m) from premiums received in connection with the granting of licences for alterations.
The profit from these sales, as compared with book value at the beginning of the year, was £10.7m (2015 - £9.5m), in line with the average margin achieved in recent years.
The outlook for the prime central London residential market continues to be unclear. To some extent the uncertainty in the sales market benefits our letting operation, but overall we expect the residential market to continue to be characterised by low transaction levels, particularly at the higher end of the market, and by continuing volatility in the rental market.
Cadogan provide affordable housing to key workers in recognition of their positive community contribution
Cadogan provide 50 properties at affordable rents to key workers, including nurses, teachers and doctors who support the community within Kensington and Chelsea and provide in excess of this number again of further low-cost grace and favour units to elderly, vulnerable and deserving residents. The total cost, as compared with the market value of the properties, is well in excess of £1m per annum.
Above - Alfresco dining at Duke of York Square
Right - 21 Oakley Gardens
26 CADOGAN GROUP LIMITED
ANNUAL REPORT 2016
CADOGAN GROUP LIMITED 27
STRATEGIC REPORT
LEISURE AND OTHER
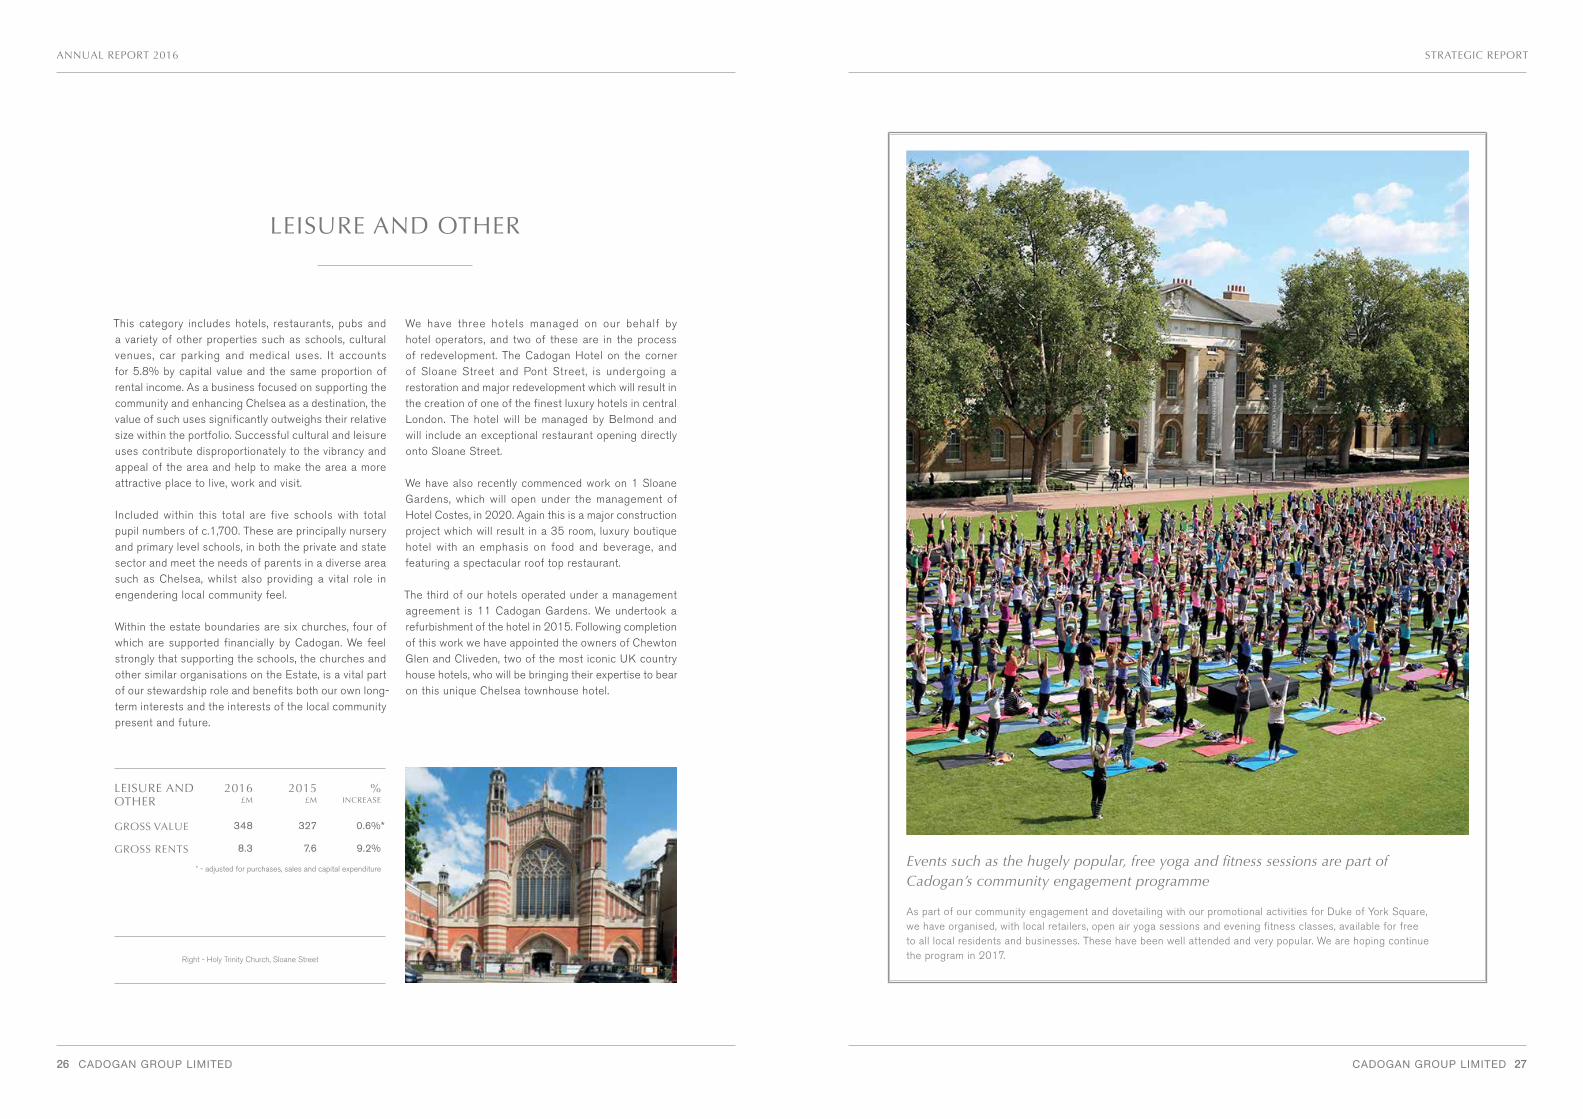
This category includes hotels, restaurants, pubs and a variety of other properties such as schools, cultural venues, car parking and medical uses. It accounts for 5.8% by capital value and the same proportion of rental income. As a business focused on supporting the community and enhancing Chelsea as a destination, the value of such uses significantly outweighs their relative size within the portfolio. Successful cultural and leisure uses contribute disproportionately to the vibrancy and appeal of the area and help to make the area a more attractive place to live, work and visit.
Included within this total are five schools with total pupil numbers of c.1,700. These are principally nursery and primary level schools, in both the private and state sector and meet the needs of parents in a diverse area such as Chelsea, whilst also providing a vital role in engendering local community feel.
Within the estate boundaries are six churches, four of which are supported financially by Cadogan. We feel strongly that supporting the schools, the churches and other similar organisations on the Estate, is a vital part of our stewardship role and benefits both our own long-term interests and the interests of the local community present and future.
We have three hotels managed on our behalf by hotel operators, and two of these are in the process of redevelopment. The Cadogan Hotel on the corner of Sloane Street and Pont Street, is undergoing a restoration and major redevelopment which will result in the creation of one of the finest luxury hotels in central London. The hotel will be managed by Belmond and will include an exceptional restaurant opening directly onto Sloane Street.
We have also recently commenced work on 1 Sloane Gardens, which will open under the management of Hotel Costes, in 2020. Again this is a major construction project which will result in a 35 room, luxury boutique hotel with an emphasis on food and beverage, and featuring a spectacular roof top restaurant.
The third of our hotels operated under a management agreement is 11 Cadogan Gardens. We undertook a refurbishment of the hotel in 2015. Following completion of this work we have appointed the owners of Chewton Glen and Cliveden, two of the most iconic UK country house hotels, who will be bringing their expertise to bear on this unique Chelsea townhouse hotel.
Events such as the hugely popular, free yoga and fitness sessions are part ofCadogan’s community engagement programme
As part of our community engagement and dovetailing with our promotional activities for Duke of York Square, we have organised, with local retailers, open air yoga sessions and evening fitness classes, available for free to all local residents and businesses. These have been well attended and very popular. We are hoping continue the program in 2017.
LEISURE AND OTHER
2016£M
2015£M
% INCREASE
GROSS VALUE 348 327 0.6%*
GROSS RENTS 8.3 7.6 9.2%
* - adjusted for purchases, sales and capital expenditure
Right - Holy Trinity Church, Sloane Street
28 CADOGAN GROUP LIMITED
ANNUAL REPORT 2016
CADOGAN GROUP LIMITED 29
STRATEGIC REPORT
DEVELOPMENTS
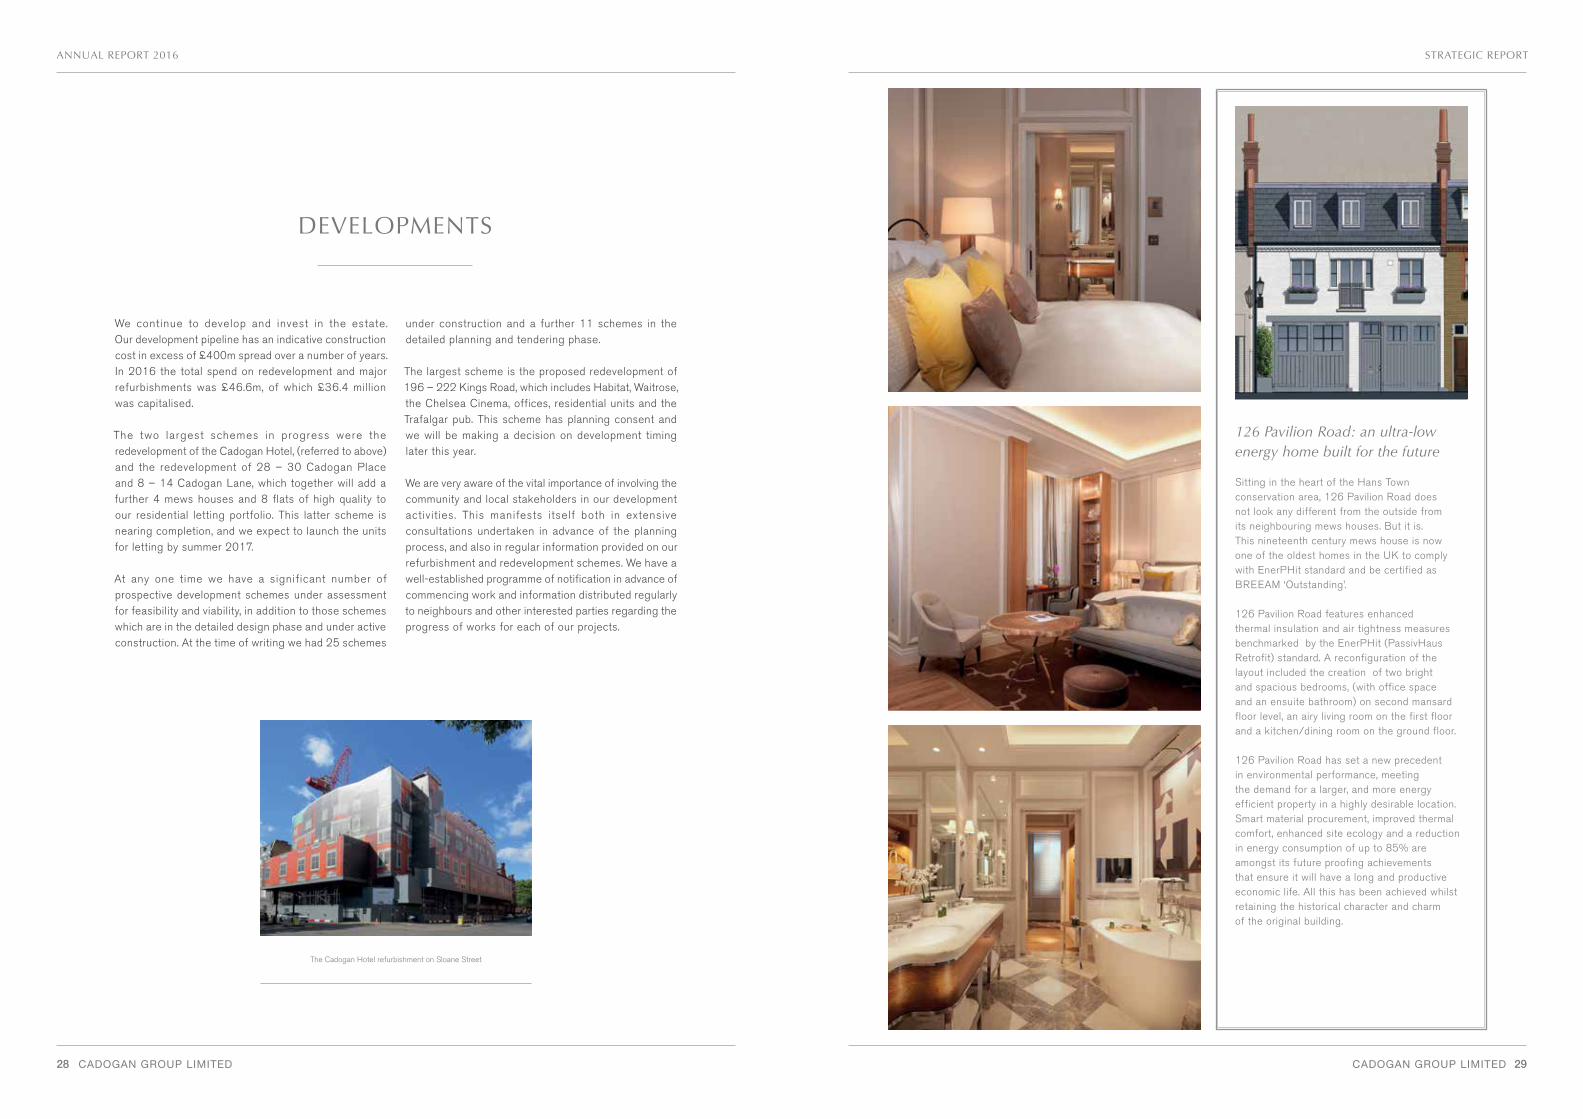
We continue to develop and invest in the estate. Our development pipeline has an indicative construction cost in excess of £400m spread over a number of years. In 2016 the total spend on redevelopment and major refurbishments was £46.6m, of which £36.4 million was capitalised.
The two largest schemes in progress were the redevelopment of the Cadogan Hotel, (referred to above) and the redevelopment of 28 – 30 Cadogan Place and 8 – 14 Cadogan Lane, which together will add a further 4 mews houses and 8 flats of high quality to our residential letting portfolio. This latter scheme is nearing completion, and we expect to launch the units for letting by summer 2017.
At any one time we have a significant number of prospective development schemes under assessment for feasibility and viability, in addition to those schemes which are in the detailed design phase and under active construction. At the time of writing we had 25 schemes
under construction and a further 11 schemes in the detailed planning and tendering phase.
The largest scheme is the proposed redevelopment of 196 – 222 Kings Road, which includes Habitat, Waitrose, the Chelsea Cinema, offices, residential units and the Trafalgar pub. This scheme has planning consent and we will be making a decision on development timing later this year.
We are very aware of the vital importance of involving the community and local stakeholders in our development activities. This manifests itself both in extensive consultations undertaken in advance of the planning process, and also in regular information provided on our refurbishment and redevelopment schemes. We have a well-established programme of notification in advance of commencing work and information distributed regularly to neighbours and other interested parties regarding the progress of works for each of our projects.
126 Pavilion Road: an ultra-low energy home built for the future
Sitting in the heart of the Hans Town conservation area, 126 Pavilion Road does not look any different from the outside from its neighbouring mews houses. But it is. This nineteenth century mews house is now one of the oldest homes in the UK to comply with EnerPHit standard and be certified as BREEAM ‘Outstanding’.
126 Pavilion Road features enhanced thermal insulation and air tightness measures benchmarked by the EnerPHit (PassivHaus Retrofit) standard. A reconfiguration of the layout included the creation of two bright and spacious bedrooms, (with office space and an ensuite bathroom) on second mansard floor level, an airy living room on the first floor and a kitchen/dining room on the ground floor.
126 Pavilion Road has set a new precedent in environmental performance, meeting the demand for a larger, and more energy efficient property in a highly desirable location. Smart material procurement, improved thermal comfort, enhanced site ecology and a reduction in energy consumption of up to 85% are amongst its future proofing achievements that ensure it will have a long and productive economic life. All this has been achieved whilst retaining the historical character and charm of the original building.
The Cadogan Hotel refurbishment on Sloane Street
30 CADOGAN GROUP LIMITED
ANNUAL REPORT 2016
CADOGAN GROUP LIMITED 31
STRATEGIC REPORT
It is difficult to review the prospects for the UK economy other than through the prism of the uncertainty arising from the Brexit referendum and the various UK and continental European elections in progress. While the gloomier prognostications which featured in the lead up to the referendum and the various pessimistic economic forecasts which followed the leave vote have not to date been realised, there is no doubt that we are in a new and uncertain era. Although there has been a strong run of overseas investment into high-quality central London commercial property assets in the last few months we are in a period of heightened political and economic uncertainty, not helped by the business rate increases which will particularly impact retailers in central London.
Although we can see some benefits accruing to our retail and hospitality tenants from the significant fall in sterling, the other side of this is a substantial rise in the cost of building materials and commodities, much of which are imported or priced in dollars. This rise in costs will impact our development projects and, coupled with an uncertain outlook for rental values, will make development appraisals more challenging and bring the profitability of future developments into sharp focus.
No doubt significantly influenced by current uncertainties, UK interest rates have still not risen as forecast. The current 10 year gilt yield is little changed from one year ago and the significant yield gap which property enjoys over cash and debt continues to support property valuations. Share prices in the quoted property sector have been anticipating substantial valuation falls from
current levels since the Brexit vote, but actual reported valuation reductions have been minimal.
Londoners did not vote for Brexit, but we believe that London can meet the challenges and vicissitudes which it has thrown up in its stride. The broad spread and depth of economic activity and growing population should enable London to maintain its position as a global city and the capital city of European business.
Against these many and varied uncertainties, Cadogan continues to be exceptionally well positioned. Our financial position remains strong and we are continuing to invest to enhance the estate. We hold a focused portfolio of unsurpassed quality, with high levels of occupancy and further opportunities to enhance income and value. We pride ourselves on the consistency of our strategy and our ability to take a long term view for the ultimate benefit of the Estate and the local community.
We do not expect the current economic environment to provide much assistance to the progress of our business in the immediate future. Most predictions for property values anticipate small declines this year and next, but we remain confident that the many initiatives and developments which we are undertaking across a broad front will continue to enhance the business and enable us to make good progress in the future
Hugh Seaborn26 April 2017
PROSPECTS
32 CADOGAN GROUP LIMITED
ANNUAL REPORT 2016
CADOGAN GROUP LIMITED 33
STRATEGIC REPORT
FINANCIAL REVIEW
Although there was a significant slowdown in capital growth, rental income and operating profits grew strongly in 2016. These increases reflected both the benefit from the substantial investment programme of the last couple of years, plus the strong growth in demand and rental values which we experienced in both the retail and office sectors in 2014 and 2015. In 2016 the annual rent roll from our office sector grew by 20.0% and by 8.0% in the retail sector. We have also maintained strong control over administration and operating expenses, thus enabling much of the increase in rental income to come through to operating profit.
The growth in office rents reflected the excellent lettings to Marshall Wace in George House, and to Sky and Sterling Square Capital in Duke of York Square which we signed in the early part of 2016. These lettings among others mean that we now have little office space available for letting. Most space currently vacant is in relatively smaller units and in secondary locations.
The growth in retail rents arises principally from the growth in rental values which we have achieved, most significantly at the north end of Sloane Street, but also in Duke of York Square and the east end of the Kings Road. The balance of supply and demand for retail space is closer to equilibrium at present, and we are watching carefully to maintain occupancy levels.
Our residential letting operation had a more volatile year in 2016 with a higher turnover of tenants, particularly after the Brexit vote. As always we monitor the balance of supply and demand in the market extremely closely and are able to move quickly to respond to small changes in the balance of the market to ensure that we minimise void periods. We have also increased our resources to improve the efficiency with which we refresh properties between lettings.
The profit from the sale of investment properties through enfranchisement saw a small increase from £9.5m to £10.7m, slightly fewer transactions were completed, but at a marginally higher average value. The margin over book value was consistent with our long run averages.
Following the Implementation of Financial Reporting Standard (FRS) 102 in 2015 the consolidated income statement now includes the gain arising during the year on the revaluation of investment properties. Last year the revaluation gain totalled £595.0m, but as a result of the significant slowdown in all property markets during 2016 the revaluation gain included in the profit and loss account this year is much reduced to a total of £139.4m.
The overall figure for taxation charge for the year shown in the consolidated income
statement is a credit of £10.2m, this compares with a charge of £14.9m in 2015. Both of these figures are substantially impacted by the change in future rates of Corporation Tax which impact directly on the deferred taxation liability arising on the property revaluation. The charge for current taxation was £10.9m in 2016 and is comparable, after allowing for the increase in operating profitability, with the current tax charge in 2015 of £8.8m.
The underlying level of dividend increase in the year was 5%, but as last year a major shareholder decided to waive their dividend, preferring to leave it invested in the business in the immediate future.
Cadogan is subject to a range of national and local taxes, some are born directly by Cadogan itself, others are collected on behalf of the government and paid over to HMRC. Our total UK tax contribution is set out in the table below. The total amount of tax is significantly greater than the direct tax charge shown in our accounts. We see this as a measure of our wider financial contribution to the UK economy.
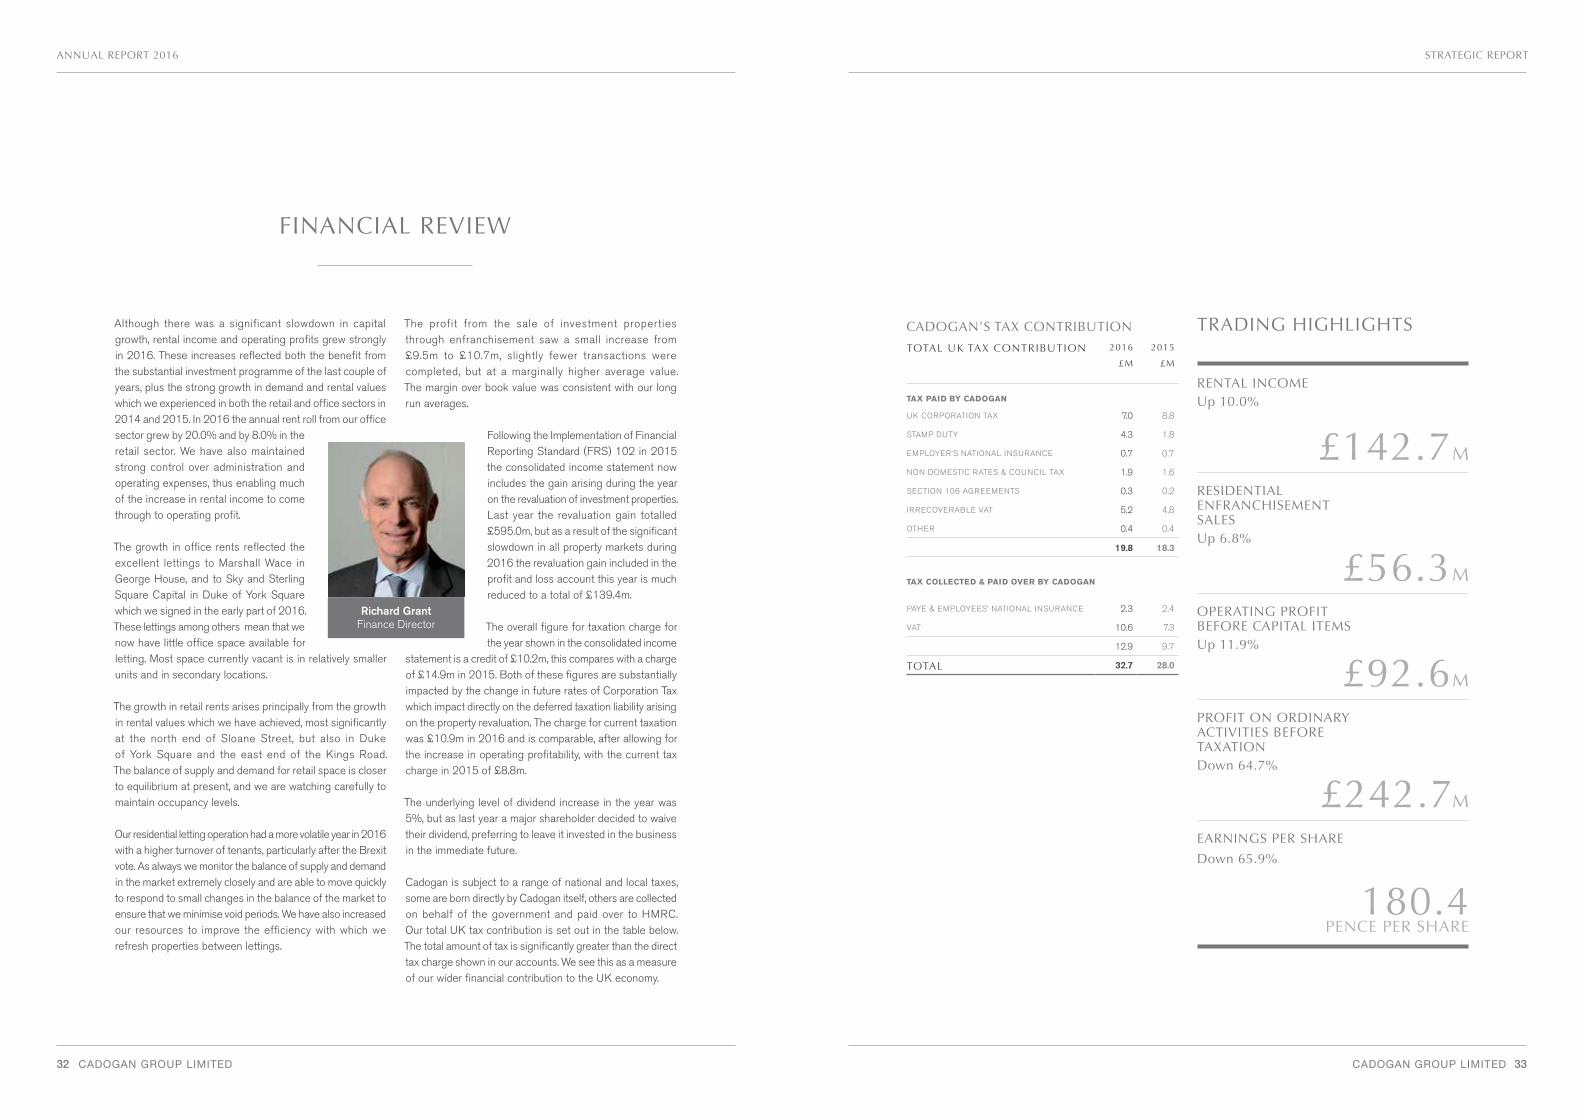
Richard GrantFinance Director
TOTAL UK TAX CONTRIBUTION 2016
£M
2015
£M
TAX PAID BY CADOGAN
UK CORPORATION TAX 7.0 8.8
STAMP DUTY 4.3 1.8
EMPLOYER’S NATIONAL INSURANCE 0.7 0.7
NON DOMESTIC RATES & COUNCIL TAX 1.9 1.6
SECTION 106 AGREEMENTS 0.3 0.2
IRRECOVERABLE VAT 5.2 4.8
OTHER 0.4 0.4
19.8 18.3
TAX COLLECTED & PAID OVER BY CADOGAN
PAYE & EMPLOYEES’ NATIONAL INSURANCE 2.3 2.4
VAT 10.6 7.3
12.9 9.7
TOTAL 32.7 28.0
CADOGAN’S TAX CONTRIBUTION
RENTAL INCOMEUp 10.0%
RESIDENTIAL ENFRANCHISEMENT SALESUp 6.8%
OPERATING PROFIT BEFORE CAPITAL ITEMS Up 11.9%
PROFIT ON ORDINARY ACTIVITIES BEFORE TAXATIONDown 64.7%
EARNINGS PER SHARE
Down 65.9%
TRADING HIGHLIGHTS
£142.7M
£56.3M
£92.6M
£242.7M
180.4PENCE PER SHARE
34 CADOGAN GROUP LIMITED
ANNUAL REPORT 2016
CADOGAN GROUP LIMITED 35
BALANCE SHEET AND BORROWINGS
After several years of double figure percentage increases in property values, 2016 saw a much more modest increase in the value of our in properties totalling 2.4%, taking our gross property values to just under £6.0 billion. This was the principal factor in the rise in group shareholders’ funds to £4.46 billion. Net assets per share increased from £35.69 to £37.17, an overall increase of 4.1%.
There was a substantial increase in the sterling value of our underlying US dollar private placement loans as a result of the impact of mark to market value changes, but this increase in liability was largely offset by a rise in our matching interest rate derivatives and overall there is only a small net increase in our long-term borrowing position. Offsetting these borrowings were cash balances totalling £71.2m at 31 December 2016, the decrease from the previous year end’s figure of £88.7m representing the overall net cash outflow for the year.
Balance sheet gearing increased marginally from 13.7% to 13.9%, but our interest cover improved from 2.5 to 2.8 times, continuing to demonstrate our fundamental financial strength.
There were no changes during the year to our borrowing arrangements; our existing portfolio of term debt remains in place providing us with interest rate certainty and long-term financial security. At 31 December 2016 the average maturity of our debt portfolio is 15.3 years and the average effective rate across all our loans remains at 5.3%. Our earliest debt maturity within our long-term debt portfolio is August next year when £24.0m of debt from our 2008 private placement issue matures. Even if interest rates rise from current levels, we are anticipating that we will be able to refinance at significantly lower rates than those currently attaching to the loan.
At the year end we have total available undrawn financial facilities amounting to £131.2m represented by our cash balances on hand, together with £60.0m of available committed banking facilities. In addition we have a further £100m available from pre-arranged, but uncommitted facilities.
STRATEGIC REPORT
36 CADOGAN GROUP LIMITED
ANNUAL REPORT 2016
CADOGAN GROUP LIMITED 37
APPROACH TO RISK MANAGEMENT
Cadogan has a well-developed strategy and process for the management of risks faced by the business. Management of risk is an essential element in any modern business. Overall responsibility for risk management lies with the group board, which recognises that there are inherent risks in running any business and which is responsible for determining the group’s risk appetite and ensuring that the group’s risk management system properly identifies, understands and manages all relevant risks.
The group’s risk appetite and processes for managing risk are regularly reviewed by the board. The Finance Director, supported by the senior management team is responsible for compiling the Risk Register which is updated on a regular basis. The Risk Register identifies the principal risks impacting on the business and the group’s financial position, it provides an assessment of the likelihood of the identified risks materialising and includes an estimate of the potential impact of each area of risk on the business. The Register is formally reviewed by the board at least annually and this forms an important part of the overall risk management process. The group also makes use of appropriate external specialists to advise on compliance with established policies and external regulations.
Cadogan is a long term property investor with a clear focus on high quality property assets located in central London. Because of its private ownership and long-term outlook the group aims for, and is able to achieve, a high level of resilience in all areas of the business.
Cadogan assess risk under three principal headings.• Strategic risks• Financial risks • Operational risks
STRATEGIC RISKSProperty market risks – the risks arising from property cycles and from shorter term unexpected changes in the market for property investment, development and occupation.
Most property markets are cyclical, and this is particularly true of central London. As a long-term investor the group is less reliant than others on predicting property market cycles and aims to manage the impact of the property cycle and any other short-term fluctuations in values or activity levels by ensuring a relatively high proportion of committed long term loan finance and high levels of available liquidity. These factors also assist the group in managing cash flow and liquidity risks.
The impact of the Brexit vote on the UK economy and on the central London property market remains unclear. The outlook for property in central London will continue to be uncertain for at least as long as the period of exit negotiations lasts.
Geographic concentration – the group accepts the risks inherent in the small geographic area in which the group’s properties are concentrated. All of the group’s properties are located in Kensington and Chelsea, which for many years has been an area renowned for long-term prosperity and economic resilience. The group also seeks to balance this geographic concentration through a diversified portfolio of uses and through close attention to the balance between sectors. The largest individual property represents 3.5% of the total portfolio value and the highest individual rent 4.3% of total annual rental income.
The group monitors and is actively involved in consultation with the Royal Borough of Kensington and Chelsea where it considers that it could be affected by changes or developments to local planning policies.
Development risks – Cadogan regularly undertakes substantial development projects, but carefully considers the timing to ensure that the group’s exposure to development risk is controlled, both relative to the overall portfolio and to potentially competing schemes in the same area. Cadogan consults widely on development schemes to ensure that schemes are designed to the highest quality and to assist in obtaining the most appropriate planning consent.
Risks associated with London’s position as a global capital – London’s advance as a global capital has been a significant factor in the overall prosperity of central London in recent years. There are risks to this position from a number of factors, most significantly from the Brexit negotiations, terrorism, under-investment in infrastructure and adverse changes to the tax regime, particularly affecting overseas investors. The group cannot manage or control these risks but Cadogan takes an active role in lobbying through organisations such as London First and the British Property Federation amongst others, to ensure that the long-term health of London is at the forefront of the minds of national and local government.
FINANCIAL RISKSInterest rate risk – The majority of long-term borrowings are at fixed rates of interest, achieved either by agreement with the lender, or through the interest rate derivatives market. The board requires at least 75% of long-term debt to be subject to fixed rates of interest. The group does not undertake financial instrument transactions that are speculative or unrelated to trading activities. Board approval is required for the use of any new financial instrument.
Refinancing risk – The group seeks to manage refinancing risk through the use of a spread of loan maturities. In normal circumstances loan terms are for an initial period of 10 years or more. The incidence of maturities is spread so as to ensure that major re-financings are spaced out over time. Foreign currencies – Some of the private placings of debt which the group has undertaken have included a significant proportion of US dollar borrowings. All exposure to US dollars in relation to both interest and capital repayments has been swapped into sterling on the date on which the
loans were committed, and as a result there is no residual foreign exchange risk exposure to the group. Operationally the group has no foreign currency exposure.
Compliance with financial covenants – The group has provided financial covenants to its lenders to support its unsecured borrowings. The group’s financial position is regularly monitored against the covenant requirements to ensure that the group has substantial financial headroom and is not at risk of breaching any of the covenants. Scenario planning is used to assess the sensitivity of potential changes to the principal financial measures which might impact the ability to meet covenant requirements.
OPERATIONAL RISKSProperty loss and damage – All the group’s properties are insured against loss or damage on a full reinstatement basis, including three years loss of rental income. Cover includes terrorism risk which is provided by a major insurer and member of Pool Re.
Health and safety risks – The group accords a high priority to health and safety issues. Health and safety issues are always discussed at the monthly Property Management Committee meeting and all incidents are reported and reviewed on a monthly basis. From time to time the group undertakes external reviews and audits of its health and safety policies and procedures, the results of which have confirmed the quality and integrity of health and safety practices.
IT, telecommunications and business continuity risks – Following the move to new offices in 2015 the group upgraded its IT and telecommunications systems, with a particular emphasis on the development of inherent resilience and backup capability. The group has a detailed business continuity plan which is reviewed and updated annually. The group undertakes regular external cyber security reviews and implements any resulting recommendations for security improvements.
Richard Grant26 April 2017
STRATEGIC REPORT
38 CADOGAN GROUP LIMITED
ANNUAL REPORT 2016
CADOGAN GROUP LIMITED 39
The directors present their report and the financial statements for the year ended 31 December 2016.
DIRECTORS’ REPORT
PRINCIPAL ACTIVITY AND REVIEW OF THE BUSINESSThe principal activity of the group during the year continued to be property investment. The group’s other activities include the operation of hotels and a concert hall. A review of the group’s business during 2016 and its future prospects is contained in the Strategic Report on pages 12 to 37.
DIVIDENDS Interim dividends of £19,078,000 (2015 – £18,508,000) were declared and paid during the year.
RISK MANAGEMENTA summary of the principal risks and uncertainties has been included in the Strategic Report on pages 36 to 37.
DIRECTORSAll the directors holding office during the financial year and up to the date of this report are listed on page 1.
The ultimate holding company maintains l iabil ity insurance for its directors and officers and for those of its subsidiaries in respect of proceedings brought by third parties, subject to the conditions set out in section 234 of the Companies Act 2006. Such qualifying third party indemnity provision remains in force as at the date of approving the Directors’ Report.
CHARITABLE CONTRIBUTIONSThe group’s charitable contributions for the year were £73,000 (2015 – £77,000). In addition, the Cadogan Charity, a shareholder in the company, makes donations to a variety of local and national charities.
GOING CONCERNThe group’s business activities, together with the factors likely to affect its future development, its financial position, financial risk management objectives, details
DIRECTORS’ REPORT
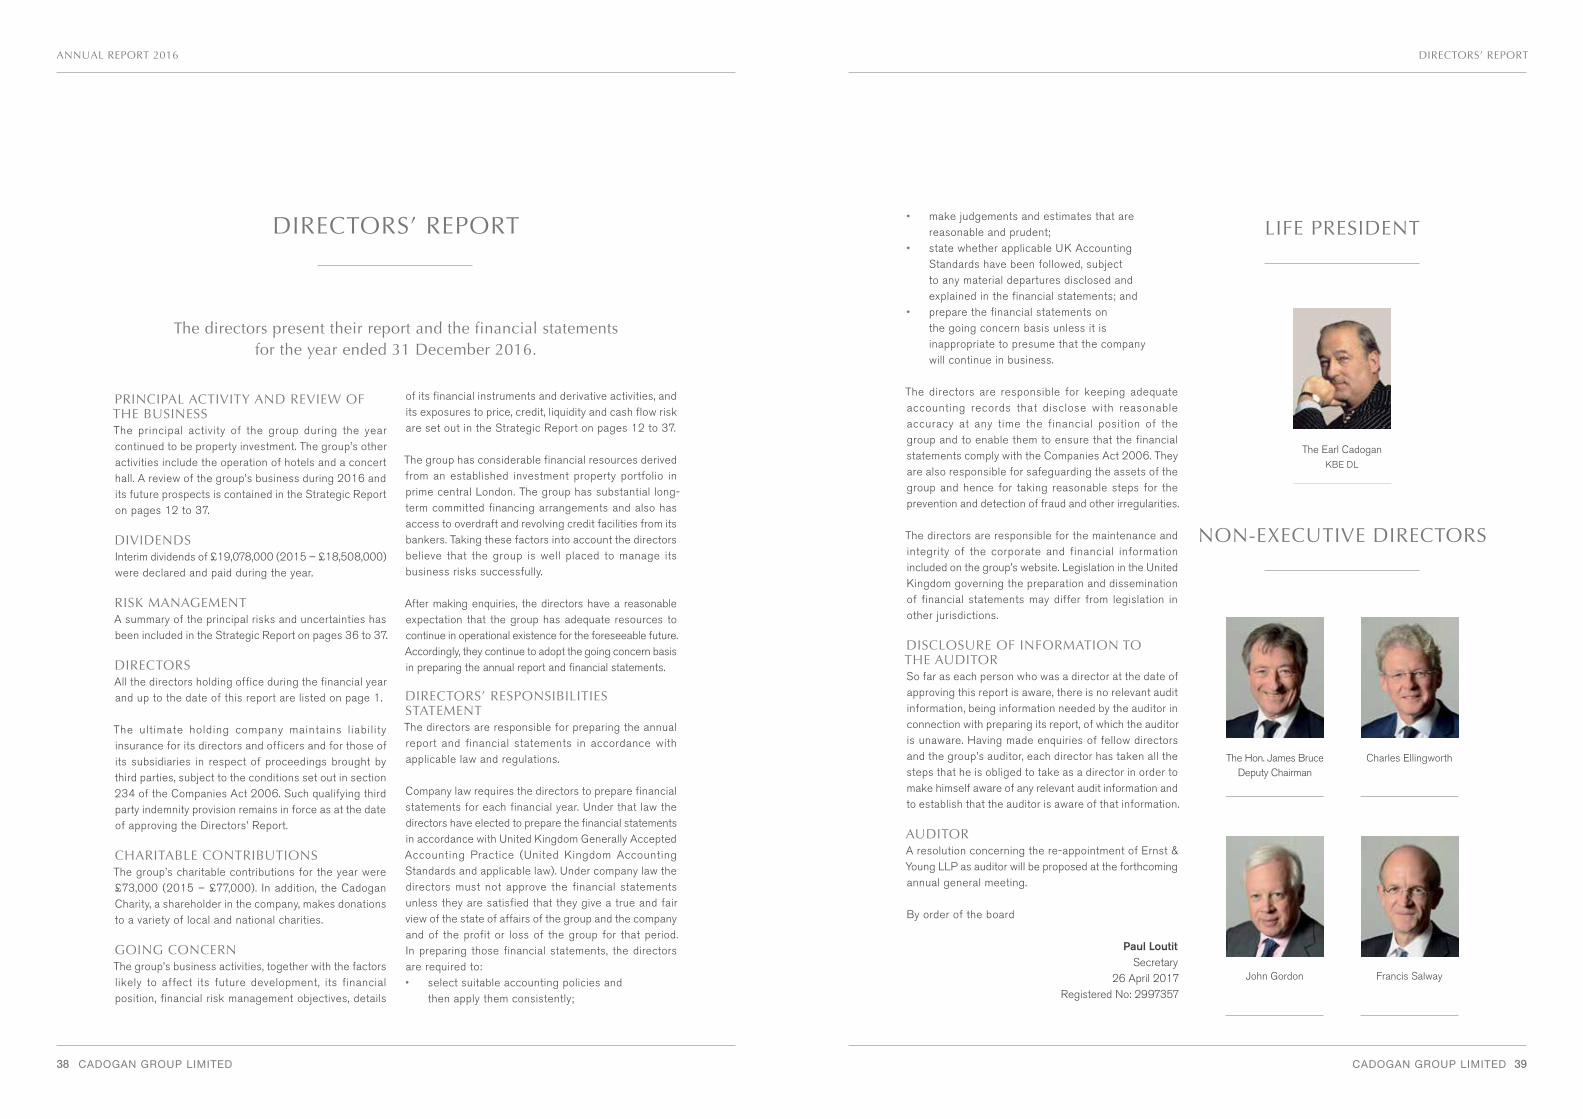
NON-EXECUTIVE DIRECTORS
The Hon. James BruceDeputy Chairman
Charles Ellingworth
John Gordon Francis Salway
LIFE PRESIDENT
The Earl Cadogan KBE DL
of its financial instruments and derivative activities, and its exposures to price, credit, liquidity and cash flow risk are set out in the Strategic Report on pages 12 to 37.
The group has considerable financial resources derived from an established investment property portfolio in prime central London. The group has substantial long-term committed financing arrangements and also has access to overdraft and revolving credit facilities from its bankers. Taking these factors into account the directors believe that the group is well placed to manage its business risks successfully.
After making enquiries, the directors have a reasonable expectation that the group has adequate resources to continue in operational existence for the foreseeable future. Accordingly, they continue to adopt the going concern basis in preparing the annual report and financial statements.
DIRECTORS’ RESPONSIBILITIES STATEMENT The directors are responsible for preparing the annual report and financial statements in accordance with applicable law and regulations.
Company law requires the directors to prepare financial statements for each financial year. Under that law the directors have elected to prepare the financial statements in accordance with United Kingdom Generally Accepted Accounting Practice (United Kingdom Accounting Standards and applicable law). Under company law the directors must not approve the financial statements unless they are satisfied that they give a true and fair view of the state of affairs of the group and the company and of the profit or loss of the group for that period. In preparing those financial statements, the directors are required to:• select suitable accounting policies and
then apply them consistently;
• make judgements and estimates that are reasonable and prudent;
• state whether applicable UK Accounting Standards have been followed, subject to any material departures disclosed and explained in the financial statements; and
• prepare the financial statements on the going concern basis unless it is inappropriate to presume that the company will continue in business.
The directors are responsible for keeping adequate accounting records that disclose with reasonable accuracy at any time the financial position of the group and to enable them to ensure that the financial statements comply with the Companies Act 2006. They are also responsible for safeguarding the assets of the group and hence for taking reasonable steps for the prevention and detection of fraud and other irregularities.
The directors are responsible for the maintenance and integrity of the corporate and financial information included on the group’s website. Legislation in the United Kingdom governing the preparation and dissemination of financial statements may differ from legislation in other jurisdictions.
DISCLOSURE OF INFORMATION TO THE AUDITORSo far as each person who was a director at the date of approving this report is aware, there is no relevant audit information, being information needed by the auditor in connection with preparing its report, of which the auditor is unaware. Having made enquiries of fellow directors and the group’s auditor, each director has taken all the steps that he is obliged to take as a director in order to make himself aware of any relevant audit information and to establish that the auditor is aware of that information.
AUDITORA resolution concerning the re-appointment of Ernst & Young LLP as auditor will be proposed at the forthcoming annual general meeting.
By order of the board
Paul Loutit Secretary
26 April 2017Registered No: 2997357
40 CADOGAN GROUP LIMITED
ANNUAL REPORT 2016
CADOGAN GROUP LIMITED 41
INDEPENDENT AUDITOR’S REPORT
We have audited the financial statements of Cadogan Group Limited for the year ended 31 December 2016 which comprise the Consolidated Income Statement, the Consolidated and Company Statement of Comprehensive Income, the Consolidated and Company Statement of Changes in Equity, the Consolidated and Company Statement of Financial Position and the Consolidated Statement of Cash Flows and the related notes 1 to 23. The financial reporting framework that has been applied in their preparation is applicable law and United Kingdom Accounting Standards (United Kingdom Generally Accepted Accounting Practice), including FRS 102 ‘The Financial Reporting Standard applicable to the UK and Republic of Ireland’.
This report is made solely to the company’s members, as a body, in accordance with Chapter 3 of Part 16 of the Companies Act 2006. Our audit work has been undertaken so that we might state to the company’s members those matters we are required to state to them in an auditor’s report and for no other purpose. To the fullest extent permitted by law, we do not accept or assume responsibility to anyone other than the company and the company’s members as a body, for our audit work, for this report, or for the opinions we have formed.
RESPECTIVE RESPONSIBILITIES OF DIRECTORS AND AUDITORAs explained more fully in the Directors’ Responsibilities Statement set out on pages 38 to 39, the directors are responsible for the preparation of the financial statements and for being satisfied that they give a true and fair view. Our responsibility is to audit and express an opinion on the financial statements in accordance with applicable law and International Standards on Auditing (UK and Ireland). Those standards require us to comply with the Auditing Practices Board’s Ethical Standards for Auditors.
SCOPE OF THE AUDIT OF THE FINANCIAL STATEMENTSAn audit involves obtaining evidence about the amounts and disclosures in the financial statements sufficient to give reasonable assurance that the financial statements are free from material misstatement, whether caused by fraud or error. This includes an assessment of: whether the accounting policies are appropriate to the group’s and the parent company’s circumstances and have been consistently applied and adequately disclosed; the reasonableness of significant accounting estimates made by the directors; and the overall presentation of the financial statements.
In addition, we read all the financial and non-financial information in the report and financial statements to identify material inconsistencies with the audited financial statements and to identify any information that is apparently materially incorrect based on, or materially inconsistent with, the knowledge acquired by us in the course of performing the audit. If we become aware of any apparent material misstatements or inconsistencies we consider the implications for our report.
OPINION ON THE FINANCIAL STATEMENTSIn our opinion the financial statements:• give a true and fair view of the state of the
group’s and parent company’s affairs as at 31 December 2016 and of the group’s profit for the year then ended;
• have been properly prepared in accordance with United Kingdom Generally Accepted Accounting Practice, including FRS 102 ‘The Financial Reporting Standard applicable to the UK and Republic of Ireland’; and
• have been prepared in accordance with the requirements of the Companies Act 2006.
OPINION ON OTHER MATTERS PRESCRIBED BY THE COMPANIES ACT 2006In our opinion based on the work undertaken in the course of the audit:• the information given in Chairman’s
Statement, the Strategic Report and the Directors’ Report for the financial year for which the financial statements are prepared is consistent with the financial statements.
• the Chairman’s Statement, the Strategic Report and the Directors’ Report have been prepared in accordance with applicable legal requirements.
MATTERS ON WHICH WE ARE REQUIRED TO REPORT BY EXCEPTIONIn light of the knowledge and understanding of the company and its environment obtained in the course of the audit, we have identified no material misstatements in the Chairman’s Statement, the Strategic Report or the Directors’ Report. We have nothing to report in respect of the following matters where the Companies Act 2006 requires us to report to you if, in our opinion:• adequate accounting records have
not been kept, or returns adequate for our audit have not been received from branches not visited by us; or
• the parent company financial statements are not in agreement with the accounting records and returns; or
• certain disclosures of directors’ remuneration specified by law are not made; or
• we have not received all the information and explanations we require for our audit.
Eamonn McGrath (Senior statutory auditor)for and on behalf of
Ernst & Young LLP, Statutory Auditor
London 26 April 2017
INDEPENDENT AUDITOR’S REPORT TO THE MEMEBERS OF CADOGAN GROUP LIMITED
42 CADOGAN GROUP LIMITED
ANNUAL REPORT 2016
CADOGAN GROUP LIMITED 43
2016£000
2015£000
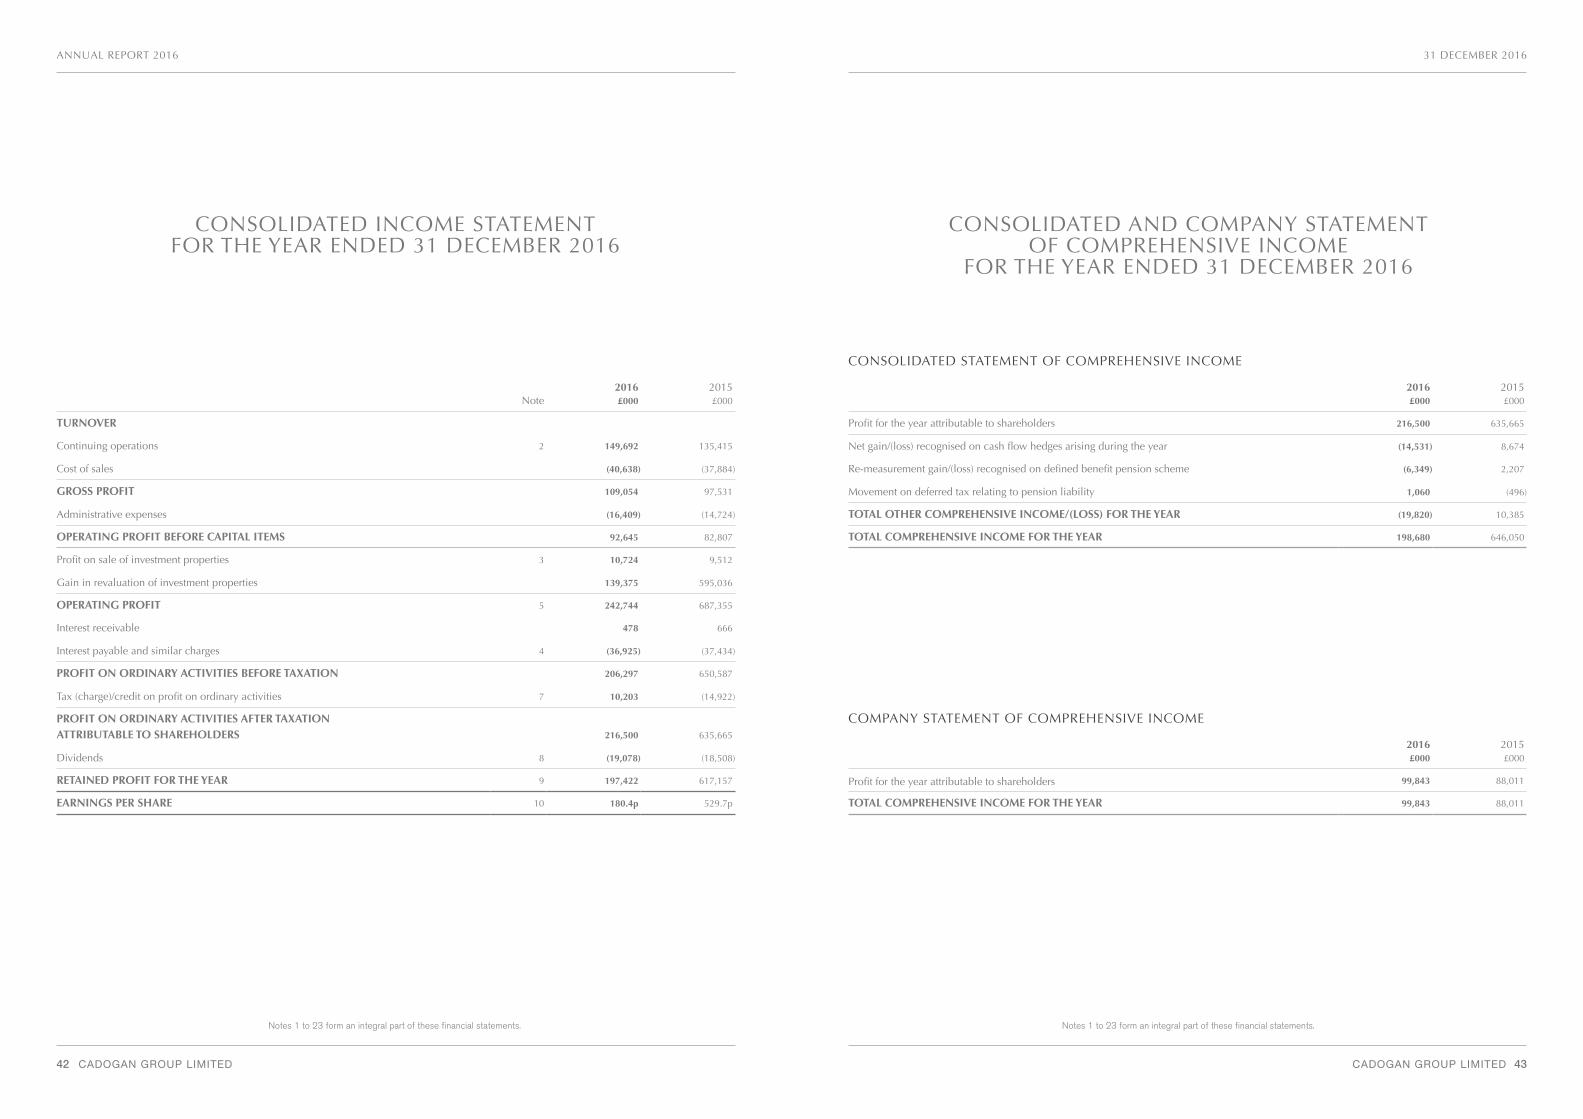
Profit for the year attributable to shareholders 99,843 88,011
TOTAL COMPREHENSIVE INCOME FOR THE YEAR 99,843 88,011
31 DECEMBER 2016
2016£000
2015£000
Profit for the year attributable to shareholders 216,500 635,665
Net gain/(loss) recognised on cash flow hedges arising during the year (14,531) 8,674
Re-measurement gain/(loss) recognised on defined benefit pension scheme (6,349) 2,207
Movement on deferred tax relating to pension liability 1,060 (496)
TOTAL OTHER COMPREHENSIVE INCOME/(LOSS) FOR THE YEAR (19,820) 10,385
TOTAL COMPREHENSIVE INCOME FOR THE YEAR 198,680 646,050
Notes 1 to 23 form an integral part of these financial statements.Notes 1 to 23 form an integral part of these financial statements.
CONSOLIDATED INCOME STATEMENT FOR THE YEAR ENDED 31 DECEMBER 2016
Note2016£000
2015£000
TURNOVER
Continuing operations 2 149,692 135,415
Cost of sales (40,638) (37,884)
GROSS PROFIT 109,054 97,531
Administrative expenses (16,409) (14,724)
OPERATING PROFIT BEFORE CAPITAL ITEMS 92,645 82,807
Profit on sale of investment properties 3 10,724 9,512
Gain in revaluation of investment properties 139,375 595,036
OPERATING PROFIT 5 242,744 687,355
Interest receivable 478 666
Interest payable and similar charges 4 (36,925) (37,434)
PROFIT ON ORDINARY ACTIVITIES BEFORE TAXATION 206,297 650,587
Tax (charge)/credit on profit on ordinary activities 7 10,203 (14,922)
PROFIT ON ORDINARY ACTIVITIES AFTER TAXATION ATTRIBUTABLE TO SHAREHOLDERS 216,500 635,665
Dividends 8 (19,078) (18,508)
RETAINED PROFIT FOR THE YEAR 9 197,422 617,157
EARNINGS PER SHARE 10 180.4p 529.7p
CONSOLIDATED AND COMPANY STATEMENT OF COMPREHENSIVE INCOME
FOR THE YEAR ENDED 31 DECEMBER 2016
CONSOLIDATED STATEMENT OF COMPREHENSIVE INCOME
COMPANY STATEMENT OF COMPREHENSIVE INCOME
44 CADOGAN GROUP LIMITED
ANNUAL REPORT 2016
CADOGAN GROUP LIMITED 45
31 DECEMBER 2016
Note2016£000
2015£000
FIXED ASSETS
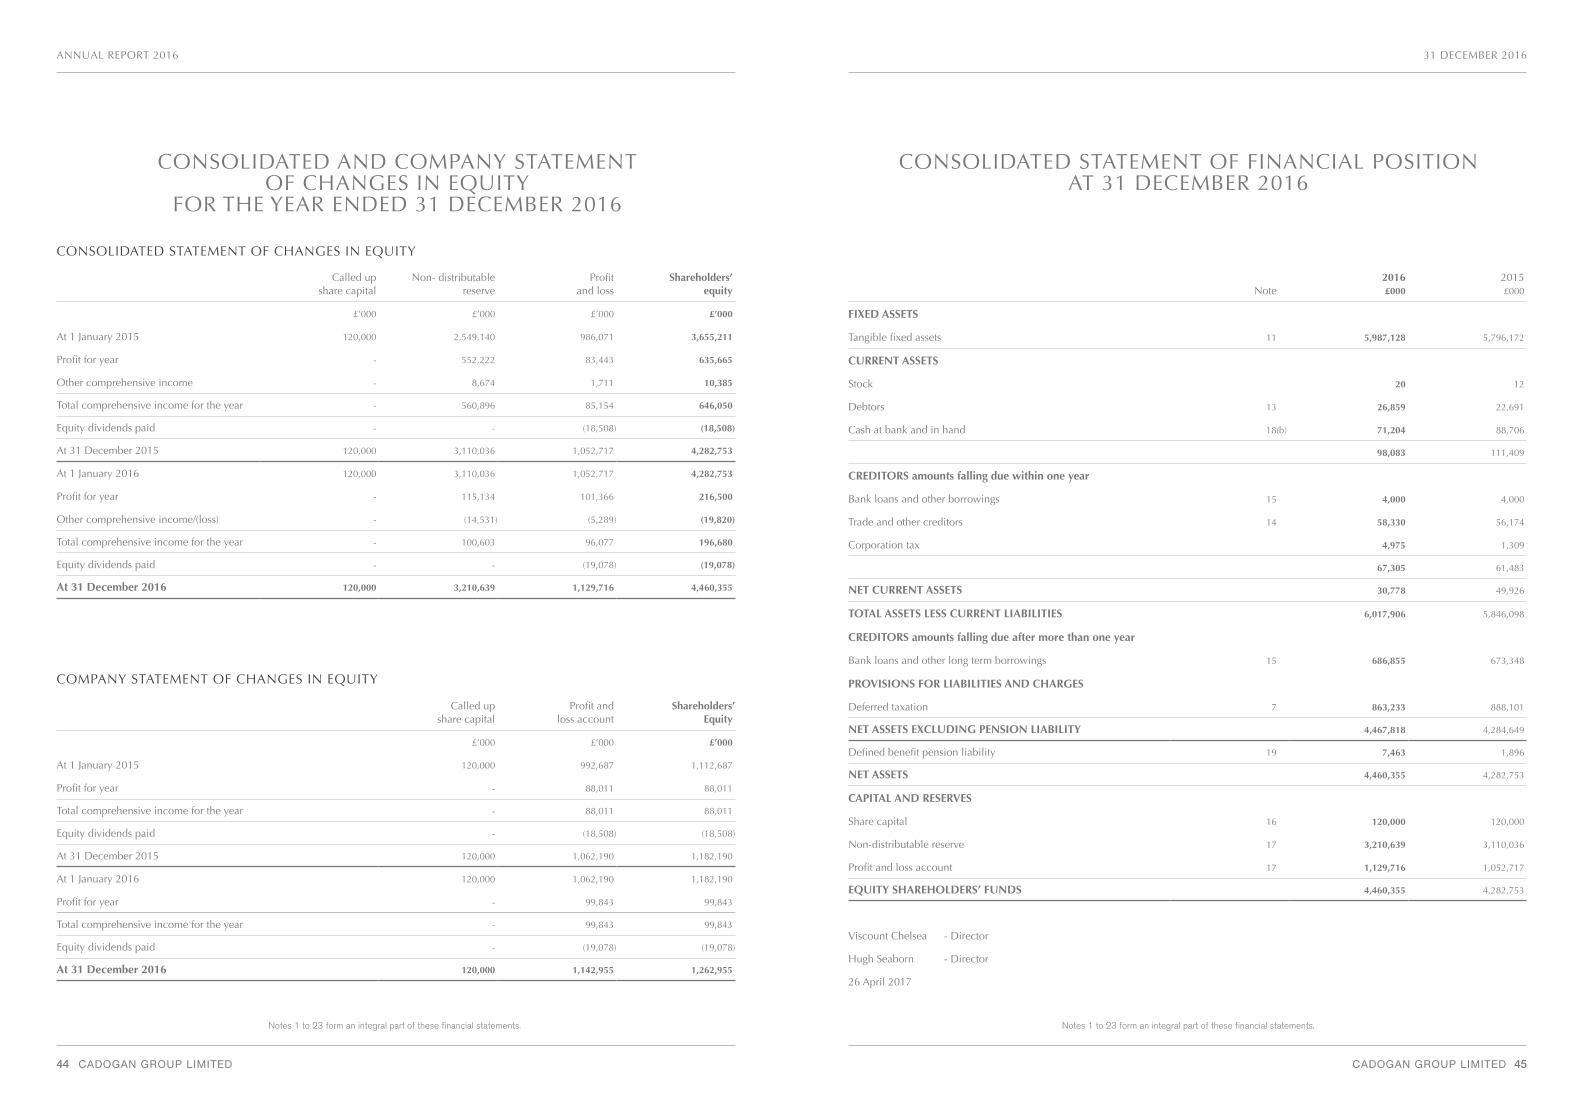
Tangible fixed assets 11 5,987,128 5,796,172
CURRENT ASSETS
Stock 20 12
Debtors 13 26,859 22,691
Cash at bank and in hand 18(b) 71,204 88,706
98,083 111,409
CREDITORS amounts falling due within one year
Bank loans and other borrowings 15 4,000 4,000
Trade and other creditors 14 58,330 56,174
Corporation tax 4,975 1,309
67,305 61,483
NET CURRENT ASSETS 30,778 49,926
TOTAL ASSETS LESS CURRENT LIABILITIES 6,017,906 5,846,098
CREDITORS amounts falling due after more than one year
Bank loans and other long term borrowings 15 686,855 673,348
PROVISIONS FOR LIABILITIES AND CHARGES
Deferred taxation 7 863,233 888,101
NET ASSETS EXCLUDING PENSION LIABILITY 4,467,818 4,284,649
Defined benefit pension liability 19 7,463 1,896
NET ASSETS 4,460,355 4,282,753
CAPITAL AND RESERVES
Share capital 16 120,000 120,000
Non-distributable reserve 17 3,210,639 3,110,036
Profit and loss account 17 1,129,716 1,052,717
EQUITY SHAREHOLDERS’ FUNDS 4,460,355 4,282,753
Viscount Chelsea - Director
Hugh Seaborn - Director
26 April 2017
Called up share capital
Non- distributable reserve
Profit and loss
Shareholders’ equity
£’000 £’000 £’000 £’000
At 1 January 2015 120,000 2,549,140 986,071 3,655,211
Profit for year - 552,222 83,443 635,665
Other comprehensive income - 8,674 1,711 10,385
Total comprehensive income for the year - 560,896 85,154 646,050
Equity dividends paid - - (18,508) (18,508)
At 31 December 2015 120,000 3,110,036 1,052,717 4,282,753
At 1 January 2016 120,000 3,110,036 1,052,717 4,282,753
Profit for year - 115,134 101,366 216,500
Other comprehensive income/(loss) - (14,531) (5,289) (19,820)
Total comprehensive income for the year - 100,603 96,077 196,680
Equity dividends paid - - (19,078) (19,078)
At 31 December 2016 120,000 3,210,639 1,129,716 4,460,355
CONSOLIDATED STATEMENT OF CHANGES IN EQUITY
CONSOLIDATED AND COMPANY STATEMENT OF CHANGES IN EQUITY
FOR THE YEAR ENDED 31 DECEMBER 2016
CONSOLIDATED STATEMENT OF FINANCIAL POSITION AT 31 DECEMBER 2016
Notes 1 to 23 form an integral part of these financial statements.Notes 1 to 23 form an integral part of these financial statements.
Called up share capital
Profit and loss account
Shareholders’ Equity
£’000 £’000 £’000
At 1 January 2015 120,000 992,687 1,112,687
Profit for year - 88,011 88,011
Total comprehensive income for the year - 88,011 88,011
Equity dividends paid - (18,508) (18,508)
At 31 December 2015 120,000 1,062,190 1,182,190
At 1 January 2016 120,000 1,062,190 1,182,190
Profit for year - 99,843 99,843
Total comprehensive income for the year - 99,843 99,843
Equity dividends paid - (19,078) (19,078)
At 31 December 2016 120,000 1,142,955 1,262,955
COMPANY STATEMENT OF CHANGES IN EQUITY
46 CADOGAN GROUP LIMITED
ANNUAL REPORT 2016
CADOGAN GROUP LIMITED 47
31 DECEMBER 2016
Note2016£000
2015£000
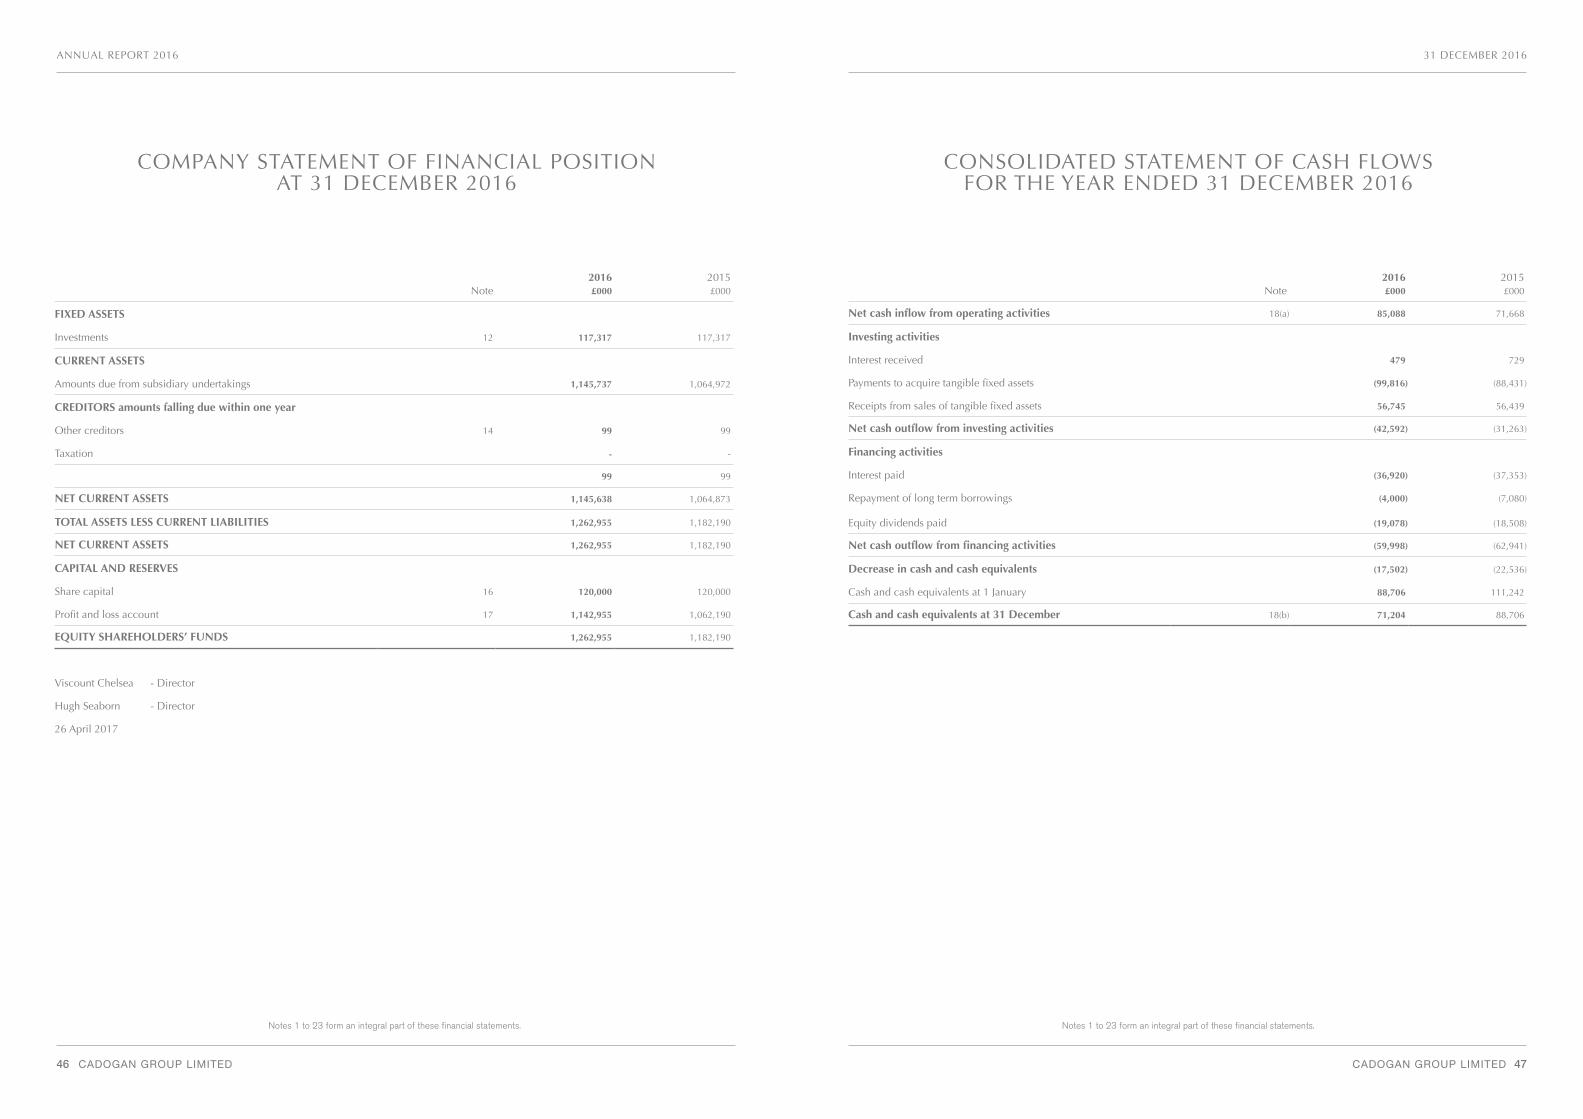
Net cash inflow from operating activities 18(a) 85,088 71,668
Investing activities
Interest received 479 729
Payments to acquire tangible fixed assets (99,816) (88,431)
Receipts from sales of tangible fixed assets 56,745 56,439
Net cash outflow from investing activities (42,592) (31,263)
Financing activities
Interest paid (36,920) (37,353)
Repayment of long term borrowings (4,000) (7,080)
Equity dividends paid (19,078) (18,508)
Net cash outflow from financing activities (59,998) (62,941)
Decrease in cash and cash equivalents (17,502) (22,536)
Cash and cash equivalents at 1 January 88,706 111,242
Cash and cash equivalents at 31 December 18(b) 71,204 88,706
Note2016£000
2015£000
FIXED ASSETS
Investments 12 117,317 117,317
CURRENT ASSETS
Amounts due from subsidiary undertakings 1,145,737 1,064,972
CREDITORS amounts falling due within one year
Other creditors 14 99 99
Taxation - -
99 99
NET CURRENT ASSETS 1,145,638 1,064,873
TOTAL ASSETS LESS CURRENT LIABILITIES 1,262,955 1,182,190
NET CURRENT ASSETS 1,262,955 1,182,190
CAPITAL AND RESERVES
Share capital 16 120,000 120,000
Profit and loss account 17 1,142,955 1,062,190
EQUITY SHAREHOLDERS’ FUNDS 1,262,955 1,182,190
Viscount Chelsea - Director
Hugh Seaborn - Director
26 April 2017
COMPANY STATEMENT OF FINANCIAL POSITIONAT 31 DECEMBER 2016
CONSOLIDATED STATEMENT OF CASH FLOWSFOR THE YEAR ENDED 31 DECEMBER 2016
Notes 1 to 23 form an integral part of these financial statements.Notes 1 to 23 form an integral part of these financial statements.
48 CADOGAN GROUP LIMITED
ANNUAL REPORT 2016
CADOGAN GROUP LIMITED 49
31 DECEMBER 2016
1 ACCOUNTING POLICIES
(A) STATEMENT OF COMPLIANCECadogan Group Limited is a limited liability company incorporated in England. The Registered Office is 10 Duke of York Square, London, SW3 4LY.
The group’s and company’s financial statements have been prepared in compliance with FRS 102 as it applies to the financial statements of the group for the year ended 31 December 2016.
Basis of preparationThe financial statements of Cadogan Group Limited were authorised for issue by the Board of Directors on 26 April 2017.
The financial statements have been prepared on a historical cost basis except investment properties and derivative financial instruments that have been measured at their fair value. The financial statements are prepared in sterling which is the functional currency of the group and rounded to the nearest £’000.
Basis of consolidationThe group financial statements consolidate the financial statements of Cadogan Group Limited and all its subsidiary undertakings drawn up to 31 December each year. No income statement is presented for Cadogan Group Limited as permitted by section 408 of the Companies Act 2006.
Subsidiaries are consolidated from the date of their acquisition, being the date on which the group obtains control and continue to be consolidated until the date that such control ceases. Control comprises the power to govern the financial and operating policies of the investee so as to obtain benefits from its activities.
(B) JUDGEMENTS AND KEY SOURCES OF ESTIMATION UNCERTAINTYThe preparation of the financial statements requires management to make judgements, estimates and
NOTES ON THE FINANCIAL STATEMENTSFOR THE YEAR ENDED 31 DECEMBER 2016
assumptions that affect the amounts reported for assets and liabilities as at the balance sheet date and the amounts reported for revenues and expenses during the year. However, the nature of estimation means that actual outcomes could differ from those estimates. The following judgements (apart from those involving estimates) have had the most significant effect on amounts recognised in the financial statements.
Operating lease commitments The group has entered into commercial property leases as a lessor on its investment property portfolio. The classification of such leases as operating or finance lease requires the group to determine, based on an evaluation of the terms and conditions of the arrangements, whether it retains the significant risks and rewards of ownership of these assets and accordingly whether the lease requires an asset and liability to be recognised in the statement of financial position.
Pension and other post-employment benefits The cost of defined benefit pension plans is determined using actuarial valuations. The actuarial valuation involves making assumptions about discount rates, future salary increases, mortality rates and future pension increases. Due to the complexity of the valuation, the underlying assumptions and the long term nature of these plans, such estimates are subject to significant uncertainty. In determining the appropriate discount rate, management considers the interest rates of corporate bonds in the respective currency with at least AA rating, with extrapolated maturities corresponding to the expected duration of the defined benefit obligation. The underlying bonds are further reviewed for quality, and those having excessive credit spreads are removed from the population bonds on which the discount rate is based, on the basis that they do not represent high quality bonds. The mortality rate is based on publicly available mortality tables for the UK. Future salary increases and pension increases are based on expected future inflation rates for the UK. Further details are given in note 19.
1 ACCOUNTING POLICIES (CONTINUED)
Taxation The group establishes provisions based on reasonable estimates, for possible consequences of audits by the tax authorities of the respective countries in which it operates. The amount of such provisions is based on various factors, such as experience with previous tax audits and differing interpretations of tax regulations by the taxable entity and the responsible tax authority.
Management estimation is required to determine the amount of deferred tax assets that can be recognised, based upon likely timing and level of future taxable profits together with an assessment of the effect of future tax planning strategies. Further details are contained in note 7.
Classification of propertyThe group determines whether a property is classified as investment property. Investment property comprises land and buildings (principally offices, retail and residential property) that are not occupied substantially for use by, or in the operations of, the Group, nor for sale in the ordinary course of business, but are held primarily to earn rental income and capital appreciation. These buildings are substantially rented to tenants and not intended to be sold in the ordinary course of business.
(C) ESTIMATES AND ASSUMPTIONSThe key assumptions concerning the future and other key sources of estimation uncertainty at the reporting date, that have a significant risk of causing a material adjustment to the carrying amounts of assets and liabilities within the next financial year, are described below.
The group based its assumptions and estimates on parameters available when the financial statements were prepared. Existing circumstances and assumptions about future developments, however, may change due to market changes or circumstances arising that are beyond the control of the group. Such changes are reflected in the assumptions when they occur.
Revaluation of investment properties The group carries its investment property at fair value, with changes in fair value being recognised in the income
statement. The group engaged independent valuation specialists to determine fair value at 31 December 2016. The valuers used market value, in accordance with the Appraisal of Valuation Manual of the Royal Institution of Charted Surveyors. The determined fair value of the investment property is most sensitive to the estimated yield as well as the long term vacancy rate. Investment property under construction are measured based on estimates prepared by independent real estate valuation experts. The key assumptions used to determine the fair value of investment property are further explained in note 11.
Estimation of net realisable value for properties under development Development property is stated at the lower of cost and net realisable value (NRV).
NRV for completed development property is assessed by reference to market conditions and prices existing at the reporting date and is determined by the group, based on comparable transactions identified by the group for properties in the same geographical market serving the same real estate segment.
NRV in respect of development property under construction is assessed with reference to market prices at the reporting date for similar completed property, less estimated costs to complete construction and an estimate of the time value of money to the date of completion.
Estimation of derivative financial instrumentsThe group carries its derivatives financial instruments at fair value, with changes in fair value being recognised in the non-distributable reserve for the effective portion, and the income statement for the ineffective portion in line with the adoption of hedge accounting. The group engaged independent valuation specialists to determine fair value at 31 December 2016. The valuation techniques applied to fair value these derivatives employ the use of market observable inputs and include swap models which use present value calculations. The model incorporates various inputs including the credit quality of counterparties and forward rates. All swap contracts are fully cash collateralised, thereby eliminating both counterparty and the Group’s own non-performance risk.
50 CADOGAN GROUP LIMITED
ANNUAL REPORT 2016
CADOGAN GROUP LIMITED 51
31 DECEMBER 2016
1 ACCOUNTING POLICIES (CONTINUED)
(D) TURNOVER AND REVENUE RECOGNITION Turnover is recognised to the extent that the group obtains the right to consideration in exchange for its performance. Revenue is measured at the fair value of the consideration received, net of VAT and comprises gross rents including reverse premium received on early lease termination, commissions and other fees receivable. Turnover in the hotel and concert hall operations represents amounts derived from the provision of goods and services, stated net of VAT.
The following criteria must also be met before revenue is recognised:
Rental incomeThe group is the lessor in operating leases. Rental income arising from operating leases on investment property is accounted for on a straight-line basis over the lease terms and is included in revenue in the income statement due to its operating nature, except for contingent rental income which is recognised when it arises.
Tenant lease incentives are recognised as a reduction of rental revenue on a straight-line basis over the term of the lease. The lease term is the non-cancellable period of the lease together with any further term for which the tenant has the option to continue the lease, where, at the inception of the lease, the directors are reasonably certain that the tenant will exercise that option.
Amounts received from tenants to terminate leases or to compensate for dilapidations are recognised in the income statement when the right to receive them arises.
Interest income Interest income is recognised as it accrues using the effective interest rate (EIR) method. The EIR is the rate that exactly discounts the estimated future cash receipts over the expected life of the financial instrument or a shorter period, where appropriate, to the net carrying amount of the financial asset. Interest income is included in finance income in the income statement.
(E) TANGIBLE FIXED ASSETSPlant and equipment are stated at cost less accumulated depreciation and accumulated impairment losses. Such cost includes costs directly attributable to making the asset capable of operating as intended. Depreciation is provided on all plant and equipment, at rates calculated to write off the cost, less estimated residual value, of each asset on a systematic basis over its expected useful life as follows: Plant and equipment 10% to 20%
The carrying values of tangible fixed assets are reviewed for impairment when events or changes in circumstances indicate the carrying value not to be recoverable. (F) LAND AND BUILDINGSLand and buildings represent owner occupied properties and are initially recognised at cost which includes purchase cost and any directly attributable expenditure of a capital nature only. They are included in the financial statements at fair value at the year end.
The surplus or deficit on revaluation is recognised in the non-distributable reserve and accumulated in the reserve unless a deficit below original cost, or its reversal, on an individual property is expected to be permanent in which case it is recognised in the income statement for the year. (G) INVESTMENT PROPERTYInvestment property comprises completed property and property under construction or re-development that is held to earn rentals or for capital appreciation or both. Property held under a lease is classified as investment property when it is held to earn rentals or for capital appreciation or both, rather than for sale in the ordinary course of business or for use in production or administrative functions.
Investment property is measured initially at cost, including transaction costs. Transaction costs include transfer taxes, professional fees for legal services and initial leasing commissions to bring the property to the condition necessary for it to be capable of operating.
1 ACCOUNTING POLICIES (CONTINUED)
The carrying amount also includes the cost of replacing part of an existing investment property at the time that cost is incurred if the recognition criteria are met.
Subsequent to initial recognition, investment property is stated at fair value, which reflects market conditions at the reporting date. Gains or losses arising from changes in the fair values of investment properties are included in the income statement in the period in which they arise, including the corresponding tax effect. For the purposes of these financial statements, in order to avoid double counting, the fair value reported in the financial statements is reduced by the carrying amount of any accrued income resulting from the spreading of lease incentives.
Transfers are made to (or from) investment property only when there is a change in use. For a transfer from investment property to owner-occupied property, the deemed cost for subsequent accounting is the fair value at the date of change in use.
Investment property is derecognised either when it has been disposed of or when it is permanently withdrawn from use and no future economic benefit is expected from its disposal. The difference between the net disposal proceeds and the carrying amount of the asset is recognised in the income statement in the period of de-recognition.
(H) PROFIT ON SALE OF INVESTMENT PROPERTIESProfits or losses on the sale of investment properties are calculated by reference to the book value at the end of the previous year, adjusted for any subsequent capital expenditure, and are shown as exceptional items. Such transactions are recognised on the exchange of contracts, providing that no material conditions remain outstanding.
(I) INVESTMENTSInvestments in subsidiary undertakings are included at cost, less a provision for impairment in value where applicable.
(J) LEASESThe determination of whether an arrangement is (or contains) a lease is based on the substance of the arrangement at the inception of the lease. The arrangement is, or contains, a lease if fulfilment of the arrangement is dependent on the use of a specific asset or assets or the arrangement conveys a right to use the asset or assets, even if that right is not explicitly specified in the arrangement.
Group as a lesseeA lease is classified at the inception date as a finance lease or an operating lease. A lease that transfers substantially all the risks and rewards incidental to ownership to the group is classified as a finance lease.
An operating lease is a lease other than a finance lease. Operating lease payments are recognised as an operating expense in the income statement on a straight-line basis over the lease term, except for contingent rental payments which are expensed when they arise.
Group as a lessorLeases in which the group does not transfer substantially all the risks and rewards of ownership of an asset are classified as operating leases. Contingent rents are recognised as revenue in the period in which they are earned.
(K) CASH AT BANK AND IN HAND Cash in the statement of financial position comprises cash at bank and in hand, and is stated net of outstanding bank overdrafts.
(L) LOAN NOTES All interest bearing loans and borrowings which are basic financial instruments are initially recorded at the present value of future payments discounted at a market rate of interest for a similar loan. After initial recognition, interest bearing loans and borrowings are subsequently measured at amortised cost using the effective interest method.
(M) SHORT TERM DEBTORS AND CREDITORS Debtors and creditors with no stated interest rate and receivable or payable within one year are recorded at transaction price. Any losses arising from impairment are recognised in the income statement in administrative expenses.
52 CADOGAN GROUP LIMITED
ANNUAL REPORT 2016
CADOGAN GROUP LIMITED 53
31 DECEMBER 2016
1 ACCOUNTING POLICIES (CONTINUED)
(N) TAXATIONCurrent taxation including UK corporation tax is provided at the amounts expected to be paid (or recovered) using the tax rates and laws that have been substantially enacted at the balance sheet date.
Deferred tax is recognised in respect of all material timing differences between taxable profits and total comprehensive income that arise from the inclusion of income and expenses in tax assessments in periods different from those in which they are recognised in the financial statements.
Deferred tax is measured on an undiscounted basis at the tax rates that are expected to apply in the periods in which timing differences reverse’ based on tax rates and laws enacted or substantively enacted at the balance sheet date.
(O) FOREIGN CURRENCIESTransactions in foreign currencies are initially recorded in the entity’s functional currency by applying the spot exchange rate ruling at the date of the transaction. Monetary assets and liabilities denominated in foreign currencies are retranslated at the rate of exchange ruling at the balance sheet date. All differences are taken to the income statement.
(P) DERIVATIVE FINANCIAL INSTRUMENTS AND HEDGE ACCOUNTINGThe group uses forward foreign currency contracts to reduce exposure to foreign exchange rates. The group also uses interest rate swaps to adjust interest rate exposures. Such derivative financial instruments are initially recognised at fair value on the date on which a derivative contract is entered into and are subsequently re-measured at fair value. Derivatives are carried as financial assets when the fair value is positive and as financial liabilities when the fair value is negative.
The criteria for forward foreign currency contracts are:• the instrument must be related to a firm
foreign currency commitment;• it must involve the same currency as the
hedged item; and• it must reduce the risk of foreign currency
exchange movements on the group’s operations.
1 ACCOUNTING POLICIES (CONTINUED)
If the hedging instrument expires or is sold, terminated or exercised without replacement or rollover (as part of the hedging strategy), or if its designation as a hedge is revoked, or when the hedge no longer meets the criteria for hedge accounting, any cumulative gain or loss previously recognised in SOCI remains separately in equity until the forecast transaction occurs or the firm commitment is met.
When a derivative is held as an economic hedge for a period beyond 12 months after the end of the reporting period, the derivative is classified as non-current consistent with the classification of the underlying item. A derivative instrument that is a designated and effective hedging instrument is classified consistent with the classification of the underlying hedged item.
(Q) PENSION BENEFITS For defined benefit scheme, the regular cost of providing pensions to employee during the year is charged to operating profit in the year. The full cost of providing amendments to benefits in respect of past service is also charged to operating profit in the year.
The net interest element is determined by multiplying the net defined benefit liability by the discount rate, at the start of the period taking into account any changes in the net defined benefit liability during the period as a result of contribution and benefit payments. The net interest is recognised in profit or loss as other finance revenue or costs.
Re-measurements, comprising actuarial gains and losses, the effect of the asset ceiling and the return on the net defined benefit liability (excluding amounts included in net interest) are recognised immediately in other comprehensive income in the period in which they occur.
The group’s criteria for interest rate swaps are:• the instrument must be related to an asset
or a liability; and• it must change the character of the interest
rate by converting a variable rate to a fixed rate or vice versa.
At the inception of a hedge relationship, the group formally designates and documents the hedge relationship to which it wishes to apply hedge accounting and the risk management objective and strategy for undertaking the hedge. The documentation includes identification of the hedging instrument, the hedged item or transaction, the nature of the risk being hedged and how the entity will assess the effectiveness of changes in the hedging instrument’s fair value in offsetting the exposure to changes in the hedged item’s fair value or cash flows attributable to the hedged risk. Such hedges are expected to be highly effective in achieving offsetting changes in fair value or cash flows and are assessed on an ongoing basis to determine that they actually have been highly effective throughout the financial reporting periods for which they were designated.
Cash flow hedgesFor the purpose of cash flow hedge accounting, hedges are classified as cash flow hedges when hedging exposure to variability in cash flows that is either attributable to a particular risk associated with a recognised asset or liability or a highly probable forecast transaction or the foreign currency risk in an unrecognised firm commitment.
The effective portion of the gain or loss on the hedging instrument is recognised in the Statement of Comprehensive Income (“SOCI”) in the non-distributable reserve, while any ineffective portion is recognised immediately in the income statement. Amounts recognised as other comprehensive income are transferred to the income statement when the hedged transaction affects profit or loss, such as when the hedged financial income or financial expense is recognised.
If the forecast transaction or firm commitment is no longer expected to occur, amounts previously recognised in the SOCI are transferred to the income statement.
The defined net benefit pension asset or liability in the statement of financial position comprises the total for each plan of the present value of the defined benefit obligation (using a discount rate based on high quality corporate bonds), less the fair value of plan assets out of which the obligations are to be settled directly. Fair value is based on market price information and in the case of quoted securities is the published bid price.
For defined contribution schemes, the value of amounts charged to the income statement in respect of pension costs is the value of the contributions payable in the year. Differences between contributions payable in the year and contributions actually paid are shown as either accruals or prepayment in the statement of financial position.
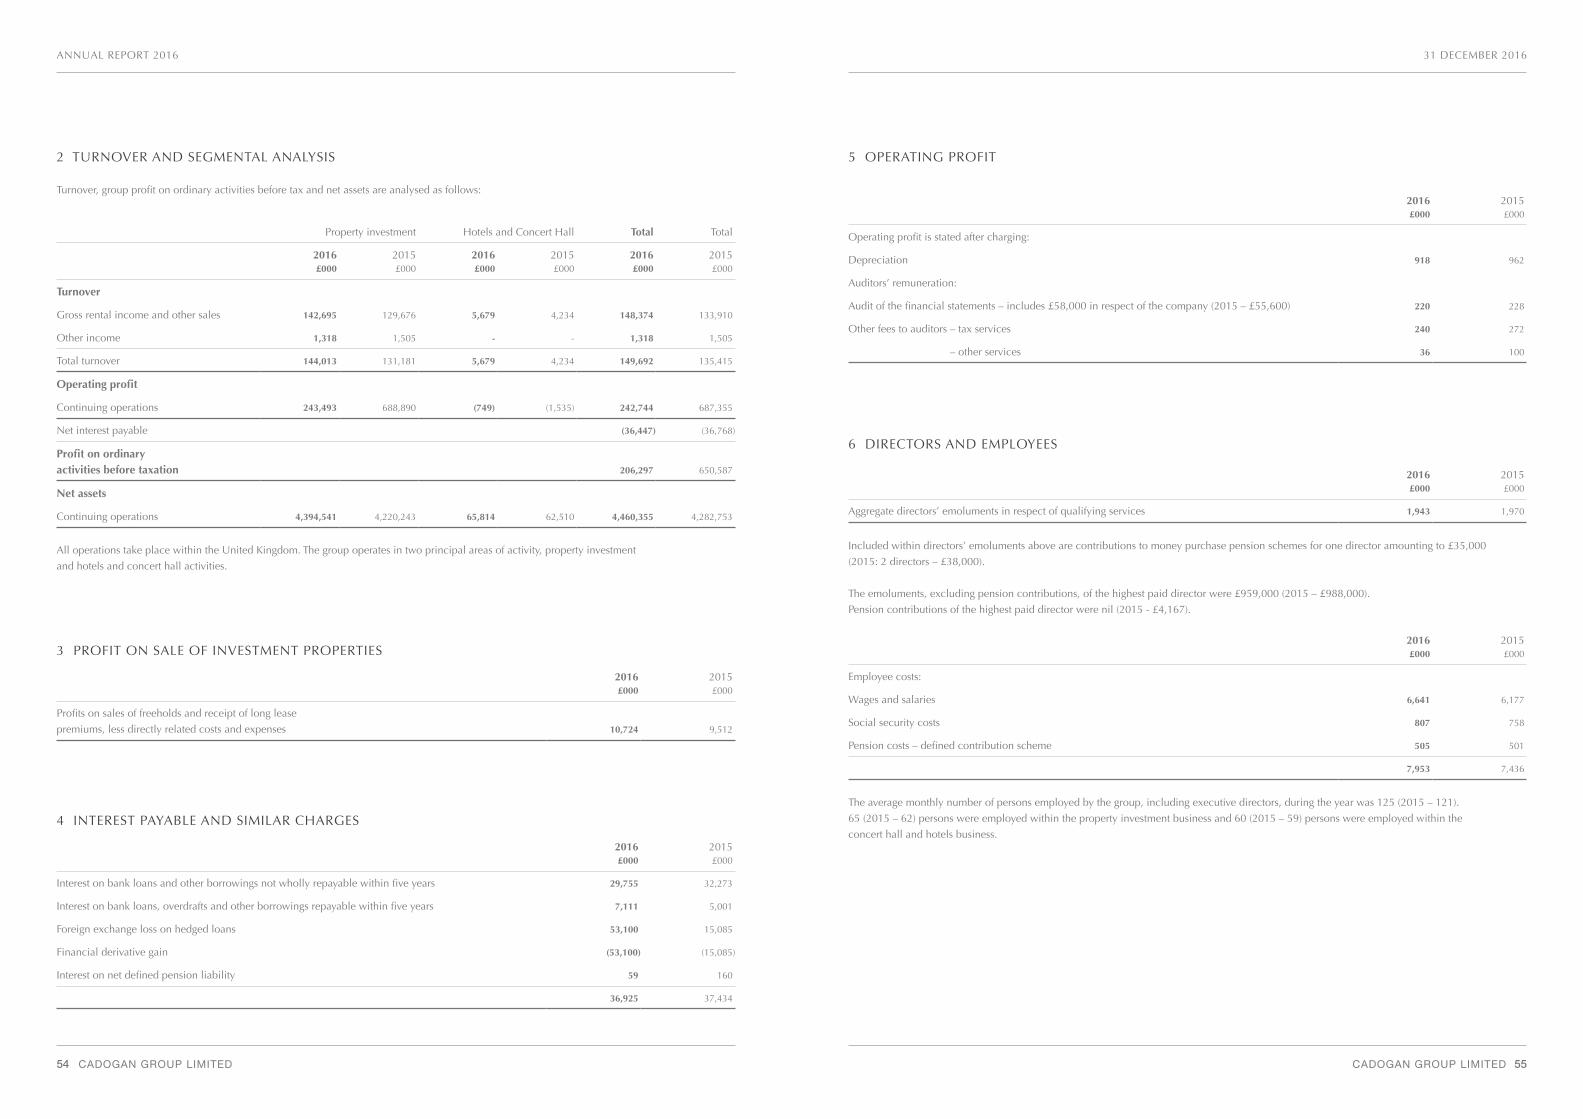
54 CADOGAN GROUP LIMITED
ANNUAL REPORT 2016
CADOGAN GROUP LIMITED 55
31 DECEMBER 2016
4 INTEREST PAYABLE AND SIMILAR CHARGES
2016£000
2015£000
Interest on bank loans and other borrowings not wholly repayable within five years 29,755 32,273
Interest on bank loans, overdrafts and other borrowings repayable within five years 7,111 5,001
Foreign exchange loss on hedged loans 53,100 15,085
Financial derivative gain (53,100) (15,085)
Interest on net defined pension liability 59 160
36,925 37,434
Included within directors’ emoluments above are contributions to money purchase pension schemes for one director amounting to £35,000
(2015: 2 directors – £38,000).
The emoluments, excluding pension contributions, of the highest paid director were £959,000 (2015 – £988,000).
Pension contributions of the highest paid director were nil (2015 - £4,167).
The average monthly number of persons employed by the group, including executive directors, during the year was 125 (2015 – 121).
65 (2015 – 62) persons were employed within the property investment business and 60 (2015 – 59) persons were employed within the
concert hall and hotels business.
5 OPERATING PROFIT
2016£000
2015£000
Operating profit is stated after charging:
Depreciation 918 962
Auditors’ remuneration:
Audit of the financial statements – includes £58,000 in respect of the company (2015 – £55,600) 220 228
Other fees to auditors – tax services 240 272
– other services 36 100
6 DIRECTORS AND EMPLOYEES
2016£000
2015£000
Aggregate directors’ emoluments in respect of qualifying services 1,943 1,970
2016£000
2015£000
Employee costs:
Wages and salaries 6,641 6,177
Social security costs 807 758
Pension costs – defined contribution scheme 505 501
7,953 7,436
2 TURNOVER AND SEGMENTAL ANALYSIS
Turnover, group profit on ordinary activities before tax and net assets are analysed as follows:
All operations take place within the United Kingdom. The group operates in two principal areas of activity, property investment
and hotels and concert hall activities.
Property investment Hotels and Concert Hall Total Total
2016£000
2015£000
2016£000
2015£000
2016£000
2015£000
Turnover
Gross rental income and other sales 142,695 129,676 5,679 4,234 148,374 133,910
Other income 1,318 1,505 - - 1,318 1,505
Total turnover 144,013 131,181 5,679 4,234 149,692 135,415
Operating profit
Continuing operations 243,493 688,890 (749) (1,535) 242,744 687,355
Net interest payable (36,447) (36,768)
Profit on ordinary activities before taxation 206,297 650,587
Net assets
Continuing operations 4,394,541 4,220,243 65,814 62,510 4,460,355 4,282,753
3 PROFIT ON SALE OF INVESTMENT PROPERTIES
2016£000
2015£000
Profits on sales of freeholds and receipt of long lease
premiums, less directly related costs and expenses 10,724 9,512
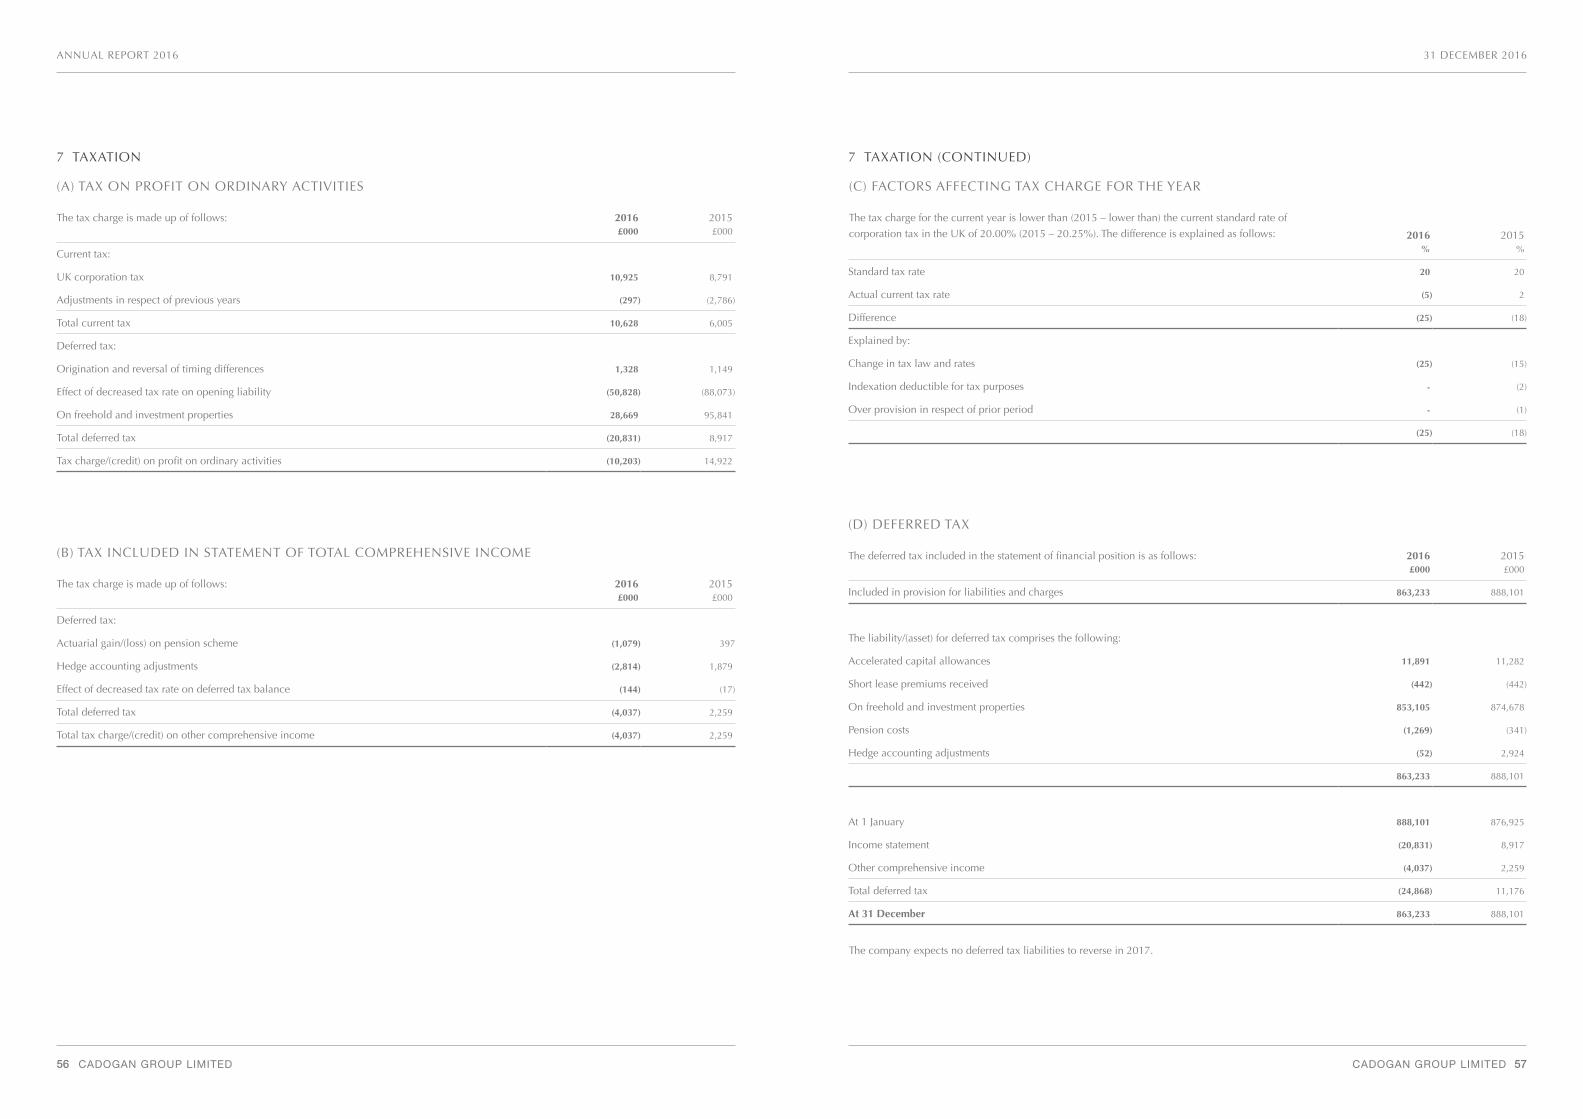
56 CADOGAN GROUP LIMITED
ANNUAL REPORT 2016
CADOGAN GROUP LIMITED 57
31 DECEMBER 2016
7 TAXATION (CONTINUED)
(D) DEFERRED TAX
The deferred tax included in the statement of financial position is as follows: 2016£000
2015£000
Included in provision for liabilities and charges 863,233 888,101
The liability/(asset) for deferred tax comprises the following:
Accelerated capital allowances 11,891 11,282
Short lease premiums received (442) (442)
On freehold and investment properties 853,105 874,678
Pension costs (1,269) (341)
Hedge accounting adjustments (52) 2,924
863,233 888,101
At 1 January 888,101 876,925
Income statement (20,831) 8,917
Other comprehensive income (4,037) 2,259
Total deferred tax (24,868) 11,176
At 31 December 863,233 888,101
(C) FACTORS AFFECTING TAX CHARGE FOR THE YEAR
The tax charge for the current year is lower than (2015 – lower than) the current standard rate of
corporation tax in the UK of 20.00% (2015 – 20.25%). The difference is explained as follows: 2016%
2015%
Standard tax rate 20 20
Actual current tax rate (5) 2
Difference (25) (18)
Explained by:
Change in tax law and rates (25) (15)
Indexation deductible for tax purposes - (2)
Over provision in respect of prior period - (1)
(25) (18)
7 TAXATION
(A) TAX ON PROFIT ON ORDINARY ACTIVITIES
The tax charge is made up of follows:£000
2016£000
2015£000
Current tax:
UK corporation tax 10,925 8,791
Adjustments in respect of previous years (297) (2,786)
Total current tax 10,628 6,005
Deferred tax:
Origination and reversal of timing differences 1,328 1,149
Effect of decreased tax rate on opening liability (50,828) (88,073)
On freehold and investment properties 28,669 95,841
Total deferred tax (20,831) 8,917
Tax charge/(credit) on profit on ordinary activities (10,203) 14,922
(B) TAX INCLUDED IN STATEMENT OF TOTAL COMPREHENSIVE INCOME
The tax charge is made up of follows:£000
2016£000
2015£000
Deferred tax:
Actuarial gain/(loss) on pension scheme (1,079) 397
Hedge accounting adjustments (2,814) 1,879
Effect of decreased tax rate on deferred tax balance (144) (17)
Total deferred tax (4,037) 2,259
Total tax charge/(credit) on other comprehensive income (4,037) 2,259
The company expects no deferred tax liabilities to reverse in 2017.
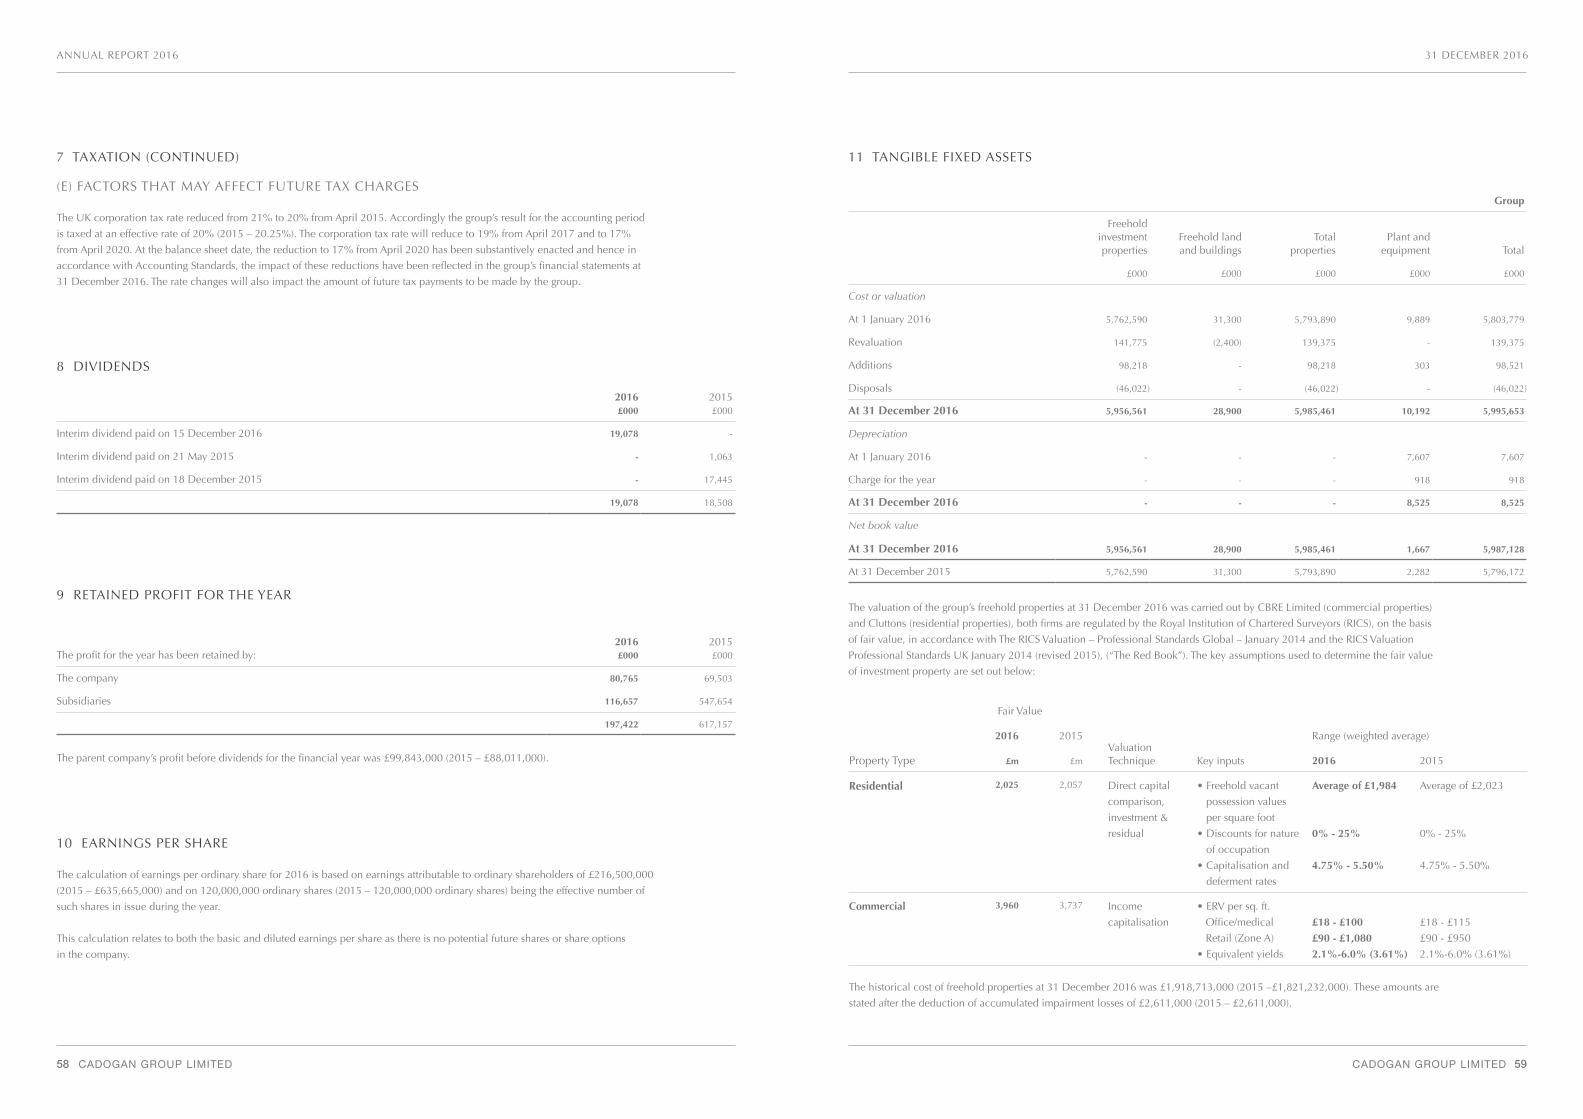
58 CADOGAN GROUP LIMITED
ANNUAL REPORT 2016
CADOGAN GROUP LIMITED 59
11 TANGIBLE FIXED ASSETS
Group
Freeholdinvestmentproperties
Freehold land and buildings
Total properties
Plant and equipment Total
£000 £000 £000 £000 £000
Cost or valuation
At 1 January 2016 5,762,590 31,300 5,793,890 9,889 5,803,779
Revaluation 141,775 (2,400) 139,375 - 139,375
Additions 98,218 - 98,218 303 98,521
Disposals (46,022) - (46,022) - (46,022)
At 31 December 2016 5,956,561 28,900 5,985,461 10,192 5,995,653
Depreciation
At 1 January 2016 - - - 7,607 7,607
Charge for the year - - - 918 918
At 31 December 2016 - - - 8,525 8,525
Net book value
At 31 December 2016 5,956,561 28,900 5,985,461 1,667 5,987,128
At 31 December 2015 5,762,590 31,300 5,793,890 2,282 5,796,172
The valuation of the group’s freehold properties at 31 December 2016 was carried out by CBRE Limited (commercial properties)
and Cluttons (residential properties), both firms are regulated by the Royal Institution of Chartered Surveyors (RICS), on the basis
of fair value, in accordance with The RICS Valuation – Professional Standards Global – January 2014 and the RICS Valuation
Professional Standards UK January 2014 (revised 2015), (“The Red Book”). The key assumptions used to determine the fair value
of investment property are set out below:
Property Type
Fair Value
Valuation Technique Key inputs
Range (weighted average)2016 2015
£m £m 2016 2015
Residential 2,025 2,057 Direct capital
comparison,
investment &
residual
• Freehold vacant
possession values
per square foot
• Discounts for nature
of occupation
• Capitalisation and
deferment rates
Average of £1,984
0% - 25%
4.75% - 5.50%
Average of £2,023
0% - 25%
4.75% - 5.50%
Commercial 3,960 3,737 Income
capitalisation
• ERV per sq. ft.
Office/medical
Retail (Zone A)
• Equivalent yields
£18 - £100
£90 - £1,080
2.1%-6.0% (3.61%)
£18 - £115
£90 - £950
2.1%-6.0% (3.61%)
The historical cost of freehold properties at 31 December 2016 was £1,918,713,000 (2015 –£1,821,232,000). These amounts are
stated after the deduction of accumulated impairment losses of £2,611,000 (2015 – £2,611,000).
31 DECEMBER 2016
7 TAXATION (CONTINUED)
(E) FACTORS THAT MAY AFFECT FUTURE TAX CHARGES
The UK corporation tax rate reduced from 21% to 20% from April 2015. Accordingly the group’s result for the accounting period
is taxed at an effective rate of 20% (2015 – 20.25%). The corporation tax rate will reduce to 19% from April 2017 and to 17%
from April 2020. At the balance sheet date, the reduction to 17% from April 2020 has been substantively enacted and hence in
accordance with Accounting Standards, the impact of these reductions have been reflected in the group’s financial statements at
31 December 2016. The rate changes will also impact the amount of future tax payments to be made by the group.
8 DIVIDENDS
9 RETAINED PROFIT FOR THE YEAR
2016£000
2015£000
Interim dividend paid on 15 December 2016 19,078 -
Interim dividend paid on 21 May 2015 - 1,063
Interim dividend paid on 18 December 2015 - 17,445
19,078 18,508
10 EARNINGS PER SHARE
The calculation of earnings per ordinary share for 2016 is based on earnings attributable to ordinary shareholders of £216,500,000
(2015 – £635,665,000) and on 120,000,000 ordinary shares (2015 – 120,000,000 ordinary shares) being the effective number of
such shares in issue during the year.
This calculation relates to both the basic and diluted earnings per share as there is no potential future shares or share options
in the company.
The profit for the year has been retained by:2016£000
2015£000
The company 80,765 69,503
Subsidiaries 116,657 547,654
197,422 617,157
The parent company’s profit before dividends for the financial year was £99,843,000 (2015 – £88,011,000).
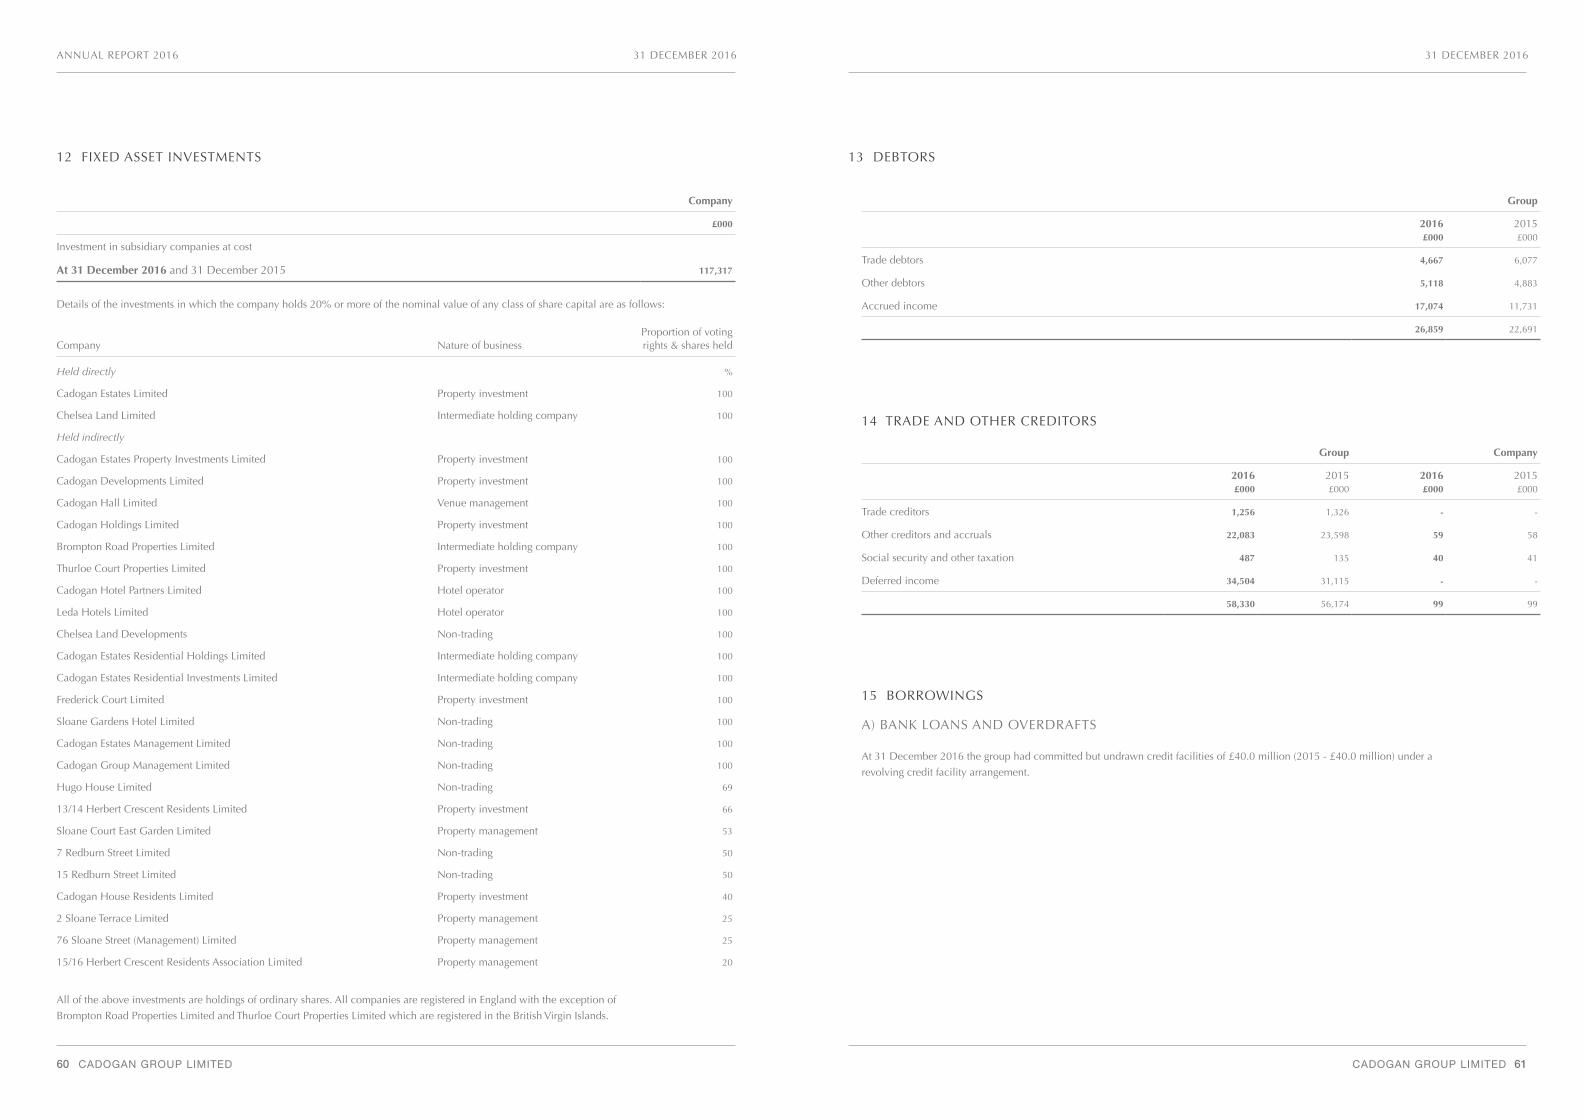
60 CADOGAN GROUP LIMITED
ANNUAL REPORT 2016
CADOGAN GROUP LIMITED 61
31 DECEMBER 2016
13 DEBTORS
31 DECEMBER 2016
All of the above investments are holdings of ordinary shares. All companies are registered in England with the exception of
Brompton Road Properties Limited and Thurloe Court Properties Limited which are registered in the British Virgin Islands.
Details of the investments in which the company holds 20% or more of the nominal value of any class of share capital are as follows:
Company Nature of businessProportion of voting rights & shares held
Held directly %
Cadogan Estates Limited Property investment 100
Chelsea Land Limited Intermediate holding company 100
Held indirectly
Cadogan Estates Property Investments Limited Property investment 100
Cadogan Developments Limited Property investment 100
Cadogan Hall Limited Venue management 100
Cadogan Holdings Limited Property investment 100
Brompton Road Properties Limited Intermediate holding company 100
Thurloe Court Properties Limited Property investment 100
Cadogan Hotel Partners Limited Hotel operator 100
Leda Hotels Limited Hotel operator 100
Chelsea Land Developments Non-trading 100
Cadogan Estates Residential Holdings Limited Intermediate holding company 100
Cadogan Estates Residential Investments Limited Intermediate holding company 100
Frederick Court Limited Property investment 100
Sloane Gardens Hotel Limited Non-trading 100
Cadogan Estates Management Limited Non-trading 100
Cadogan Group Management Limited Non-trading 100
Hugo House Limited Non-trading 69
13/14 Herbert Crescent Residents Limited Property investment 66
Sloane Court East Garden Limited Property management 53
7 Redburn Street Limited Non-trading 50
15 Redburn Street Limited Non-trading 50
Cadogan House Residents Limited Property investment 40
2 Sloane Terrace Limited Property management 25
76 Sloane Street (Management) Limited Property management 25
15/16 Herbert Crescent Residents Association Limited Property management 20
12 FIXED ASSET INVESTMENTS
Company
£000
Investment in subsidiary companies at cost
At 31 December 2016 and 31 December 2015 117,317
Group
2016£000
2015£000
Trade debtors 4,667 6,077
Other debtors 5,118 4,883
Accrued income 17,074 11,731
26,859 22,691
14 TRADE AND OTHER CREDITORS
Group Company
2016£000
2015£000
2016£000
2015£000
Trade creditors 1,256 1,326 - -
Other creditors and accruals 22,083 23,598 59 58
Social security and other taxation 487 135 40 41
Deferred income 34,504 31,115 - -
58,330 56,174 99 99
15 BORROWINGS
A) BANK LOANS AND OVERDRAFTS
At 31 December 2016 the group had committed but undrawn credit facilities of £40.0 million (2015 - £40.0 million) under a
revolving credit facility arrangement.
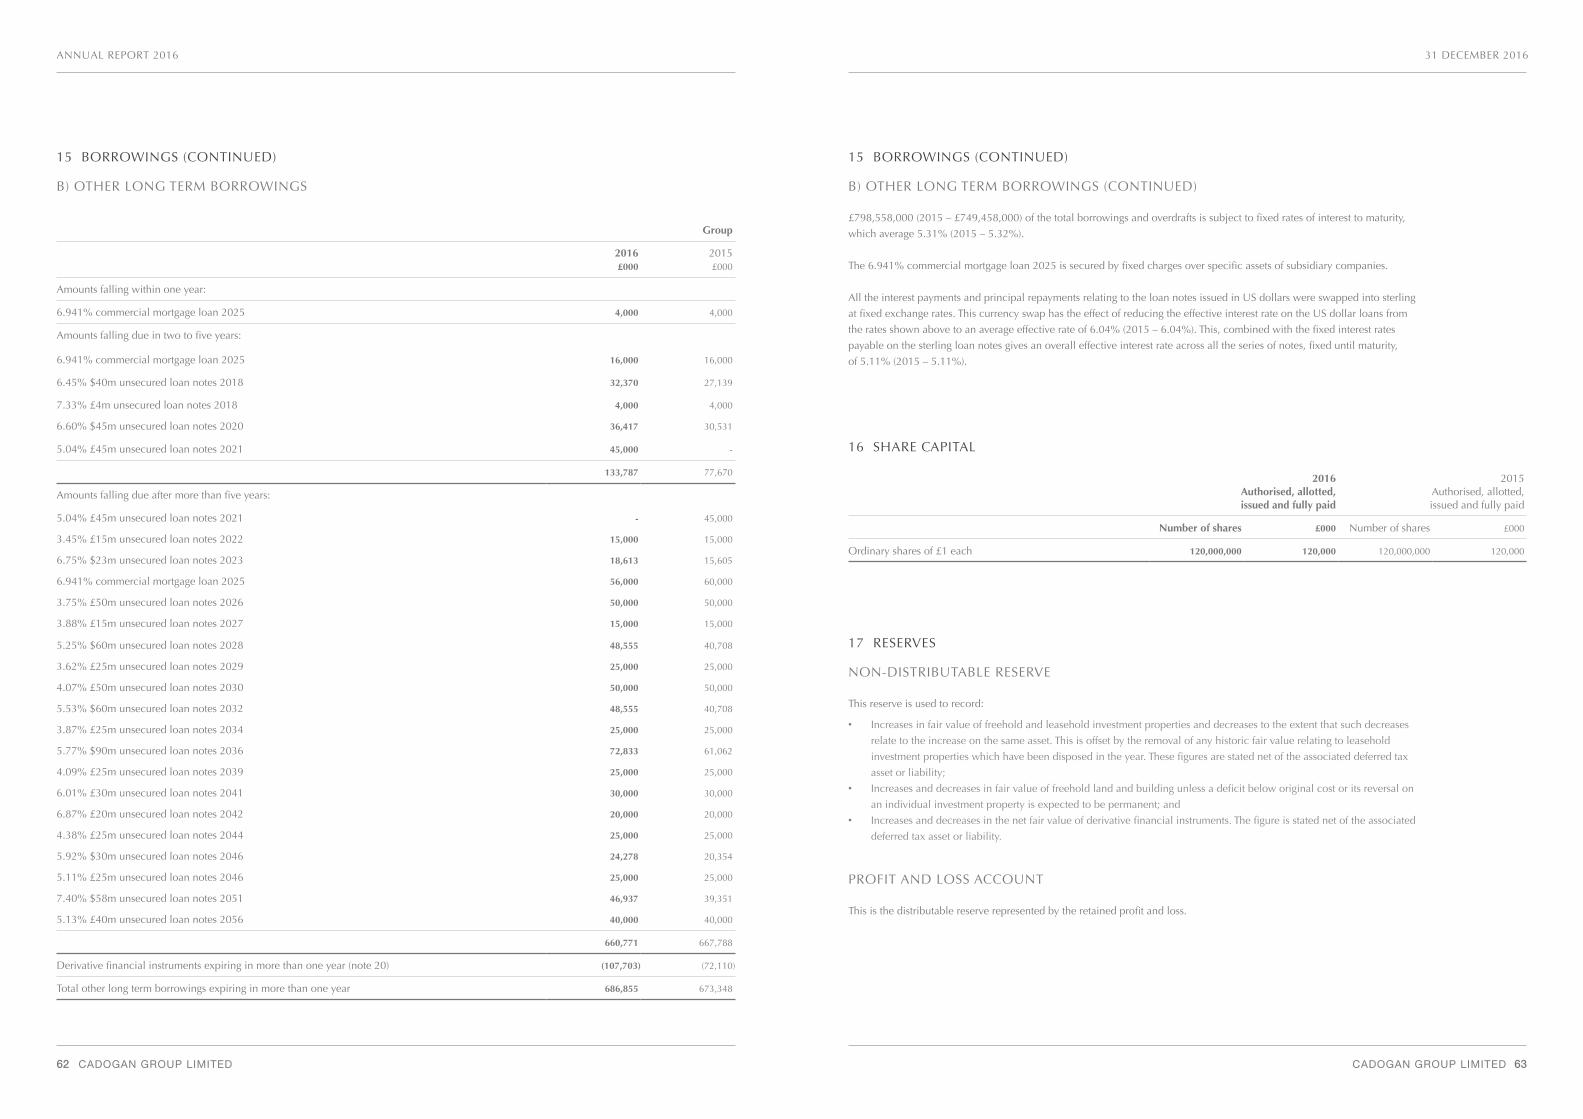
62 CADOGAN GROUP LIMITED
ANNUAL REPORT 2016
CADOGAN GROUP LIMITED 63
15 BORROWINGS (CONTINUED)
B) OTHER LONG TERM BORROWINGS (CONTINUED)
£798,558,000 (2015 – £749,458,000) of the total borrowings and overdrafts is subject to fixed rates of interest to maturity,
which average 5.31% (2015 – 5.32%).
The 6.941% commercial mortgage loan 2025 is secured by fixed charges over specific assets of subsidiary companies.
All the interest payments and principal repayments relating to the loan notes issued in US dollars were swapped into sterling
at fixed exchange rates. This currency swap has the effect of reducing the effective interest rate on the US dollar loans from
the rates shown above to an average effective rate of 6.04% (2015 – 6.04%). This, combined with the fixed interest rates
payable on the sterling loan notes gives an overall effective interest rate across all the series of notes, fixed until maturity,
of 5.11% (2015 – 5.11%).
16 SHARE CAPITAL
2016Authorised, allotted,issued and fully paid
2015Authorised, allotted,issued and fully paid
Number of shares £000 Number of shares £000
Ordinary shares of £1 each 120,000,000 120,000 120,000,000 120,000
17 RESERVES
NON-DISTRIBUTABLE RESERVE
This reserve is used to record:
• Increases in fair value of freehold and leasehold investment properties and decreases to the extent that such decreases
relate to the increase on the same asset. This is offset by the removal of any historic fair value relating to leasehold
investment properties which have been disposed in the year. These figures are stated net of the associated deferred tax
asset or liability;
• Increases and decreases in fair value of freehold land and building unless a deficit below original cost or its reversal on
an individual investment property is expected to be permanent; and
• Increases and decreases in the net fair value of derivative financial instruments. The figure is stated net of the associated
deferred tax asset or liability.
PROFIT AND LOSS ACCOUNT
This is the distributable reserve represented by the retained profit and loss.
31 DECEMBER 2016
Group
2016£000
2015£000
Amounts falling within one year:
6.941% commercial mortgage loan 2025 4,000 4,000
Amounts falling due in two to five years:
6.941% commercial mortgage loan 2025 16,000 16,000
6.45% $40m unsecured loan notes 2018 32,370 27,139
7.33% £4m unsecured loan notes 2018 4,000 4,000
6.60% $45m unsecured loan notes 2020 36,417 30,531
5.04% £45m unsecured loan notes 2021 45,000 -
133,787 77,670
Amounts falling due after more than five years:
5.04% £45m unsecured loan notes 2021 - 45,000
3.45% £15m unsecured loan notes 2022 15,000 15,000
6.75% $23m unsecured loan notes 2023 18,613 15,605
6.941% commercial mortgage loan 2025 56,000 60,000
3.75% £50m unsecured loan notes 2026 50,000 50,000
3.88% £15m unsecured loan notes 2027 15,000 15,000
5.25% $60m unsecured loan notes 2028 48,555 40,708
3.62% £25m unsecured loan notes 2029 25,000 25,000
4.07% £50m unsecured loan notes 2030 50,000 50,000
5.53% $60m unsecured loan notes 2032 48,555 40,708
3.87% £25m unsecured loan notes 2034 25,000 25,000
5.77% $90m unsecured loan notes 2036 72,833 61,062
4.09% £25m unsecured loan notes 2039 25,000 25,000
6.01% £30m unsecured loan notes 2041 30,000 30,000
6.87% £20m unsecured loan notes 2042 20,000 20,000
4.38% £25m unsecured loan notes 2044 25,000 25,000
5.92% $30m unsecured loan notes 2046 24,278 20,354
5.11% £25m unsecured loan notes 2046 25,000 25,000
7.40% $58m unsecured loan notes 2051 46,937 39,351
5.13% £40m unsecured loan notes 2056 40,000 40,000
660,771 667,788
Derivative financial instruments expiring in more than one year (note 20) (107,703) (72,110)
Total other long term borrowings expiring in more than one year 686,855 673,348
15 BORROWINGS (CONTINUED)
B) OTHER LONG TERM BORROWINGS
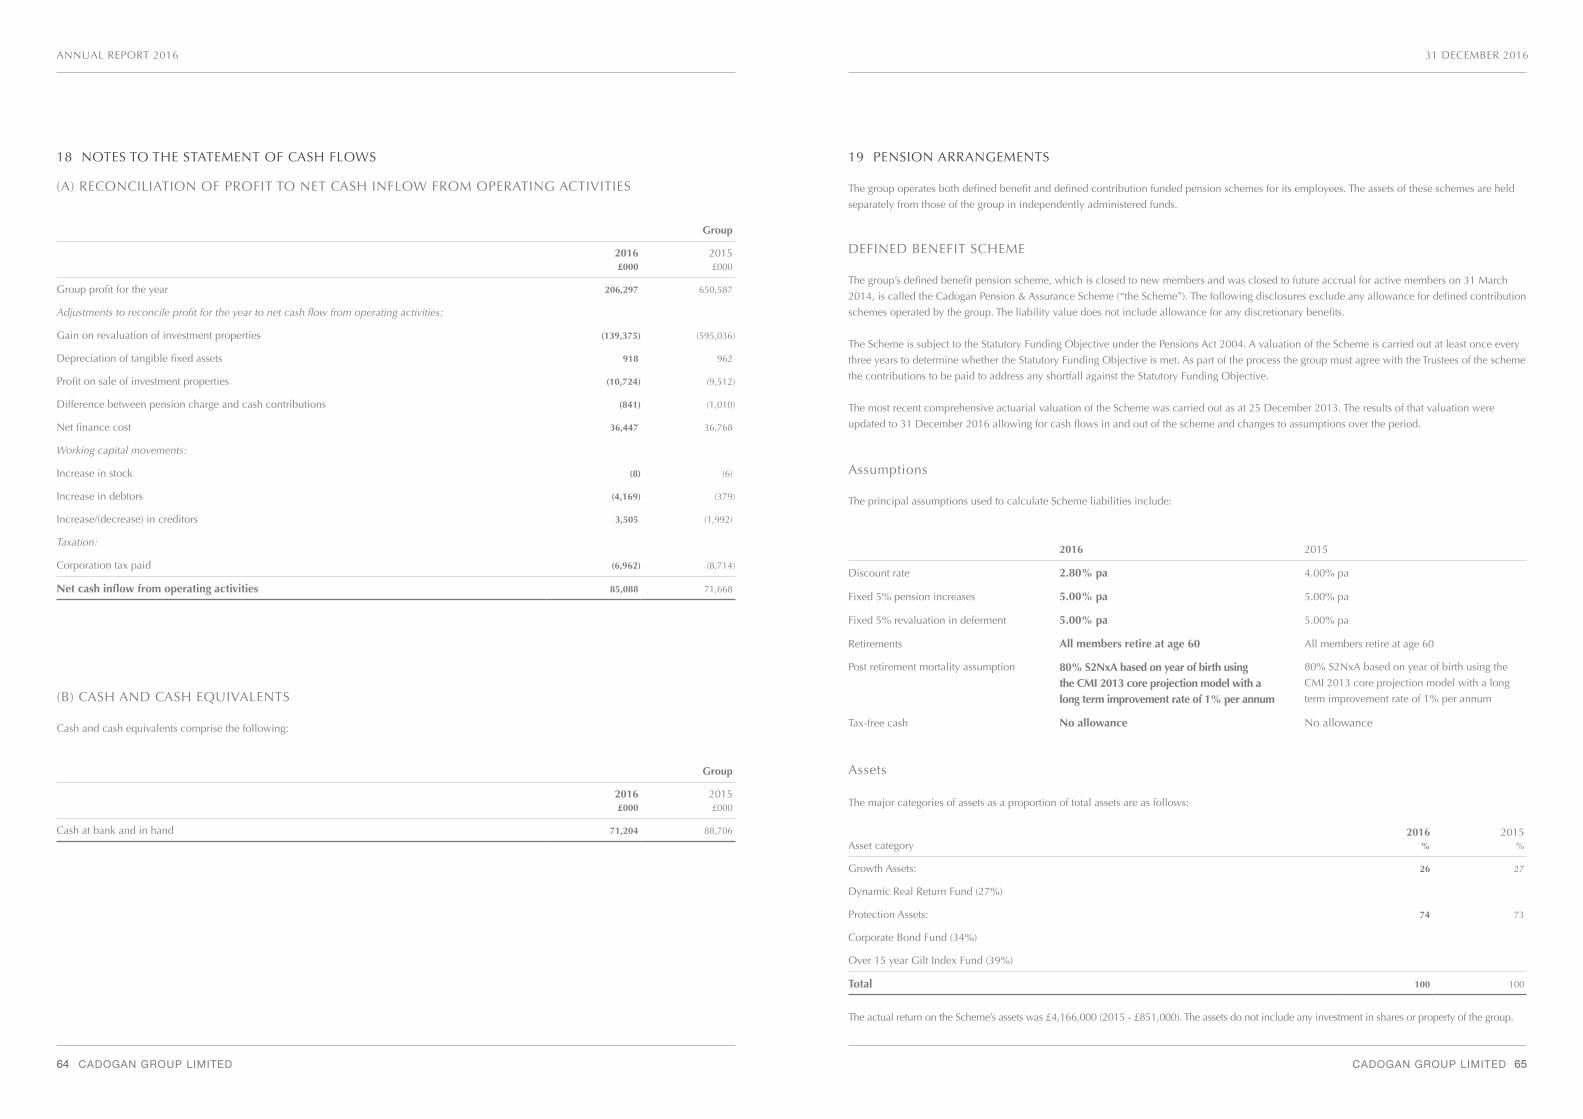
64 CADOGAN GROUP LIMITED
ANNUAL REPORT 2016
CADOGAN GROUP LIMITED 65
19 PENSION ARRANGEMENTS
The group operates both defined benefit and defined contribution funded pension schemes for its employees. The assets of these schemes are held
separately from those of the group in independently administered funds.
DEFINED BENEFIT SCHEME
The group’s defined benefit pension scheme, which is closed to new members and was closed to future accrual for active members on 31 March
2014, is called the Cadogan Pension & Assurance Scheme (“the Scheme”). The following disclosures exclude any allowance for defined contribution
schemes operated by the group. The liability value does not include allowance for any discretionary benefits.
The Scheme is subject to the Statutory Funding Objective under the Pensions Act 2004. A valuation of the Scheme is carried out at least once every
three years to determine whether the Statutory Funding Objective is met. As part of the process the group must agree with the Trustees of the scheme
the contributions to be paid to address any shortfall against the Statutory Funding Objective.
The most recent comprehensive actuarial valuation of the Scheme was carried out as at 25 December 2013. The results of that valuation were
updated to 31 December 2016 allowing for cash flows in and out of the scheme and changes to assumptions over the period.
Assumptions The principal assumptions used to calculate Scheme liabilities include:
2016 2015
Discount rate 2.80% pa 4.00% pa
Fixed 5% pension increases 5.00% pa 5.00% pa
Fixed 5% revaluation in deferment 5.00% pa 5.00% pa
Retirements All members retire at age 60 All members retire at age 60
Post retirement mortality assumption 80% S2NxA based on year of birth using the CMI 2013 core projection model with a long term improvement rate of 1% per annum
80% S2NxA based on year of birth using the
CMI 2013 core projection model with a long
term improvement rate of 1% per annum
Tax-free cash No allowance No allowance
Asset category2016
%2015
%
Growth Assets: 26 27
Dynamic Real Return Fund (27%)
Protection Assets: 74 73
Corporate Bond Fund (34%)
Over 15 year Gilt Index Fund (39%)
Total 100 100
Assets
The major categories of assets as a proportion of total assets are as follows:
The actual return on the Scheme’s assets was £4,166,000 (2015 - £851,000). The assets do not include any investment in shares or property of the group.
31 DECEMBER 2016
18 NOTES TO THE STATEMENT OF CASH FLOWS
(A) RECONCILIATION OF PROFIT TO NET CASH INFLOW FROM OPERATING ACTIVITIES
Group
2016£000
2015£000
Group profit for the year 206,297 650,587
Adjustments to reconcile profit for the year to net cash flow from operating activities:
Gain on revaluation of investment properties (139,375) (595,036)
Depreciation of tangible fixed assets 918 962
Profit on sale of investment properties (10,724) (9,512)
Difference between pension charge and cash contributions (841) (1,010)
Net finance cost 36,447 36,768
Working capital movements:
Increase in stock (8) (6)
Increase in debtors (4,169) (379)
Increase/(decrease) in creditors 3,505 (1,992)
Taxation:
Corporation tax paid (6,962) (8,714)
Net cash inflow from operating activities 85,088 71,668
(B) CASH AND CASH EQUIVALENTS
Cash and cash equivalents comprise the following:
Group
2016£000
2015£000
Cash at bank and in hand 71,204 88,706
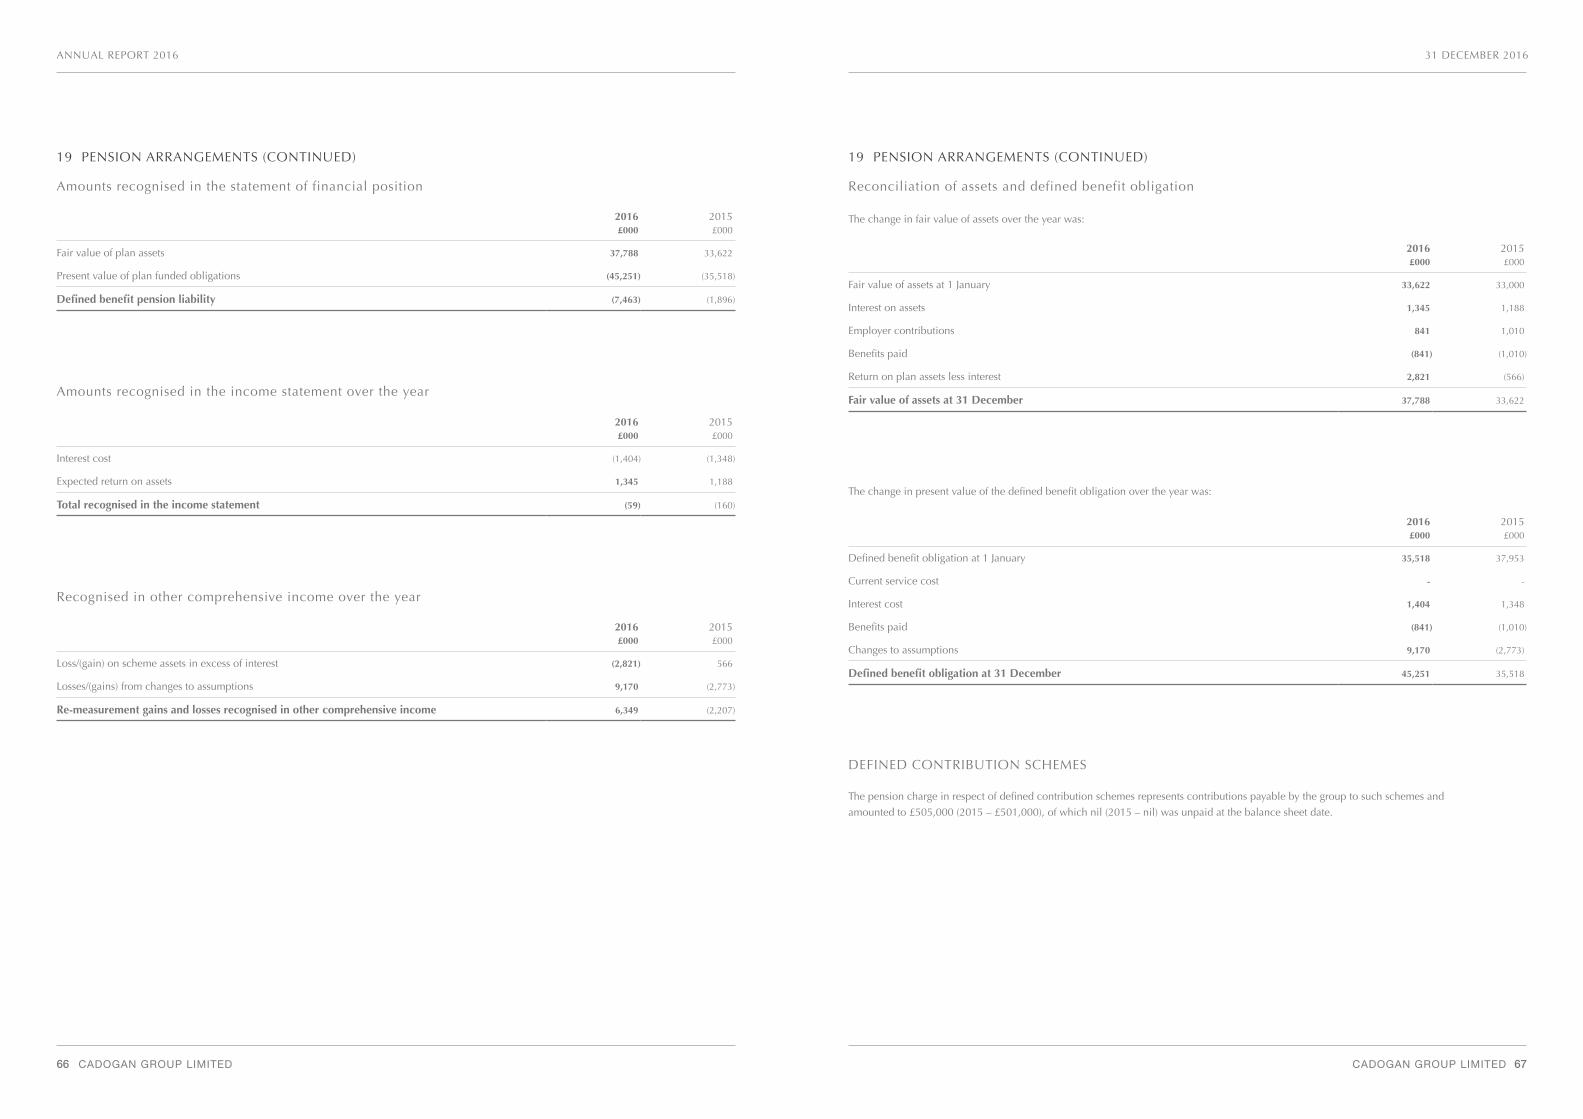
66 CADOGAN GROUP LIMITED
ANNUAL REPORT 2016
CADOGAN GROUP LIMITED 67
31 DECEMBER 2016
2016£000
2015£000
Fair value of assets at 1 January 33,622 33,000
Interest on assets 1,345 1,188
Employer contributions 841 1,010
Benefits paid (841) (1,010)
Return on plan assets less interest 2,821 (566)
Fair value of assets at 31 December 37,788 33,622
19 PENSION ARRANGEMENTS (CONTINUED)
Reconciliation of assets and defined benefit obligation
The change in fair value of assets over the year was:
2016£000
2015£000
Defined benefit obligation at 1 January 35,518 37,953
Current service cost - -
Interest cost 1,404 1,348
Benefits paid (841) (1,010)
Changes to assumptions 9,170 (2,773)
Defined benefit obligation at 31 December 45,251 35,518
The change in present value of the defined benefit obligation over the year was:
DEFINED CONTRIBUTION SCHEMES
The pension charge in respect of defined contribution schemes represents contributions payable by the group to such schemes and
amounted to £505,000 (2015 – £501,000), of which nil (2015 – nil) was unpaid at the balance sheet date.
19 PENSION ARRANGEMENTS (CONTINUED)
2016£000
2015£000
Fair value of plan assets 37,788 33,622
Present value of plan funded obligations (45,251) (35,518)
Defined benefit pension liability (7,463) (1,896)
Amounts recognised in the statement of financial position
2016£000
2015£000
Interest cost (1,404) (1,348)
Expected return on assets 1,345 1,188
Total recognised in the income statement (59) (160)
Amounts recognised in the income statement over the year
2016£000
2015£000
Loss/(gain) on scheme assets in excess of interest (2,821) 566
Losses/(gains) from changes to assumptions 9,170 (2,773)
Re-measurement gains and losses recognised in other comprehensive income 6,349 (2,207)
Recognised in other comprehensive income over the year
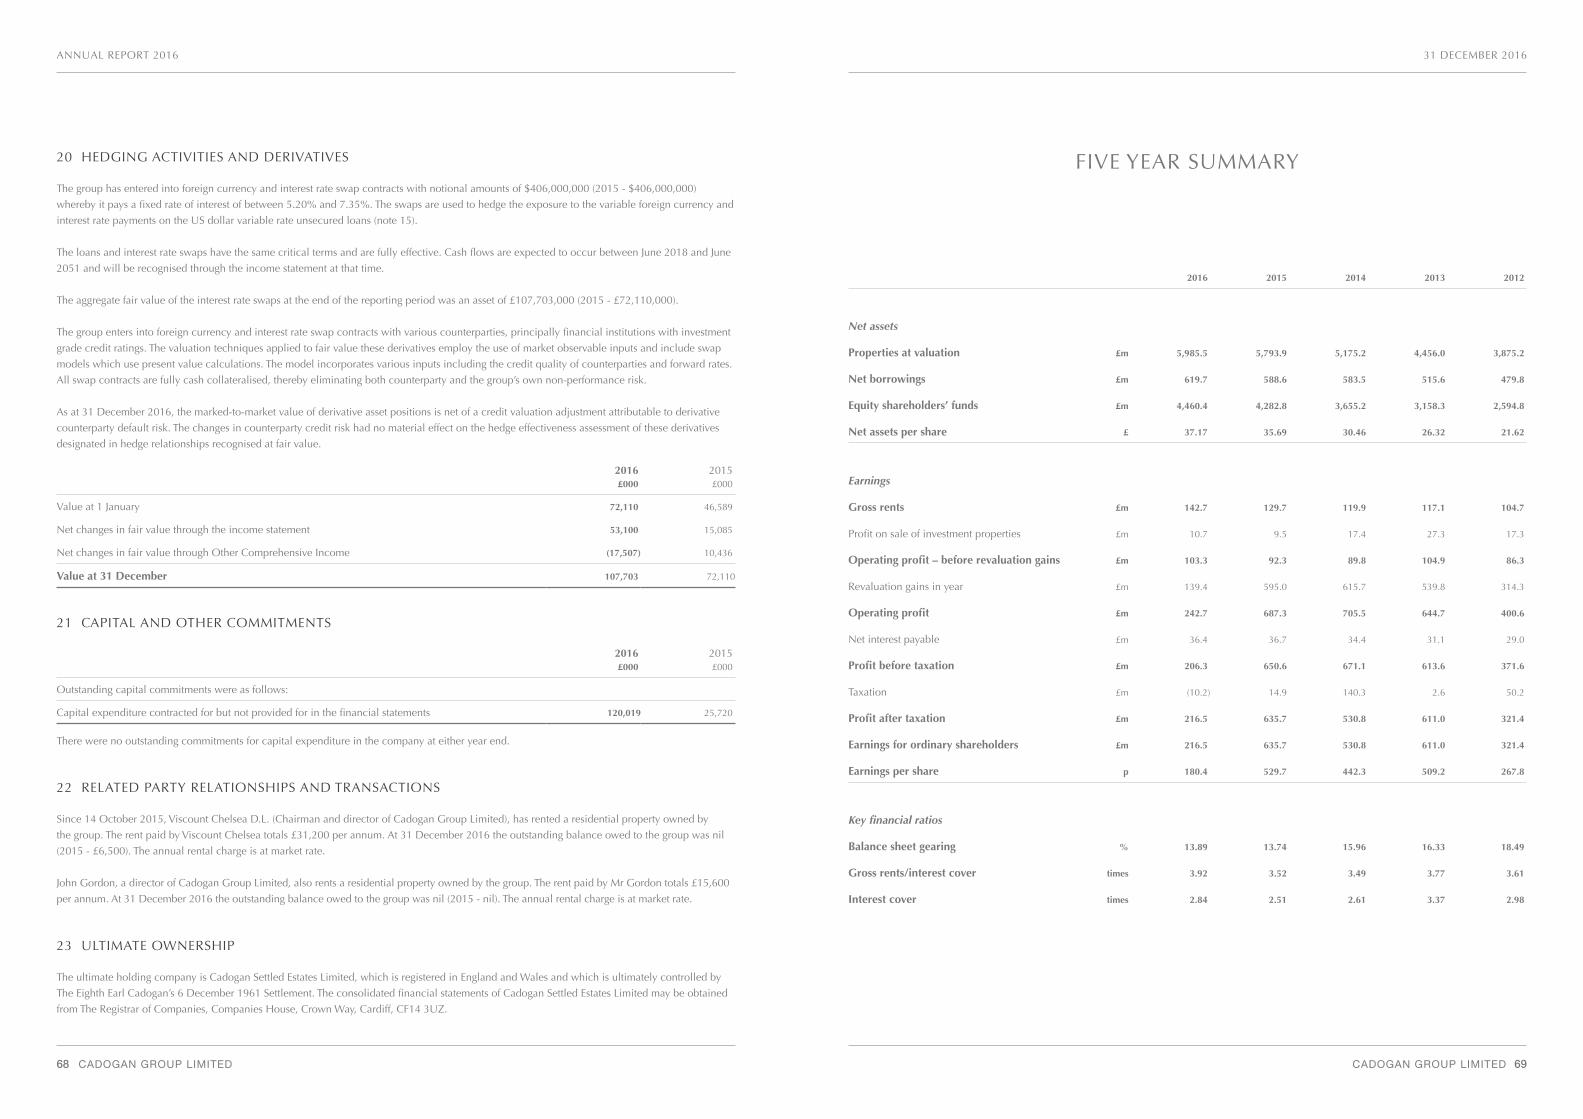
68 CADOGAN GROUP LIMITED
ANNUAL REPORT 2016
CADOGAN GROUP LIMITED 69
31 DECEMBER 2016
20 HEDGING ACTIVITIES AND DERIVATIVES
The group has entered into foreign currency and interest rate swap contracts with notional amounts of $406,000,000 (2015 - $406,000,000)
whereby it pays a fixed rate of interest of between 5.20% and 7.35%. The swaps are used to hedge the exposure to the variable foreign currency and
interest rate payments on the US dollar variable rate unsecured loans (note 15).
The loans and interest rate swaps have the same critical terms and are fully effective. Cash flows are expected to occur between June 2018 and June
2051 and will be recognised through the income statement at that time.
The aggregate fair value of the interest rate swaps at the end of the reporting period was an asset of £107,703,000 (2015 - £72,110,000).
The group enters into foreign currency and interest rate swap contracts with various counterparties, principally financial institutions with investment
grade credit ratings. The valuation techniques applied to fair value these derivatives employ the use of market observable inputs and include swap
models which use present value calculations. The model incorporates various inputs including the credit quality of counterparties and forward rates.
All swap contracts are fully cash collateralised, thereby eliminating both counterparty and the group’s own non-performance risk.
As at 31 December 2016, the marked-to-market value of derivative asset positions is net of a credit valuation adjustment attributable to derivative
counterparty default risk. The changes in counterparty credit risk had no material effect on the hedge effectiveness assessment of these derivatives
designated in hedge relationships recognised at fair value.
2016£000
2015£000
Value at 1 January 72,110 46,589
Net changes in fair value through the income statement 53,100 15,085
Net changes in fair value through Other Comprehensive Income (17,507) 10,436
Value at 31 December 107,703 72,110
21 CAPITAL AND OTHER COMMITMENTS
2016£000
2015£000
Outstanding capital commitments were as follows:
Capital expenditure contracted for but not provided for in the financial statements 120,019 25,720
There were no outstanding commitments for capital expenditure in the company at either year end.
22 RELATED PARTY RELATIONSHIPS AND TRANSACTIONS
Since 14 October 2015, Viscount Chelsea D.L. (Chairman and director of Cadogan Group Limited), has rented a residential property owned by
the group. The rent paid by Viscount Chelsea totals £31,200 per annum. At 31 December 2016 the outstanding balance owed to the group was nil
(2015 - £6,500). The annual rental charge is at market rate.
John Gordon, a director of Cadogan Group Limited, also rents a residential property owned by the group. The rent paid by Mr Gordon totals £15,600
per annum. At 31 December 2016 the outstanding balance owed to the group was nil (2015 - nil). The annual rental charge is at market rate.
23 ULTIMATE OWNERSHIP
The ultimate holding company is Cadogan Settled Estates Limited, which is registered in England and Wales and which is ultimately controlled by
The Eighth Earl Cadogan’s 6 December 1961 Settlement. The consolidated financial statements of Cadogan Settled Estates Limited may be obtained
from The Registrar of Companies, Companies House, Crown Way, Cardiff, CF14 3UZ.
2016 2015 2014 2013 2012
Net assets
Properties at valuation £m 5,985.5 5,793.9 5,175.2 4,456.0 3,875.2
Net borrowings £m 619.7 588.6 583.5 515.6 479.8
Equity shareholders’ funds £m 4,460.4 4,282.8 3,655.2 3,158.3 2,594.8
Net assets per share £ 37.17 35.69 30.46 26.32 21.62
Earnings
Gross rents £m 142.7 129.7 119.9 117.1 104.7
Profit on sale of investment properties £m 10.7 9.5 17.4 27.3 17.3
Operating profit – before revaluation gains £m 103.3 92.3 89.8 104.9 86.3
Revaluation gains in year £m 139.4 595.0 615.7 539.8 314.3
Operating profit £m 242.7 687.3 705.5 644.7 400.6
Net interest payable £m 36.4 36.7 34.4 31.1 29.0
Profit before taxation £m 206.3 650.6 671.1 613.6 371.6
Taxation £m (10.2) 14.9 140.3 2.6 50.2
Profit after taxation £m 216.5 635.7 530.8 611.0 321.4
Earnings for ordinary shareholders £m 216.5 635.7 530.8 611.0 321.4
Earnings per share p 180.4 529.7 442.3 509.2 267.8
Key financial ratios
Balance sheet gearing % 13.89 13.74 15.96 16.33 18.49
Gross rents/interest cover times 3.92 3.52 3.49 3.77 3.61
Interest cover times 2.84 2.51 2.61 3.37 2.98
FIVE YEAR SUMMARY
![Neutral Citation Number: [2016] UKUT 0223 (LC) Case Nos ... v Mundy(1).pdf · Earl Cadogan v Sportelli [2007] 1 EGLR 153 (LT) and [2008] 1 WLR 2142 (CA) Earl Cadogan v Cadogan Square](https://img.pdfslide.us/doc/110x75/5b0d906a7f8b9a02508de8d4/neutral-citation-number-2016-ukut-0223-lc-case-nos-v-mundy1pdfearl-cadogan.jpg)