Embed Size (px)
Citation preview

F i n a n c i a l
S t a t e m e n t s
September2 0 1 1


3
Message from the CEO
The external environment has been evolving amida context of increasing risk perception associatedwith the financial instability that has deepened overthe first nine months of 2011. The delicate fiscalsituation of the Eurozone’s peripheral countries,the debate over raising the debt ceiling in the UnitedStates that ended up with the downgrade of theAmerican rating, the increase in the inflation riskin emerging economies and the uncertaintiesregarding the global economy’s ability to recoverhave also contributed to the worsening of tensionsin international markets.Backed by the stability of the labor market and thecredit evolution, together with a significant in-flowof foreign capital, the strong growth observed inBrazil in the beginning of the year produced apicture of inflationary pressures exacerbated byrising commodity prices, a scenario that wasmanaged through increasing interest rates andfiscal control measures that reduced the economicactivity and reversed the contraction cycle in August2011, in face of the deepening global instabi lity.Given Rio Grande do Sul’s exporting profile, theindustry performance reflected the dynamics of theglobal economy; however, infrastructureinvestments such as roads duplication, the use ofalternative energy sources and the development ofthe technological pole, among others, are signs offavorable prospects for the development of theregional environment, also supported by the goodperformance of the agricultural sector, aided byproductivity gains and appropriate climaticconditions.The high degree of integration among the local,domestic and international economies and thedynamics of the banking sector, extremely linkedto the movements of business cycles, have requiredplanning efforts and constant review of businessesstrategies.After six months of managing Banrisul, manyevents, actions, relevant facts have enabled us tobetter understand the nuances of the business
environment, as well as to improve the diagnosisof a financial institution that celebrated inSeptember its 83rd anniversary.In the last three months, the preparation of the2011-2015 strategic plans can be safely cited as akey process on which we have focused. Variousmeetings addressing all Banrisul’s employees wereheld in July and August, for the purpose ofpromoting a broad discussion about thealternatives that will ensure the growth andsustainability of the Bank’s business.Several are the challenges within the bankingindustry. Changes in the economic environment andin the regulatory framework, such as the recentalignment of the Central Bank of Brazil to Basel III,aiming at preparing the banking system to supportsystemic crises, and changes in the competitiveand technological environments, that ultimatelyrespond for innovation in the financial sector,illustrate our point.And many have being the changes wrought in thesocial environment in recent years. The lifeexpectancy of Brazilians has increased, the habitsare different, and the entry of new classes in theconsumer market demands new approaches tosales and information management related todifferent customer profiles.Hence we have defined, in our planning efforts, theimprovement of customer service as one of themain pillars of the current administration.Banrisul’s other strategic guidelines are groundedin the ( i) expansion of the credit and fundingportfolios, (ii) increase and consolidation of ourmarket share in banking services, (iii ) ongoingimprovements of internal controls and corporaterisk mitigation mechanisms, and ( iv) training,retention and qualification of employees, all basedon sound principles of sustainability andefficiency-focused management.The improvement of customer service covers notonly the branch network, planned to expandespecially to towns lacking financial services, to

4 FINANCIAL STATEMENTSSEPTEMBER 2011
Túlio Luiz ZaminCEO
promote local development in coordinated effortsjointly with the State Government, but also toincrease the quality of services and accessibilityconditions in the different customer channels,including home and office banking, mobile bankingand correspondent banking network.With respect to services provided at branches, inthe last quarter, business hours of local offices in25 municipalities was expanded, the opening of89 new branches in the Southern Region approved,the purchase of equipment for technology upgradeand furniture for standardizing branch layouttriggered, procedures to review and improve thesizing and allocation of human and materialresources at the Head Office initiated, andprocedures for the integration of internalcommunication mechanisms defined.The strengthening and consolidation ofBanricompras network as an acquiring channel tocapture cards other than those of Banrisul’s issueand the back office automation are part of actionsaimed at increasing levels of operating efficiencyand deepening customer loyalty and therelationship with and users of the institution, withinmarket guidelines and the continuous improvementof processes.And finally, to make a difference in service tocustomers, improvements related to processes ofdealing with people must be reached. As much astechnology incorporates agility and comfort tobanking transactions, the delivery of high servicestandards, characterized by warmth, attention,knowledge and efficiency, implies employeequalification and the ability to retain a talented,
skilled workforce aware of developments in theircareer possibilities.By integrating technology, processes and people,we have maintained the consistent trend ofpositive results. Banrisul’s net income of R$678million in the first nine months of was 32.52%higher than that of the same period last year.Net income of R$239 million in 3Q11 was 15.89%higher than 3Q10 and 5.28% higher than that of2Q11.With R$37 billion in assets, of which R$20 billionin loans, Banrisul’s credit portfolio grew 21.05%in the last twelve months. Total funding, includingthird party assets under managed, reached R$28billion in September 2011, an increase of 14.15%over the same month last year. Shareholders’ equitytotaled R$4 billion at the end of September, withan ROAE of 22.76%.Banrisul recently figured in the third position inrelation to customer satisfaction level in theranking of standard banks, and was highly notedin the item of banking safety as perceived bycustomers. Recently, the Bank was included in TheBest Companies list published by IstoÉ Dinheiro,with special emphasis on indicators of financialsustainabi lity, social responsibi lity andenvironmental and human resources. Banrisul hasbeen repeatedly highlighted by the value of itsbrand, the reputation achieved in the local marketand the return of its shares in the stock exchange.And all this has been achieved obtained frompeople’s work. One has no reason to doubt that wecan be one of the best financial institutions inBrazil when it comes to tending customers.

5
IndexMessage from the CEO........................................................................................... 3
Press Release ............................................................................................................. 11Management Report .................................................................................................. 19
Economic Scenario ................................................................................................. 21Consolidated Performance .................................................................................... 23
Net Income ............................................................................................................. 23Shareholders' Equity .............................................................................................. 23Total Assets............................................................................................................. 24Taxes and Contributions ........................................................................................ 24
Operational Performance ...................................................................................... 25Funds Raised and Under Management .................................................................. 25Securities ................................................................................................................ 25
Loan Operations .................................................................................................... 27Products, Services and Channels ............................................................................ 30
Banricompras.......................................................................................................... 30Banrisul's Correspondent Banks ............................................................................ 30Virtual Branch - Home and Office Banking ........................................................... 31Banrifone and Branch Call Center ......................................................................... 31Credit Cards ............................................................................................................ 31Insurances, Private Pension and Capitalization.................................................... 32Eletronic Bidding.................................................................................................... 32
Public Sector Activities .......................................................................................... 32Banrisul's Customer Service Network .................................................................... 33Subsidiaries ........................................................................................................... 34Corporate Governance........................................................................................... 35
Overview ................................................................................................................ 35Shareholding Structure .......................................................................................... 35Investor Relations and Communication Policy ..................................................... 36Interest on Equity and Dividends Payout Policy................................................... 37
Internal Controls and Compliance .......................................................................... 38Risk Management .................................................................................................. 38Basel Ratio .............................................................................................................. 41
Technological Modernization ................................................................................. 42Marketing .............................................................................................................. 43Human Resources .................................................................................................. 44Corporate Responsibility ....................................................................................... 44
Awards.................................................................................................................... 45 Acknowledgements................................................................................................. 48

6 FINANCIAL STATEMENTSSEPTEMBER 2011
Index of GraphsGraph 1: Net Income ................................................................................................... 23Graph 2: Shareholders' Equity Growth ....................................................................... 23Graph 3: Total Assets Growth...................................................................................... 24Graph 4: Growth of Funds Raised and Under Management ....................................... 25Graph 5: Securities Growth ......................................................................................... 26Graph 6: Loan Operations Growth .............................................................................. 27Graph 7: Commercial Credit Growth - Individuals and Companies........................... 28Graph 8: Banricompras ................................................................................................ 30Graph 9: Shareholding Structure ................................................................................ 36Graph 10: Market Value X Shareholders' Equity......................................................... 36Graph 11: Pay Out - Quartely Payments - R$ Million ................................................. 37
Financial Statements .................................................................................................. 49Balance Sheet ........................................................................................................ 51Statement of Income ............................................................................................. 55Cash Flow............................................................................................................... 56Statement of Value Added..................................................................................... 57Statement of Changes on Shareholders' Equity ..................................................... 58Contents of the Notes to Financial Statements ..................................................... 59
Note 01 - Operations.............................................................................................. 61Note 02 - Presentation of the Financial Statements ............................................ 61Note 03 - Significant Accounting Practices............................................................ 62Note 04 - Interbank Investments........................................................................... 66Note 05 - Securities and Derivatives ..................................................................... 66Note 06 - Restricted Deposits ................................................................................ 68Note 07 - Loans, Lease Operations and Other Credit-like Receivables ............... 69Note 08 - Other Receivables.................................................................................. 71Note 09 - Permanent Assets .................................................................................. 72Note 10 - Deposits and Money Market Funding ................................................... 73Note 11 - Borrowings ............................................................................................. 73Note 12- Onlendings ............................................................................................. 74Note 13 - Other Payables....................................................................................... 74Note 14 - Reserves, Contingent Assets and Liabilities ........................................ 75Note 15 - Income from Services Rendered ........................................................... 76Note 16 - Income from Bank Fees ......................................................................... 77Note 17 - Other Administrative Expenses ............................................................ 77Note 18 - Other Operating Income ....................................................................... 77Note 19 - Other Operating Expenses..................................................................... 78Note 20 - Shareholders' Equity - Banrisul ............................................................. 78Note 21 - Commitments, Guarantees and Other .................................................. 79Note 22 - Income and Social Contribution Taxes .................................................. 80Note 23 - Fundação Banrisul de Seguridade Social and Cabergs - Caixa de
Assistência dos Empregados do Banco do Estado do Rio Grande do Sul ......... 82Note 24 - Financial Instruments and Financial Risks Management...................... 83Note 25 - Transactions With Related Parties ........................................................ 87

7
Note 26 - Impact from the Adoption of the InternacionalFinancial Reporting Standards (IFRS) ................................................................ 92
Note 27 - Authorization for Completion of the Financial Statements ................. 92Report ...................................................................................................................... 93Analysis of Performance ............................................................................................. 97
Banco do Estado do Rio Grande do Sul S.A. ............................................................ 99Banking Industry and Competitive Environment.................................................... 100Economic and Financial Indicators.......................................................................... 101
Assets and Earnings Structure ................................................................................. 102Financial Performance ........................................................................................... 102Capital Expenditure Policy .................................................................................... 103Margin Analysis ...................................................................................................... 104Variations in Interest Income and Expenses: Volumes and Rates ....................... 106
Banrisul's Stock Market Performance .................................................................... 107Evolution of Balance Sheet Accounts ..................................................................... 110
Total Assets ....................................................................................................... 110Securities ................................................................................................................ 111Interbank and Interbranch Transactions ............................................................... 112Credit Operation ............................................................................................... 112Breakdown of Credit by Company Size ................................................................. 113Breakdown of Credit by Sector .............................................................................. 113Breakdown of Credit by Portfolio ......................................................................... 114Breakdown of Credit Disbursement...................................................................... 115Commercial Credit ............................................................................................ 116Breakdown of Credit by Rating .............................................................................. 117Allowance for Loan Losses..................................................................................... 118Cover Ratio ............................................................................................................. 119Default Ratio .......................................................................................................... 119Funds Raised and Under Management .............................................................. 120Demand Deposits ................................................................................................... 120Savings Accounts.................................................................................................... 120Time Deposits ........................................................................................................ 121Assets under Management.................................................................................... 121Cost of Funding ...................................................................................................... 121Shareholders' Equity ......................................................................................... 122Return on Average Shareholders' Equity .............................................................. 123Basel Ratio .............................................................................................................. 123Pace of Growth ....................................................................................................... 124
Evolution of Income Statement Accounts .............................................................. 125Net Income ............................................................................................................. 125Financial Income .................................................................................................... 125Revenue from Treasury Operations ...................................................................... 126Revenues from Credit and Leasing Operations .................................................... 126Revenues from Commercial Credit - Individuals and Companies ....................... 127Financial Expenses ................................................................................................. 129

8 FINANCIAL STATEMENTSSEPTEMBER 2011
Expenses with Market Funding Operations .......................................................... 130Expenses with Borrowings and Onlendings ......................................................... 131Allowance for Loan Losses..................................................................................... 131Financial Margin..................................................................................................... 132Revenue from Services Rendered ......................................................................... 132Administrative Expenses....................................................................................... 133Other Operating Income ........................................................................................ 134Other Operating Expenses .................................................................................... 134
Economic Indicators ............................................................................................... 136Leverage Ratio ....................................................................................................... 136Operating Cost ....................................................................................................... 136Debt-Equity Ratio................................................................................................... 136Employee Productivity .......................................................................................... 137Efficiency Ratio ...................................................................................................... 137
Consolidated Pro Forma Balance Sheet ................................................................. 138Pro Forma Income Statement ................................................................................ 139
Index of GraphsGraph 01: Banrisul PNB Performance vs. Brazilian Stock Market Indexes ................ 107Graph 02: Average Financial Volume, Number of Trades and Number of Shares .... 108Graph 03: Banrisul´s Shares - Geographic Distribution .............................................. 108Graph 04: Total Assets ................................................................................................. 110Graph 05: Composition of Assets................................................................................ 111Graph 06: Securities and Liquid Interbank Transaction.............................................. 111Graph 07: Interbank and Interbranch Transactions .................................................... 112Graph 08: Credit Operations ....................................................................................... 112Graph 09: Commercial Credit Portfolio - Individuals and Companies ...................... 114Graph 10: Credit Portfolio by Risk Levels ................................................................... 117Graph 11: Breakdown of Allowance for Loan Losses ................................................. 118Graph 12: Cover Ratio.................................................................................................. 119Graph 13: Default Ratio ............................................................................................... 119Graph 14: Funds Raised and Under Management ...................................................... 120Graph 15: Cost of Funding as % of Selic Rate ............................................................. 122Graph 16: Shareholders' Equity................................................................................... 122Graph 17: Return on Average Shareholders' Equity................................................... 123Graph 18: Basel Ratio .................................................................................................. 124Graph 19: Pace of Growth - Credit and Funding......................................................... 124Graph 20: Net Income ................................................................................................. 125Graph 21: Financial Income......................................................................................... 126Graph 22: Revenues from Credit and Leasing Operations......................................... 127Graph 23: Financial Expenses ..................................................................................... 130Graph 24: Expenses with Market Funding Operations .............................................. 130Graph 25: Allowance for Loan Losses ......................................................................... 131Graph 26: Financial Margin ......................................................................................... 132

9
Graph 27: Revenue from Services Rendered ............................................................. 133Graph 28: Personnel and Other Administrative Expenses ........................................ 133Graph 29: Other Operating Income ............................................................................ 134Graph 30: Other Operating Expenses ......................................................................... 135Graph 31: Leverage Ratio ............................................................................................ 136Graph 32: Operating Cost ............................................................................................ 136Graph 33: Debt-Equity Ratio ....................................................................................... 136Graph 34: Employee Productivity ............................................................................... 137Graph 35: Efficiency Ratio ........................................................................................... 137
Index of TablesTable 01: Competitive Environment ........................................................................... 100Table 02: Economic and Financial Indicators .............................................................. 101Table 03: Margin Analysis ............................................................................................ 104Table 04: Variations in Interest Income and Expenses: Volumes and Rate .............. 106Table 05: Communication and Relationship Efforts................................................... 107Table 06: Breakdown of Credit to Companies by Company Size ............................... 113Table 07: Breakdown of Credit by Sector ................................................................... 113Table 08: Breakdown of Credit by Portfolio ............................................................... 114Table 09: Breakdown of Credit Disbursement ........................................................... 116Table 10: Composition of General Credit - Individuals and Companies ................... 117Table 11: Balance of Allowance for Losses ................................................................. 118Table 12: Funding Composition .................................................................................. 121Table 13: Cost of Funding ............................................................................................ 122Table 14: Revenues from Commercial Credit - Individuals and Companies ............. 128Table 15: Monthly Average Commercial Credit Rates - Individuals
and Companies ............................................................................................. 129Table 16: Consolidated Pro Forma Balance Sheet ...................................................... 138Table 17: Pro Forma Income Statement ..................................................................... 139

10 FINANCIAL STATEMENTSSEPTEMBER 2011

11
PressRelease

12 FINANCIAL STATEMENTSSEPTEMBER 2011
13
Monday, November 7, 2011 - Earnings Results for the 3r d Quarter of 2011.We report Banrisul’s most relevant numbers for 3Q11 and 9M11. The Analysis of Performance,Management Report, Financial Statements and the Accompanying Notes are available at theBank’s site (www.banrisul.com.br/ir).
Bovespa: BRSR3, BRSR5 , BRSR6This press release contains forward-looking statements, which not only relate to historicfacts but also reflect the targets and expectations of the Company management. The terms“anticipate”, “desire”, “expect”, “project”, “plan”, “ intend” and similar words are intended toidentify statements that necessarily involve known and unknown risks. Known risks includeuncertainties that are not limited to the price and service war impact, acceptance of servicesby the market, service transactions of either the Company or its competitors, regulatoryapproval, currency fluctuation, changes in the service mix and other risks described in theCompany’s reports. This Press Release is updated unti l the present date and Banrisul is notobliged to update it upon new information and/or future events.
( 1 ) Inclui despesas de pessoal, outras despesas administrativas e outras despesas operacionais.( 2 ) Juros sobre o capital próprio e dividendos pagos e/ou distribuídos (antes da retenção do Imposto
de Renda).( 3 ) Inclui aplicações interfinanceiras de liquidez e deduz as obrigações compromissadas.( 4 ) Lucro líquido sobre ativo total médio.( 5 ) Lucro líquido sobre patrimônio líquido médio.
( 6 ) Índice de eficiência – acumulado no período dos últimos 12 meses.Despesas de pessoal + outras despesas administrativas / Margemfinanceira líquida + rendas de prestação de serviços + (Outras receitasoperacionais – outras despesas operacionais).
( 7 ) Imobilizado sobre o patrimônio líquido.( 8 ) Atrasos > 60 dias / carteira de crédito.( 9 ) Provisão para devedores duvidosos / atrasos > 60 dias
Main Income Statement Accounts - R$ Million 9M11 9M10 3Q11 2Q11 1Q11 4Q10 3Q103Q11/ 9M11/2Q11 9M10
Net Financial Margin 2,461.1 2,128.0 873.2 832.6 755.3 786.7 769.7 4.9% 15.7%Allowance for Loan Losses Expenses (463.8) (391.7) (182.3) (143.1) (138.5) (126.6) (111.2) 27.4% 18.4%Gross Profit from Financial Operations 1,997.2 1,736.2 690.9 689.5 616.8 660.1 658.5 0.2% 15.0%Financial Income 4,405.3 3,531.4 1,668.9 1,436.5 1,299.9 1,310.4 1,298.2 16.2% 24.7%Financial Expenses 2,408.0 1,795.2 978.0 747.0 683.1 650.3 639.7 30.9% 34.1%Income from Services Rendered 517.4 468.2 172.4 173.4 171.6 173.5 160.9 -0.6% 10.5%Administrative and Other Operational Expenses (¹) 1,496.3 1,395.8 527.8 499.5 469.0 499.2 478.7 5.7% 7.2%Other Operation Income 199.8 127.8 86.7 46.6 66.5 81.1 39.0 86.2% 56.4%Income from Operations 1,046.8 786.0 362.0 353.5 331.4 361.8 327.0 2.4% 33.2%Net Income 677.7 511.4 239.2 227.2 211.3 229.9 206.4 5.3% 32.5%
Used/Distributed Results - R$ Million 9M11 9M10 3Q11 2Q11 1Q11 4Q10 3Q103Q11/ 9M11/2Q11 9M10
Interest on Own Capital - Dividends (²) 232.2 172.8 58.3 117.1 56.8 120.4 51.6 -50.2% 34.4%
Main Balance Sheet Accounts - R$ Million Sep11 Sep10 Sep11 Jun11 Mar11 Dec10 Sep10Sep11/Sep11/
Jun11 Sep10Total Assets 36,554.1 32,339.3 36,554.1 34,755.0 32,951.0 32,127.7 32,339.3 5.2% 13.0%Securities (³) 10,571.2 10,014.1 10,571.2 9,965.9 9,789.3 9,573.9 10,014.1 6.1% 5.6%Total Lending 19,654.7 16,237.1 19,654.7 18,809.3 17,939.6 17,033.2 16,237.1 4.5% 21.0%Allowance for Loan Losses (1,284.6) (1,122.7) (1,284.6) (1,214.7) (1,156.0) (1,101.9) (1,122.7) 5.8% 14.4%Past Due Loans > 60 days 566.6 487.9 566.6 498.9 478.2 418.0 487.9 13.6% 16.1%Funding and Assets under Management 27,505.3 24,095.2 27,505.3 26,092.7 25,289.8 25,090.8 24,095.2 5.4% 14.2%Shareholders' Equity 4,298.1 3,746.4 4,298.1 4,118.1 4,009.0 3,855.2 3,746.4 4.4% 14.7%Consolidated Reference Equity 4,289.6 3,738.0 4,289.6 4,170.7 4,000.6 3,873.0 3,738.0 2.9% 14.8%Average Shareholders' Equity 4,076.7 3,577.4 4,208.1 4,063.6 3,932.1 3,800.8 3,668.2 3.6% 14.0%Average Total Assets 34,340.9 30,711.7 35,654.6 33,853.0 32,539.3 32,233.5 31,719.1 5.3% 11.8%Financial Index 9M11 9M10 3Q11 2Q11 1Q11 4Q10 3Q10Return on Total Assets 2.5% 2.1% 2.6% 2.6% 2.6% 2.9% 2.6%Return on Shareholders' Equity 21.6% 18.6% 24.2% 24.0% 22.8% 26.1% 23.9%ROAA (p.a.) (4) 2.6% 2.2% 2.7% 2.7% 2.6% 2.9% 2.6%ROAE (p.a.) (5) 22.8% 19.5% 24.7% 24.3% 23.3% 26.5% 24.5%Efficiency Ratio (6) 44.4% 48.5% 44.4% 45.0% 45.8% 47.8% 48.5%Consolidated Basel Ratio 15.9% 15.8% 15.9% 15.6% 15.8% 16.1% 15.8%Fixed Assets Ratio (7) 3.8% 4.6% 3.8% 4.0% 4.3% 4.4% 4.6%Default Rate (8) 2.9% 3.0% 2.9% 2.7% 2.7% 2.5% 3.0%Cover Rate (9) 226.7% 230.1% 226.7% 243.5% 241.7% 263.6% 230.1%Economic Indicators 9M11 9M10 3Q11 2Q11 1Q11 4Q10 3Q10 Effective Selic Rate (accrued) 8.74% 7.03% 3.03% 2.82% 2.65% 2.57% 2.62% Foreign Exchange Rate (R$/USD – end of period) 1.85 1.69 1.85 1.56 1.63 1.67 1.69 Foreign Exchange (%) 11.30% -2.70% 18.79% -4.15% -2.25% -1.67% -5.96%IGP-M (General Market Price Index) 4.15% 7.90% 0.97% 0.70% 2.43% 3.18% 2.08%IPCA (Extended National Consumer Price Index) 4.97% 3.60% 1.06% 1.40% 2.44% 2.23% 0.50%

14 FINANCIAL STATEMENTSSEPTEMBER 2011
Operational Highlights
In 9M11, Banrisul presented ascendant creditrates. Default indicators and credit qualityremained stable, in spite of the riskierenvironment due to the effects of macro-prudential measures issued in December2010 and high interest rates, reverted at theend of 3Q11 due to the foreign economiesenvironment instability. The increase ofcredit, treasury and foreign Exchangerevenues contributed to the growth of thenet interest income.Six months after the Management change,Banrisul has maintained its market-orientedbusiness strategies focused on returns to
public and private shareholders.A mature organization, and by adopting thebest practices of corporate governance,Banrisul ensures that reshuffles in theBoard of Administration and its ExecutiveBody, a natural process within a state-controlled bank, reinforces the continuityof business management and operationalprocesses.The focus on efficiency is also compatiblewith maintaining, by the third consecutivequarter, the Company’s guidance released,despite the changing circumstances of theeconomy.
Financial Performance
Net income registered in 9M11 was R$677.7million, 32.5% or R$166.3 million above thenet income reached in the same period of2010. In 3Q11, net income was R$239.2million, 15.9% or R$32.8 million higher thanin 3Q10.
From 3Q10 to 3Q11, the Bank’s performancepositively reflects the increase of 23.3% orR$217.5 mill ion in credit revenues, ofR$44.3 million in treasury income andservices fees and of R$95.2 mill ion inforeign exchange revenues, howeveroffset by growing financial, market fundingand onlendings expenses.
From 2Q10 to 3Q11, the performancepositively was impacted by the increaseof 8 .9% (R$94.0 mi l l ion) in cred i trevenues and the increase of 6 .4%(R$20.2 mill ion) in treasury revenues,negatively offset by higher f inancial ,market funding and onlending expenses
and administrative costs.
The net interest margin totaled R$2,461.1million at the end of 9M11, a 15.7% (R$333.1million) increase over that of 9M10. NIMwas positively affected by the growth ofrevenues from credit, treasury, restricteddeposits and foreign exchange, whilenegatively impacted by increasingfinancial, market funding and onlendingexpenses.
3Q11’s NIM of R$873.2 million is 13.4%(R$103.5 million) above 3Q10’s, on accountof higher income from credit, treasury andforeign exchange that offset increasesrecorded on financial and market fundingexpenses.
NIM increase in from 2Q11 to 3Q11 isexplained by higher credit and treasury andforeign exchange income in comparison toincreases seen on financial expenses.

15
Evolution of Assets
Total assets at the end of September 2011were R$36,554.1 million, 13.0% (R$4,214.8million) higher than in September 2010. Incomparison to December 2010, assetsincreased 13.8% (R$4,426.4 million), whileexpanding 5.2% (R$1,799.1 million) from2Q11 to 3Q11.
The year-on-year asset growth of R$2,956.0million comes from the expansion of thefunding portfolio and the increase of R$616.2million in escrow deposits. In the last twelvemonths, the growth of credit (in R$3,417.6million) and interbank transactions (inR$812.9 million) were the main drivers ofasset allocation.
Banrisul‘s credit portfolio totaled R$19,654.7million in September 2011, exceeding by21.0% the balance as of September 2010, by15.4% the amount as of December 2010 andby 4.5% the balance as of June 2011.
In September 2011, commercial credit toIndividuals totaled R$8,326.7 mill ion,15.4% (R$1,108.5 million) over September2010, increasing 12.5% (R$928.3 million)
over December 2010 and 1.4% (R$115.3mill ion) from 2Q10. Payroll loansconsolidated as important tool in theexpansion of operations in the last twelvemonths. Credit to companies totaledR$6,580.2 million at the end of September2011, increasing 24.2% (R$1,283.8 million)in twelve months, 14.8% (R$848.0 million)year-to-date and 3.4% (R$216.4 million)from 2Q10 to 3Q10.
Non-performing loans over 60 days, 2.9% ofthe loan book, reduced 10 basis points fromSeptember 2010 to 2.9% of total loans inSeptember 2011. NPL over 90 days was 2.4%in September 2011, below market ratios.Total provisions remain at a level sufficientto cover loans in arrears.
Securities totaled R$10,571.2 million at theend of September 2011, amount 5.6%(R$557.1 million) above that of 3Q10. Year-to-date, securities increased 10.4% (R$997.2million) and rose 6.1% (R$605.2 million) from2Q11 to 3Q11. This amount includes liquidinterbank transactions but excludes total
At the end of 3Q11, expenses with loan lossesallowance totaled R$463.8 million, 18.4%(R$72.1 million) higher than that recordedon 9M10, reflecting the growth of the loanportfolio and also of loans past due over 60
days. From 2Q11 to 3Q11, provision expensestotaled R$182.3 million, increasing 63.9%(R$71.1 million) in twelve months and 27.4%(R$39.2 million) quarter-on-quarter.
9M11 9M10 3Q11 2Q11 1Q11 4Q10 3Q10
Financial Margin 2,461.1 2,128.0 873.2 832.6 755.3 786.7 769.7
Gross Profit from Financial Operations 1,997.2 1,736.2 690.9 689.5 616.8 660.1 658.5
Average Profitable Assets (1) 31,178.4 28,433.1 32,140.6 31,475.5 29,919.1 29,563.8 29,291.2
Net Financial Margin(2) 10.7% 10.1% 11.3% 11.0% 10.5% 11.1% 10.9%
Gross Profit from Financial Operations(3) 8.6% 8.2% 8.9% 9.1% 8.5% 9.2% 9.3%(1) Average Interest-Earning Assets of the Period(2) Net Financial Margin / Average Profitable Assets (Annualized)(3) Gross Profit from Financial Operations / Average Profitable Assets (Annualized)
Financial Margin R$ Million

16 FINANCIAL STATEMENTSSEPTEMBER 2011
The efficiency ratio reached 44.4% in the pasttwelve months ended in September 2011.The consistent reduction in efficiency ratioreflects the capacity of the financial margin,sustained by the growth in revenue fromcredit, treasury and favored by reduction offinancial expenses, to absorb the increase inadministrative and operating expenses.
Operating cost indicator ended September2011 at 4.9% for the past twelve months.Asset expansion, leveraged by the growthin credit operations helped to absorb theincrease of administrative expenses,reflecting in the reduction of costs inproportion to the assets in twelve months.
Sep/11 Jun/11 Mar/11 Dec/10 Sep/10
Total Assets 36,554.1 34,755.0 32,951.0 32,127.7 32,339.3
Tot al Credit O perations 19,654.7 18,809.3 17,939.6 17,033.2 16,237.1
Securities (1) 10,571.2 9,965.9 9,789.3 9,573.9 10,014.1
Funds raised and under management 27,505.3 26,092.7 25,289.8 25,090.8 24,095.2
Shareholders' Equity 4,298.1 4,118.1 4,009.0 3,855.2 3,746.4(1) Securities + In terbank Investiments - Matched Transactions
Highlights R$ Million
liabilities from matched transactions. Thelower securities balance year-on-yearreflects the Bank’s policy of migrating tohigher yield assets.
Funds raised and under management totaledR$27,505.3 million in September 2011,growing 14.2% (R$3,410.2 million) overSeptember 2010, 9.6% (R$2,414.5 million)year-to-date and 5.4% (R$1,412.6 million)quarter-on-quarter.
The growth in the last twelve months camemainly from the expansion of time anddemand deposits. Ye ar-to-dat e, the
increase of time deposits and third-partyassets under management exceeded thereduction of demand and savings deposits,indicating migration of funding. Similartrend was also observed in the last quarter.
At the end of September 2011,shareholders’ equity totaled R$4,298.1million, with increases of 14.7% in twelvemonths, 11.5% year-to-date and 4.4% from2Q11 to 3Q11, on account of profitsaccounted net of dividends and interest oncapital paid and provisioned. In 9M11, ROEreached 22.8%, and Basel ratio was 15.9%.
Guidance
Banrisul’s strategic guidelines established forthe period 2011-2014 are grounded on theexpansion of loan and funding portfolios, onthe consolidation of market share in services,especially through Banricompras Network,on ongoing improvements of customerservices, on preserving investment ininnovation and reinforcing mechanisms ofinternal controls and risk mitigation and on
employees’ retention and qualification,based on sound, efficiency orientedprinciples of sustainability and management.
In the short term, the special attention tobusiness continuity and the Bank’scommitment to its 2011 guidance has beenreflected in the results achieved in the 9M11,in line to expectations from when it was firstreleased and the reason as to why business

17
Estimate Banrisul Year 2011 Not Altered
CREDIT PORTFOLIO 15% to 20%
Commercial Credit - Individuals 12% to 17%
Commercial Credit - Companies 16% to 21%
Real Estate Loans 18% to 23%
Provision Cost / Average Credit Portfolio 3% to 4%
Allowance for loan Losses / Average Credit Portfolio 6% to 8%
FUNDING 15% to 20%
Time Deposits 35% to 40%
Return on Average Shareholders' Equity 19% to 23%
Efficiency Ratio 44% to 48%
Net Financial Margin / Interest-Earning Assets 10% to 11%
* No altered in 3Q11
and indicators forecasts have beenmaintained ever since.Credit evolution confirms the expecteddeceleration in response to measuresadopted by the Central Bank of Brazil at the
end of December 2010, with a view tomaintaining monetary stabi lity. Otherassumptions included in the guidance reflectthe priority to preserve asset quality and tomanage costs.
Awards
January 2011. Banrisul Brand is featured in world ranking.
January 2011. Banrisul is one of the best reputed companies in Rio Grande do Sul.
March 2011. Banrisul is highlighted in the study Brands of Who Decides.
April/2011. Banrisul’s shares presented the best performance.
April/2011. Banrisul, one of the largest companies in the world.
May/2011. Banrisul’s shares listed in Bovespa’s new index.
May/2011. Banrisul, one of Brazil’s most valuable brands.
June/2011. Banrisul among Brazi l’s most valuable brands.
June/2011. Banrisul is the most remembered brand of Rio Grande do Sul in the bankcategory.
June /2011. Banrisul receives Government and Society Sustainability Certificate.

18 FINANCIAL STATEMENTSSEPTEMBER 2011
July/2011. Banrisul is one of Brazi l’s 100 largest companies.
July/2011. Projeto Pescar Banrisul is awarded as Best Educational Practice.
August/2011. Banrisul is recognized as the Sports’ Best Friend.
August/2011. Bank is featured in national ranking.
August/2011. Banrisul is among the 500 best companies in the country.
August/2011. Banrisul is featured on the socio-environmental area.
August/2011. Banrisul is awarded the Luiz Henrique Roessler Environmental Merit.
September/2011. Banrisul featured in the ranking of customer satisfaction.
Porto Alegre, November 7, 2011.

19
Management ReportWE PRESENT THE MANAGEMENT REPORT AND FINANCIAL STATEMENTS OF BANCODO ESTADO DO RIO GRANDE DO SUL S.A. IN THE 3 RD QUARTER OF 2011 ANDBETWEEN JANUARY AND SEPTEMBER 2011, PREPARED IN ACCORDANCE WITH THERULES OF THE BRAZILIAN SECURITIES AND EXCHANGE COMMISSION (COMISSÃODE VALORES MOBILIÁRIOS – CVM) AND THE CENTRAL BANK OF BRAZIL.

20 FINANCIAL STATEMENTSSEPTEMBER 2011

21
Economic Scenario
During the first semester and the beginning of the secondhalf of 2011, the international economic scenario wascharacterized by the deepening of the global financialinstability, directly associated with the worsening of fiscalproblems in developed economies and the increasing riskof inflation, especially in emerging economies, anduncertainties regarding the recovery of the world’seconomic activity. The protracted stalemate on raising thedebt ceiling as well as the unfavorable prospects for theperformance of the economy in the USA led to thedowngrading of the world’s largest economy rating, withrelevant consequences in the deterioration of consumerand business confidence and in the almost stagnation ofthe economic activity. In Europe, high unemployment
rates, high public debt and low economic growth contributed to increasing global risk aversionand the demand for liquid, low risk assets, and promoted, more recently, the recovery of theUS Dollar in world markets.
The domestic environment, although housed in a highly uncertain international environment,presented a firm economic growth, albeit moderate when compared to the same period lastyear, driven by household consumption which, in turn, was supported by the stability of thelabor market, with historically low unemployment rates and high real wages, as well as bythe consistent evolution of credit in Brazil. In combination with high levels of installed capacityutilization, such a situation led to the gap between the demand and supply growth rates,culminating at inflationary pressures aggravated by the boom of commodity pricesinternationally. Stubbornly such pressures kept market expectations pessimist throughoutthe year, signaling further deterioration of the inflation picture and lower growth rate,nevertheless being partially attenuated by the appreciation of the Brazilian Real in the sameperiod, largely stemming from excess of liquidity in international markets and from theattractiveness of the local economy.
In contrast, the monetary authority has implemented adjustments in monetary policy, raisingthe Selic rate by 175 basis points from January to July, reaching 12.50% per year, besides othermacro prudential measures such as lifting bank reserve requirements and increasing tax onfinancial operations and capital requirement for banks. However, against the backdrop ofincreased uncertainty and pessimism about the evolution of the global economy, monetarypolicy was promptly reversed by starting, in late August, a new setting cycle for the Selic rate,with a drop of 50 points base to the level of 12.00% per year, in order to preserve adequateconditions for the Brazilian economy.
As for the State of Rio Grande do Sul, economic activity showed moderate performance fromJanuary to September 2011 in comparison to the first nine months of 2010, following the

22 FINANCIAL STATEMENTSSEPTEMBER 2011
dynamics of the rest of the country. This moderate scenario reflected fundamentally thestagnation of industrial activity, despite the positive performance of retail sales supported bysolid labor market and the exports of primary products as a result, mainly, of the appreciationof commodities. According to data released by the Federation of Industries of Rio Grande doSul – FIERGS -, the Industrial Performance Index stalled in the first eight months of this year,revealing difficulties to overcome restrictions and resume growth. Among the restrictivefactors to the expansion of the industrial sector, exchange valuation stood out, with directeffects on the trade balance of manufactured products and on the domestic demand, as itmakes local products less attractive abroad and favors the supply of internal market withimported goods, in combination with the apathy of international economic activity. It is worthmentioning that, despite this scenario, the level of installed capacity utilization remained athigh peaks and the variables associated with labor market still showed no significantdeterioration.
Regarding the agricultural sector, the estimate for the total grain harvest in the State of RioGrande do Sul for 2010/2011 already surpasses by 13.5% the effective 2009/2010 harvest, thehighest growth in the Southern Region of Brazil which, coupled with rising prices, guaranteesthe performance of the primary sector in the State. According to Conab’s (Companhia Nacionalde Abastecimento - National Supply Company) September survey, grain production is expectedto surpass 28 million tons, driven by productivity increases and suitable climatic conditions.
As for the State’s trade balance, the result of foreign sales from January to September 2011recorded significant growth driven mainly on higher prices. In the period, exports totaledUSD15 billion, 30.03% higher than that of 9M10. With these figures, Rio Grande do Sul hasreturned to be listed among the largest Brazilian exporting states, contributing now to 7.89%of Brazil’s total exports. On the other hand, imports remained high, supported by favorableexchange rate and the expansion of the internal market, recording, in 9M11, an increase of18.26%. Thus, the State’s trade balance had a surplus of USD3 bi llion, representing an increaseof 95.08% on accumulated numbers in the first nine months of 2011.
In this scenario, it is worth noting also that the evolution of prices from January to Septemberthis year remained dynamic similar to that observed nationally, with major impacts on Food,Housing and Education. Based on IPCA - Extended Consumer Price Index for the MetropolitanRegion of Porto Alegre, accumulated inflation in period was 4.68%.

23
Consolidated Performance
Net Income
Banrisul’s net income totaled R$678 million between January and September 2011, R$166million or 32.52% above the result recorded in the same period in 2010, due to the growth ofcredit and treasury revenues and services fees, and lower administrative costs (exceptpersonnel expenses).
Graph 1: Net Income - R$ Million
Shareholders’ Equity
At the end of September 2011, Banrisul’s shareholders’ equity totaled R$4,298 million, growing14.73% in twelve months as the result of the incorporation of net income net and the deductionof dividend and interest on equity payments and provisions. Return on average shareholders’equity in 9M11 reached 22.76% per annum.
Graph 2: Shareholders’ Equity Growth - R$ Million

24 FINANCIAL STATEMENTSSEPTEMBER 2011
Total Assets
Total assets amounted to R$36,554 million at the end of September 2011, a 13.03% increase inrelation to the R$32,339 million recorded in the same period of 2010, coming from creditexpansion leveraged by the growth of the commercial credit to individuals and companies.
Graph 3: Total Assets Growth - R$ Million
Taxes and Contributions
In 9M11, Banrisul collected and provisioned R$582 million in taxes and contributions. Thetaxes retained and passed through levied directly on financial intermediation and otherpayments amounted to R$370 million.

25
Operational Performance
Funds Raised and Under Management
Funds Raised and Under Management totaled R$27,505 million in September 2011, up 14.15%or R$3,410 million in twelve months. Banrisul has maintained its retail funding policy.
The balance of time deposits reached R$13,269 million, a 39.19% or R$3,736 million increaseover September 2010, and make up for 48.24% of total funding. Savings deposits reduced19.43% or R$1,223 million, ending 9M11 with a balance of R$5,072 million, and account for18.44% of the total funds raised and under management. Demand deposits, which accountfor 9.29% of total funding, increased 21.20% or R$447 million year-over-year and reached thebalance of R$2,556 million. Assets under management, which account for 23.98% of totalfunding, totaled R$6,595 million at the end of 9M11, increasing R$454 million or 7.4% overSeptember 2010.
Graph 4: Growth of Funds Raised and Under Management - R$ Million
Securities
The balance of securities stood at R$10,571 million in September 2011, a year-on-year increaseof 5.56% or R$557 million. This balance includes interbank investments net of resale andrepurchase agreement liabilities.
As confirmed by internal technical studies, Banrisul has a strong financial capacity and intendsto hold securities classified as “held-to-maturity” pursuant to Article 8 of the Central Bank ofBrazil Circular Letter no. 3068 of November 8, 2001.

26 FINANCIAL STATEMENTSSEPTEMBER 2011
Graph 5: Securities Growth* - R$ Million
*Net of Matched transactions

27
Loan Operations
In September, 2011, Banrisul’s loan portfolio totaledR$19,655 million, 21.05% or R$3,418 million above theR$16,237 million recorded in the same month of 2010.Accounting for 70.00% of such growth, the commercialcredit portfolio increased from R$12,515 million toR$14,907 million, rising 19.12% or R$2,392 million intwelve months.
At the end of September 2011, credit operations of AAto C ratings, representative of normal risk according to
Resolution no. 2682/99 of Conselho Monetário Nacional, accounted for 89.02% of the creditportfolio, with a balance of R$17,496 million. Credit operations rated D to G (risk level 1),amounted to R$1,642 million, equivalent to 8.35% of the loan portfolio. Risk level 2, composedsolely by operations rated H that require provisions of 100%, represented 2.63% or R$517million of the total loan portfolio.
Graph 6: Loan Operations Growth - R$ Million
At the end September 2011, commercial loan operations (non ear-marked credit) to individualstotaled R$8,327 million, accounting for 55.86% of the commercial portfolio and 42.37% of allloan operations. The 15.36% or R$1,108 million year-on-year increase is particularly due tothe growth of payroll loans.
Own payroll loan portfolio amounted to R$3,717 million in September 2011, 12.25% abovethe balance recorded in the same month of 2010. Acquired payroll loan portfolio amountedto R$2,381 million in September 2011, a year-on-year increase of 16.93%.
Commercial loan operations targeted to Companies increased R$1,284 million or 24.24%,totaling R$6,580 million at the end of September 2011, and accounted for 44.14% of the

28 FINANCIAL STATEMENTSSEPTEMBER 2011
commercial credit portfolio and for 33.48% of the loan book. Working capital lines increased28.23% year-on-year, reaching a balance of R$4,835 million in September 2011.
Graph 7: Commercial Credit Growth – Individuals and Companies - R$ Million
The balance of real estate loans reached R$1,611 million in September 2011, an increase ofR$393 million or 32.31% in twelve months. In 2011, Banrisul held events in various locations topromote the lines of credit and financing conditions offered by the Bank to real estatecompanies and brokers, to real estate loans correspondents, to developers and otherprofessionals engaged in real estate business. Since September 2011, and looking to addbenefits to the portfolio, the customer who was has a real estate finance at Banrisul has thebenefit of opting to include in the loan the amount due as ITBI (tax transfer of immovableproperty) and other fees, and may also choose for a grace period of up to 3 (three) months forthe payment of amortization.
At the end of September 2011, rural lending amounted to R$1,584 million, an increase ofR$403 million or 34.18% in twelve months. In order to stimulate the productive sector ofagribusiness and to expand Banrisul’s market share in rural lending, the Bank has attendedagricultural fairs, created new products for the sector and provided training to employees.The Bank’s participation at the 34th Expointer, held between August 27 and September 04,2011, increased the amount of agricultural credit proposals in the amount of R$47 million, anincrease of 138% over 2010. In their implementation phase and expected to begin operationsin the fourth quarter of 2011, programs were created, such as the Banriagro Simplified Credit,for cooperatives and agribusinesses, and the Rice in the Mercantile Exchange, a partnershipwith Banrisul’s Brokerage Company. During this period, 330 branch employees participated intraining courses to efficiently and effectively operate the demand for rural credit.

29
The long-term finance portfolio totaled R$838 million in the end of 9M11, an increase ofR$193million or 30.00% over the balance recorded in 9M10.
ACC and ACE (pre- and post-shipment export financing operations) totaled R$513 million atthe end September 2011.
It is the aim of Banrisul to align public policy with social and economic development toexpand the supply of credit for formal and informal businesses. Given this purpose, in July2011 microcredit ’s project and risk policy were approved. In August, the launch of GauchoMicrocredit program by the State Government was the highlight, and microcredit operationsstarted at Banrisul.

30 FINANCIAL STATEMENTSSEPTEMBER 2011
Graph 8: Banricompras
Financial Transactions - R$ Million Transactions - Million
Products, Services and Channels
Banricompras
Banrisul customer’s unique product, Banricompras conducted 56 millionoperations from January to September 2011, totaling R$3,909 million in
financial turnover, numbers that are 9.67% and 15.66%, respectively,higher to the same period last year. The strengthening of the
Banricompras Network is part of the Bank’s business strategy, whichincluded entering into accrediting new merchant stores, providingshop owners and customers various payment options on a singleterminal.
Banrisul has established agreement to offer the SafetyPay system in Brazil,through operations to be carried out online by the store Amazon.com and
settled through Banrisul's Internet Banking. Initially, the launch of the International SafetyPayBanricompras is available only to Banrisul's employees for subsequent use by customers.
In July 2011, the Bank and the Verde Administradora de Cartões de Crédito (VerdeCard – CreditCard Issuing Company) entered into a partnership that will allow Banricompras network tocapture debit and credit transactions other than Banrisul’s debit card directly at terminals andPOS, providing new business opportunities for both companies.
Partnerships with other card brands allow the increase of Banrisul own network, which isbecoming a multibrand one. This diversity of payment options offered by BanricomprasNetwork enables business expansion to the Bank and brings convenience, safety and state-of-the-art benefits to its affiliated stores and customers.
Banrisul’s Correspondent Banks
From January to September 2011, Banrisul had approximately 2,000 correspondent banks,with an average of 5 million transactions per month. At the end of this quarter, 43 milliontransactions were recorded with a financial turnover of R$10.865 million, an increase of 8.08%over 9M10.

31
Virtual Branch – Home and Office Banking
From January to September 2011, 76 million operations totaling R$65,664 million were carriedout through Agência Virtual Banrisul (Banrisul Virtual Branch). In relation to the same periodin 2010, the number of transactions grew 4.11% and the financial turnover, 15.91%.
Banrifone and Branch Call Center
Through Banrifone, customers can obtain account statements and balances, request bankingservices and carry out banking transactions, all these over the phone. During the first ninemonths of 2011, Banrifone electronic service had 4 million accesses, 420.000 of them operatorassisted, and presented a financial turnover of R$166 million, information services aside.Over the same period, 987.000 phone calls with a financial turnover of R$17 million weremade to the Branch Call Center, designed to capture calls from individual customers that aremade to branches that are part of such service.
Credit Cards
At the end of September 2011, Banrisul had a base of 403,000 Visa and MasterCard creditcardholders, 42.18% up over the same period in 2010. During the same period, credit cardcustomers were responsible for a financial turnover of R$759 million in 10 million transactions,an increase of 39.88% and 34.32%, respectively, over 9M10.
In Banrisul’s own acquiring network, Banricompras Network, a wide variety of transactionscan be carried out: with Banricompras and MasterCard cards, Meal Food, Benefits, Presentand Fuel cards, and IPE’s (Instituto de Previdência do Estado – Social Security Institute of theState of Rio Grande do Sul) Health Care. As a result from the strategy of entering into theacquiring business, Banricompras network has started a multibrand expansion since 2010and, from March 2011 on, has gained notoriety with the capture of debit and credit cardstransactions with the MasterCard brand. Recently, the Bank has also prepared the network tocapture credit card transactions with the VerdeCard label. The technological advances offeredby the network include modern solutions that meet the needs of commercial trade.
As issuer of Visa and MasterCard cards, Banrisul has promoted internal campaigns to increasesales. Beside the BanriClube de Vantagens (Banrisul’s reward program), released at the end of2010, commercial campaigns conducted during 3Q11 ended up with sales of more than 50,000credit cards.
These actions to broaden and improve the card base and has brought in recognition. Recentsurvey conducted by the consulting company CVA Solutions demonstrated that Banrisul’scustomers are satisfied with the interest rates charged in the revolving credit facilities andwith the outreach of its network in the State. The survey indicated that the Bank is the secondbest institution according to how customers perceive the cost-benefit perceived of plasticmoney.

32 FINANCIAL STATEMENTSSEPTEMBER 2011
Insurance, Private Pension and Capitalization
The expansion of the Brazilian economy and improved income distribution have brought intothe insurance market new customers, especially from the classes C and D. In this scenario,following the rapid growth of the insurance industry, Banrisul has sought to better repositionits products and establish actions and campaigns to increase synergy among customers, pointof sale and brand value, which strengthens Banrisul’s identity as a provider of insurancesolutions.
In the third quarter of 2011, the Bank launched three new insurance products: EngineeringRisk, Civil Liability and Miscellaneous Equipment Risks. In the same period, the marketing oflife and automotive insurance products was encouraged, through campaigns named Auto andLife SuperAção, with the participation of more than 3,000 employees.
Electronic Bidding
The Electronic Auction is a modern shopping portal on the Internet directed at public companiesindirectly controlled by the State Government, municipal governments and other public andprivate entities. By September 2011, R$608 million in purchases of goods and the hiring ofservices were carried out, in 34,000 trading sessions of bidding contests. Banrisul, in the sameperiod, while user of the Procurement System, held 298 trading sessions, with a total of R$24million in purchases of goods and contracting of services, which represented a reduction ofR$12 million over the R$36 million initially offered for the purchases, an economy of 33.33%.
Public Sector ActivitiesBanrisul continuously strives to strengthen customerservice and collaborate with the economic and socialdevelopment of Rio Grande do Sul. Focused on thatmission, it establishes partnerships with the governmentat the municipal, state and federal levels.
In order to reduce operating costs for the municipalities,the Bank has maintained the focus of providing productsand services, particularly the fleet managementsolutions and the management of electronic purchases. During the 9M11, through placingtelephone calls and sending illustrative e-mails to local government representatives, thedisposition of credit lines to anticipate year-end bonus (the 13th salary) to municipal civilservants was made available. Among the banking services offered from January to September2011, a total of R$814 million was raised from municipal taxes and fees upon the collection ofmore than four million documents. In relation to managing assets from the public sector,marketing actions addressing the social security system related to the civil servants wererestructured, in order to expand the attractiveness of Banrisul’s products. Also noteworthy isthe Bank’s participation in FAMURS 31 st General Congress with the theme Agriculture:Sustainable Growth and Economic Relevance.

33
Eletronic Service Station - Brasília Passo da Areia Branch - Bourbon Shopping - Porto Alegre
Trindade Branch - Florianópolis
To service the state public sector, in conjunction with the Court of the State and the StateDepartment of Finance, Banrisul launched the Automated State Debt Security, a new systemof transferring information between the Court of Justice of the State of Rio Grande do Sul andBanrisul, which enables the deposit of amounts in all of the Bank’s branches, eliminating theneed for going in person to the State Debt Security Agency in Porto Alegre.
Responsible for payments to policyholders/beneficiaries of Social Security, Banrisul mademore than 254,000 payments to new beneficiaries of the Social Security during the first ninemonths of 2011, consolidating its position as the bank of choice in the state of Rio Grande doSul in the providing benefits payment on behalf of the Institute.
Banrisul´s Customer Service NetworkBy the end of September 2011, Banrisulserved its customers in 1,272 points,distributed in 440 branches (399 in RioGrande do Sul, 25 in Santa Catarina, 14 inother Brazilian states, one in New Yorkand one in Grand Cayman), 279 bankingservice stations and 553 electronicservice stations. In Rio Grande do Sul, theBank is present in 414 municipalities,covering 98.31% of the population andthe GDP of the state.
The focus of expansion of the service network is in the Southern Region of the country. Thecurrent expansion project encompasses the opening of 35 branches in places where Banrisulis already present, 21 new branches in cities that lack banking presence and to transform 48service stations into full small size branches in the State of Rio Grande do Sul, besides the 7new branches to be opened in the State of Santa Catarina, totaling 111 branches.

34 FINANCIAL STATEMENTSSEPTEMBER 2011
99.6% ON70.5% PNA13.0% PNB57.0% Total
0.4% ON29.5% PNA87.0% PNB43.0% Tot al
State of RioGrande do Sul Market
Banco do Estadodo Rio Grande do Sul S.A.
Banrisul S.A.Adm. Consórcios
Banrisul S.A.CVMC
Banrisul ArmazénsGerais S.A
Banrisul ServiçosLtda.
99.6% Total 98.7% Total 99.5% Total 99.8% Total
Subsidiaries
Banrisul S.A. Administradora de Consórcios –The Company ended September 2011 with 24,983active groups and with a loan portfolio of R$762 million. In the first nine months of 2011, 3,403letters of credit were granted to customers, equivalent to R$83 million for the purchase ofgoods. Net income in 9M11 totaled R$11 million.
Banrisul S.A. Corretora de Valores Mobiliários e Câmbio – By the end of September 2011, theCompany brokered R$843 million in the stock market, of which 65.30% through Home Broker.Net income for the first nine months of 2011 totaled R$3 million.
Banrisul Armazéns Gerais S.A. – Banrisul Armazéns Gerais S.A. accumulated until September2011 a net income of R$1 million. The company’s strategy to expand its participation in thelogistics market is to invest in technology, process automation, increase of workforce andsearch for new market niches.
Banrisul Serviços Ltda. – Banrisul Serviços Ltda. operates in the southern region of Brazil inthe segments of meal and food vouchers, fuel, gifts, private label and benefit cards. On adaily basis, more than 410,000 individual customers and 5,500 companies use its products inmore than 50,000 affiliated stores. Regarding the lines sponsored by the Federal Governmentwithin the Programa de Alimentação ao Trabalhador (PAT - Workers' Nourishment Program),Refeisul is responsible to make payments under PAT program to about 35% of the totalbeneficiaries in Rio Grande do Sul. By September 2011, the company's net income was R$15million.

35
Corporate Governance
Overview
Since July 2007 listed on BM&FBovespa SA‘sCorporate Governance Level 1, Banrisul meetsthe requirements of this level of listing and alsorequirements of other levels of corporategovernance, in line with best market practices,on behalf of greater transparency, fairness andproper accountabi lity, whi le enhancingcredibility and the interest of investors andcustomers.
Corporate governance practices create incentives and monitoring mechanisms, ensuring thatthe Banrisul’s behavior is market oriented. They also confirm the interest in improving andstrengthening relations with its controlling shareholders, the Board of Administration, FiscalCouncil, Board of executive Officers, independent auditors, oversight bodies and other relatedparties and stakeholders.
Such practices are important, especially in times of administrative changes such as occurredduring the first semester of this year, yet without significant changes in Banrisul’s businessmanagement, reinforcing its role as a state-controlled, market-oriented publicly held company.
It is also worth noting that, in the first quarter of 2011, Deloitte Touche Tohmatsu, independentauditors, was replaced by Ernst & Young Terco Auditores Independentes S/S upon terminationof contract. The hiring was done through a bidding process (Public Competition 97/2010), asestablishing by the Law No. 8666 of June 21, 1993 (Public Procurement Law), which sets forthrules forbidding and contracts within the Public Administration area, to which Banrisul has toabide for being a public capital company controlled directly by the State of Rio Grande do Sul.
The participation of the Boards of Administration and Fiscal Council in the decision-makingstructure, the management model focused on profitability and quality of operations and theadoption of corporate governance policies give Banrisul strength and recognition, as reflectedin the proper performance within the banking industry.
Shareholding Structure
The Government of the State of Rio Grande do Sul, as the main shareholder, have control overthe election of the Board of Administration and, therefore, over Banrisul’s management andoperations. However, the Bank’s free float is above the minimum of 25% required by CorporateGovernance Level 1: 42.8% of its total shares are held by shareholders without any connectionwith the Institution. Banrisul’s shareholding structure is presented in the following graph.

36 FINANCIAL STATEMENTSSEPTEMBER 2011
Investor Relations and Communication Policy
A transparent relationship with clients and investors is built through the disclosure of dataand information to the market, communication that allows broader and timely knowledge ofthe Bank’s business.
Banrisul’s Investor Relations website, available in Portuguese and English, provides clear,detai led and timely information for the Bank’s shareholders, institutional investors,individuals, market analysts and other interested stakeholders.
The significance of these events is reflected on Banrisul’s trading volume. At the end ofSeptember 2011, the Bank’s PNB stock (BRSR6) ranked 94th among the 100 most-traded stockson BM&F Bovespa (78th in twelve months).
Banrisul’s market value in September 2011, represented by the total number of outstandingshares multiplied by the closing price of its PNB stock, was 52% higher than shareholders’equity in the same period.
Graph 10: Market Value X Shareholders’ Equity - R$ Mi llion

37
The table below shows the geographic distribution of shareholders by number and numberof Banrisul’s shares held.
REGION SHAREHOLDERS % SHARES %
BRAZIL 55,500 98.96% 242,276,301 59.24%
NORTH AMERICA 263 0.47% 57,451,426 14.05%
CENTRAL AMERICA 15 0.03% 1,528,485 0.37%
SOUTH AMERICA (Except Brazil) 8 0.01% 1,162,443 0.28%
EUROPE 218 0.39% 85,992,065 21.03%
AFRICA 1 0.00% 95,000 0.02%
ASIA 67 0.12% 18,354,238 4.49%
OCEANIA 14 0.02% 2,114,519 0.52%
TOTAL 56,086 100% 408,974,477 100%
Interest on Equity and Dividends Payout Policy
Since early 2008, Banrisul has maintained the policy of paying interest on equity on a quarterlybasis and, historically, has remunerated its shareholders by paying interest on capital anddividends above the minimum level required.
From January to September 2011, R$221 million net of income taxes were paid/provisionedas interest on own equity and dividends.
Graph 11: Pay Out – Quarterly Payments - R$ Million

38 FINANCIAL STATEMENTSSEPTEMBER 2011
Internal Controls and Compliance
To strengthen the system of internal controls, Banrisul hasadopted policies aimed at spreading the culture of internalcontrols, ensuring compliance with rules, procedures andstandards established by law and enforcement agencies.
The internal controls policy establishes guidelines that seek toperiodically reinforce the alignment of internal controls withthe goals related to global business strategies and otherinstitutional policies set by the management.
The area in charge of internal control monitors activities in order to ensure compliance withregulations, the use and the effectiveness of controls in the many processes of the institution,to prevent and reduce risks inherent to business.
The spread of a controlling culture and the maintenance of an ethical environment areguaranteed by a set of rules, regulations and codes that guide employees in their activities toincorporate the values and ethical principles of the Organization.
Money Laundering Prevention - MLP
The Bank has established specific prevention processes and systems in order to ensure thatits activities are conducted in an environment of adequate controls to prevent risks related tothe crime of money laundering.
In this context, Banrisul maintains dedicated staff devoted to the execution of tasks focusedon the prevention of money laundering, which is responsible for reviewing legislation andprocedures and developing training programs for all employees.
The “Know Your Customer” process is continually reviewed and disseminated, emphasizingthe importance of timely, qualified customer information gathered at the beginning of eachand every business relationship, mitigating the risks of having the Bank’s services and productsused to legitimize illicit activities.
Risk Management
The risk management is embedded and continuously monitored in Banrisul’s strategicplanning. Management is performed on a consolidated basis and is added to the managementstructures dealing with credit, market, liquidity and operational risk, which contributes toexpedite processes, to decision making and to the alignment to the provisions of best practicesand standards defined by the Central Bank of Brazil, in accordance with the guidelines of theBasel Committee.

39
Credit Risk
The institutional policy for the management of credit risk at Banrisul aims to identify, measure,monitor and mitigate exposure to credit risk within the loan portfolio; to act towardsconsolidating a culture of best practices in credit risk management; to enhance ongoingmanagement of credit risk in all types of assets; to ensure adequate levels of risk and avoidlosses not covered; to ensure impartial and segregation of function in the process of managingcredit risk.
In the process of identifying, evaluating and monitoring credit risk, Banrisul adopts CreditScore and Behavior Score models when dealing with Individuals, defining pre-approved creditlimits based on risk classifications provided for in statistical models. The analysis of adherenceto the model is assessed every six months by the Board of Executive Officers and the BankingManagement Committee. For the Companies segment, the Automated Credit Risk Modelwas established in February 2011, also based on models of Credit and Behavior Scores. At thisstage of implementation, the current policy model in use by the Bank, through credit scopeand credit grant by the Branches Credit Committees, remains as it is. For the Corporatesegment, Banrisul has adopted technical studies performed by the internal area of risk analysis,which evaluates companies from the financial, management, marketing and productionperspectives, with periodic review, considering economic scenarios, simulating the economicsituation of companies in these environments.
As for the credit operations not covered by scoring models and onlendings operations throughfinancial agents, Banrisul assesses the probability of default of counterparties individually,through classification tools designed for the different categories of counterparties. Regularly,the Administration validates the performance of the classification and its predictive powerwith respect to events of default.
According to Resolution no. 2682/99 of the National Monetary Council, financial institutionsshould classify loans in increasing order of risk, considering aspects in relation to debtors andtheir guarantors and in relation to the transaction itself. Based on such rule, all Banrisulcustomers’ operations have ratings defined which, added to the minimum rating, determinethe highest risk to the customer. With regard to the provisions, they are monthly made inaccordance with the Resolution, and additional amounts have still being accrued by the Banksince December 2008, in order to cover possible events not captured by the customer ratingmodel.
Banrisul’s management of credit risk exposure is based on the selective and conservativestance of the Bank, following strategies defined by the senior management and technicalareas of the corporation. For all customer segments, analysis of past due, default and creditgrant indicators are performed in various clusters and granularities, enabling managing suchexposures by product, risk classification, concentration of credit and branch. Also, managerialreports of the loan portfolio of the Bank are regularly reported to senior on management formonitoring of allocated volumes and default rates.

40 FINANCIAL STATEMENTSSEPTEMBER 2011
More information about the structure of operational risk management is available at http://www.banrisul.com.br / Investor Relations / Corporate Governance / Risk Management / CreditRisk Management Structure.
Market Risk
Market risk arises due to market fluctuations that may cause losses to the institution. Theseoscillations can occur in the prices of financial assets and liabilities or in determining variablessuch as, among others, interest rates, exchange rates, price indexes.
Banrisul monitors the market risk using statistical methodologies, Value at Risk (VaR) andSensitivity Tests among them, which seek to simulate and determine, with a degree ofreliabi lity, the maximum levels of expected loss over a certain period of time, both in normalmarket conditions and in stress and volatility scenarios.
Market monitoring reports and the daily review of Banrisul’s assets and liabilities portfolios,as well as other operational procedures, allow monitoring, preventing and correcting possibleimbalances, ensuring the soundness of the institution.
Liquidity Risk
Liquidity risk relates to the inability to meet cash requirements, i.e. the occurrence ofmismatches in financial flows between assets and liabilities and the resulting consequenceson the Bank’s ability to raise funds when fulfilling its obligations.
Banrisul jointly monitors liquidity and market risk by observing cash flow projections andpossible changes in its structure resulting from alterations in the macroeconomic scenario,which may affect market funding and allocation.
Concerning to the asset side, different scenarios designed for the evolution of credit portfolioand settlement of financial instruments are considered. Moreover, as to the liabi lities, theassumptions made include the possibility of early redemptions and difficulties in maintainingthe current funding structure.
Operational Risk
The main responsibi lities of the operational risk management group are to identify, assess,monitor, control and mitigate operational risks at Banrisul, including those resulting fromoutsourced services. They group is composed by the Board of Administration and the Board ofExecutive Officers, the Committee for the Management of Internal Controls, Corporate RiskManagement Unit, the Comptroller, the branches and Head Offices areas, and the internalcontrols executive. More information about the structure of operational risk management isavailable at http://www.banrisul.com.br / Investor Relations / Corporate Governance / RiskManagement / Operational Risk Management Structure.
To faci litate the process of staff qualification, the Bank keeps internal communicationinstruments for operational risk available on the Corporate Risks Intranet, by means of forums,

41
newsletters, and media news, and promotes training courses for new employees and to thepreparation of new business managers, supervisors and internal auditors.
For the monitoring and controlling of operational risk processes, periodic cycles of riskassessment are performed and the results of the analysis and mitigation plans submitted tothe approval of the senior management. Additionally, plans are being implemented to improveprocesses, upon diagnosis prepared by PWC - Associated Consultants.
Basel Ratio
The Basel Ratio is the relation between the Base Equity (Reference Equity - RE) and weightedrisks (Required Reference Equity - RRE), according to current regulations, showing thecompany's solvency. The minimum required by the National Monetary Council (CMN) is 11%.CMN also determines that the minimum amount of the Reference Equity must be equal to thesum of the parcels calculated for credit, market and operational risks.
In the 9M11, Banrisul's Group Basel Ratio was 15.51%, above the minimum requirement. Theincrease in relation to September 2010 was caused by improvements on the calculation ofcapital allocation to cover market risk, which reduced such amount from R$329 million toR$196 million, and by the growth of 15% in the RRE.
The credit risk parcel varied due to the increase of the loan book and capital allocation (CircularNo. 3,515/10 from the Central Bank of Brazi l); operational risk parcel increased on account ofrevenue growth in the same period. In relation to the Economic and Financial Conglomerate,impacts on portions of the RRE remained, which required the increasing the Capital AdequacyRatio from 15.83% in September 2010 to 15.91% in September 2011, with a potential growth ofup to R$ 8,584 million in new loans.

42 FINANCIAL STATEMENTSSEPTEMBER 2011
Technological Modernization
Banrisul’s investments in hardware, software andmaintenance of goods totaled R$141 million from Januaryto September 2011. During this period, the Bank has adaptedthe encryption routines and digital certification, conductedmarket research, set security policies and fraud combat,has developed new document generator and contributedto the expansion of community access to technology.
Regarding encryption and digital certification, the Bank hasdesigned new models of generating cryptographic keys aimed at meeting the requirementsof the Safety Program of the card issuers that Banrisul has entered into agreements with.Adjustments were also made in encryption routines that meet the SPB (Brazilian PaymentsSystem), adapting it to the new size of keys and hash algorithm of the SPB certificates, inaccordance with version 3 of the Security Manual of the RSFN - National Financial SystemNetwork.
Looking for speed, ease and safety in servicing customers in person at branches, Banrisulmade market research on innovative TOTEM (the ATM electronic password emitter) solutionsto be used on the branch faci lity. In addition, market analyses were conducted for thepreparation of proposals that will make Banrisul present in social medias, enabling the safeuse of a new channel of customer relationship.
To ensure security, to prevent and combat fraud in Banricompras Network and in all networksthat acquire the brands Banrisul has agreements with, policies were defined, processes andprocedures adopted to conform to the safety standards in payment cards. With a view to thecertification PCI to Banricompras network, a complete mapping of the network was performed.In the Web POS environment, several improvements were implemented, ensuring high safetystandards.
In order to facilitate the maintenance of texts in contracts and documents generated fromautomated systems at Banrisul, the BJP Document Generator system has been developed.With this application, texts are stored in a database from which standard parts can be reusedand conditional functions applied to generate the final text. The new application will allowthat in the medium term the Bank has its contractual templates and documents centralized,standardized, and managed in a single, more reliable environment, giving greater flexibilityand autonomy for end users.
In June 2011, while taking part in the initiative of the Digital Inclusion Plan promoted by theState Government, Banrisul donated 300 computers in the 12th Free Software Forum in PortoAlegre. The computers will be available for projects such as community telecentres.

43
MarketingDuring the first nine months of 2011, Banrisul directed its marketing strategies towards marketsegmentation, in order to expand the potential sale of specific products such as real estateloans, agricultural loans, credit cards, acquiring and insurance. For this, the Bank has changedforms of sales approach, attended events, increased the use of Banricompras card, andnarrowed business relationship with business customers.
The segmentation policy has been targeted to the development of a portfolio of high-incomecustomers. This audience now has personalized service, sales approach and specific products.Credit cards are already being repositioned at Banrisul. Scheduled to be launched in thefourth quarter of 2011, besides the Gold Card already in used, there is the development of thePlatinum Credit Card, whose benefits addressed such niche of customers.
Participating in events has created to Banrisul opportunities for effecting business andattracting new customers. The creation of the Mobile Business Branch, which provides theintegration of corporative systems, has allowed the hiring of closure of operations, the sale ofproducts and services outside of the environment of a formal branch and fostered contactwith customers at the fairs for the settlement of business. This tool will expand the customerbase through personalized, differentiated service with a focus on customer loyalty.
During the 2011 edition of Expointer (Latin America Largest Agricultural Fair), Banrisulreinforced the Programa Mais Alimento (More Food Program), aimed at the family agribusiness,and increased its agricultural credit grant. Participation in the Fair increased in 138% thenumber of business that were settled last year. For the real estate sector, Banrisul took part invarious Real Estate Fairs, in which real estate developers and builders were present, makingavailable credit to individuals and demonstrating how competitive it is when it comes to realestate financing within the conditions set by the Sistema Financeiro de Habitação (SFH -Housing Finance System) and Sistema Hipotecário (SH - Mortgage System).
As an innovative marketing strategy, Banrisul turned in August 2011 its checking account card- Banricompras card - in an International Purchasing Card. Through SafetyPay, a comprehensive,secure online payment system, the customer of the Bank may now acquire products on theAmazon.com website, settling transactions through Banrisul Internet Banking.
In order to expand business with the corporate sector, especially small and mediumenterprises, Banrisul has improved business relationship and met the credit needs ofcompanies. This market action, along with the productive sectors, enables the developmentof and the investment capacity of enterprises. Credit grants are evaluated and risk assessedaccording to customers’ profile and creditworthiness.
The amplitude of Banrisul’s business model is focused on participating in new markets andcapturing customers, with the strategic advantage on customer service, proximity to thecommunities and the offering of segmented products and services, in order to meet theneeds of customers and with a vision on continuity and sustainability.

44 FINANCIAL STATEMENTSSEPTEMBER 2011
Human Resources
Banrisul ended the September 2011 with 9,836 employees and2,199 trainees. By the end of September 2011, 1,366 trainingcourses were performed, with 8,298 attendants. In thesequalification programs, the Bank invested R$10 million, of whichR$380,000 were directed to college programs, R$288,000 to post-graduation programs and R$267,000 to language courses.
To Banrisul, the professional qualification is essential for improving customer service, a processthat is a strategic priority of the institution. By the end of July 2011, 368 agencies were includedin the Programa de Qualificação do Atendimento (PQA - Customer Service Qualification Program– QAP), where 5,400 employees were qualified. Customer Service Training for 5,282 employeesallocated at branches and working at service platforms, back office positions and as tellerswas also available, distributed in 172 classes. The courses were held in different regionalcenters of the Bank and focused aspects related to communication, sales, customers, telephoneservice and personal presentation.
Corporate Responsability
Banrisul works to generate and increase income, alwaysrenewing the commitment to always act as an agent ofsustainable economic development. To ensure that growthin a balanced manner, the Bank promotes activities andprograms, supports sport activities and is committed to thebest social and environmental practices.
Regarding to programs and actions, the Bank encouragesvolunteering activities among its employees. Thepartnership built between Banricoop (Banrisul Employees’Credit Cooperative) and Banrisul Volunteer Program has startedthe digital inclusion project, in which volunteer instructors, allemployees of Banrisul, teach retired senior citizens who wish to be entered in the digitalworld. Volunteers are also teach courses of Portuguese, English, computer science andmathematics, and behavioral disciplines such as ethics, adolescence, drug prevention andenvironmental preservation directed to socially vulnerable youngsters within Projeto PescarBanrisul (Fishing Project), which was awarded in the second half of 2011 the prize of BestEducational Practices from Fundação Projeto Pescar (Fishing Project Foundation) for its courseon Ecological Consciousness of Being.
Support for sport activities has always been encouraged by Banrisul. In recognition of theseactions, the Bank was honored in August 2011 the Sports’ Best Friend in the State of Rio

45
Awards January 2011. Banrisul Brand is featured in world ranking
The value of the brand Banrisul in 2011 reached R$532 million, up 12.5% compared to last year.The outcome is part of a survey prepared by the British consultancy Brand Finance, whichexamined the 500 largest financial institutions in several countries. Banrisul’s goodwill appearsin the 319th position in the ranking Global Banking 500 by Brand.
January 2011. Banrisul is one of the best reputed companies in Rio Grande do Sul.
The Bank was one of the winners of the Corporate Reputation award given by Tomorrowmagazine, which showed Rio Grande do Sul’s most prestigious corporations, as the outcomeof a study by Trojan Brand Consultancy. Banrisul has reached the Prestige of Corporate Brandlevel equivalent to 32.41 points and was presented in all fields covered by the survey:“Confidence and Admiration”, “Innovation Capacity”, “Quality of Products and Services”,“Social and Environmental Responsibility” and “History and Evolution”.
March 2011. Banrisul is highlighted in the study Brands of Who Decides.
Banrisul is highlighted in the study Marks of Who Decides, in the 13th edition of the surveyconducted by Jornal do Comércio and the company Qualidata, as one of the most rememberedbrand in the “Bank” and “Savings Deposits” categories.
April/2011. Banrisul’s shares presented the best performance.
Banrisul’s class B preferred shares (PNB –BRSR6) Banrisul had the best average performanceamong Brazilian banks, according to a survey made by the consulting firm Economática. Theprofitability of Banrisul’s PNB shares reached 41.2% in the last 12 months.
April/2011. Banrisul, one of the largest companies in the world.
Banrisul appears in the new list of the world’s largest two thousand companies published byForbes magazine. The Bank, one of 37 Brazilian companies listed in the ranking, appears inthe 1,438th place. The survey was prepared based on criteria that take into account sales, netincome, assets and market value.
Grande do Sul for its support of the Children in Sport program, in an event in São Paulo. TheMinistry of Sport presented the award Businessman Friend of Sport to entrepreneurs whohave most contributed to sports projects through the Lei de Incentivo ao Esporte (LIE - SportsIncentive Law).
Committed to the social and environmental best practices, Banrisul adds value to its productsand services and try and settle for its customers examples of the importance of respectingand preserving the environment. One of its environmental project is Projeto Sementes Banrisul(Banrisul Seed Project), which distributes agroecological horticultural and native trees seedsadapted to the different biogeography landscape of the State. Since its beginning in 2008,over 20 million seeds and seedlings of native trees were delivered to farmers, schools,associations and cooperatives of ecological farmers, in college lectures in universities, inagroecological fairs and events related to environmental rural area.

46 FINANCIAL STATEMENTSSEPTEMBER 2011
May/2011. Banrisul’s shares listed in Bovespa’s new index.
Banrisul’s shares were included in the Broad Brazi l Index (IBRA), Bovespa’s most recent index.As disclosed by Bovespa, the index includes all shares of the listed companies that meet theminimum criteria of liquidity, such as inclusion in a list whose trade index added represent99% of the total trading and the financial volume recorded, besides participating in no lessthan 95% of trading sessions in the 12 months prior to the calculation of the indicator.
May/2011. Banrisul, one of Brazil’s most valuable brands.
For the first time, Banrisul is part of the “50 most valuable brands in Brazil” ranking and, in thecategory of Banks, is listed as the 4th largest Brazilian financial institution in value. In thisyear’s edition, Banrisul brand reached USD344 million. The survey was prepared by theconsulting firm BrandAnalytics and the magazine Dinheiro.
June/2011. Banrisul among Brazil’s most valuable brands.
The Bank is among the 25 most valuable brands in Brazil. The ranking was elaborated byInterbrand, an American brand consultancy company. Banrisul’s brand value was set at R$501million.
June/2011. Banrisul is the most remembered brand of Rio Grande do Sul in the bank
category.The Bank is listed among the most remembered local brands in the category “Large Companyin Rio Grande do Sul” of Top of Mind 2011 survey, published by the newspaper Tomorrow.With 26.4% of citations, the Company also took the lead among banks in the State, and wasranked first in the item “Electronic Payment Network,” Banricompras especially. Banrisul stoodout as an efficient public company that invests in culture and, in the “Savings Account” and“Credit Card” categories, with the Banricompras. In the same study, Banrisul Serviços won thecategory Meal Voucher.
June/2011. Banrisul receives Government and Society Sustainability Certificate.
The Bank received the Certificate of Sustainability as a function of the 7th SustainableManagement Research. The survey involved 112 medium and large companies that operate inthe southern region of Brazil and are aware of corporate responsibility.
July/2011. Banrisul is one of Brazil’s 100 largest companies.
Banrisul is one of the 100 largest public companies by market value in Brazil, according toranking published by the Exame magazine in its special edition The Largest and the Best of2011. The study pointed that the Bank’s R$6.7 billion market value in 2010 is up 11.5% over theprevious year.Within the domestic financial industry, the Bank is prominent among the ten largest banks inof net income and shareholders’ equity. Among the sector ratios of the financial market, theBank is listed in top positions in demand deposits and savings deposits, branch network,personal loans, real estate loans and wealth created.
July/2011. Projeto Pescar Banrisul is awarded as Best Educational Practice.
Projeto Pescar Banrisul (Banrisul Fishing Project) was awarded Best Practice Educational bythe Fundação Projeto Pescar (Fishing Project Foundation). Banrisul was chosen unanimously

47
among the 22 units that are part of the Regional Porto Alegre, the largest of the 11 regionalcountrywide.The award is granted on account of the course Ecological Consciousness of Being, wherestudents from Projeto Pescar Banrisul create and environmental projects that are subsequentlypresented in public schools in Southern Porto Alegre.
August/2011. Banrisul is recognized as the Sports’ Best Friend.
The Bank won the Sports‘ Best Friend Award in Rio Grande do Sul. The award, sponsored by theMinistry of Sports, recognizes companies that have invested the most in the segment throughthe Lei de Incentivo ao Esporte (LIE - Sports Incentive Law).. The Bank received the award fordeveloping sports projects for children and teenagers, especially the Children in Sports program,in partnership with Sport Club Internacional and Grêmio Foot-Ball Porto Alegrense, the twomost famous soccer teams in the State.
August/2011. Bank is featured in national ranking.
The Bank was featured in the ranking list Valor 1000, edited by the newspaper Valor Econômico.The Bank occupies the 11th position among the 100 largest banks in Brazil. Banrisul was alsolisted among the 20 largest banks in total loans, total deposits, shareholders’ equity and netincome, among other items.
August/2011. Banrisul is among the 500 best companies in the country.
Banrisul is one of the top 500 companies in Brazil according to the ranking As Melhores (TheBest) of Dinheiro, released by the magazine publication IstoÉ Dinheiro from São Paulo. TheBank is in 106th place in the study, which was compiled from questionnaires completed by thecompanies themselves. In banking, Banrisul is highlighted in indicators of financialsustainability, social and environmental responsibi lity and human resources. The institutionalso appears among the largest state owned companies in the country, in the 12th position.
August/2011. Banrisul is featured on the socio-environmental area.
The Bank has earned the merit Outstanding in Government and Society during the 2011Sustainable Management Forum in Florianópolis, by distinguishing itself in the researchSustainable Management published by the Expressão Yearbook, which was drafted based onthe Ethos Indicators and the Balanced Scorecard methodology.
August/2011. Banrisul is awarded the Luiz Henrique Roessler Environmental Merit.
The Bank received the Luiz Henrique Roessler Environmental Merit Award, granted by thejournal Ecology and Environment from Porto Alegre, for its performance in the social andenvironmental area, on account of its Seeds and Recycling programs.
September/2011. Banrisul featured in the ranking of customer satisfaction.
The Bank received the 3rd place in the ranking of standard banks with respect to the level ofcustomer satisfaction, according to the research 2011 Brazil Retail Banking CustomerSatisfaction StudySM, released by JD Power of Brazil.

48 FINANCIAL STATEMENTSSEPTEMBER 2011
Acknowledgments
To offer the best customer service care is paramount for Banrisul. And the good results fromJanuary to September 2011 show that the Bank is on right on track for the target set. Tocustomers, for their incentive to produce more and better, to the staff, for their competenceand dedication, and to all who contribute to make Banrisul increasingly sound, the sincerethanks of the Financial Institution representing the gaucho people.
The Management

49
FinancialStatements

50 FINANCIAL STATEMENTSSEPTEMBER 2011

51
Balance SheetSeptember 30, 2011 and 2010(In Thousands of Reais)
Banrisul Banrisul ConsolidatedASSETS 2011 2010 2011 2010
CURRENT........................................................................ 19,328,346 17,900,459 19,412,830 17,979,713CASH ................................................................................. 481,051 396,334 481,087 396,370INTERBANK INVESTMENTS (Note 04) ........................... 3,037,770 3,804,581 3,056,998 3,822,569
Money Market Investments ..................................... 2,920,180 3,681,978 2,939,408 3,699,966Interbank Deposits ................................................... 117,590 122,603 117,590 122,603
SECURITIES AND DERIVATIVES (Note 05) .................... 3,315,445 3,463,850 3,325,966 3,467,794Own Portfolio .............................................................. 2,412,813 1,341,690 2,423,328 1,345,629Linked to Repurchase Commitments ..................... 902,632 2,099,078 902,632 2,099,078Derivatives .................................................................. - 23,082 - 23,082Privatization Certificates .......................................... - - 6 5
INTERBANK ACCOUNTS .................................................. 2,767,257 2,114,289 2,767,257 2,114,289Payments and Receipts Pending Settlement ....... 208,259 207,024 208,259 207,024Restricted Deposits (Note 06)
Central Bank of Brazil ............................................ 2,524,256 1,881,085 2,524,256 1,881,085Agreements .............................................................. 3,304 - 3,304 -Correspondents ....................................................... 31,438 26,180 31,438 26,180
INTERBRANCH ACCOUNTS ............................................. 56,247 50,429 56,247 50,429Third-party Funds in transit .................................... 5,616 1,900 5,616 1,900Internal Transfers of Funds ..................................... 50,631 48,529 50,631 48,529
LENDING OPERATIONS (Notes 07) ............................... 8,512,485 6,967,177 8,512,485 6,967,177Lending Operations
Public Sector ............................................................ 28,042 41,252 28,042 41,252Private Sector ........................................................... 8,939,667 7,345,034 8,939,667 7,345,034
Allowance for Loan Losses ...................................... (455,224) (419,109) (455,224) (419,109)LEASE OPERATIONS (Note 07) ....................................... 37,256 37,018 37,256 37,018
Lease ReceivablesPublic Sector ............................................................ 856 708 856 708Private Sector ........................................................... 38,850 38,770 38,850 38,770
Allowance for Doubtful Lease Receivables ......... (2,450) (2,460) (2,450) (2,460)OTHER RECEIVABLES (Note 08) ..................................... 1,095,546 1,049,599 1,149,970 1,106,648
Foreign Exchange Portfolio ...................................... 572,400 436,752 572,400 436,752Income Receivable .................................................... 40,140 33,232 37,643 32,233Trading Accounts ........................................................ - - 3,474 3,440Specific Credits ........................................................... - - 22 16Other ............................................................................. 499,938 592,072 555,235 647,167Allowance for Losses on Other Receivables ....... (16,932) (12,457) (18,804) (12,960)
OTHER ASSETS ................................................................. 25,289 17,182 25,564 17,419Temporary Investiments ........................................... - 232 - 232Other Assets ............................................................... 2,041 1,801 2,181 1,943Prepaid Expenses ...................................................... 23,248 15,149 23,383 15,244

52 FINANCIAL STATEMENTSSEPTEMBER 2011
Banrisul Banrisul ConsolidatedASSETS (cont´d) 2011 2010 2011 2010
LONG-TERM ASSETS ....................................................... 16,821,570 13,978,819 16,843,227 13,992,928SECURITIES AND DERIVATIVES (Note 05) .................... 5,816,778 5,006,651 5,822,246 5,009,598
Own Portfolio .............................................................. 4,304,004 3,970,901 4,304,004 3,970,901Linked to Repurchase Commitments ..................... 799,871 251,544 799,871 251,544Derivatives .................................................................. - 136,558 - 136,558Linked to Central Bank of Brazil ............................. 645,126 578,581 645,126 578,581Linked to Guarantees ............................................... 67,777 69,067 73,245 72,014
INTERBANK ACCOUNTS .................................................. 645,742 485,813 645,742 485,813Restricted Deposits (Note 06)
National Housing System ........................................... 645,742 485,813 645,742 485,813LENDING OPERATIONS (Note 07) ................................. 9,311,869 7,632,863 9,311,869 7,632,863
Lending OperationsPublic Sector ............................................................ 90,808 85,593 90,808 85,593Private Sector ........................................................... 9,999,643 8,211,831 9,999,643 8,211,831
Allowance for Loan Losses ...................................... (778,582) (664,561) (778,582) (664,561)LEASING OPERATIONS (Note 07) .................................. 37,721 38,633 37,721 38,633
Lease ReceivablesPublic Sector ............................................................ 2,277 2,229 2,277 2,229Private Sector ........................................................... 41,599 41,478 41,599 41,478
Allowance for Doubtful Lease Receivables ......... (6,155) (5,074) (6,155) (5,074)OTHER RECEIVABLES (Note 08) ..................................... 998,773 805,750 1,014,962 816,912
Foreing Exchange Portfolio ...................................... 27,156 22,764 27,156 22,764Other ............................................................................. 1,019,260 872,059 1,035,449 883,221Allowance for Losses on Other Receivables ....... (47,643) (89,073) (47,643) (89,073)
OTHER ASSETS ................................................................. 10,687 9,109 10,687 9,109Other Assets ............................................................... 22,909 20,142 22,909 20,142Allowance for Valuation .......................................... (12,738) (11,936) (12,738) (11,936)Prepaid Expenses ...................................................... 516 903 516 903
PERMANENT ASSETS ...................................................... 638,518 668,640 298,044 366,707INVESTIMENTS................................................................ 355,959 317,944 7,660 7,759
Investments in Domestic Subsidiaries(Note 02 (c)) .............................................................. 349,153 311,039 - -
Other Investiments ................................................... 11,599 11,888 12,926 13,214Allowance for Losses ................................................ (4,793) (4,983) (5,266) (5,455)
PROPERTY AND EQUIPMENT IN USE (Note 09 (a)) ..... 156,305 164,138 163,170 171,349Real Estate .................................................................. 120,325 121,068 130,586 131,330Other ............................................................................. 490,801 461,271 496,307 466,507Accumulated Depreciation ...................................... (454,821) (418,201) (463,723) (426,488)
INTANGIBLE (Note 09 (b)) ............................................. 126,254 186,558 127,214 187,599Intangible Assets ...................................................... 368,501 360,663 370,384 361,704Accumulated Amortization ...................................... (242,247) (174,105) (243,170) (174,105)
TOTAL ASSETS ................................................................. 36,788,434 32,547,918 36,554,101 32,339,348

53
Banrisul Banrisul ConsolidatedLIABILITIES AND SHAREHOLDERS´ EQUITY 2011 2010 2011 2010
CURRENT........................................................................ 24,083,994 24,053,677 23,847,574 23,939,721DEPOSITS (Note 10) ....................................................... 14,277,663 14,735,857 14,011,030 14,603,711
Demand Deposits ...................................................... 2,558,461 2,114,254 2,555,954 2,108,912Saving Deposits ......................................................... 5,072,399 6,295,708 5,072,399 6,295,708Interbank Deposits ................................................... 11,516 14,652 11,516 14,652Time Deposits ............................................................ 6,634,396 6,309,382 6,370,270 6,182,578Other Deposits ........................................................... 891 1,861 891 1,861
MONEY MARKET FUNDING (Note 10) .......................... 1,702,516 2,350,621 1,634,047 2,285,898Own Portfolio .............................................................. 1,702,516 2,350,621 1,634,047 2,285,898
INTERBANK ACCOUNTS .................................................. 295,036 264,506 295,036 264,506Receipt and Payment Pending Settlement ........... 294,304 264,107 294,304 264,107Correspondents .......................................................... 732 399 732 399
INTERBRANCH ACCOUNT ............................................... 242,608 210,541 242,608 210,541Third-party Funds in Transit .................................... 242,189 210,074 242,189 210,074Internal Trans fers of Funds ..................................... 419 467 419 467
BORROWINGS (Note 11) ............................................... 830,388 572,272 830,388 572,272Foreign Borrowings ................................................... 830,388 572,272 830,388 572,272
DOMESTIC ONLENDINGS - OFFICIAL INSTITUTIONS(Note 12) ...................................................................... 302,631 281,944 302,631 281,944National Treasury ...................................................... 77,980 58,510 77,980 58,510National Economic and Social Development
Bank (BNDES) ........................................................... 103,220 116,793 103,220 116,793Federal Savings and Loan Bank (CEF) .................... 9,342 4,951 9,342 4,951National Equipment Financing Authority
(FINAME) ................................................................... 112,089 101,690 112,089 101,690FOREING ONLENDINGS (Note 12) ............................... 1,684 42,222 1,684 42,222
Foreign Onlendings .................................................. 1,684 42,222 1,684 42,222DERIVATIVES (Note 05 (d)) ........................................... - 19,985 - 19,985
Derivatives .................................................................. - 19,985 - 19,985OTHER PAYABLES (Note 13) ............................................ 6,431,468 5,575,729 6,530,150 5,658,642
Collected Taxes and Other ....................................... 133,366 111,978 133,366 111,978Foreign Exchanges Portfolio .................................... 36,149 42,468 36,149 42,468Social and Statutory .................................................. 100,804 54,347 100,863 55,655Tax and Social Security ............................................. 432,804 311,799 452,164 324,851Trading Account and Intermediation ..................... - - 3,163 3,089Financial and Development Funds ....................... 5,011,739 4,395,584 5,011,739 4,395,584Other ............................................................................. 716,606 659,553 792,706 725,017

54 FINANCIAL STATEMENTSSEPTEMBER 2011
Banrisul Banrisul ConsolidatedLIABILITIES AND SHAREHOLDERS´ EQUITY (cont´d) 2011 2010 2011 2010
LONG-TERM LIABILITIES ................................................. 8,406,295 4,747,857 8,406,800 4,651,484DEPOSITS (Note 10) ....................................................... 6,899,086 3,447,243 6,899,086 3,350,387
Interbank Deposits ................................................... 6,899,086 3,447,243 6,899,086 3,350,387INTERBANK ACCOUNTS (Note 11) ................................. 3,976 3,223 3,976 3,223
Interbank Onlendings ................................................ 3,976 3,223 3,976 3,223BORROWINGS ................................................................. 11,505 - 11,505 -
Foreign Borrowings ................................................... 11,505 - 11,505 -DOMESTIC ONLENDINGS - OFFICIAL INSTITUTIONS
(Note 12) ...................................................................... 832,862 709,678 832,862 709,678National Treasury ...................................................... 9,094 10,807 9,094 10,807National Economic and Social Development
Bank (BNDES) ........................................................... 518,797 470,739 518,797 470,739Federal Savings and Loan Bank (CEF) .................... 43,674 32,833 43,674 32,833National Equipment Financing Authority
(FINAME) ................................................................... 261,297 195,299 261,297 195,299FOREING ONLENDINGS (Note 12) ............................... 32,042 2,540 32,042 2,540
Foreign Onlendings .................................................. 32,042 2,540 32,042 2,540DERIVATIVES (Note 5 (d)) .............................................. - 36,520 - 36,520
Derivatives .................................................................. - 36,520 - 36,520OTHER PAYABLES (Note 13) ............................................ 626,824 548,653 627,329 549,136
Tax and Social Security ............................................. 408,686 388,981 408,686 388,981Other ............................................................................. 218,138 159,672 218,643 160,155
MINORITY INTEREST ...................................................... - - 1,582 1,759SHAREHOLDERS' EQUITY (Note 20) .............................. 4,298,145 3,746,384 4,298,145 3,746,384
Capital ......................................................................... 3,200,000 2,900,000 3,200,000 2,900,000Capital Reserves ........................................................ 4,512 4,511 4,512 4,511Profit Reserves ........................................................... 920,802 691,914 920,802 691,914Assets valuation adjustment (Note 05 (b)) .......... (8,055) (4,870) (8,055) (4,870)Accrued Profits ............................................................ 180,886 154,829 180,886 154,829
TOTAL LIABILITIES AND SHAREHOLDERS' EQUITY .......... 36,788,434 32,547,918 36,554,101 32,339,348

55
September 30, 2011 and 2010(In Thousands of Reais)
Statement of Income
Banrisul Banrisul Consolidated 2011 2010 2011 2010
FINANCIAL INCOME ........................................................ 4,392,626 3,524,970 4,405,258 3,531,439
Loan Operations ............................................................ 3,157,797 2,540,312 3,157,797 2,540,312
Lease Operations .......................................................... 11,660 11,290 11,660 11,290
Securities ........................................................................ 917,829 786,407 930,461 792,876
Foreign Exchange .......................................................... 123,743 46,718 123,743 46,718
Compulsory Investments ............................................. 181,597 140,243 181,597 140,243
FINANCIAL EXPENSES ..................................................... 2,424,136 1,807,681 2,408,038 1,795,226
Funding Operations ..................................................... 1,348,577 1,034,024 1,332,210 1,021,405
Borrowings, Assignments and Onlendings ............. 611,993 380,966 611,993 380,966
Derivatives ..................................................................... - 1095 - 1116
Allowance for Loan Losses (Note 07 (d)) ................. 463,566 391,596 463,835 391,739
GROSS PROFIT FROM FINANCIAL OPERATIONS .............. 1,968,490 1,717,289 1,997,220 1,736,213
OTHER OPERATING INCOME (EXPENSES) ....................... (938,685) (943,710) (950,385) (950,209)
Income from Services Rendered (Note 15) .............. 80,895 74,554 107,008 111,505
Bank Fees Income (Note 16) ....................................... 395,152 356,682 410,362 356,674
Equity in Subsidiaries (Note 02 (c)) ........................... 29,136 21,774 - -
Personnel Expenses ..................................................... (794,802) (682,229) (798,522) (687,531)
Other Administratives Expenses (Note 17) .............. (523,766) (569,814) (533,928) (577,884)
Tax Expenses .................................................................. (165,313) (145,177) (171,259) (150,324)
Other Operating Income (Note 18) ............................ 200,187 129,841 199,810 127,774
Other Operating Expenses (Note 19) ......................... (160,174) (129,341) (163,856) (130,423)
INCOME FROM OPERATIONS .......................................... 1,029,805 773,579 1,046,835 786,004
INCOME BEFORE TAXES ON INCOME AND EMPLOYEE
PROFIT SHARING ......................................................... 1,029,805 773,579 1,046,835 786,004
INCOME TAX AND SOCIAL CONTRIBUTION (Note 22 (a)) (311,555) (228,695) (328,478) (240,994)
EMPLOYEE PROFIT SHARING .......................................... (40,569) (33,500) (40,569) (33,500)
MINORITY INTEREST....................................................... - - (107) (126)
NET INCOME................................................................... 677,681 511,384 677,681 511,384
Number of Outstanding Shares (Thousands) ......... 408,974 408,974 - -
Earning per Thousand Shares (R$) ............................ 1,657,03 1,250,41 - -

56 FINANCIAL STATEMENTSSEPTEMBER 2011
Banrisul Banrisul Consolidated 2011 2010 2011 2010
Adjustes to Net Income..................................................... 1,242,135 1,014,175 1,268,761 1,038,350Net Income ....................................................................... 677,681 511,384 677,681 511,384Adjustment to Net Income:Depreciation and Amortization ................................... 82,970 81,031 83,408 81,572Equity in Subsidiaries .................................................... (29,136) (21,774) - -Dividends Received From Subsidiaires ..................... 5,597 - - -Provision for Loan Losses .............................................. 463,566 391,596 463,835 391,739Reserve for Securitization Losses ............................... (1,323) (3,167) (1,323) (3,167)Reserve for Contingencies ............................................ 93,952 79,595 96,812 80,935Deferred Income Tax and Social Contri bution ......... (51,172) (24,490) (51,652) (24,113)
Changes in Assets and Liabilities ...................................... (254,638) (2,310,119) (280,234) (2,330,544)Valuation adjustment to Equity ................................... (2,606) 977 (2,606) 977Increase (Decrease) in Interbank Deposits .............. 6,824 12,119 6,824 12,119(Increase) Decrease in Securities ............................... (621,793) (1,060,575) (622,466) (1,060,450)Increase (Decrease) in Derivatives............................. - 1,112 - 1,112(Increase) Decrease in Interbank and Interbranch
Accounts ........................................................................ 56,118 (479,385) 56,118 (479,385)(Increase) Decrease in Lending Operations ............. (2,790,253) (3,110,311) (2,790,253) (3,110,311)(Increase) Decrease in Lease Operations................. (2,951) 12,167 (2,951) 12,167(Increase) Decrease in Other Receivables ................ (365,885) (211,477) (375,806) (221,451)(Increase) Decrease in Other Assets .......................... (6,407) 19,329 (6,379) 19,329Increase (Decrease) in Deposits................................. 1,886,968 1,624,681 1,857,111 1,584,353Increase (Decrease) in Money Market Funding ....... 322,470 280,728 322,887 279,401Increase (Decrease) in Borrowing ............................... 381,144 130,199 381,144 130,199Increase (Decrease) in Other Liabilities ................... 881,733 470,317 896,143 501,396
NET CASH USED IN OPERATING ACTIVITIES ...................... 987,497 (1,295,944) 988,527 (1,292,194)
CASH FLOW PROVIDED BY INVESTING ACTIVITIESRestatement of Assets in Subsidiaries ..................... 1 - 1 -Disposal of Investiments .............................................. 1 52 - -Disposal of Property and Equipment in Use............. 124 109 124 109Acquisition of Investiments ......................................... (80) (16) - (1,660)Acquisition of Property and Equipment in Use ........ (26,314) (26,042) (26,442) (29,391)Acquisition of Intangible Assets................................. (7,280) (60,340) (7,280) (61,052)
NET CASH USED IN INVESTMENT ACTIVITIES ................... (33,548) (86,237) (33,597) (91,994)
CASH FLOW FROM FINANCING ACTIVITIESInterest on Capital Paid ................................................ (172,574) (152,620) (172,574) (152,620)Change in Minority Interest .......................................... - - (97) 104
NET CASH USED IN FINANCING ACTIVITIES ...................... (172,574) (152,620) (172,671) (152,516)
NET INCREASE/DECREASE IN CASH AND CASHEQUIVALENTS ................................................................ 781,375 (1,534,801) 782,259 (1,536,704)Cash and Cash Equivalents ........................................... 403,281 411,158 403,321 411,220Interbank Investments (Note 03(n)) ............................ 2,235,788 5,222,087 2,254,128 5,241,952
CASH AND CASH EQUIVALENT AT THE BEGINNING OFTHE PERIOD................................................................... 2,639,069 5,633,245 2,657,449 5,653,172Cash ................................................................................... 481,051 396,334 481,087 396,370Interbank Investments (Note 03(n)) ............................ 2,939,393 3,702,110 2,958,621 3,720,098
CASH AND CASH EQUIVALENT AT THE END OF THEPERIOD .......................................................................... 3,420,444 4,098,444 3,439,708 4,116,468
September 30, 2011 and 2010(In Thousands of Reais)
Cash Flow

57
September 30, 2011 and 2010(In Thousands of Reais)
Statement of Value Added
Banrisul Banrisul Consolidated 2011 2010 2011 2010
INCOME .......................................................................... 4,612,419 3,696,039 4,663,522 3,737,224
Financial Income .......................................................... 4,392,635 3,526,558 4,407,049 3,533,010
Services Rendered and Bank Fees Income ............. 476,047 431,236 517,370 468,179
Allowance for loan losses .......................................... (463,566) (391,596) (463,835) (391,739)
Other ................................................................................ 207,303 129,841 202,938 127,774
FINANCIAL INTERMEDIATION EXPENSES (b) ................... 1,960,570 1,417,650 1,944,203 1,405,031
INPUTS ACQUIRED FROM THIRD PARTIES (c) ................. 568,318 581,022 580,423 590,821
Materials, Energy and other ...................................... 465,302 485,707 473,339 493,478
Third-party Services ...................................................... 103,007 95,292 105,293 97,316
Assets Value Reco very (Loss) ..................................... 9 23 1,791 27
GROSS VALUE ADDED (d=a-b-c) ..................................... 2,083,531 1,697,367 2,138,896 1,741,372
DEPRECIATION AND AMORTIZATION (e) ......................... 82,970 81,031 83,408 81,572
NET VALUE ADDED PRODUCED BY THE BANK (f=d-e) .... 2,000,561 1,616,336 2,055,488 1,659,800
VALUE ADDED RECEIVED IN TRANSFER (g) .................... 29,136 21,774 - -
Equity in Subsidiaries .................................................. 29,136 21,774 - -
VALUE ADDED FOR DISTRIBUTION (h=f+g) .................... 2,029,697 1,638,110 2,055,488 1,659,800
DISTRIBUTION OF VALUE ADDED ................................... 2,029,697 1,638,110 2,055,488 1,659,800
Personnel ..................................................................... 714,057 610,430 717,595 615,494
Salary ............................................................................ 547,165 468,899 549,796 473,107
Benefits ....................................................................... 123,452 105,061 123,975 105,573
F.G.T.S. .......................................................................... 43,440 36,470 43,824 36,814
Tax Fees and contributions ........................................... 598,182 479,171 621,233 496,855
Federal ........................................................................ 570,902 453,963 592,032 469,891
State ............................................................................. 384 335 400 341
Municipality ................................................................ 26,896 24,873 28,801 26,623
Third-party capital compensation ................................ 39,777 37,125 38,872 35,941
Rentals ........................................................................ 39,777 37,125 38,872 35,941
Shareholders' equity compensation ............................. 677,681 511,384 677,788 511,510
Interest on Capital .................................................... 172,574 152,620 172,574 152,620
Dividends .................................................................... 59,596 20,159 59,596 20,159
Retained Earnings ..................................................... 445,511 338,605 445,511 338,605
Minority interest ..................................................... - - 107 126

58 FINANCIAL STATEMENTSSEPTEMBER 2011
Sept
embe
r 30,
201
1 an
d 20
10(I
n Th
ousa
nds
of R
eais
)
Stat
emen
t of C
hang
es in
Sha
reho
lder
s´ E
quity
Ca
pita
l Res
erve
s
Pr
ofit
Rese
rves
Adju
stm
ent o
fCa
pita
lM
embe
r shi
psAs
sets
l C
ertif
icat
esIn
vest
men
tsFo
rFo
rVa
luat
ion
Reat
ined
in
Sto
ck
in S
ubsid
iary
Gra
nts
Lega
l E
stat
utor
yEx
pans
ion
Adju
stm
ent
Earn
ings
TO
TAL
Bala
nce
as o
f Jan
uary
01,
201
0...
......
......
......
......
......
......
2,60
0,00
0 1
,660
4,5
11 1
55,3
69 4
25,0
31 2
27,7
38 (5
,847
) -
3,4
08,4
62
Capi
tal
Incr
ease
(N
ote
20 (
a)) .
......
......
......
......
......
......
.. 3
00,0
00-
- -
(72,
262)
(227
,738
) -
- -
Adju
stm
ent
of M
embe
rshi
ps C
ertif
icat
es in
Sub
sidi
ary
- (1
,660
) -
- -
- -
- (1
,660
)
Adju
stm
ents
for
Eva
luat
ion
Shee
t (N
ote
05(b
))...
......
- -
- -
- -
977
-97
7
Allo
catio
n of
Net
Inc
ome
(Not
e 20
(b)
Net
Inc
ome
......
......
......
......
......
......
......
......
......
......
......
......
- -
- -
- -
- 5
11,3
84 5
11,3
84
Reco
gnit
ion
of R
eser
ves.
......
......
......
......
......
......
......
. -
- -
15,
250
76,
250
92,
276
- (1
83,7
76)
-
Inte
rest
on
Capi
tal .
......
......
......
......
......
......
......
......
....
- -
- -
- -
- (1
52,6
20)
(152
,620
)
Div
iden
ds A
ccru
ed...
......
......
......
......
......
......
......
......
... -
- -
- -
- -
(20
,159
) (2
0,15
9)
Bala
nce
as o
f Sep
tem
ber 3
0, 2
010
......
......
......
......
......
....
2,90
0,00
0 -
4,5
11 1
70,6
19 4
29,0
19 9
2,27
6 (4
,870
) 1
54,8
29 3
,746
,384
Bala
nce
as o
f Jan
uary
01,
201
1...
......
......
......
......
......
......
2,90
0,00
0 -
4,5
11 1
92,4
31 5
38,0
80 2
25,6
66 (5
,449
) -
3,8
55,2
39
Capi
tal
Incr
ease
(N
ote
20 (
a)) .
......
......
......
......
......
......
.. 3
00,0
00-
- -
(74,
334)
(225
,666
) -
- -
Adju
stm
ent
of M
embe
rshi
ps C
ertif
icat
es in
Sub
sidi
ary
- 1
- -
- -
- -
1
Adju
stm
ents
for
Eva
luat
ion
Shee
t (N
ote
05(b
))...
......
- -
- -
- -
(2,6
06)
- (2
,606
)
Net
Inc
ome
......
......
......
......
......
......
......
......
......
......
......
......
- -
- -
- -
- 6
77,6
81 6
77,6
81
Allo
catio
n of
Net
Inc
ome
(Not
e 20
(b)
Reco
gnit
ion
of R
eser
ves.
......
......
......
......
......
......
......
. -
- -
21,
925
109
,624
133
,076
- (2
64,6
25)
-
Inte
rest
on
Capi
tal .
......
......
......
......
......
......
......
......
....
- -
- -
- -
- (1
72,5
74)
(172
,574
)
Div
iden
ds A
ccru
ed...
......
......
......
......
......
......
......
......
... -
- -
- -
- -
(59
,596
) (5
9,59
6)
Bala
nce
as o
f Sep
tem
ber 3
0, 2
011
......
......
......
......
......
....
3,20
0,00
0 1
4,5
11 2
14,3
56 5
73,3
70 1
33,0
76 (8
,055
) 1
80,8
86 4
,298
,145

59
Notes to theFinancial Statements

60 FINANCIAL STATEMENTSSEPTEMBER 2011

61
Notes to the Financial Statements as ofSeptember 30, 2011 and 2010Amounts expressed in thousands of Reais (unless otherwise indicated) and presented asfollows:
NOTE 1 Operations
Banco do Estado do Rio Grande do Sul S.A. (Banrisul) is a multiple-service bank, operatingcommercial, lending, financing and investment, mortgage loan, development, lease andinvestment portfolios, including exchange, securities brokerage, and credit card andconsortium management. Transactions are conducted within the context of a group of financialinstitutions that operate on an integrated basis in the financial market. Banrisul also operatesas an agent for the economic and financial policy of the state of Rio Grande do Sul, in conformitywith the state government’s plans and programs.
NOTE 02 Presentation of the Financial Statements
(a) The individual and consolidated financial statements have been prepared in accordancewith Brazilian accounting practices applicable to financial institutions, and with standardsand instructions from the Central Bank of Brazil and from the Brazilian Securities and ExchangeCommission (CVM), which include accounting practices and estimates concerning therecognition of allowances and determination of assets that comprise its securities portfolio.Actual results could differ from those estimated.
(b) Banrisul’s individual financial statements include operations conducted in Brazil as well asthe incorporation of its foreign branches (New York and Grand Cayman). Assets, liabi lities,income and expenses reported by foreign branches, before consolidation eliminations, aresummarized as follows:
2011 2010
ASSETSLending Operations ............................................................................. 153,772 140,884
Operations in Brazil .......................................................................... 86,728 78,086Other Lending Operations ................................................................. 67,044 62,798
Other Assets....................................................................................... 46,852 40,392Total Assets......................................................................................... 200,624 181,276LIABILITIESDeposits ............................................................................................. 67,776 66,760
Operations in Brazil .......................................................................... 29,461 17,136Other Deposits .................................................................................. 38,315 49,624
Other Liabilities .................................................................................. 4,512 629Shareholders' Equity............................................................................ 128,336 113,887Total Liabi lities and Shareholders' Equity............................................... 200,624 181,276STATEMENT OF INCOME
Financial Intermediation Income ...................................................... 5,228 4,448Financial Intermediation Expenses ................................................... (914) (1,072)Other Expenses, Net ........................................................................... (1,551) (1,562)
Net Income......................................................................................... 2,763 1,814

62 FINANCIAL STATEMENTSSEPTEMBER 2011
The effects of the exchange variation over operations in foreign branches are distributed inthe statement of income according to the nature of corresponding assets and liabilities.
(c) The consolidated financial statements include the accounts of Banrisul, its foreign branchesand subsidiaries whose balance of investments, as of September 30, 2011, amounted toR$349,153 (2010 – R$311,039), and generated equity gains in subsidiaries of R$29,136 for theperiod (2010 – R$21,774), and are presented as follows:
MAIN INFORMATION ON INVESTMENTS IN SUBSIDIARIES:
Banrisul Banrisul S.A. Banrisul S.A. BanrisulArmazéns Corretora de Val. Administradora Serviços
Gerais S.A. Mob. e Câmbio de Consórcios Ltda. TotalThousands of Shares
. Common Shares ............................................. 696 10,000 89,216 - -
. Preferred Shares ........................................... - 19,608 - - -
. Shares ............................................................. - - - 2,780 -Adjusted Ownership Interest (%) ...................... 99,498 98,957 99,683 99,785 -Capital ................................................................... 24,700 58,000 116,000 77,640 -Shareholders’ Equity ........................................... 26,176 73,965 140,028 110,568 -Net Income ........................................................... 1,342 3,289 10,656 14,928 -Net Amounts Eliminated on Consolidation
(Note 25):Assets (Liabilities)
. As of September 30, 2011 ............................ (14) (67,598) (133,344) (139,492) (340,448)
. As of September 30, 2010 ............................ 147 (63,855) (127,611) (107,188) (298,507)Income (Expenses) ...............................................
. As of September 30, 2011 ............................ (1,089) (3,726) (8,351) 2,205 (10,961)
. As of September 30, 2010 ............................ (1,087) (2,546) (6,542) 494 (9,681)Book Value of the Investment
. As of September 30, 2011 ............................ 26,045 73,193 139,584 110,331 349,153
. As of September 30, 2010 ............................ 24,636 66,470 128,937 90,996 311,039Equity in Subsidiaries
. As of September 30, 2011 ............................ 1,326 3,285 10,624 13,901 29,136
. As of September 30, 2010 ............................ 670 6,709 8,464 5,931 21,774
In the preparation of the consolidated financial statements, interests held among consolidatedcompanies were eliminated, as well as intercompany balance sheet and profit and lossaccounts. The portions of income for the half year and net equity referring to noncontrollinginterests are shown separately in the financial statements.
(d) Finance Lease Operations are stated at present value in the Balance Sheet, and relatedincome and expenses, which represent the financial result of said operations, are grouped inLease Operations in the Statement of Income.
NOTE 03 Significant Accounting Practices
(a) Results of operationsIncome and expenses are recorded on the accrual basis.
(b) Interbank InvestmentsThese represent funds invested in the interbank market, stated at present value, calculatedon “pro rata die” basis, according to the variation of both the agreed index and the interestrate.
(c) Securities and DerivativesAccording to Circular no. 3068, issued by the Central Bank of Brazil on November 8, 2001, andsupplementary regulation, these are classified and valued in three specific categories, inconformity with the following accounting criteria:

63
i) Trading Securities – these include securities acquired for purposes of being actively andfrequently traded, measured at fair value, with related gains or losses being recognized inthe statement of income.
ii) Available-for-Sale Securities – these include securities used as part of the strategy tomanage risk of changes in interest rates and may be traded as a result of these changes,changes in payment conditions or other factors. These securities are adjusted to fair value,and income earned is recorded in the statement of income, whereas unrealized gains andlosses from changes in fair value are recorded in a separate shareholders’ equity caption, netof taxes, where applicable, denominated “Valuation Adjustments to Equity” unti l they arerealized through sale.
Gains and losses, when realized, are recorded in the statement of income on the tradingdate, matched with a specific shareholders’ equity account, net of taxes, where applicable.
iii) Held-to-Maturity Securities – these include securities for which Management has theintention and financial capacity to hold to maturity. These securities are stated at cost plusincome earned on a “pro rata temporis” basis. Financial capacity is defined in cash flowprojections, disregarding any possible sale of these securities.
Derivatives – Derivatives acquired together with other investment operations are stated atfair value amounts. income earned and expenses incurred are recorded on the accrual basis,matched with a P&L account.
(d) Loans, Lease Transactions and Other Credit-Like ReceivablesAll loans and lease transactions are classified based on Management’s risk assessment, takinginto account the economic scenario, past experience and specific risks related to operations,debtors and guarantors, pursuant to National Monetary Council (CMN) Resolution no. 2682/99, which requires a periodic analysis of the portfolio and its classification into nine risklevels, from AA to H. A summary of this classification is presented in Note 07.
Loans and lease transactions are recorded at present value, calculated on a daily pro-ratabasis, based on the agreed index and interest rate, and are adjusted to the 60th day past-due.Thereafter, revenue is recognized only when the operations are actually received.
The risk of renegotiated asset operations is classified in accordance with the criteriaestablished by National Monetary Council (CMN) Resolution no. 2682/99, i.e. the ratingassigned before the renegotiation is maintained and renegotiated loans previously written-off against the allowance and controlled in memorandum accounts are rated level H. Anygains on renegotiation are recognized as revenue only when actually received.
(e) Other Receivables – Operations with Credit CardsUnbilled amounts are represented by receivables from cardholders for transactions underVisa and MasterCard banners. These amounts are accounted for as non credit-like Notes andReceivables, and installment payment transactions where Banrisul is the issuer and theoutstanding balance of transactions after minimum payment of the bill is made (Revolvingcredit) are reclassified as Loans.
(f) Allowance for loan losses, for doubtful lease receivables and for losses on other receivablesThis is recorded in an amount considered sufficient to cover possible considering the risklevel classification of the customer based on periodic assessment of credit quality, and notonly on the minimum percentages required by the National Monetary Council (CMN)Resolution no. 2682/99 when a default event occurs.

64 FINANCIAL STATEMENTSSEPTEMBER 2011
As of September 30, 2011, the total amount related to the allowance for loan losses, allowancefor doubtful lease receivables and losses on other receivables, as stated in Note 07, exceedsthe minimum amount required if only the rating of transactions based on the number of pastdue days is considered as set forth by National Monetary Resolution no. 2682/99. Thisprocedure has been adopted by Management since its publication to cover possible eventsnot captured by the credit-scoring model.
(g) Permanent AssetsPermanent assets are stated at acquisition cost, considering the following aspects:
· Investments in subsidiaries are accounted for under the equity method, based on the financialstatements prepared in conformity with the accounting practices adopted by the parentcompany, i.e. the Brazilian accounting practices applicable to financial institutions. Otherinvestments are stated at cost and adjusted for allowances for permanent losses, whenapplicable;
· Depreciation of property and equipment in use under the straight-line method is based onthe expected economic useful lives of assets considering the minimum rates set annually bythe Central Bank of Brazil, and disclosed in Note 09;
· Intangible Assets consist, basically, of investments whose benefits will occur in the future.This group of accounts is represented by bank services contracts and software acquisition.Amortization is calculated under the straight line method at the rates stated in Note 09; and
· Annually, Banrisul reviews intangible assets for impairment losses. When identified, lossesare charged to income.
(h) Assets and Liabilities in Foreign CurrencyThe assets and liabilities of foreign branches, as well as other assets and liabilities arisingfrom foreign currency transactions carried out by Banrisul and its subsidiaries were translatedat the exchange rate prevailing at the balance sheet date.
(i) Deposits, Money Market Funding, Borrowings and Onlendings and Financial andDevelopment FundThese are stated at liability amounts plus charges incurred through the balance sheet date,recognized on a pro rata die basis.
As prescribed by Laws No. 12069/04 and No. 12585/06, issued by the Rio Grande do Sul StateGovernment, up to 85% of the escrow deposits made by third parties at Banrisul should be, ifso requested, made available to the state of Rio Grande do Sul, and the remaining balance isretained at Banrisul for the creation of a fund. Escrow deposits transferred to the Rio Grandedo Sul Government are controlled in a memorandum account and the retained portion isclassified as “Other Payables”, as described in Note 21(a). Expenses on charges on the remainingbalance are recorded under “Expenses with Borrowings, Assignments and Onlendings”.
(j) Contingent Assets and Liabilities and Tax, Labor and Civi l RisksContingent assets, contingent liabilities, and legal obligations are recognized, measured anddisclosed in accordance with the criteria set forth by Resolution no. 3823/09 and TechnicalPronouncement CPC 25, issued by the Brazilian FASB (CPC), recorded based on the legalcounsel’s opinion, using models and criteria which permit obtaining the most adequatemeasurement, despite the uncertainty about their period and the final outcome amount.The criteria used according to the nature of the contingency are as follows:
i) Contingent Assets– Not recognized in the financial statements, except when there isevidence of likely realization, and to which no further appeal can be made.
ii) Contingent Liabilities – Recognized in the financial statements when the risk of losing alawsuit or administrative claim is probable, based on the opinion of management and of legal

65
advisors, with a probable outflow of funds for the settlement of liabilities and when theamounts involved are measurable reliably, as follows:
Reserve for Labor Contingencies – Recognized upon court notification of judicial discussioninvolving Banrisul, the risk of loss of which is deemed as probable. Amounts are determinedaccording to disbursement estimates by Management, timely revised based on informationreceived from our legal counsels, adjusted based on the amount of the deposit related to theexecution, when required.
Reserve for Civil Risks – Recognized upon court notice, and monthly adjusted based on theamount of compensation sought, on the evidence presented, and on the legal counsel’sevaluation – which considers previous court decisions, factual support, evidence produced inthe records and legal decisions that might be rendered in the lawsuit, for the risk of loss onthe lawsuit.
Reserve for Tax and Social Security Contingencies – This refers basically to taxes whoselawfulness or constitutionality is being challenged at administrative or judicial levels andwhose likelihood of loss is – or has been in previous phases – deemed as probable, and isrecognized at the full amount under dispute. For lawsuits with respective escrow deposits,amounts are not updated except when Banrisul is authorized to withdraw the deposits onaccount of a favorable outcome of the lawsuit.
Contingent liabilities assessed as possible losses are reported in the financial statements;those liabilities that cannot be measured reliably and are assessed as remote losses areneither accrued nor disclosed.
(l) Other Current and Noncurrent Assets and LiabilitiesThese are stated at realizable or settlement values, including earnings and charges incurredto the balance sheet date, calculated on a daily “pro rata” basis, and, where applicable, theeffect of adjustments to bring the asset cost to realizable or fair value. Amounts receivableand payable within twelve months are classified as current assets and liabilities, respectively.(m) Income and social contribution taxesSocial contribution tax (CSLL) is calculated at a rate of 15% (9% for non financial companies)and corporate income tax (IRPJ) is calculated at 15% (plus a 10% surtax pursuant to legislation)on taxable profit for the period, adjusted for permanent differences. Deferred income andsocial contribution taxes were calculated based on the rates in force on balance sheet dateover the temporary differences and recorded under Other Receivables, matched with NetIncome for the Period.(n) Post-Employment BenefitsBanrisul offers its employees “defined benefit” and “variable contribution” plans that havebeen valued in compliance with specific legislation. As required by Brazilian AccountingStandard Procedures (NPC) 26, issued by the Brazilian Institute of Independent Auditors(Ibracon), and based on an appraisal report issued by an independent actuary, Banrisul reviewsthe actuarial position of the plan annually, as discussed in Note 23.(o) Cash and Cash EquivalentsFor purposes of the statements of cash flows (as defined in Resolution - CMN 3604/08), cashand cash equivalents correspond to the balances of cash and readily convertible, highly liquidfinancial investments, or with original maturity not exceeding ninety days.

66 FINANCIAL STATEMENTSSEPTEMBER 2011
NOTE 04 Interbank Investments
Banrisul Banrisul Consolidated 2011 2010 2011 2010
Money Market Investments .............................................. 2,920,180 3,681,978 2,939,408 3,699,966Pending Setlement resales - Own Portfolio ..................
Treasury Bills - LFT ......................................................... 2,570,180 3,601,979 2,570,180 3,601,979National Treasury Bills- LTN ........................................ 350,000 50,000 350,000 50,000National Treasury Notes - NTN .................................... - 29,999 - 29,999Other ................................................................................ - - 19,228 17,988
Interbank Deposits ........................................................... 117,590 122,603 117,590 122,603Interbank Deposits (*) .................................................. 117,590 119,005 117,590 119,005
Foreign Currency Investments ....................................... 3,598 3,598Total ................................................................................ 3,037,770 3,804,581 3,056,998 3,822,569
(*) On September 30, 2011, out of the amount of R$117,590 in Interbank Deposits, R$98,377 have maturities of more thanninety days from the date of application.
NOTE 05 Securities and Derivatives
Breakdown of the portfolio of Securities and Derivatives: Banrisul Banrisul Consolidated 2011 2010 2011 2010
Trading Securities .............................................................. 2,251,663 2,017,053 2,253,636 2,018,816Available-for-sale Securities .......................................... 1,764,451 1,666,709 1,772,999 1,668,890Held-to-Maturity Securities ............................................. 5,116,109 4,627,099 5,121,577 4,630,046Derivatives ......................................................................... - 159,640 - 159,640Total ................................................................................ 9,132,223 8,470,501 9,148,212 8,477,392
Current Assets .................................................................. 3,315,445 3,463,850 3,325,966 3,467,794Noncurrent Assets ............................................................ 5,816,778 5,006,651 5,822,246 5,009,598
The fair value presented in the chart below was assessed as follows: actively traded TreasuryBills are determined based on prices published by the ANBIMA; equity shares of publicly-held companies are based on the average last day trade; investment fund shares are dailyupdated by the respective share price informed by the fund administrator; and for securitieswhere no prices are available (mainly Salary Variation Compensation Fund - CVS), Banrisulcalculates their fair value based on the figure derived from adopting an internal pricingmethod.
(a) Trading SecuritiesBreakdown of Trading Securities per Type, at Market Value:
Banrisul Banrisul Consolidated 2011 2010 2011 2010
Tresury Bills - LFT ............................................................................ 2,251,663 2,017,053 2,251,663 2,017,053Shares of Publicly-Held Companies .............................................. - - 1,973 1,763Total .......................................................................................... 2,251,663 2,017,053 2,253,636 2,018,816
Breakdown per maturity: Banrisul Banrisul Consolidated
Updated UpdatedAcquisition Market Acquisition Market
Maturity Cost Value Cost Value
Without maturity ........................................................................... - - 2,248 1,9733 to 12 months ............................................................................... 403,390 403,394 403,390 403,3941 to 3 years ..................................................................................... 1,214,799 1,214,825 1,214,799 1,214,8253 to 5 years ..................................................................................... 95,581 95,591 95,581 95,5915 to 15 years ................................................................................... 537,853 537,853 537,853 537,853Total in 2011 .............................................................................. 2,251,623 2,251,663 2,253,871 2,253,636Total in 2010 .............................................................................. 2,017,006 2,017,053 2,018,769 2,018,816
According to the Central Bank of Brazil regulations, these securities are classified in currentassets at their fair value.
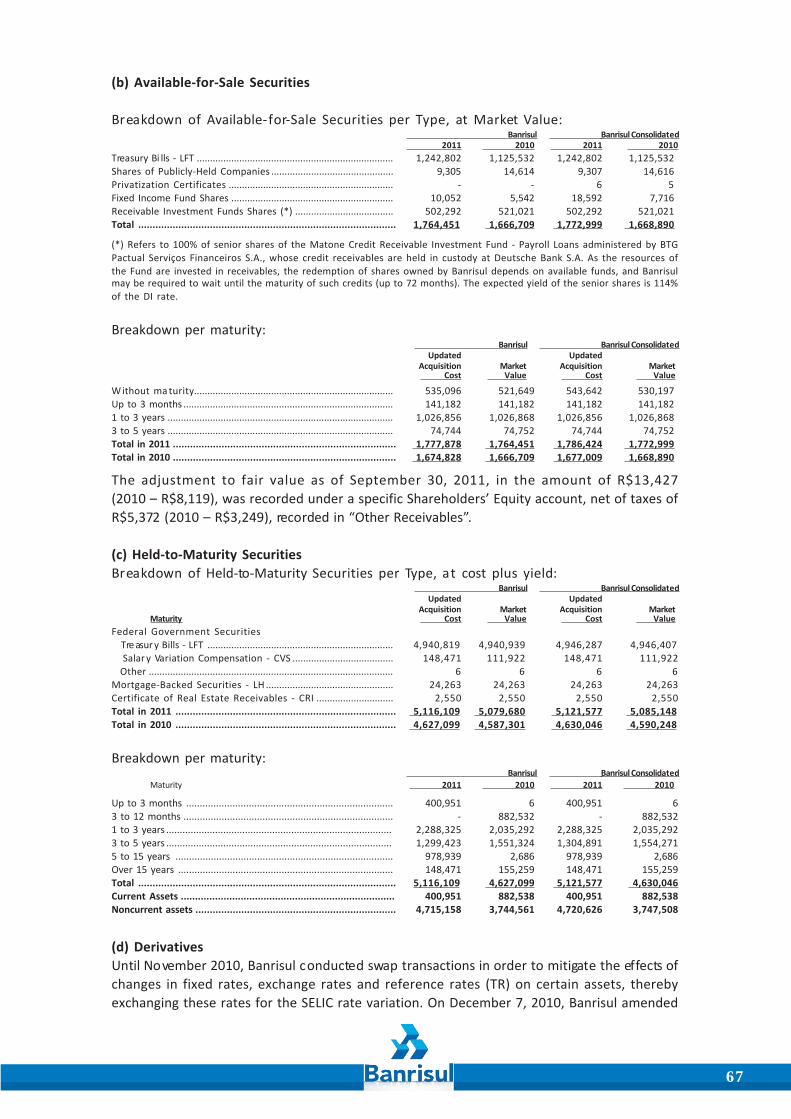
67
(b) Available-for-Sale Securities
Breakdown of Available-for-Sale Securities per Type, at Market Value: Banrisul Banrisul Consolidated 2011 2010 2011 2010
Treasury Bi lls - LFT .......................................................................... 1,242,802 1,125,532 1,242,802 1,125,532Shares of Publicly-Held Companies .............................................. 9,305 14,614 9,307 14,616Privatization Certificates .............................................................. - - 6 5Fixed Income Fund Shares ............................................................. 10,052 5,542 18,592 7,716Receivable Investment Funds Shares (*) ..................................... 502,292 521,021 502,292 521,021Total .......................................................................................... 1,764,451 1,666,709 1,772,999 1,668,890
(*) Refers to 100% of senior shares of the Matone Credit Receivable Investment Fund - Payroll Loans administered by BTGPactual Serviços Financeiros S.A., whose credit receivables are held in custody at Deutsche Bank S.A. As the resources ofthe Fund are invested in receivables, the redemption of shares owned by Banrisul depends on available funds, and Banrisulmay be required to wait until the maturity of such credits (up to 72 months). The expected yield of the senior shares is 114%of the DI rate.
Breakdown per maturity: Banrisul Banrisul Consolidated
Updated UpdatedAcquisition Market Acquisition Market Cost Value Cost Value
Without ma turity........................................................................... 535,096 521,649 543,642 530,197Up to 3 months ............................................................................... 141,182 141,182 141,182 141,1821 to 3 years ..................................................................................... 1,026,856 1,026,868 1,026,856 1,026,8683 to 5 years ..................................................................................... 74,744 74,752 74,744 74,752Total in 2011 .............................................................................. 1,777,878 1,764,451 1,786,424 1,772,999Total in 2010 .............................................................................. 1,674,828 1,666,709 1,677,009 1,668,890
The adjustment to fair value as of September 30, 2011, in the amount of R$13,427(2010 – R$8,119), was recorded under a specific Shareholders’ Equity account, net of taxes ofR$5,372 (2010 – R$3,249), recorded in “Other Receivables”.
(c) Held-to-Maturity SecuritiesBreakdown of Held-to-Maturity Securities per Type, at cost plus yield:
Banrisul Banrisul ConsolidatedUpdated Updated
Acquisition Market Acquisition MarketMaturity Cost Value Cost Value
Federal Government Securities Tre asur y Bills - LFT ...................................................................... 4,940,819 4,940,939 4,946,287 4,946,407 Salar y Variation Compensation - CVS ...................................... 148,471 111,922 148,471 111,922 Other ............................................................................................ 6 6 6 6Mortgage-Backed Securities - LH ................................................ 24,263 24,263 24,263 24,263Certificate of Real Estate Receivables - CRI ............................. 2,550 2,550 2,550 2,550Total in 2011 ............................................................................. 5,116,109 5,079,680 5,121,577 5,085,148Total in 2010 ............................................................................. 4,627,099 4,587,301 4,630,046 4,590,248
Breakdown per maturity: Banrisul Banrisul Consolidated
Maturity 2011 2010 2011 2010
Up to 3 months ............................................................................ 400,951 6 400,951 63 to 12 months ............................................................................. - 882,532 - 882,5321 to 3 years ................................................................................... 2,288,325 2,035,292 2,288,325 2,035,2923 to 5 years ................................................................................... 1,299,423 1,551,324 1,304,891 1,554,2715 to 15 years ................................................................................ 978,939 2,686 978,939 2,686Over 15 years ............................................................................... 148,471 155,259 148,471 155,259Total .......................................................................................... 5,116,109 4,627,099 5,121,577 4,630,046Current Assets ........................................................................... 400,951 882,538 400,951 882,538Noncurrent assets ...................................................................... 4,715,158 3,744,561 4,720,626 3,747,508
(d) DerivativesUntil November 2010, Banrisul conducted swap transactions in order to mitigate the effects ofchanges in fixed rates, exchange rates and reference rates (TR) on certain assets, therebyexchanging these rates for the SELIC rate variation. On December 7, 2010, Banrisul amended

68 FINANCIAL STATEMENTSSEPTEMBER 2011
the assignment agreement entered into with the State of Rio Grande do Sul, whereby itrevoked the rate equalization clauses in the swap contracts, and offset adjustments to bereceived calculated through that base date in the amount of R$102.909 against the fair valueof the Credits with National Housing System – Salary Variation Compensation Fund (FCVS),not affecting Banrisul’s income (loss).
As of September 30, 2010, the amounts were as follows: Banrisul and Banrisul Consolidated
Notional Up to 3 3 to 12 1 to 3 3 to 5 5 to 15 OverValue months months years years years 15 years 2010
AssetsSELIC + Fixed Rate-FCVS 65,555 - - - 9 21,300 4,603 25,912
SELIC + Fixed Rate 88,974 10,788 12,294 24,588 24,588 61,470 - 133,728LiabilitiesTR + Fixed Rate (65,555) (8,504) (10,761) (14,049) (6,835) (10,158) (646) (50,953)USD+BID+Fixed Rate (88,974) - (720) (1,314) (1,163) (2,355) - (5,552)Net Adjustment 2,284 813 9,225 16,599 70,257 3,957 103,135
The counterparty to the above mentioned swap transactions was the Rio Grande do Sul StateGovernment and these transactions were tied to the assignment of FCVS credits and borrowingsfrom municipal governmental entities, with the same maturity dates as the main operations.These swap transactions were designed to adjust the prices of transactions linked to themand, along with these transactions, were subject to rates equivalent to those prevailing in themarket on the same date, since their maturity dates would be concurrent with those of theoriginal transactions and swap contracts not separately negotiated.As of September 30, 2010, the amounts receivable and amounts payable were as follows:
Banrisul and Banrisul Consolidated 2010
DerivativesAdjustments Receivable - Short Term ...................................................................................................... 23,082Adjustments Receivable - Long Term ....................................................................................................... 136,558Adjustments Payable - Short Term ........................................................................................................... (19,985)Adjustments Payable - Long Term ............................................................................................................ (36,520)
Net Adjustment................................................................................................................................... 103,135
As of September 30, 2011, there were no outstanding operations involving derivatives.
NOTE 06 Restricted Deposits Banrisul and Banrisul Consolidated
Description Inerest Rate 2011 2010
Compulsory Deposits - Brazilian Central Bank ............................................................... 2,524,256 1,881,085Demand deposits and other funds ........... None ..................................................... 498,957 447,926Additional liabilities ................................... SELIC ..................................................... 361,138 26,709Savings deposits .......................................... Savings account ................................. 1,006,901 1,190,599Other deposits ............................................. None ..................................................... 41,291 26,398Other deposits ............................................. TR .......................................................... - 189,453Bacen T ime Deposit s .................................. SELIC ..................................................... 615,969 -
Credits with the National Housing System ..................................................................... 645,742 485,813Acquired portfolio ....................................... (*) ......................................................... 443,776 314,655Acquired portfolio ....................................... TR + Interest (**) ................................. 185,680 155,543
Own portfolio .................................................... TR + Interest (**) ................................. 16,286 15,615Correspondents ........................................... None ..................................................... 31,438 26,180
Agreements ...................................................... SELIC ..................................................... 3,304 -
Total ................................................................................................................................ 3,204,740 2,393,078Current Assets ................................................................................................................ 2,558,998 1,907,265Non current Assets ......................................................................................................... 645,742 485,813
(*) Until November 2010, the yield on those credits was linked to a swap contract as detailed in Note 05 (d), resulting ina net yield equivalent to the Selic Rate plus some 1% p.a. on average. Beginning December 2010, the yield is fixed at14.07% p.a.
(**) Refers to credits with FCVS updated according to the payment of funds from which TR + 6.17% for loans from ownresources and TR + 3.12% for credits from FGTS.
69
National Housing System (SFH) - Acquired Portfolio – From October 2002 to March 2005, Banrisulacquired from the Rio Grande do Sul State Government receivables from the Salary VariationCompensation Fund (FCVS). On December 7, 2010, pursuant to the cancellation of theequalization rate clause in swap contracts, as stated in note 05, these assets were priced byadding the amount of R$102,909 to the acquisition cost, thus offsetting adjustments receivableof swap contracts, as described in note 05 (d), with no impact on net income (loss). As ofSeptember 30, 2011, receivables are stated at cost plus income earned through the balancesheet date, in the amount of R$629,456 (2010 – R$470,198). Their face value is R$818,839(2010 – R$779,543). These receivables will be converted into CVS securities, pursuant toratification and novation processes, which have passed the original deadline estimated bymanagement, and the past due amounts are shown separately and restated by the TR ratevariation plus interest. While no maturity date has been defined, the fair values of securities,upon their issue date, could significantly differ from the carrying amounts.
National Housing System (SFH) - Own Portfolio – Refers to FCVS credits arising from Banrisul’sown mortgage loans portfolio that have already been approved by the FCVS’s regulatorybody.
NOTE 07 Loans, Lease Operations and Other Credit-Like Receivables
The tables below show loans, lease and foreign exchange portfolio balances.
(a) Breakdown by Type of Operation and Risk Level: Banrisul and Banrisul Consolidated
A A A B C D E F G H 2011 2010
Loan and Discounted Receivables ........ 1,931,791 7,173,864 2,326,114 1,332,492 430,828 341,255 450,862 75,986 401,320 14,464,512 12,103,142Financing ................................................ 460,664 432,614 286,706 76,584 16,579 18,824 7,048 3,548 26,765 1,329,332 1,125,067Rural and Agro-Industrial Financing .... 220,933 544,774 415,132 199,657 68,416 43,488 34,755 12,157 44,852 1,584,164 1,181,137Real Estate Financing ............................ 492,855 590,800 305,201 115,128 38,385 23,062 22,947 1,717 20,881 1,610,976 1,217,623Infrastructure and Development
Financing .......................................... 19,522 49,654 - - - - - - - 69,176 56,741Total Loans ........................................... 3,125,765 8,791,706 3,333,153 1,723,861 554,208 426,629 515,612 93,408 493,818 19,058,160 15,683,710
Lease Operations ................................... 10,859 21,280 23,169 13,164 5,591 1,967 2,862 185 4,505 83,582 83,185Advances on Foreign Exchange
Contracts (1) ..................................... 10,614 167,938 164,458 101,689 23,826 4,974 3,536 1,027 17,300 495,362 443,158Other Receivables - Foreign
Exchange (2) ...................................... 144 3,039 3,817 1,621 1,455 80 725 5,648 1,046 17,575 27,027Tot al Banrisul in 2011 .......................... 3,147,382 8,983,963 3,524,597 1,840,335 585,080 433,650 522,735 100,268 516,669 19,654,679Tot al Banrisul in 2010 .......................... 5,304,177 5,552,222 2,468,154 1,191,945 231,394 242,785 735,284 82,185 428,934 16,237,080
(1) Advances on foreign exchange contracts are classified as a reduction of “Other payables - Foreign exchange portfolio”(Note 13).
(2) Other Receivables - Foreign exchange include receivables from foreign exchange contracts and receivables fromexport contracts.
(b) Client Breakdown per Maturity and Risk Levels: Banrisul and Banrisul Consolidated
A A A B C D E F G H 2011 2010
Falling due (*) .................................... 3,147,329 8,982,905 3,515,204 1,814,600 563,124 407,393 478,223 68,763 347,268 19,324,809 15,930,216 Up to 180 days ................................ 1,224,758 2,260,712 1,384,476 811,215 249,764 183,547 211,633 26,831 94,561 6,447,497 5,523,985 181 to 360 days ............................... 466,730 1,401,691 644,039 307,738 94,569 71,921 76,454 11,875 53,927 3,128,944 2,418,556 Over 360 days ................................. 1,455,841 5,320,502 1,486,689 695,647 218,791 151,925 190,136 30,057 198,780 9,748,368 7,987,675
Past-due .............................................. 53 1,058 9,393 25,735 21,956 26,257 44,512 31,505 169,401 329,870 306,864 Up to 180 days ................................ 53 1,058 9,393 25,735 21,956 26,204 43,934 31,040 108,800 268,173 211,442 181 to 360 days ............................... - - - - - 53 578 465 46,031 47,127 58,725 Over 360 days ................................. - - - - - - - - 14,570 14,570 36,697
Tot al Banrisul in 2011 .......................... 3,147,382 8,983,963 3,524,597 1,840,335 585,080 433,650 522,735 100,268 516,669 19,654,679Tot al Banrisul in 2010 .......................... 5,304,177 5,552,222 2,468,154 1,191,945 231,394 242,785 735,284 82,185 428,934 16,237,080
(*) Amounts up to 14 days past-due are classified as falling due.
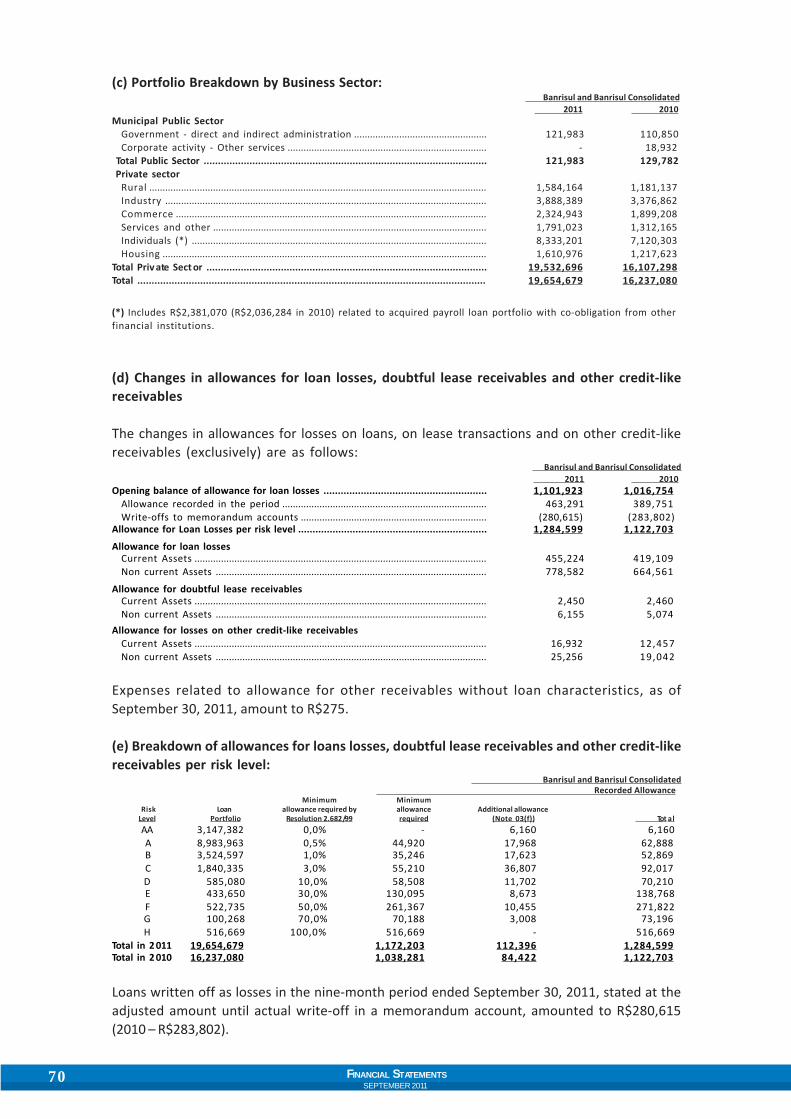
70 FINANCIAL STATEMENTSSEPTEMBER 2011
(c) Portfolio Breakdown by Business Sector: Banrisul and Banrisul Consolidated
2011 2010Municipal Public Sector
Government - direct and indirect administration .................................................. 121,983 110,850Corporate activity - Other services ........................................................................... - 18,932
Total Public Sector ................................................................................................... 121,983 129,782 Private sector
Rural ............................................................................................................................... 1,584,164 1,181,137Industry ......................................................................................................................... 3,888,389 3,376,862Commerce ..................................................................................................................... 2,324,943 1,899,208Services and other ....................................................................................................... 1,791,023 1,312,165Individuals (*) ............................................................................................................... 8,333,201 7,120,303Housing .......................................................................................................................... 1,610,976 1,217,623
Total Priv ate Sect or .................................................................................................. 19,532,696 16,107,298Total .......................................................................................................................... 19,654,679 16,237,080
(*) Includes R$2,381,070 (R$2,036,284 in 2010) related to acquired payroll loan portfolio with co-obligation from otherfinancial institutions.
(d) Changes in allowances for loan losses, doubtful lease receivables and other credit-likereceivables
The changes in allowances for losses on loans, on lease transactions and on other credit-likereceivables (exclusively) are as follows:
Banrisul and Banrisul Consolidated 2011 2010
Opening balance of allowance for loan losses ......................................................... 1,101,923 1,016,754Allowance recorded in the period ............................................................................. 463,291 389,751Write-offs to memorandum accounts ...................................................................... (280,615) (283,802)
Allowance for Loan Losses per risk level .................................................................. 1,284,599 1,122,703
Allowance for loan lossesCurrent Assets .............................................................................................................. 455,224 419,109Non current Assets ...................................................................................................... 778,582 664,561
Allowance for doubtful lease receivablesCurrent Assets .............................................................................................................. 2,450 2,460Non current Assets ...................................................................................................... 6,155 5,074
Allowance for losses on other credit-like receivablesCurrent Assets .............................................................................................................. 16,932 12,457Non current Assets ...................................................................................................... 25,256 19,042
Expenses related to allowance for other receivables without loan characteristics, as ofSeptember 30, 2011, amount to R$275.
(e) Breakdown of allowances for loans losses, doubtful lease receivables and other credit-likereceivables per risk level:
Banrisul and Banrisul Consolidated Recorded Allowance
Minimum MinimumRisk Loan allowance required by allowance Additional allowance
Level Portfolio Resolution 2.682/99 required (Note 03(f)) Tot alAA 3,147,382 0,0% - 6,160 6,160A 8,983,963 0,5% 44,920 17,968 62,888B 3,524,597 1,0% 35,246 17,623 52,869C 1,840,335 3,0% 55,210 36,807 92,017D 585,080 10,0% 58,508 11,702 70,210E 433,650 30,0% 130,095 8,673 138,768F 522,735 50,0% 261,367 10,455 271,822G 100,268 70,0% 70,188 3,008 73,196H 516,669 100,0% 516,669 - 516,669
Total in 2 011 19,654,679 1,172,203 112,396 1,284,599Total in 2 010 16,237,080 1,038,281 84,422 1,122,703
Loans written off as losses in the nine-month period ended September 30, 2011, stated at theadjusted amount until actual write-off in a memorandum account, amounted to R$280,615(2010 – R$283,802).

71
Recoveries of loans previously written off as losses were recognized as income from lendingoperations and amounted to R$89,985 (2010 – R$86.648) in the nine-month period endedSeptember 30, 2011, net of losses generated from these recoveries.
NOTE 08 Other Receivables
Banrisul Banrisul Consolidated 2011 2010 2011 2010
Foreign Exchange Portfolio ............................................................ 599,556 459,516 599,556 459,516 Purchased foreign exchange, pending settlement ..................... 583,750 435,188 583,750 435,188 Advances in foreign currency received ......................................... - (126) (126) Term bills in foreign curr ency ......................................................... 1,403 75 1,403 75 Rights on sale of foreign exchange ................................................ 21,299 39,814 21,299 39,814 Advances in local currency ............................................................. (18,291) (24,910) (18,291) (24,910) Income receivable from advances ................................................ 11,395 9,475 11,395 9,475Income receivable ......................................................................... 40,140 33,232 37,643 32,233 Dividends and bonuses receivable ............................................... 2,497 2,247 - 1,248 Receivables from services rendered ............................................ 37,418 30,687 37,418 30,687 Other .................................................................................................. 225 298 225 298Negotiation and intermediation of amounts ................................. - - 3,474 3,440 Negotiation and intermediation of amounts ............................. - - 3,474 3,440Specific Credits ............................................................................... - - 22 16
Specific Credits ............................................................................... - - 22 16Sundry ............................................................................................. 1,519,198 1,464,131 1,590,684 1,530,388 Advances to Loan Guarantee Fund ............................................... 42,620 62,291 42,620 62,291 Advances to employees .................................................................. 22,353 20,035 22,503 20,118 Advances for payment by our account .......................................... 565 680 6,723 7,151 Deferred income and social contribution taxes (Note 22 (b)) .. 669,855 622,503 674,670 627,693 Escrow deposits (Note 14 (b)) ......................................................... 173,361 162,321 184,793 173,851 Recoverable taxes ............................................................................ 157,468 131,899 167,106 138,756 Reimbursable payments ................................................................ 39,268 82,394 39,296 82,950 Notes and credits receivable(*) .................................................... 244,384 241,045 245,930 241,782 Credit Cards ...................................................................................... 102,048 68,922 102,048 68,922 Other debtors – Domestic ............................................................... 67,276 72,041 104,995 106,874Allowance for losses on other receivables .................................... (64,575) (101,530) (66,447) (102,033)
Credit-like receivables .................................................................. (42,188) (31,499) (42,188) (31,499)Non-credit-like receivables .......................................................... (22,387) (70,031) (24,259) (70,534)
Tot al other receivables ................................................................... 2,094,319 1,855,349 2,164,932 1,923,560
Current assets ................................................................................. 1,095,546 1,049,599 1,149,970 1,106,648Noncurrent assets .......................................................................... 998,773 805,750 1,014,962 816,912
(*) Notes and Credit Receivables mainly comprise:
a) Securities issued to cover court-ordered debts (“precatórios”). In the first quarter of 2005, as part of receivables recoverypolicy, Banrisul received a s payment in kind securities issued to pay court-ordered deb ts from comp anies in the sameEconomic Group. The actual receipt of such securities depends on the outcome of litigation between the Economic Groupand the Government of Brazil and the release of escrow deposits that have been made by the Federal Government as theflow of the original judiciary bonds. As of September 30, 2011, these securities amount to R$93,614 (2010 - R$86,418).These bonds are subject to the variation of the Extended National Consumer Price Index (IPCA-E) and interest.
b) Other non-credit-like receivables from transactions with municipal governmental entities, in the amount of R$88,664(2010 - R$91,763) related to receivables acquired from the State Government of Rio Grande do Sul or its controlled entities,with yield of 1% to 8.5% p.a. plus the TR or IGPM variation, maturing through 2036.

72 FINANCIAL STATEMENTSSEPTEMBER 2011
NOTE 09 Permanent Assets
(a) Property and equipment Banrisul
Net Balance Net BalanceRate Original Cost Depreciation in 2011 in 2010
Property in UseLand and Buildings in Use ............................................ 4 % 120,325 (98,229) 22,096 22,815Other .............................................................................
Furniture and Equipment in inventory ................... - 7,100 - 7,100 12,315Property and Equipment in Progress ..................... - 56 - 56 114Facilities ..................................................................... 10% 91,240 (79,765) 11,475 11,842Furniture and Equipment in Use ............................. 10% 73,452 (52,225) 21,227 20,931Other
Communication System ....................................... 10% 4,433 (3,943) 490 590Data Processing System ....................................... 20% 302,866 (211,630) 91,236 92,606Security System ..................................................... 10% 9,406 (6,968) 2,438 2,606Transport ation System ......................................... 20% 2,248 (2,061) 187 319
Total in 2011 ............................................................... 611,126 (454,821) 156,305Total in 2010 ............................................................... 582,339 (418,201) 164,138
Banrisul ConsolidatedNet Balance Net Balance
Rate Original Cost Depreciation in 2011 in 2010Property in UseLand and Buildings in Use ............................................ 4 % 130,586 (103,134) 27,452 28,388Other .............................................................................
Furniture and Equipment in Inventory ................... - 7,100 - 7,100 12,315Property and Equipment in Progress ..................... - 56 - 56 114Facilities ..................................................................... 10% 92,438 (80,233) 12,205 12,668Furniture and Equipment in Use ............................. 10% 76,903 (55,080) 21,823 21,563Other
Communication System ....................................... 10% 4,434 (3,943) 491 591Data Processing System ....................................... 20% 303,657 (212,277) 91,380 92,735Security System ..................................................... 10% 9,406 (6,968) 2,438 2,605Transport ation System ......................................... 20% 2,313 (2,088) 225 370
Total in 2011 ............................................................... 626,893 (463,723) 163,170Total in 2010 ............................................................... 597,837 (426,488) 171,349
(b) Intangible Assets Banrisul Banrisul Consolidated
Original Net Balance Net Balance Net Balance Net BalanceIntangible Assets Rate Cost Amortization in 2010 in 2009 in 2011 in 2010
Right from Acquisition of Payrolloperations (*)Public Sector ............................................ 20% 298,284 (199,985) 98,299 157,957 98,299 157,957Private Sector ........................................... 20% 27,664 (10,495) 17,169 20,337 17,169 20,337
Software Acquisition ................................... 20% 41,585 (31,148) 10,437 8,200 11,014 8,200Other .............................................................. - 968 (619) 349 64 732 1,105Total in 2011 .............................................. 368,501 (242,247) 126,254 127,214Total in 2010 .............................................. 360,663 (174,105) 186,558 187,599
(*) This refers to agreements entered into with public and private sector entities to ensure the exclusivity in bankingservices for payroll processing and priority offering of payroll loans to employees, bill collection portfolio, supplierpayment and other banking services. Such agreements are effective for five years and are amortized over theagreement period. No indications that these assets are impaired were identified.

73
NOTE 10 Deposits and Money Market Funding
BanrisulWithout Up to 3 to Over
maturity 3 months 12 months 12 months 2011 2010Deposits
Demand deposits(a) ................................ 2,558,461 - - - 2,558,461 2,114,254Savings deposits (a) ................................. 5,072,399 - - - 5,072,399 6,295,708Interbank deposits .................................. - 11,516 - - 11,516 14,652Time deposits (b) ...................................... 7,270 2,170,306 4,456,820 6,899,086 13,533,482 9,756,625Other deposits .......................................... 891 - - - 891 1,861
Total ........................................................... 7,639,021 2,181,822 4,456,820 6,899,086 21,176,749 18,183,100
Current liabilities ...................................... 14,277,663 14,735,857Noncurrent liabilities ................................ 6,899,086 3,447,243
Money market fundingOwn Portfolio ............................................ - 1,702,516 - - 1,702,516 2,350,621
Total ........................................................... - 1,702,516 - - 1,702,516 2,350,621
Banrisul ConsolidatedWithout Up to 3 to Over
maturity 3 months 12 months 12 months 2011 2010Deposits
Demand deposits (a) ............................... 2,555,954 - - - 2,555,954 2,108,912Savings deposits (a) ................................. 5,072,399 - - - 5,072,399 6,295,708Interbank deposits .................................. - 11,516 - - 11,516 14,652Time deposits (b) ...................................... 7,270 1,906,180 4,456,820 6,899,086 13,269,356 9,532,965Other deposits .......................................... 891 - - - 891 1,861
Total ........................................................... 7,636,514 1,917,696 4,456,820 6,899,086 20,910,116 17,954,098
Current liabilities ...................................... 14,011,030 14,603,711Noncurrent liabilities ................................ 6,899,086 3,350,387
Money market fundingOwn Portfolio ............................................ - 1,634,047 - - 1,634,047 2,285,898
Total ........................................................... - 1,634,047 - - 1,634,047 2,285,898
(a) Cla ssified as without maturity since the y can be redeemed immediately.(b) Consider the maturities set for each investment.
Time deposits are made by individuals and companies, with floating or fixed charges equivalentto 86% and 14% of the total portfolio, respectively. The average funding rate for floating-ratedeposits corresponds to 72.73% (2010 – 96.85%) of the CDI variation, and for fixed-rate deposits,to 9.33% (2010 – 8.44%) p.a.
Funding through money market purchase and sale commitments operations – own portfolio–, conducted with financial institutions, has an average funding rate of 100% of the CDI variation.
NOTE 11 Borrowings
Foreign Borrowings: represented by funds obtained from foreign banks to be used in foreignexchange commercial transactions subject to the variation of the corresponding currenciesplus annual interest at rates ranging from 2.0% to 5.5% (2010 – 2.00 % to 7.76%) with maximumterm of 1,826 days (2010 – 1,100 days).

74 FINANCIAL STATEMENTSSEPTEMBER 2011
NOTE 12 Onlendings
Banrisul and Banrisul ConsolidatedDomestic Onlendings
Official Instituitions Foreign Onlendings Total 2011 2010 2011 2010 2011 2010
Up to 90 days ................................................ 101,564 252,579 - 26,318 101,564 278,89791 to 360 days ....................................... 201,067 29,365 1,684 15,904 202,751 45,2691 to 3 years ........................................... 360,390 314,712 31,778 1,814 392,168 316,5263 to 5 years ........................................... 216,226 174,747 264 726 216,490 175,473Over 5 years .......................................... 256,246 220,219 - - 256,246 220,219Total ........................................................... 1,135,493 991,622 33,726 44,762 1,169,219 1,036,384Current liabilities ................................. 302,631 281,944 1,684 42,222 304,315 324,166Noncurrent liabilities ........................... 832,862 709,678 32,042 2,540 864,904 712,218
Internal funds for onlending refer basically to funds from Official Institutions (BNDES – National Bank for Economic andSocial Development, FINAME – National Equipment Financing Authority and Caixa Econômica Federal – Federal Savingsand Loan Bank). These liabilities mature on a monthly basis through September 2028, and are subject to interest of 0.50%to 8.00% (2010 – 0.90% to 8.00%) p.a., plus variation of the indexes (TJLP, U.S. dollar and Curr ency Basket) for floating-rateoperations and up to 11.00% (2010 – 11.00%) p.a. for fixed-rate operations. Funds are transferred to customers on thesame terms and with the same funding rates, plus commission on financial intermediation. These funds are collateralizedby the same guarantees received for the related loans.
NOTE 13 Other Payables Banrisul Banrisul Consolidated 2011 2010 2011 2010
Collected taxes and other ................................................................ 133,366 111,978 133,366 111,978Receipt of federal taxes ................................................................... 133,081 111,710 133,081 111,710Other .................................................................................................... 285 268 285 268
Foreign exchange portfolio .............................................................. 36,149 42,468 36,149 42,468Pending Setlement exchange sold .................................................. 21,670 38,759 21,670 38,759Foreign exchange purchased ........................................................... 509,841 446,867 509,841 446,867Advances on foreign exchange contracts (Note 07 (a)) ............... (495,362) (443,158) (495,362) (443,158)
Social and statutory .......................................................................... 100,804 54,347 100,863 55,655Dividends and bonuses payable ..................................................... 60,236 20,814 60,295 22,122Bonuses and profit sharing payable .............................................. 40,568 33,533 40,568 33,533
Taxes and social security ................................................................... 841,490 700,780 860,850 713,832Taxe s and contributions payable .................................................... 58,400 48,529 59,542 49,500Reserve for income and social contribution taxes ...................... 360,989 252,308 377,725 262,953Reserve for deferred taxes and contributions (Note 22 (b2)) ..... 13,415 10,962 13,416 10,962Reserve for tax contingencies (Note 14 (b)) .................................. 408,686 388,981 410,167 390,417
Trading and intermedia tion of securities ......................................... - - 3,163 3,089Trading and interme diation of securitie s ...................................... - - 3,163 3,089
Financial and development funds .................................................... 5,011,739 4,395,584 5,011,739 4,395,584Payables for financial and development funds (Note 21 (a)) ..... 4,991,570 4,376,184 4,991,570 4,376,184Other .................................................................................................... 20,169 19,400 20,169 19,400
Sundry............................................................................................... 934,744 819,225 1,011,349 885,172Ca shier ’s check .................................................................................. 1,669 1,092 1,669 1,092Creditors for unreleased funds ....................................................... 96,664 48,609 96,884 48,799Payables for acquisition of assets and rights ............................... 2,789 2,121 2,843 2,208Liabilities under government agreements ................................... 25,411 22,944 25,411 22,944Accrued vacation and related charges .......................................... 254,591 207,483 247,082 200,824Actuarial deficit of Fundação Banrisul (Note 23) ......................... 63,961 61,236 63,961 61,236Reserve for labor contingencies (Note 14(b)) ............................... 112,663 109,274 124,354 123,098Brazilian Central Bank fines on foreign exchange
transactions (Note 14 (f)(i)) ......................................................... 119,288 114,229 119,288 114,229Reserve for social security contingencies (Note 14 (f)(ii)) .......... 18,783 18,783 18,783 18,783Reserve for securitization losses (*) .............................................. 3,584 4,262 3,584 4,262Reserve for civil risk (Note 14 (b)) ................................................... 10,445 9,686 10,533 9,686Reserve for debts assumed with Grupo de Empresas
Seguradoras Brasileiras (GESB) arising from CompanhiaUnião de Seguros Gerais .............................................................. 8,028 7,334 8,028 7,334
FGTS (Severance Pay Fund) for amortization ................................ 4,367 3,221 4,367 3,221Sundry creditors – Domestic ........................................................... 74,841 76,481 145,476 134,061Card transactions payable .............................................................. 84,878 57,655 84,878 57,655Other .................................................................................................... 52,782 74,815 54,208 75,740
Total Other Payable s ......................................................................... 7,058,292 6,124,382 7,157,479 6,207,778
Current Liabilities ............................................................................ 6,431,468 5,575,729 6,530,150 5,658,642Noncurrent Liabilities ...................................................................... 626,824 548,653 627,329 549,136
(*) Banrisul management recognizes a pr ovision for co-obligation of securitized receivables with the National Treasury, inthe amount of R$27,649 (2010 – R$42,779), controlled in a memorandum account, which are the responsibility ofagricultural borrowers.

75
NOTE 14 Reserves, Contingent Assets and Liabilities
In the normal course of their activities, Banrisul and its subsidiaries are parties to tax, laborand civil lawsuits at the judicial and administrative levels.
The provisions were calculated based on the opinion of the legal counselors, using the bestmeasurement models and benchmarks available, despite the inherent uncertainty as to theperiod and outcome of the suits. Banrisul records a reserve in the total amounts involved inlawsuits that have been assessed as probable losses.
Management believes that the reserves are sufficient to cover any losses arising from lawsuits.
(a) Contingent AssetsAs of September 30, 2011 no contingent assets were recorded.
(b) Changes in Provisions
Banrisul Tax Labor Civil Other Total
Initial Balance at 12/31/2 010 ....................... 393,470 111,894 9,575 134,164 649,103Recognition and Inflation ............................... 15,216 73,582 1,948 3,907 94,653Reversal of Provision ...................................... - - (767) - (767)Payment ............................................................ - (72,813) (311) - (73,124)Closing Balance a t 09/30/2011 ..................... 408,686 112,663 10,445 138,071 669,865Garanteed Deposits (Note 8) ......................... - 91,602 63,202 18,557 173,361
Banrisul Consolidated Tax Labor Civil Other Total
Initial Balance at 12/31/2 010 ....................... 394,916 123,073 9,575 134,164 661,728Recognition and Inflation ............................... 15,251 76,399 2,036 3,907 97,593Reversal of Provision ...................................... - (80) (767) - (847)Payment ............................................................ - (75,038) (311) - (75,349)Closing Balance a t 09/30/2011 ..................... 410,167 124,354 10,533 138,071 683,125Garanteed Deposits (Note 8) ......................... 1,577 100,036 64,623 18,557 184,793
(c) Tax ProvisionsProvisions for tax contingencies relate primarily to liabilities related to taxes whose legalityor constitutionality is being challenged at the administrative or judicial levels, whoselikelihood of loss is considered as probable and are recognized at the full amount underdispute. For lawsuits collateralized by escrow deposits, the amounts involved are not adjustedfor inflation. When legal permits are issued as a result of a favorable outcome, the amountsare adjusted for inflation and withdrawn.
The main tax contingency refers to income and social contribution taxes on the deduction ofexpenses arising from the settlement of the actuarial deficit of Fundação Banrisul deSeguridade Social (Banrisul Social Security Foundation), challenged by the Federal RevenueService from 1998 to 2005 in the amount of R$408,686 . Banrisul, through its legal counsel, hasbeen discussing the matter in court and, on recorded a reserve for contingencies in the amountof the estimated loss.
There are also some tax contingencies whose likelihood of loss, based on their nature, isconsidered as possible, in the amount of R$ R$40,759 (Consolidated – R$59,084). A reserve forcontingencies was not recognized, in accordance with applicable accounting practices.
(d) Labor ProvisionsThese refer to lawsuits fi led by, mainly, unions and former employees claiming labor rights, inparticular the payment of overtime and other labor rights.

76 FINANCIAL STATEMENTSSEPTEMBER 2011
This account records the provision for labor claims filed against Banrisul when a court notificationis received and the likelihood of loss is considered as probable. The reserve is calculatedaccording to the disbursement estimated by our management, timely reviewed based ondata received from our legal counsel, and adjusted to the escrow deposit when required. Ofthe aforementioned reserve, R$73,686 (consolidated - R$81,351) has been deposited in anescrow account. Additionally, R$17,916 (consolidated - R$18,685) was required for appeals.
There are also some labor claims whose likelihood of loss, based on their nature, is consideredas possible, in the approximate amount of R$47,039 (Consolidated - R$47,740). In labor claimsthat have claims considered probable losses already accrued and there are also applicationsin the same action that are considered as a possible loss in the amount of R$171,743(Consolidated - R$180,174). A reserve for contingencies was not recognized, in accordancewith applicable accounting practices.
(e) Civil ProvisionsLawsuits for damages refer to compensation for property damage and/or pain and suffering,referring to consumer relations, in particular, matters relating to credit cards, consumer credit,checking accounts, banking collection and loans.
This account records the provision for civil suits when a court notification is received, and isadjusted monthly based on the amount claimed, on evidence produced and on the assessmentof the related risk of loss made by the legal counsel, considering case law, factual informationgathered, evidence produced in the records and court decisions on the lawsuit.
There is also an amount of R$93,414 (Consolidated – R$94,245) included in the balance ofescrow deposits related to claims filed by third parties against Banrisul, whose likelihood ofloss is classified by our legal counsel as possible.
(f) Othersi) On September 29, 2000, Banrisul received an assessment notice from the Central Bank ofBrazil in connection with administrative proceedings filed by that authority related to supposedirregularities in foreign exchange transactions between 1987 and 1989. In an appeal decisionat the administrative level, Banrisul was required to pay a fine equivalent to 100% of theamount of the supposedly irregular transactions. This decision is being challenged in court byManagement, which, on a conservative basis and in compliance with BACEN requirements,recorded a reserve in the amount of R$119,288 for this contingency.
ii) INSS tax assessment notice related to social security contribution on compensation otherthan salary and on education allowance, whose likelihood of loss is classified by our legalcounsel as probable. A reserve in the amount of R$18,783 was recorded.
NOTE 15 Income From Services Rendered
Banrisul Banrisul Consolidated 2011 2010 2011 2010
Funds Management .............................................................................. 45,547 42,304 48,138 47,389Collection of Debt Instruments ........................................................... 34,467 31,593 34,467 31,862Income from Group Financing Management Fee ............................. - - 11,149 8,660Income from Brokerage of Operations ............................................... - - 2,820 3,396Other Income .......................................................................................... 881 657 10,434 20,198Total .................................................................................................. 80,895 74,554 107,008 111,505

77
NOTE 16 Income From Bank Fees
Banrisul Banrisul Consolidated 2011 2010 2011 2010
Banricompras ......................................................................................... 73,603 61,611 73,603 61,611Check Returns ........................................................................................ 13,948 13,730 13,948 13,730Checking Account Debits ...................................................................... 17,268 15,976 17,268 15,976Collection Services ................................................................................ 44,407 44,960 44,407 44,960Transactions with Checks ..................................................................... 9,686 10,647 9,686 10,647Bank Fees from Checking Accounts ..................................................... 204,337 178,577 204,337 178,577Credit Card .............................................................................................. 7,008 9,143 7,008 9,143Other Income from Fees ....................................................................... 24,895 22,038 40,105 22,030Tot al .................................................................................................. 395,152 356,682 410,362 356,674
Of a total R$395,152 in income received for the nine-month period ended September 30, 2011,R$191,725 (2010 – R$174,352) arise from operations with individuals and R$203,427(2010 – R$182,330) from operations with legal entities.
NOTE 17 Other Administrative Expenses
Banrisul Banrisul Consolidated 2011 2010 2011 2010
Data Proce ssing and Telecommunication ......................................... 105,269 114,553 109,629 118,032Security and Money Transportation ................................................... 63,055 60,103 63,055 60,103Amortization and Depreciation .......................................................... 82,970 81,031 83,408 81,572Rentals and related fees ...................................................................... 43,622 40,425 42,717 39,241Supplies ................................................................................................... 17,456 19,039 17,490 19,077Outsourced Services ............................................................................. 103,007 95,292 105,293 97,316Advertising, Promotions and Publicity (*) .......................................... 35,343 85,313 35,833 86,177Maintenance and upkeep .................................................................... 16,344 18,666 16,528 18,830Water, Electricity and Gas ................................................................... 13,876 14,552 14,052 14,707Financial System Services .................................................................... 15,833 14,652 16,777 15,352Other ........................................................................................................ 26,991 26,188 29,146 27,477Tot al .................................................................................................. 523,766 569,814 533,928 577,884
(*) Comprises mainly institutional advertising of R$4,549 (2010 - R$34,160) and sponsorship ofsport events and clubs of R$25,898 (2010 - R$43,663).
NOTE 18 Other Operating Income
Banrisul Banrisul Consolidated 2011 2010 2011 2010
Recovery of Charges and Expenses ..................................................... 42,509 36,380 40,307 33,184Reversal of Operating Reserves for:
Labor .................................................................................................... - - 80 -Civil ...................................................................................................... 767 - 767Other .................................................................................................... 32,801 1,791 32,801 1,791Reserve for Securitization Losses .................................................. 1,323 3,167 1,323 3,167
Other Taxes ............................................................................................. - 61 - 61Commission on Capitalization Cerficates ......................................... 3,270 1,379 3,270 1,379Interbank Fees ....................................................................................... 14,784 15,881 14,784 15,881Exchange Rate Adjustment .................................................................. 12,744 - 12,744 -Credit Notes Receivable ....................................................................... 6,264 7,972 6,264 7,972Reserve Fund - Escrow Deposit - Law no, 12069 ............................... 19,156 11,507 19,156 11,507Brokerage and Administration Fee on Insurance ............................ 2,641 2,374 2,641 2,374Other Operating Income ....................................................................... 63,928 49,329 65,673 50,458Tot al .................................................................................................. 200,187 129,841 199,810 127,774

78 FINANCIAL STATEMENTSSEPTEMBER 2011
NOTE 19 Other Operating Expenses
Banrisul Banrisul Consolidated 2011 2010 2011 2010
Discount Granted from Renegotiations ............................................. 7,258 5,081 7,258 5,081Labor Provisions (Note 14 (b)) ............................................................. 73,582 61,115 76,399 62,422Provision for Properties - Assets not in use ...................................... 2,859 3,283 2,859 3,283Provision for Civil Lawsuits (Note 14 (b)) ........................................... 1,948 2,762 2,036 2,764Collection of Federal Taxes .................................................................. 2,721 1,621 2,721 1,621In flation Adjustmen t of Reser ve for Tax Contingencies (Social
Contribution Tax / Income Tax) - (Note 14 (b)) ............................... 15,216 12,592 15,251 12,624Lawsuits Indemnifications .................................................................. 66 5,999 66 5,999Inflation Adjustment of Brazilian Central Bank fines on Foreign
Exchange ............................................................................................. 3,907 3,124 3,907 3,124Inflation Adjustment of Borrowing from Fundação Banrisul ......... 5,330 6,599 5,330 6,599Expenses with Overdraft Accounts and Banricompras Prize
Programs ............................................................................................ - 704 - 704Provision for Debts Assumed with GESB ............................................ 1,350 951 1,350 951Exchange Adjustment - Foreign Branches .......................................... - 3,109 - 3,109Lawsuits .................................................................................................. 11,527 5,435 11,527 5,435Cards ........................................................................................................ 2,579 3,007 2,579 3,007Credit Card Membership Program ...................................................... 3,815 - 3,815 -Other Operating Expenses (*) ............................................................... 28,016 13,957 28,758 13,700Total .................................................................................................. 160,174 129,341 163,856 130,423
NOTE 20 Shareholders’ Equity – Banrisul
(a) CapitalFully subscribed paid-up capital as of September 30, 2011 is R$3,200,000 and it is representedby 408,974 thousand shares without par value as follows:
ON PNA PNB Tot al Amount % Amount % Amount % Amount %
Rio Grande do Sul State ................................. 204,199,859 99.59 2,721,484 75.03 26,086,957 13.02 233,008,300 56.97Fundação Banrisul de Seguridade Social
(pension plan) .......................................... 449,054 0.22 158,983 4.38 - 0.00 608,037 0.15Social Security Institute of Rio Grande do Sul
State .......................................................... 44,934 0.02 168,612 4.65 - 0.00 213,546 0.05Outros ........................................................... 349,527 0.17 578,180 15.94 174,216,887 86.98 175,144,594 42.83Total ............................................................ 205,043,374 100.00 3,627,259 100.00 200,303,844 100.00 408,974,477 100.00
The Extraordinary Shareholders’ Meeting held on April 29, 2011 approved the capital increasethrough the use of revenue reserves in the amount of R$300,000 without the issuance of newshares. This capital increase has been approved by the Central Bank of Brazil.
Preferred shares do not carry voting rights and are entitled to the following payments:
Class A Preferred Shares:i) Priority to receive fixed non-cumulative dividends of six percent (6%) p.a. on the figureresulting from the division of capital by the related number of shares comprising it;
ii) Right to take part, after Class B Common and Preferred Shares have been paid dividendsequal to that paid to those shares, in the distribution of any other cash dividends or bonusespaid out by Banrisul, under the same conditions as Class B Common and Preferred Shares, plusan additional ten percent (10%) over the amount paid to those shares;
iii) Interest in capital increases deriving from the capitalization of reserves, under the sameconditions as Class B Common and Preferred Shares; and

79
iv) Priority in capital reimbursement, without premium.
Class B Preferred Shares:i) Interest in capital increases deriving from the capitalization of reserves, under the sameconditions as Class A Common and Preferred Shares; and
ii) Priority in capital reimbursement, without premium.
(b) Allocation of IncomeNet Income for the year, adjusted in accordance with Law no. 6404/76, shall be allocated asfollows: (i) 5% to the Legal Reserve, not to exceed 20% of total Capital, (ii) 25% to the StatutoryReserve, and (iii) mandatory minimum dividends limited to 25% of adjusted net income. Theremaining net income shall be allocated as decided in the Shareholders´ Meeting.
The Statutory Reserve is intended to ensure funds for investments in information technology,and is limited to 70% of paid-up capital.
The Ordinary and Extraordinary Shareholders’ Meeting held on April 29, 2011 approved theproposed distribution of additional dividends for 2011, equivalent to 15% of Adjusted NetIncome, totaling 40%.
The pay-out policy adopted by Banrisul aims to pay interest on capital for the maximum taxdeductible amount calculated in accordance with prevailing legislation, which is included,net of withholding income tax, in the calculation of mandatory dividends for the fiscal year, asstated in our by-Laws.
As permitted by Law no. 9249/95 and CVM Resolution no. 207/96, Banrisul’s management paidinterest on capital in the amount of R$161,663 referring to the period from January toSeptember 2011 (2010 – R$144,306), to be credited to dividends, net of withholding incometax.
The payment of this interest on capital resulted in a tax benefit for Banrisul in the amount ofR$69,029 (2010 – R$61,048) (Note 22 (a)).
NOTE 21 Commitments, Guarantees and Other
(a) State Law no. 12069 was enacted on April 22, 2004, as amended by Law no. 12585, of August29, 2006, whereby Banrisul must transfer to Rio Grande do Sul State, upon its request, up to85% of the escrow deposits made by third parties at Banrisul (except for those in which thelitigant is a municipality). The remaining amount not transferred is to be recorded in a reservefund to ensure the refund of said escrow deposits. As of September 30, 2011, the amount ofescrow deposits made by third parties at Banrisul, adjusted through the balance sheet dateby the TR (managed prime rate) variation plus interest of 6.17% p.a., totaled R$7,040,904(2010 – R$6,419,184), of which R$2,043,000 (2010 – R$2,043,000) was transferred to the Stateupon its request and written off from the respective balance sheet accounts. The remainingbalance, which makes up the aforementioned fund managed by Banrisul, is recorded in OtherPayables - F inancial and Development Funds (Note 13).
(b) Sureties and guarantees granted to customers amount to R$579,470 (2010 – R$538,738),and are subject to financial charges and backed by the beneficiaries’ sureties.
(c) Banrisul is responsible for the custody of 453,124 thousand securities owned by customers(2010 – 430,441 thousand).

80 FINANCIAL STATEMENTSSEPTEMBER 2011
(d) Banrisul has co-obligations in import credits in the amount of R$78,540 (2010 – R$60,515).
(e) Banrisul manages various funds and portfolios, which have the following net assets:
Banrisul Banrisul Consolidated 2011 2010 2011 2010
Investment funds (*) ........................................................................ 5,110,767 5,368,942 5,110,767 5,385,461Investment funds in investment fund quotas ............................ 117,161 114,167 117,161 255,614Equity Funds ..................................................................................... 82,387 - 82,387Fund to Guarantee the Liquidity of Rio Grande do Sul
State Debt Securities .................................................................. 646,966 980,891 646,966 980,891Managed portfolios ......................................................................... 1,270,736 483,982 1,281,204 499,148Investment Clubs ............................................................................ - - 3,699 855Total ............................................................................................ 7,228,017 6,947,982 7,242,184 7,121,969
(*) The investments fund portfolios consist basically of fixed-rate and variable rate securities, and their carrying amountsalready reflect mark-to-market adjustments at the balance sheet date.
(f) Subsidiary Banrisul S.A. Administradora de Consórcios is responsible for the managementof 126 buyers’ pools (113 in September 2010), including real estate, motorcycles, vehicles andtractors, gathering 24,983 active pool members (21,180 in September 2010).
(g) Banrisul leases properties, manly used for branches, based on standard contracts whichmay be cancelled as its own discretion and include the right to opt for renewal and adjustmentclauses. Total future minimum payments under noncancellable lease agreements as ofSeptember 30, 2011 total R$157,309, of which R$41,307 matures in up to one year, R$101,864from one to five years and R$14,138 over five years. Lease payments recognized as expensesfor the period from January to September 2011 amounted to R$39,777.
NOTE 22 Income and Social Contribution Taxes
(a) Reconciliation of Income and Social Contribution Tax Expenses/Revenue
Banrisul Banrisul Consolidated 2011 2010 2011 2010
Income for the Period before Taxes and Pr ofit Sharing ............. 1,029,805 773,579 1,046,835 786,004Income Tax (IRPJ) - Ra te 25% ........................................................... (257,451) (193,395) (261,709) (196,501)Social Contribution Tax (CSLL) - Rate 9% ....................................... - - (1,274) (956)Social Contribution Tax - Ra te 15% ................................................ (154,471) (116,037) (156,189) (116,307)Total Income and Social Contribution Taxes c alculated at
Effective Rate .......................................................................... (411,922) (309,432) (419,172) (313,764)Adjustment of Fine on Foreign Exchange Operations ................ (1,563) (1,250) (1,563) (1,250)Profit Sharing .................................................................................... 16,228 13,400 16,228 13,400Interest on Capital .......................................................................... 69,029 61,048 69,029 61,048Equity in Subsidiaries and Foreing Exchange Adjustment on
Branches ....................................................................................... 17,857 8,192 6,593 (1,244)Other Additions, Net of Exclusions ................................................ (1,184) (653) 407 816Total Income and Social Contribution Taxe s .............................. (311,555) (228,695) (328,478) (240,994)Current .............................................................................................. (362,727) (244,371) (380,130) (256,690)Deferred ............................................................................................ 51,172 15,676 51,652 15,696
(b) Deferred income and social contribution taxesIn September 2011, Banrisul had deferred income and social contribution tax credits ontemporary differences as follows:

81
(b1) Tax creditsTax credit balances, by origin and disbursements made, are as follows:
BanrisulBalance on Balance on
12/31/2010 Recognition Realization 09/30/2011
Allowance for loan losses .............................................................. 452,612 150,863 102,678 500,797Reserve for labor contingencies ................................................... 44,758 29,433 29,126 45,065Reserve for tax contingencies ....................................................... 76,892 6,179 93 82,978Other temporary provisions .......................................................... 42,664 986 2,612 41,038Tot al tax credit s on temporary diff erences................................ 616,926 187,461 134,509 669,878Unrecorded credits ......................................................................... (23) - - (23)Tot al tax credits recorded .......................................................... 616,903 187,461 134,509 669,855Deferred tax liabilities ................................................................... (11,635) (1,780) - (13,415)Tax credit s, net of deferred liabilities ........................................ 605,268 185,681 134,509 656,440
Banrisul ConsolidatedBalance on Balance on
12/31/2010 Recognition Realization 09/30/2011
Allowance for loan losses .............................................................. 452,612 151,061 102,678 500,995Reserve for tax contingencies ....................................................... 48,559 60,590 60,079 49,070Reserve for tax contingencies ....................................................... 77,384 6,191 93 83,482Other temporary provisions .......................................................... 42,706 1,054 2,614 41,146Tot al tax credit s on temporary diff erences................................ 621,261 218,896 165,464 674,693Unrecorded credits ......................................................................... (23) - - (23)Tot al tax credits recorded .......................................................... 621,238 218,896 165,464 674,670Deferred tax liabilities ................................................................... (11,636) (1,780) - (13,416)Tax credit s, net of deferred liabilities ........................................ 609,602 217,116 165,464 661,254
Expected realization of these receivables is as follows:
Banrisul Banrisul Consolidated Tempor ary Diferences
Year Income Tax Social Contribution Total Total Recorded Total Recorded
2011 79,099 47,460 126,559 126,559 126,8792012 106,404 63,842 170,246 170,246 170,6872013 101,990 61,194 163,184 163,184 163,6232014 70,579 42,347 112,926 112,926 113,3662015 45,173 27,105 72,278 72,278 72,7182016 to 2018 14,350 8,610 22,960 22,960 24,1912019 to 2021 1,064 638 1,702 1,702 3,206After 2021 14 9 23 - -Total at 9/30/2011 418,673 251,205 669,878 669,855 674,670Total at 9/30/2010 389,079 233,447 622,526 622,503 627,693
The total present value of tax credits is R$561,184, calculated based on the expected realizationof temporary differences at average funding rate projected for the corresponding periods.
(b2) Deferred Tax LiabilitiesThe balance of the Reserve for Deferred Taxes and Contributions is represented by:
Banrisul Banrisul Consolidated 2011 2010 2011 2010
Excess Depreciation ........................................................................ (13,407) (10,954) (13,407) (10,954)Available for Sale Securities .......................................................... (8) (8) (8) (8)Adjustment to Fair Value of Trading Securities ........................... - - (1) -Tot al ............................................................................................ (13,415) (10,962) (13,416) (10,962)

82 FINANCIAL STATEMENTSSEPTEMBER 2011
NOTE 23 Fundação Banrisul de Seguridade Social and Cabergs – Caixa deAssistência dos Empregados do Banco do Estado do Rio Grande do Sul
Banrisul is the main sponsor of Fundação Banrisul de Seguridade Social (“Fundação Banrisul”),which is mainly engaged in supplementing the benefits covered and provided by the SocialSecurity to the employees of Banrisul, Banrisul Serviços, and Cabergs, as well as in carryingout social security programs promoted by its sponsors.
On July 6, 2009, new retirement benefit plan Banrisulprev was approved and has been offeredto non members of Benefit Plan I since then. This new variable contribution benefit planbecame effective in November 2009. Following implementation of this new plan, newmembers are no longer allowed to join Benefit Plan I.
To attain its objectives, Fundação Banrisul receives monthly contributions from its sponsorsand participants, which are calculated based on the monthly compensation of employees andtheir beneficiaries. Banrisul’s contributions for the period amounted to R$9,511 (2010 -R$9,192), which, as of September 30, 2011, corresponds to 3.17% (2010 – 3.51%) of employees’monthly contribution salaries, and were recorded as operating expenses.
Benefit Plan I - Benefit Plan I provides defined benefits in the form of retirement andsurvivorship benefits, sick pay, inmate pension, funeral allowance and annual bonus.
The active participant ’s regular contributions correspond to monthly amounts equivalent tothe result of applying the following rates:
a) An overall fixed rate of 3% applicable to the contribution salary;
b) A first additional rate of 2% applicable to the contribution salary surplus (if any) on half ofthe highest Social Security benefit salary; and
c) A second additional rate of 7% applicable to the contribution salary surplus (if any) on thehighest Social Security benefit salary.
Banrisul’s remaining portion of the contracted debt related to this plan in the amount ofR$63,961 as of September 30, 2011 (2010 – R$61,236) is recorded in Other Payables (Note 13).In addition to this debt, Banrisul pays interest of 6% per year with final maturity in 2028, whichis monthly adjusted based on the General Price Index – Domestic Availability (IGP-DI).
Banrisulprev - Banrisulprev provides variable contribution benefits with defined contributioncharacteristics, such as regular retirement, early retirement and funeral allowance, and benefitswith defined benefit characteristics, such as disability retirement, proportional benefits, sickpays, annual bonus, minimum benefit and survivorship benefit.
The participant’s regular contributions comprise three portions:
a) Basic portion: 1% of the contribution salary;
b) Additional portion: may vary from 1% to 7.5% of the contribution salary in excess of 9reference units; and
c) Variable portion: percentage applied on the contribution salary annually established by theactuary to cover 50% of the costs of risk benefits and the plan’s administrative expenses.
In addition to regular contributions, a participant may opt to make monthly contributions notlower than 1 reference unit and not matched by the sponsor.
Banrisul’s contributions match the participants’ regular contributions.
Medical and dental care - Banrisul offers medical and dental care benefits to its activeemployees and Fundação Banrisul’s retirees through Cabergs.

83
As of December 31, 2010, the actuarial appraisal of post-employment benefits related todefined benefits, Banrisulprev and health care granted to its employees was as follows:
Benefit Banrisulprev Medical and Plan I Plan Dental Care Total
Present obligation of actuarial obligations ................................................ (2,787,358) (2,696) (129,621) (2,919,675)Fair value of Fundação Banrisul’s assets ................................................... 2,636,530 1,977 110,322 2,748,829Gains /Losses and cost of unrecognized services ...................................... 508,241 672 28,707 537,620Actuarial assets (liabilities) ................................................................... 357,413 (47) 9,408 366,774
The main actuarial assumptions used as December 31, 2010 are as follows:
Discount rate: 10.77% p.a.Expected return rate of pension plans’ assets:
Defined benefit plan: 13.28% p.a.Variable contribution plan: 12.01% p.a.Medical and dental care: 10.69% p.a.
Future salary increase rate: 6.59% p.a.Increase in medical costs: 7.64% p.a.Inflation: 4.50% p.a.Mortality table: AT – 2000.
NOTE 24 Financial Instruments and Financial Risks Management
Risk management is an essential strategic tool for Banrisul. The inherent risks range fromthose easily identifiable, such as market, liquidity and credit risks, to those which are notdirectly identified as such, but also extremely important, such as operating and reputationalrisk, among others.
Banrisul seeks to align its activities with the standards set forth by the New Capital Accord -Basel II, by adopting best market practices to maximize profitability and to ensure the bestpossible combination of investments in assets and use of required capital. The systematicimprovement of risk policies, internal control systems and security standards aligned withBanrisul’s strategic and market objectives are ongoing processes within this structure.
Credit risk: it is the possibility of Banrisul incurring losses related to the nonperformance ofa loan or financial obligation by the counterparty under the agreed terms.
Banrisul’s risk assessment structure is based on the principle of joint technical decision.Banrisul defines different credit limits corresponding to the decision levels, from thewidespread branch network (with various categories) to the credit and risk committees atthe Head Office. This process aims at expediting the concession of credit based on technicallypredefined limits, which establish Banrisul’s risk exposure for every customer, in conformitywith the risk/return ratio.
The continuous, increasing use of statistical methodologies for assessing customers’ risks,with the standardization of credit and business policies along with the optimization of thecontrols over registry information through a certification model, increased and strengthenedrisk assessments. The use of credit score and behavior score systems allowed establishingreapproved credit limits to individuals according to the risk ratings described in the statisticalmodels, conceptually considered more appealing when dealing with mass credit.

84 FINANCIAL STATEMENTSSEPTEMBER 2011
For the corporate segment, Banrisul evaluates companies from the financial, management,market and production standpoint, with periodic reviews that also take into account currentand future economic and competitive environments, adding companies to them. Themanagement of the credit risk exposure is based on a selective, conservative approach,pursuant the strategies set by Banrisul’s management and technical areas.
(a) Credit Risk AssessmentDirect Lending and Onlendings by Financial Agents - Banrisul assesses the potential default ofeach counterparty by using credit rating tools designed for different categories ofcounterparties. Such internally developed tools, which combine statistical analyses and theopinion of the credit area staff, are validated, when appropriate, by comparing externalavai lable data. The rating tools are reviewed and updated when necessary. Frequently,Management validates the rating performance and its ability to forecast to default events.
Default exposure is based on the amounts that may be owed to Banrisul at the time of default,e.g. in the case of a loan, it corresponds to the nominal value. Loan commitments include allamounts withdrawn in excess of the amount that may be withdrawn at the time of default, ifany.
Default loss or loss extent represents Banrisul’s expectation regarding the amount of the lossresulting from a dispute, should the default occur. This amount is expressed as a percentageloss per unit of exposure and typically varies in accordance with the category of thecounterparty, the type and level of the suit and the availability of collaterals or credit mitigationinstruments.
(b) Risk Limit Control and Mitigation PoliciesBanrisul manages, limits and controls credit risk concentrations whenever they are identified- particularly in relation to counterparties and groups.
Management manages assumed risk levels by setting limits to the extent of acceptable risk inrelation to a specific borrower, or groups of borrowers and industry segments. These risks arecontinuously monitored and subject to annual or more frequent reviews when necessary. Thelimits on the level of credit risk by product and industry sector are approved by the ExecutiveBoard and by the Board of Directors, if applicable.
In the case of a counterparty, the exposure to any borrower, including financial agents, isadditionally restricted by sublimits that cover exposures, whether recorded or not, in thefinancial statements. The actual exposures are monitored on a monthly basis in accordancewith the established limits.The credit risk exposure is also managed through the regular analysis of actual or potentialborrowers, with respect to payments of principal and interest and change in limits whenappropriate.
c) Credit Related CommitmentsCredit related commitments represent unused portions of established limits by thecounterparty, normally attributed to working capital, overdraft accounts, credit cards, amongothers. They also refer to contracts whose funds will be released upon fulfillment of anycontractual condition, pursuant to the construction schedule, such as in some real estateagreements.
The contractual amount represents the maximum credit risk in such transactions, if thecounterparty actually uses the fund available. However, the exposure to losses resulting fromthese contracts is lower than the total funds to be released, since part of these commitments
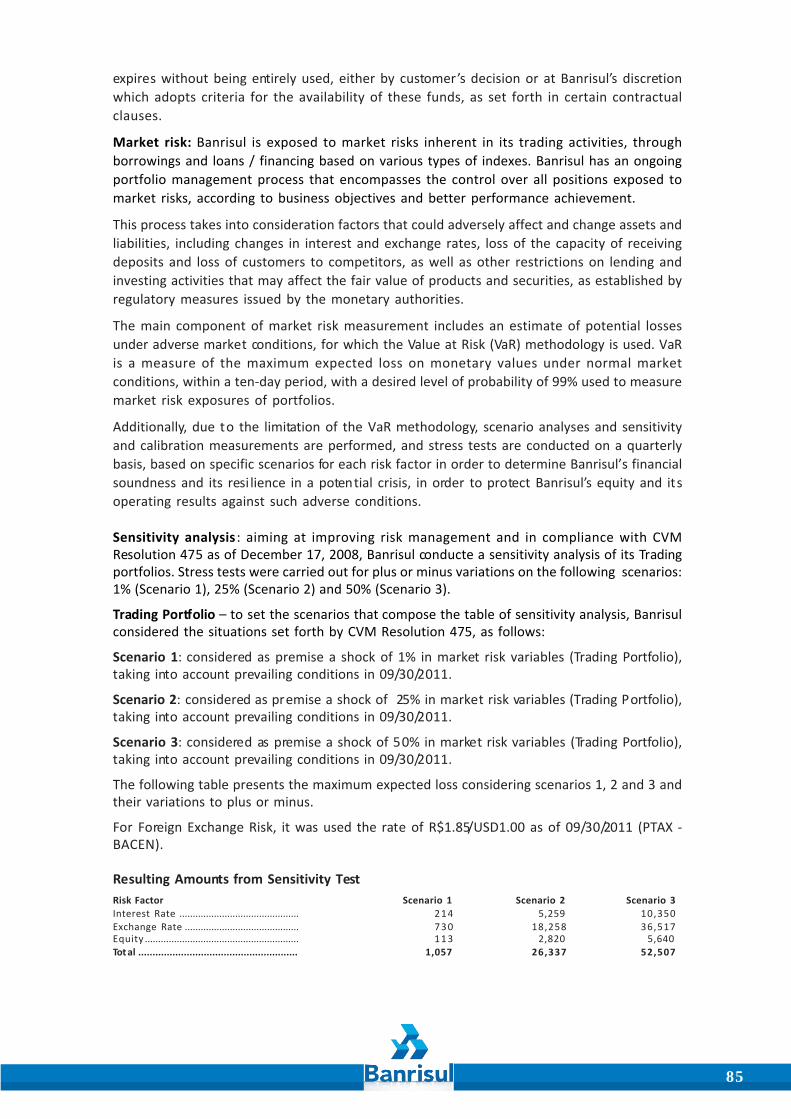
85
expires without being entirely used, either by customer’s decision or at Banrisul’s discretionwhich adopts criteria for the availability of these funds, as set forth in certain contractualclauses.
Market risk: Banrisul is exposed to market risks inherent in its trading activities, throughborrowings and loans / financing based on various types of indexes. Banrisul has an ongoingportfolio management process that encompasses the control over all positions exposed tomarket risks, according to business objectives and better performance achievement.
This process takes into consideration factors that could adversely affect and change assets andliabilities, including changes in interest and exchange rates, loss of the capacity of receivingdeposits and loss of customers to competitors, as well as other restrictions on lending andinvesting activities that may affect the fair value of products and securities, as established byregulatory measures issued by the monetary authorities.
The main component of market risk measurement includes an estimate of potential lossesunder adverse market conditions, for which the Value at Risk (VaR) methodology is used. VaRis a measure of the maximum expected loss on monetary values under normal marketconditions, within a ten-day period, with a desired level of probability of 99% used to measuremarket risk exposures of portfolios.
Additionally, due to the limitation of the VaR methodology, scenario analyses and sensitivityand calibration measurements are performed, and stress tests are conducted on a quarterlybasis, based on specific scenarios for each risk factor in order to determine Banrisul’s financialsoundness and its resi lience in a potential crisis, in order to protect Banrisul’s equity and itsoperating results against such adverse conditions.
Sensitivity analysis : aiming at improving risk management and in compliance with CVMResolution 475 as of December 17, 2008, Banrisul conducte a sensitivity analysis of its Tradingportfolios. Stress tests were carried out for plus or minus variations on the following scenarios:1% (Scenario 1), 25% (Scenario 2) and 50% (Scenario 3).
Trading Portfolio – to set the scenarios that compose the table of sensitivity analysis, Banrisulconsidered the situations set forth by CVM Resolution 475, as follows:
Scenario 1: considered as premise a shock of 1% in market risk variables (Trading Portfolio),taking into account prevailing conditions in 09/30/2011.
Scenario 2: considered as premise a shock of 25% in market risk variables (Trading Portfolio),taking into account prevailing conditions in 09/30/2011.
Scenario 3: considered as premise a shock of 50% in market risk variables (Trading Portfolio),taking into account prevailing conditions in 09/30/2011.
The following table presents the maximum expected loss considering scenarios 1, 2 and 3 andtheir variations to plus or minus.
For Foreign Exchange Risk, it was used the rate of R$1.85/USD1.00 as of 09/30/2011 (PTAX -BACEN).
Resulting Amounts from Sensitivity TestRisk Factor Scenario 1 Scenario 2 Scenario 3Interest Rate ............................................. 2 1 4 5,259 10,350Exchange Rate ........................................... 7 3 0 18,258 36,517Equity .......................................................... 1 1 3 2,820 5,640Tot al ........................................................ 1,057 26,337 52,507

86 FINANCIAL STATEMENTSSEPTEMBER 2011
Definitions:
Interest Rate - Exposures subject to variations in interest rates and fixed-coupon interestrates.
Exchange Rate - Exposures subject to currency fluctuations.
Equity - Exposures subject to the variation of stock prices.
The analysis of the output identifies in the Foreign Currency risk factor the greatest expectedloss, which represents approximately 70% of the expected loss for the three scenarios. FromScenario 1 to Scenario 2, an increase of 96% on the highest expected loss was observed giventhe total exposure to all risk factors. From Scenario 2 to Scenario 3, the variation is 50%. Thehighest expected loss in these sensitivity analysis scenarios occurs in Scenario 3 (50%), in theamount of R$ 52,507.
Liquidity risk: arises from the potential inability to finance financial assets and to meet therequired obligations on the respective maturity dates and from difficulties to settle positionsin the portfolio without incurring significant losses. Banrisul’s liquidity risk is managed byanalyzing cash flows projections, based on different market scenarios. For asset positions, thegrowth of the credit portfolio and the settlement of financial instruments are taken intoaccount. For liabilities, the assumptions adopted include the possibility of making earlyredemptions and also lower-than-expected funding rollover.
The Corporate Risk Unit is responsible for the consolidated management of Banrisul’s liquidityrisk, in order to monitor the availability of funds to meet Banrisul’s financial needs from thepoint of view of funding and allocation, business and performance and business references,to avoid significant mismatches which could jeopardize the Bank’s liquidity and budgetplanning. Banrisul’s controls are kept on a preventive standpoint, calculated according to therules of Resolution no. 2804/00 and Circular no. 3393/07, that establish monitoring consistentwith the positions assumed in financial markets, in order to emphasize the liquidity risk arisingfrom such exposures. Daily Cash Flow, Portfolio Position Map, Maturity and Currency MismatchMap and Duration Maps, among other reports, are prepared to assist with the monitoring ofthese positions. This information is made available on a daily basis to the CFO and to theMarket Risk Officer.
The Market and Liquidity Risk Report is monthly prepared, including the main events duringthe period to highlight the Bank’s current guidelines and policies and ensure compliance withexposure limits for market and liquidity risks, with the approval from the Banking Managementand Economic Committees, the Executive Board and the Board of Directors.
Derivatives: Banrisul has not entered into “target forward swap” transactions or any otherleveraged derivative since its policies do not provide for non-hedging transactions for itsassets and liability positions.
On December 7, 2010, Banrisul amended its contracts, thus canceling its positions in derivatives– swap transactions – in effect as of September 30, 2010, as described in note 05.
Sensitivity analysis: Banrisul has no derivatives transactions in its portfolio as of September30, 2011, therefore the sensitivity analysis table is not disclosed herein.
(d) Basel RatioThe Basel Ratio represents the ratio between the Shareholders’ Equity – Reference Equity, orPR -, and the risk weighted assets - Required Reference Equity - PRE, according to currentlegislation, demonstrating the Bank’s solvency. The minimum percentage established by theNational Monetary Council - CMN - is 11%. CMN also determines that the minimum value ofthe Reference Equity must be equal to the sum of credit, market and operating risk amounts.The Bank is in compliance with that operational limit as of 30 September 2011.

87
Banrisul Consolidated 2011
Reference Equity Level I .......................................................................................... 4,297,659Shareholders' Equity ................................................................................................... 4,118,724Receivable Income Accounts .................................................................................... 1,959,389Payable Income Accounts .......................................................................................... 1,778,386Deferred Permanent Assets ...................................................................................... 10,124Adjustmen t to Fair Value - Securities and Derivatives .......................................... (8,056)
Reference Equity Level II ......................................................................................... (8,056)Adjustmen t to Fair Value - Securities and Derivatives .......................................... (8,056)
Reference Equity (PR) ............................................................................................... 4,289,603Required Reference Equity (PRE) ............................................................................. 2,965,833
Amount related to:Credit Risks (PEPR) .................................................................................................. 2,347,349Marke t Risks (PJUR) ................................................................................................ 196,471Share Prices Risks (PACS) ....................................................................................... 1,805Operating Riss (POPR) ............................................................................................ 420,208
Portion of Trading P orfolio Risks (RBAN) ................................................................... 379,385Margin Value or insufficiency (PR-PRE-RBAN) .......................................................... 944,385Basel Ratio (Risk Factor/PRE) ......................................................................................... 15.91%Permanent Assets Ratio ................................................................................................. 4.27%
Permanent Assets Margin .......................................................................................... 1,961,376
NOTE 25 Transactions With Related Parties
Banrisul’s commercial relations with the Rio Grande do Sul State Government and itssubsidiaries, Companhia Estadual de Energia Elétrica (CEEE), Companhia Rio-Grandense deSaneamento (CORSAN), Companhia de Gás do Rio Grande do Sul (SULGÁS), Centrais deAbastecimento do Rio Grande do Sul S.A. (CEASA), Companhia Estadual de Silos e Armazéns(CESA), Companhia Rio-Grandense de Artes Gráficas (CORAG), Companhia Rio-Grandense deMineração (CRM), Companhia de Indústrias Eletroquímicas – CIEL, Companhia deProcessamento de Dados do Estado do Rio Grande do Sul (PROCERGS) and Caixa Estadual S.A.– Agência de Fomento/RS are described below:
Rio Grande do Sul State Government - On June 29, 2007, Cooperation Agreement no. 1959/2007 was entered into between Banrisul and Rio Grande do Sul State Government, underwhich Banrisul will provide to the Government, on an exclusive basis and for a five-yearperiod, banking services related to the payment of active and inactive servants, lifetime andspecial pensioners of the Executive Branch (Direct Administration), and pension planpensioners (Social Security of the Rio Grande do Sul State – IPERGS) and the Governmentmaintains Banrisul’s right to offer payroll loans. In view of the reciprocity of services provided,under this Agreement Banrisul releases the Rio Grande do Sul State Government from costsrelated to the provision of banking services, such as the collection of revenue and state taxes,debt to bank account, FGTS (severance pay fund) statement and mortgage loan collectionservices.
Banrisul also provides services related to the financial transfers made by the governmentdepartments of amounts related to social programs and updates information related to inactiveservants and holders of special or lifetime pension plans of the Direct Administration. Theseservices are not paid.
Banrisul also pays the suppliers of the Public Finance System and processes changes relatedto the Cash Management Integrated System (SIAC), which is responsible for centralizing inone bank account the cash and cash equivalents of the Direct and Indirect State Administrationand its subsidiaries. These services are not paid.

88 FINANCIAL STATEMENTSSEPTEMBER 2011
Banrisul provides other services to foundations and government agencies, such as paymentservices through payment forms and the supply of meal and fuel vouchers. For the periodended in September 30, 2011, these services generated fees in the amount of R$10,619.Banrisul offers a solution for the management of e-commerce through the Online AuctionPortal (Portal de Compras Pregão On Line). This service is not paid.
Banrisul purchased FCVS credit rights, as described in note 06. At September 30, 2011, thesecredits are stated at acquisition cost plus income earned to the balance sheet date, in theamount of R$629,456. These credit rights were originally purchased at a discount andsimultaneously hedged through an exchange rate swap contract to the Selic index variation.On December 7, 2010, in order to simplify the structure of such transaction and the cash flowsgenerated at the settlement dates, the parties amended the contract, as defined in note 05.The changes did not affect Banrisul’s net income for the year.
For the nine-month period ended September 30, 2011, Banrisul’s lease agreements on theState Government’s properties generated expenses in the amount of R$751.
Also, Banrisul has an employee assignment agreement with the State Government wherebythe latter assigned 9 employees from the dissolved Caixa Econômica Estadual to Banrisul andreceived 7 employees to work in Government departments and foundations. These employee-related costs are refunded by the parties.
Companhia Estadual de Energia Elétrica (CEEE) - Banrisul is responsible for the provision ofpayroll banking services, including payroll loan operations. Banrisul is also responsible forcollecting payments of electricity bills issued by CEEE and for the supply of meal and fuelvouchers, which represented service revenue in the amount of R$4,453 for the nine-monthperiod ended September 30, 2011. Banrisul offers an e-commerce management solutionthrough the Pregão On Line portal.
Companhia Riograndense de Saneamento (CORSAN) - Banrisul is responsible for the provisionof payroll banking services. Banrisul is also responsible for collecting payments of bills issuedby Corsan and for the supply of fuel vouchers, which represented service revenue in theamount of R$5,054 for the nine-month period ended September 30, 2011. Banrisul offers ane-commerce management solution through the Pregão On Line portal.
Banrisul serves as a go between in the implementation of the financial flow expected fromthe agreements entered into by this company and the National Bank for Economic and SocialDevelopment (BNDES). There are no guarantees pledged and/or compensation related tothese operations.
SULGÁS, CEASA, CESA, CIEL, CORAG, CRM and PROCERGS - Banrisul is responsible for theprovision of payroll banking services and has payroll loan agreements with SULGÁS, CEASAand CESA. Banrisul is also responsible for services related to e-payment issued by thesecompanies and the supply of meal and fuel vouchers, which represented service revenue inthe amount of R$343 for the nine-month period ended September 30, 2011. Banrisul offers ane-commerce management solution through the Pregão On Line portal.
SULGÁS has investments whose yield is indexed to the CDI variation. Banrisul serves as a gobetween in the implementation of the financial flow expected from the agreements enteredinto by this company and the National Bank for Economic and Social Development (BNDES).There are no guarantees pledged and/or compensation related to these operations.
Caixa Estadual S.A. - Agência de Fomento/RS - Banrisul is responsible for the provision ofpayroll banking services, including payroll loan operations. Banrisul is also responsible for e-

89
payment services and the supply of meal and fuel vouchers, which represented servicerevenue in the amount of R$65 for the nine-month period ended September 30, 2011. Banrisuloffers an e-commerce management solution through the Pregão On Line portal.
Banrisul and Caixa Estadual have an employee assignment agreement, whereby the formerassigned 7 to the latter. These employee-related costs are refunded by the parties.
Banco Regional de Desenvolvimento do Extremo Sul (BRDE) - Banrisul is responsible for theprovision of payroll banking services, including payroll loan operations to employees allocatedin the Rio Grande do Sul State, and is responsible for e-payment services.
Fundação Banrisul de Seguridade Social - As described in Note 23, Banrisul’s remaining portionof the contracted debt related to this plan amounts to R$63,961. In addition to this debt,Banrisul pays interest of 6% per year with final maturity in 2028, which is monthly adjustedbased on the General Price Index – Domestic Availability (IGP-DI).
In order to supplement the benefits ensured and provided by the Social Security to itsemployees, Banrisul’s contributions to Fundação Banrisul for the nine-month period endedSeptember, 30 2011 amounted to R$9,511 as described in Note 23.
Banrisul is responsible for the provision of payroll banking services as well as the payment ofretirement and pension benefits to Fundação Banrisul’s beneficiaries. Fundação Banrisulalso has an exclusive investment fund managed by Banrisul, which represented service revenuein the amount of R$222 for the nine-month period ended September 30, 2011. Investmentsmade by Fundação Banrisul at Banrisul earn yield at rates indexed to the CDI variation.
For the nine-month period ended September 30, 2011, Banrisul’s lease agreements on theFundação Banrisul’s properties generated expenses in the amount of R$4,050.
Cabergs – Caixa de Assistência dos Empregados do Banco do Estado do Rio Grande do Sul -Banrisul provides medical and dental care benefits to its employees and Fundação Banrisul’sretirees, which generated expenses of R$16,551 for the nine-month period ended September30, 2011.
Banrisul is responsible for providing banking services related to the payment of staff andsuppliers. Cabergs also has an exclusive investment fund managed by Banrisul, whichrepresented service revenue in the amount of R$116 for the nine-month period endedSeptember 30, 2011. Investments made by Cabergs at Banrisul earn yields at rates indexed tothe CDI variation.
Banrisul offers an e-commerce management solution through the Pregão On Line portal, andthis service is not paid.
All interest-bearing transactions were carried out on an arm’s length basis at rates prevailingon the transaction dates.
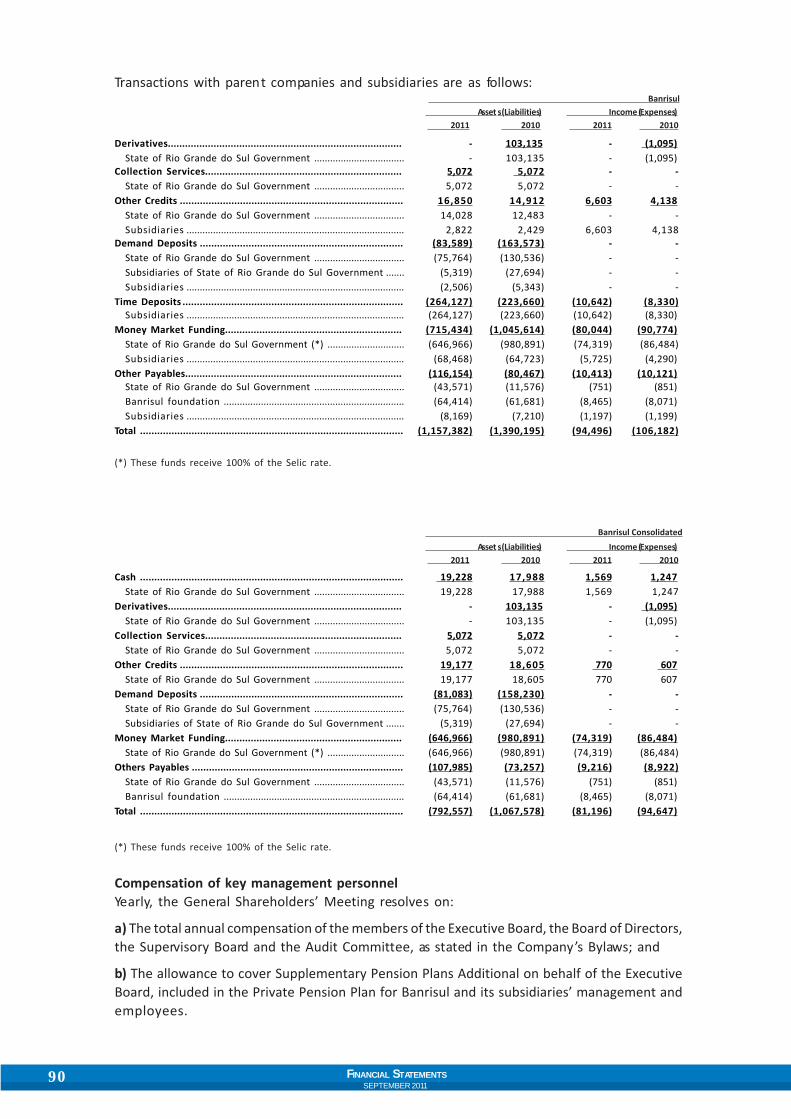
90 FINANCIAL STATEMENTSSEPTEMBER 2011
Transactions with parent companies and subsidiaries are as follows: Banrisul
Asset s (Liabilities) Income (Expenses) 2011 2010 2011 2010
Derivatives.................................................................................. - 103,135 - (1,095)State of Rio Grande do Sul Government .................................. - 103,135 - (1,095)
Collection Services..................................................................... 5,072 5,072 - -State of Rio Grande do Sul Government .................................. 5,072 5,072 - -
Other Credits .............................................................................. 16,850 14,912 6,603 4,138State of Rio Grande do Sul Government .................................. 14,028 12,483 - -Subsidiaries .................................................................................. 2,822 2,429 6,603 4,138
Demand Deposits ....................................................................... (83,589) (163,573) - -State of Rio Grande do Sul Government .................................. (75,764) (130,536) - -Subsidiaries of State of Rio Grande do Sul Government ....... (5,319) (27,694) - -Subsidiaries .................................................................................. (2,506) (5,343) - -
Time Deposits ............................................................................. (264,127) (223,660) (10,642) (8,330)Subsidiaries .................................................................................. (264,127) (223,660) (10,642) (8,330)
Money Market Funding.............................................................. (715,434) (1,045,614) (80,044) (90,774)State of Rio Grande do Sul Government (*) ............................. (646,966) (980,891) (74,319) (86,484)Subsidiaries .................................................................................. (68,468) (64,723) (5,725) (4,290)
Other Payables............................................................................ (116,154) (80,467) (10,413) (10,121)State of Rio Grande do Sul Government .................................. (43,571) (11,576) (751) (851)Banrisul foundation .................................................................... (64,414) (61,681) (8,465) (8,071)Subsidiaries .................................................................................. (8,169) (7,210) (1,197) (1,199)
Total ............................................................................................ (1,157,382) (1,390,195) (94,496) (106,182)
(*) These funds receive 100% of the Selic rate.
Banrisul Consolidated Asset s (Liabilities) Income (Expenses) 2011 2010 2011 2010
Cash ............................................................................................ 19,228 17,988 1,569 1,247State of Rio Grande do Sul Government .................................. 19,228 17,988 1,569 1,247
Derivatives.................................................................................. - 103,135 - (1,095)State of Rio Grande do Sul Government .................................. - 103,135 - (1,095)
Collection Services..................................................................... 5,072 5,072 - -State of Rio Grande do Sul Government .................................. 5,072 5,072 - -
Other Credits .............................................................................. 19,177 18,605 770 607State of Rio Grande do Sul Government .................................. 19,177 18,605 770 607
Demand Deposits ....................................................................... (81,083) (158,230) - -State of Rio Grande do Sul Government .................................. (75,764) (130,536) - -Subsidiaries of State of Rio Grande do Sul Government ....... (5,319) (27,694) - -
Money Market Funding.............................................................. (646,966) (980,891) (74,319) (86,484)State of Rio Grande do Sul Government (*) ............................. (646,966) (980,891) (74,319) (86,484)
Others Payables .......................................................................... (107,985) (73,257) (9,216) (8,922)State of Rio Grande do Sul Government .................................. (43,571) (11,576) (751) (851)Banrisul foundation .................................................................... (64,414) (61,681) (8,465) (8,071)
Total ............................................................................................ (792,557) (1,067,578) (81,196) (94,647)
(*) These funds receive 100% of the Selic rate.
Compensation of key management personnelYearly, the General Shareholders’ Meeting resolves on:
a) The total annual compensation of the members of the Executive Board, the Board of Directors,the Supervisory Board and the Audit Committee, as stated in the Company’s Bylaws; and
b) The allowance to cover Supplementary Pension Plans Additional on behalf of the ExecutiveBoard, included in the Private Pension Plan for Banrisul and its subsidiaries’ management andemployees.

91
In 2011, the fixed maximum annual amount of R$403 was defined as compensation and bonusespayable to individual members of the Executive Board, the Board of Directors, the SupervisoryBoard and the Audit Committee.
For the nine-month period ended September 30, 2011, management compensation is asfollows:
Short Term Benefit s paid to Senior Management 2011 2010Salaries .................................................................................................................................... 2,381 2,727Bonuses .................................................................................................................................... 3 3Security .................................................................................................................................... 5 3 7 635Total ................................................................................................................................ 2,921 3,365
Banrisul pays in full defined benefit pension plans to officers who belong to the staff. For thenine-month period ended September 30, 2011, contributions to Fundação Banrisul deSeguridade Social (Banrisul Social Security Foundation) are summarized as follows:
Post-Employment Benefits 2011 2010Defined Contribution Pension Plan ..................................................................................... 13 15
Banrisul has a D&O liability insurance policy for its officers and members of the Boards, andpaid insurance premium in the amount of R$298.
Banrisul does not offer its key management personnel any long-term, termination or stock-based compensation benefits.
Additional information(1) According to existing legislation, financial institutions may not grant loans or advances to:
a) Officers, directors or members of the advisory, supervisory or similar boards, as well astheir spouses and relatives up to the 2nd degree of kinship;
b) Individuals or legal entities holding equity interest equal to or more than 10%; and
c) Legal entities having more than 10% of capital held by the financial institution itself, any ofits directors or officers as well as their spouses and relatives up to the 2nd degree of kinship.
Thus, Banrisul does not grant any loans or advances to any subsidiary, members of the Boardor the Executive Board and their relatives.
(2) ShareholdingAs of September 30, 2011, members of the Executive Board, the Board of Directors, theSupervisory Board and the Audit Committee jointly hold Banrisul’s shares as follows:
SHARES AMOUNTCommon Shares 9Preferred Shares 128TOTAL SHARES 137

92 FINANCIAL STATEMENTSSEPTEMBER 2011
TÚLIO LUIZ ZAMINCEO
FLAVIO LUIZ LAMMELVice-President
WERNER KÖHLERAccountant CRCRS 38.534
GUILHERME CASSELIVANDRE DE JESUS MEDEIROS
JOÃO EMÍLIO GAZZANAJOEL DOS SANTOS RAYMUNDO
JONE LUIZ HERMES PFEIFFJULIMAR ROBERTO ROTA
LUIZ CARLOS MORLINOfficers
EXECUTIVE BOARD
NOTE 26 Impact From the Adoption of the International Financial ReportingStandards (IFRS)
During the IFRS convergence process, some standards and their interpretations were issuedby the Brazilian FASB (CPC), which will be applicable to financial institutions only whenapproved by the National Monetary Committee (CMN). Currently, financial institutions andother institutions regulated by the Central Bank must adopt the following pronouncements:
Impairment of Assets (CPC 01);Statement of Cash Flows (CPC 03);Related Party Disclosures (CPC 05);Subsequent Events (CPC 24) andProvisions, Contingent Liabilities and Contingent Assets (CPC 25).
CMN Resolution no. 3786/09 and Official Letters no. 3472/09 and no. 3516/10, issued by theCentral Bank of Brazil (Bacen), established that financial institutions and other institutionsauthorized to operate by Bacen, either incorporated as a public company or required toestablish an Audit Committee, must, as of December 31, 2010, annually prepare and disclosein a period not exceeding 120 days after the December 31 reporting date, their consolidatedfinancial statements prepared in accordance with the international financial reportingstandards (IFRS), and following international pronouncements issued by the IASB –International Accounting Standards Board.
The financial statements for the year ended December 31, 2010, prepared in accordance withIFRS was disclosed by Banrisul on May 2, 2011, on its website www.banrisul.com.br/ir as wellas on the website of the Brazilian Securities Exchange Commission (Comissão de ValoresMobiliários – CVM -, www.cvm.gov.br). Management believes that the reconciliation betweennet income and shareholders’ equity as of September 30, 2011 is consistent with the amountspresented in the reconciliation as of December 31, 2010.
NOTE 27 Authorization for Completion of the Financial StatementsBanrisul’s Executive Board authorized the completion of these financial statements on October31, 2011, which consider events subsequent to that date that might affect these financialstatements.

93
Report

94 FINANCIAL STATEMENTSSEPTEMBER 2011

95
Interim information review report
To the Shareholders, Board of Directors and OfficersBanco do Estado do Rio Grande do Sul S.A.Porto Alegre - RS
IntroductionWe have reviewed the individual and consolidated balance sheet of Banco do Estado do Rio Grande doSul S.A. ("Bank") as of September 30, 2011 and the related statements of income, of changes inshareholders' equity and of cash flows for the quarter then ended, including notes thereto.
Management is responsible for the preparation and fair presentation of this interim financial inaccordance with the accounting practices adopted in Brazil, applicable to institutions authorized tooperate by the Brazilian Central Bank. Our responsibility is to express a conclusion on this interiminformation based on our review.
Scope of reviewWe conducted our review in accordance with Brazilian and international standards on review. A reviewof interim information consists of inquiries, mainly of the officials in charge of financial and accountingareas, and of the application of analytical and other review procedures. A review is substantially less inscope than an audit conducted in accordance with International Standards on Auditing and consequentlydoes not enable us to obtain assurance that we would become aware of all significant matters that mightbe identified in an audit. Accordingly, we do not express an audit opinion.
ConclusionBased on our review, nothing has come to our attention that causes us to believe that the accompanyingindividual and consolidated interim information does not present fairly, in all material respects, theBank's financial position at September 30, 2011, the performance of its operations and cash flows forthe quarter then ended, in accordance with the accounting practices adopted in Brazil, applicable toinstitutions authorized to operate by the Brazilian Central Bank.
Other interim informationStatement of value added - We have also reviewed the individual and consolidated statement of valueadded (SVA) for the quarter ended September 30, 2011, the presentation of which in the interim financialinformation is required in accordance with the regulations issued by Brazilian Exchange Commission(CVM) and deemed to be supplementary information for the purposes of the Brazilian Central Bank andthe National Monetary Counci l, which do not require the presentation of the SVA. These statements weresubmitted to the same review procedures described above and, based on our review, we are not aware ofany fact which makes us believe that they were not prepared, in all material respects, in accordance withthe individual and consolidated interim accounting information taken as a whole.
Review of prior quarter amounts - The individual and consolidated interim accounting information forthe quarter ended September 30, 2010, presented for comparison purposes, was previously reviewed byother independent auditors who issued their report dated November 03, 2010 with no modification.
Porto Alegre (RS), November 1, 2011
Fernando Radaich de MedeirosContador CRC-1SP217532/O-6/"S"RS
Porto Alegre, 05 de agosto de 2011ERNST & YOUNG TERCOAuditores Independentes S.S.CRC 2SP015199/O-6/F/RS

96 FINANCIAL STATEMENTSSEPTEMBER 2011

97
Analysis ofPerformance 3Q11
FOLLOWING IS THE ANALYSIS OF THE PERFORMANCE OF BANCO DO ESTADODO RIO GRANDE DO SUL S.A. IN THE NINE MONTHS OF 2011 AND IN THE 3 RD
QUARTER OF 2011.

98 FINANCIAL STATEMENTSSEPTEMBER 2011

99
Banco do Estado do Rio Grande do Sul S.A.
Founded in 1928, Banrisul is a multiple-service bank controlledby the State of Rio Grande do Sul. Banrisul is the official andmain financial agent of the Government of the State. In 1934,Banrisul began its expansion with the opening of branches invarious cities in the state, and continued its growth andconsolidation through the incorporation of public financialinstitutions such as the Banco Real de Pernambuco (1969), BancoSul do Brasil (1970), Banco de Desenvolvimento do Estado doRio Grande do Sul, BADESUL (Rio Grande do Sul’s DevelopmentBank, 1992) and DIVERGS - Distribuidora de Títulos e ValoresMobiliários do Estado do Rio Grande do Sul (SecuritiesDistributor of the State of Rio Grande do Sul, 1992).
In 2007 Banrisul held a primary and secondary public offering of shares, totaling approximatelyR$2.1 billion and enrolled to the Level 1 of Corporate Governance Practices of theBM&FBovespa. In 2008, Banrisul opened a new Superintendence in the State of Santa Catarina,expanding its inclusion in that State, in order to deepen customer relationships, strengthenpartnerships that promote the development of the State of Santa Catarina and expand itsbusiness scale.
2009 was marked by the consolidation of the strategy towards adding efficiency and qualityto the management, which took shape with the implementation of a management modelfocused on generating results, on technology modernization, on the review of internalprocesses, the development of a new credit model, the restructuring of business goals modelsand incentive compensation to employees.
The Bank presented consistent growth of its asset base in 2010, and ended the period withfavorable solvency and profitability indicators.
In September 2011, total assets reached the amount of R$36.6 billion. Of these, R$19.7 billionare related to the loan portfolio, and R$4.3 billion recorded in the shareholders’ equity of.Banrisul focuses on providing consumer credit to individuals and working capital finance tocompanies. Over the past 12 months, the participation of the corporate segment has expandede, as well as the real estate credit lines in relation to the total loan book. The growth of thesetwo credit lines was very significant in the last twelve months, surpassing the performance ofthe credit portfolio to individuals.
Yet, payroll lending to individuals has maintained the highest share of the credit portfolio,despite the shy growth of 0.8% from 2Q11 to 3Q11. In comparison to 3Q10, payroll loansincreased 14.0%. Another important credit product the portfolio is working capital forcompanies, that grew 28.2% year-on-year and 4.5% quarter-on-quarter. Real estate portfoliowas 3Q11’s highlight, increasing 10.3% from 2Q11 to 3Q11 and 32.3% from September 2010 toSeptember 2011.
The geographic focus of the Bank is the Southern Region of Brazil, especially the state of RioGrande do Sul, with the 4th largest Gross Domestic Product (GDP) and where Banrisul’sheadquarters is located.
Banrisul group consists of Banco do Estado do Rio Grande do Sul S.A., Banrisul S.A.Administradora de Consórcios, Banrisul S.A. Corretora de Valores Mobiliários e Câmbio,Banrisul Armazéns Gerais S.A. and Banrisul Serviços Ltda.

100 FINANCIAL STATEMENTSSEPTEMBER 2011
Banking Industry and CompetitiveEnvironmentBanking industry extremely linked to the movement of business cycles and considering thehigh level of integration between local and global economies, has been impacted, over thenine months of 2011, by the financial instability in full deployment in Europe and in theUnited States. The effects of turbulence in the macroeconomic environment were felt in theslowdown of credit growth, in the acceleration, though not widespread, of default levels andin a reversal of the monetary policy of increasing interest rates to control inflation. In additionto cyclical pressures, recent changes in the regulatory framework will provoke changes in thestructure of the Brazilian banking environment.
The balance of credit operations within the Brazilian financial industry reached R$1,929.3billion in September 2011, an increase of 19.6% in comparison compared to September lastyear. The moderation in credit added to wage increases resulting from collective bargainingagreements should help keeping default levels under control, which reached 3,5% inSeptember 2011, increasing 10 basis points in twelve. The control of inflation and the reductionin the Selic rate by 50 basis points last August, with the prospect of another reduction inOctober, as opposed to successive increases of the interest rate made by the Monetary PolicyCommittee (Comitê de Política Monetária - COPOM), should also contribute to the stability ofdefault rates. The Credit/GDP ratio reached 48.4% in September, up 300 basis points from theration obtained in September 2010.
In relation to structural impacts of financial crises, it is important to point out the Basel IIIaccord which, once implemented, will result in new capital requirements for financialinstitutions. However, many Brazilian banks are already reporting higher BIS ratios than theminimum established by the National Monetary Council, which should reduce possibledifficulties in adapting to the new rules.
The most relevant aspects in Basel III are the requirement for a higher percentage of betterquality regulatory capital. Divided into two levels, capital will be composed of elementscapable of absorbing losses during the lifetime of the institution and in the event of bankruptcy.The introduction of countercyclical capital seeks to contemplate the risks from changes in themacroeconomic scenario, in an environment of economic growth. Basel III also proposes twolevels of liquidity: short term liquidity wi ll verify the institution’s ability to withstand a stressscenario for a period of one month, while long-term liquidity encourages the financing ofactivities with more stable funding sources. These changes in the regulatory framework mayimpair mainly the credit concession until banks are dully adequate.
In relation to the banking environment in Brazil, in June 2011, Banrisul occupied, among mid-sized and large Brazi lian banks, the 11 th position in total assets, 11th in equity, 8th in totaldeposits and 7th in the number of branches, according to rankings released by the CentralBank Brazil (BNDES not included). The Bank increased its time deposits market share in Brazilfrom 1.7712% in 2Q11 to 1.8868% 3Q11.
Brazil Rio Grande do Sulsep/11¹ jun/11 jun/11 mar/11²
Demand Deposits 1.7982% 1.8532% 26.6920% 27.0793%
Saving Deposits 1.2415% 1.3272% 16.4062% 17.1849%
Time Deposits 1.8868% 1.7712% 30.4961% 29.4502%
Credit Operations 1.0187% 1.0250% 22.4270% 21.5458%
Number of Branches 2.2024% 2.2071% 25.7088% 25.7605%
¹ Last information disclosed. ² Last available information.
Table 01: Competitive Environment

101
Economic and Financial IndicatorsTable 02: Economic and Financial Indicators
(¹) Including Personnel Expenses, Other Administrative Expenses and Other Operating Expenses.(²) Interest on own capital and dividends paid and/or distributed (before income tax witholding at source),(³) Including interbank investments and excluding matched transactions.(4) Net income / average total assets.(5) Ne t income / aver age shar eholders’ equity.(6) Efficiency Ratio - 12-month accumulation. Personnel expenses + other administrative expenses /Net financial margin + revenue from services rendered +
(other operating income - other operating expenses)(7) Fixed assets/ shareholders’ equity .(8) Default > 60 days / total loans.(9) Allowance for loan losses / default > 60 dias.
Main Income Statement Accounts - R$ Million 9M11 9M10 3Q11 2Q11 1Q11 4Q10 3Q103Q11/ 9M11/2Q11 9M10
Net Financial Margin 2,461.1 2,128.0 873.2 832.6 755.3 786.7 769.7 4.9% 15.7%Allowance for Loan Losses Expenses (463.8) (391.7) (182.3) (143.1) (138.5) (126.6) (111.2) 27.4% 18.4%Gross Profit from Financial Operations 1,997.2 1,736.2 690.9 689.5 616.8 660.1 658.5 0.2% 15.0%Financial Income 4,405.3 3,531.4 1,668.9 1,436.5 1,299.9 1,310.4 1,298.2 16.2% 24.7%Financial Expenses 2,408.0 1,795.2 978.0 747.0 683.1 650.3 639.7 30.9% 34.1%Income from Services Rendered 517.4 468.2 172.4 173.4 171.6 173.5 160.9 -0.6% 10.5%Administrative and Other Operational Expenses (¹) 1,496.3 1,395.8 527.8 499.5 469.0 499.2 478.7 5.7% 7.2%Other Operation Income 199.8 127.8 86.7 46.6 66.5 81.1 39.0 86.2% 56.4%Income from Operations 1,046.8 786.0 362.0 353.5 331.4 361.8 327.0 2.4% 33.2%Net Income 677.7 511.4 239.2 227.2 211.3 229.9 206.4 5.3% 32.5%
Used/Distributed Results - R$ Million 9M11 9M10 3Q11 2Q11 1Q11 4Q10 3Q103Q11/ 9M11/2Q11 9M10
Interest on Own Capital - Dividends (²) 232.2 172.8 58.3 117.1 56.8 120.4 51.6 -50.2% 34.4%
Main Balance Sheet Accounts - R$ Million Sep11 Sep10 Sep11 Jun11 Mar11 Dec10 Sep10Sep11/Sep11/
Jun11 Sep10Total Assets 36,554.1 32,339.3 36,554.1 34,755.0 32,951.0 32,127.7 32,339.3 5.2% 13.0%Securities (³) 10,571.2 10,014.1 10,571.2 9,965.9 9,789.3 9,573.9 10,014.1 6.1% 5.6%Total Lending 19,654.7 16,237.1 19,654.7 18,809.3 17,939.6 17,033.2 16,237.1 4.5% 21.0%Allowance for Loan Losses (1,284.6) (1,122.7) (1,284.6) (1,214.7) (1,156.0) (1,101.9) (1,122.7) 5.8% 14.4%Past Due Loans > 60 days 566.6 487.9 566.6 498.9 478.2 418.0 487.9 13.6% 16.1%Funding and Assets under Management 27,505.3 24,095.2 27,505.3 26,092.7 25,289.8 25,090.8 24,095.2 5.4% 14.2%Shareholders' Equity 4,298.1 3,746.4 4,298.1 4,118.1 4,009.0 3,855.2 3,746.4 4.4% 14.7%Consolidated Reference Equity 4,289.6 3,738.0 4,289.6 4,170.7 4,000.6 3,873.0 3,738.0 2.9% 14.8%Average Shareholders' Equity 4,076.7 3,577.4 4,208.1 4,063.6 3,932.1 3,800.8 3,668.2 3.6% 14.0%Aver age Total Assets 34,340.9 30,711.7 35,654.6 33,853.0 32,539.3 32,233.5 31,719.1 5.3% 11.8%Financial Index 9M11 9M10 3Q11 2Q11 1Q11 4Q10 3Q10Return on Total Assets 2.5% 2.1% 2.6% 2.6% 2.6% 2.9% 2.6%Return on Shareholders' Equity 21.6% 18.6% 24.2% 24.0% 22.8% 26.1% 23.9%ROAA (p.a.) (4) 2.6% 2.2% 2.7% 2.7% 2.6% 2.9% 2.6%ROAE (p.a.) (5) 22.8% 19.5% 24.7% 24.3% 23.3% 26.5% 24.5%Efficiency Ratio (6) 44.4% 48.5% 44.4% 45.0% 45.8% 47.8% 48.5%Consolidated Basel Ratio 15.9% 15.8% 15.9% 15.6% 15.8% 16.1% 15.8%Fixed Assets Ratio (7) 3.8% 4.6% 3.8% 4.0% 4.3% 4.4% 4.6%Default Rate (8) 2.9% 3.0% 2.9% 2.7% 2.7% 2.5% 3.0%Cover Rate (9) 226.7% 230.1% 226.7% 243.5% 241.7% 263.6% 230.1%Economic Indicators 9M11 9M10 3Q11 2Q11 1Q11 4Q10 3Q10 Effective Selic Rate (accrued) 8.74% 7.03% 3.03% 2.82% 2.65% 2.57% 2.62% Foreign Exchange Rate (R$/USD – end of period) 1.85 1.69 1.85 1.56 1.63 1.67 1.69 Foreign Exchange (%) 11.30% -2.70% 18.79% -4.15% -2.25% -1.67% -5.96%IGP-M (General Market Price Index) 4.15% 7.90% 0.97% 0.70% 2.43% 3.18% 2.08%IPCA (Extended National Consumer Price Index) 4.97% 3.60% 1.06% 1.40% 2.44% 2.23% 0.50%
In the State of Rio Grande do Sul, Banrisul’s market share also increased 0.88 percentagepoints in credit operations from March 2011 to June 2011. The reduction in share of demandand savings deposits is due to migration of funding to time deposits in that period.

102 FINANCIAL STATEMENTSSEPTEMBER 2011
Assets and Earnings Structure Financial Performance
Banrisul ended the nine months of 2011 with a growing assets structure and favorable results.The Bank continued its strategy of increasing credit operations, encouraged by the prospectsof the economic environment, and enjoyed its competitive advantages in relation to otherinstitutions: comfortable cash at hand, low exposure to treasury risks, adequate levels ofdefault and cost of funding, and the financial capacity to sustain the growth of loan assets.
Banrisul’s liquidity is favored by its market fundraising features, the cash and cash equivalentsare invested in federal bonds indexed to the Selic Rate, Treasury bills or in matchedtransactions, always backed by federal securities, without any exposure to foreign exchange,swaps or derivatives operations.
The policy of attracting small and medium depositors and savers ensures the reduction offinancial costs and the diversification of the funding sources, a strategy suited to the needs offunding for new loans. Total deposits represented 64.8% or R$20.9 billion of the third partiesliabilities at the end of September 2011.
Responsible for 53.8% of total assets, the credit portfolio is composed of non-concentratedoperations granted mainly to individuals and micro, small and medium companies. Payrollloans to individuals and working capital to companies absorbed 31.0% and 24.6%, respectively,of total credit at the end of September 2011. Real estate loans, with less participation butongoing growth, correspond to 8.2% of the total credit portfolio.
Non-performing loans over 60 days reduced to 2.9% of the total loans in September 2011, alevel lower than the 3.0% of the same period last year. NPL over 90 days was 2.4% in September2011, also lower than the 2.6% of September 2010. The coverage ratio, total provisions inrelation to overdue credit operations, reached 226.7%, an appropriated level in comparisonto market practices, given the risks of past due loans.
Banrisul has conditions to support credit growth, as demonstrated by the (consolidated)Basel Ratio of 15.9% in September 2011. All structural indicators demonstrate the effectivenessof the administrative structure, at favorable levels, as showed by the operating costs/totalassets and cost/income ratios, which reached 4.9% and 44.4% in September 2011, respectively.
Net income reached R$677.7 million in 9M11, 32.5% (R$166.3 million) above the net incomefor the same period of 2010. In 3Q11, net income was R$239.2 million, 15.9% (R$32.8 million)above 3Q10. The performance reflects increases in credit, treasury and services revenues,offset by higher financial expenses. Net profit increased 5.3% (R$12.0 million) from 2Q11 to3Q11 due to higher income from credit and foreign exchange portfolios, offset by the increaseof financial expenses.
Total Net profit in the nine months of 2011 represents an annualized return on average equityof 22.8%. In September 2011, shareholders’ equity reached R$4,298.1 million, an increase of14.7% over September 2010, 11.5% over December 2010 and of 4.4% over June 2011.
Gross interest income of R$1,997.2 million in the nine months of 2011 was 15.0% (R$261.0million) higher than that of the same period the last year. In 3Q11, it reached R$690.9 million,4.9% (R$32.3 million) above 3Q10 and 0.2% (R$1.3 million) above that of 2Q11.
Total assets reached R$36,554.1 million in September 2011, an increase of 13.0% overSeptember 2010, 13.8% over December 2010 and 5.2% above June 2011. The year-on-year,growth was motivated by the increase in credit portfolio, especially in commercial creditportfolio. With respect to growth from 2Q11 to 3Q11, in addition to that of the commercialcredit portfolio, it was observed a significant expansion of rural credit. Banrisul’s creditoperations totaled R$19,654.7 million at the end of September 2011, an increase of 21.0% in
103
twelve months, 15.4% in nine months and 4.5% in the last quarter. The commercial credit(non-earmarked portfolio) totaled R$14,906.9 million, an increase of 19.1% in twelve months,13.5% in nine months and 2.3% in the last quarter. Commercial credit to Individuals totaledR$8,326.7 million in September 2011, an increase of 15.4% over September 2010, 12.5% overDecember 2010 and 1.4% over June 2011. Commercial credit to Companies totaled R$6,580.2million in September 2011, an increase of 24.2% compared with September last year and of14.8% compared to December 2010 and of 3.4% from June 2011.
Funds raised and under management reached R$27,505.3 million in September 2011, growing14.2% over September 2010, 9.6% over December 2010 and 5.4% from June 2011. Depositsreached R$20,910.1 million in September 2011, growing 16.5% over September 2010, 9.7% inrelation to December 2010 and 5.6% to June 2011. Assets under management reached R$6,595.2million, 7.4% above September 2010, 9.2% over December 2010 and 4.8% above June 2011.
Banrisul collected and provisioned R$581.7 million in taxes and contributions in nine monthsof 2011. Taxes withheld and paid, which are levied directly on financial intermediation andother payments, amounted to R$369.5 million.
Capital Expenditure Policy
Investments in hardware, software and maintenance of assets focused mainly onimplementation of solutions for ensuring safety in the payments, to Banrisul accreditation asdigital certificate-issuing authority and the restructuring of the environment for enterprisestorage the large platform (mainframes). The investment policy of the Bank unfolds on threepillars: technology expansion and modernization, renovations and expansions and expansionof the distribution network. For that purposes, R$141.0 million was invested in the ninemonths of 2011, distributed among software and hardware enhancements and assetmaintenance.
Technology Expansion/Modernization
Investments in information technology amounted to R$121.5 million in September 2011,reflecting the strategy of periodic development of security mechanisms to prevent and combatfraud in banking transactions and improve the operational efficiency of its infrastructure ofsystems.
In the nine months of 2011, in order to meet requirements for the acquisition of cards fromMasterCard, Visa and Banricompras, security processes were standardized and implemented,in order to comply with the PCI (Payment Card Industry) safety standards to card market. TheBank is the only institution in Latin America member to PCI board of advisors, directlyinfluencing the definition of rules to be applied worldwide.
Encryption and digital certification projects also add a higher level of security to the Bank'srelationships channels. Computer authentication features based on digital certificates havebeen incorporated to the current system in use by Banrisul's correspondent banks. The Bank'sweb environment systems are now authenticated with digital identity smartcards, increasingsecurity and access validation to products. The digital identity certificates have incorporatedalerts of due date proximity to avoid problems from unavailability of access.
Service Network Renovation/Expansion
Increase operations in the banking industry, review and expand the number of service pointsguide the restructuring of the Bank. Branches modernization is focused on revitalizingcustomer service model, setting new standards of configuration of the points, increasing the

104 FINANCIAL STATEMENTSSEPTEMBER 2011
Table 03: Margin AnalysisR$ Million
performance of communication channels and improving contact with customers. With theview of expanding and remodeling the network, investments of R$19.5 million were made innine months of 2011, being R$12.6 million during 1H11 and R$6.9 million in 3Q11.
Expansion of Distribution Network
In nine months of 2011, Banrisul’s customer service network totaled 1,272 points, distributedin 440 branches, 279 banking services stations and 553 electronic service stations. In Rio Grandedo Sul, the Bank is present in 414 municipalities, covering 98% of the population and GDP ofthe state.
Margin Analysis
The Margin Analysis in the following chart was based on the average balances of assets andliabilities, calculated as of the closing monthly balances in each quarter.
The chart shows the revenue-generating assets and interest-bearing liabilities, thecorresponding financial incomes on assets and financial expenses on liabilities, as well as theeffective average rates practiced.
9M11 9M10 2010 2009Average Income Average Average Income Average Average Income Average Average Income AverageBalance Expense Rate Balance Expense Rate Balance Expense Rate Balance Expense Rate
Interest-Earning Assets 31,178.4 4,405.3 14.13% 28,433.1 3,530.4 12.42% 28,781.4 4,840.5 16.82% 25,996.9 4,262.1 16.39%Loan Portfolio 18,046.1 3,293.2 18.25% 14,639.1 2,598.4 17.75% 15,372.3 3,567.5 23.21% 11,954.9 2,948.1 24.66%Resales pending Settlement 2,595.9 222.8 8.58% 4,098.4 290.9 7.10% 3,476.9 368.9 10.61% 5,582.3 517.1 9.26%Money Market Investments 2,168.4 183.4 8.46% 1,955.0 129.5 6.62% 1,995.7 182.4 9.14% 1,761.2 166.4 9.45%Available-for-Sale Securities 1,721.2 145.6 8.46% 1,397.5 92.5 6.62% 1,516.9 138.7 9.14% 966.4 91.3 9.45%Held-to-Maturity Securities 4,331.2 366.4 8.46% 4,074.3 269.8 6.62% 4,129.2 377.5 9.14% 3,677.5 347.4 9.45%Interbank Deposits 230.7 12.2 5.28% 127.2 8.0 6.27% 123.7 10.7 8.68% 155.2 15.4 9.91%Other Interest-Earning Assets 2,084.9 181.7 8.71% 2,141.5 141.3 6.60% 2,166.8 194.8 8.99% 1,899.3 176.4 9.29%
Compulsories 1,459.0 140.4 9.62% 1,675.2 95.3 5.69% 1,661.7 131.6 7.92% 1,479.8 117.6 7.95%Other 625.9 41.3 6.60% 466.3 46.0 9.87% 505.1 63.2 12.52% 419.5 58.8 14.01%
Non Interest-Earning Assets 3,300.8 2,440.9 2,577.5 1,980.3Total Assets 34,479.1 4,405.3 12.78% 30,873.9 3,530.4 11.43% 31,359.0 4,840.5 15.44% 27,977.2 4,262.1 15.23%Interest - Bearing Liabilities 25.195.9 (1,944.2) 7.72% 23,109.4 (1,402.4) 6.07% 23,143.0 (1,925.8) 8.32% 21,097.3 (1,719.7) 8.15%Domestic Interbank Deposits 11.2 (1.0) 8.64% 62.3 (3.6) 5.83% 38.2 (3.9) 10.28% 59.3 (4.2) 7.10%Domestic Saving Deposits 5,242.0 (279.7) 5.34% 5,942.7 (257.5) 4.33% 5,901.4 (349.8) 5.93% 5,136.1 (292.9) 5.70%Domestic Time Deposits 11,647.8 (884.3) 7.59% 9,002.4 (602.0) 6.69% 9,268.2 (837.3) 9.03% 8,334.7 (782.3) 9.39%Money Market Funding 1,742.7 (167.2) 9.60% 2,081.3 (161.1) 7.74% 1,893.2 (214.4) 11.32% 2,485.5 (257.6) 10.36%Borrowings and Onlendings 1,809.1 (220.3) 12.18% 1,637.5 (83.1) 5.07% 1,627.7 (112.5) 6.91% 1,407.9 (57.1) 4.05%
Domestic 1,109.6 (76.0) 6.85% 1,045.8 (51.0) 4.87% 1,038.2 (77.5) 7.46% 914.6 (42.0) 4.59%Foreing 699.4 (144.2) 20.62% 591.7 (32.1) 5.43% 589.5 (35.1) 5.95% 493.4 (15.0) 3.05%
Other 4,743.1 (391.7) 8.26% 4,383.1 (295.1) 6.73% 4,414.3 (407.9) 9.24% 3,673.8 (325.6) 8.86%Non Interest - Bearing Liabilities 5,159.2 4,174.8 4,534.1 3,609.0Shareholders' Equity 4,124.0 3,589.8 3,681.9 3,270.8Liabilities and Shareholders' Equity 34,479.1 (1,944.2) 5.64% 30,873.9 (1,402.4) 4.54% 31,359.0 (1,925.8) 6.14% 27,977.2 (1,719.7) 6.15%
Spread 7.14% 6.89% 9.29% 9.09%NIM 2,461.1 7.89% 2,128.0 7.48% 2,914.7 2,542.4NIM (Yearly) 10.66% 10.10% 10.13% 9.78%

105
Credit operations include advances on foreign exchange contracts and leasing agreements,which are shown at the current net value of the leasing agreements. Income from creditoperations overdue for more than 60 days, irrespective of their risk level, will only be bookedas revenues when they are received.
Average balances of interbank investments, funds invested or raised in the interbank marketcorrespond to the redemption amount deducted from the income or expenses correspondingto future periods.
Average balances of deposits, open-market funding, loans and onlendings include the feespayable till the date of closing of the financial statements, booked on a pro rata die basis. Asfor expenses related to these items, fees relating to deposits include contributions to theDeposit Guarantee Fund (Fundo Garantidor de Crédito - FGC).
The interest-earning assets margin presented an upward trend in last nine months in relationthe same period last year, when the effective basic interest rate (Selic) increased from 7.03%in 9M10 to 8.74% in 9M11. Average profitable assets grew 9.7% year-on-year, while interest-bearing liabilities increased by 9.0%. The absolute margin increased 15.7%, and the relativemargin surpassed by 0.41 percentage points that recorded in 9M10.
The hikes of the basic interest rate registered in the nine months of the year resulted inincreasing rates on interest-earning assets over interest-bearing liabilities. Besides the basicinterest rates that index transactions in the financial sector, the assets and liabilities structureand also the tenor of the transactions are determinant factors in the formation of the marginrecorded in each period.
The representativeness of credit assets in total average interest-earning assets expanded by6.4 percentage points last year, given that treasury operations maintained, practically, thesame participation, going from 26.1% in September 2010 to 26.3% in September 2011, anincrease of 0.6 percentage points. The credit revenue from the higher volume of transactionsand the effects of the hikes of the Selic Rate over the balance of securities were the maindrivers to increase margin.
By the side of interest-bearing liabilities, it can be clearly seen the change in funding structure:the average balance of time deposits, during the nine months of 2011, increased to represent46.2% of the liabilities that generated costs, 7.2 percentage points above the 39.0% shown inthe same period last year; savings deposits reduced their participation from 25.7% in 9M10 to20.8% in 9M11. On the other hand, non interest-bearing demand deposits showed an increasein their participation of 5.7 percentage points in the average balance, going from 48.1% in9M10 to 53.8% in 9M11.
Changes in the structure of assets and liabilities improved the financial margin and increasedefficiency. The growth of the average interest-earning assets was influenced by the increaseof credit asset and securities portfolio, helping increase revenue-generating rates.
In relation to liabilities, the balances of savings and money market funding declined theirvolume, while time deposits and borrowings increased their average balance. However,interest-bearing liabilities showed an upward trend in average rates strongly influenced byeconomic measures to increase the Selic rate and the growth of reserve requirements. Theresults of these changes together produced higher spreads, which reached 7.14%% in ninemonths 2011, 0.25 percentage points higher than that of 9M10.

106 FINANCIAL STATEMENTSSEPTEMBER 2011
9M11 / 9M10 2010 / 2009 2009 / 2008Increase/Decrease Increase/Decrease Increase/Decrease
According to change in: According to change in: According to change in:Volume Rate Net Volume Rate Net Volume Rate Net
Interest Change Interest Change Interest ChangeInterest - Earning AssetsLending Operations, Leasing Operations and Other Receivables 619.9 75.0 694.9 780.1 (160.8) 619.3 484.1 (110.7) 373.4Resales pending Settlement (120.9) 52.8 (68.1) (215.4) 67.3 (148.1) 32.4 (24.5) 7.9Securities and Derivatives 56.6 146.9 203.6 112.2 (18.8) 93.4 202.5 (42.8) 159.7Interbank Deposits 5.2 (1.0) 4.2 (2.1) (2.5) (4.6) 96.3 (5.8) 90.5Other (3.6) 44.0 40.4 23.8 (5.4) 18.4 (273.9) 38.0 (235.9)Total In terest-Earning Assets 557.3 317.7 874.9 698.6 (120.2) 578.4 541.4 (145.8) 395.6Interest -Bearing LiabilitiesInterbank Deposits 6.5 (3.8) 2.7 (1.1) 1.4 0.3 (3.9) 0.4 (3.5)Savings Deposits 32.7 (55.0) (22.3) (46.0) (10.9) (56.9) 256.2 (252.1) 4.1Time Deposits (221.3) (61.0) (282.3) (85.1) 30.2 (54.9) (120.8) 110.9 (9.9)Money Market Funding 28.8 (34.9) (6.1) 70.7 (27.5) 43.2 20.9 52.4 73.3Onlendings (7.7) (129.5) (137.2) (7.1) (48.4) (55.5) (63.3) 296.2 232.9Other Interest-Earning Assets (21.1) (75.5) (96.6) (69.2) (13.1) (82.3) (162.6) 33.6 (129.0)Total Interest -Bearing Liabilities (182.2) (359.7) (541.8) (137.8) (68.3) (206.1) (73.4) 241.3 167.9
Table 04: Variations in Interest Income and Expenses: Volumes and Rates R$ Million
Variations in Interest Income and Expenses: Volumes and Rates
The following chart shows the variations in the interest incomes and expenses by the changein average volume of interest-earning assets and interest-bearing liabilities (a) from 9M10 to9M11, (b) from 2009 to 2010 and (c) from 2008 to 2009.
The variations in the volume and interest rates were calculated based on the average balancesin the period and the variations in the average interest rates on interest-earning assets andinterest-bearing liabi lities. Variation of interest rate was calculated by variation on interestrate in the period multiplied by the average interest-earning assets or average interest-bearing in the second period. The volume change was computed as the difference betweenthe interest amounts from the current period to the previous one.
The upward net variation of revenue on interest-earning assets of R$874.9 million is associatedwith increases the volumes of credit and securities, which added revenues of R$676.5 million,and also with oscillations over average rates that caused an increase of R$317.7 millionmotivated by the growth of credit rates in R$75.0 million, and by the expansion of securitiesportfolio, increasing repurchase agreements, by R$199.7 million.
The growth of R$541.8 million in expenses from interest-earning liabilities is tied to evolutionof the average balances of time deposits, that increased the cost of funding by R$221.3 million,to higher average interest rates, the raised the costs of saving accounts and time deposits byR$116.0 million, by money market funding of R$34.9 million, and borrowing and onlendingsof R$129.5 million. Both the saving and market funding showed reductions in their averagebalances, thus reducing costs proportionally, in contrast to the hikes of the interest rates thatoriginated increases in expenses.
The change in credit revenues that came from the average rates was directly influenced bythe exchange rate of 11.30% accumulated in the nine months of 2011, a result that led toincreases in long-term financing in foreign currency and in the income from operations foradvance on foreign exchange contracts. This effect was made null because of the cost ofborrowings and onlendings, which showed an upward trend, linked specifically to thevolatility of the exchange rate.
The positive result of variations in financial income and expenses was delivered by higheraverage volume, making it possible that asset gains of R$375.1 million were higher than theR$42.0 million produced by liabilities expenses, allowing for the expansion of R$333.1 millionin the analytical margin.

107
Banrisul’s Stock Market PerformanceIn July 31, 2011, Banrisul completed four years of its accession to the Level 1 of CorporateGovernance of the BM&FBOVESPA SA - Brazi lian Stock Exchange, Commodities and Futures,Banrisul strengthens and consolidates its transparent relationship with clients and investors,built by the dissemination of data and information to the market, providing better and timelyknowledge about the Bank's business.
From January to September 2011, Banrisul organized 121 opportunities for approaching marketanalysts and investors, as well as other stakeholders in Brazil and abroad.
Currently, Banrisul’s PNB share is part of the composition of seven BM&FBovespa’s differentlistings. The performance of Banrisul‘s shares compared with those segments’ is seen in thegraph below.
Graph 01: Banrisul PNB Performance x Brazilian Stock Market Indexes
Table 05: Communication and Relationship Efforts
3Q11 2Q11 1Q11 4Q10 3Q10
Meetings 7 39 15 16 39
Conference Calls 6 19 12 5 28
Events Abroad* 0 23 0 16 0
Expo Money 0 0 0 0 0
APIMEC Meetings 0 0 0 1 0
TOTAL 13 81 27 38 67
* 2010: London, New York and Stavanger. 2011: Amsterdam, Chic ago, The Hague, London, Milwaukee, New York, Paris, Rotter dam, Stavanger and Zurich.

108 FINANCIAL STATEMENTSSEPTEMBER 2011
At the end of September 2011, the PNB share (BRSR6) was ranked 92nd among the 100 mosttraded shares in Bovespa (73th in twelve months). In 3Q11, average daily financial trade wasapproximately 24% below than that in 3Q10, while average daily trade increase by 29% in thesame period.
Graph 02: Average Financial Volume, Number of Trades and Number of Shares (PNB Shares)
The shares and shareholders are distributed geographically according to the charts below:
Graph 03: Banrisul´s Shares - Geographic Distribution

109
Expected target-prices divulged by the now ten sell-side financial institutions currentlycovering the Bank are shown below and available at the Investor Relations website(www.banrisul.com.br/irwww.banrisul.com.br/ir).
Target-Prices (in R$) and Upside (in % - as of September 30, 2011)
Market Consensus

110 FINANCIAL STATEMENTSSEPTEMBER 2011
Evolution of Balance Sheet Accounts
Total Assets
Total assets in September 2011 were R$36,554.1 million, 13.0% (R$4,214.8 million) higher thanin September 2010, and increased 13.8% (R$4,426.4 million) from December 2010 and 5.2% or(R$1,799.1 million) from June 2011.
The year-on-year asset growth comes from the expansion of the funding portfolio in R$2,956.0million and the increase of R$616.2 million in escrow deposits. In the asset allocation duringthe last twelve months, the growth of R$3,417.6 million in credit and of R$812.9 million ininterbank transactions stand out.
In the nine months 2011, the increase of assets comes from the R$1.857.1 million increase indeposits, from the R$322.9 million growth in matched transactions and from the R$567.1million increase in escrow deposits. As to funding allocation, credit portfolio grew R$2,621.5million and investments in securities plus interbank liquidity increased R$1,320.1 million.
Assets growth quarter-on-quarter originated from the positive performance of deposits(R$1,109.2 million increase) and escrow deposits (R$218.9 million). As to funding allocation,credit portfolio, treasury operations and interbank transactions increased by R$845.4 million,R$460.4 million and R$335.2 million, respectively.
Graph 04: Total Assets - R$ Million
Total assets in September 2011 were comprised of credit operations (53.8%), interbanktransactions and securities (33.4%), interbank and interbranch accounts (9.4%) and other assets(3.4%).

111
Graph 05: Composition of Assets - R$ Million
Securities
Securities totaled R$10,571.2 million at the end of September 2011, 5.6% (R$557.1 million)above that of September 2010. In the nine months of 2011, securities increased 10.4% (R$997.2million) over the balance of December 2010 and rose 6.1% (R$605.2 million) from 2Q11 to3Q11. This amount includes liquid interbank transactions but excludes total liabilities frommatched transactions.
The year-on-year increase in securities was the result of the R$2,956.0 million increase ofdeposits at, the growth of R$616.2 million in escrow deposits and of R$391.7 million inonlendings, deducted of the R$3,417.6 million expansion of the credit portfolio.
Year-to-date, the expansion of the securities portfolio in R$1,857.1 million came from theincreases of R$567.1 million in escrow deposits and of R$381.1 million in onlendings, offsetby the allocation in credit assets in the amount of R$2,621.5 million.
From 2Q11 to 3Q11, the increase of R$1,109.2 million in deposits, the growth of R$R$218.9million in escrow deposits and of R$166.5 million in onlendings fueled both the growth of thesecurities portfolio and of the loan book.
Graph 06: Securities and Liquid Interbank Transaction* - R$ Million
* Excluding Matched Transactions

112 FINANCIAL STATEMENTSSEPTEMBER 2011
Interbank and Interbranch Transactions
The balance of interbank and interbranch transactions was R$3,469.2 million at the end ofSeptember 2011, which is 30.9% (R$818.7 million) more than that in September 2010, 9.9%(R$313.4 million) higher than in December 2010 and 10.8% (R$338.5 million) above June 2011.
In twelve months, the balance fluctuation refers to the increase of reserve requirementsimposed by the Central Bank of Brazil, boosted by the expansion of funding from demand andtime deposits, in the amounts of R$447.0 million and R$3,736.4 million, respectively.
From December 2010, the positive changes are associated with increasing amount depositsmade to comply with reserve requirements. From 2Q11 to 3Q11, it may be noted that theincrease of time deposits in R$1,333.0 million boosted reserve requirements even with thereduction of R$225.5 million in the balances of demand and savings deposits.
Graph 07: Interbank and Interbranch Transactions - R$ Million
Credit Operations
Banrisul‘s credit portfolio totaled R$19,654.7 million in September 2011, exceeding by 21.0%the balance in September 2010, by 15.4% the amount in December 2010 and by 4.5% theamount in June 2011.
Graph 08: Credit Operations - R$ Million

113
Breakdown of Credit by Company Size
At the end of September 2011, credit to companies represented 46.6% of the total creditportfolio, with a balance of R$9,166.1 million.
The company’s size is determined by average monthly revenue: Micro – up to R$20,000; Small – up to R$200,000; Mid-sized– up to R$25 million; and Large – above R$25 million.
Credit to companies grew 26.2% year-over-year, 18.6% year-to-date and 6.8% quarter-on-quarter. Balance of large companies operations increased 4.6% from September 2010 toSeptember 2011 and 9.5% from 2Q11 to 3Q11.
Loans to mid-sized, small and micro companies increased 37.5% in twelve months, helpingexpand the segment ’s share of total credit to companies to 71.5% at the end of September2011 from 65.6% in September 2010. Year-to-date, loans to SME increased by 9.4% (5.7%quarter-on-quarter), amounting to 33.4% of the loan book.
Breakdown of Credit by Sector
The following table provides the breakdown of the credit portfolio by sector. Out of the creditassets at the end of September 2011, 99.4% were allocated to the private sector, with a 21.0%growth in twelve months. Leading sectors to the year-on-year growth were: individuals, withR$1,212.9 million growth; industry, increasing loans to R$511.5 million; services and other,increase of R$478.9 million; and commerce, which grew R$425.7 million.
Table 06: Breakdown of Credit to Companies by Company Size R$ Million
Sep11 Jun11 Sep10 % %Size Balance % Co. % Total Balance % Co. % Total Balance % Co. % Total Sep11/ Sep11/
Portfolio Portfolio Portfolio Jun11 Sep10
Large Companies 2,610.3 28.5% 13.3% 2,383.2 27.8% 12.7% 2,494.7 34.4% 15.4% 9.5% 4.6%
Total Middle/Small/Micro 6,555.8 71.5% 33.4% 6,199.4 72.2% 33.0% 4,767.0 65.6% 29.4% 5.7% 37.5%
Middle Companies 4,890.4 53.4% 24.9% 4,648.4 54.2% 24.7% 3,346.9 46.1% 20.6% 5.2% 46.1%
Small Companies 1,300.3 14.2% 6.6% 1,210.3 14.1% 6.4% 1,152.7 15.9% 7.1% 7.4% 12.8%
Micro-companies 365.1 4.0% 1.9% 340.7 4.0% 1.8% 267.3 3.7% 1.6% 7.2% 36.6%
Total Companies 9,166.1 100.0% 46.6% 8,582.6 100.0% 45.6% 7,261.6 100.0% 44.7% 6.8% 26.2%
Table 07: Breakdown of Credit by Sector R$ Million
Sep11 Jun11 Mar11 Dec10 Sep10 Sep11/ Sep11/Jun11 Sep10
Private Sector 19,532.7 18,692.6 17,815.8 16,907.1 16,107.3 4.5% 21.3%
Rural 1,584.2 1,295.1 1,338.3 1,284.7 1,181.1 22.3% 34.1%
Industrial 3,888.4 3,833.1 3,531.8 3,504.6 3,376.9 1.4% 15.1%
Commercial 2,324.9 2,208.5 2,145.2 2,010.8 1,899.2 5.3% 22.4%
Other Services 1,791.0 1,749.5 1,709.4 1,476.5 1,312.2 2.4% 36.5%
Individuals 8,333.2 8,145.3 7,736.9 7,345.2 7,120.3 2.3% 17.0%
Housing 1,611.0 1,461.1 1,354.1 1,285.3 1,217.6 10.3% 32.3%
Public Sector 122.0 116.7 123.8 126.1 129.8 4.5% -6.0%
Government - Direct and Indirect Management 122.0 99.9 106.6 107.1 110.9 22.1% 10.0%
Corporate - Other Services 0.0 16.8 17.2 19.0 18.9 -100.0% -100.0%
Total 19,654.7 18,809.3 17,939.6 17,033.2 16,237.1 4.5% 21.0%
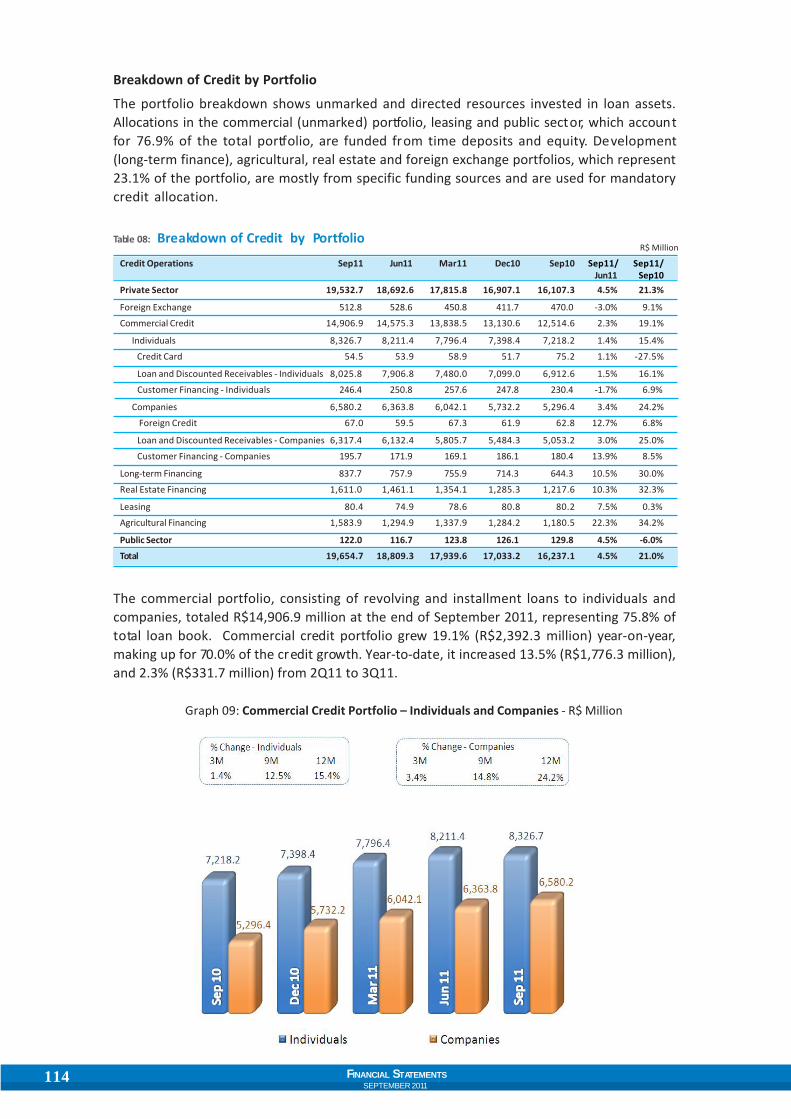
114 FINANCIAL STATEMENTSSEPTEMBER 2011
Table 08: Breakdown of Credit by PortfolioR$ Million
Credit Operations Sep11 Jun11 Mar11 Dec10 Sep10 Sep11/ Sep11/Jun11 Sep10
Private Sector 19,532.7 18,692.6 17,815.8 16,907.1 16,107.3 4.5% 21.3%
Foreign Exchange 512.8 528.6 450.8 411.7 470.0 -3.0% 9.1%
Commercial Credit 14,906.9 14,575.3 13,838.5 13,130.6 12,514.6 2.3% 19.1%
Individuals 8,326.7 8,211.4 7,796.4 7,398.4 7,218.2 1.4% 15.4%
Credit Card 54.5 53.9 58.9 51.7 75.2 1.1% -27.5%
Loan and Discounted Receivables - Individuals 8,025.8 7,906.8 7,480.0 7,099.0 6,912.6 1.5% 16.1%
Customer Financing - Individuals 246.4 250.8 257.6 247.8 230.4 -1.7% 6.9%
Companies 6,580.2 6,363.8 6,042.1 5,732.2 5,296.4 3.4% 24.2%
Foreign Credit 67.0 59.5 67.3 61.9 62.8 12.7% 6.8%
Loan and Discounted Receivables - Companies 6,317.4 6,132.4 5,805.7 5,484.3 5,053.2 3.0% 25.0%
Customer Financing - Companies 195.7 171.9 169.1 186.1 180.4 13.9% 8.5%
Long-term Financing 837.7 757.9 755.9 714.3 644.3 10.5% 30.0%
Real Estate Financing 1,611.0 1,461.1 1,354.1 1,285.3 1,217.6 10.3% 32.3%
Leasing 80.4 74.9 78.6 80.8 80.2 7.5% 0.3%
Agricultural Financing 1,583.9 1,294.9 1,337.9 1,284.2 1,180.5 22.3% 34.2%
Public Sector 122.0 116.7 123.8 126.1 129.8 4.5% -6.0%
Total 19,654.7 18,809.3 17,939.6 17,033.2 16,237.1 4.5% 21.0%
Breakdown of Credit by Portfolio
The portfolio breakdown shows unmarked and directed resources invested in loan assets.Allocations in the commercial (unmarked) portfolio, leasing and public sector, which accountfor 76.9% of the total portfolio, are funded from time deposits and equity. Development(long-term finance), agricultural, real estate and foreign exchange portfolios, which represent23.1% of the portfolio, are mostly from specific funding sources and are used for mandatorycredit allocation.
The commercial portfolio, consisting of revolving and installment loans to individuals andcompanies, totaled R$14,906.9 million at the end of September 2011, representing 75.8% oftotal loan book. Commercial credit portfolio grew 19.1% (R$2,392.3 million) year-on-year,making up for 70.0% of the credit growth. Year-to-date, it increased 13.5% (R$1,776.3 million),and 2.3% (R$331.7 million) from 2Q11 to 3Q11.
Graph 09: Commercial Credit Portfolio – Individuals and Companies - R$ Million

115
In commercial (unmarked) credit, the individuals segment totaled R$8,326.7 million at theend of September 2011, representing 55.9% of the commercial portfolio balance and 42.4% ofthe total credit balance. The companies segment, which totaled R$6,580.2 million in September2011, absorbed 44.1% of commercial credit and 33.5% of total loan book.
Long-term credit portfolio ended September 2011 with a balance of R$837.7 million, increasing30.0% (R$193.3 million) year-on-year, 17.3% (R$123.4 million) year-to-date and 10.5% (R$79.7million) quarter-on-quarter.
Real estate financing totaled R$1,611.0 million at the end of September 2011, growing 32.3%(R$393.4 million) in twelve months, 25.3% (R$325.6 million) since December 2010 and 10.3%(R$149.9 million) since 2Q11. This performance can be explained by strong market demandand by the addition of real estate financing into Banrisul’s business goals.
Rural credit totaled R$1,583.9 million in September 2011, an increase of 34.2% (R$403.4 million)year-on-year, 23.3% growth (R$299.7 million) over 4Q10 and increased 22.3% (R$289.0 million)from 2Q11 to 3Q11. Last quarter’s fast growth was influenced mainly by Banrisul’s effectiveattendance to 24 regional agricultural fairs, including the 34th Expointer (largest agriculturalfair in Latin America), and the training of 330 employees about specific products targeted toagribusiness.
The foreign exchange portfolio reached R$512.8 million in September 2011, an increase of9.1% (R$42.8 million) since September 2010, 24.5% (R$101.1 million) higher than December2010 and a decrease of 3.0% (R$15.8 million) from 2Q11 to 3Q11.
Breakdown of Credit Disbursement
The nine months of 2011 were marked by the grant of R$24,089.2 billion in credit assets, 9.9%(R$2,163.5million) higher than the same period of 2010. Credit granted through commercialcredit lines increased 7.3% (R$1,412.7 billion) year-on-year, accounting for 65.3% of the growthof the total credit concession, seconded by rural credit (increase of 57.6% or R$380.4 million),long-term financing (increase of 35.4% or R$120.6 million) and real estate credit (increase of32.0% or R$133.7 million).
During 3Q11, Banrisul provided funding for credit in the amount of R$8,231.9 million, R$616.1million above 3Q10’s disbursement. Commercial credit stood out, participating with 85.4%(R$7,032.8 million) of the total credit grant, mainly in overdraft accounts (R$1,702.9 million),guaranteed account (R$1,457.0 million) , working capital (R$1,368.3 million) and consumercredit (R$ 1,368.3 million). Agricultural lending, by increasing 124.9% (R$499.4 million), hadthe highest relative increase, reflecting the direct participation of Banrisul in fairs and regionalevents related to the agribusiness. The long-term funding increased by 64.5% (R$80.6 million)leveraged by the strategy to foster the commercialization of the BNDES Card and to providecredit for investments to large and medium enterprises.
In relation to 2Q11, credit grant shrank by R$280.7 million, especially related to personalcredit, which reduced 23.2% (R$392.3 million), offset by increasing allocation into workingcapital from by 12.5% (R$152.2 million), both related to the commercial portfolio. The long-term financing stands out for its relative increase of 82.7% (R$93.0 million), followed by andreal estate loans, which expanded by 43.6% (R$73.9 million).
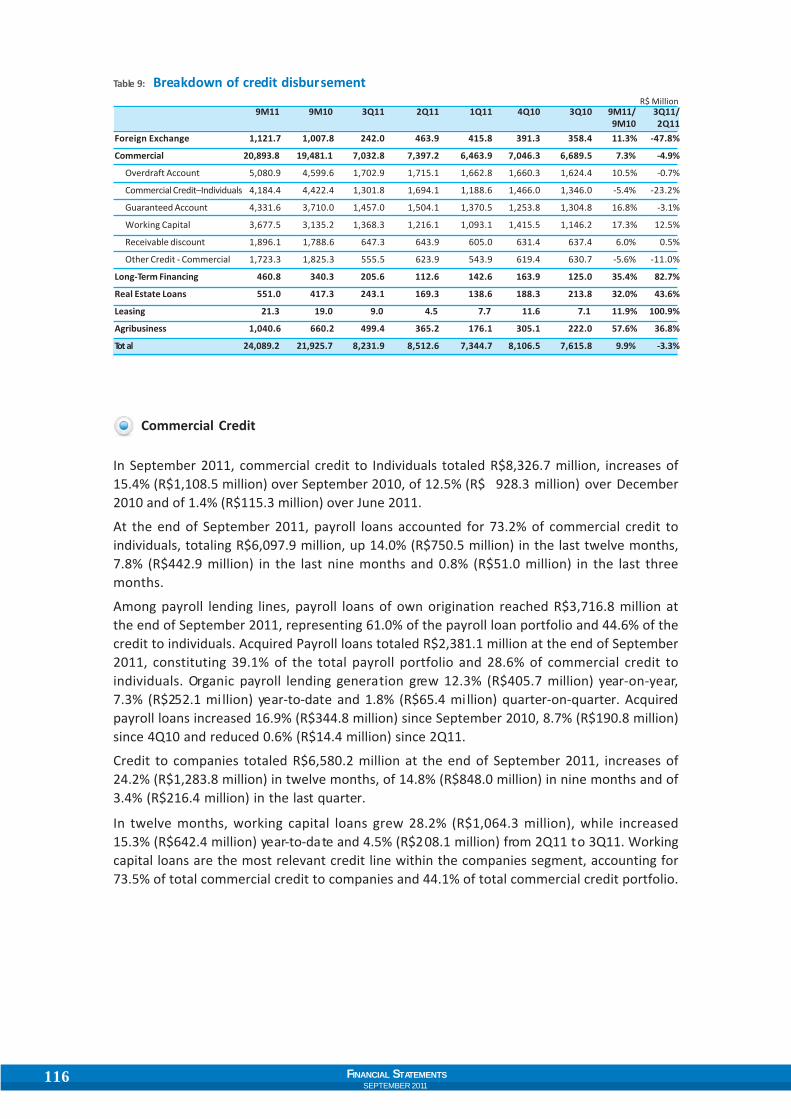
116 FINANCIAL STATEMENTSSEPTEMBER 2011
R$ Million
Table 9: Breakdown of credit disbursement
9M11 9M10 3Q11 2Q11 1Q11 4Q10 3Q10 9M11/ 3Q11/9M10 2Q11
Foreign Exchange 1,121.7 1,007.8 242.0 463.9 415.8 391.3 358.4 11.3% -47.8%
Commercial 20,893.8 19,481.1 7,032.8 7,397.2 6,463.9 7,046.3 6,689.5 7.3% -4.9%
Overdraft Account 5,080.9 4,599.6 1,702.9 1,715.1 1,662.8 1,660.3 1,624.4 10.5% -0.7%
Commercial Credit–Individuals 4,184.4 4,422.4 1,301.8 1,694.1 1,188.6 1,466.0 1,346.0 -5.4% -23.2%
Guaranteed Account 4,331.6 3,710.0 1,457.0 1,504.1 1,370.5 1,253.8 1,304.8 16.8% -3.1%
Working Capital 3,677.5 3,135.2 1,368.3 1,216.1 1,093.1 1,415.5 1,146.2 17.3% 12.5%
Receivable discount 1,896.1 1,788.6 647.3 643.9 605.0 631.4 637.4 6.0% 0.5%
Other Credit - Commercial 1,723.3 1,825.3 555.5 623.9 543.9 619.4 630.7 -5.6% -11.0%
Long-Term Financing 460.8 340.3 205.6 112.6 142.6 163.9 125.0 35.4% 82.7%
Real Estate Loans 551.0 417.3 243.1 169.3 138.6 188.3 213.8 32.0% 43.6%
Leasing 21.3 19.0 9.0 4.5 7.7 11.6 7.1 11.9% 100.9%
Agribusiness 1,040.6 660.2 499.4 365.2 176.1 305.1 222.0 57.6% 36.8%
Tot al 24,089.2 21,925.7 8,231.9 8,512.6 7,344.7 8,106.5 7,615.8 9.9% -3.3%
Commercial Credit
In September 2011, commercial credit to Individuals totaled R$8,326.7 million, increases of15.4% (R$1,108.5 million) over September 2010, of 12.5% (R$ 928.3 million) over December2010 and of 1.4% (R$115.3 million) over June 2011.
At the end of September 2011, payroll loans accounted for 73.2% of commercial credit toindividuals, totaling R$6,097.9 million, up 14.0% (R$750.5 million) in the last twelve months,7.8% (R$442.9 million) in the last nine months and 0.8% (R$51.0 million) in the last threemonths.
Among payroll lending lines, payroll loans of own origination reached R$3,716.8 million atthe end of September 2011, representing 61.0% of the payroll loan portfolio and 44.6% of thecredit to individuals. Acquired Payroll loans totaled R$2,381.1 million at the end of September2011, constituting 39.1% of the total payroll portfolio and 28.6% of commercial credit toindividuals. Organic payroll lending generation grew 12.3% (R$405.7 million) year-on-year,7.3% (R$252.1 million) year-to-date and 1.8% (R$65.4 million) quarter-on-quarter. Acquiredpayroll loans increased 16.9% (R$344.8 million) since September 2010, 8.7% (R$190.8 million)since 4Q10 and reduced 0.6% (R$14.4 million) since 2Q11.
Credit to companies totaled R$6,580.2 million at the end of September 2011, increases of24.2% (R$1,283.8 million) in twelve months, of 14.8% (R$848.0 million) in nine months and of3.4% (R$216.4 million) in the last quarter.
In twelve months, working capital loans grew 28.2% (R$1,064.3 million), while increased15.3% (R$642.4 million) year-to-date and 4.5% (R$208.1 million) from 2Q11 to 3Q11. Workingcapital loans are the most relevant credit line within the companies segment, accounting for73.5% of total commercial credit to companies and 44.1% of total commercial credit portfolio.
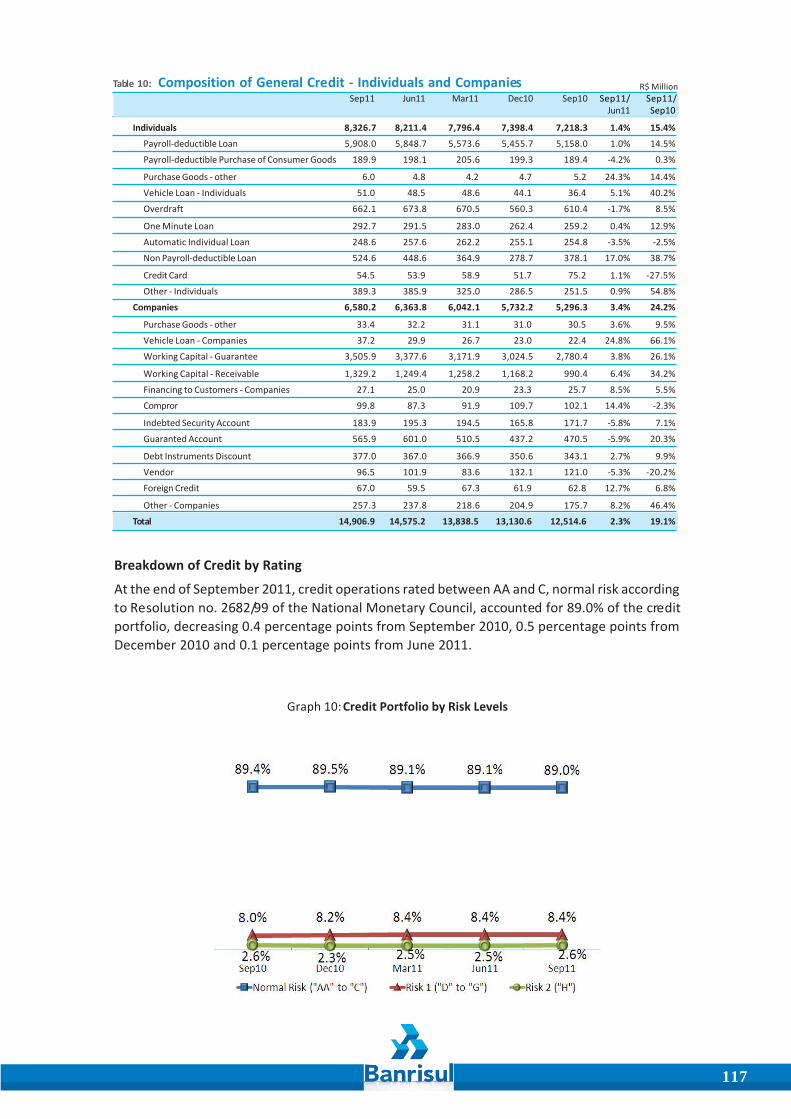
117
Breakdown of Credit by Rating
At the end of September 2011, credit operations rated between AA and C, normal risk accordingto Resolution no. 2682/99 of the National Monetary Council, accounted for 89.0% of the creditportfolio, decreasing 0.4 percentage points from September 2010, 0.5 percentage points fromDecember 2010 and 0.1 percentage points from June 2011.
Graph 10: Credit Portfolio by Risk Levels
Table 10: Composition of General Credit - Individuals and Companies R$ MillionSep11 Jun11 Mar11 Dec10 Sep10 Sep11/ Sep11/
Jun11 Sep10
Individuals 8,326.7 8,211.4 7,796.4 7,398.4 7,218.3 1.4% 15.4%
Payroll-deductible Loan 5,908.0 5,848.7 5,573.6 5,455.7 5,158.0 1.0% 14.5%
Payroll-deductible Purchase of Consumer Goods 189.9 198.1 205.6 199.3 189.4 -4.2% 0.3%
Purchase Goods - other 6.0 4.8 4.2 4.7 5.2 24.3% 14.4%
Vehicle Loan - Individuals 51.0 48.5 48.6 44.1 36.4 5.1% 40.2%
Overdraft 662.1 673.8 670.5 560.3 610.4 -1.7% 8.5%
One Minute Loan 292.7 291.5 283.0 262.4 259.2 0.4% 12.9%
Automatic Individual Loan 248.6 257.6 262.2 255.1 254.8 -3.5% -2.5%
Non Payroll-deductible Loan 524.6 448.6 364.9 278.7 378.1 17.0% 38.7%
Credit Card 54.5 53.9 58.9 51.7 75.2 1.1% -27.5%
Other - Individuals 389.3 385.9 325.0 286.5 251.5 0.9% 54.8%
Companies 6,580.2 6,363.8 6,042.1 5,732.2 5,296.3 3.4% 24.2%
Purchase Goods - other 33.4 32.2 31.1 31.0 30.5 3.6% 9.5%
Vehicle Loan - Companies 37.2 29.9 26.7 23.0 22.4 24.8% 66.1%
Working Capital - Guarantee 3,505.9 3,377.6 3,171.9 3,024.5 2,780.4 3.8% 26.1%
Working Capital - Receivable 1,329.2 1,249.4 1,258.2 1,168.2 990.4 6.4% 34.2%
Financing to Customers - Companies 27.1 25.0 20.9 23.3 25.7 8.5% 5.5%
Compror 99.8 87.3 91.9 109.7 102.1 14.4% -2.3%
Indebted Security Account 183.9 195.3 194.5 165.8 171.7 -5.8% 7.1%
Guaranted Account 565.9 601.0 510.5 437.2 470.5 -5.9% 20.3%
Debt Instruments Discount 377.0 367.0 366.9 350.6 343.1 2.7% 9.9%
Vendor 96.5 101.9 83.6 132.1 121.0 -5.3% -20.2%
Foreign Credit 67.0 59.5 67.3 61.9 62.8 12.7% 6.8%
Other - Companies 257.3 237.8 218.6 204.9 175.7 8.2% 46.4%
Total 14,906.9 14,575.2 13,838.5 13,130.6 12,514.6 2.3% 19.1%
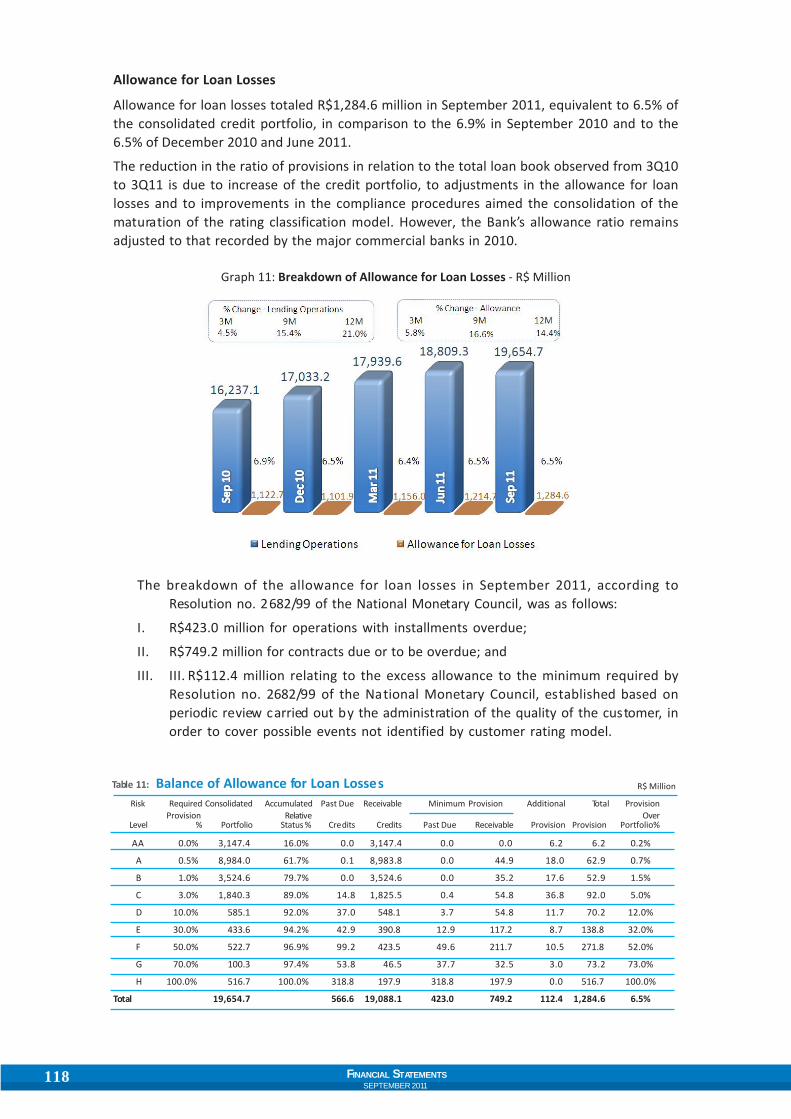
118 FINANCIAL STATEMENTSSEPTEMBER 2011
Allowance for Loan Losses
Allowance for loan losses totaled R$1,284.6 million in September 2011, equivalent to 6.5% ofthe consolidated credit portfolio, in comparison to the 6.9% in September 2010 and to the6.5% of December 2010 and June 2011.
The reduction in the ratio of provisions in relation to the total loan book observed from 3Q10to 3Q11 is due to increase of the credit portfolio, to adjustments in the allowance for loanlosses and to improvements in the compliance procedures aimed the consolidation of thematuration of the rating classification model. However, the Bank’s allowance ratio remainsadjusted to that recorded by the major commercial banks in 2010.
Graph 11: Breakdown of Allowance for Loan Losses - R$ Million
The breakdown of the allowance for loan losses in September 2011, according toResolution no. 2682/99 of the National Monetary Council, was as follows:
I. R$423.0 million for operations with installments overdue;
II. R$749.2 million for contracts due or to be overdue; and
III. III. R$112.4 million relating to the excess allowance to the minimum required byResolution no. 2682/99 of the National Monetary Council, established based onperiodic review carried out by the administration of the quality of the customer, inorder to cover possible events not identified by customer rating model.
R$ MillionTable 11: Balance of Allowance for Loan LossesRisk Required Consolidated Accumulated Past Due Receivable Minimum Provision Additional Total Provision
Provision Relative OverLevel % Portfolio Status % Credits Credits Past Due Receivable Provision Provision Portfolio%
AA 0.0% 3,147.4 16.0% 0.0 3,147.4 0.0 0.0 6.2 6.2 0.2%
A 0.5% 8,984.0 61.7% 0.1 8,983.8 0.0 44.9 18.0 62.9 0.7%
B 1.0% 3,524.6 79.7% 0.0 3,524.6 0.0 35.2 17.6 52.9 1.5%
C 3.0% 1,840.3 89.0% 14.8 1,825.5 0.4 54.8 36.8 92.0 5.0%
D 10.0% 585.1 92.0% 37.0 548.1 3.7 54.8 11.7 70.2 12.0%
E 30.0% 433.6 94.2% 42.9 390.8 12.9 117.2 8.7 138.8 32.0%
F 50.0% 522.7 96.9% 99.2 423.5 49.6 211.7 10.5 271.8 52.0%
G 70.0% 100.3 97.4% 53.8 46.5 37.7 32.5 3.0 73.2 73.0%
H 100.0% 516.7 100.0% 318.8 197.9 318.8 197.9 0.0 516.7 100.0%
Total 19,654.7 566.6 19,088.1 423.0 749.2 112.4 1,284.6 6.5%

119
Cover Ratio
The cover ratio, the percentage between theallowance for loan losses and the balance ofoperations overdue that do not generate revenue,shows the capacity to cover defaults withprovisions remains at comfortable levels. The coverratio to credit operations overdue for more than60 days of 226.7% in September 2011 is bellow the230.1% recorded in September 2010, below the263.6% observed in December 2010 and is lowerthan the 243.5% presented in June 2011. The coverratio recorded in 3Q11 is, however, comfortable,attesting Banrisul's conservative approach tomanaging credit risk. Cover ratio for operations overdue for more than 90 days reached 270.1%in September 2011, 0.8 percentage points above the 269.3% of September 2010.
Default Ratio
The 2.9% default ratio over 60 days inSeptember 2011 decreased 0.1 percentagepoints from the default rate verified inSeptember 2010, increased 0.4 percentagepoints in relation to December 2010 andslightly increased (0.2 percentage points)in relation to June 2011.
The 2.4% 90-day default ratio in September2011 decreased 0.15 percentage points fromthe default rate verified in September 2010,increased 0.24% in relation to December2010 and increased 0.12 percentage pointsin relation to June 2011.
Focused on leveraging lower risk portfolios, the risk management policy adopted by Banrisulproved to be adequate, given the stable behavior of default loans over 60 days seen in thepast twelve months, period in which the loan book increased 21.0%.
Graph 12: Cover Ratio(over 60 days overdue)
Graph 13: Default Ratio

120 FINANCIAL STATEMENTSSEPTEMBER 2011
Funds Raised and Under Management
Funds raised and under management totaled R$27,505.3 million at the end of September2011, 14.2% (R$3,410.2 million) higher than September 2010, 9.6% (R$2,414.5 million) higherthan December 2010 and 5.4% (R$1,412.6 million) above the balance of June 2011.
The growth in twelve months came mainly from increases in time and demand deposits. Innine months, the balance of time deposits and surpassed the reduction in demand andsavings deposits. The growth in the last quarter was driven by time deposits and third-partyinvestment funds.
Graph 14: Funds Raised and Under Management - R$ Million
Demand Deposits
Demand deposits, which make up 9.3% of the total funding, reached R$2,556.0 million at theend of September 2011, 21.2% (R$447.0 million) over September 2010, 32.4% (R$1,224.0million) below December 2010 and 5.2% (R$139.1 million) under June 2011. The year-on-year growth seen in demand deposits is due to changes to the Poupança Integrada product(a savings account linked to the customer’s checking account) introduced in October 2010that provoked the migration of resources to demand deposits. The reduction observed inrelation to December 2010 is due to the base of comparison (year-end is a period of higherseasonal income). As to the changes observed from June 2011, they demonstrate the strategyof migrating resources from demand deposits into time deposits.
Savings Accounts
Savings deposits totaled R$5,072.24 million at the end of September 2011, 19.4% (R$1,223.3million) below September 2010, 9.1% (R$507.6 million) below December 2010 and 1.7% (R$86.4million) below June 2011. The savings deposits account for 18.4% of funds raised and managed.The migration of resources from savings deposits reflects the discontinuity of the PoupançaIntegrada (with the automatic transfer feature from demand deposits into a savings accountlinked to the customer's checking account) and also the strategy of directing funding intotime deposits.

121
T ime Deposits
Time deposits represent 48.2% of the total funds raised and under management. At the endof September 2011, time deposits totaled R$13,269.4 million, an increase of 39.2% (R$3,736.4million) over September 2010, 37.1% (R$3,589.0 million) higher than December 2010 and11.2% (R$1,333.0 million) over June 2011. The expansion observed in twelve months, year-to-date and in the last quarter reflects particularly the startup of a specific time depositproduct that replace the Poupança Integrada , improving its attractiveness.
Assets under Management
Assets under management totaled R$6,595.2 million at the end of September 2011, 7.4%(R$454.1 million) higher than in September 2010. Year-to-date, they grew 9.2% (R$454.1million), and added R$303.4 million in the last quarter, especially by the expansion of fixedincome funds.
Cost of Funding
The upward trend of Banrisul's average funding cost reflects the movement of the basicinterest rate in 3Q11, which indexes the remuneration paid to customers. The average cost offunding increased in the quarters, up again to 2.21% in 3Q11, above the 2.09% of 2Q11 and ofthe 1.95% of 3Q10.
The share of the average balance of time deposits in total funds reached 57.4%, up 3.4percentage points in relation to 2Q11 and 10.4 percentage points higher than in 3Q10, mainlydue to the availability of new types of Time Deposits at the end of 2010.
The cost of funding as proportion of the Selic rate decreases on the last twelve months: from74.63% in 3Q10 to 74.21% in 2Q11 to 72.70% in 3Q11. Even though Banrisul's average nominalcost increased in the quarters following the upward movement of the Selic rate, it grewrelatively less than the interest rate.
As to time deposits, the quarterly accumulated interest rates (2.39% in 3Q10, 2.49% in 2Q11and 2.57% in 3Q11) demonstrate the trend of the Selic. The cost of funding for time deposits- as a proportion of the effective Selic rate - decreased during the last twelve months, speciallyinfluenced by the dispersion of Banrisul's customer funding base: from 91.18% in 3Q10, itdecreased to 88.52% in 2Q11 and reached 84.57% in 3Q11.
Though the average balance of repurchase agreements reduced in relation to 3Q10 and 2Q11,cost increased from 2.87% in 3Q10 to 3.09% in 2Q11 and to 3.22% in 3Q11, accompanying theevolution of the interbank deposit rate (DI) that benchmarks these operations.
R$ MillionTable 12: Funding Composition
Sep11 Jun11 Mar11 Dec10 Sep10 Sep11/ Sep11/Jun11 Sep10
Deposits 20,910.1 19,800.9 19,062.2 19,053.0 17,954.1 5.6% 16.5%
Time Deposits 13,269.4 11,936.4 10,935.0 9,680.3 9,533.0 11.2% 39.2%
Demand Deposits 2,556.0 2,695.1 2,778.5 3,779.9 2,108.9 -5.2% 21.2%
Saving Account 5,072.4 5,158.8 5,336.7 5,580.0 6,295.7 -1.7% -19.4%
Other Deposits 12.4 10.7 12.0 12.8 16.5 15.5% -24.9%
Assets under Management 6,595.2 6,291.8 6,227.6 6,037.8 6,141.1 4.8% 7.4%
Total 27,505.3 26,092.7 25,289.8 25,090.8 24,095.2 5.4% 14.2%

122 FINANCIAL STATEMENTSSEPTEMBER 2011
R$ Million and %Table 13: Cost of Funding3Q11 2Q11 3Q10
Average Accumulated Average Average Accumulated Average Average Accumulated AverageBalance Expense Cost Balance Expense Cost Balance Expense Cost
Demand Deposits 2,538.2 2,703.3 2,074.4
Saving Deposits 5,094.0 (95.6) 1.88% 5,200.8 (92.0) 1.77% 6,208.8 (95.3) 1.54%Time Deposits 12,836.5 (329.3) 2.57% 11,578.0 (288.6) 2.49% 9,321.8 (222.6) 2.39%
Interbank Deposits 11.4 (0.3) 2.91% 10.8 (0.3) 3.05% 28.0 (0.3) 1.08%Credit Guarantee Fund Expenses 0.0 (7.5) 0.0 (7.3) 0.0 (6.6)
Matched Transactions 1,864.1 (60.1) 3.22% 1,927.4 (59.5) 3.09% 2,180.1 (62.6) 2.87%
Payable for Financial andDevelopment Funds 2.7 2.4 2.1 (0.0)
Investment Deposits 1.0 0.5 7.1 0.0Total Average Balance/Total Expenses 22,347.9 (492.9) 2.21% 21,423.0 (447.8) 2.09% 19,822.3 (387.5) 1.95%
Selic 3.03% 2.82% 2.62%
Average Cost / Selic 72.70% 74.21% 74.63%Cost of Time Deposits / Selic 84.57% 88.52% 91.18%
Graph 15: Cost of Funding as % of Selic Rate
Shareholders’ Equity
At the end of September 2010, Banrisul’s shareholders’ equity was R$4,298.1 million, 14.7%(R$551.8 million) over September 2010, 11.5% (R$442.9 million) over December 2010 and 4.4%(R$180.0 million) higher than in June 2011. The changes in shareholders’ equity are related tothe incorporation of the net income by the payment of dividends and interest on equity.
Graph 16: Shareholders’ Equity - R$ Million
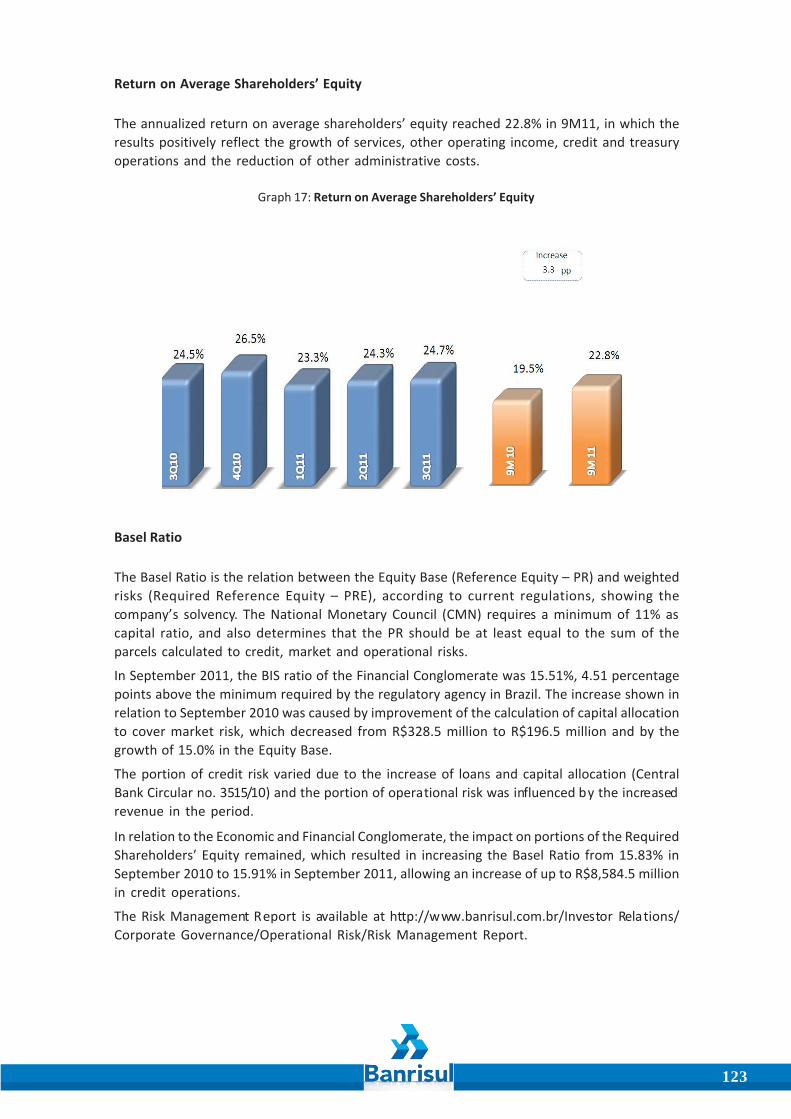
123
Return on Average Shareholders’ Equity
The annualized return on average shareholders’ equity reached 22.8% in 9M11, in which theresults positively reflect the growth of services, other operating income, credit and treasuryoperations and the reduction of other administrative costs.
Graph 17: Return on Average Shareholders’ Equity
Basel Ratio
The Basel Ratio is the relation between the Equity Base (Reference Equity – PR) and weightedrisks (Required Reference Equity – PRE), according to current regulations, showing thecompany’s solvency. The National Monetary Council (CMN) requires a minimum of 11% ascapital ratio, and also determines that the PR should be at least equal to the sum of theparcels calculated to credit, market and operational risks.
In September 2011, the BIS ratio of the Financial Conglomerate was 15.51%, 4.51 percentagepoints above the minimum required by the regulatory agency in Brazil. The increase shown inrelation to September 2010 was caused by improvement of the calculation of capital allocationto cover market risk, which decreased from R$328.5 million to R$196.5 million and by thegrowth of 15.0% in the Equity Base.
The portion of credit risk varied due to the increase of loans and capital allocation (CentralBank Circular no. 3515/10) and the portion of operational risk was influenced by the increasedrevenue in the period.
In relation to the Economic and Financial Conglomerate, the impact on portions of the RequiredShareholders’ Equity remained, which resulted in increasing the Basel Ratio from 15.83% inSeptember 2010 to 15.91% in September 2011, allowing an increase of up to R$8,584.5 millionin credit operations.
The Risk Management Report is available at http://www.banrisul.com.br/Investor Relations/Corporate Governance/Operational Risk/Risk Management Report.

124 FINANCIAL STATEMENTSSEPTEMBER 2011
Graph 18: Basel Ratio
Pace of Growth
The pace of growth in time deposits and commercial credit, measured by the relative growthin volumes, is shown in the following graph, and demonstrates the effects of economicmeasures and the strategies internally adopted to manage Banrisul’s assets and liabilities.The 19.1% growth in commercial credit in the twelve months ended in September 2011followed suit the increase the total deposits in 16.5%, yet reducing in relation to the 39.2%year-on-year growth in time deposits. Credit has reduced speed in relation to the 12-monthgrowth rate of 29.6% presented in 3Q10, especially after the credit inhibiting macro-prudentialmeasures at the end of 2010, while the increase of time deposits demonstrates the changesmade since October 2010 to products offered to customers.
Even so, Banrisul’s credit growth has outperformed the loan growth rates reported quarterlyby the banking industry year-to-date and in the last twelve months. Loan book grew 21.0%from 3Q10 to 3Q11, 15.4% year-to-date and 4.5% quarter-on-quarter. The banking industry inBrazil grew 19.6%, 13.1% and 5.1% in those same periods, respectively, according to data fromthe Central Bank of Brazil.
Graph 19: Pace of Growth - Credit and Funding

125
Evolution of Income Statement AccountsNet Income
Banrisul’s net income of R$677.7 million in 3Q11 is 32.5% (R$166.3 million) aboveSeptember 2010. In 3Q11, net income was R$239.2 million, 15.9% (R$32.8 million) higher thanin 3Q10 and 5.3% (R$12.0 million) higher than 2Q11.
From 3Q10 to 3Q11, the Bank’s performance positively reflects the increase of 24.3% (R$617.5million) in credit revenues, the increase of 17.4% (R$137.6 million) in treasury income, thegrowth of revenue from exchange operations of R$77.0 million and the increase of 10.5%(R$49.2 million) in services fees. On the negative side, net income was affected by the increaseof 30.4% (R$310.8 million) in market funding expenses, the increase of 60.6% (R$231.0 million)in credit and onlendings expenses and the increase of 5.3% (R$67.0 million) in administrativecosts.
From 3Q10 to 3Q11, the Bank’s performance positively reflects the increase of 20.2% (R$248.5million) in credit and treasury revenues, the increase of R$95.2 million in revenue fromexchange and the increase of 7.2% (R$11.5 million) in services fees. On the negative side, netincome was affected by the increase of 50.1% (R$265.7 million) in market funding andonlendings expenses and the increase of 63.9% (R$71.1 million) in expenses with provisionsfor credit.
From 2Q11 to 3Q11, the Bank’s performance positively reflects the increase of R$97.1 millionin revenue from exchange operations, of 8.9% (R$93.4 million) in credit revenues and theincrease of 6.4% (R$20.2 million) in treasury revenues. On the negative side, net income wasaffected by the increase of 93.9% (R$146.7 million) in credit and onlendings expenses, theincrease of 10.1% (R$45.1 million) in market funding expenses, the increase of 27.4% (R$39.2million) in credit provision expenses and the increase of 8.4% (R$37.1 million) in administrativeexpenses.
Graph 20: Net Income - R$ Million
Financial Income
Financial income totaled R$4,405.3 million in 9M11, 24.7% (R$873.8 million) above the amountregistered in 9M10. In 3Q11, financial income totaled R$1,668.9 million, 28.6% (R$370.7 million)higher than the amount of 3Q10, and 16.2% (R$232.4 million) higher than 2Q11.
The growth of financial income from 3Q10 to 3Q11 is related to the R$617.9 million growth incredit revenues, on account of increasing credit operations, the increase of R$77.0 million in
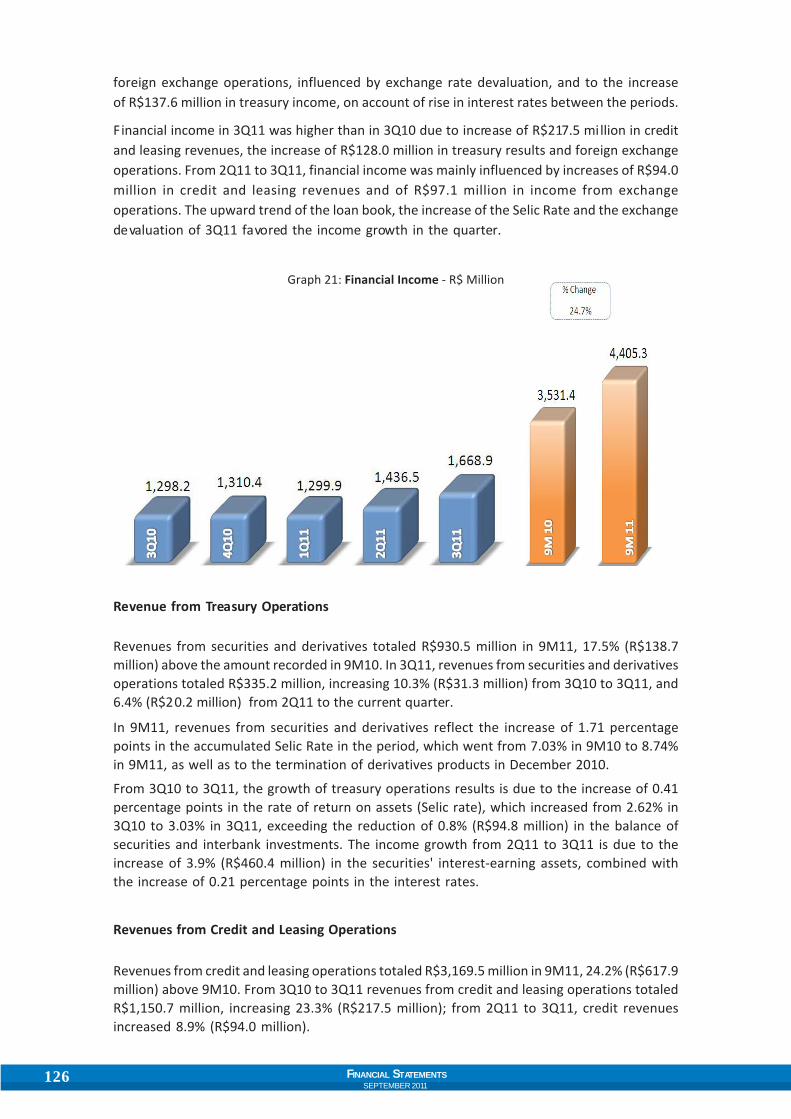
126 FINANCIAL STATEMENTSSEPTEMBER 2011
foreign exchange operations, influenced by exchange rate devaluation, and to the increaseof R$137.6 million in treasury income, on account of rise in interest rates between the periods.
Financial income in 3Q11 was higher than in 3Q10 due to increase of R$217.5 million in creditand leasing revenues, the increase of R$128.0 million in treasury results and foreign exchangeoperations. From 2Q11 to 3Q11, financial income was mainly influenced by increases of R$94.0million in credit and leasing revenues and of R$97.1 million in income from exchangeoperations. The upward trend of the loan book, the increase of the Selic Rate and the exchangedevaluation of 3Q11 favored the income growth in the quarter.
Graph 21: Financial Income - R$ Million
Revenue from Treasury Operations
Revenues from securities and derivatives totaled R$930.5 million in 9M11, 17.5% (R$138.7million) above the amount recorded in 9M10. In 3Q11, revenues from securities and derivativesoperations totaled R$335.2 million, increasing 10.3% (R$31.3 million) from 3Q10 to 3Q11, and6.4% (R$20.2 million) from 2Q11 to the current quarter.
In 9M11, revenues from securities and derivatives reflect the increase of 1.71 percentagepoints in the accumulated Selic Rate in the period, which went from 7.03% in 9M10 to 8.74%in 9M11, as well as to the termination of derivatives products in December 2010.
From 3Q10 to 3Q11, the growth of treasury operations results is due to the increase of 0.41percentage points in the rate of return on assets (Selic rate), which increased from 2.62% in3Q10 to 3.03% in 3Q11, exceeding the reduction of 0.8% (R$94.8 million) in the balance ofsecurities and interbank investments. The income growth from 2Q11 to 3Q11 is due to theincrease of 3.9% (R$460.4 million) in the securities' interest-earning assets, combined withthe increase of 0.21 percentage points in the interest rates.
Revenues from Credit and Leasing Operations
Revenues from credit and leasing operations totaled R$3,169.5 million in 9M11, 24.2% (R$617.9million) above 9M10. From 3Q10 to 3Q11 revenues from credit and leasing operations totaledR$1,150.7 million, increasing 23.3% (R$217.5 million); from 2Q11 to 3Q11, credit revenuesincreased 8.9% (R$94.0 million).

127
The year-to-date increase in credit revenues reflects the growth of R$3,417.6 million in creditassets. Credit revenues were positively impacted by revenues from commercial credit, whichincreased 24.8% (R$577.4 million), by the growth of 28.9% (R$26.0 million) in revenues fromreal estate loans, by the increase of 24.1% (R$13.0 million) in revenues from agricultural loansand by the R$39.2 million increase in foreign exchange revenues, on account of exchangedevaluation observed in the last quarter.
From 3Q10 to 3Q11, credit revenues increased on account of loan growth and higher interestrates. The increase in revenues credit was driven by the growth of 22.0% (R$184.1 million) incommercial credit revenues, by the growth of R$47.6 million in revenues from long termfinance in foreign currency, by the growth of 33.0% (R$10.7 million) in income from real estateloans, and the increase of 25.4% (R$4.9 million) in revenues from agricultural lending, helpingoffset lower credit recovery income (reduction of R$25.9 million).
From 2Q11 to 3Q11, credit revenues trend especially reflected the positive variations inrevenues from commercial credit, which increased 5.2% (R$50.9 million) quarter-on-quarter,the increase of 12.9% (R$25.0 million) in revenues from real estate and agricultural loans, andincome of R$53.0 million on long-term financing in foreign currency, deducted by the lowerrecovery of written-off loans in R$23.9 million.
Graph 22: Revenues from Credit and Leasing Operations - R$ Million
Revenues from Commercial Credit - Individuals and Companies
During the nine months of 2011, revenues from commercial credit to individuals totaledR$2,903.1 million, 24.8% (R$577.4 million) higher than during 9M10. In 3Q11, revenues fromcommercial credit reached R$1,021.1 million, 22.0% (R$184.1 million) higher than in 3Q10, and5.2% (R$50.9 million) above the amount registered during 2Q11.
From 9M10 to 9M11, revenues from commercial credit resulted from the 20.3% (R$310.0 million)growth in revenue from individual commercial credit, influenced mainly from the growth ofR$138.7 million, in payroll loans and of R$75.5 million in overdraft accounts. As to thecommercial credit to companies the increase of 33.4% (R$267.3 million) was originated mainlyfrom the R$173.1 million increase in working capital lines and by the R$61.5 million inguaranteed account. During the nine months of 2011, revenues from commercial credit toIndividuals represented 63.2% of total commercial credit revenues; Companies, 36.8%. Thecredit revenues from commercial credit to Individuals accounted for 58.1% of the total creditrevenues, while revenues from commercial credit to Companies represented 33.8%.

128 FINANCIAL STATEMENTSSEPTEMBER 2011
From 3Q10 to 3Q11, the revenue from commercial credit to individuals grew 16.4% (R$89.5million) and revenues from corporate business segment registered an increase of 32.4%(R$94.5 million). The expansion of commercial credit is grounded in four main credit lines:payroll loans and overdrafts, which added R$57.9 million of additional revenue to theindividual segment, and working capital and guaranteed account, which totaled R$82.9 million,influenced by credit expansion.
From 2Q11 to 3Q11, the increase in revenues from commercial credit to individuals, whichincreased 2.8% (R$17.4 million), is due to growth of R$115.3 million in the balance ofoperations, while interest rates were maintained stable. As for the companies segment, the9.5% (R$33.4 million) growth was due to the increase of R$216.4 million in portfolio volumeand to the increase observed in the average interest rates.
The average commercial credit interest rates increased from 2.22% in 9M10 to 2.26% in 9M11.The upward trend of the average interest rates was directly influenced by credit operationsto companies with floating rates linked to the Selic Rate, which reached 8.74% in the ninemonths of 2011, 1.71 percentage points above the 7.03% of the same period of 2010. Averageinterest rates charged to Individuals remained practically unchanged.
From 3Q10 to 3Q11, the average monthly interest rates of 2.27% on commercial credit remainunchanged, influenced by adjustments in credit lines to Companies, whose interest rateswere altered due to increase of 500 base points of Selic Rate in the months of July and Augustof 2011, and also to reproduce its subsequent similar decrease in September 2011.
R$ MillionTable 14: Revenues from Commercial Credit - Individuals and Companies
9M11 9M10 3Q11 2Q11 1Q11 4Q10 3Q10 9M11/9M10
Individuals 1,835.8 1,525.8 635.1 617.7 583.1 563.9 545.6 20.3%
Payroll-deductible Loan 888.6 757.8 308.8 296.7 283.0 275.9 263.9 17.3%Payroll-deductible Purchase of
Consumer Goods 26.7 18.9 8.6 9.0 9.1 8.8 7.5 41.4%Purchase Goods - other 0.4 0.3 0.2 0.1 0.1 0.1 0.1 20.9%
Vehicle Loan - Individuals 7.8 4.9 2.7 2.6 2.5 2.2 1.9 59.0%
Overdraft 468.4 392.8 156.0 158.5 153.9 144.2 144.1 19.2%
One Minute Loan 140.9 109.2 48.9 47.7 44.3 42.5 40.4 29.0%
Automatic Individual Loan 113.8 96.6 37.6 38.4 37.8 37.2 35.9 17.7%
Non Payroll-deductible Loan 114.5 90.2 45.4 38.6 30.4 31.8 32.8 26.9%
Credit Card 36.1 35.0 12.2 12.4 11.6 12.6 11.4 3.0%
Other - Individuals 38.7 20.0 14.7 13.6 10.3 8.6 7.7 93.2%
Companies 1,067.3 800.0 385.9 352.6 328.8 307.3 291.4 33.4%
Purchase Goods - other 4.7 3.6 1.7 1.6 1.5 1.4 1.3 29.6%
Vehicle Loan - Companies 5.0 3.2 2.0 1.6 1.4 1.3 1.2 57.8%
Working Capital - Guarantee 465.6 365.7 170.7 151.3 143.6 138.2 131.2 27.3%
Working Capital - Receivable 176.8 103.5 63.1 57.4 56.4 48.4 40.7 70.8%
Financing to Customers - Companies 6.0 5.7 2.3 2.0 1.7 1.6 1.7 5.3%
Compror 13.2 15.9 4.7 4.4 4.1 4.7 4.5 -17.3%
Indebted Security Account 28.2 22.9 9.4 9.8 8.9 8.1 8.0 23.0%
Guaranted Account 257.3 195.7 93.1 87.2 77.0 70.1 72.0 31.4%
Debt Instruments Discount 68.3 54.8 23.9 22.9 21.5 20.8 19.9 24.6%
Vendor 11.7 10.8 4.0 4.0 3.7 4.8 3.9 8.7%
Foreign Credit 2.3 1.5 1.0 0.6 0.7 0.6 0.6 58.3%
Other - Companies 28.3 16.5 10.0 9.8 8.5 7.4 6.4 70.9%
Total 2,903.1 2,325.8 1,021.0 970.2 911.9 871.2 837.1 24.8%
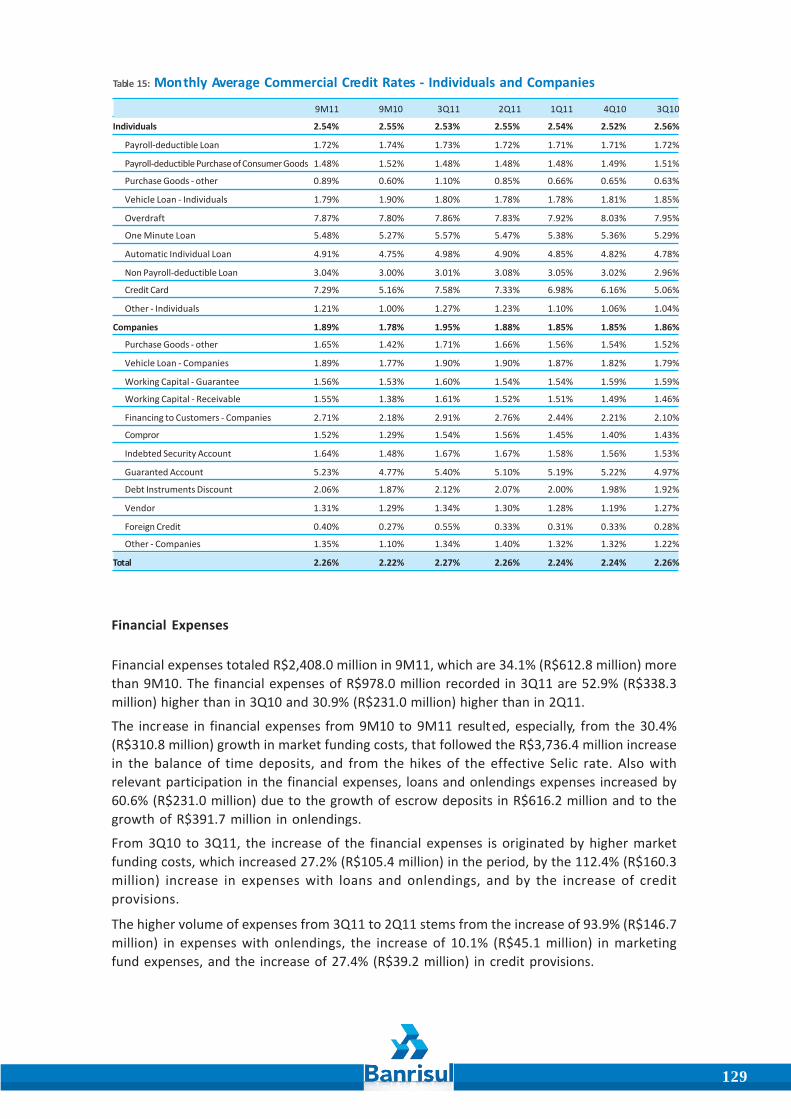
129
Financial Expenses
Financial expenses totaled R$2,408.0 million in 9M11, which are 34.1% (R$612.8 million) morethan 9M10. The financial expenses of R$978.0 million recorded in 3Q11 are 52.9% (R$338.3million) higher than in 3Q10 and 30.9% (R$231.0 million) higher than in 2Q11.
The increase in financial expenses from 9M10 to 9M11 resulted, especially, from the 30.4%(R$310.8 million) growth in market funding costs, that followed the R$3,736.4 million increasein the balance of time deposits, and from the hikes of the effective Selic rate. Also withrelevant participation in the financial expenses, loans and onlendings expenses increased by60.6% (R$231.0 million) due to the growth of escrow deposits in R$616.2 million and to thegrowth of R$391.7 million in onlendings.
From 3Q10 to 3Q11, the increase of the financial expenses is originated by higher marketfunding costs, which increased 27.2% (R$105.4 million) in the period, by the 112.4% (R$160.3million) increase in expenses with loans and onlendings, and by the increase of creditprovisions.
The higher volume of expenses from 3Q11 to 2Q11 stems from the increase of 93.9% (R$146.7million) in expenses with onlendings, the increase of 10.1% (R$45.1 million) in marketingfund expenses, and the increase of 27.4% (R$39.2 million) in credit provisions.
Table 15: Monthly Average Commercial Credit Rates - Individuals and Companies
9M11 9M10 3Q11 2Q11 1Q11 4Q10 3Q10
Individuals 2.54% 2.55% 2.53% 2.55% 2.54% 2.52% 2.56%
Payroll-deductible Loan 1.72% 1.74% 1.73% 1.72% 1.71% 1.71% 1.72%
Payroll-deductible Purchase of Consumer Goods 1.48% 1.52% 1.48% 1.48% 1.48% 1.49% 1.51%
Purchase Goods - other 0.89% 0.60% 1.10% 0.85% 0.66% 0.65% 0.63%
Vehicle Loan - Individuals 1.79% 1.90% 1.80% 1.78% 1.78% 1.81% 1.85%
Overdraft 7.87% 7.80% 7.86% 7.83% 7.92% 8.03% 7.95%
One Minute Loan 5.48% 5.27% 5.57% 5.47% 5.38% 5.36% 5.29%
Automatic Individual Loan 4.91% 4.75% 4.98% 4.90% 4.85% 4.82% 4.78%
Non Payroll-deductible Loan 3.04% 3.00% 3.01% 3.08% 3.05% 3.02% 2.96%
Credit Card 7.29% 5.16% 7.58% 7.33% 6.98% 6.16% 5.06%
Other - Individuals 1.21% 1.00% 1.27% 1.23% 1.10% 1.06% 1.04%
Companies 1.89% 1.78% 1.95% 1.88% 1.85% 1.85% 1.86%
Purchase Goods - other 1.65% 1.42% 1.71% 1.66% 1.56% 1.54% 1.52%
Vehicle Loan - Companies 1.89% 1.77% 1.90% 1.90% 1.87% 1.82% 1.79%
Working Capital - Guarantee 1.56% 1.53% 1.60% 1.54% 1.54% 1.59% 1.59%
Working Capital - Receivable 1.55% 1.38% 1.61% 1.52% 1.51% 1.49% 1.46%
Financing to Customers - Companies 2.71% 2.18% 2.91% 2.76% 2.44% 2.21% 2.10%
Compror 1.52% 1.29% 1.54% 1.56% 1.45% 1.40% 1.43%
Indebted Security Account 1.64% 1.48% 1.67% 1.67% 1.58% 1.56% 1.53%
Guaranted Account 5.23% 4.77% 5.40% 5.10% 5.19% 5.22% 4.97%
Debt Instruments Discount 2.06% 1.87% 2.12% 2.07% 2.00% 1.98% 1.92%
Vendor 1.31% 1.29% 1.34% 1.30% 1.28% 1.19% 1.27%
Foreign Credit 0.40% 0.27% 0.55% 0.33% 0.31% 0.33% 0.28%
Other - Companies 1.35% 1.10% 1.34% 1.40% 1.32% 1.32% 1.22%
Total 2.26% 2.22% 2.27% 2.26% 2.24% 2.24% 2.26%

130 FINANCIAL STATEMENTSSEPTEMBER 2011
Graph 23: Financial Expenses - R$ Million
Expenses with Market Funding Operations
Market funding expenses totaled R$1,332.2 million in 9M11, 30.4% (R$310.8 million) higherthan in 9M10. In comparison to 3Q10, fund raising expenses of R$492.9 million in 3Q11 increased27.2% (R$105.4 million). From 2Q11 to 3Q11, market funding expenses increased 10.1% (R$45.1million).
The growth in fund raising expenses from 9M10 to 9M11 came from the 48.4% (R$275.0 million)increase in time deposits expenses, on account of the higher balance and of the evolution ofthe effective Selic Rate, and from the 3.8% (R$6.1 million) increase in interbank matchedtransactions, besides the growth from 0.47% to 0.99% in the Reference Rate (TR), whichhelped increase expenses with savings deposits by 8.7% (R$22.3 million), despite their balancehaving reduced by 19.4% (R$1,223.3 million).
From 3Q10 to 3Q11, market fund expenses increased on account of the raising of 0.41percentage points in the Selic Rate, increasing expenses with time deposits in 48.6% (R$105.5million), offset by reduction of 4.0% (R$2.5 million) in matched transactions. Time depositsexpenses were influenced by the growth of R$3,736.4 million in time deposits and decreaseof R$651.9 million in matched transactions balance in twelve months.
From 2Q11 and 3Q11, the higher amount of market fund expenses is due to the increase ofR$1,333.0 million in funding from time deposits that, together with the Selic rate reaching3.03% in 3Q11, a 0.21 percentage points increase over the 2.82% registered in 2Q11, explainsthe growth of 14.3% (R$40.3 million) in time deposits expenses.
Graph 24: Expenses with Market Funding Operations - R$ Million

131
Expenses with Borrowings and Onlendings
The expenses with borrowings and onlendings totaled R$612.0 million in 9M11, a 60.6% (R$231.0million) increase above 9M10. The R$302.8 million expenses with borrowings and onlendingsrecorded in 3Q11 represent increases of 112.4% (R$160.3 million) from 2Q11 to 3Q11 and of93.9% (R$146.7 million) from 2Q11 to 3Q11.
In the nine months of 2011, the evolution of the borrowings and onlendings expenses isexplained by expenses with borrowing from foreign banks, in the amount of R$121.7 million,the 32.7% (R$96.6 million) growth of costs with escrow deposits and by the increase of 121.8%(R$23.7 million) in onlendings under the Finame (Financiamento de Máquinas e Equipamentos– capital goods long term credit lines from BNDES) program.
From 3Q10 to 3Q11, the increase in expenses stemmed from the growth of 11.3% in foreignexchange during the last quarter, from the 2.7% recorded in 2Q11, which led to the expansionof R$140.7 million in the costs of foreign onlendings, and the increase of the Selic rate, whichwent from 2.62% in 3Q10 to 3.03% in 3Q11, which led to an increase of 26.8% (R$30.2 million)in the expenses with onlendings and escrow deposits.
From 2Q11 to 3Q11, the bulk of expenses were originated by the R$141.1 million increase inonlendings from foreign bankers, driven by the currency devaluation of 18.79% in 3Q11, in anopposite direction from the currency appreciation of 4.15% in 2Q11. Increasing 9.3% (R$12.1million) driven by the hike of the Selic Rate, costs with escrow deposits were offset by the81.5% (R$14.5 million) drop in expenses with Finame onlendings, due to the completion, inAugust 2011, of booking adjustments to the Pronaf (Programa Nacional de Fortalecimento daAgricultura Familiar, or National Program for Supporting Family Farming) program.
Allowance for Loan Losses
In 9M11, expenses with loan losses allowance totaled R$463.8 million, 18.4% (R$72.1 million)above the amount recorded in 9M10. From 3Q10 to 3Q11, provision expenses totaled R$182.3million, increasing by 63.9% (R$71.1 million); from 2Q11 to 3Q11, provisions expensesincreased 27.4% (R$39.2 million).
From 9M10 to 9M11, provision expenses increased directly due to the growth of R$ 21.0% incredit portfolio and the increase of 16.1% (R$78.7 million) in past due operations over 60 days.
The upward trend observed in provision expenses from 3Q10 to 3Q11 is related to the growthof the loan book. From 2Q11 to 3Q11, 60 - day past due loans increased 13.6% (R$67.7 million),demanding provision adjustments during the last quarter.
Graph 25: Allowance for Loan Losses - R$ Million

132 FINANCIAL STATEMENTSSEPTEMBER 2011
Financial Margin
Net interest income reached R$2,461.1 million in 9M11, 15.7% (R$333.1 million) higher than in9M10. The net interest income of R$873.2 million in 3Q11 is 13.4% (R$103.5 million) higherthan in 3Q10 and increased 4.9% (R$40.6 million) from 2Q11.
From 9M10 to 9M11, net interest income was positively impacted by the increase in creditrevenues and by the results from treasury, from restricted deposits, and by result of foreignexchange transactions. On the negative side, it was affected by market funding cost andexpenses with loans and onlendings.
The margin increase from 3Q10 and 3Q11 is linked to higher credit and treasury revenues andthe result of foreign exchange transactions, which offset the growth of expenses with marketfunding, loans and onlendings.
From 2Q11 to 3Q11, the performance of credit revenues and higher results of foreign exchangetransactions and treasury gains compensated the increases in market funding, loans andonlendings expenses, substantially contributing to the growth of financial margin.
Graph 26: Financial Margin - R$ Million
Revenue from Services Rendered
Revenues from services totaled R$517.4 million in 9M11, 10.5% (R$49.2 million) more than in9M10. In 3Q11 fees from services reached R$172.4 million, 7.2% (R$11.5 million) higher than in3Q10 and 0.6% (R$1.0 million) below 2Q11.
The increase in revenues from services from January to September 2011 in comparison to9M10 reflects mainly the growth of 14.4% (R$25.8 million) in fees on checking accounts, theincrease of 19.5% (R$12.0 million) in Banricompras fees and the 28.7% (R$2.5 million) increasein consortium management fees.
The growth of checking account and Banricompras fees, that together increased 9.4% (R$7.8million), help explain fees expansions from 3Q10 to 3Q11. From 2Q11 to 3Q11, fees decreaseof 64.2% (R$15.3 million) in other income from fees and of the 6.1% (R$4.2 million) in revenuesfrom bank fees on checking accounts were responsible for the revenue reduction.
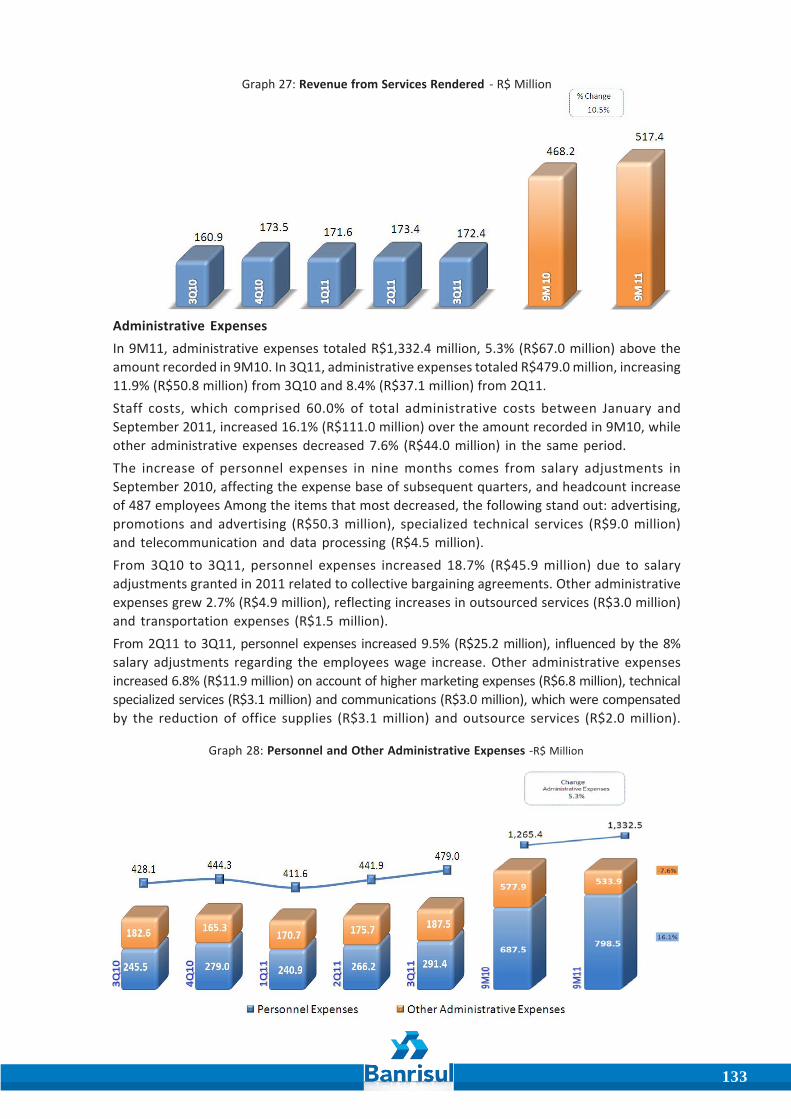
133
Graph 27: Revenue from Services Rendered - R$ Million
Administrative ExpensesIn 9M11, administrative expenses totaled R$1,332.4 million, 5.3% (R$67.0 million) above theamount recorded in 9M10. In 3Q11, administrative expenses totaled R$479.0 million, increasing11.9% (R$50.8 million) from 3Q10 and 8.4% (R$37.1 million) from 2Q11.Staff costs, which comprised 60.0% of total administrative costs between January andSeptember 2011, increased 16.1% (R$111.0 million) over the amount recorded in 9M10, whileother administrative expenses decreased 7.6% (R$44.0 million) in the same period.The increase of personnel expenses in nine months comes from salary adjustments inSeptember 2010, affecting the expense base of subsequent quarters, and headcount increaseof 487 employees Among the items that most decreased, the following stand out: advertising,promotions and advertising (R$50.3 million), specialized technical services (R$9.0 million)and telecommunication and data processing (R$4.5 million).From 3Q10 to 3Q11, personnel expenses increased 18.7% (R$45.9 million) due to salaryadjustments granted in 2011 related to collective bargaining agreements. Other administrativeexpenses grew 2.7% (R$4.9 million), reflecting increases in outsourced services (R$3.0 million)and transportation expenses (R$1.5 million).From 2Q11 to 3Q11, personnel expenses increased 9.5% (R$25.2 million), influenced by the 8%salary adjustments regarding the employees wage increase. Other administrative expensesincreased 6.8% (R$11.9 million) on account of higher marketing expenses (R$6.8 million), technicalspecialized services (R$3.1 million) and communications (R$3.0 million), which were compensatedby the reduction of office supplies (R$3.1 million) and outsource services (R$2.0 million).
Graph 28: Personnel and Other Administrative Expenses -R$ Million
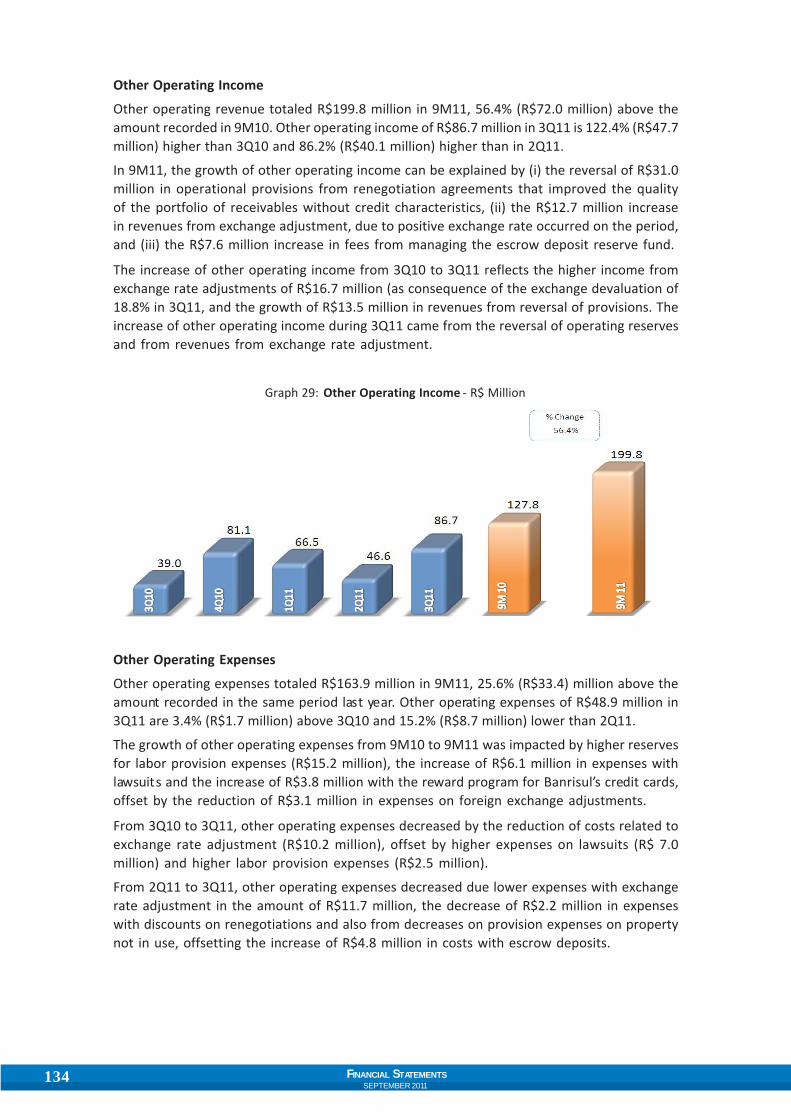
134 FINANCIAL STATEMENTSSEPTEMBER 2011
Other Operating Income
Other operating revenue totaled R$199.8 million in 9M11, 56.4% (R$72.0 million) above theamount recorded in 9M10. Other operating income of R$86.7 million in 3Q11 is 122.4% (R$47.7million) higher than 3Q10 and 86.2% (R$40.1 million) higher than in 2Q11.
In 9M11, the growth of other operating income can be explained by (i) the reversal of R$31.0million in operational provisions from renegotiation agreements that improved the qualityof the portfolio of receivables without credit characteristics, (ii) the R$12.7 million increasein revenues from exchange adjustment, due to positive exchange rate occurred on the period,and (iii) the R$7.6 million increase in fees from managing the escrow deposit reserve fund.
The increase of other operating income from 3Q10 to 3Q11 reflects the higher income fromexchange rate adjustments of R$16.7 million (as consequence of the exchange devaluation of18.8% in 3Q11, and the growth of R$13.5 million in revenues from reversal of provisions. Theincrease of other operating income during 3Q11 came from the reversal of operating reservesand from revenues from exchange rate adjustment.
Graph 29: Other Operating Income - R$ Million
Other Operating Expenses
Other operating expenses totaled R$163.9 million in 9M11, 25.6% (R$33.4) million above theamount recorded in the same period last year. Other operating expenses of R$48.9 million in3Q11 are 3.4% (R$1.7 million) above 3Q10 and 15.2% (R$8.7 million) lower than 2Q11.
The growth of other operating expenses from 9M10 to 9M11 was impacted by higher reservesfor labor provision expenses (R$15.2 million), the increase of R$6.1 million in expenses withlawsuits and the increase of R$3.8 million with the reward program for Banrisul’s credit cards,offset by the reduction of R$3.1 million in expenses on foreign exchange adjustments.
From 3Q10 to 3Q11, other operating expenses decreased by the reduction of costs related toexchange rate adjustment (R$10.2 million), offset by higher expenses on lawsuits (R$ 7.0million) and higher labor provision expenses (R$2.5 million).
From 2Q11 to 3Q11, other operating expenses decreased due lower expenses with exchangerate adjustment in the amount of R$11.7 million, the decrease of R$2.2 million in expenseswith discounts on renegotiations and also from decreases on provision expenses on propertynot in use, offsetting the increase of R$4.8 million in costs with escrow deposits.

135
Graph 30: Other Operating Expenses - R$ Million

136 FINANCIAL STATEMENTSSEPTEMBER 2011
Graph 32: Operating Cost
Graph 33: Debt-Equity Ratio
Graph 31: Leverage Ratio
Economic IndicatorsLeverage Ratio
The leverage ratio is the ratio of thecredit operations portfolio toshareholders’ equity. In September2011, Banrisul’s credit operationswere 4.6x shareholders’ equity, risingfrom to the 4.3x registered inSeptember 2010 and the 4.4x inDecember 2010.
The significant growth of the loanportfolio in the twelve months reflected the variation of the Leverage Ratio. The Bank’scomfortable leverage shows its capacity for loan portfolio growth in the future.
Operating Cost
Operating cost measures total ofadministrative expenses in relation tototal assets. The ratio is calculatedbased on the expenses in the twelvemonths against the balance of assetsat the end of the period beinganalyzed.
The 13.0% growth in assets in thetwelve months, leveraged by thegrowth in credit operations, helped to absorb an increase of 5.3% in administrative expenses,reflecting in the reduction of costs in proportion to assets in twelve months.
Debt-Equity Ratio
The debt-equity ratio measures theratio of shareholders’ equity to fundsraised from the public, includinginvestment funds. It evaluates thesecurity that the company’s own fundsoffer to third-party capital.
In September 2011, the debt-equityratio was 15.6%, 0.1 percentage pointsabove September 2010, 0.2 percentagepoints above that of December 2010 and0.2 percentage points below June 2011. The increase produced in the months of Septemberand December 2010 showed that the Shareholders’ Equity grew higher than funding. Incomparison to June 2011, funding increased 5.4%, above the 4.4% rise in Shareholders’ Equity.

137
Graph 34: Employee Productivity - R$ Thousand
Graph 35: Efficiency Ratio
Employee Productivity
The productivity indicator, measuredby total funding and lending amountsper employee, grew by 11.1% over thelast twelve months, reaching R$4,794.6thousand, explained by the commercialperformance, leveraged byencouraging productivity throughsystematic incentive pay to employees,already consolidated in the institution.
Banrisul’s headcount in September 2011 was 9,836 employees, an increase of 487 employeesover September 2010.
Efficiency Ratio
The Efficiency Ratio measures thepercentage volume of revenues usedto cover administrative expenses. Thetwelve-month accumulated ratio in thesame period of the last yeardecreased, performance favorable tothe Bank.
The efficiency ratio reached 44.4% inSeptember 2011, 4.1 percentage pointsbelow the income-cost ratio inSeptember 2010 and 3.4 percentagepoints less than December 2010 and 0.6percentage points below the indicator for June 2011. The improvement of the efficiencyindex during last twelve months reflects the rising trends of the net interest income (16.1%year-on-year growth), of fees from services (increase of 11.3% since June 2010) and operatingincome (expansion of 53.7% from 9M10 to 9M11), which helped absorb the increases of 6.4%in administrative expenses and of 38.4% in other operating expenses during the same period.

138 FINANCIAL STATEMENTSSEPTEMBER 2011
R$ Million
Assets Sep11 Jun11 Mar11 Dec10 Sep10Sep11/ Sep11/ Sep11/
Jun11 Dec10 Sep10
Curr ent and Long-Term Assets 36,256.1 34,438.6 32,615.3 31,779.8 31,972.6 5.3% 14.1% 13.4%
Cash 481.1 405.8 382.7 403.3 396.4 18.5% 19.3% 21.4%
Interbank Investments 3,057.0 2,844.8 2,534.6 2,359.3 3,822.6 7.5% 29.6% -20.0%
Securities and Derivatives 9,148.2 8,900.0 8,688.5 8,525.7 8,477.4 2.8% 7.3% 7.9%
Interbank and Interbranch Accounts 3,469.2 3,130.7 2,756.9 3,155.9 2,650.5 10.8% 9.9% 30.9%
Lending Operations 19,058.2 18,202.7 17,407.4 16,537.6 15,683.7 4.7% 15.2% 21.5%
Allowance for Loan Losses (1,233.8) (1,167.9) (1,102.3) (1,058.7) (1,083.7) 5.6% 16.5% 13.9%
Leasing Operations 83.6 77.8 81.2 83.6 83.2 7.4% -0.1% 0.5%
Allowance for Doubtful Lease Receivables (8.6) (6.9) (5.9) (8.9) (7.5) 24.6% -3.5% 14.2%
Other Receivables 2,231.4 2,089.3 1,916.8 1,826.0 2,025.6 6.8% 22.2% 10.2%
Allowance for Losses on Other Receivables (66.4) (62.8) (71.0) (73.9) (102.0) 5.8% -10.1% -34.9%
Other Assets 36.3 24.9 26.3 29.9 26.5 45.4% 21.4% 36.7%
Permanent 298.0 316.5 335.7 347.9 366.7 -5.8% -14.3% -18.7%
Investments 7.7 7.7 7.7 7.7 7.8 0.0% 0.0% -1.3%
Property in Use 163.2 166.0 172.4 168.9 171.3 -1.7% -3.4% -4.8%
Intangible 127.2 142.8 155.6 171.3 187.6 -10.9% -25.7% -32.2%
Total Assets 36,554.1 34,755.0 32,951.0 32,127.7 32,339.3 5.2% 13.8% 13.0%
Liabilities Set11 Jun11 Mar11 Dec10 Set10Sep11/ Sep11/ Sep11/
Jun11 Dec10 Sep10
Current and Long-Term Liabi lities 32,254.4 30,635.4 28,940.2 28,270.7 28,591.2 5.3% 14.1% 12.8%
Deposits 20,910.1 19,800.9 19,062.2 19,053.0 17,954.1 5.6% 9.7% 16.5%
Demand Deposits 2,556.0 2,695.1 2,778.5 3,779.9 2,108.9 -5.2% -32.4% 21.2%
Saving Deposits 5,072.4 5,158.8 5,336.7 5,580.0 6,295.7 -1.7% -9.1% -19.4%
Intebank Deposits 11.5 10.2 11.6 12.3 14.7 12.8% -6.5% -21.4%
Time Deposits 13,269.4 11,936.4 10,935.0 9,680.3 9,533.0 11.2% 37.1% 39.2%
Other Deposits 0.9 0.5 0.4 0.5 1.9 66.9% 89.2% -52.1%
Money Market Funding 1,634.0 1,778.9 1,433.8 1,311.2 2,285.9 -8.1% 24.6% -28.5%
Intebank and Interbranch Accounts 537.6 503.9 415.2 179.7 475.0 6.7% 199.3% 13.2%
Borrowings and Onlendings 2,015.1 1,837.1 1,754.9 1,622.4 1,611.9 9.7% 24.2% 25.0%
Derivatives 0.0 0.0 0.0 0.0 56.5 0.0% 0.0% 0.0%
Other Payables 7,157.5 6,714.6 6,274.1 6,104.5 6,207.8 6.6% 17.2% 15.3%
Collected Taxes and Other 133.4 151.8 128.7 23.6 112.0 -12.1% 465.1% 19.1%
Foreign Exchange Portfolio 36.1 18.8 27.7 18.8 42.5 92.2% 92.4% -14.9%
Social and Statutory 100.9 85.0 36.5 27.9 55.7 18.7% 261.9% 81.2%
Tax ans Social Securitie s 860.9 710.7 578.2 634.9 713.8 21.1% 35.6% 20.6%
Trading Account 3.2 4.9 3.6 2.1 3.1 -35.6% 54.1% 2.4%
Financial and Development Funds 5,011.7 4,792.9 4,639.8 4,444.6 4,395.6 4.6% 12.8% 14.0%
Other 1,011.3 950.4 859.5 952.7 885.2 6.4% 6.2% 14.3%
Minority Interest 1.6 1.5 1.8 1.7 1.8 2.3% -5.8% -10.1%
Shareholders' Equity 4,298.1 4,118.1 4,009.0 3,855.2 3,746.4 4.4% 11.5% 14.7%
Total Liabilities and Shareholders' Equity 36,554.1 34,755.0 32,951.0 32,127.7 32,339.3 5.2% 13.8% 13.0%
Consolidated Pro Forma Balance SheetTable 16: Consolidated Pro Forma Balance Sheet

139
Pro Forma Income Statement
R$ Million
9M11 9M10 3Q11 2Q11 1Q11 4Q10 3Q10 9M11/ 3Q11/ 3Q11/9M10 2Q11 3Q10
FINANCIAL INCOME 4,405.3 3,531.4 1,668.9 1,436.5 1,299.9 1,310.4 1,298.2 24.7% 16.2% 28.6%Lending Operations and Lease Operations 3,169.5 2,551.6 1,150.7 1,056.7 962.1 961.3 933.1 24.2% 8.9% 23.3%Securities 930.5 792.9 335.2 315.0 280.3 289.1 302.4 17.4% 6.4% 10.9%Foreign Exchange 123.7 46.7 106.4 9.3 8.0 7.8 11.2 164.9% 1,039.8% 850.4%Compulsory Investments 181.6 140.2 76.7 55.5 49.4 52.2 51.5 29.5% 38.0% 48.8%FINANCIAL EXPENSES (2,408.0) (1,795.2) (978.0) (747.0) (683.1) (650.3) (639.7) 34.1% 30.9% 52.9%Funding Operations (1,332.2) (1,021.4) (492.9) (447.8) (391.5) (381.3) (387.5) 30.4% 10.1% 27.2%Borrowings. Assignments and Onlendings (612.0) (381.0) (302.8) (156.1) (153.1) (142.2) (142.5) 60.6% 93.9% 112.4%Operations of Sale or Transfer of Financial Assets 0.0 (1.1) 0.0 0.0 0.0 (0.2) 1.5 - - -Allowance for Loan Losses (463.8) (391.7) (182.3) (143.1) (138.5) (126.6) (111.2) 18.4% 27.4% 63.9%Gross Profit from Financial Income 1,997.2 1,736.2 690.9 689.5 616.8 660.1 658.5 15.0% 0.2% 4.9%Financial Margin 2,461.1 2,128.0 873.2 832.6 755.3 786.7 769.7 15.7% 4.9% 13.4%Other Operations Income / Expenses (950.4) (950.2) (328.9) (336.1) (285.4) (298.3) (331.6) 0.0% -2.1% -0.8%Services / Bank Fees 517.4 468.2 172.4 173.4 171.6 173.5 160.9 10.5% -0.6% 7.2%Personnel Expenses (798.5) (687.5) (291.4) (266.2) (240.9) (279.0) (245.5) 16.1% 9.5% 18.7%Other Administrative Expenses (533.9) (577.9) (187.5) (175.7) (170.7) (165.3) (182.6) -7.6% 6.8% 2.7%Other Operation Income 199.8 127.8 86.7 46.6 66.5 81.1 39.0 56.4% 86.2% 122.4%Tax Expenses (171.3) (150.3) (60.1) (56.6) (54.5) (53.7) (52.7) 13.9% 6.3% 14.1%Other Operation Expenses (163.9) (130.4) (48.9) (57.6) (57.4) (54.9) (50.6) 25.6% -15.2% -3.4%Income from Operations 1,046.8 786.0 362.0 353.5 331.4 361.8 327.0 33.2% 2.4% 10.7%Inc ome Before Taxes on Income 1,046.8 786.0 362.0 353.5 331.4 361.8 327.0 33.2% 2.4% 10.7%Inc ome Tax and Social Contribution (328.5) (241.0) (106.9) (113.9) (107.6) (116.1) (109.4) 36.3% -6.2% -2.3%Statutory Interest (40.6) (33.5) (15.8) (12.3) (12.4) (15.8) (11.1) 21.1% 28.6% 42.8%Minority Interest (0.1) (0.1) (0.0) (0.0) (0.0) -0.1 (0.1) -15.1% 11.4% -23.5%Net Income 677.7 511.4 239.2 227.2 211.3 229.9 206.4 32.5% 5.3% 15.9%
Table 17: Pro Forma Income Statement

140 FINANCIAL STATEMENTSSEPTEMBER 2011
GOVERNO DO ESTADODO RIO GRANDE DO SUL
Secretaria da FazendaBanco do Estado do Rio Grande do Sul
BOARD OF DIRECTORS
ODIR ALBERTO PINHEIRO TONOLLIERChairman
TÚLIO LUIZ ZAMINVice Chairman
ALDO PINTO DA SILVAESTILAC MARTINS RODRIGUES XAVIER
ERINEU CLÓVIS XAVIERFLAVIO LUIZ LAMMEL
OLÍVIO DE OLIVEIRA DUTRABoard Members
EXECUTIVE BOARD
TÚLIO LUIZ ZAMINCEO
FLÁVIO LUIZ LAMMELVice-President
GUILHERME CASSELIVANDRE DE JESUS MEDEIROS
JOÃO EMILIO GAZZANAJOEL DOS SANTOS RAYMUNDO
JOSE LUIZ HERMES PFEIFFJULIMAR ROBERTO GARCIA ROTA
LUIZ CARLOS MORLINOfficers
WERNER KÖHLERAccountant CRCRS 38.534

Founded on September 12, 1928Head Office: Rua Capitão Montanha, 177 - Porto Alegre - RS - Brazil
Editing/Printing:Banrisul Corporate Communication
www.banrisul.com