Embed Size (px)
Citation preview
CAD IT S.p.A. Registered office in Verona, Via Torricelli No. 44/a
Share capital € 4,669,600 fully paid in. Tax code and Verona Company Register No. 01992770238
Chamber of Commerce REA No. 210441
*.*.*.*.*.*.*.*.*
First half report 2006 Drawn up in accordance with CONSOB resolution no. 11971 of 14 May 1999 and subsequent changes and integrations
CORPORATE BODIES ..................................................................................................................3
1 DIRECTORS’ REPORT ON MANAGEMENT ................................................................................5 Activities of the Group.......................................................................................................................................... 5 Summary of the results ........................................................................................................................................ 5 The market........................................................................................................................................................... 6 Significant events of the period............................................................................................................................ 6 Consolidated income result analyses................................................................................................................... 7 Consolidated net financial position....................................................................................................................... 8 Variations in net assets forming part of working capital ....................................................................................... 9 Research and development ................................................................................................................................. 9 Investments........................................................................................................................................................ 10 Relationships with Group companies................................................................................................................. 10 Related party...................................................................................................................................................... 11 Corporate Governance ...................................................................................................................................... 11 Programmatic document on security.................................................................................................................. 11 Financial instruments and risk management...................................................................................................... 11
2 CONSOLIDATED FINANCIAL STATEMENTS OF THE GROUP ....................................................12 Consolidated income statement......................................................................................................................... 12 Consolidated balance sheet............................................................................................................................... 13 Statement of changes in equity.......................................................................................................................... 14 Consolidated Cash Flow Statement................................................................................................................... 15 Notes to the financial statements ....................................................................................................................... 16
3 FINANCIAL STATEMENTS OF CAD IT S.P.A. ........................................................................38 Income statement .............................................................................................................................................. 38 Balance sheet .................................................................................................................................................... 39 Statement of changes in equity.......................................................................................................................... 41 Cash Flow Statement......................................................................................................................................... 42 Relations with subsidiaries................................................................................................................................. 43
First half report at 30/06/2006
Corporate bodies
BOARD OF STATUTORY DIRECTORS 1 AUDITORS 1 GIUSEPPE DAL CORTIVO GIANNICOLA CUSUMANO Chairman and Managing Director Chairman LUIGI ZANELLA GIAN PAOLO RANOCCHI Vice Chairman and Managing Director Statutory Auditor GIAMPIETRO MAGNANI RENATO TENGATTINI Vice Chairman and Managing Director Statutory Auditor PAOLO DAL CORTIVO Managing Director MAURIZIO RIZZOLI CESARE BRENA Director Substitute Statutory Auditor MICHAEL JOHN MARGETTS LUCA SIGNORINI Director Substitute Statutory Auditor FRANCESCO ROSSI Independent Director LAMBERTO LAMBERTINI Independent Director
AUDITORS
(1) Appointed on 28 April 2006; office expires with the shareholders' meeting for the approval of the 2008 financial statements. The Chairman and Managing Director of the parent company CAD IT S.p.A., Giuseppe Dal Cortivo, is authorised to perform all ordinary and extraordinary administrative duties, excluding only those which can not be delegated by law and those assigned to the Board of Directors by article 14 of the company by-laws. The principal duties assigned to the Board of Directors by the company by-laws are: the examination and approval of the strategic, industrial and financial plans of the company; the appointment of the general managers; the purchase, sale, exchange or transfer of fixed assets and real estate rights; the granting of collateral on fixed assets; the set up of new subsidiaries and the take-over, acquisition or sale of corporate investments; the acquisition, sale, exchange or transfer of the whole company or of business lines. Furthermore, the Board of Directors is authorised to take on any kind of obligation amounting to more than € 4 million, and to stand surety by way of collateral or personal or other guarantees of any amount, if issued on behalf of third parties other than the parent company or its subsidiaries. The Vice Chairmen, Giampietro Magnani and Luigi Zanella, in accordance with art. 15 of the company statute, will substitute for the Chairman whenever the latter is absent or unable to fulfil his duties. The managing directors, Giampietro Magnani and Luigi Zanella, will have full ordinary administrative power including the faculty to prepare reports and to order banking transactions, within the limits of account availability and credit worthiness, with the power to act alone with their single signature to the maximum amount of Euro 1,000,000 (one million) for each individual transaction and with the joint signature of another managing director for amounts exceeding Euro 1,000,000 (one million) up to a maximum of Euro 3,000,000 (three million) for each individual transaction. Moreover, each of them will also be authorised to acquire and/or sell registered moveable assets with their single signature. The Managing Director Paolo Dal Cortivo is authorised to represent the company before the institutional investors and the shareholders, and before Borsa Italiana S.p.A., the Italian Stock Exchange company, and Consob. The Managing Directors are authorised to represent the company to the extent, and within the limits, of the proxies received.
3
First half report at 30/06/2006
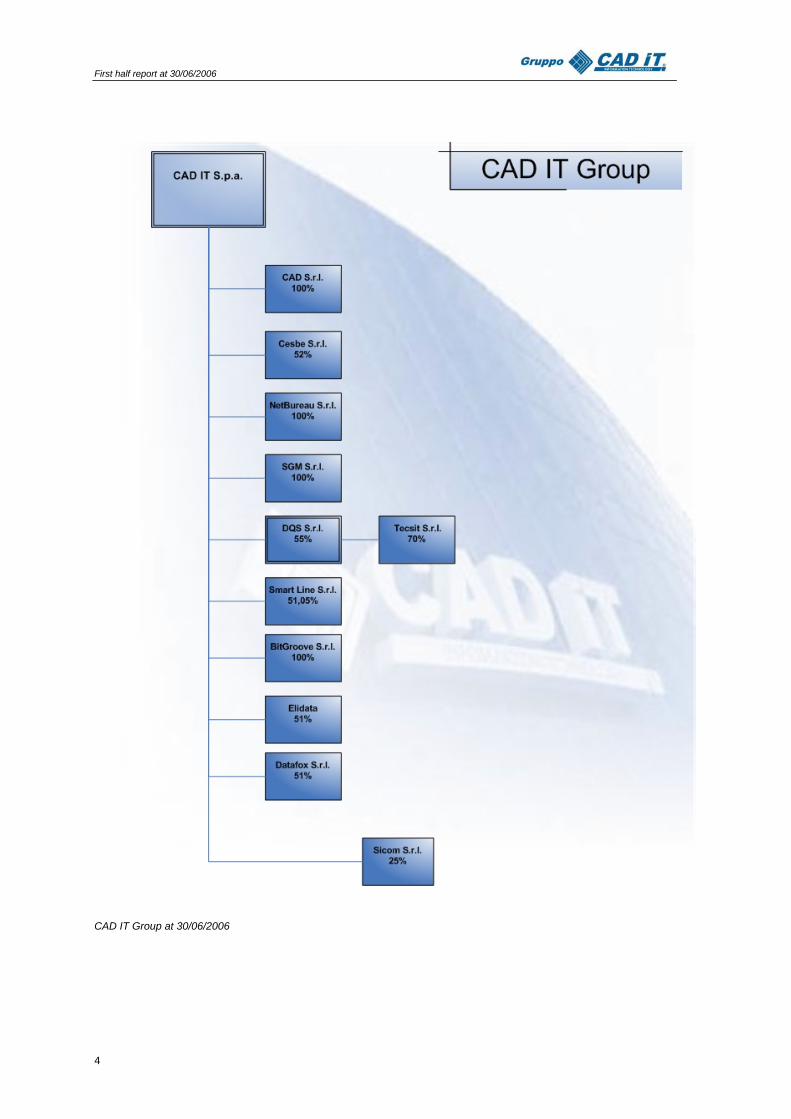
CAD IT Group at 30/06/2006
4
First half report at 30/06/2006
1 Directors’ report on management
This Directors’ report on management is attached to CAD IT’s six-monthly consolidated report at 30th June 2006, drafted in accordance with the international accounting standards (IAS/IFRS), and shows and explains the main aspects of the Group’s consolidated profit and loss account and the consolidated patrimonial-financial situation. Unless otherwise indicated, the monetary amounts in the accounting tables and those referred to in the comments are shown in thousands of Euros.
Activities of the Group CAD IT is the leader of a group that is one of the most dynamic organisations in the Italian information technology sector. For almost 30 years, the Group has been dealing with the banking and insurance market and the world of business and public administration by offering software solutions, maintenance, personalisation, integration and other correlated services from application management to outsourcing, consultancy to training. The CAD IT Group operates in Italy with its own branches and Group companies. Its Head Office is in Verona but there are other units in Milan, Rome, Florence, Bologna, Mantua, Prato and Trento. CAD IT is leader in the Italian software market for the banking sector with its main product, Financial Area, a programme which completely manages all functions connected to negotiation, settlement and administration of security transactions, debentures, derivates (in any currency) and adopted by 60% of Italian banking outlets. In addition, the Group boasts long-standing activity in the industrial sector and the capacity to offer solutions for e-business, credit and industrial companies in constant evolution.. Solutions for Local Taxes make up the newest sector but they capitalize the Group’s traditional abilities like its 20-year experience in developing computer systems for public body treasury and tax collection.
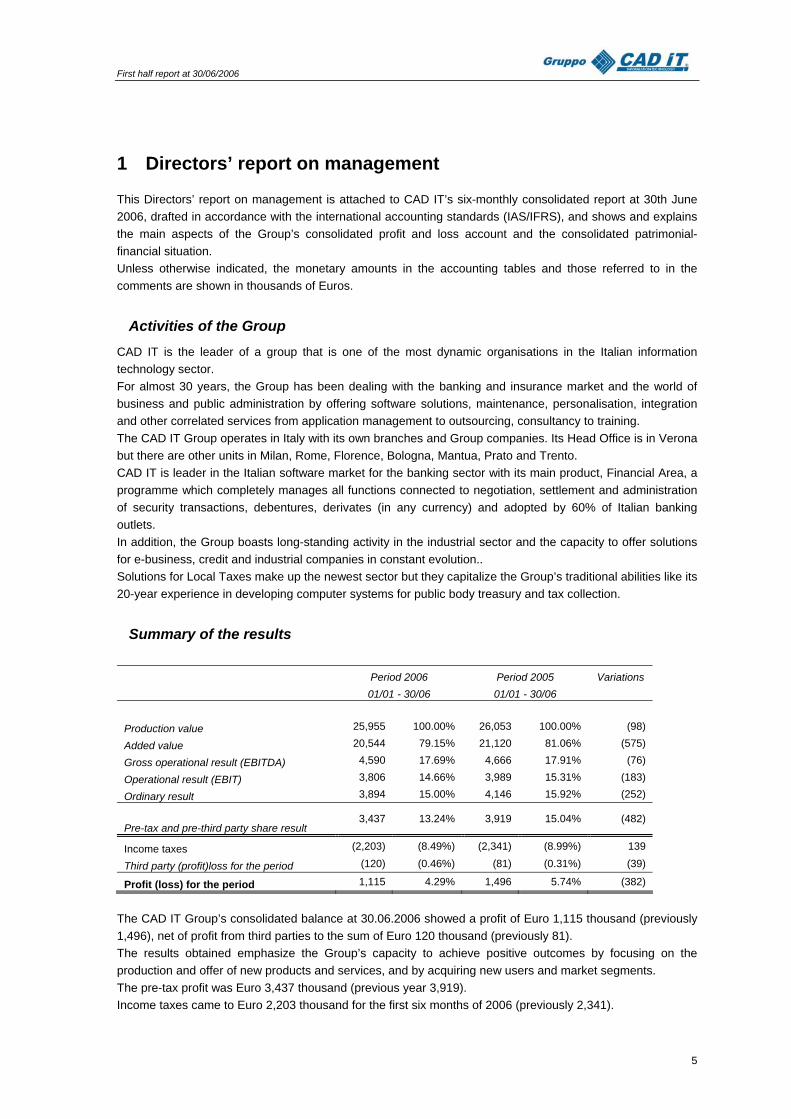
Summary of the results
Period 2006 Period 2005 Variations 01/01 - 30/06 01/01 - 30/06
Production value 25,955 100.00% 26,053 100.00% (98)
Added value 20,544 79.15% 21,120 81.06% (575)
Gross operational result (EBITDA) 4,590 17.69% 4,666 17.91% (76)
Operational result (EBIT) 3,806 14.66% 3,989 15.31% (183)
Ordinary result 3,894 15.00% 4,146 15.92% (252)
Pre-tax and pre-third party share result 3,437 13.24% 3,919 15.04% (482)
Income taxes (2,203) (8.49%) (2,341) (8.99%) 139
Third party (profit)loss for the period (120) (0.46%) (81) (0.31%) (39)
Profit (loss) for the period 1,115 4.29% 1,496 5.74% (382)
The CAD IT Group’s consolidated balance at 30.06.2006 showed a profit of Euro 1,115 thousand (previously 1,496), net of profit from third parties to the sum of Euro 120 thousand (previously 81). The results obtained emphasize the Group’s capacity to achieve positive outcomes by focusing on the production and offer of new products and services, and by acquiring new users and market segments. The pre-tax profit was Euro 3,437 thousand (previous year 3,919). Income taxes came to Euro 2,203 thousand for the first six months of 2006 (previously 2,341).
5
First half report at 30/06/2006
Production revenues in the first six months of 2006 stood at Euro 25,955 thousand, in line with the same period in the previous year (26,053). Staff costs came to Euro 14,805 thousand (previously 15,293), while service costs were Euro 4,482 thousand (previously 4,087). Amortizations and devaluations were registered at Euro 785 thousand (previously 678). The balance from financial returns and charges was in credit by Euro 88 thousand (previously 158); amendments to holdings accountable to the profit and loss account showed a negative balance of Euro 457 thousand (previously 288 thousand in credit).
The market There were no events or clear indications in the semester to modify the short-term prospects of the sector which, nevertheless, has shown some positive signs. A period that saw numerous mergers and takeovers by financial institutions in Italy followed due to the need to achieve the necessary critical mass to operate on the European market. All of 2005 and the first half of 2006 were periods of adjustment and rationalisation for banks which caused a period of recession in the Italian IT service market. Thus investment slowed down and a stalemate situation arose. In this context, the outcome achieved is the result of the Group’s capacity to continue to invest over the years in Research and Development, thus maintaining a strategic and leading position in the Italian financial software market.
Significant events of the period In June CAD IT and Xchanging extended the letter of intent which they signed last November to strengthen the alliance to focus on the European financial service sector. A further agreement was also signed for the sale of CAD IT’s software E.M.M. (Easyset Maching Module) to its partner Xchanging. E.M.M. is a software product that supports operational control functions of financial instruments. For some years CAD IT has been investing in developing multi-lingual and multi-platform versions of its products with potential foreign clients in mind. The software will be used simultaneously in English and German. The EMM product is suitable for Italian or foreign banks or financial institutions, as it may be used stand-alone or integrated with other CAD IT products. The five-year agreement, which will be renewable on expiry, foresees payment on the part of Xchanging for implementation activities and an annual fee for the supply of the user licence, maintenance and application management services. Xchanging is a supplier in Germany of back-office processing services to the financial services industry. Xchanging’s Financial Services Sector will use “E.M.M.” to supply services to its clients including: Deutsche Bank, Citigroup, Sal. Oppenheim and Sparda Banken. Thanks to this important connection, the CAD IT Group will be selling its own product in Germany. The agreement achieves one of the objectives laid down in the letter of intent signed last November by the two companies, to identify opportunities for CAD IT products where reciprocal advantages exist. Aside from “E.M.M.”, the two companies are assessing the possibility of integrating other CAD IT products with the software platforms operated by Xchanging. CAD IT and Xchanging are convinced that there are multiple joint business areas to be explored and are extending the duration of the letter of intent signed last November to 31st December 2006. This extension will allow the two companies to pursue their objective of creating a strategic alliance aimed at offering business processing services to financial institutions in the European financial sector. On 28th April 2006, on the basis of the 2005 financial results, which confirm the Veronese Group’s ability to generate positive income margins, the Shareholders’ Meeting approved the distribution of an ordinary dividend of Euro 0.18 per share, with coupon detachment and payment on 8th May 2006 and 11th May 2006 respectively. At the same Shareholders’ Meeting on 28th April 2006, it was also decided: − to appoint the share auditing company BDO Sala Scelsi Farina to carry out the audits for the next 6
financial periods in appliance of the new regulations issued with L. no. 262 on 28/12/2005;
6
First half report at 30/06/2006
− to nominate a Board of Directors of 8 members who will remain in office until the Shareholders approve the balance at 31/12/2008. The members were confirmed as Giuseppe Dal Cortivo, Giampietro Magnani, Luigi Zanella, Paolo Dal Cortivo, all previously managing directors; Maurizio Rizzoli, non-executive director; Prof. Francesco Rossi and Lamberto Lambertini, independent directors. Michael John Margetts was also appointed as non-executive director;
− to nominate the Auditing Board which comprises: Dr. Giannicola Cusumano, Chairman; Gian Paolo Ranocchi and Renato Tengattini, standing auditors; Cesare Brena and Luca Signorini, substitute auditors.
During the first half of 2006, CAD IT released software for the evasion of Inland Revenue tax assessment requests. In fact, the actuarial measure issued by the Inland Revenue on 28/12/2005 relating to Banking Assessments obliges Financial Institutions to use a communication system in technical format (XML) based on certified electronic mail with strict time restrictions. The solution proposed by CAD IT for the evasion of Inland Revenue tax assessment requests foresees the use of integrated and flexible procedures that guarantee reliability and full respect of the new norm. During the period CAD IT launched a new integrated solution which allows financial institutions to use the new messages with XML standard for the SWIFTNet platform in the investment fund sector. The solution was developed in close collaboration with the MPS Group and is absolutely new to the Italian financial sector. On a European level, it is one of the first solutions developed for exchanging messages of orders, status and execution by means of the SWIFTNet platform in InterAct modality using the new ISO20022 standard and taking advantage of the XML protocol. The procedure satisfies the need to automate by adopting the mutual standards of information exchange supplied by SWIFT, the present communication channels – fax, telephone, e-mail, file transfer – used for distributing national and international investment funds. As a partner of SWIFT, CAD IT takes part in the international work group set up to analyse and define pilot projects that will guide financial institutions in the use of SWIFTNet, the “IP based” platform that will replace the traditional way of transferring standardised messages (FIN Messages) in the near future. The procedure developed by CAD IT allows for the contemporary management of ISO15022 and ISO20022 standard messaging according to the SWIFTNet Funds project. In accordance with ISO (International Organization for Standardization), the ISO20022 standard will lead to a shift to the standardised use of the XML protocol, guaranteeing inter-operability between financial institutions.
Consolidated income result analyses Production revenues came to Euro 25,955 thousand, including increases in intangible assets due to internal work, and were substantially in line with the same period in the previous year (Euro 26,053 thousand). Earnings were affected by the continual postponement of investments by some banking groups who are involved in merger and reorganisation processes which have delayed investment decision-making. In view of this point, the Group has continued with its own investment plans for creating new procedures so as to be prepared to offer innovative solutions and be even more competitive. The added value of Euro 20,544 thousand (previously Euro 21,120 thousand) remains at 79% of production revenues (previously 81%). The Euro 4,590 thousand gross operational result (EBITDA) was 17.7% of production revenues and is in line with the revenues of the same period in 2005 (Euro 4,666 thousand). This result was obtained thanks to a Euro 488 thousand reduction in labour costs, in line with the reduction in the number of employees, mainly due to a reorganisation programme concerning the subsidiary SGM. The operational result (EBIT) stood at Euro 3,806 thousand (previously Euro 3,989 thousand), equal to 14.7% of production revenues, compared to the 15.3% of the corresponding period in 2005. This was mainly because of the effect of higher amortizations in intangible assets (increased by Euro 100 thousand). The total sum of amortizations, credit depreciation and funding was Euro 785 thousand compared to Euro 678 thousand in the same period in the previous year. Pre-tax profit, due to the effect of income and financial charges and the appraisal and devaluation of holdings, came to Euro 3,437 thousand, equal to 13.2% of production revenues. The Group’s result, net of tax, came to Euro 1,115 thousand, while profit from third parties came to Euro 120
7
First half report at 30/06/2006
thousand.
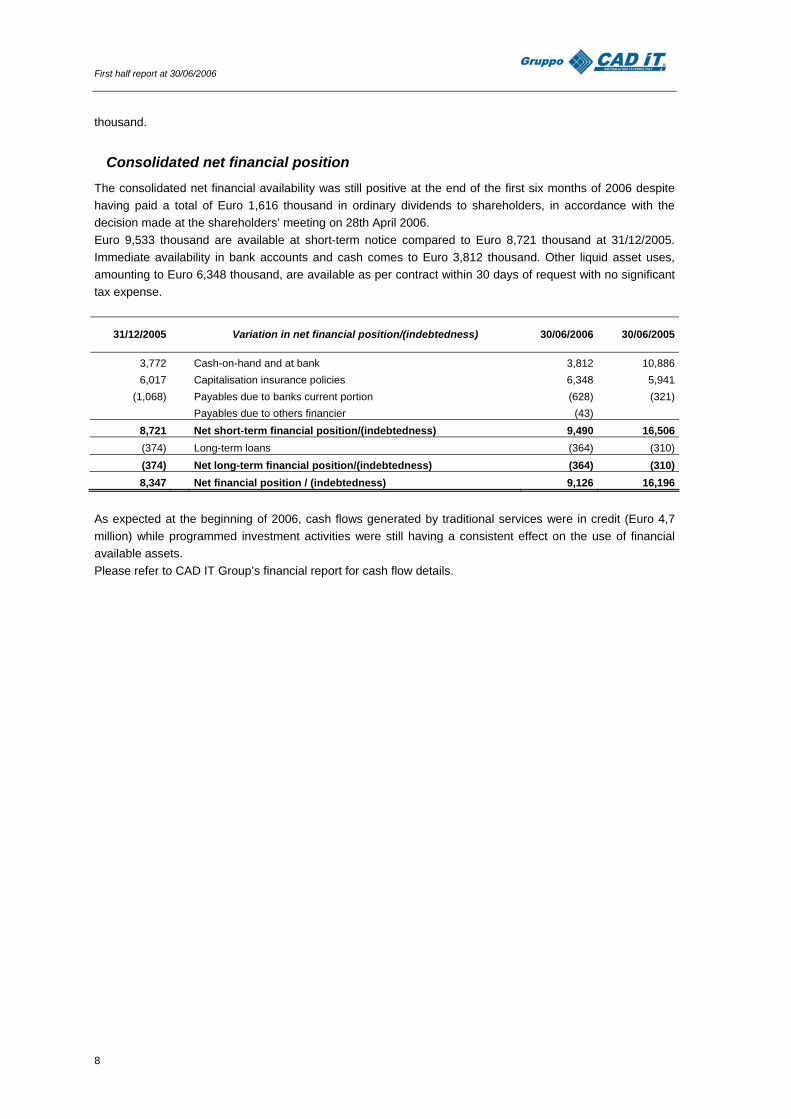
Consolidated net financial position The consolidated net financial availability was still positive at the end of the first six months of 2006 despite having paid a total of Euro 1,616 thousand in ordinary dividends to shareholders, in accordance with the decision made at the shareholders’ meeting on 28th April 2006. Euro 9,533 thousand are available at short-term notice compared to Euro 8,721 thousand at 31/12/2005. Immediate availability in bank accounts and cash comes to Euro 3,812 thousand. Other liquid asset uses, amounting to Euro 6,348 thousand, are available as per contract within 30 days of request with no significant tax expense.
31/12/2005
Variation in net financial position/(indebtedness) 30/06/2006 30/06/2005
3,772 Cash-on-hand and at bank 3,812 10,886 6,017 Capitalisation insurance policies 6,348 5,941
(1,068) Payables due to banks current portion (628) (321) Payables due to others financier (43)
8,721 Net short-term financial position/(indebtedness) 9,490 16,506 (374) Long-term loans (364) (310)(374) Net long-term financial position/(indebtedness) (364) (310)8,347 Net financial position / (indebtedness) 9,126 16,196
As expected at the beginning of 2006, cash flows generated by traditional services were in credit (Euro 4,7 million) while programmed investment activities were still having a consistent effect on the use of financial available assets. Please refer to CAD IT Group’s financial report for cash flow details.
8
First half report at 30/06/2006
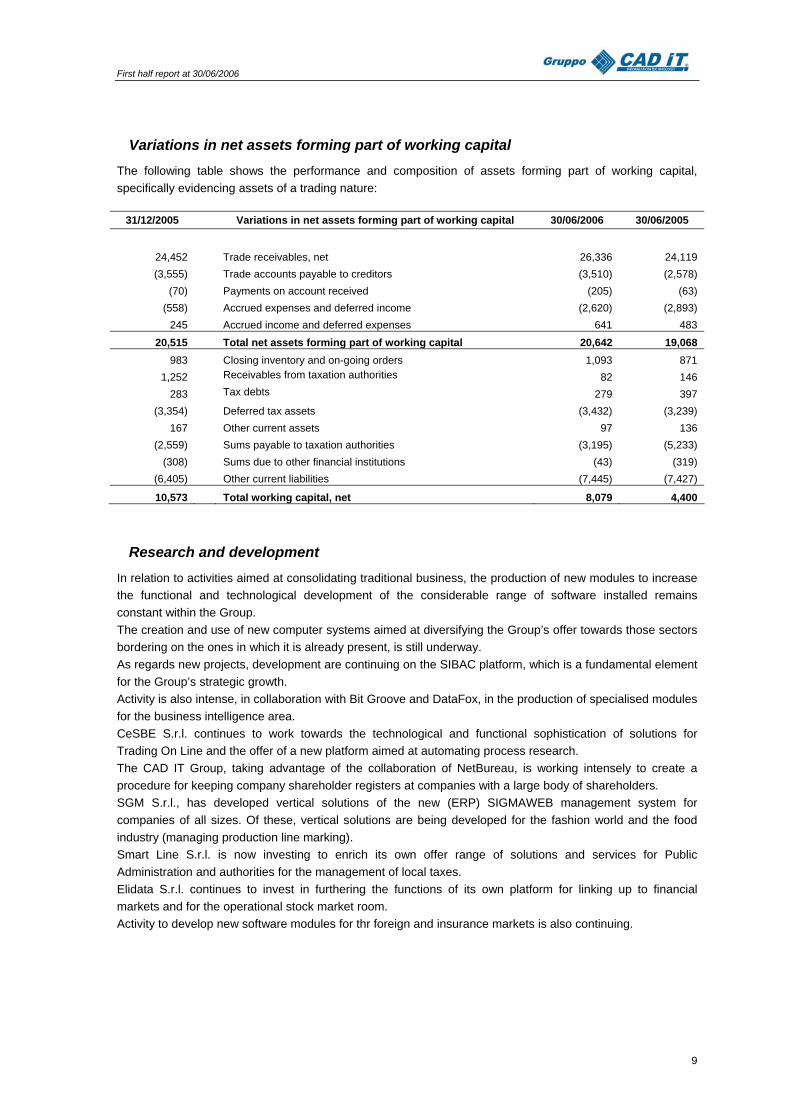
Variations in net assets forming part of working capital The following table shows the performance and composition of assets forming part of working capital, specifically evidencing assets of a trading nature:
31/12/2005 Variations in net assets forming part of working capital 30/06/2006 30/06/2005
24,452 Trade receivables, net 26,336 24,119 (3,555) Trade accounts payable to creditors (3,510) (2,578)
(70) Payments on account received (205) (63) (558) Accrued expenses and deferred income (2,620) (2,893)
245 Accrued income and deferred expenses 641 483 20,515 Total net assets forming part of working capital 20,642 19,068
983 Closing inventory and on-going orders 1,093 871 1,252 Receivables from taxation authorities 82 146
283 Tax debts 279 397 (3,354) Deferred tax assets (3,432) (3,239)
167 Other current assets 97 136 (2,559) Sums payable to taxation authorities (3,195) (5,233)
(308) Sums due to other financial institutions (43) (319) (6,405) Other current liabilities (7,445) (7,427)
10,573 Total working capital, net 8,079 4,400
Research and development In relation to activities aimed at consolidating traditional business, the production of new modules to increase the functional and technological development of the considerable range of software installed remains constant within the Group. The creation and use of new computer systems aimed at diversifying the Group’s offer towards those sectors bordering on the ones in which it is already present, is still underway. As regards new projects, development are continuing on the SIBAC platform, which is a fundamental element for the Group’s strategic growth. Activity is also intense, in collaboration with Bit Groove and DataFox, in the production of specialised modules for the business intelligence area. CeSBE S.r.l. continues to work towards the technological and functional sophistication of solutions for Trading On Line and the offer of a new platform aimed at automating process research. The CAD IT Group, taking advantage of the collaboration of NetBureau, is working intensely to create a procedure for keeping company shareholder registers at companies with a large body of shareholders. SGM S.r.l., has developed vertical solutions of the new (ERP) SIGMAWEB management system for companies of all sizes. Of these, vertical solutions are being developed for the fashion world and the food industry (managing production line marking). Smart Line S.r.l. is now investing to enrich its own offer range of solutions and services for Public Administration and authorities for the management of local taxes. Elidata S.r.l. continues to invest in furthering the functions of its own platform for linking up to financial markets and for the operational stock market room. Activity to develop new software modules for thr foreign and insurance markets is also continuing.
9
First half report at 30/06/2006
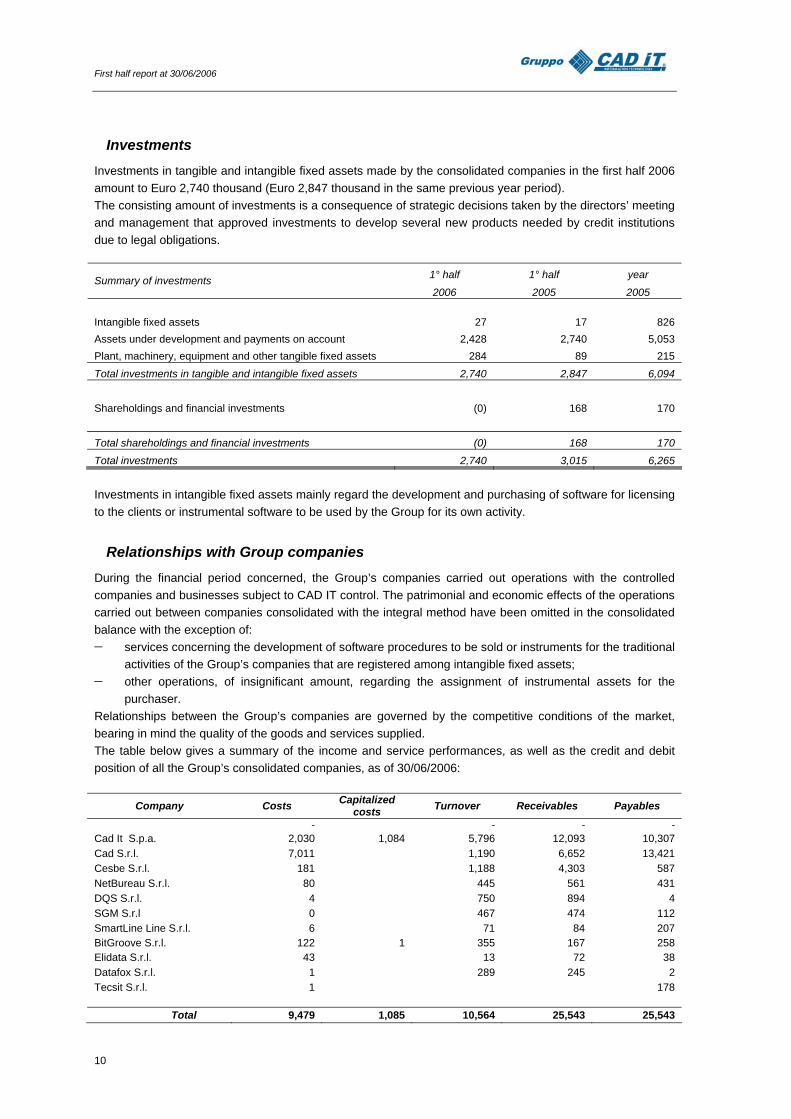
Investments Investments in tangible and intangible fixed assets made by the consolidated companies in the first half 2006 amount to Euro 2,740 thousand (Euro 2,847 thousand in the same previous year period). The consisting amount of investments is a consequence of strategic decisions taken by the directors’ meeting and management that approved investments to develop several new products needed by credit institutions due to legal obligations.
1° half 1° half year Summary of investments 2006 2005 2005
Intangible fixed assets 27 17 826 Assets under development and payments on account 2,428 2,740 5,053 Plant, machinery, equipment and other tangible fixed assets 284 89 215
Total investments in tangible and intangible fixed assets 2,740 2,847 6,094 Shareholdings and financial investments (0) 168 170
Total shareholdings and financial investments (0) 168 170 Total investments 2,740 3,015 6,265
Investments in intangible fixed assets mainly regard the development and purchasing of software for licensing to the clients or instrumental software to be used by the Group for its own activity.
Relationships with Group companies During the financial period concerned, the Group’s companies carried out operations with the controlled companies and businesses subject to CAD IT control. The patrimonial and economic effects of the operations carried out between companies consolidated with the integral method have been omitted in the consolidated balance with the exception of: − services concerning the development of software procedures to be sold or instruments for the traditional
activities of the Group’s companies that are registered among intangible fixed assets; − other operations, of insignificant amount, regarding the assignment of instrumental assets for the
purchaser. Relationships between the Group’s companies are governed by the competitive conditions of the market, bearing in mind the quality of the goods and services supplied. The table below gives a summary of the income and service performances, as well as the credit and debit position of all the Group’s consolidated companies, as of 30/06/2006:
Company Costs Capitalized costs Turnover Receivables Payables
- - - - Cad It S.p.a. 2,030 1,084 5,796 12,093 10,307 Cad S.r.l. 7,011 1,190 6,652 13,421 Cesbe S.r.l. 181 1,188 4,303 587 NetBureau S.r.l. 80 445 561 431 DQS S.r.l. 4 750 894 4 SGM S.r.l 0 467 474 112 SmartLine Line S.r.l. 6 71 84 207 BitGroove S.r.l. 122 1 355 167 258 Elidata S.r.l. 43 13 72 38 Datafox S.r.l. 1 289 245 2 Tecsit S.r.l. 1 178 Total 9,479 1,085 10,564 25,543 25,543
10
First half report at 30/06/2006
There have been no abnormal or unusual transactions between the CAD IT Group’s companies in this financial period. CAD IT S.p.A.’s relations with its subsidiaries are shown at the bottom of the accounting tables.
Related party Regarding the positions and transactions with related parties (other than those with subsidiary companies), it is hereby reported, in accordance with Consob decree no. 15519 of 27 July 2006, that sums of money for any security from the issuer or any direct or indirect subsidiary of the issuer, to members of the Board of Directors or Auditing Board, are not significantly different to last year. Furthermore, at present there are no managers with strategic roles or a Managing Director. Neither has a manager yet been nominated for the drawing up of accounting documents. This will be done in accordance with the conditions laid down by Law no. 262 of 28 December 2005 regarding the “Instructions for the protection of savings and financial market discipline.”
Corporate Governance On 28th March 2006, the Board of Directors approved the annual report in order to provide the CAD IT S.p.A. shareholders with adequate information about its own company management system and about how much the company adheres to the auto-disciplinary code for quoted companies laid down by the Corporate Governance Committee and promoted by Borsa Italiana S.p.A. Regarding the acknowledgment of European Community and national norms on market abuse, CAD IT S.p.A.’s Board of Directors also approved the following procedures − on 12 May 2006: procedure for the management and processing of confidential information with the aim
of regulating the management and processing of any information that has not yet been disclosed to the public and which could considerably affect the price of released financial instruments;
− on 11 August 2006: procedure for the drawing up and updating of a register of persons with access to confidential information, in accordance with art. 115-bis of Leg. Decree 58/1998 and art. 152-bis. 152-ter, 152-quater, 152-quinques of the Issuer Regulations;
− on 11 August 2006: procedure regarding internal dealing, a modification and replacement of the previous internal dealing behaviour code, with the aim of regulating the obligations and limitations concerning some types of transactions involving company financial instruments that some senior members of the company or persons closely related to them may make, in accordance with art. 114, paragraph 7 of Leg. Decree 58/1998 and art.152-sexies and subsequent points of the Issuer Regulations..
Programmatic document on security In reference to article 26 of attachment B of the Legislative Degree no. 196 of 30th June 2003, the programmatic document on security and personal data protection and the use of the measures stated within has been drafted and updated.
Financial instruments and risk management Given the type of financial instruments in its possession, the Group is not subject to exchange risks or significant risks regarding interest rates and liquidity. As for credit risk, the Group constantly monitors credits so that its clients respect payment terms and in order to contain the risk of any possible losses. The Group mainly operates with banks and companies controlled by banks and in past periods the event of credit losses concerning said clients has been minimal. No operations were carried out using derivate instruments during the period since it is not the company’s policy to carry out these kind of operations, whether for cover purposes or for negotiation.
11
First half report at 30/06/2006
2 Consolidated financial statements of the Group
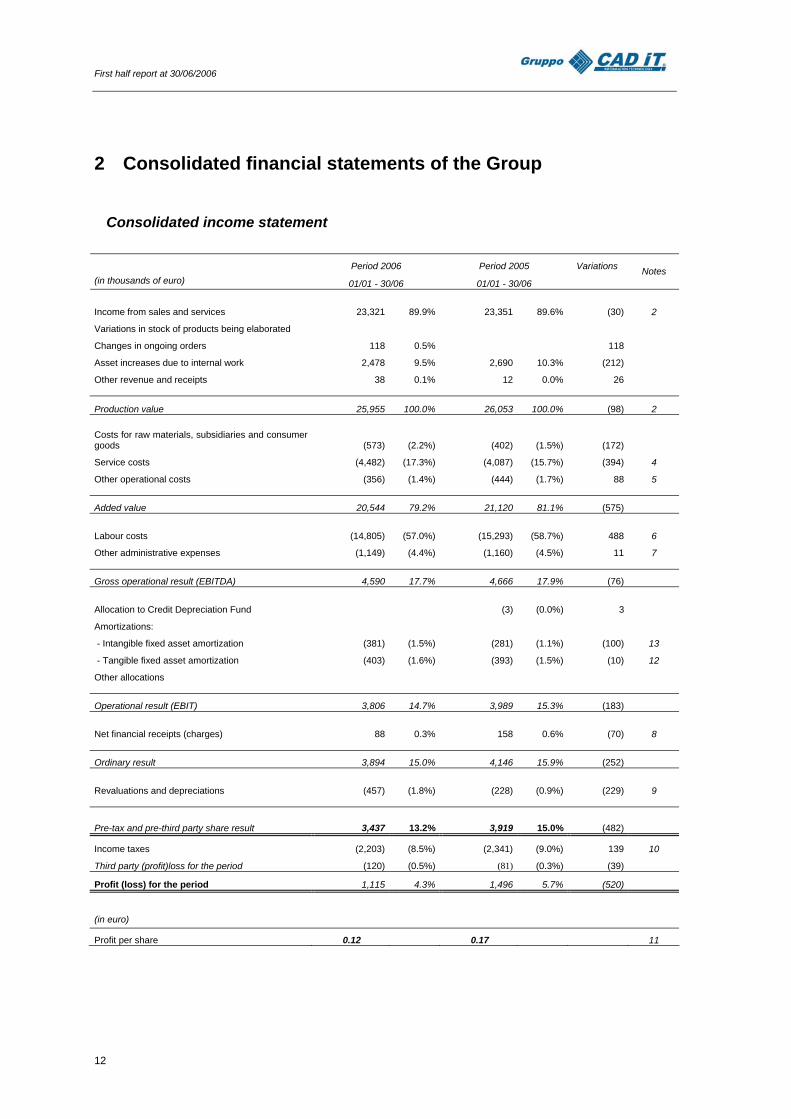
Consolidated income statement Period 2006 Period 2005 Variations (in thousands of euro) 01/01 - 30/06 01/01 - 30/06
Notes
Income from sales and services 23,321 89.9% 23,351 89.6% (30) 2
Variations in stock of products being elaborated
Changes in ongoing orders 118 0.5% 118
Asset increases due to internal work 2,478 9.5% 2,690 10.3% (212)
Other revenue and receipts 38 0.1% 12 0.0% 26
Production value 25,955 100.0% 26,053 100.0% (98) 2 Costs for raw materials, subsidiaries and consumer goods (573) (2.2%) (402) (1.5%) (172)
Service costs (4,482) (17.3%) (4,087) (15.7%) (394) 4
Other operational costs (356) (1.4%) (444) (1.7%) 88 5
Added value 20,544 79.2% 21,120 81.1% (575)
Labour costs (14,805) (57.0%) (15,293) (58.7%) 488 6
Other administrative expenses (1,149) (4.4%) (1,160) (4.5%) 11 7
Gross operational result (EBITDA) 4,590 17.7% 4,666 17.9% (76)
Allocation to Credit Depreciation Fund (3) (0.0%) 3
Amortizations:
- Intangible fixed asset amortization (381) (1.5%) (281) (1.1%) (100) 13
- Tangible fixed asset amortization (403) (1.6%) (393) (1.5%) (10) 12
Other allocations
Operational result (EBIT) 3,806 14.7% 3,989 15.3% (183)
Net financial receipts (charges) 88 0.3% 158 0.6% (70) 8
Ordinary result 3,894 15.0% 4,146 15.9% (252)
Revaluations and depreciations (457) (1.8%) (228) (0.9%) (229) 9
Pre-tax and pre-third party share result 3,437 13.2% 3,919 15.0% (482)
Income taxes (2,203) (8.5%) (2,341) (9.0%) 139 10
Third party (profit)loss for the period (120) (0.5%) (81) (0.3%) (39)
Profit (loss) for the period 1,115 4.3% 1,496 5.7% (520)
(in euro)
Profit per share 0.12 0.17 11
12
First half report at 30/06/2006
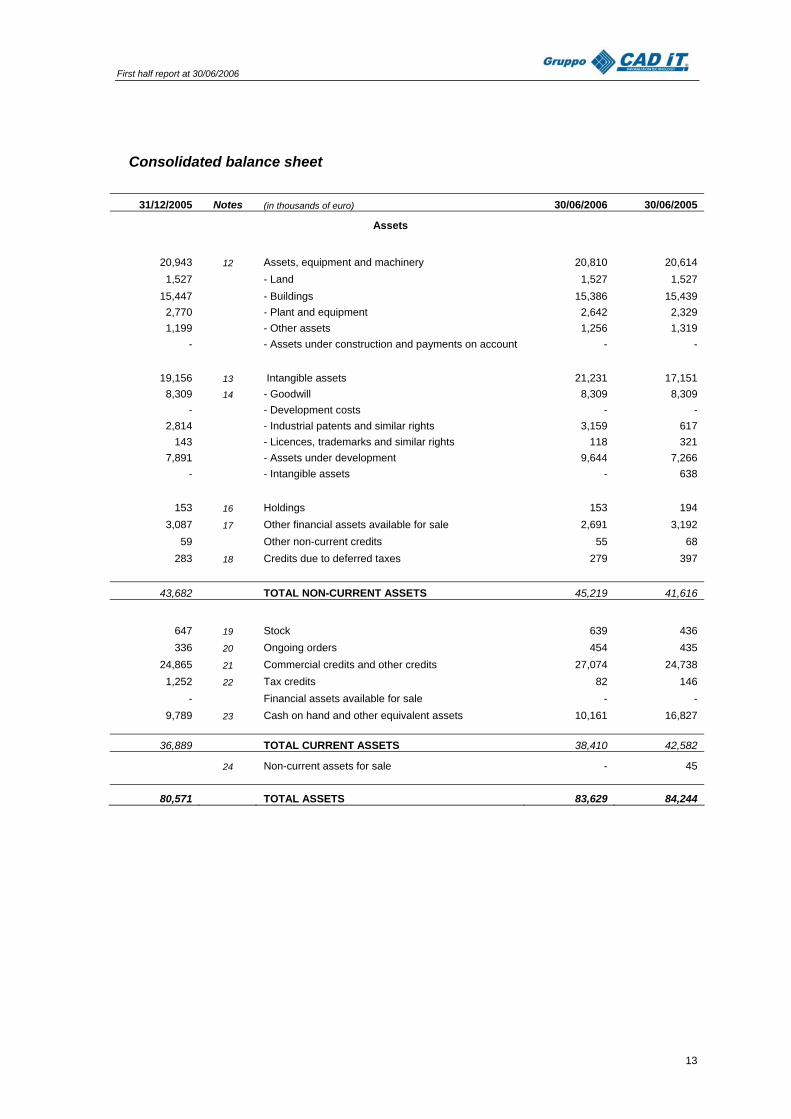
Consolidated balance sheet
31/12/2005 Notes (in thousands of euro) 30/06/2006 30/06/2005
Assets
20,943 12 Assets, equipment and machinery 20,810 20,614
1,527 - Land 1,527 1,527 15,447 - Buildings 15,386 15,439
2,770 - Plant and equipment 2,642 2,329 1,199 - Other assets 1,256 1,319
- - Assets under construction and payments on account - -
19,156 13 Intangible assets 21,231 17,151 8,309 14 - Goodwill 8,309 8,309
- - Development costs - - 2,814 - Industrial patents and similar rights 3,159 617
143 - Licences, trademarks and similar rights 118 321 7,891 - Assets under development 9,644 7,266
- - Intangible assets - 638
153 16 Holdings 153 194 3,087 17 Other financial assets available for sale 2,691 3,192
59 Other non-current credits 55 68 283 18 Credits due to deferred taxes 279 397
43,682 TOTAL NON-CURRENT ASSETS 45,219 41,616
647 19 Stock 639 436 336 20 Ongoing orders 454 435
24,865 21 Commercial credits and other credits 27,074 24,738 1,252 22 Tax credits 82 146
- Financial assets available for sale - - 9,789 23 Cash on hand and other equivalent assets 10,161 16,827
36,889 TOTAL CURRENT ASSETS 38,410 42,582
24 Non-current assets for sale - 45
80,571 TOTAL ASSETS 83,629 84,244
13
First half report at 30/06/2006
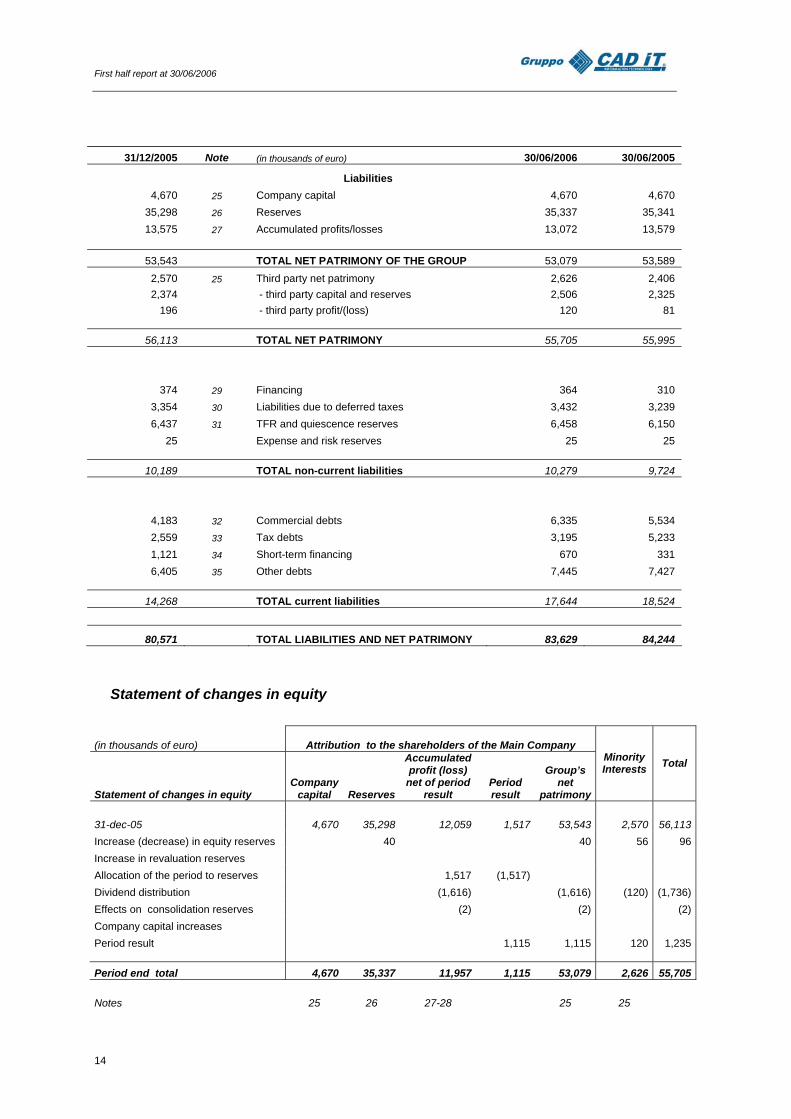
31/12/2005 Note (in thousands of euro) 30/06/2006 30/06/2005
Liabilities 4,670 25 Company capital 4,670 4,670
35,298 26 Reserves 35,337 35,341 13,575 27 Accumulated profits/losses 13,072 13,579
53,543 TOTAL NET PATRIMONY OF THE GROUP 53,079 53,589
2,570 25 Third party net patrimony 2,626 2,406 2,374 - third party capital and reserves 2,506 2,325
196 - third party profit/(loss) 120 81
56,113 TOTAL NET PATRIMONY 55,705 55,995
374 29 Financing 364 310
3,354 30 Liabilities due to deferred taxes 3,432 3,239 6,437 31 TFR and quiescence reserves 6,458 6,150
25 Expense and risk reserves 25 25
10,189 TOTAL non-current liabilities 10,279 9,724
4,183 32 Commercial debts 6,335 5,534 2,559 33 Tax debts 3,195 5,233 1,121 34 Short-term financing 670 331 6,405 35 Other debts 7,445 7,427
14,268 TOTAL current liabilities 17,644 18,524
80,571 TOTAL LIABILITIES AND NET PATRIMONY 83,629 84,244
Statement of changes in equity
(in thousands of euro) Attribution to the shareholders of the Main Company
Statement of changes in equity Company
capital Reserves
Accumulated profit (loss)
net of period result
Period result
Group’s net
patrimony
Minority Interests Total
31-dec-05 4,670 35,298 12,059 1,517 53,543 2,570 56,113 Increase (decrease) in equity reserves 40 40 56 96 Increase in revaluation reserves Allocation of the period to reserves 1,517 (1,517) Dividend distribution (1,616) (1,616) (120) (1,736) Effects on consolidation reserves (2) (2) (2) Company capital increases Period result 1,115 1,115 120 1,235 Period end total 4,670 35,337 11,957 1,115 53,079 2,626 55,705 Notes 25 26 27-28 25 25
14
First half report at 30/06/2006
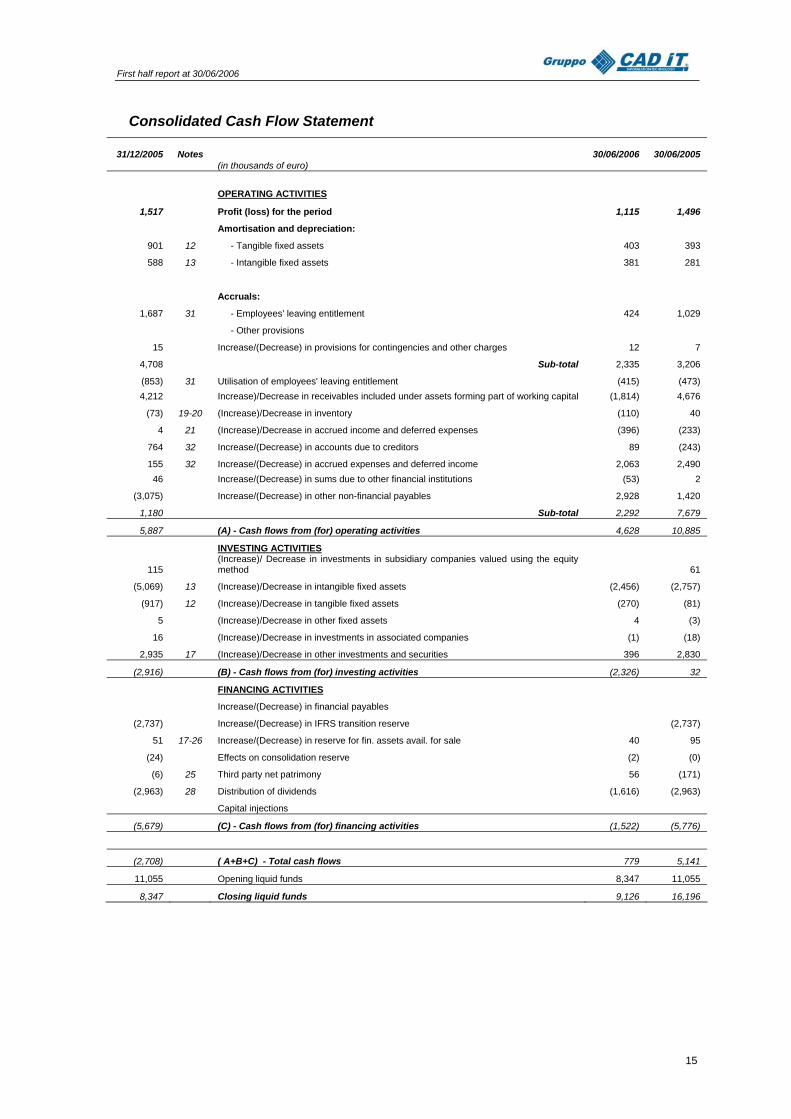
Consolidated Cash Flow Statement
31/12/2005 Notes (in thousands of euro)
30/06/2006 30/06/2005
OPERATING ACTIVITIES
1,517 Profit (loss) for the period 1,115 1,496
Amortisation and depreciation:
901 12 - Tangible fixed assets 403 393
588 13 - Intangible fixed assets 381 281
Accruals:
1,687 31 - Employees' leaving entitlement 424 1,029
- Other provisions
15 Increase/(Decrease) in provisions for contingencies and other charges 12 7
4,708 Sub-total 2,335 3,206
(853) 31 Utilisation of employees' leaving entitlement (415) (473) 4,212 Increase)/Decrease in receivables included under assets forming part of working capital (1,814) 4,676
(73) 19-20 (Increase)/Decrease in inventory (110) 40
4 21 (Increase)/Decrease in accrued income and deferred expenses (396) (233)
764 32 Increase/(Decrease) in accounts due to creditors 89 (243)
155 32 Increase/(Decrease) in accrued expenses and deferred income 2,063 2,490 46 Increase/(Decrease) in sums due to other financial institutions (53) 2
(3,075) Increase/(Decrease) in other non-financial payables 2,928 1,420
1,180 Sub-total 2,292 7,679
5,887 (A) - Cash flows from (for) operating activities 4,628 10,885
INVESTING ACTIVITIES
115 (Increase)/ Decrease in investments in subsidiary companies valued using the equity method 61
(5,069) 13 (Increase)/Decrease in intangible fixed assets (2,456) (2,757)
(917) 12 (Increase)/Decrease in tangible fixed assets (270) (81)
5 (Increase)/Decrease in other fixed assets 4 (3)
16 (Increase)/Decrease in investments in associated companies (1) (18)
2,935 17 (Increase)/Decrease in other investments and securities 396 2,830
(2,916) (B) - Cash flows from (for) investing activities (2,326) 32
FINANCING ACTIVITIES
Increase/(Decrease) in financial payables
(2,737) Increase/(Decrease) in IFRS transition reserve (2,737)
51 17-26 Increase/(Decrease) in reserve for fin. assets avail. for sale 40 95
(24) Effects on consolidation reserve (2) (0)
(6) 25 Third party net patrimony 56 (171)
(2,963) 28 Distribution of dividends (1,616) (2,963)
Capital injections
(5,679) (C) - Cash flows from (for) financing activities (1,522) (5,776)
(2,708) ( A+B+C) - Total cash flows 779 5,141
11,055 Opening liquid funds 8,347 11,055
8,347 Closing liquid funds 9,126 16,196
15
First half report at 30/06/2006
Notes to the financial statements CAD IT S.p.A. is a joint stock company and is governed on the basis of Italian law and exercises its management and coordinated activities on its own controlled companies. CAD IT S.p.a. is not subject to other company control in accordance with art. 2359 of the civil code. The company is listed in the STAR market of the Italian stock exchange. The company is listed in the STAR segment of the Italian stock exchange The registered office and the administrative and operating offices are in Via Torricelli no. 44/a, Verona, Italy. The company is registered in the Verona Company Register under no. 01992770238. Unless otherwise indicated, the monetary sums in the accounting tables and those in the notes are shown in thousands of Euro. Any minor differences deriving from rounding up figures to thousands of Euro are considered irrelevant. Due to this rounding up process, the sum of the individual entries in some of the tables containing exact figures may differ from the total amount.
1 Accounting policies and evaluation criteria more important
This half report has been prepared in accordance with Consob regulation no. 11971 of 14th May 1999, and subsequent modification and integration. The six-monthly report has been drafted in accordance with the international IAS/IFRS accounting standards issued by the International Accounting Standard Board (IASB) and approved by the European Union and is particularly in accordance with IAS 34 – Interim financial reporting. The balance tables are set out in accordance with the IAS 1 – Presentation of financial statements, while the notes contain the minimum content if relevant and not shown elsewhere in the interim reporting, in accordance with IAS 34. The accounting standards adopted are the same as those used for drafting the last annual balance and have been applied in the same manner throughout the periods shown and for all the Group’s companies. This document comprises consolidated financial statements, notes to the said financial statements, administrative staff observations on how management is progressing and the most important factors of the financial period, and the financial statements regarding the parent company. The consolidated balance has been drafted using the evaluation criterion of past cost, except for financial instruments available for sale, which are assessed at fair value, and the holdings in subsidiaries, which are assessed in accordance with the equity method. Moreover, where some land and buildings have been included in First Time Adoption, the fair value has been used instead of the cost.
Use of estimates
In accordance with the IFRS, when drafting the balance the company management formulates evaluations, estimates and hypotheses to apply the accounting standards which affect the amounts of credit and debit and the costs and revenues found in the balance. Estimates and their relative hypotheses are based on past experience and factors considered reasonable for the case concerned. Since they are estimates, the results obtained are not necessarily the same as the results portrayed. The estimates and hypotheses are reviewed on a regular basis. Any variations deriving from an accounting estimate review are shown in the period in which the review was made if such review only affects that period. If the review affects the current and future periods, the variation is recorded in the period in which the review is made and in the relative subsequent periods.
Balance sheet layout
The Group presents its economic account by nature, the format that is considered the most representative in terms of function presentation. In fact, the chosen format conforms to the internal reporting modalities and the business management and is in line with the way the economic account was represented in the past. As for the patrimonial situation, a distinction has been made between current and non-current assets and liabilities.
16
First half report at 30/06/2006
Subsidiary companies
The consolidation area includes the Parent company and the companies it controls, that is, where it has the power to determine financial and managerial policies of a business in order to reap benefits from said company’s activities. Subsidiary companies are consolidated from the date in which control was effectively transferred to the Group and are no longer consolidated as from the date that control becomes external to the Group. These companies are consolidated using the integral consolidation method. In order to prepare the consolidated data, the patrimonial, economic and financial situations of the subsidiary and associate companies have been used as prepared by the Group’s individual companies at the reference dates, opportunely reclassified and amended to reflect the application of the homogeneous accounting standards. In drafting the consolidated balance all the balances and significant transactions between the Group’s companies have been eliminated, as are all unrealised infra-group profit and loss transactions. Inactive controlled companies or those that generated an insignificant volume of business are consolidated using the net patrimony method. Their effect on the total activity, on liabilities, on the financial position and result of the Group is insignificant.
Associated companies
The share in associated companies, that is those companies in which the Group has significant influence, is evaluated using the net patrimony method, as defined in IAS 28 – Investments in Associates. The profits or losses relevant to the Group are included in the consolidated balance from the date in which this considerable influence began up to the moment it ceases.
Property, plant and equipment
Tangible fixed assets are shown at purchase cost, including any costs that may be directly ascribable and necessary for activating the asset and putting it to the use for which it was purchased. In reference to land and buildings listed in First Time Adoption, the fair value was used instead of the cost. Tangible fixed assets are shown at net value of the relative accumulated depreciations and losses due to the reduction in value determined in accordance with the modalities described below. Tangible fixed assets are amortised in constant rates during the course of their expected useful life cycle, i.e. the estimated period of time in which the asset will be put to company use. Whenever significant parts of tangible fixed assets have different estimated useful life cycles, said components are amortised separately. The value to be depreciated is given by the registered value of the asset net of any loss in value and reduced by its assumed value at the end of its useful life cycle, if significant and reasonably calculable. The useful life cycle and the cash value are reassessed annually and any changes, where necessary, are brought in with a perspective application. The main economic-technical tax rates used are the following: − industrial buildings: 3% − electrical equipment: from 5 to 10% − air conditioning equipment: from 6 to 15% − telephone systems: 20% − alarm systems: from 10 to 30% − furniture and fittings: 12% − electrical machinery: 15% − electronic machines and computers: 20% − vehicles: 25% Land, both without buildings or next to civil and industrial constructions, is accounted for separately and not amortised as it is considered an element with an unlimited useful life cycle. In order to calculate any losses due to depreciation, the accounting value of intangible fixed assets is subject to verification. At the time of elimination or when no future economic benefit can be expected from the use of an asset, it is eliminated from the balance and the eventual loss or profit (calculated as the difference between the
17
First half report at 30/06/2006
assignment value and the taxation value) is shown in the economic account of the year in which the asset is eliminated.
Financial leasing
Assets owned through financial leasing contracts, through which all the risks and benefits tied to the property are transferred to the Group, are registered among the Group assets at their fair value or, if this value is lower, at the present value of the minimum payments due for the leasing and depreciated by applying coherent criteria to the other assets. The corresponding liability towards the lessor is registered in the balance among the financial debts.
Intangible fixed assets
Intangible fixed assets are shown as such when it is likely that they will bring in future economic benefits for the company and when the asset cost can be feasibly determined. Intangible fixed assets, having a defined useful life cycle, are subsequently registered net of the relative accumulated amortizations and any losses due to a durable reduction in value, determined in the same way as previously described for tangible fixed assets. The useful life cycle is reassessed annually and any changes, where necessary, are brought in with a perspective application. Profits or losses deriving from the transfer of an intangible fixed asset are determined as the difference between the elimination value and taxation value of said asset and are reported on the economic account at the time of elimination. Project development costs for the production of instrumental software, or those to be terminated, are registered on the credit side when they satisfy the following conditions: the costs can be feasibly determined, the product is technically feasible, the expected use and/or sale of the product indicate that the sustained costs will generate future economic benefits. In respect of the standard that correlates costs and returns, such costs are amortized as from the date shown for the sales of the products in relation to the project concerned and according to the life cycle calculated for the products themselves, estimated over about five years, which is taken as not less than the period of effective use. The costs of internally generated intangible assets include any expenses that can be directly attributable to the development of the product and any reasonable part of general production costs attributable to the preparation stages before putting the product to use. All other development costs that cannot be capitalised, when sustained, are reported on the income statement.
Goodwill
Goodwill resulting from the purchase of controlled and incorporate companies is initially registered at cost and is the overbalance of the purchase cost in respect of the purchaser’s share of the fair value of the assets and liabilities and the potential liabilities at the date of purchase. After the initial registration, goodwill is no longer amortised and is decremented of any losses in accumulated value, calculated according to the IAS 36 Asset value reduction. Starting-up regarding shares in incorporate companies is included in the taxation value of said companies. Goodwill is subject to an annual analysis of retrievableness or at shorter intervals if something happens or changes in circumstances arise, which could cause losses in value. Goodwill deriving from purchases made prior to 1st January 2004 is registered at the recorded value ascribed to it in the last balance drafted on the basis of the previous accounting standards (31st December 2003). In fact, during the preparation of the opening balance in accordance with the international accounting standards, none of the purchase transactions made prior to 1st January 2004 have been re-considered.
Impairment loss
The Group annually verifies the accountable value of intangible and tangible assets or more often whenever there is an indication that assets may have suffered a value loss. If the charged value exceeds the recoverable value, the assets are devalued to reflect their recoverable
18
First half report at 30/06/2006
value, represented by the greatest figure between the net price and use value. In defining the use value, expected future financial flows are discounted back using a pre-tax discount rate that reflects the current market estimations in reference to the cost of money at the time and the specific risks of the asset in question. For an asset that does not generate widely independent financial flows, the return value is determined in relation to the unit generating the financial flows of which the asset is a part. The value losses are accounted for in the economic account among depreciation and devaluation costs. When subsequently an asset value loss, different from the beginning, is less or decreases, the accounting value is increased to a new estimate of the recoverable value within the limit of the previous value loss. The recovery of a value loss is registered to the economic account.
Assets available for sale
Share in non-consolidated companies are classified as assets financially available for sale and are valued at fair value. For any shares quoted as fair value, this value has been taken as the market value. The profits and losses found due to the effect of evaluation at fair value at every balance date for these activities were determined at net patrimony except for the value losses registered to the economic account.
Other non-current credits
These are registered at their nominal value, representative of their fair value.
Stock
Leftover stock is valued as the lesser value between purchase cost and the net value of the assumed income. The cost is determined in accordance with the average calculated cost method.
On-going orders
On-going construction contracts are valued with reasonable certainty on the basis of the matured contractual fees according to the criterion of percentage completion (so-called cost to cost), so as to attribute the profits and the economic result of the order to each single financial period concerned in proportion to the progress of the work.
Commercial credits and other credits
Commercial credits, whose expiry limits are within normal commercial terms, are not updated and are registered at their nominal value net of any loss of value. Moreover, they are adjusted to their assumed cash value by means of the registration of an appropriate amendment fund.
Liquid asset availability and equivalent means
The availability of liquid assets and equivalent means is registered at nominal value and has the requirements to be immediately available or available at very short notice, without obstacles and with no significant expense for collection.
Non current assets held for sale
The voice includes non-cash assets, the value of which will mostly be recovered by their sale rather than through their continuous use. These assets are valued as the lesser value between the net accounting value and the cash value net of sales costs.
Employee leaving entitlement
The present value of debts related to employees for benefits allocated in connection with or following the termination of working relationships through defined benefit programmes is calculated on the basis of the method of projecting the credit in accordance with the indications in IAS 19. Therefore, the amount reflects eventual future wage increases and the correlated statistic dynamics. The liability evaluation is calculated by private actuaries.
19
First half report at 30/06/2006
The profits and losses deriving form these evaluations are ascribed to the income statement.
Risk and obligation funds
In accordance with the IAS 37, the allocations are shown when there is an ongoing obligation (legal or implicit) that stems from a past event, whenever an outlay may be necessary to satisfy the obligation and a feasible estimation may be made on the obligation amount. If the effect of updating the assumed cash value is significant, the allocations are calculated by updating the expected future financial flows at a pre-tax discount rate that reflects the current market evaluation of the cash value in relation to time. When updating has been done, the increase in the allocation caused by the passing of time is shown as a financial obligation
Commercial debts and other current liabilities
The commercial debts, whose deadlines are within normal commercial terms, are not updated and are registered at cost (identified by their nominal value). Financial liabilities are initially shown at cost, which corresponds to the fair value of the liability, net of transition costs, which are directly attributable to the issue of the liability itself. After the initial determination, the financial liabilities are assessed with the criterion of amortized cost using the original effective tax rate method.
Revenues and costs
The revenues and costs are determined in accordance with the qualifying economic principle to the amount to which the fair value can be feasibly determined. Depending on the type of operation, the revenues are determined on the basis of the specific criteria reported below: the revenues for services are determined with reference to the point at which they stand on the basis of the same criteria used for determining the position of ongoing orders. If it is not possible to feasibly determine the revenue values, they are then calculated until they concur with the amount of expenses sustained and which are deemed recoverable. the profits from the sale of goods are shown when significant risks and benefits of the ownership of the goods are transferred to the purchaser, the sale price is agreed or can be determined and payment is collected. As for sales concerning assistance and/or maintenance services carried out with the annual subscription formula, the accrual is calculated in proportion with time. The costs are ascribed in the balance according to the same criteria as those for revenue acknowledgment.
Income taxes
Current income taxes for the financial period are calculated on the basis of estimates of taxable income in accordance with the laws in vigour: Moreover, the effects deriving from the activation within the Group of the national tax consolidation are also taken into account. The debt for current taxes is accounted for in the patrimonial status, net of any taxes paid in advance. Deferred and pre-paid income taxes are calculated on the temporary differences between the patrimonial values registered in accordance with the IFRS international accounting standards and the corresponding values realised for tax purposes. In particular, assets due to pre-paid taxes are registered when their recovery is probable, that is, when it is expected that sufficient tax profits will be available in the future so that these assets may be used. The degree of recovery of pre-paid tax assets is re-examined at the end of every period. Deferred taxes are always calculated in compliance with the IAS 12.
20
First half report at 30/06/2006
2 Revenues
The revenues gained in the period by the Group are subdivided as follows: Revenues Period 2006 Period 2005 Variations 01/01 - 30/06 01/01 - 30/06 Income from sales and services 23,321 89.9% 23,351 89.6% (30)
Variations in stock of products being elaborated
Changes in ongoing orders 118 0.5% 118
Asset increases due to internal work 2,478 9.5% 2,690 10.3% (212)
Other revenue and receipts 38 0.1% 12 0.0% 26
Production value 25,955 100.0% 26,053 100.0% (98)
The Group’s activities are not, on the whole, affected by significant cyclical or seasonal variations in total sales during the financial period.
3 Segment reporting by sectors and geographical areas
The internal organisational and managerial structure and the internal reporting for the Board of Directors is presently grouped into two operative divisions: Finance and Manufacturing. These divisions are the basis on which the Group reports sector information according to the primary layout. The main activities of each sector are as follows: − Finance: includes the computer applications aimed specifically at banks and other financial institutions.
The main applications provide: o management of intermediary activities on securities, funds and derivate instruments; o management of the typical services in the credit sector, such as the collection, treasury and
monitoring of credit procedures; o service allocation for trading on line; o management of integrated banking computer systems; o consultancy and training.
− Manufacturing: includes the development and marketing of instruments and software applications and offers a series of services aimed at allowing the companies to effectively manage numerous company processes, including Outsourcing.
The data not allocated to the sectors mainly refer to income and costs for logistics and administration services given to the group’s companies by the controlling party.
Disclosures for business segments 30/06/2006 Finance Manufacturing Not allocated/General Elisions ConsolidatedExternal revenues 24,050 1,905 - - 25,955Intersegment revenues 1,547 785 - (2,332) -Total revenues 25,597 2,690 - (2,332) 25,955Costs (21,351) (2,446) (684) 2,332 (22,149)Gross Operating Result (EBITDA) 4,894 381 (684) - 4,590Operating Result (EBIT) 4,247 244 (684) - 3,806Net financial income (expenses) - - 88 - 88Revaluations and devaluations (457) - - - (457)Result 3,790 244 (596) - 3,437Income taxes - - (2,203) - (2,203)Third party share (profit)/loss - (120)Financial period profit (loss) - 1,115
21
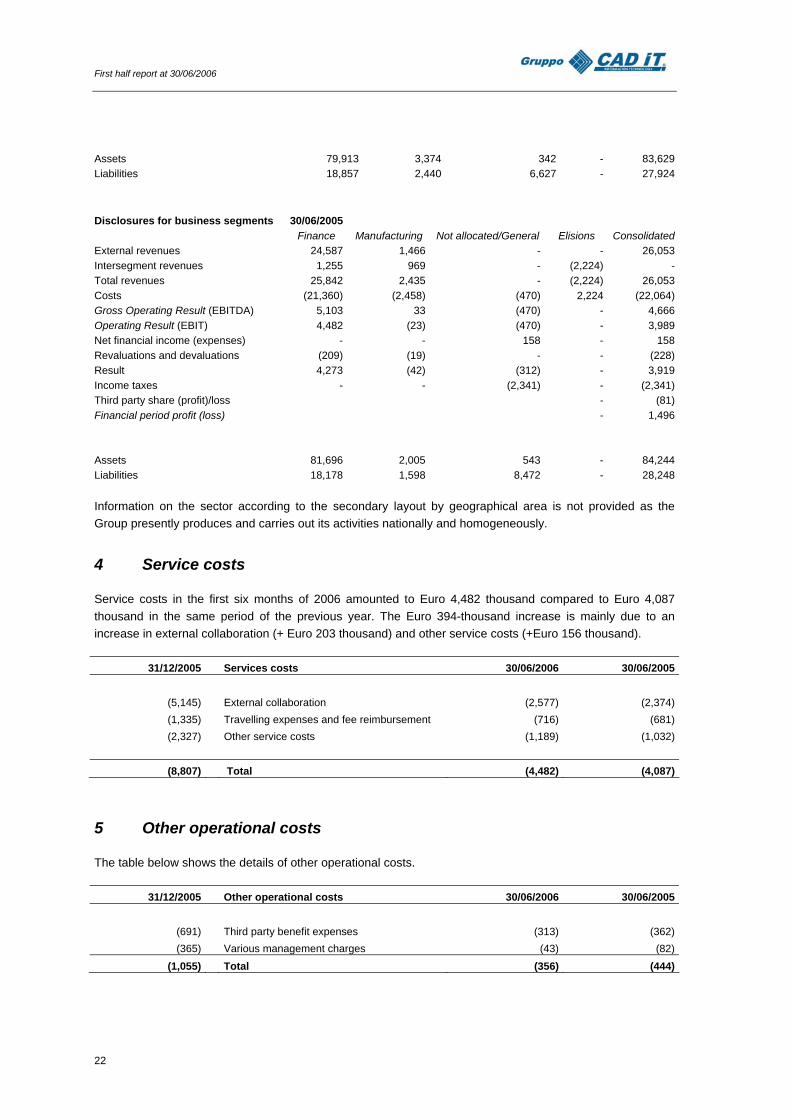
First half report at 30/06/2006
Assets 79,913 3,374 342 - 83,629Liabilities 18,857 2,440 6,627 - 27,924
Disclosures for business segments 30/06/2005 Finance Manufacturing Not allocated/General Elisions ConsolidatedExternal revenues 24,587 1,466 - - 26,053Intersegment revenues 1,255 969 - (2,224) -Total revenues 25,842 2,435 - (2,224) 26,053Costs (21,360) (2,458) (470) 2,224 (22,064)Gross Operating Result (EBITDA) 5,103 33 (470) - 4,666Operating Result (EBIT) 4,482 (23) (470) - 3,989Net financial income (expenses) - - 158 - 158Revaluations and devaluations (209) (19) - - (228)Result 4,273 (42) (312) - 3,919Income taxes - - (2,341) - (2,341)Third party share (profit)/loss - (81)Financial period profit (loss) - 1,496 Assets 81,696 2,005 543 - 84,244Liabilities 18,178 1,598 8,472 - 28,248
Information on the sector according to the secondary layout by geographical area is not provided as the Group presently produces and carries out its activities nationally and homogeneously.
4 Service costs
Service costs in the first six months of 2006 amounted to Euro 4,482 thousand compared to Euro 4,087 thousand in the same period of the previous year. The Euro 394-thousand increase is mainly due to an increase in external collaboration (+ Euro 203 thousand) and other service costs (+Euro 156 thousand).
31/12/2005 Services costs 30/06/2006 30/06/2005
(5,145) External collaboration (2,577) (2,374)(1,335) Travelling expenses and fee reimbursement (716) (681)(2,327) Other service costs (1,189) (1,032)
(8,807) Total (4,482) (4,087)
5 Other operational costs
The table below shows the details of other operational costs.
31/12/2005 Other operational costs 30/06/2006 30/06/2005
(691) Third party benefit expenses (313) (362)(365) Various management charges (43) (82)
(1,055) Total (356) (444)
22
First half report at 30/06/2006
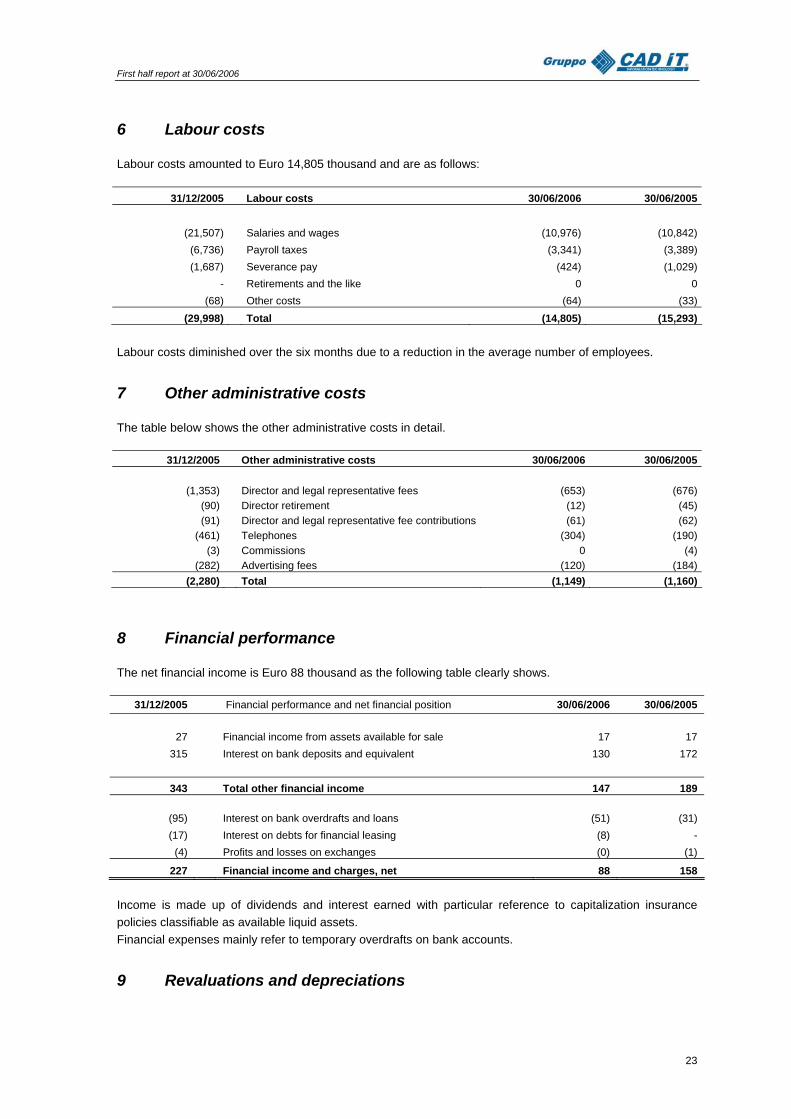
6 Labour costs
Labour costs amounted to Euro 14,805 thousand and are as follows:
31/12/2005 Labour costs 30/06/2006 30/06/2005
(21,507) Salaries and wages (10,976) (10,842)(6,736) Payroll taxes (3,341) (3,389)(1,687) Severance pay (424) (1,029)
- Retirements and the like 0 0(68) Other costs (64) (33)
(29,998) Total (14,805) (15,293) Labour costs diminished over the six months due to a reduction in the average number of employees.
7 Other administrative costs
The table below shows the other administrative costs in detail.
31/12/2005 Other administrative costs 30/06/2006 30/06/2005
(1,353) Director and legal representative fees (653) (676)(90) Director retirement (12) (45)(91) Director and legal representative fee contributions (61) (62)
(461) Telephones (304) (190)(3) Commissions 0 (4)
(282) Advertising fees (120) (184)(2,280) Total (1,149) (1,160)
8 Financial performance
The net financial income is Euro 88 thousand as the following table clearly shows. 31/12/2005 Financial performance and net financial position 30/06/2006 30/06/2005
27 Financial income from assets available for sale 17 17
315 Interest on bank deposits and equivalent 130 172
343 Total other financial income 147 189
(95) Interest on bank overdrafts and loans (51) (31) (17) Interest on debts for financial leasing (8) -
(4) Profits and losses on exchanges (0) (1)
227 Financial income and charges, net 88 158
Income is made up of dividends and interest earned with particular reference to capitalization insurance policies classifiable as available liquid assets. Financial expenses mainly refer to temporary overdrafts on bank accounts.
9 Revaluations and depreciations
23
First half report at 30/06/2006
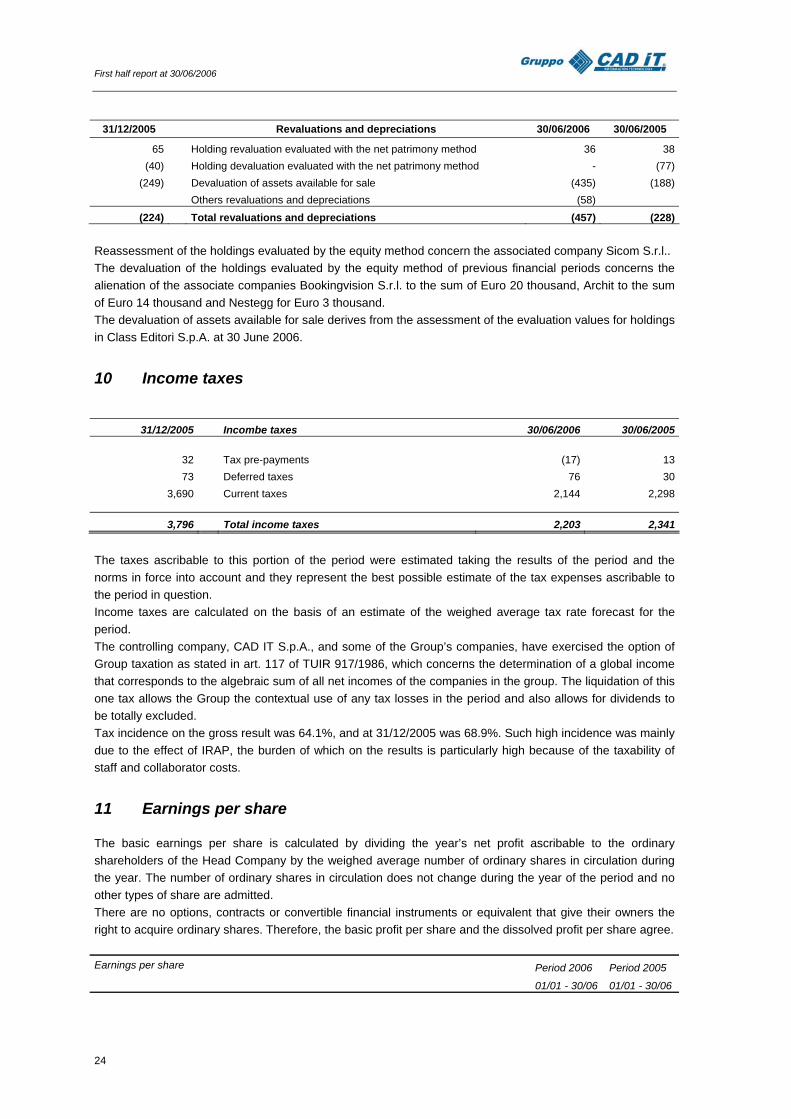
31/12/2005 Revaluations and depreciations 30/06/2006 30/06/2005
65 Holding revaluation evaluated with the net patrimony method 36 38 (40) Holding devaluation evaluated with the net patrimony method - (77)
(249) Devaluation of assets available for sale (435) (188) Others revaluations and depreciations (58)
(224) Total revaluations and depreciations (457) (228) Reassessment of the holdings evaluated by the equity method concern the associated company Sicom S.r.l.. The devaluation of the holdings evaluated by the equity method of previous financial periods concerns the alienation of the associate companies Bookingvision S.r.l. to the sum of Euro 20 thousand, Archit to the sum of Euro 14 thousand and Nestegg for Euro 3 thousand. The devaluation of assets available for sale derives from the assessment of the evaluation values for holdings in Class Editori S.p.A. at 30 June 2006.
10 Income taxes
31/12/2005 Incombe taxes 30/06/2006 30/06/2005
32 Tax pre-payments (17) 1373 Deferred taxes 76 30
3,690 Current taxes 2,144 2,298
3,796 Total income taxes 2,203 2,341
The taxes ascribable to this portion of the period were estimated taking the results of the period and the norms in force into account and they represent the best possible estimate of the tax expenses ascribable to the period in question. Income taxes are calculated on the basis of an estimate of the weighed average tax rate forecast for the period. The controlling company, CAD IT S.p.A., and some of the Group’s companies, have exercised the option of Group taxation as stated in art. 117 of TUIR 917/1986, which concerns the determination of a global income that corresponds to the algebraic sum of all net incomes of the companies in the group. The liquidation of this one tax allows the Group the contextual use of any tax losses in the period and also allows for dividends to be totally excluded. Tax incidence on the gross result was 64.1%, and at 31/12/2005 was 68.9%. Such high incidence was mainly due to the effect of IRAP, the burden of which on the results is particularly high because of the taxability of staff and collaborator costs.
11 Earnings per share
The basic earnings per share is calculated by dividing the year’s net profit ascribable to the ordinary shareholders of the Head Company by the weighed average number of ordinary shares in circulation during the year. The number of ordinary shares in circulation does not change during the year of the period and no other types of share are admitted. There are no options, contracts or convertible financial instruments or equivalent that give their owners the right to acquire ordinary shares. Therefore, the basic profit per share and the dissolved profit per share agree. Earnings per share Period 2006 Period 2005 01/01 - 30/06 01/01 - 30/06
24
First half report at 30/06/2006
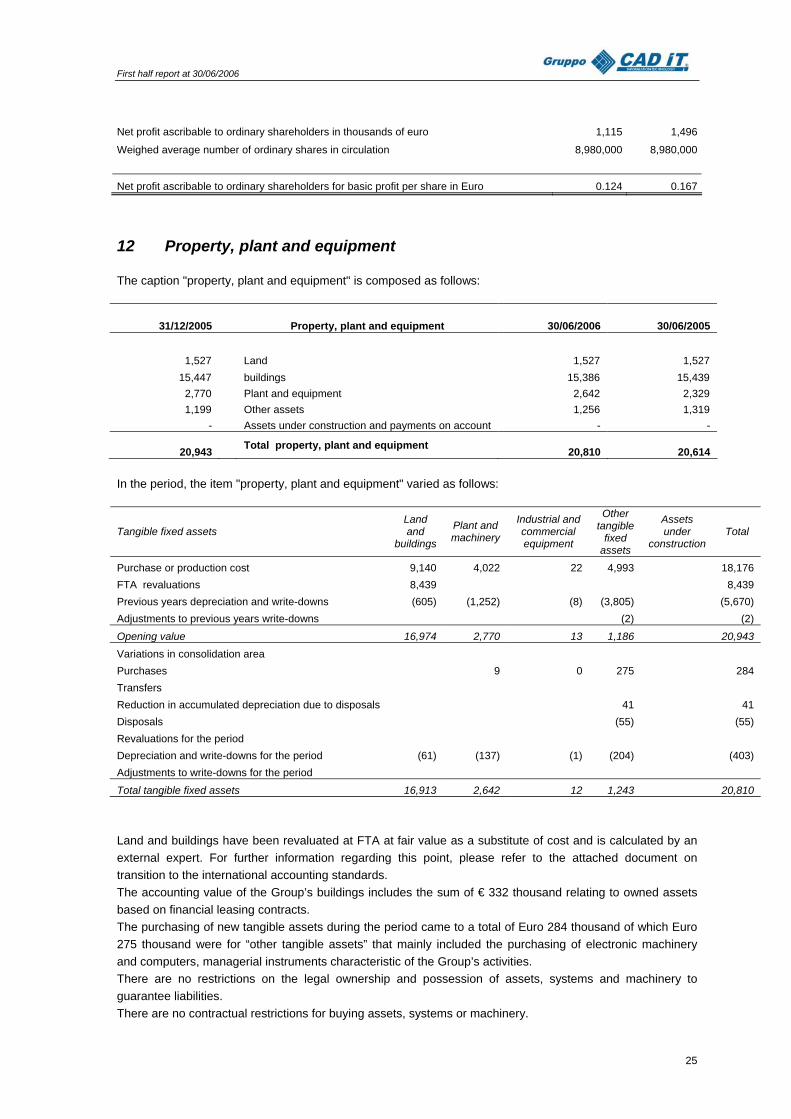
Net profit ascribable to ordinary shareholders in thousands of euro 1,115 1,496
Weighed average number of ordinary shares in circulation 8,980,000 8,980,000
Net profit ascribable to ordinary shareholders for basic profit per share in Euro 0.124 0.167
12 Property, plant and equipment
The caption "property, plant and equipment" is composed as follows:
31/12/2005 Property, plant and equipment 30/06/2006 30/06/2005 1,527 Land 1,527 1,527 15,447 buildings 15,386 15,439 2,770 Plant and equipment 2,642 2,329 1,199 Other assets 1,256 1,319 - Assets under construction and payments on account - -
20,943 Total property, plant and equipment 20,810 20,614
In the period, the item "property, plant and equipment" varied as follows:
Tangible fixed assets Land and
buildings
Plant and machinery
Industrial and commercial equipment
Other tangible
fixed assets
Assets under
construction Total
Purchase or production cost 9,140 4,022 22 4,993 18,176 FTA revaluations 8,439 8,439 Previous years depreciation and write-downs (605) (1,252) (8) (3,805) (5,670) Adjustments to previous years write-downs (2) (2)
Opening value 16,974 2,770 13 1,186 20,943 Variations in consolidation area Purchases 9 0 275 284 Transfers Reduction in accumulated depreciation due to disposals 41 41 Disposals (55) (55) Revaluations for the period Depreciation and write-downs for the period (61) (137) (1) (204) (403) Adjustments to write-downs for the period
Total tangible fixed assets 16,913 2,642 12 1,243 20,810 Land and buildings have been revaluated at FTA at fair value as a substitute of cost and is calculated by an external expert. For further information regarding this point, please refer to the attached document on transition to the international accounting standards. The accounting value of the Group’s buildings includes the sum of € 332 thousand relating to owned assets based on financial leasing contracts. The purchasing of new tangible assets during the period came to a total of Euro 284 thousand of which Euro 275 thousand were for “other tangible assets” that mainly included the purchasing of electronic machinery and computers, managerial instruments characteristic of the Group’s activities. There are no restrictions on the legal ownership and possession of assets, systems and machinery to guarantee liabilities. There are no contractual restrictions for buying assets, systems or machinery.
25
First half report at 30/06/2006
During the six month period, situations indicating that assets may be impaired and may need a formal estimation of their recoverable value have not been found.
13 Intangible fixed assets
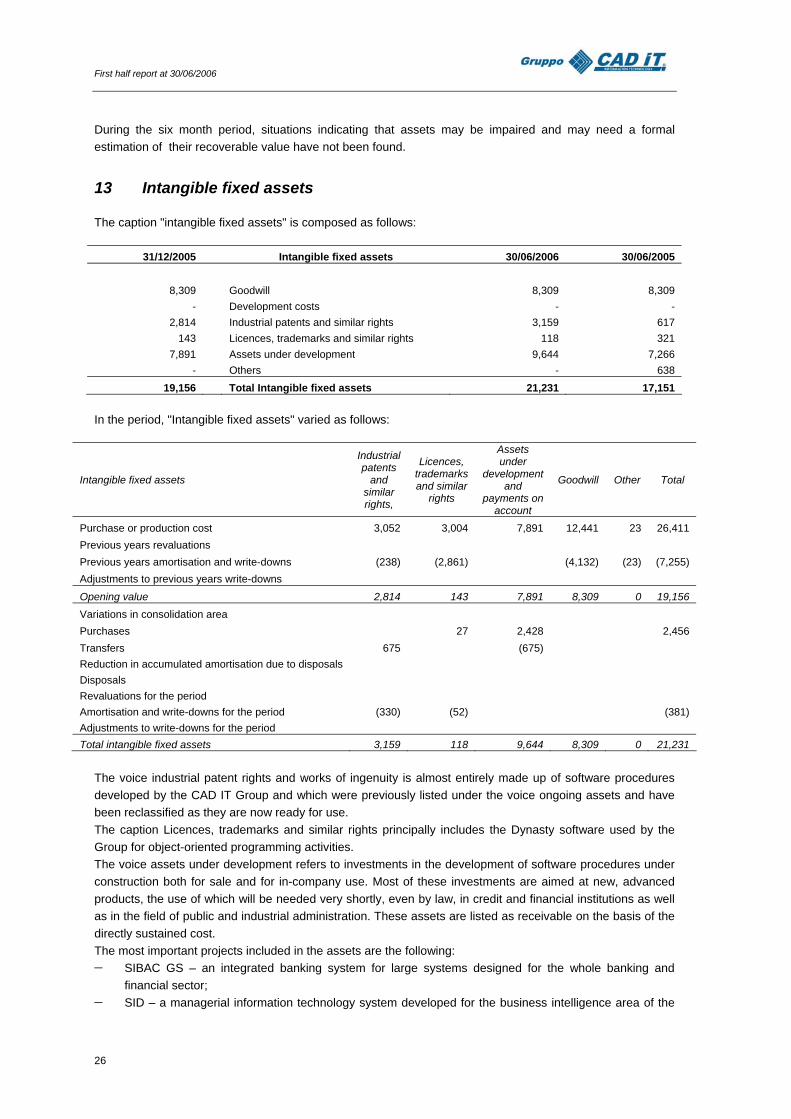
The caption "intangible fixed assets" is composed as follows:
31/12/2005 Intangible fixed assets 30/06/2006 30/06/2005
8,309 Goodwill 8,309 8,309 - Development costs - -
2,814 Industrial patents and similar rights 3,159 617 143 Licences, trademarks and similar rights 118 321
7,891 Assets under development 9,644 7,266 - Others - 638
19,156 Total Intangible fixed assets 21,231 17,151
In the period, "Intangible fixed assets" varied as follows:
Intangible fixed assets
Industrial patents
and similar rights,
Licences, trademarks and similar
rights
Assets under
development and
payments on account
Goodwill Other Total
Purchase or production cost 3,052 3,004 7,891 12,441 23 26,411 Previous years revaluations Previous years amortisation and write-downs (238) (2,861) (4,132) (23) (7,255) Adjustments to previous years write-downs
Opening value 2,814 143 7,891 8,309 0 19,156 Variations in consolidation area Purchases 27 2,428 2,456 Transfers 675 (675) Reduction in accumulated amortisation due to disposals Disposals Revaluations for the period Amortisation and write-downs for the period (330) (52) (381) Adjustments to write-downs for the period Total intangible fixed assets 3,159 118 9,644 8,309 0 21,231
The voice industrial patent rights and works of ingenuity is almost entirely made up of software procedures developed by the CAD IT Group and which were previously listed under the voice ongoing assets and have been reclassified as they are now ready for use. The caption Licences, trademarks and similar rights principally includes the Dynasty software used by the Group for object-oriented programming activities. The voice assets under development refers to investments in the development of software procedures under construction both for sale and for in-company use. Most of these investments are aimed at new, advanced products, the use of which will be needed very shortly, even by law, in credit and financial institutions as well as in the field of public and industrial administration. These assets are listed as receivable on the basis of the directly sustained cost. The most important projects included in the assets are the following: − SIBAC GS – an integrated banking system for large systems designed for the whole banking and
financial sector; − SID – a managerial information technology system developed for the business intelligence area of the
26
First half report at 30/06/2006
banking system; − Libro Soci – a procedure for the management of quoted company books designed for the whole banking
system; − Fiscalità locale (Local taxation)– a procedure for the management of local taxes designed for the public
administration and public body sector; − GPM4 – this is a procedure aimed mainly at banks and financial companies who deal with savings as it
manages property patrimony by simulating investment portfolios. The fundamental condition for their registration in patrimonial credit is that said costs concern clearly defined, distinguishable and measurable products or processes and that they relate to projects that are both technically feasible and economically recoverable through revenues that will develop in the future by application of the project itself. The values are registered at credit to the directly sustained cost including the cost concerning the use of internal company resources as well as any extra expenses that may be added to the original cost. In respect of the principle that correlates cost and gain, these costs are depreciated as from the date of the sale of products correlated to these projects and in terms of the life-cycle of the products themselves, which is estimated at five years. During the six month period, situations indicating that assets may be impaired and may need a formal estimation of their recoverable value have not been found.
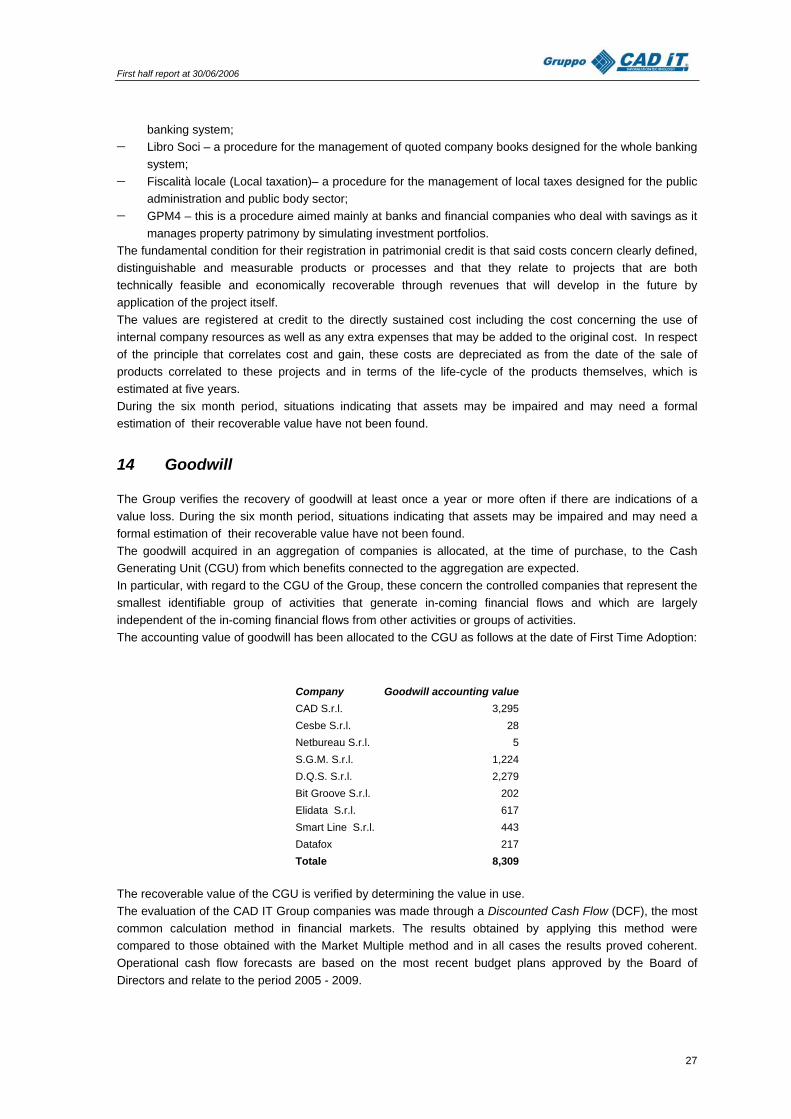
14 Goodwill
The Group verifies the recovery of goodwill at least once a year or more often if there are indications of a value loss. During the six month period, situations indicating that assets may be impaired and may need a formal estimation of their recoverable value have not been found. The goodwill acquired in an aggregation of companies is allocated, at the time of purchase, to the Cash Generating Unit (CGU) from which benefits connected to the aggregation are expected. In particular, with regard to the CGU of the Group, these concern the controlled companies that represent the smallest identifiable group of activities that generate in-coming financial flows and which are largely independent of the in-coming financial flows from other activities or groups of activities. The accounting value of goodwill has been allocated to the CGU as follows at the date of First Time Adoption:
Company Goodwill accounting valueCAD S.r.l. 3,295Cesbe S.r.l. 28Netbureau S.r.l. 5S.G.M. S.r.l. 1,224D.Q.S. S.r.l. 2,279Bit Groove S.r.l. 202Elidata S.r.l. 617Smart Line S.r.l. 443Datafox 217Totale 8,309
The recoverable value of the CGU is verified by determining the value in use. The evaluation of the CAD IT Group companies was made through a Discounted Cash Flow (DCF), the most common calculation method in financial markets. The results obtained by applying this method were compared to those obtained with the Market Multiple method and in all cases the results proved coherent. Operational cash flow forecasts are based on the most recent budget plans approved by the Board of Directors and relate to the period 2005 - 2009.
27
First half report at 30/06/2006
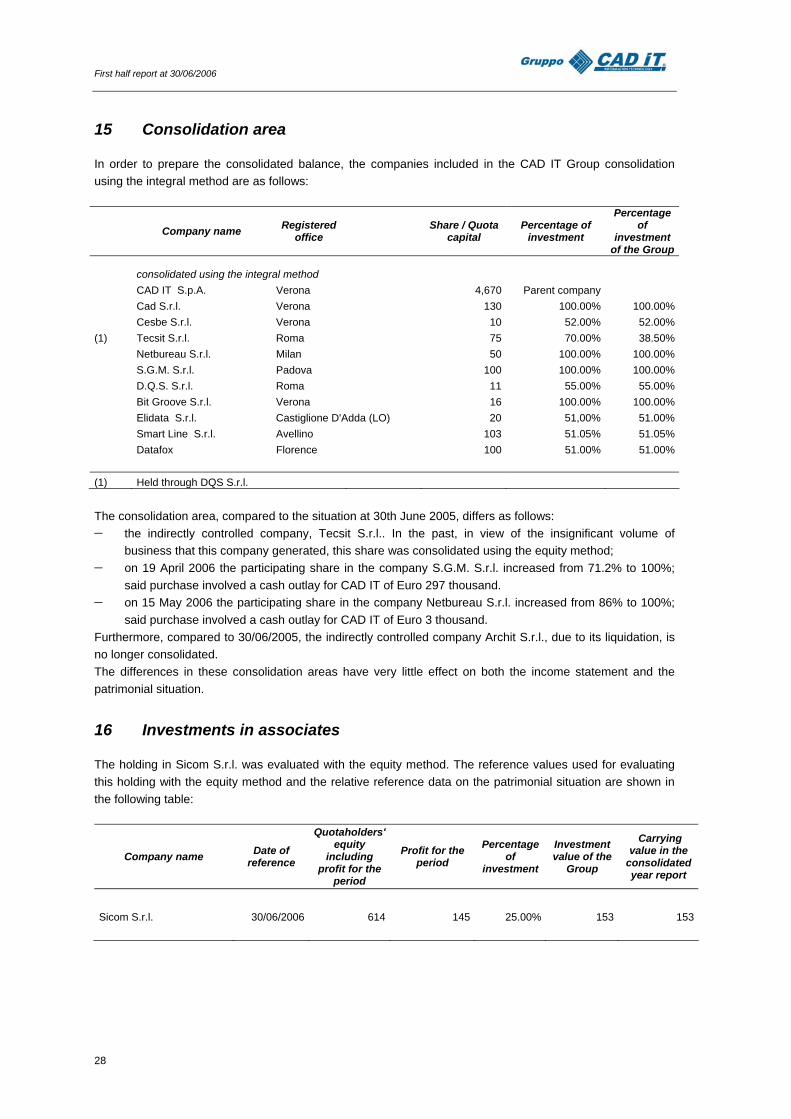
15 Consolidation area
In order to prepare the consolidated balance, the companies included in the CAD IT Group consolidation using the integral method are as follows:
Company name Registered office
Share / Quota capital
Percentage of investment
Percentage of
investment of the Group
consolidated using the integral method CAD IT S.p.A. Verona 4,670 Parent company Cad S.r.l. Verona 130 100.00% 100.00% Cesbe S.r.l. Verona 10 52.00% 52.00%(1) Tecsit S.r.l. Roma 75 70.00% 38.50% Netbureau S.r.l. Milan 50 100.00% 100.00% S.G.M. S.r.l. Padova 100 100.00% 100.00% D.Q.S. S.r.l. Roma 11 55.00% 55.00% Bit Groove S.r.l. Verona 16 100.00% 100.00% Elidata S.r.l. Castiglione D'Adda (LO) 20 51,00% 51.00% Smart Line S.r.l. Avellino 103 51.05% 51.05% Datafox Florence 100 51.00% 51.00% (1) Held through DQS S.r.l. The consolidation area, compared to the situation at 30th June 2005, differs as follows: − the indirectly controlled company, Tecsit S.r.l.. In the past, in view of the insignificant volume of
business that this company generated, this share was consolidated using the equity method; − on 19 April 2006 the participating share in the company S.G.M. S.r.l. increased from 71.2% to 100%;
said purchase involved a cash outlay for CAD IT of Euro 297 thousand. − on 15 May 2006 the participating share in the company Netbureau S.r.l. increased from 86% to 100%;
said purchase involved a cash outlay for CAD IT of Euro 3 thousand. Furthermore, compared to 30/06/2005, the indirectly controlled company Archit S.r.l., due to its liquidation, is no longer consolidated. The differences in these consolidation areas have very little effect on both the income statement and the patrimonial situation.
16 Investments in associates
The holding in Sicom S.r.l. was evaluated with the equity method. The reference values used for evaluating this holding with the equity method and the relative reference data on the patrimonial situation are shown in the following table:
Company name Date of reference
Quotaholders' equity
including profit for the
period
Profit for the period
Percentage of
investment
Investment value of the
Group
Carrying value in the
consolidated year report
Sicom S.r.l. 30/06/2006 614 145 25.00% 153 153
28
First half report at 30/06/2006
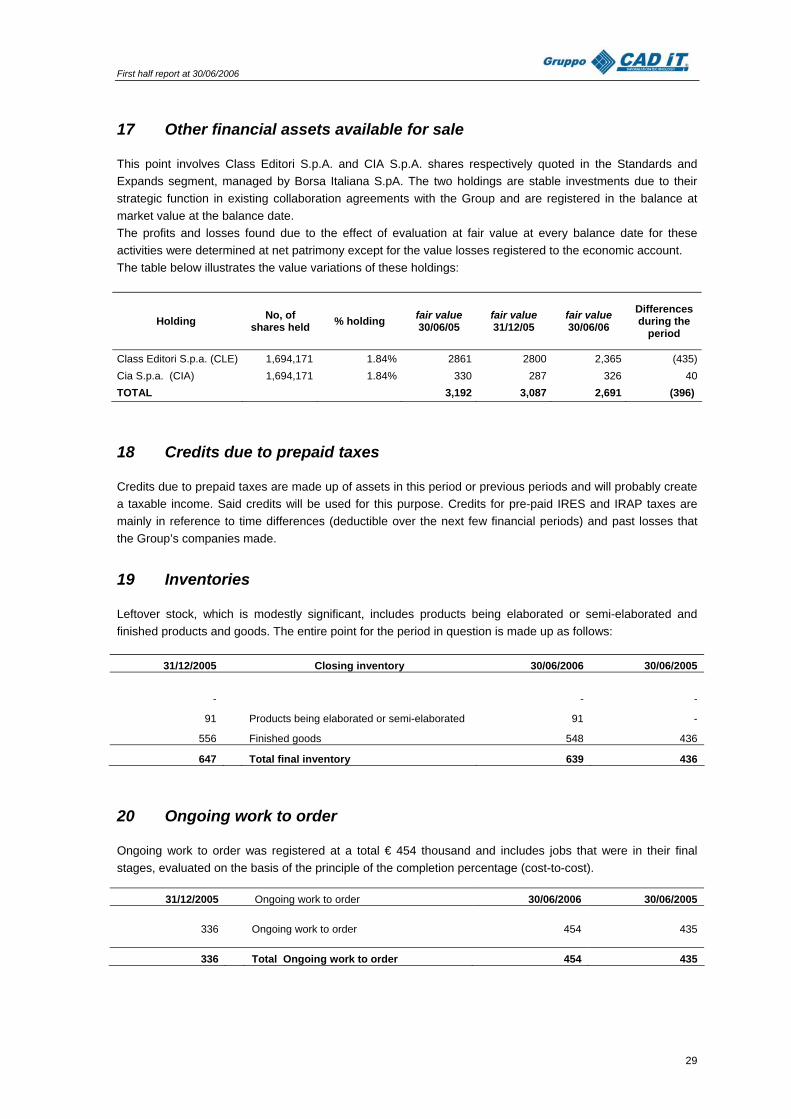
17 Other financial assets available for sale
This point involves Class Editori S.p.A. and CIA S.p.A. shares respectively quoted in the Standards and Expands segment, managed by Borsa Italiana S.pA. The two holdings are stable investments due to their strategic function in existing collaboration agreements with the Group and are registered in the balance at market value at the balance date. The profits and losses found due to the effect of evaluation at fair value at every balance date for these activities were determined at net patrimony except for the value losses registered to the economic account. The table below illustrates the value variations of these holdings:
Holding No, of shares held % holding fair value
30/06/05 fair value 31/12/05
fair value 30/06/06
Differences during the
period
Class Editori S.p.a. (CLE) 1,694,171 1.84% 2861 2800 2,365 (435) Cia S.p.a. (CIA) 1,694,171 1.84% 330 287 326 40 TOTAL 3,192 3,087 2,691 (396)
18 Credits due to prepaid taxes
Credits due to prepaid taxes are made up of assets in this period or previous periods and will probably create a taxable income. Said credits will be used for this purpose. Credits for pre-paid IRES and IRAP taxes are mainly in reference to time differences (deductible over the next few financial periods) and past losses that the Group’s companies made.
19 Inventories
Leftover stock, which is modestly significant, includes products being elaborated or semi-elaborated and finished products and goods. The entire point for the period in question is made up as follows:
31/12/2005 Closing inventory 30/06/2006 30/06/2005
- - -
91 Products being elaborated or semi-elaborated 91 -
556 Finished goods 548 436
647 Total final inventory 639 436
20 Ongoing work to order
Ongoing work to order was registered at a total € 454 thousand and includes jobs that were in their final stages, evaluated on the basis of the principle of the completion percentage (cost-to-cost).
31/12/2005 Ongoing work to order 30/06/2006 30/06/2005
336 Ongoing work to order 454 435
336 Total Ongoing work to order 454 435
29
First half report at 30/06/2006
21 Other financial assets
Commercial credits and other credits are made up as follows:
31/12/2005 Trade receivables and other credits 30/06/2006 30/06/2005
24,452 Trade receivables 26,336 24,119 245 Accrued income and deferred expenses 641 483 167 Other credits 97 136
24,865 Total trade receivables and other credits 27,074 24,738
Credits to clients are entirely due within 12 months. The accounting value of commercial credits and other credits is approximate to their fair value. Commercial credits are mainly in favour of the Group’s Banking Institute clients. The high sum of credits towards clients is conditioned by the size of the value of the contracts, which is often considerable, as well as the contractual terms of payment which usually state that the balance of the amounts due are to be paid after the procedures supplied have been approved. The Group evaluated the credits to the probable break-up value. This evaluation is made analytically for expired credits and on expiry of a greater length of time than the average receipt time and on a lump-sum basis for the other credits, depending on the past incidence of losses that the Group finds for sales during the invoicing year. Regarding credits that are considered uncollectable, an allocation fund has been set up to the amount of Euro 342 thousand (€ 486 thousand in previous period) which ensures a cover of 1.28% of the total amount of credits towards clients. This fund was determined on the basis of past data regarding losses on credits and is considered proportionate.
31/12/2005 Trade receivables, net 30/06/2006 30/06/2005
2 Associated companies 2
24,793 Trade receivables 26,676 24,605
(342) Bad debt provision (342) (486)
24,452 Total trade receivables 26,336 24,119
1.38% % Coverage of bad debt provision 1.28% 1.97%
The point Accrued accruals and payables refers to accrued income to the sum of Euro 5 thousand and the remaining amount to accrued income made up as follows:
31/12/2005 Accrued costs 30/06/2006 30/06/2005
58 Software assistance 344 180 58 Advertising expenses 39 2 12 Third party benefit expenses 35 39 37 Telephone charges 63 77 20 Administrative services 19 21 34 Various insurances 50 51 8 Various 32 56 4 Hardware assistance 5 8 3 System maintenance 16 16 2 Associative fees 10 8
30
First half report at 30/06/2006
1 Office management costs 22 25
237 Total Accrued costs 636 482 The total sum of the point on other credits showed the following results:
31/12/2005 Credits towards other 30/06/2006 30/06/2005
16 Receivables from social security institutions 9 1114 Receivables for advances on travel expenses 8 331 Payments on account to suppliers 16 1597 Other 59 98
9 Guarantee deposits 5 8
167 Total credits towards others 97 136
22 Tax credits
This field currently comprises credits in withholding tax on current account interest and other running tax credits; at 31/12/2005, however, it was mainly composed of advance payments made for direct taxes (IRES and IRAP) in 2005.
23 Cash and other equivalent assets
31/12/2005 Cash and other equivalent assets 30/06/2006 30/06/2005
3,759 Bank and postal accounts 3,797 10,870
0 Cheques on hand 2
13 Cash-on-hand and cash equivalents 15 14
6,017 Insurance policies capitalised 6,348 5,941
9,789 Total 10,161 16,827 It is possible to redeem the capitalisation insurance policy at any time and reimbursement is made within 20 days with no particular significant expense. The returns are variable in relation to the annually calculated revaluation rate. The guaranteed minimum annual rate is 2.50%.
24 Non current assets held for sale
At 30/06/2006 there were no non-current assets of the Group to be classified as held for sale.
25 Company capital
The company capital, entirely registered, deposited and unchanged over the period, amounted to €4,669,600. It was subdivided into 8,980,000 ordinary shares with a nominal value of €0.52 each and all with equal rights. The ordinary shares are registered and indivisible and each one gives the right to a vote at the ordinary and extraordinary shareholders’ meetings, as well as to the faculty of carrying out other company and patrimonial rights in accordance with the law and the statute. Neither CAD IT S.p.A. nor its controlled companies own CAD IT or their own shares, not even through trustee companies or third parties.
31
First half report at 30/06/2006
Group net patrimony
The Group net patrimony at 31/12/2005 came to Euro 53,079 thousand compared to Euro 53,543 thousand at 31/12/2005.
Third party net patrimony
This point refers to the patrimony quota of the controlled companies that, on the basis of the ‘Equity ratios’, belongs to third parties. It was made up of:
31/12/2005 Minority interests 30/06/2006 30/06/2005
1,679 Minority quotaholders of Cesbe S.r.l. 1,636 1,610148 Minority quotaholders of Datafox S.r.l. 171 143
2 Minority quotaholders of Netbureau S.r.l. 7(58) Minority quotaholders of SGM S.r.l. (24)
53 Minority quotaholders of Tecsit S.r.l. 42 259 Minority quotaholders of DQS S.r.l. 265 262408 Minority quotaholders of Elidata srl 437 311
79 Minority quotaholders of Smart Line S.r.l. 76 962,570 Total minority interests 2,626 2,406
26 Reserves
31/12/2005 Reserves 30/06/2006 30/06/2005
(1) Own shares 35,246 (2) Share surcharge riserve 35,246 35,246 - (3) Re-evaluation reserve - - 51 (4) Re-eval. res for fin. assets available for sale 91 95
35,298 Total 35,337 35,341 The variation of the evaluation reserve for assets available for sale comes from the variation in fair value at 30/06/06 of the holding in the quoted company CIA S.p.A., directly registered in the net patrimony reserve.
27 Accumulated profit
Previous period profit refers to the difference between the profits for the 2004 period calculated with the IAS/IFRS accounting standards compared to calculation with the national accounting standards. The IFRS transition fund changed during the course of the period by €2,737 thousand due to the application of the IAS 32 and 39 for the evaluation of financial assets available for sale being deferred to 01/01/05. The IFRS transition fund covers any differences that may have occurred when the international accounting standards were first adopted on 1st January 2004 and was changed for the actual application of the IAS 32 and 39 standards on 01/01/05 when assessing financial assets available for sale, in accordance with the IFRS 1 accounting standard. The available reserve of undivided profits increased by Euro 10 thousand due to the effect of undistributed profits in the previous period.
32
First half report at 30/06/2006
31/12/2005 Accumulated profits/losses 30/06/2006 30/06/2005 585 Previous profits/losses 585 585 934 Legal reserve 934 934
- Statutory reserve - - 2,119 IFRS transition reserve 2,119 2,119
(1,966) Consolidation reserve (2,077) (1,942) 10,386 Available joint profit reserve 10,396 10,386
1,517 Period profits/losses 1,115 1,496
13,575 Total 13,072 13,579
28 Dividends paid
On the basis of the results of the 2005 period, which confirm the Veronese Group’s ability to generate positive income margins, the distribution of an ordinary dividend of Euro 0.18 per share, with coupon detachment on 8 May 2006 and payment on 11 May 2006, was approved at the Shareholders’ Meeting on 28 April 2006.
29 Financing
€ 245 thousand of this point refers to the registration of the amount of debt funding determined by property leasing in accordance with the financial method. A further medium-term debt towards a banking institute of €119 thousand was also registered.
30 Liabilities due to deferred taxes
Deferred taxes amounted to Euro 3,432 thousand and took into account the taxable time differences resulting from time differences of the accounting value of an asset or liability compared to its recognised value for tax purposes. In particular they mainly referred to the fiscal effect of adjustments made at the FTA, the taxation of which was deferred to future periods.
31 Employees' leaving entitlement and quiescence reserves
31/12/2005 Employees' leaving entitlement and quiescence reserves 30/06/2006 30/06/2005
6,262 Employees' leaving entitlement
6,271
5,984
173 Fund due to director end of term of office treatment
185
154
2 Other quiescence reserves
2
12
6,437 Total
6,458
6,150
The point concerning the TFR Fund shows the movements resulting from annual allocations made on the basis of the evaluations of external actuaries based on the IAS 19 and the uses carried out concerning end of working contract resolutions or advance payments.
33
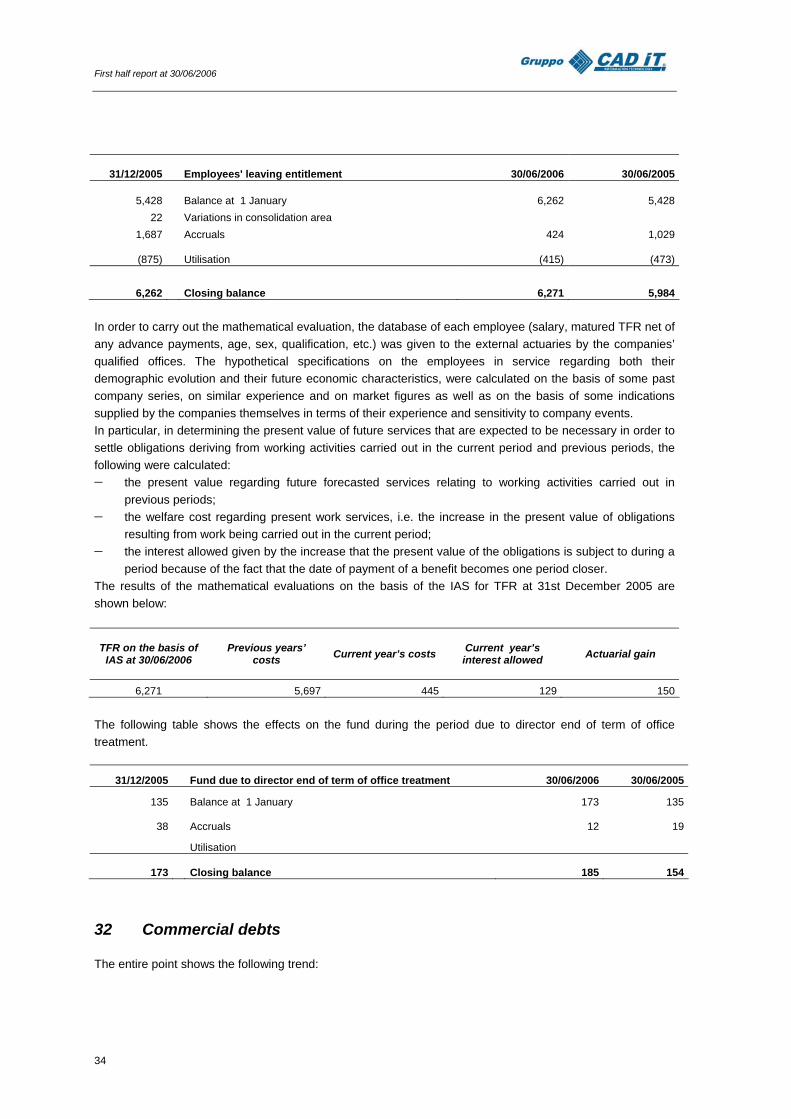
First half report at 30/06/2006
31/12/2005 Employees' leaving entitlement 30/06/2006 30/06/2005
5,428 Balance at 1 January 6,262 5,42822 Variations in consolidation area
1,687 Accruals 424 1,029
(875) Utilisation (415) (473)
6,262 Closing balance 6,271 5,984 In order to carry out the mathematical evaluation, the database of each employee (salary, matured TFR net of any advance payments, age, sex, qualification, etc.) was given to the external actuaries by the companies’ qualified offices. The hypothetical specifications on the employees in service regarding both their demographic evolution and their future economic characteristics, were calculated on the basis of some past company series, on similar experience and on market figures as well as on the basis of some indications supplied by the companies themselves in terms of their experience and sensitivity to company events. In particular, in determining the present value of future services that are expected to be necessary in order to settle obligations deriving from working activities carried out in the current period and previous periods, the following were calculated: − the present value regarding future forecasted services relating to working activities carried out in
previous periods; − the welfare cost regarding present work services, i.e. the increase in the present value of obligations
resulting from work being carried out in the current period; − the interest allowed given by the increase that the present value of the obligations is subject to during a
period because of the fact that the date of payment of a benefit becomes one period closer. The results of the mathematical evaluations on the basis of the IAS for TFR at 31st December 2005 are shown below:
TFR on the basis of IAS at 30/06/2006
Previous years’ costs Current year’s costs Current year’s
interest allowed Actuarial gain
6,271 5,697 445 129 150 The following table shows the effects on the fund during the period due to director end of term of office treatment.
31/12/2005 Fund due to director end of term of office treatment 30/06/2006 30/06/2005
135 Balance at 1 January 173 135
38 Accruals
12
19
Utilisation
173 Closing balance
185
154
32 Commercial debts
The entire point shows the following trend:
34
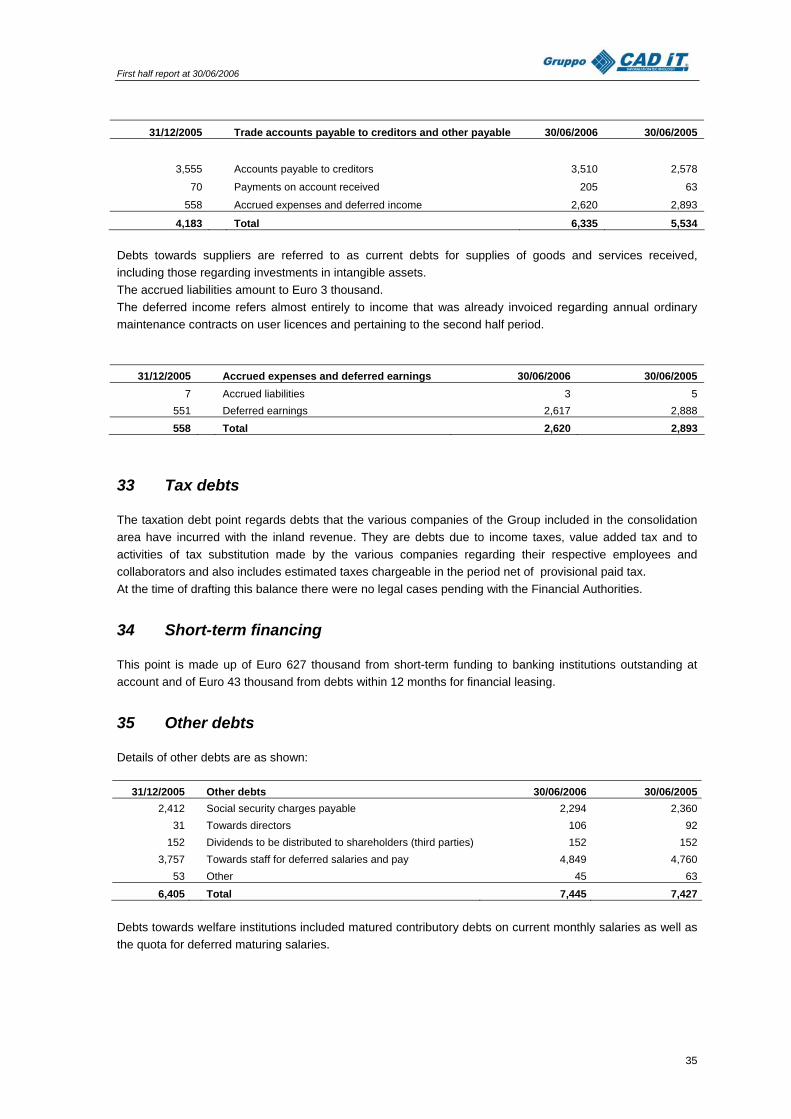
First half report at 30/06/2006
31/12/2005 Trade accounts payable to creditors and other payable 30/06/2006 30/06/2005
3,555 Accounts payable to creditors 3,510 2,578
70 Payments on account received 205 63
558 Accrued expenses and deferred income 2,620 2,893
4,183 Total 6,335 5,534
Debts towards suppliers are referred to as current debts for supplies of goods and services received, including those regarding investments in intangible assets. The accrued liabilities amount to Euro 3 thousand. The deferred income refers almost entirely to income that was already invoiced regarding annual ordinary maintenance contracts on user licences and pertaining to the second half period.
31/12/2005 Accrued expenses and deferred earnings 30/06/2006 30/06/2005 7 Accrued liabilities 3 5
551 Deferred earnings 2,617 2,888 558 Total 2,620 2,893
33 Tax debts
The taxation debt point regards debts that the various companies of the Group included in the consolidation area have incurred with the inland revenue. They are debts due to income taxes, value added tax and to activities of tax substitution made by the various companies regarding their respective employees and collaborators and also includes estimated taxes chargeable in the period net of provisional paid tax. At the time of drafting this balance there were no legal cases pending with the Financial Authorities.
34 Short-term financing
This point is made up of Euro 627 thousand from short-term funding to banking institutions outstanding at account and of Euro 43 thousand from debts within 12 months for financial leasing.
35 Other debts
Details of other debts are as shown:
31/12/2005 Other debts 30/06/2006 30/06/20052,412 Social security charges payable 2,294 2,360
31 Towards directors 106 92152 Dividends to be distributed to shareholders (third parties) 152 152
3,757 Towards staff for deferred salaries and pay 4,849 4,76053 Other 45 63
6,405 Total 7,445 7,427 Debts towards welfare institutions included matured contributory debts on current monthly salaries as well as the quota for deferred maturing salaries.
35
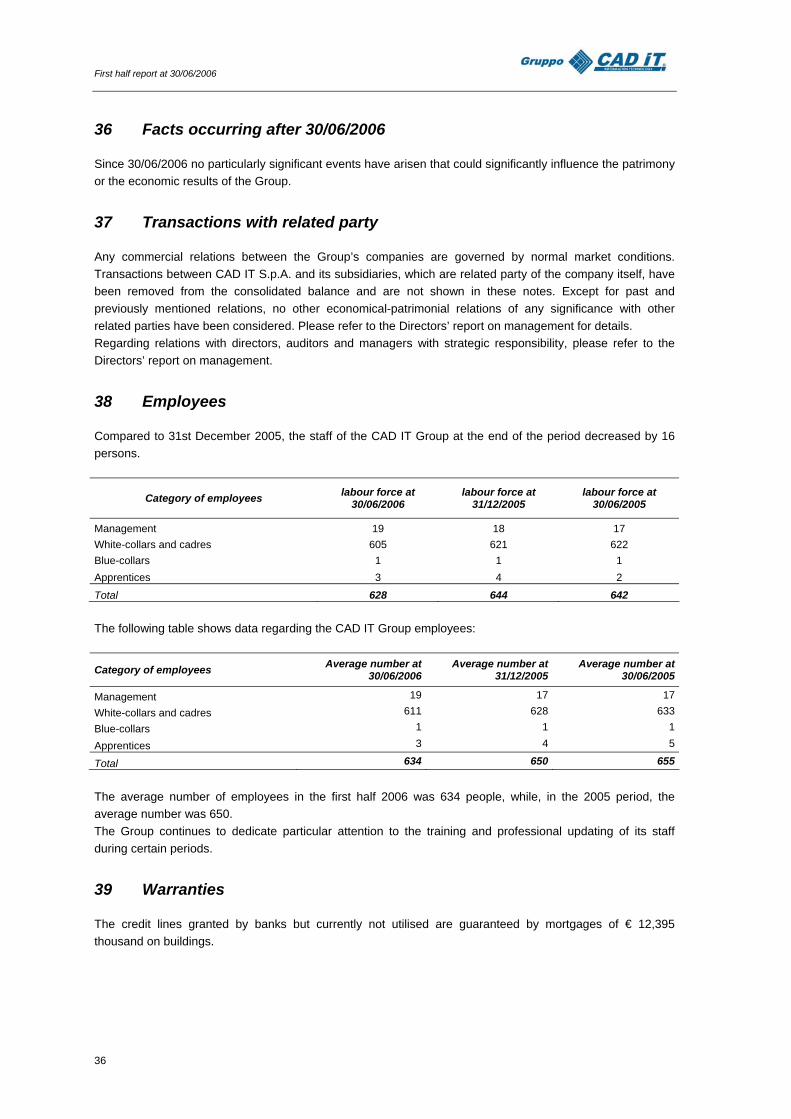
First half report at 30/06/2006
36 Facts occurring after 30/06/2006
Since 30/06/2006 no particularly significant events have arisen that could significantly influence the patrimony or the economic results of the Group.
37 Transactions with related party
Any commercial relations between the Group’s companies are governed by normal market conditions. Transactions between CAD IT S.p.A. and its subsidiaries, which are related party of the company itself, have been removed from the consolidated balance and are not shown in these notes. Except for past and previously mentioned relations, no other economical-patrimonial relations of any significance with other related parties have been considered. Please refer to the Directors’ report on management for details. Regarding relations with directors, auditors and managers with strategic responsibility, please refer to the Directors’ report on management.
38 Employees
Compared to 31st December 2005, the staff of the CAD IT Group at the end of the period decreased by 16 persons.
Category of employees labour force at 30/06/2006
labour force at 31/12/2005
labour force at 30/06/2005
Management 19 18 17 White-collars and cadres 605 621 622 Blue-collars 1 1 1 Apprentices 3 4 2
Total 628 644 642 The following table shows data regarding the CAD IT Group employees:
Category of employees Average number at
30/06/2006Average number at
31/12/2005Average number at
30/06/2005
Management 19 17 17
White-collars and cadres 611 628 633
Blue-collars 1 1 1
Apprentices 3 4 5
Total 634 650 655
The average number of employees in the first half 2006 was 634 people, while, in the 2005 period, the average number was 650. The Group continues to dedicate particular attention to the training and professional updating of its staff during certain periods.
39 Warranties
The credit lines granted by banks but currently not utilised are guaranteed by mortgages of € 12,395 thousand on buildings.
36

First half report at 30/06/2006
40 Financial statement approval
The present first half report was approved by the CAD IT S.p.A. Board of Directors on 22/09/2006.
On behalf of the Board of Directors The Chairman
(Giuseppe Dal Cortivo)
37
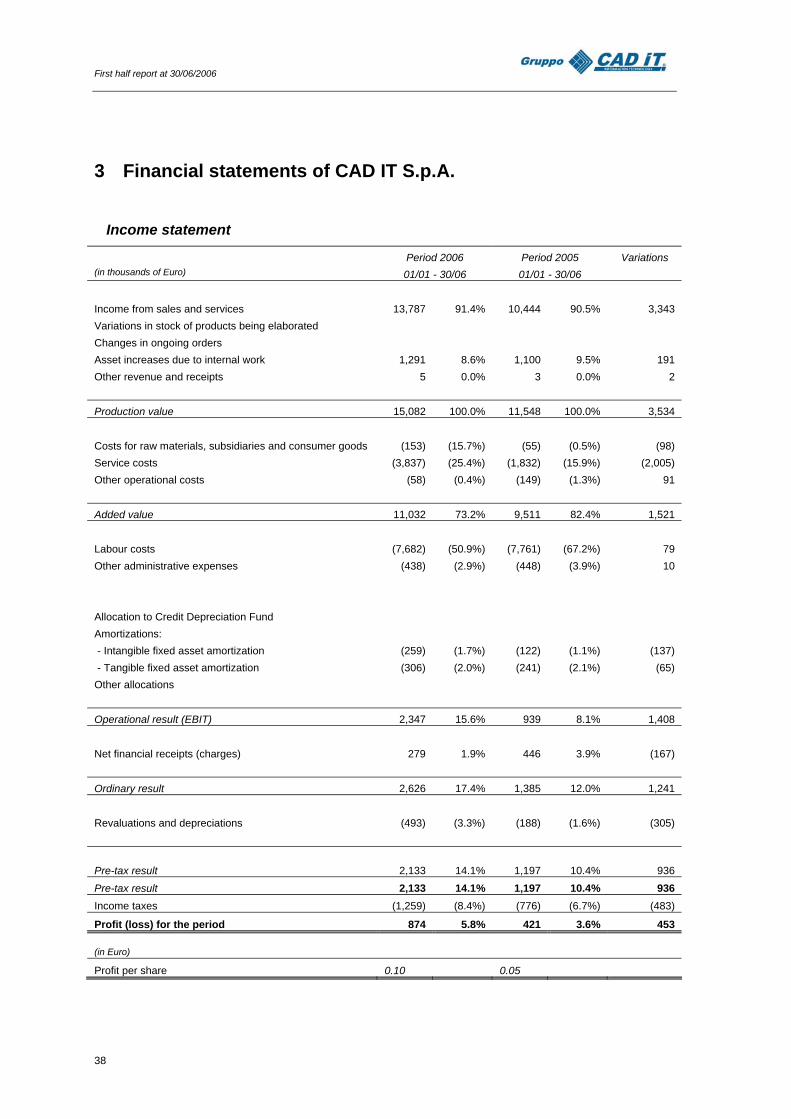
First half report at 30/06/2006
3 Financial statements of CAD IT S.p.A.
Income statement
Period 2006 Period 2005 Variations (in thousands of Euro) 01/01 - 30/06 01/01 - 30/06 Income from sales and services 13,787 91.4% 10,444 90.5% 3,343 Variations in stock of products being elaborated Changes in ongoing orders Asset increases due to internal work 1,291 8.6% 1,100 9.5% 191 Other revenue and receipts 5 0.0% 3 0.0% 2
Production value 15,082 100.0% 11,548 100.0% 3,534 Costs for raw materials, subsidiaries and consumer goods (153) (15.7%) (55) (0.5%) (98) Service costs (3,837) (25.4%) (1,832) (15.9%) (2,005) Other operational costs (58) (0.4%) (149) (1.3%) 91
Added value 11,032 73.2% 9,511 82.4% 1,521
Labour costs (7,682) (50.9%) (7,761) (67.2%) 79 Other administrative expenses (438) (2.9%) (448) (3.9%) 10 Allocation to Credit Depreciation Fund Amortizations: - Intangible fixed asset amortization (259) (1.7%) (122) (1.1%) (137) - Tangible fixed asset amortization (306) (2.0%) (241) (2.1%) (65) Other allocations
Operational result (EBIT) 2,347 15.6% 939 8.1% 1,408 Net financial receipts (charges) 279 1.9% 446 3.9% (167)
Ordinary result 2,626 17.4% 1,385 12.0% 1,241 Revaluations and depreciations (493) (3.3%) (188) (1.6%) (305)
Pre-tax result 2,133 14.1% 1,197 10.4% 936
Pre-tax result 2,133 14.1% 1,197 10.4% 936 Income taxes (1,259) (8.4%) (776) (6.7%) (483)
Profit (loss) for the period 874 5.8% 421 3.6% 453 (in Euro)
Profit per share 0.10 0.05
38
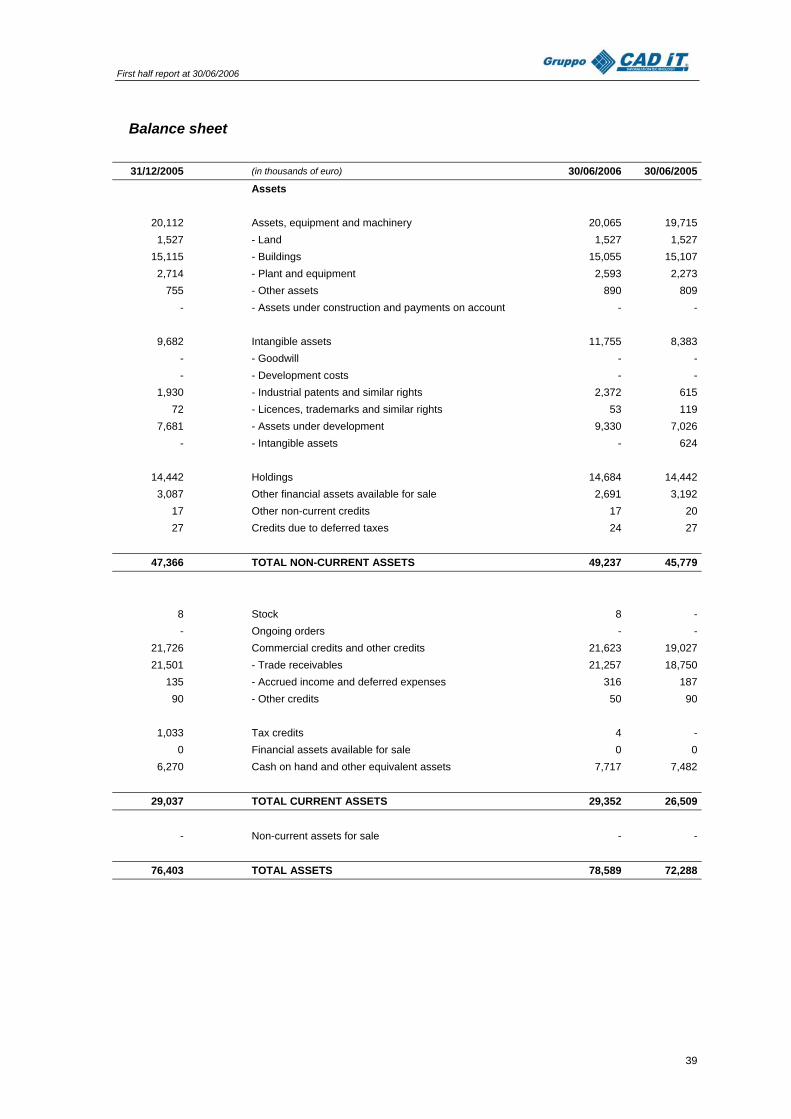
First half report at 30/06/2006
Balance sheet
31/12/2005 (in thousands of euro) 30/06/2006 30/06/2005 Assets
20,112 Assets, equipment and machinery 20,065 19,7151,527 - Land 1,527 1,527
15,115 - Buildings 15,055 15,1072,714 - Plant and equipment 2,593 2,273
755 - Other assets 890 809- - Assets under construction and payments on account - -
9,682 Intangible assets 11,755 8,383- - Goodwill - -- - Development costs - -
1,930 - Industrial patents and similar rights 2,372 61572 - Licences, trademarks and similar rights 53 119
7,681 - Assets under development 9,330 7,026- - Intangible assets - 624
14,442 Holdings 14,684 14,4423,087 Other financial assets available for sale 2,691 3,192
17 Other non-current credits 17 2027 Credits due to deferred taxes 24 27
47,366 TOTAL NON-CURRENT ASSETS 49,237 45,779
8 Stock 8 -- Ongoing orders - -
21,726 Commercial credits and other credits 21,623 19,02721,501 - Trade receivables 21,257 18,750
135 - Accrued income and deferred expenses 316 18790 - Other credits 50 90
1,033 Tax credits 4 -
0 Financial assets available for sale 0 06,270 Cash on hand and other equivalent assets 7,717 7,482
29,037 TOTAL CURRENT ASSETS 29,352 26,509
- Non-current assets for sale - -
76,403 TOTAL ASSETS 78,589 72,288
39
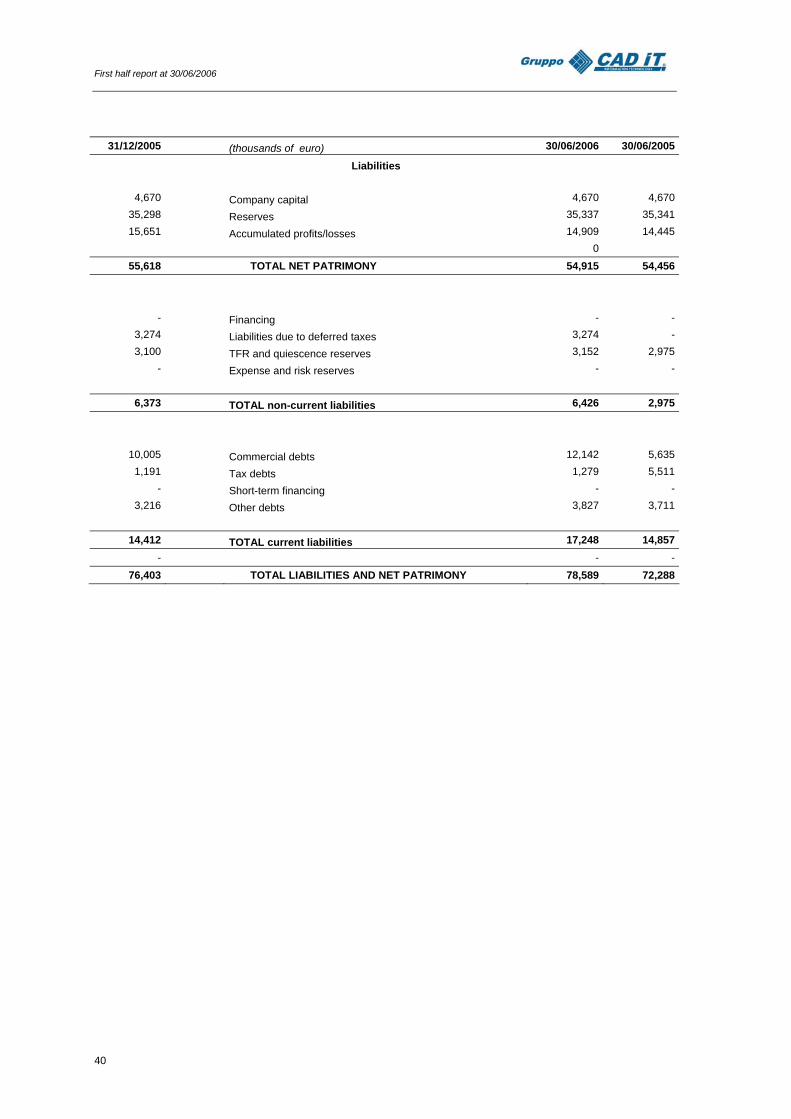
First half report at 30/06/2006
31/12/2005 (thousands of euro) 30/06/2006 30/06/2005
Liabilities
4,670 Company capital 4,670 4,670 35,298 Reserves 35,337 35,341
15,651 Accumulated profits/losses 14,909 14,445 0
55,618 TOTAL NET PATRIMONY 54,915 54,456
- Financing - - 3,274 Liabilities due to deferred taxes 3,274 -
3,100 TFR and quiescence reserves 3,152 2,975- Expense and risk reserves - -
6,373 TOTAL non-current liabilities 6,426 2,975
10,005 Commercial debts 12,142 5,6351,191 Tax debts 1,279 5,511
- Short-term financing - -3,216 Other debts 3,827 3,711
14,412 TOTAL current liabilities 17,248 14,857
- - -76,403 TOTAL LIABILITIES AND NET PATRIMONY 78,589 72,288
40
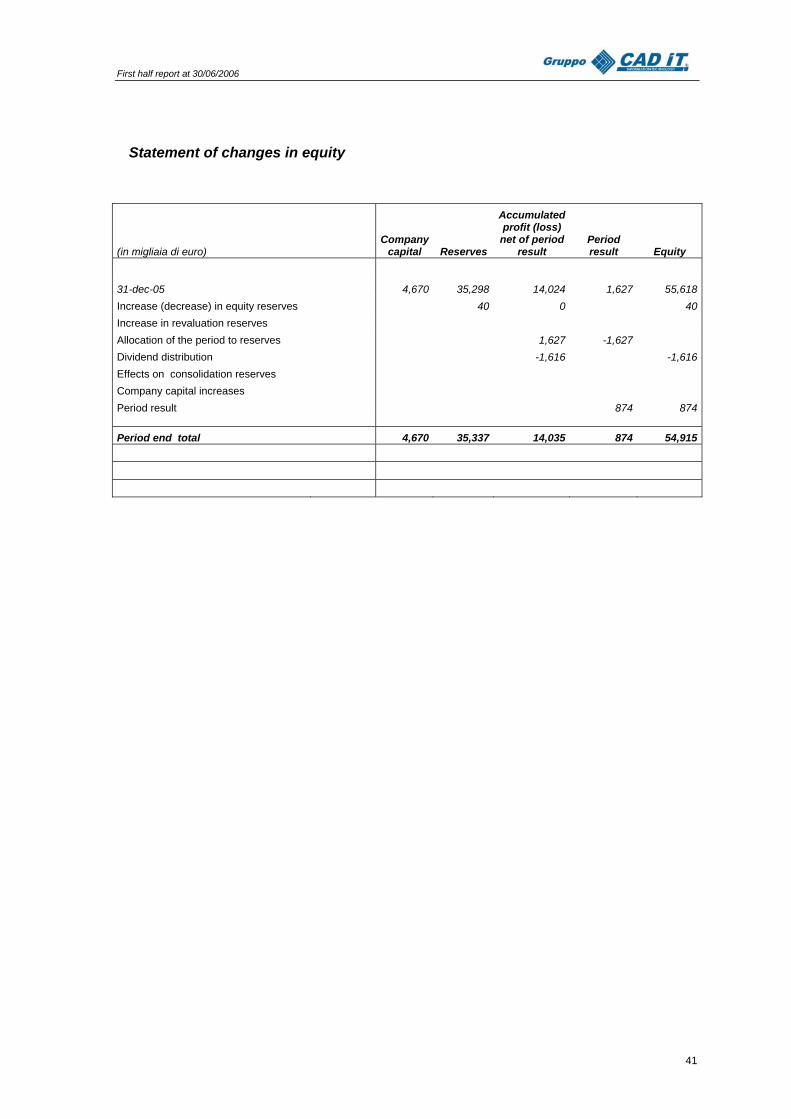
First half report at 30/06/2006
Statement of changes in equity
(in migliaia di euro) Company
capital Reserves
Accumulated profit (loss)
net of period result
Period result Equity
31-dec-05 4,670 35,298 14,024 1,627 55,618 Increase (decrease) in equity reserves 40 0 40 Increase in revaluation reserves Allocation of the period to reserves 1,627 -1,627 Dividend distribution -1,616 -1,616 Effects on consolidation reserves Company capital increases Period result 874 874
Period end total 4,670 35,337 14,035 874 54,915
41
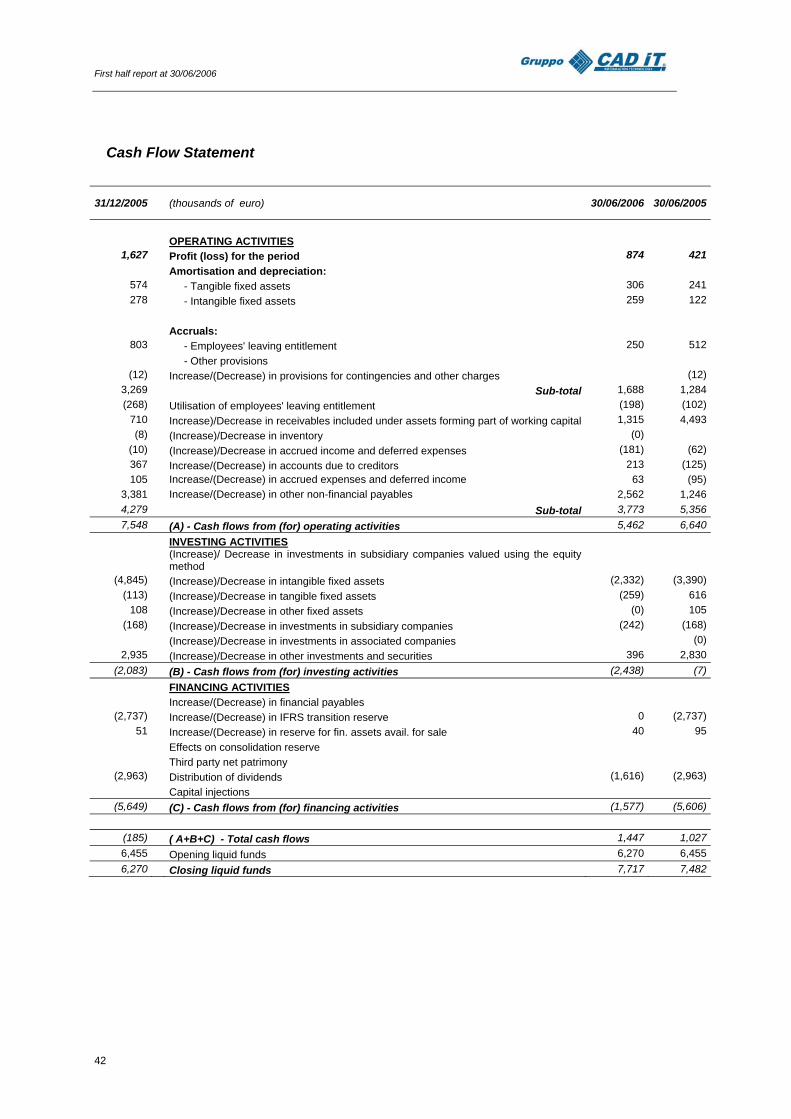
First half report at 30/06/2006
Cash Flow Statement
31/12/2005 (thousands of euro) 30/06/2006 30/06/2005
OPERATING ACTIVITIES
1,627 Profit (loss) for the period 874 421 Amortisation and depreciation:
574 - Tangible fixed assets 306 241278 - Intangible fixed assets 259 122
Accruals:
803 - Employees' leaving entitlement 250 512 - Other provisions
(12) Increase/(Decrease) in provisions for contingencies and other charges (12)3,269 Sub-total 1,688 1,284(268) Utilisation of employees' leaving entitlement (198) (102)
710 Increase)/Decrease in receivables included under assets forming part of working capital 1,315 4,493(8) (Increase)/Decrease in inventory (0)
(10) (Increase)/Decrease in accrued income and deferred expenses (181) (62)367 Increase/(Decrease) in accounts due to creditors 213 (125)105 Increase/(Decrease) in accrued expenses and deferred income 63 (95)
3,381 Increase/(Decrease) in other non-financial payables 2,562 1,2464,279 Sub-total 3,773 5,356 7,548 (A) - Cash flows from (for) operating activities 5,462 6,640
INVESTING ACTIVITIES
(Increase)/ Decrease in investments in subsidiary companies valued using the equity method
(4,845) (Increase)/Decrease in intangible fixed assets (2,332) (3,390)(113) (Increase)/Decrease in tangible fixed assets (259) 616
108 (Increase)/Decrease in other fixed assets (0) 105(168) (Increase)/Decrease in investments in subsidiary companies (242) (168)
(Increase)/Decrease in investments in associated companies (0)2,935 (Increase)/Decrease in other investments and securities 396 2,830
(2,083) (B) - Cash flows from (for) investing activities (2,438) (7) FINANCING ACTIVITIES Increase/(Decrease) in financial payables
(2,737) Increase/(Decrease) in IFRS transition reserve 0 (2,737)51 Increase/(Decrease) in reserve for fin. assets avail. for sale 40 95
Effects on consolidation reserve Third party net patrimony
(2,963) Distribution of dividends (1,616) (2,963) Capital injections
(5,649) (C) - Cash flows from (for) financing activities (1,577) (5,606)
(185) ( A+B+C) - Total cash flows 1,447 1,027 6,455 Opening liquid funds 6,270 6,4556,270 Closing liquid funds 7,717 7,482
42
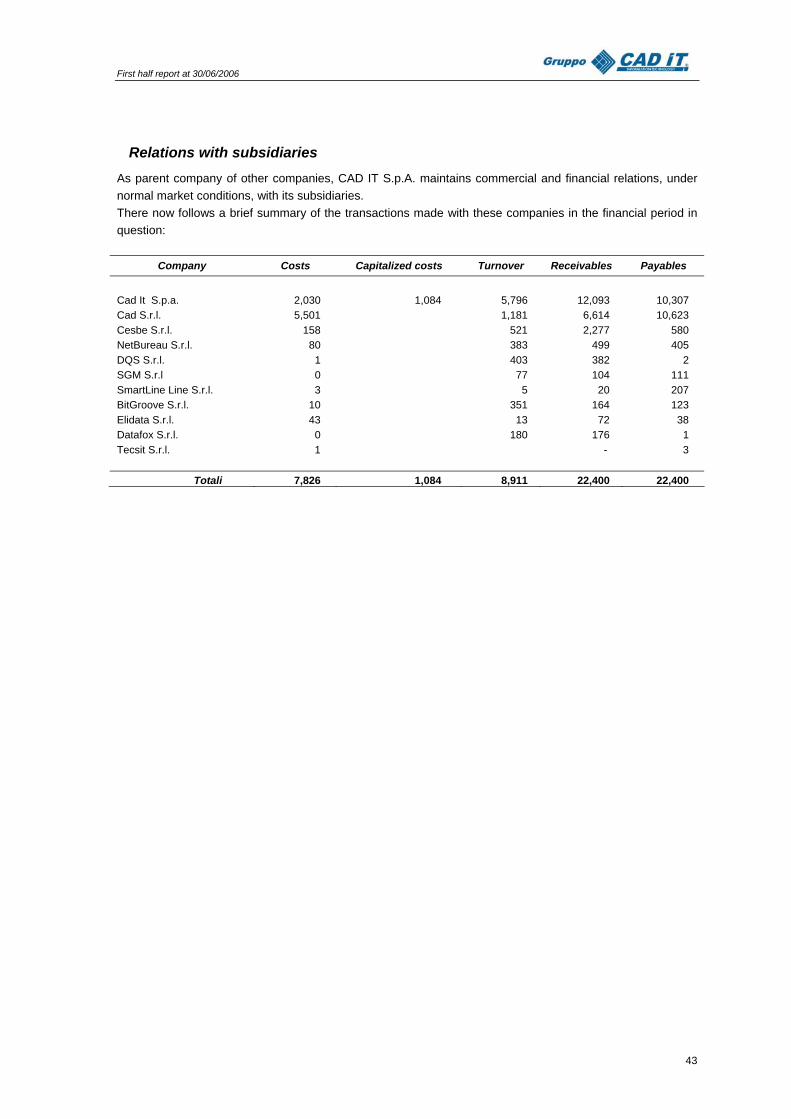
First half report at 30/06/2006
Relations with subsidiaries As parent company of other companies, CAD IT S.p.A. maintains commercial and financial relations, under normal market conditions, with its subsidiaries. There now follows a brief summary of the transactions made with these companies in the financial period in question:
Company Costs Capitalized costs Turnover Receivables Payables
Cad It S.p.a. 2,030 1,084 5,796 12,093 10,307 Cad S.r.l. 5,501 1,181 6,614 10,623 Cesbe S.r.l. 158 521 2,277 580 NetBureau S.r.l. 80 383 499 405 DQS S.r.l. 1 403 382 2 SGM S.r.l 0 77 104 111 SmartLine Line S.r.l. 3 5 20 207 BitGroove S.r.l. 10 351 164 123 Elidata S.r.l. 43 13 72 38 Datafox S.r.l. 0 180 176 1 Tecsit S.r.l. 1 - 3 Totali 7,826 1,084 8,911 22,400 22,400
43