Embed Size (px)
Citation preview
Zellescher Weg 12
Willers-Bau A106
Tel. +49 351 - 463 - 31945
Ulf Markwardt ([email protected])
Matthias Lieber ([email protected])
Cache Profi ling with Callgrind
Linux/x86 Performance Practical, 17.06.2009
Center for Information Services and High Performance Computing (ZIH)
Cache Profiling with Callgrind 2
Val gr i nd
Suite of simulation-based debugging and profiling tools
Valgrind core simulates a CPU in software
Tools implement various tasks by adding analysis code
Available for Linux on x86 and PowerPC platforms (both 32/64 bit)
Open source
Standard Linux package
Wide acceptance, e.g. Firefox, OpenOffice, KDE use Valgrind
http://www.valgrind.org

Cache Profiling with Callgrind 3
Val gr i nd’ s Tool Sui te
Memcheck
= “Valgrind”
– Most prominent, detects memory management bugs
Cachegrind
– Cache profiler, finds source location of cache misses
Callgrind
– Cachegrind
+ function call graph information
Massif
– Heap profiler, where / how much memory allocations?
Helgrind
– Thread debugger

Cache Profiling with Callgrind 4
How does Valgrind work?
Dynamic recompilation of program’s binary at runtime
Original code never runs directly on CPU
Large overhead: 10 –
100 times slower, depending on tool
Machine Code Byte Code
Instrumented
Byte CodeInstrumented
Machine Code
Valgrind Core
Valgrind Core
Valgrind Tool, e.g. Callgrind
This code is much better suited for Analysis Tools

Cache Profiling with Callgrind 5
Cachegr i nd, Cal l gr i nd
Cachegrind
collects statistics about cache misses
Simulates L1i, L1d, inclusive L2 cache
Size of the caches can be specified, default is current machine’s cache
Output:
– Total program run hit/miss count and ratio
– Per function hit/miss count
– Per source code line hit/miss count
Callgrind
is an extension of Cachegrind
– Additional function call graph information
Very useful for performance tuning

Cache Profiling with Callgrind 6
Callgrind Example: Program run under Callgrind
Cache Profiling with Callgrind 7
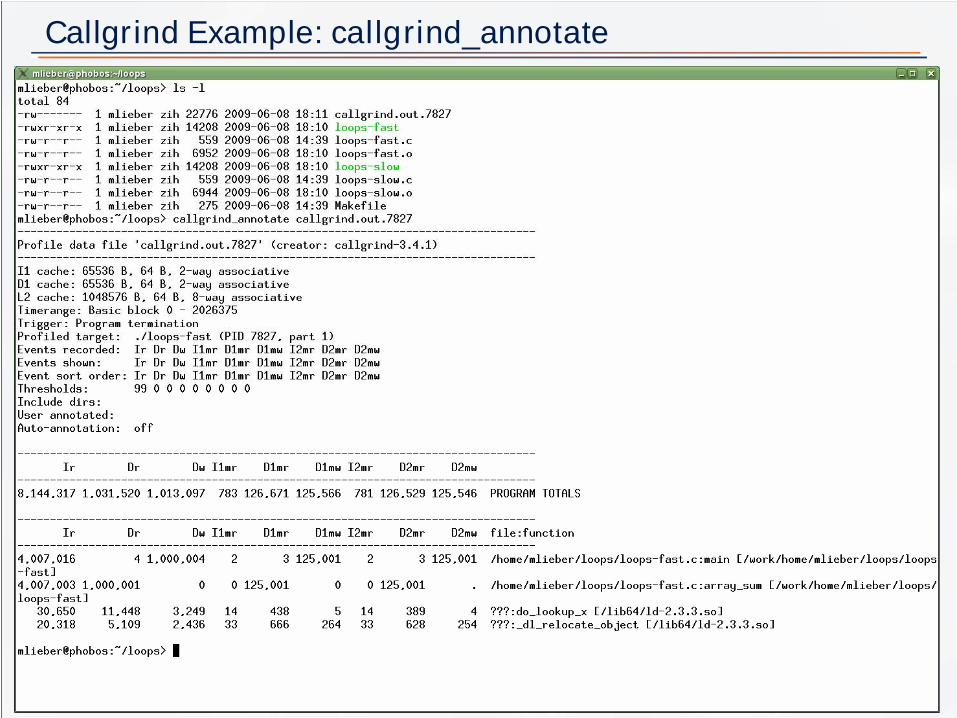
Cal l gr i nd Exampl e: cal l gr i nd_annot at e

Cache Profiling with Callgrind 8
Cal l gr i nd Exampl e: cal l gr i nd_annot at e wi t h Source

Cache Profiling with Callgrind 9
KCachegrind

Cache Profiling with Callgrind 10
KCachegrind

Cache Profiling with Callgrind 11
Tool Chains
callgrindcachegrind
callgrind_annotatecg_annotate KCachegrind
Text Output Text Output GUI

Cache Profiling with Callgrind 12
Exercises
cd ~/callgrind
make

Cache Profiling with Callgrind 13
Exercise 1 - loops-fast
Fill 2D array
Array size is 1000 x 1000 x 8 Byte = 8MB
Phobos
Cache:
– 64kB L1i + 64kB L1d
– 1MB L2
Cache too small for array
Read the array
If L2 cache was large enough (>8MB), no L2 miss would happen here!
Because the upper loop loads the array into the cache
Cache Profiling with Callgrind 14
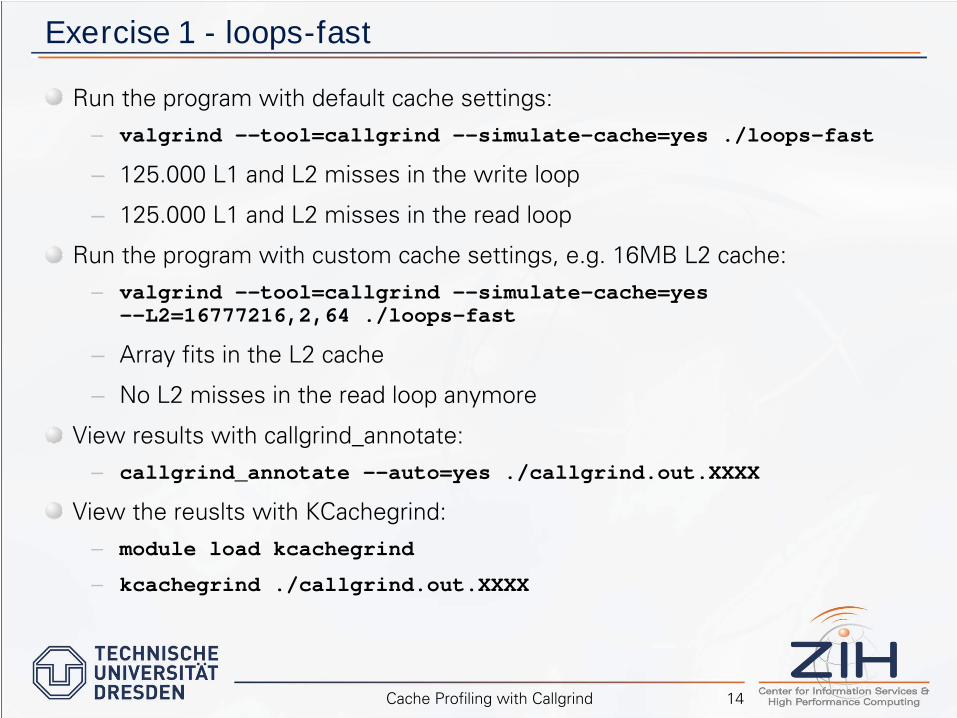
Exercise 1 - loops-fast
Run the program with default cache settings:– valgrind --tool=callgrind --simulate-cache=yes ./loops-fast
– 125.000 L1 and L2 misses in the write loop
– 125.000 L1 and L2 misses in the read loop
Run the program with custom cache settings, e.g. 16MB L2 cache:– valgrind --tool=callgrind --simulate-cache=yes
--L2=16777216,2,64 ./loops-fast
– Array fits in the L2 cache
– No L2 misses in the read loop anymore
View results with callgrind_annotate:– callgrind_annotate --auto=yes ./callgrind.out.XXXX
View the reuslts
with KCachegrind:
– module load kcachegrind
– kcachegrind ./callgrind.out.XXXX

Cache Profiling with Callgrind 15
Exercise 2 - loops-slow
Fill 2D array, loop has “bad”
order
C Storage:
row-major orderAccess here:
column-major order
Array size is 1000 x 1000 x 8 Byte = 8MB
Phobos
Cache:
– 64kB L1i + 64kB L1d
– 1MB L2
Cache too small for array

Cache Profiling with Callgrind 16
Exercise 2 - loops-slow
Fill 2D array, loop has “bad”
order
Cache misses will occur even if cache was large enough
– Because array is not in cache
But how many cache misses will occur?
– Cache line size: 64 Byte = 8 double
– 1.000.000 misses?
– 125.000 misses?
Try small L1 and L2 cache size (32768 Byte each) vs. default cache size setup
Then try the example with “good”
ordered loop with the small cache sizes and compare to “bad”
ordered loop
Cache Profiling with Callgrind 17
Beyond Cache Misses
Callgrind
can also be used to find performance problems which are not related to CPU cache
– What code lines eat up most instructions (CPU cycles, time)
– What system/math/library functions are called and what do they cost?
Recorded instructions can be a measure of computational costs in cache-friendly code
KCachegrind’s
cycle estimation allows incorporation of cache misses in this measure
Cache Profiling with Callgrind 18
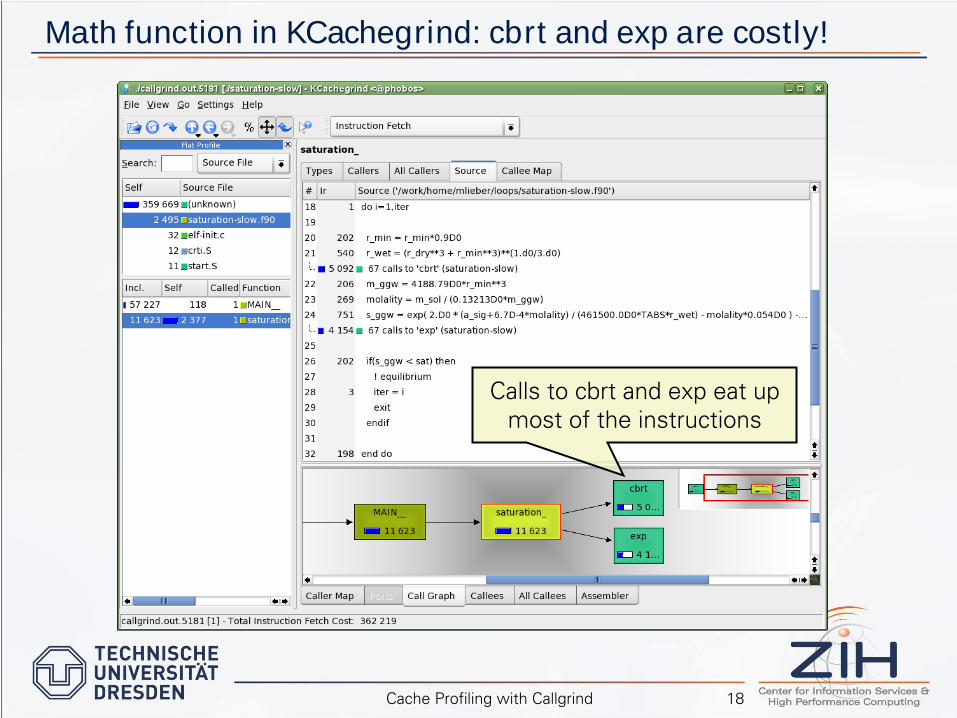
Math function in KCachegrind: cbrt and exp are costly!
Calls to cbrt
and exp eat up
most of the instructions

Cache Profiling with Callgrind 19
Math function in KCachegrind: optimized version – no exp!
Instructions dropped down from 11623 to 7199
Cache Profiling with Callgrind 20
Exercise 3 - saturation
Compare the slow and the fast version of the saturation example
– Don’t need to collect cache counters
– valgrind --tool=callgrind ./saturation-fast
– valgrind --tool=callgrind ./saturation-slow
Display in KCachegrind
Cache Profiling with Callgrind 21
Selected Callgrind Command-Line Options
--simulate-cache=[yes|no] –
enable cache simulation
--dump-instr=[yes|no] –
collect information at per-instruction granularity,
only useful for assembler view in KCachegrind
--callgrind-out-file=<file> -
output file
--I1=<size>,<associativity>,<line size> -
specifiy
L1 instruction
cache
--D1=<size>,<associativity>,<line size> -
specifiy
L1 data cache
--L2=<size>,<associativity>,<line size> -
specifiy
L2 cache
More features and options:
– User Manual: http://valgrind.org/docs/manual/cg-manual.html
– valgrind --tool=callgrind --help

Cache Profiling with Callgrind 22
Summary
Remember: Valgrind is based on simulation, no measurements!
– Don’t trust the results to be absolutely accurate
– Large Overhead
Whenever using Cachegrind
/ Callgrind:
– Reduce problem size, but should still be representative
– Large application: extract computational kernel routines
Easy to use
But not available for IA64 (Altix)
Callgrind_annotate
is a good alternative when KCachegrind
is not available (KCachegrind
requires X11 and KDE libs)


![Прокачиваем свою производительность [Debugging, Tracing and Profiling... yourself!]](https://img.pdfslide.us/doc/110x75/55a1702b1a28abf9668b4576/-debugging-tracing-and-profiling-yourself.jpg)