Embed Size (px)
Citation preview
Cable and Antenna Measurements Using Tektronix USB Spectrum Analyzers––APPLICATION NOTE
2 | WWW.TEK.COM
APPLICATION NOTECable and Antenna Measurements Using Tektronix USB Spectrum Analyzers
This application note looks at the basics of line sweeping
measurements on cable and antenna systems using a
spectrum analyzer and a tracking generator, including a look
at why they are important and how to perform them. Specific
measurements covered include return loss/voltage standing
wave ratio (VSWR), cable loss, antenna isolation, and distance
to fault (DTF) measurements.
Tracking generators play a key role in allowing spectrum
analyzers to perform transmission loss, transmission gain, and
return loss measurements. As will be discussed later, tracking
generators are simply variable, or swept, RF generators that
track with the spectrum analyzer sweep frequency. In other
words, the tracking generator produces signals as the analyzer
sweeps, measuring power across a frequency range. This
allows the user to provide a known stimulus to a circuit and
view the response.
There are a number of portable spectrum analyzers on the
market today available with tracking generators. However,
the majority of this equipment incorporates slow, low-power
processors and offer limited to no real-time capabilities. The
Tektronix family of USB spectrum analyzers, on the other hand,
work in conjunction with a laptop or tablet PC to offer desktop-
level real-time performance in an easily portable package,
including models that are battery powered and IP52 rated.
Cable and Antenna Testing – What Can Go Wrong?It’s estimated that about 60 percent of cellular base station
problems result from faulty cables, connectors and antennas.
Some problems occur during installation and are immediately
apparent. But over time, connecting cables, adapters and
antennas may become damaged or gradually degrade.
Component failures often result in poor coverage and
unnecessary handovers in the case of cellular systems. But
cellular is simply the most obvious and pervasive example
– any communication system is bound to degrade without
ongoing testing to verify performance and isolate the source of
problems.
Cabling and antennas are expected to cope with a diverse
range of environments including outdoor and indoor
installations, each posing different challenges.
Typical outdoor installations involve mounting antennas on the
tops of tall buildings or on towers, often in remote locations
where the antenna and portions of the coaxial cabling can
be exposed to extreme weather conditions including wide
temperature swings, rain, snow, ice, wind and lightning. Such
conditions can exact a major toll on the integrity of the system,
resulting in physical damage such as failed waterproofing
at connector joints, failed cable splice seals, and cracks in
insulating materials.
Indoor installations range from stationary set-ups like
equipment shelters and office buildings to more mobile (and
therefore more vulnerable) applications on ships, airplanes and
trains, as well as cars and trucks. Even sheltered installations
face a range of hazards including mishandling, stress, heat,
vibration, chemicals and contamination. Problems are
especially prevalent where solder joints and cable crimps
weaken over time and break or degrade.
WWW.TEK.COM | 3
APPLICATION NOTECable and Antenna Measurements Using Tektronix USB Spectrum Analyzers
Running cables up and down towers, through walls or
underground can be a messy job. It’s not hard to tear,
stretch, dent, crush or poorly route a cable during installation
– problems that can sometimes manifest themselves long
after the initial installers have moved on. Another problem
occurs when the minimum bend radius is exceeded such as
in the case of low-loss coaxial cables, which can significantly
degrade electrical performance.
Fortunately, it is not necessary to use highly specialized tools
for cable and antenna test and troubleshooting. Portable
spectrum analyzers are already used in the installation and
maintenance of RF transmission systems, and are already used
to test many different aspects of an RF transmission system,
from overall performance to analysis of individual components.
Therefore, adding a tracking generator to a spectrum analyzer
is a cost-effective solution to the problem.
Tracking Generator BasicsSince spectrum analyzers receive and measure a signal, they
can be considered passive instruments. As such, spectrum
analyzers, by themselves, are not able to make cable and
antenna measurements that require known signals to be
applied to a particular device or network under test in order to
measure the output or response.
There are two main types of test equipment used for making
these stimulus-response measurements. The traditional type
of test equipment is an RF or scalar network analyzer. The
other option is a spectrum analyzer with a tracking generator.
A vector network analyzer is typically required if exceptional
accuracy is needed, but in most other cases a spectrum
analyzer and tracking generator arrangement is an excellent
solution. This is particularly true with the advent of low-cost
high-performance USB-based spectrum analyzers.
The tracking generator operates by providing a sinusoidal
output to the input of the spectrum analyzer. By linking the
sweep of the tracking generator to the spectrum analyzer,
the output of the tracking generator is on the same frequency
as the spectrum analyzer, and the two units track the same
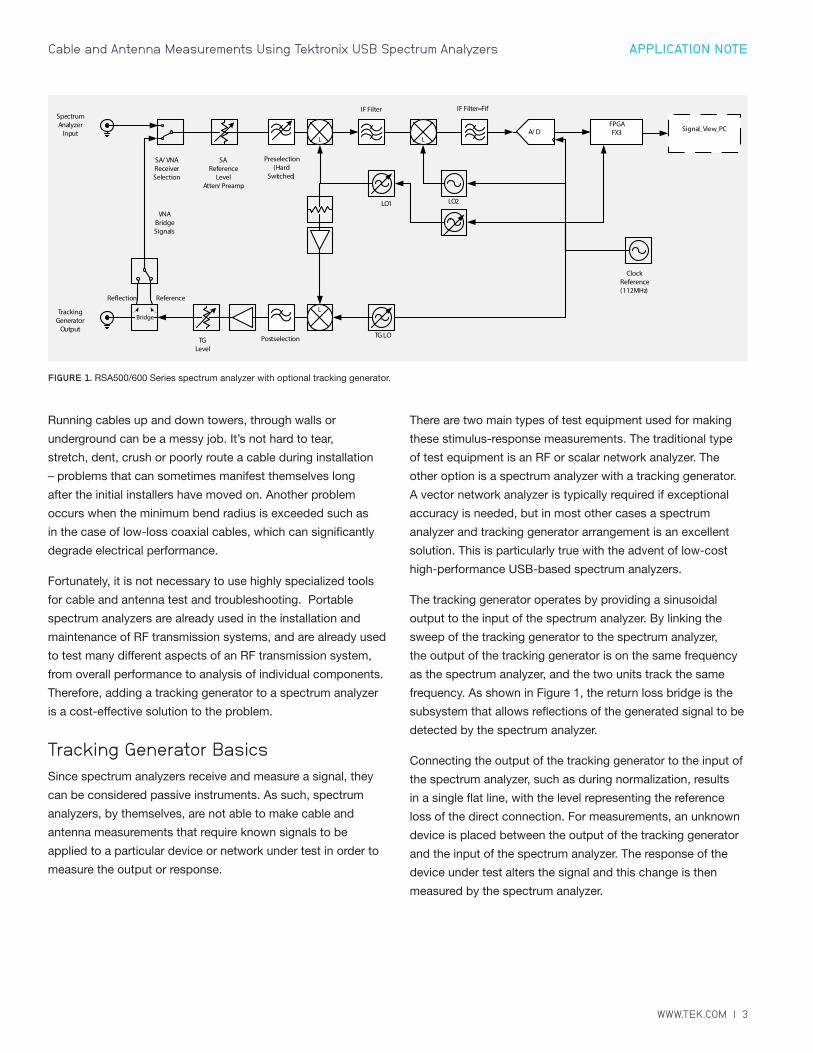
frequency. As shown in Figure 1, the return loss bridge is the
subsystem that allows reflections of the generated signal to be
detected by the spectrum analyzer.
Connecting the output of the tracking generator to the input of
the spectrum analyzer, such as during normalization, results
in a single flat line, with the level representing the reference
loss of the direct connection. For measurements, an unknown
device is placed between the output of the tracking generator
and the input of the spectrum analyzer. The response of the
device under test alters the signal and this change is then
measured by the spectrum analyzer.
FIGURE 1. RSA500/600 Series spectrum analyzer with optional tracking generator.
L
L
Re�ection Reference
LA/ D
LO2
TG LO
SAReference
LevelAtten/ Preamp
TGLevel
ClockReference(112MHz)
Postselection
Preselection(Hard
Switched)
IF Filter IF Filter=Fif
Bridge
SA/ VNAReceiverSelection
VNABridgeSignals
SpectrumAnalyzer
Input
TrackingGenerator
Output
FPGAFX3 Signal_View_PC
LO1
4 | WWW.TEK.COM
APPLICATION NOTECable and Antenna Measurements Using Tektronix USB Spectrum Analyzers
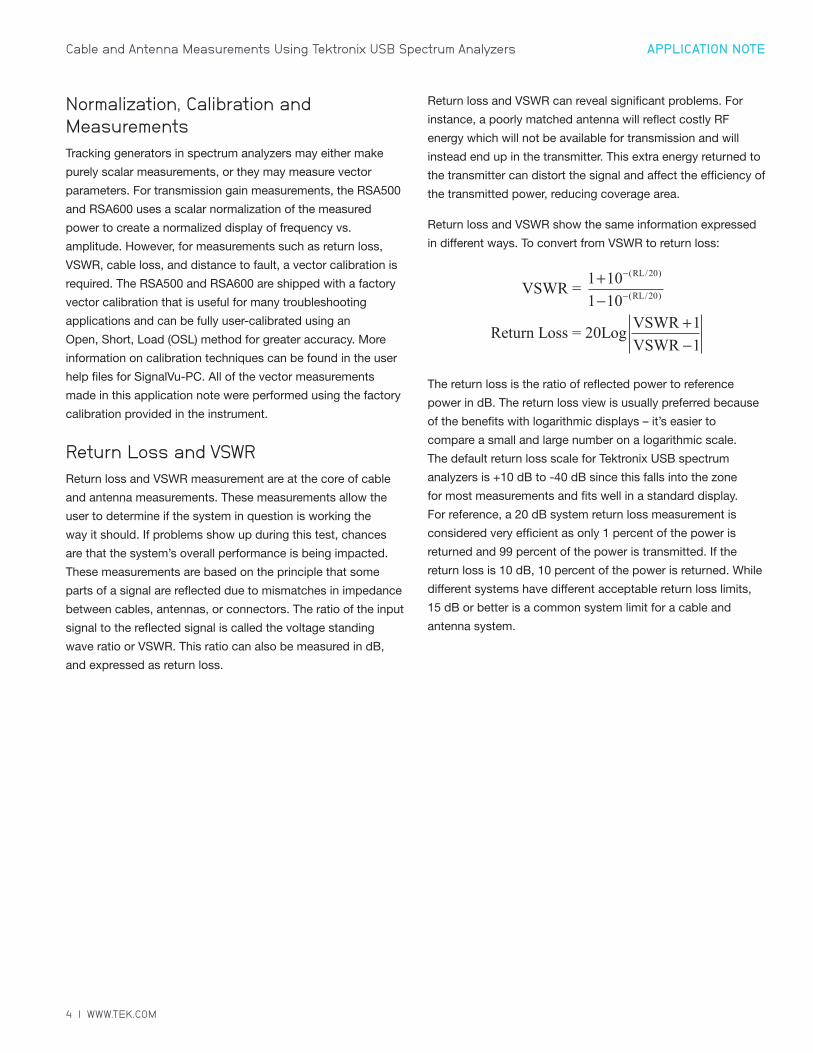
Normalization, Calibration and MeasurementsTracking generators in spectrum analyzers may either make
purely scalar measurements, or they may measure vector
parameters. For transmission gain measurements, the RSA500
and RSA600 uses a scalar normalization of the measured
power to create a normalized display of frequency vs.
amplitude. However, for measurements such as return loss,
VSWR, cable loss, and distance to fault, a vector calibration is
required. The RSA500 and RSA600 are shipped with a factory
vector calibration that is useful for many troubleshooting
applications and can be fully user-calibrated using an
Open, Short, Load (OSL) method for greater accuracy. More
information on calibration techniques can be found in the user
help files for SignalVu-PC. All of the vector measurements
made in this application note were performed using the factory
calibration provided in the instrument.
Return Loss and VSWRReturn loss and VSWR measurement are at the core of cable
and antenna measurements. These measurements allow the
user to determine if the system in question is working the
way it should. If problems show up during this test, chances
are that the system’s overall performance is being impacted.
These measurements are based on the principle that some
parts of a signal are reflected due to mismatches in impedance
between cables, antennas, or connectors. The ratio of the input
signal to the reflected signal is called the voltage standing
wave ratio or VSWR. This ratio can also be measured in dB,
and expressed as return loss.
Return loss and VSWR can reveal significant problems. For
instance, a poorly matched antenna will reflect costly RF
energy which will not be available for transmission and will
instead end up in the transmitter. This extra energy returned to
the transmitter can distort the signal and affect the efficiency of
the transmitted power, reducing coverage area.
Return loss and VSWR show the same information expressed
in different ways. To convert from VSWR to return loss:
The return loss is the ratio of reflected power to reference
power in dB. The return loss view is usually preferred because
of the benefits with logarithmic displays – it’s easier to
compare a small and large number on a logarithmic scale.
The default return loss scale for Tektronix USB spectrum
analyzers is +10 dB to -40 dB since this falls into the zone
for most measurements and fits well in a standard display.
For reference, a 20 dB system return loss measurement is
considered very efficient as only 1 percent of the power is
returned and 99 percent of the power is transmitted. If the
return loss is 10 dB, 10 percent of the power is returned. While
different systems have different acceptable return loss limits,
15 dB or better is a common system limit for a cable and
antenna system.
WWW.TEK.COM | 5
APPLICATION NOTECable and Antenna Measurements Using Tektronix USB Spectrum Analyzers
In contrast to return loss, VSWR displays the impedance
match of the system linearly, measuring the ratio of voltage
peaks and valleys. If the match isn’t perfect, the reflected
signal will add and subtract from the transmitted signal. The
greater this number, the worse the match. A perfect or ideal
match in VSWR terms would be 1:1. A more realistic match
for a cable and antenna system is in the order of 1.43 (15
dB return loss). Antenna manufacturers typically specify the
match in VSWR based on a certain operating frequency and
characteristic impedance. Higher VSWR's indicate a greater
degree of impedance mismatch and can be viewed as having
less efficient power transfer. The default scale of VSWR for
Tektronix USB instruments is 1 to 10.
Tektronix’ RSA500 and RSA600 spectrum analyzers with the
added tracking generator option allow for return loss and
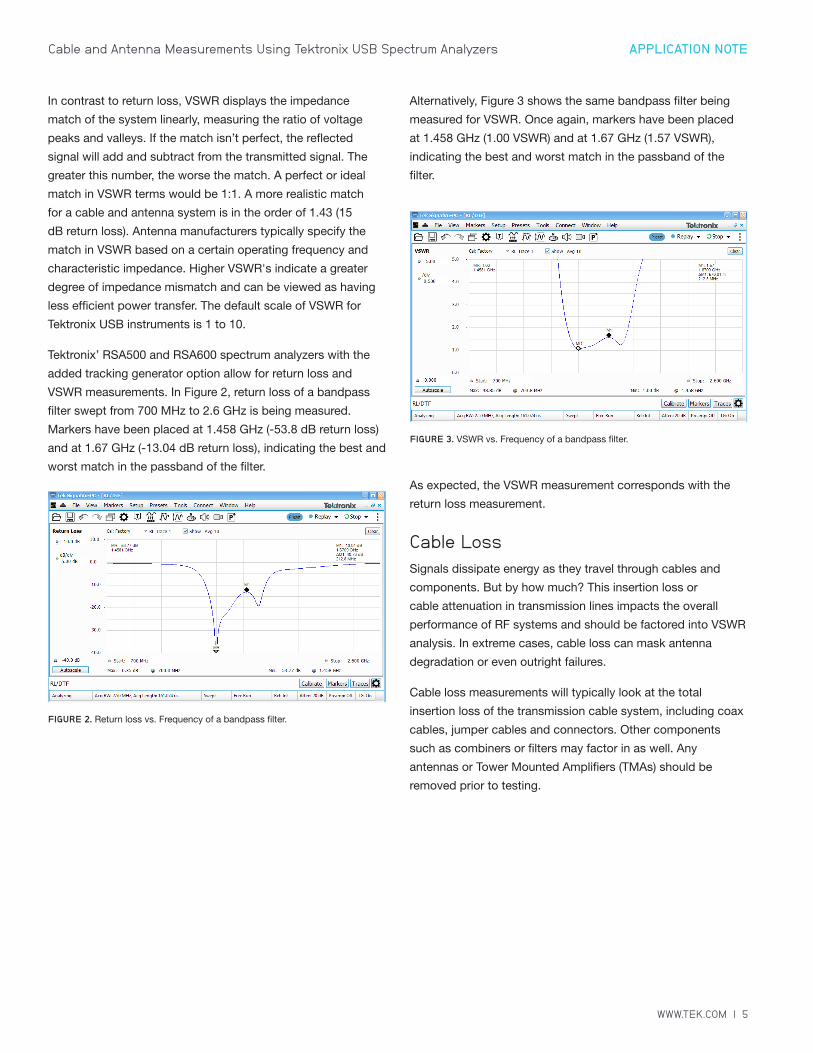
VSWR measurements. In Figure 2, return loss of a bandpass
filter swept from 700 MHz to 2.6 GHz is being measured.
Markers have been placed at 1.458 GHz (-53.8 dB return loss)
and at 1.67 GHz (-13.04 dB return loss), indicating the best and
worst match in the passband of the filter.
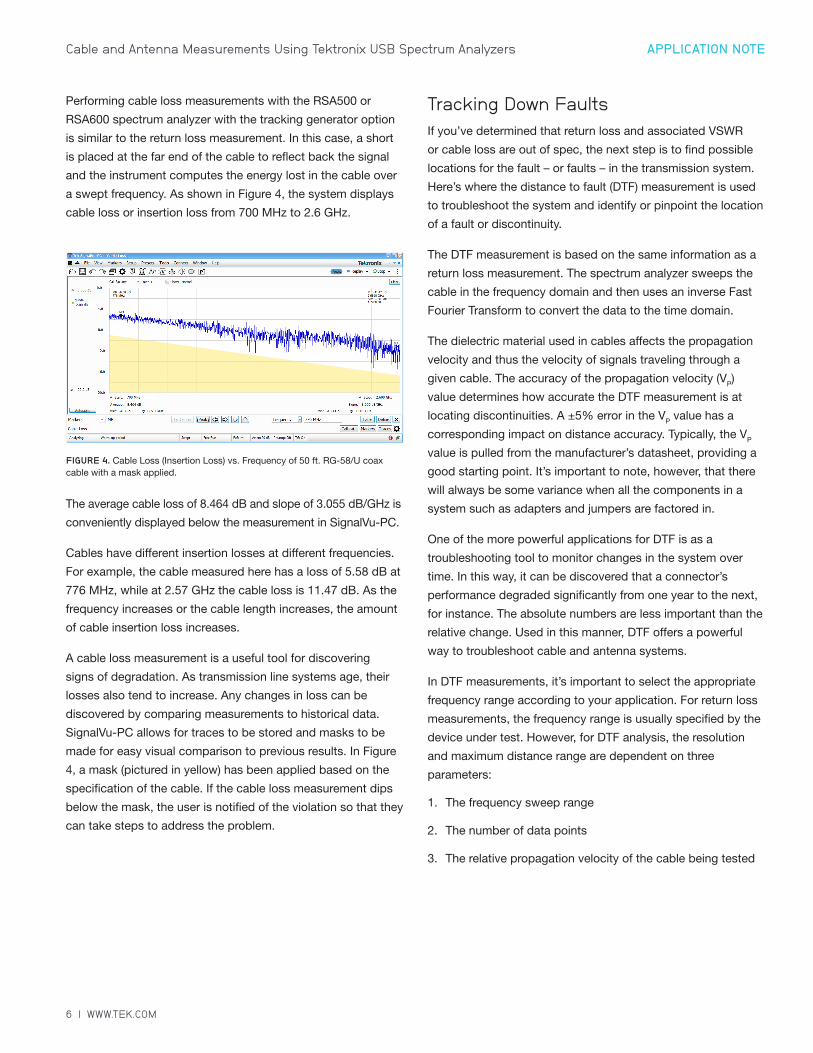
Alternatively, Figure 3 shows the same bandpass filter being
measured for VSWR. Once again, markers have been placed
at 1.458 GHz (1.00 VSWR) and at 1.67 GHz (1.57 VSWR),
indicating the best and worst match in the passband of the
filter.
As expected, the VSWR measurement corresponds with the
return loss measurement.
Cable LossSignals dissipate energy as they travel through cables and
components. But by how much? This insertion loss or
cable attenuation in transmission lines impacts the overall
performance of RF systems and should be factored into VSWR
analysis. In extreme cases, cable loss can mask antenna
degradation or even outright failures.
Cable loss measurements will typically look at the total
insertion loss of the transmission cable system, including coax
cables, jumper cables and connectors. Other components
such as combiners or filters may factor in as well. Any
antennas or Tower Mounted Amplifiers (TMAs) should be
removed prior to testing.
FIGURE 2. Return loss vs. Frequency of a bandpass filter.
FIGURE 3. VSWR vs. Frequency of a bandpass filter.
6 | WWW.TEK.COM
APPLICATION NOTECable and Antenna Measurements Using Tektronix USB Spectrum Analyzers
Performing cable loss measurements with the RSA500 or
RSA600 spectrum analyzer with the tracking generator option
is similar to the return loss measurement. In this case, a short
is placed at the far end of the cable to reflect back the signal
and the instrument computes the energy lost in the cable over
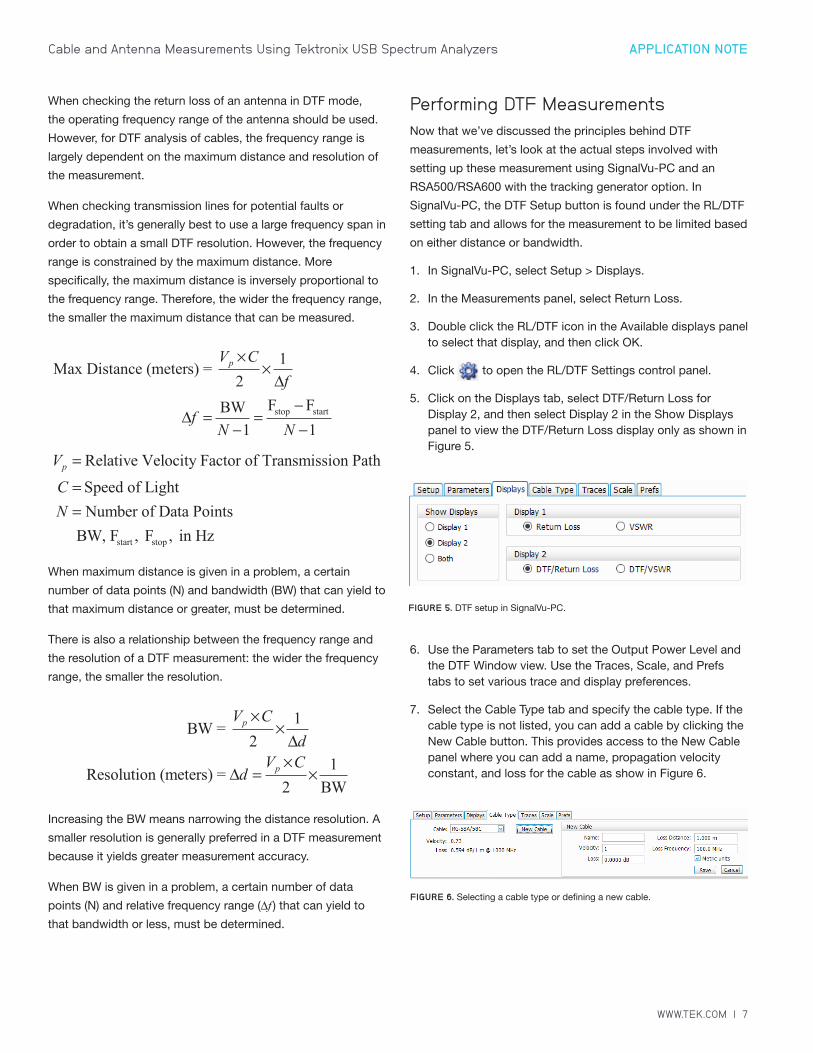
a swept frequency. As shown in Figure 4, the system displays
cable loss or insertion loss from 700 MHz to 2.6 GHz.
The average cable loss of 8.464 dB and slope of 3.055 dB/GHz is
conveniently displayed below the measurement in SignalVu-PC.
Cables have different insertion losses at different frequencies.
For example, the cable measured here has a loss of 5.58 dB at
776 MHz, while at 2.57 GHz the cable loss is 11.47 dB. As the
frequency increases or the cable length increases, the amount
of cable insertion loss increases.
A cable loss measurement is a useful tool for discovering
signs of degradation. As transmission line systems age, their
losses also tend to increase. Any changes in loss can be
discovered by comparing measurements to historical data.
SignalVu-PC allows for traces to be stored and masks to be
made for easy visual comparison to previous results. In Figure
4, a mask (pictured in yellow) has been applied based on the
specification of the cable. If the cable loss measurement dips
below the mask, the user is notified of the violation so that they
can take steps to address the problem.
Tracking Down FaultsIf you’ve determined that return loss and associated VSWR
or cable loss are out of spec, the next step is to find possible
locations for the fault – or faults – in the transmission system.
Here’s where the distance to fault (DTF) measurement is used
to troubleshoot the system and identify or pinpoint the location
of a fault or discontinuity.
The DTF measurement is based on the same information as a
return loss measurement. The spectrum analyzer sweeps the
cable in the frequency domain and then uses an inverse Fast
Fourier Transform to convert the data to the time domain.
The dielectric material used in cables affects the propagation
velocity and thus the velocity of signals traveling through a
given cable. The accuracy of the propagation velocity (VP)
value determines how accurate the DTF measurement is at
locating discontinuities. A ±5% error in the VP value has a
corresponding impact on distance accuracy. Typically, the VP
value is pulled from the manufacturer’s datasheet, providing a
good starting point. It’s important to note, however, that there
will always be some variance when all the components in a
system such as adapters and jumpers are factored in.
One of the more powerful applications for DTF is as a
troubleshooting tool to monitor changes in the system over
time. In this way, it can be discovered that a connector’s
performance degraded significantly from one year to the next,
for instance. The absolute numbers are less important than the
relative change. Used in this manner, DTF offers a powerful
way to troubleshoot cable and antenna systems.
In DTF measurements, it’s important to select the appropriate
frequency range according to your application. For return loss
measurements, the frequency range is usually specified by the
device under test. However, for DTF analysis, the resolution
and maximum distance range are dependent on three
parameters:
1. The frequency sweep range
2. The number of data points
3. The relative propagation velocity of the cable being tested
FIGURE 4. Cable Loss (Insertion Loss) vs. Frequency of 50 ft. RG-58/U coax cable with a mask applied.
WWW.TEK.COM | 7
APPLICATION NOTECable and Antenna Measurements Using Tektronix USB Spectrum Analyzers
When checking the return loss of an antenna in DTF mode,
the operating frequency range of the antenna should be used.
However, for DTF analysis of cables, the frequency range is
largely dependent on the maximum distance and resolution of
the measurement.
When checking transmission lines for potential faults or
degradation, it’s generally best to use a large frequency span in
order to obtain a small DTF resolution. However, the frequency
range is constrained by the maximum distance. More
specifically, the maximum distance is inversely proportional to
the frequency range. Therefore, the wider the frequency range,
the smaller the maximum distance that can be measured.
When maximum distance is given in a problem, a certain
number of data points (N) and bandwidth (BW) that can yield to
that maximum distance or greater, must be determined.
There is also a relationship between the frequency range and
the resolution of a DTF measurement: the wider the frequency
range, the smaller the resolution.
Increasing the BW means narrowing the distance resolution. A
smaller resolution is generally preferred in a DTF measurement
because it yields greater measurement accuracy.
When BW is given in a problem, a certain number of data
points (N) and relative frequency range (Δf ) that can yield to
that bandwidth or less, must be determined.
Performing DTF MeasurementsNow that we’ve discussed the principles behind DTF
measurements, let’s look at the actual steps involved with
setting up these measurement using SignalVu-PC and an
RSA500/RSA600 with the tracking generator option. In
SignalVu-PC, the DTF Setup button is found under the RL/DTF
setting tab and allows for the measurement to be limited based
on either distance or bandwidth.
1. In SignalVu-PC, select Setup > Displays.
2. In the Measurements panel, select Return Loss.
3. Double click the RL/DTF icon in the Available displays panel to select that display, and then click OK.
4. Click to open the RL/DTF Settings control panel.
5. Click on the Displays tab, select DTF/Return Loss for Display 2, and then select Display 2 in the Show Displays panel to view the DTF/Return Loss display only as shown in Figure 5.
6. Use the Parameters tab to set the Output Power Level and the DTF Window view. Use the Traces, Scale, and Prefs tabs to set various trace and display preferences.
7. Select the Cable Type tab and specify the cable type. If the cable type is not listed, you can add a cable by clicking the New Cable button. This provides access to the New Cable panel where you can add a name, propagation velocity constant, and loss for the cable as show in Figure 6.
FIGURE 5. DTF setup in SignalVu-PC.
FIGURE 6. Selecting a cable type or defining a new cable.
8 | WWW.TEK.COM
APPLICATION NOTECable and Antenna Measurements Using Tektronix USB Spectrum Analyzers
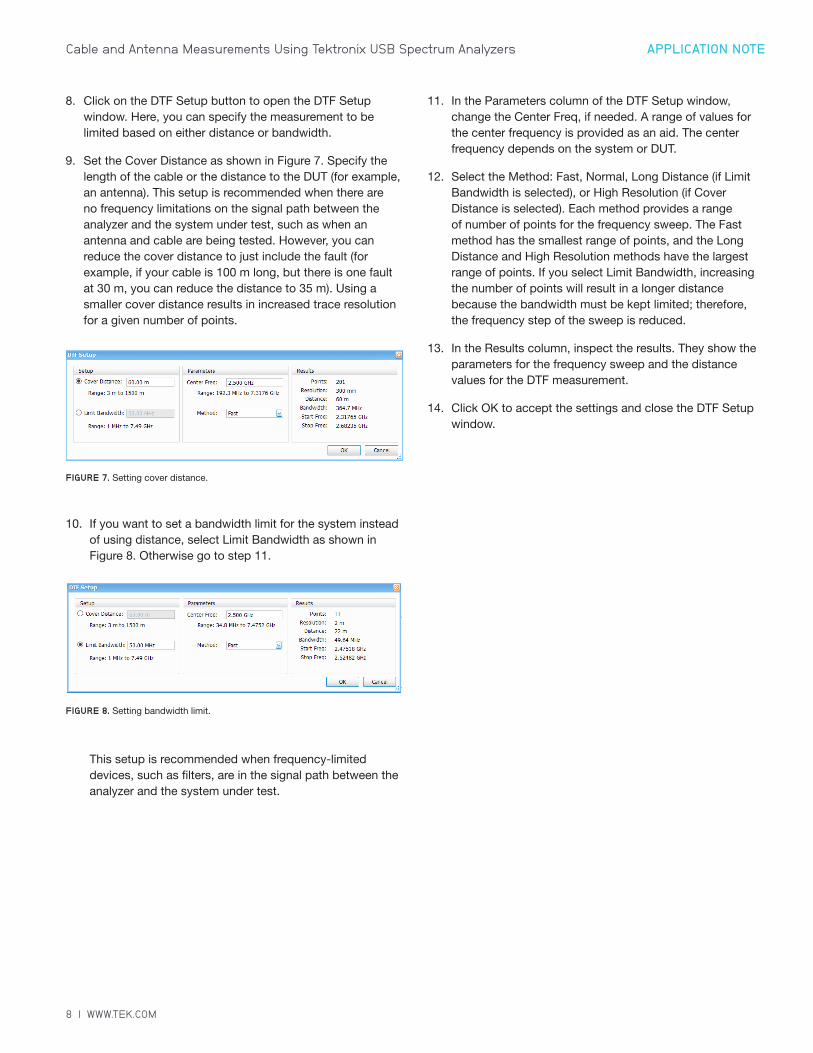
8. Click on the DTF Setup button to open the DTF Setup window. Here, you can specify the measurement to be limited based on either distance or bandwidth.
9. Set the Cover Distance as shown in Figure 7. Specify the length of the cable or the distance to the DUT (for example, an antenna). This setup is recommended when there are no frequency limitations on the signal path between the analyzer and the system under test, such as when an antenna and cable are being tested. However, you can reduce the cover distance to just include the fault (for example, if your cable is 100 m long, but there is one fault at 30 m, you can reduce the distance to 35 m). Using a smaller cover distance results in increased trace resolution for a given number of points.
10. If you want to set a bandwidth limit for the system instead of using distance, select Limit Bandwidth as shown in Figure 8. Otherwise go to step 11.
This setup is recommended when frequency-limited devices, such as filters, are in the signal path between the analyzer and the system under test.
11. In the Parameters column of the DTF Setup window, change the Center Freq, if needed. A range of values for the center frequency is provided as an aid. The center frequency depends on the system or DUT.
12. Select the Method: Fast, Normal, Long Distance (if Limit Bandwidth is selected), or High Resolution (if Cover Distance is selected). Each method provides a range of number of points for the frequency sweep. The Fast method has the smallest range of points, and the Long Distance and High Resolution methods have the largest range of points. If you select Limit Bandwidth, increasing the number of points will result in a longer distance because the bandwidth must be kept limited; therefore, the frequency step of the sweep is reduced.
13. In the Results column, inspect the results. They show the parameters for the frequency sweep and the distance values for the DTF measurement.
14. Click OK to accept the settings and close the DTF Setup window.
FIGURE 7. Setting cover distance.
FIGURE 8. Setting bandwidth limit.
WWW.TEK.COM | 9
APPLICATION NOTECable and Antenna Measurements Using Tektronix USB Spectrum Analyzers
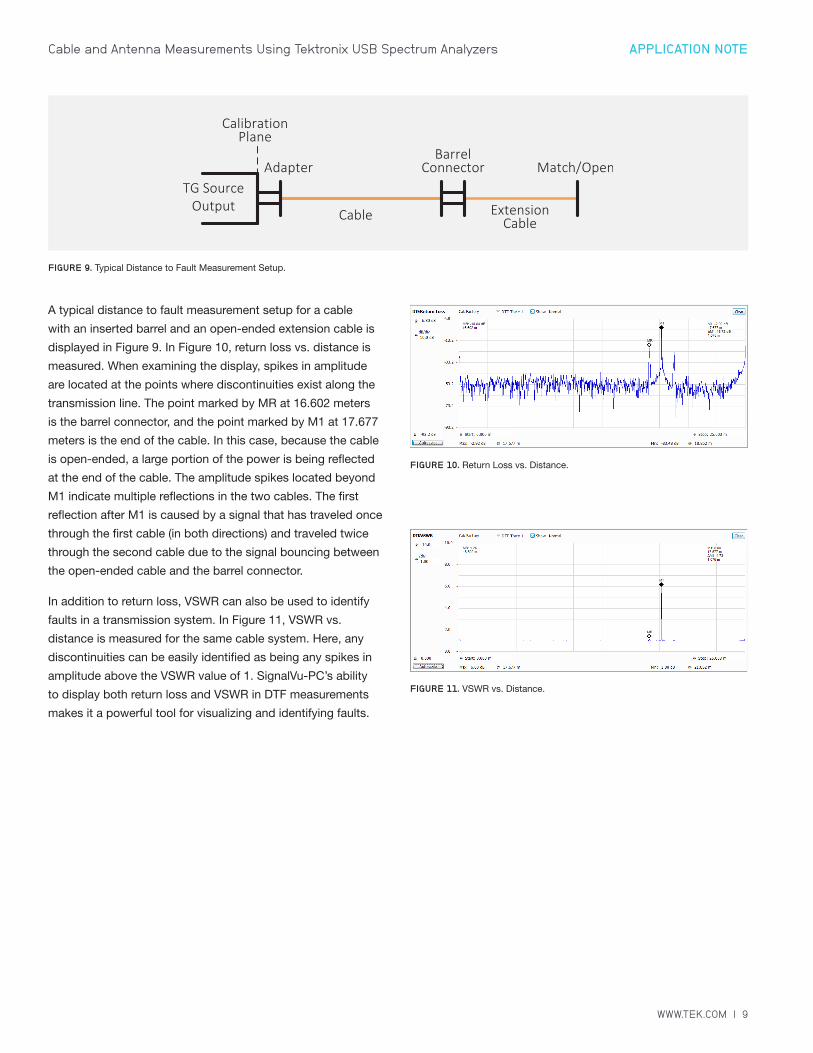
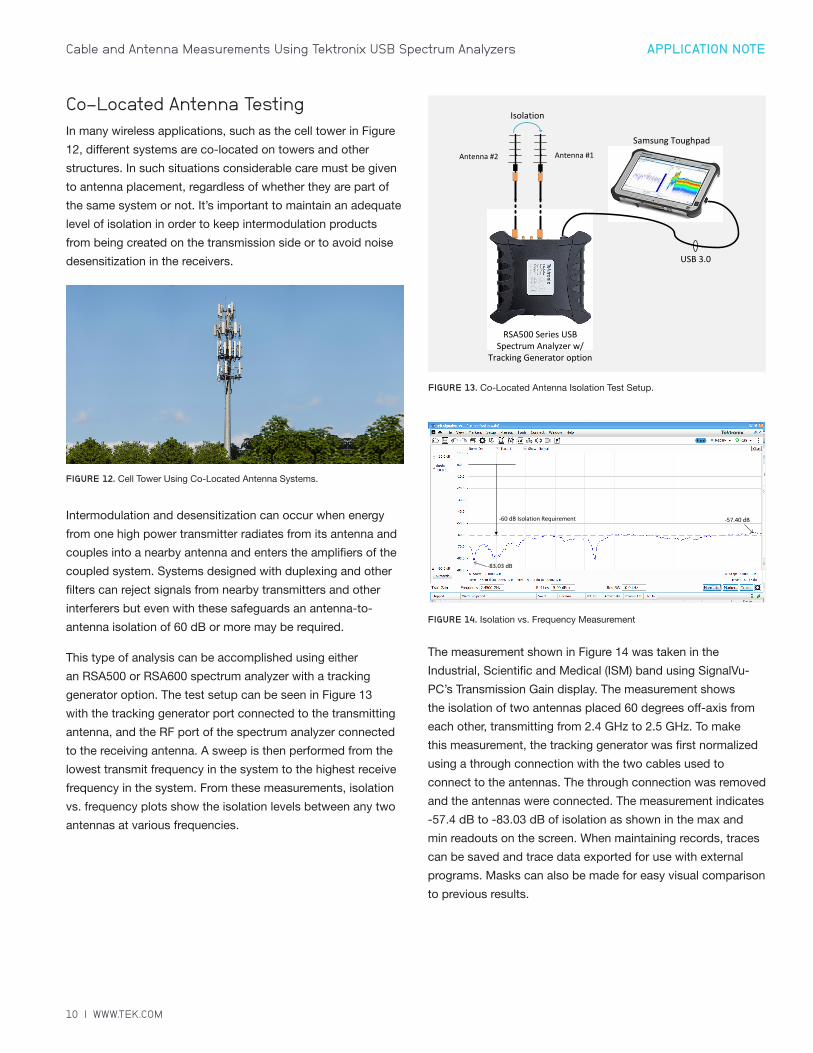
A typical distance to fault measurement setup for a cable
with an inserted barrel and an open-ended extension cable is
displayed in Figure 9. In Figure 10, return loss vs. distance is
measured. When examining the display, spikes in amplitude
are located at the points where discontinuities exist along the
transmission line. The point marked by MR at 16.602 meters
is the barrel connector, and the point marked by M1 at 17.677
meters is the end of the cable. In this case, because the cable
is open-ended, a large portion of the power is being reflected
at the end of the cable. The amplitude spikes located beyond
M1 indicate multiple reflections in the two cables. The first
reflection after M1 is caused by a signal that has traveled once
through the first cable (in both directions) and traveled twice
through the second cable due to the signal bouncing between
the open-ended cable and the barrel connector.
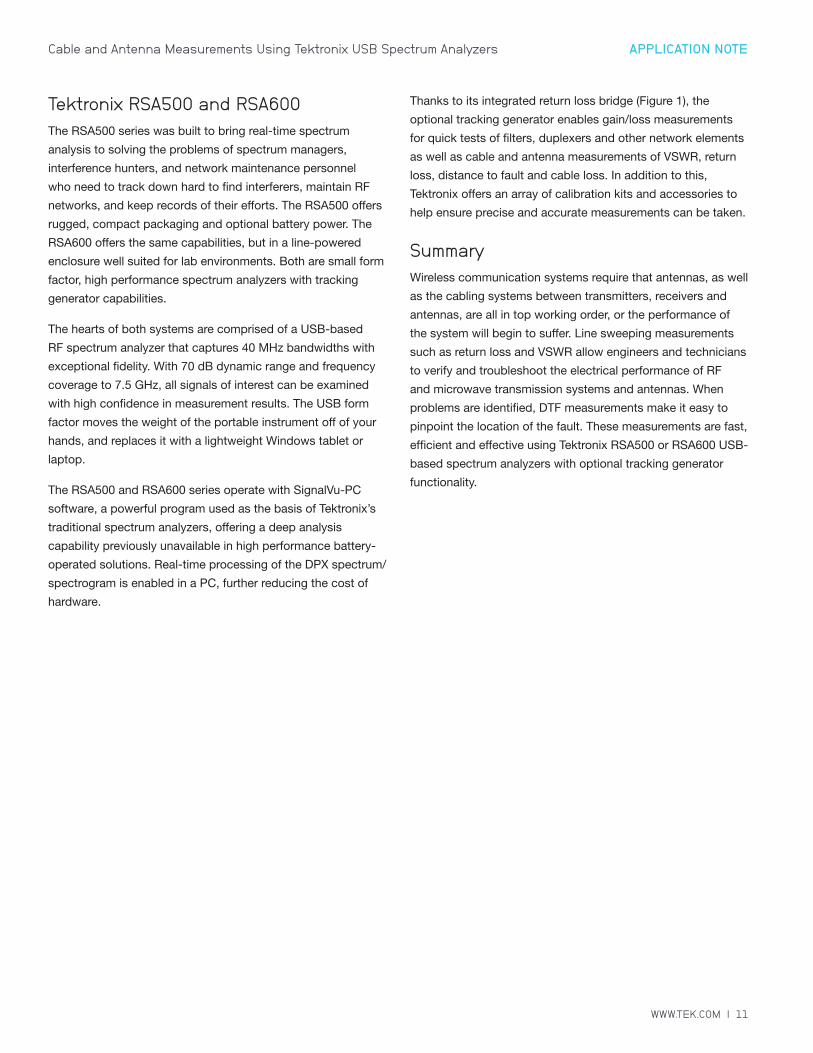
In addition to return loss, VSWR can also be used to identify
faults in a transmission system. In Figure 11, VSWR vs.
distance is measured for the same cable system. Here, any
discontinuities can be easily identified as being any spikes in
amplitude above the VSWR value of 1. SignalVu-PC’s ability
to display both return loss and VSWR in DTF measurements
makes it a powerful tool for visualizing and identifying faults.
FIGURE 10. Return Loss vs. Distance.
FIGURE 11. VSWR vs. Distance.
FIGURE 9. Typical Distance to Fault Measurement Setup.
10 | WWW.TEK.COM
APPLICATION NOTECable and Antenna Measurements Using Tektronix USB Spectrum Analyzers
Co-Located Antenna TestingIn many wireless applications, such as the cell tower in Figure
12, different systems are co-located on towers and other
structures. In such situations considerable care must be given
to antenna placement, regardless of whether they are part of
the same system or not. It’s important to maintain an adequate
level of isolation in order to keep intermodulation products
from being created on the transmission side or to avoid noise
desensitization in the receivers.
Intermodulation and desensitization can occur when energy
from one high power transmitter radiates from its antenna and
couples into a nearby antenna and enters the amplifiers of the
coupled system. Systems designed with duplexing and other
filters can reject signals from nearby transmitters and other
interferers but even with these safeguards an antenna-to-
antenna isolation of 60 dB or more may be required.
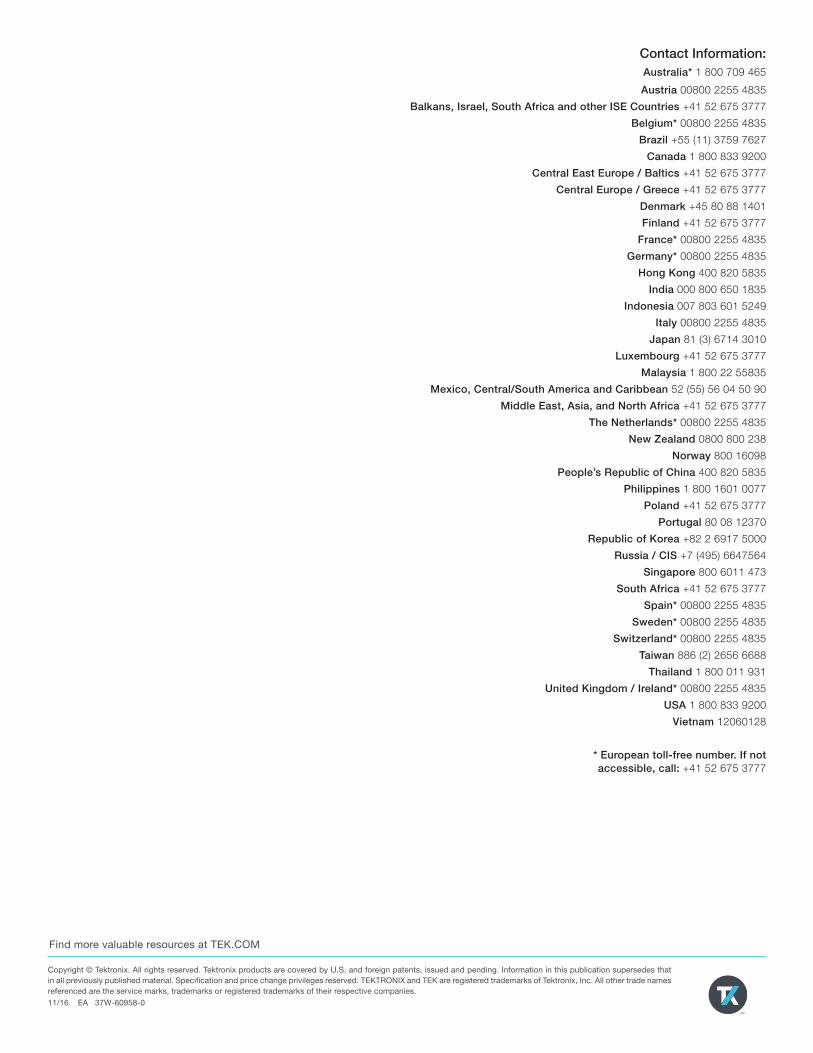
This type of analysis can be accomplished using either
an RSA500 or RSA600 spectrum analyzer with a tracking
generator option. The test setup can be seen in Figure 13
with the tracking generator port connected to the transmitting
antenna, and the RF port of the spectrum analyzer connected
to the receiving antenna. A sweep is then performed from the
lowest transmit frequency in the system to the highest receive
frequency in the system. From these measurements, isolation
vs. frequency plots show the isolation levels between any two
antennas at various frequencies.
The measurement shown in Figure 14 was taken in the
Industrial, Scientific and Medical (ISM) band using SignalVu-
PC’s Transmission Gain display. The measurement shows
the isolation of two antennas placed 60 degrees off-axis from
each other, transmitting from 2.4 GHz to 2.5 GHz. To make
this measurement, the tracking generator was first normalized
using a through connection with the two cables used to
connect to the antennas. The through connection was removed
and the antennas were connected. The measurement indicates
-57.4 dB to -83.03 dB of isolation as shown in the max and
min readouts on the screen. When maintaining records, traces
can be saved and trace data exported for use with external
programs. Masks can also be made for easy visual comparison
to previous results.
FIGURE 13. Co-Located Antenna Isolation Test Setup.
USB 3.0
RSA500 Series USB Spectrum Analyzer w/
Tracking Generator option
Samsung Toughpad
Isolation
Antenna #1Antenna #2
FIGURE 14. Isolation vs. Frequency Measurement
-83.03 dB
-57.40 dB-60 dB Isolation Requirement
FIGURE 12. Cell Tower Using Co-Located Antenna Systems.
WWW.TEK.COM | 11
APPLICATION NOTECable and Antenna Measurements Using Tektronix USB Spectrum Analyzers
Tektronix RSA500 and RSA600The RSA500 series was built to bring real-time spectrum
analysis to solving the problems of spectrum managers,
interference hunters, and network maintenance personnel
who need to track down hard to find interferers, maintain RF
networks, and keep records of their efforts. The RSA500 offers
rugged, compact packaging and optional battery power. The
RSA600 offers the same capabilities, but in a line-powered
enclosure well suited for lab environments. Both are small form
factor, high performance spectrum analyzers with tracking
generator capabilities.
The hearts of both systems are comprised of a USB-based
RF spectrum analyzer that captures 40 MHz bandwidths with
exceptional fidelity. With 70 dB dynamic range and frequency
coverage to 7.5 GHz, all signals of interest can be examined
with high confidence in measurement results. The USB form
factor moves the weight of the portable instrument off of your
hands, and replaces it with a lightweight Windows tablet or
laptop.
The RSA500 and RSA600 series operate with SignalVu-PC
software, a powerful program used as the basis of Tektronix’s
traditional spectrum analyzers, offering a deep analysis
capability previously unavailable in high performance battery-
operated solutions. Real-time processing of the DPX spectrum/
spectrogram is enabled in a PC, further reducing the cost of
hardware.
Thanks to its integrated return loss bridge (Figure 1), the
optional tracking generator enables gain/loss measurements
for quick tests of filters, duplexers and other network elements
as well as cable and antenna measurements of VSWR, return
loss, distance to fault and cable loss. In addition to this,
Tektronix offers an array of calibration kits and accessories to
help ensure precise and accurate measurements can be taken.
SummaryWireless communication systems require that antennas, as well
as the cabling systems between transmitters, receivers and
antennas, are all in top working order, or the performance of
the system will begin to suffer. Line sweeping measurements
such as return loss and VSWR allow engineers and technicians
to verify and troubleshoot the electrical performance of RF
and microwave transmission systems and antennas. When
problems are identified, DTF measurements make it easy to
pinpoint the location of the fault. These measurements are fast,
efficient and effective using Tektronix RSA500 or RSA600 USB-
based spectrum analyzers with optional tracking generator
functionality.
Contact Information: Australia* 1 800 709 465
Austria 00800 2255 4835
Balkans, Israel, South Africa and other ISE Countries +41 52 675 3777
Belgium* 00800 2255 4835
Brazil +55 (11) 3759 7627
Canada 1 800 833 9200
Central East Europe / Baltics +41 52 675 3777
Central Europe / Greece +41 52 675 3777
Denmark +45 80 88 1401
Finland +41 52 675 3777
France* 00800 2255 4835
Germany* 00800 2255 4835
Hong Kong 400 820 5835
India 000 800 650 1835
Indonesia 007 803 601 5249
Italy 00800 2255 4835
Japan 81 (3) 6714 3010
Luxembourg +41 52 675 3777
Malaysia 1 800 22 55835
Mexico, Central/South America and Caribbean 52 (55) 56 04 50 90
Middle East, Asia, and North Africa +41 52 675 3777
The Netherlands* 00800 2255 4835
New Zealand 0800 800 238
Norway 800 16098
People’s Republic of China 400 820 5835
Philippines 1 800 1601 0077
Poland +41 52 675 3777
Portugal 80 08 12370
Republic of Korea +82 2 6917 5000
Russia / CIS +7 (495) 6647564
Singapore 800 6011 473
South Africa +41 52 675 3777
Spain* 00800 2255 4835
Sweden* 00800 2255 4835
Switzerland* 00800 2255 4835
Taiwan 886 (2) 2656 6688
Thailand 1 800 011 931
United Kingdom / Ireland* 00800 2255 4835
USA 1 800 833 9200
Vietnam 12060128
* European toll-free number. If not accessible, call: +41 52 675 3777
Find more valuable resources at TEK.COM
Copyright © Tektronix. All rights reserved. Tektronix products are covered by U.S. and foreign patents, issued and pending. Information in this publication supersedes that in all previously published material. Specification and price change privileges reserved. TEKTRONIX and TEK are registered trademarks of Tektronix, Inc. All other trade names referenced are the service marks, trademarks or registered trademarks of their respective companies. 11/16 EA 37W-60958-0