Embed Size (px)
Citation preview

CAAP REPORT 2015 In this Summary Report, a summary of the ACT CAAP results are presented and compared to the results to US national normative results. These results cannot be generalized on any scale due to the small sample of students that took the test voluntarily, resulting in a sample that does not represent the entire student population efficiently in GPA or number.
The American University in Cairo www.aucegypt.edu
CAAP REPORT 2015
Page 2 DAIR, 2015
Executive Summary
The Collegiate Assessment of Academic Proficiency (CAAP) Test was given early Spring, term 2014-‐15, to sample of junior students. The test was administered on Tuesday February 10th, 2015. With continuous reminders and urging, only 60 of the total population of juniors 1224 (5%) junior students sat for the CAAP. Examining the sample representativeness with regards to major, the sample covers all 21 majors, with some majors represented by very small numbers (1 student). Each student who took the test was given the Critical Thinking, Reading, and Essay Writing modules (with the exception of one student that did not take the Essay Writing Test).
The tests were administered following CAAP standardized administration procedures. The Director of Assessment and Accreditation held orientation sessions with proctors before the administration of the test to familiarize them with the procedure. Completed forms were sent to ACT for scoring and a few months later reports were received. There was an institutional report, in addition to individual student reports. Each student received a report detailing his/her performance on tests that were taken, giving score and percentile rank compared to AUC students and also compared to American national norms of comparable 4-‐year institutions. In addition, students who got higher than the 50th percentile received a Certificate of Achievement.
It is essential to mention that these results cannot be generalized due to the small sample of students, in addition to the small range of their GPA scores (7% from 2.51 – 3.0, 37% from 3.1 – 5.0 and 57% above 5.0), which does not represent the entire AUC student body. We suggest that we take steps to address this issue so that our next tested sample provides better representation for our students’ population.
Note: ACT provides average scores in every category for which there are at least five students tested. If fewer than five have tested, the average score is virtually meaningless, so no average score provided.

CAAP REPORT 2015
Page 3 DAIR, 2015
I. SUMMARY OF SAMPLE CHARACTERISTICS
1. GENDER
Figure 1 -‐ Distribution of tested AUC students’ Sample by Gender
2. GPA
Figure 2 -‐ Distribution of tested AUC students’ Sample by GPA
41.6%
58.40% Male
Female
Total number of students = 60
0%
0%
7%
37%
57%
Below 2.0
2.01 – 2.5
2.51 – 3.0
3.01 – 3.5
3.51 and above
Average GPA of Student Sample
CAAP REPORT 2015
Page 4 DAIR, 2015
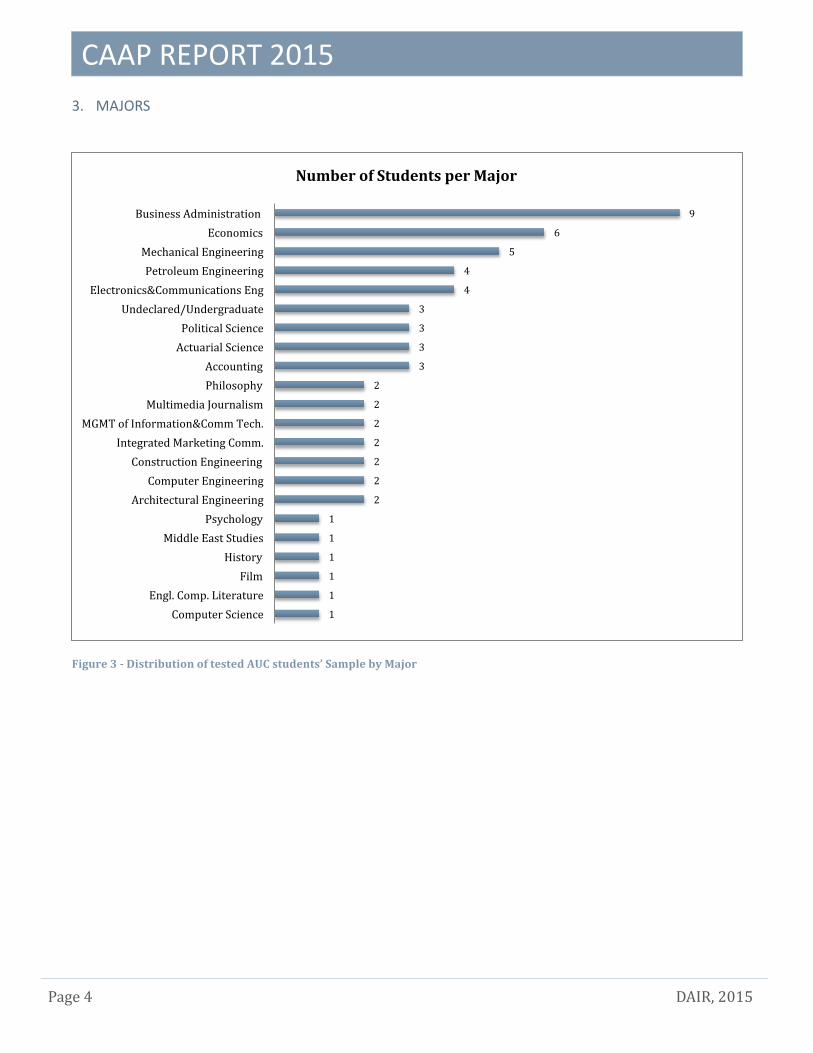
3. MAJORS
Figure 3 -‐ Distribution of tested AUC students’ Sample by Major
1
1
1
1
1
1
2
2
2
2
2
2
2
3
3
3
3
4
4
5
6
9
Computer Science Engl. Comp. Literature
Film History
Middle East Studies Psychology
Architectural Engineering Computer Engineering
Construction Engineering Integrated Marketing Comm.
MGMT of Information&Comm Tech. Multimedia Journalism
Philosophy Accounting
Actuarial Science Political Science
Undeclared/Undergraduate Electronics&Communications Eng
Petroleum Engineering Mechanical Engineering
Economics Business Administration
Number of Students per Major

CAAP REPORT 2015
Page 5 DAIR, 2015
II. STUDENT PERFORMANCE
Tested AUC students scored lower than US norms in the reading test with an average of 58.9, as opposed to the reported US national normative score of 61.6. However, AUC students scored higher on the critical thinking test with an average of 63.9, as opposed to the reported US national normative score of 59.4. Students also scored higher that US norms in essay writing with an average of 3.7, as opposed to the US norms of 3.3.
Table 1 – Mean Exam Scores for AUC students and US norms
TESTS COUNT AUC US NATIONAL NORMS
MEAN SD MEAN* SD Reading (40 -‐ 80) 60 58.9 4.4 61.6 5.6 Critical Thinking (40 -‐ 80) 60 63.9 5.2 59.4 5.5 Essay Writing (1-‐6) 59 3.7 0.5 3.3 0.6
Figure 4 – Tested AUC Students’ Performance Vs. US National Norms for Critical Thinking and Reading Tests
Figure 5 – Tested AUC Students’ Performance Vs. US National Norms for Essay Writing Test
58.9
63.9
61.6
59.4
Reading Score
Cri6cal Thinking Score
Tested AUC Students' Performance Vs. US Na9onal Norms
US Na6onal Norm Tested AUC Average
3.3
3.7
US National Norm
Tested AUC Average
AUC Students' Performance vs US Na9onal Norms for Essay Wri9ng Test

CAAP REPORT 2015
Page 6 DAIR, 2015
III. TEST SCORES PERCENTILES
In this section, the distribution of AUC tested students are presented and compared to ACT CAAP US norms (data collected from all institutions throughout the United States that used ACT CAAP during the last three years). The grade scale is divided into four quartiles using ACT CAAP norms and the percentages of AUC tested students falling within these quartiles were calculated.
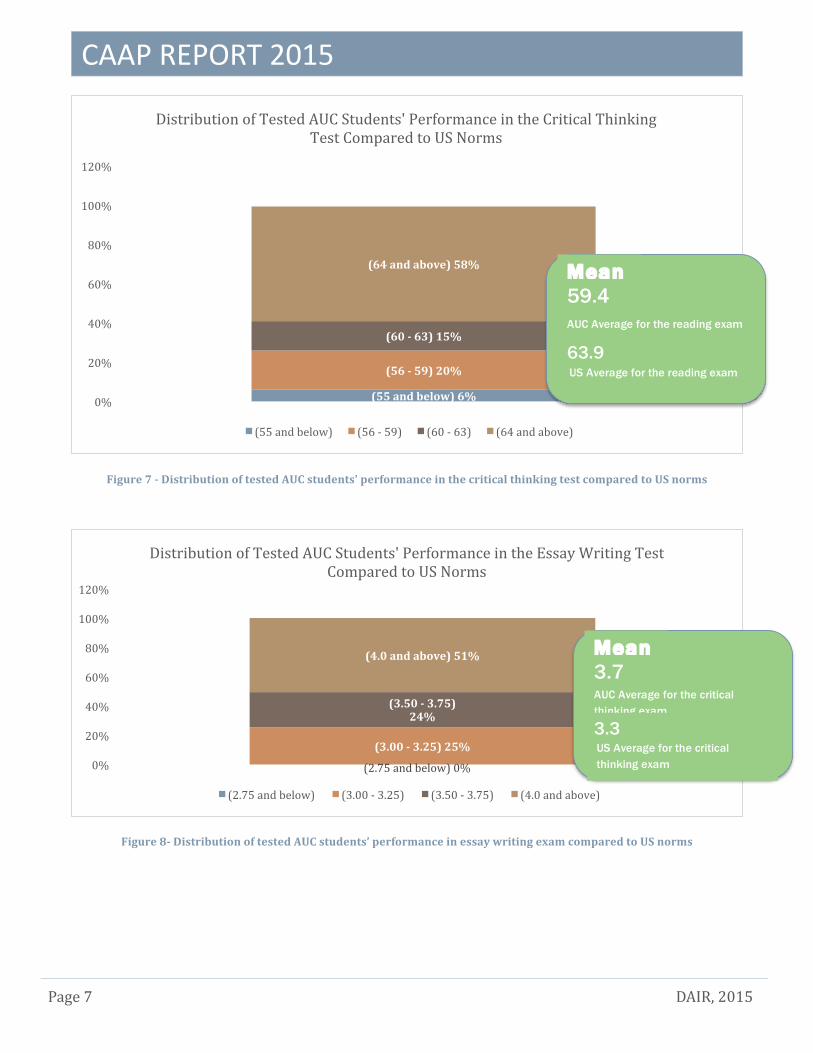
For the reading tests, it is clear that more than half of AUC tested students fall in the lower quartile, which is something that calls for attention. With regards to the critical thinking test, more than half of AUC students fall in the upper quartile as shown in Figure 7. For the essay writing test, shown in Figure 8, more than 50% of AUC tested students population fall in the upper quartile with no AUC students falling into the lower quartile.
This information can be used to set goals for enhancement, for example, reducing the percentage of students who fall in the lower quartiles by 3% in a 3 years period or increase the students in the third quartile. Once goals have been established, sufficient time must be given to create an action plan and implement suggested changes before allowing students to take the ACT CAAP test once more, and then comparing the new test scores to the frequency distribution once again.
Figure 6 -‐ Distribution of tested AUC students’ performance in the reading exam compared to US norms
(Scores 57 and below) 48%
(Scores 58 -‐ 61) 20%
(Scores 62 -‐ 65) 25%
(66 and above) 8%
0%
20%
40%
60%
80%
100%
120%
Distribution of Tested AUC Students' Performance in the Reading Test Compared to US Norms
(Scores 57 and below) (Scores 58 -‐ 61) (Scores 62 -‐ 65) (66 and above)
58.9 AUC Average for the reading exam
61.6 US Average for the reading exam
Mean
CAAP REPORT 2015
Page 7 DAIR, 2015
Figure 7 -‐ Distribution of tested AUC students' performance in the critical thinking test compared to US norms
Figure 8-‐ Distribution of tested AUC students’ performance in essay writing exam compared to US norms
(55 and below) 6%
(56 -‐ 59) 20%
(60 -‐ 63) 15%
(64 and above) 58%
0%
20%
40%
60%
80%
100%
120%
Distribution of Tested AUC Students' Performance in the Critical Thinking Test Compared to US Norms
(55 and below) (56 -‐ 59) (60 -‐ 63) (64 and above)
(2.75 and below) 0%
(3.00 -‐ 3.25) 25%
(3.50 -‐ 3.75) 24%
(4.0 and above) 51%
0%
20%
40%
60%
80%
100%
120%
Distribution of Tested AUC Students' Performance in the Essay Writing Test Compared to US Norms
(2.75 and below) (3.00 -‐ 3.25) (3.50 -‐ 3.75) (4.0 and above)
59.4 AUC Average for the reading exam
63.9 US Average for the reading exam
Mean
3.7 AUC Average for the critical thinking exam 3.3 US Average for the critical thinking exam
Mean

CAAP REPORT 2015
Page 8 DAIR, 2015
IV. CERTIFICATES OF ACHIEVEMENT
Most students (54 out of a total of 60 students) obtained Certificates of Achievements (90%) indicating that they achieved above the 50 percentile of the normative sample. Table 2 presents the number and percentage of certificates obtained in the different tested modules. The percentage of students scoring above US norms in critical thinking and essay writing were the same (73%). A significant lower percentage of students scored above the US norms in reading, with only 32% obtaining certificates of achievement in reading.
Some students obtained certificates in one subject, others in two or three. Table 3 details this information. The percentage of students who obtained three certificates was 27%, two certificates (35%) and one certificate was 28%. Six students (10%) did not obtain any certificates.
Table 2 – Number of students scoring above US norms by module
Test Number of Students Percentage of Students Essay Writing 44 73%
Critical Thinking 44 73% Reading 19 32%
Figure 9-‐ Percentage of Students that Scored above US norms by Module
32%
73%
73%
Reading
Essay Writing
Critical Thinking
Percentage of Students that Scored above US Norms by Module

CAAP REPORT 2015
Page 9 DAIR, 2015
Table 3 – Number of tests with scores above US norms
Number of tests with scores above US Norms
Number of Students Percentage of Students
Three 16 27% Two 21 35% One 17 28% Zero 6 10%
Figure 10-‐ Percentage of Students by Number of Test Scores above US norms
10%
28%
35%
27%
Zero
One
Two
Three
Num
ber of tests with scores above
US Norms
Percentage of Students by Number of Test Scores above US Norms
CAAP REPORT 2015
Page 10 DAIR, 2015
V. SUMMARY BY STUDENT BACKGROUND CHARACTERISTICS
In this section, AUC student performance in each of the demographic categories is examined.
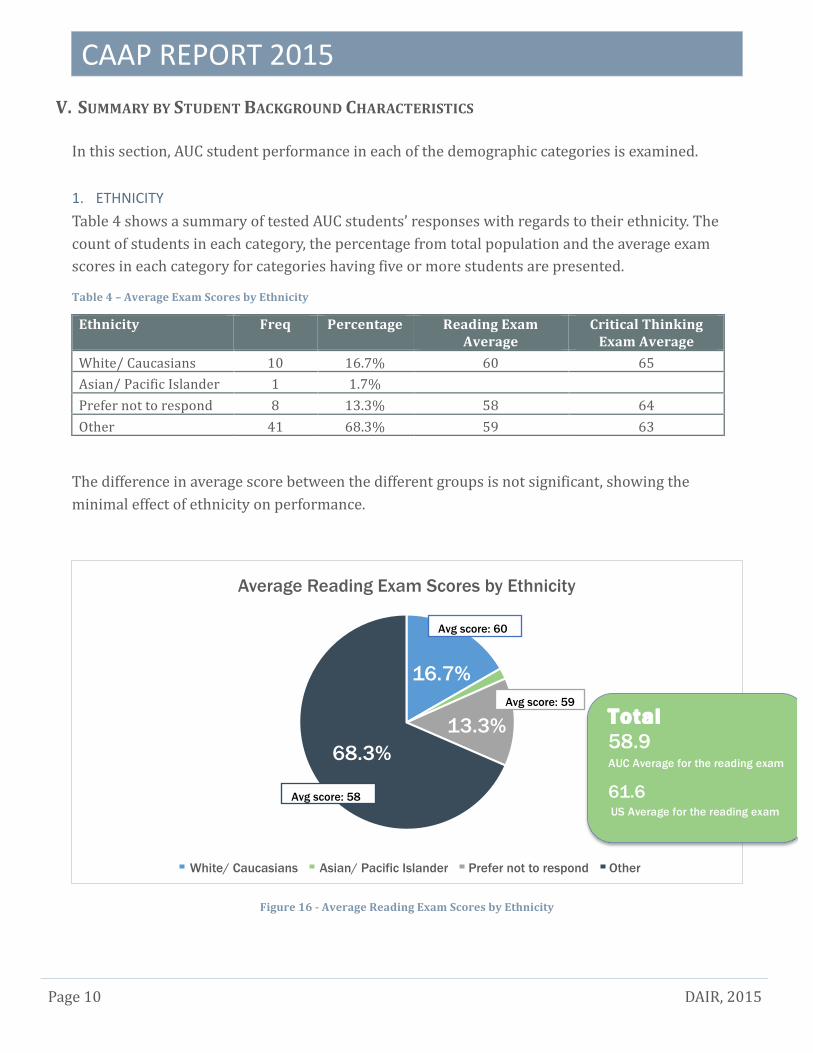
1. ETHNICITY Table 4 shows a summary of tested AUC students’ responses with regards to their ethnicity. The count of students in each category, the percentage from total population and the average exam scores in each category for categories having five or more students are presented.
Table 4 – Average Exam Scores by Ethnicity
Ethnicity Freq Percentage Reading Exam Average
Critical Thinking Exam Average
White/ Caucasians 10 16.7% 60 65 Asian/ Pacific Islander 1 1.7% Prefer not to respond 8 13.3% 58 64 Other 41 68.3% 59 63
The difference in average score between the different groups is not significant, showing the minimal effect of ethnicity on performance.
Figure 16 -‐ Average Reading Exam Scores by Ethnicity
16.7%
13.3% 68.3%
Average Reading Exam Scores by Ethnicity
White/ Caucasians Asian/ Pacific Islander Prefer not to respond Other
Avg score: 60
Avg score: 59
Avg score: 58
58.9 AUC Average for the reading exam
61.6 US Average for the reading exam
Total

CAAP REPORT 2015
Page 11 DAIR, 2015
Figure 17 -‐ Average Critical Thinking Exam Scores by Ethnicity
2. GENDER Table shows a summary of tested AUC students’ responses with regards to gender. The count of students in each category, the percentage from total population and the average exam scores in each category for categories having five or more students are presented.
Table 5 -‐ Average Exam Scores by Gender
Gender Freq Percentage Reading Exam Average
Critical Thinking Exam Average
Male 25 41.7% 58 64 Female 35 58.3% 59 64
Figure 18 -‐ Average Reading Exam Scores by Gender
16.7%
13.3% 68.3%
Average Critical Thinking Exam Scores by Ethnicity
White/ Caucasians Asian/ Pacific Islander Prefer not to respond Other
Avg score: 65
Avg score: 64
Avg score: 63
41.7% 58.3%
Average Reading Exam Scores by Gender
Male Female
Avg score: 59
Avg score: 58
63.9 AUC Average for the Critical Thinking exam 59.4 US Average for the Critical Thinking exam
Totals
59.4 AUC Average for the critical thinking exam 63.9 US Average for the critical thinking exam
Totals

CAAP REPORT 2015
Page 12 DAIR, 2015
Figure 19 -‐ Average Critical Thinking Exam Scores by Gender
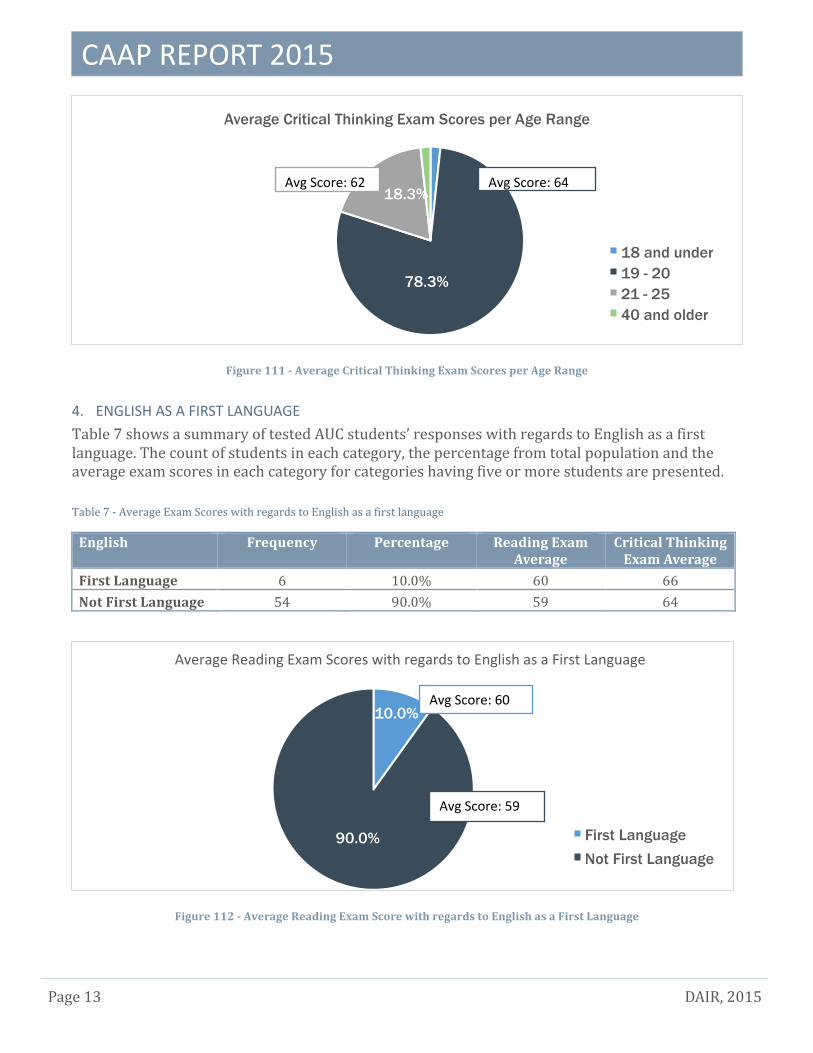
3. AGE RANGE Table shows a summary of tested AUC students’ responses with regards to their age range. The count of students in each category, the percentage from total population and the average exam scores in each category for categories having five or more students are presented.
Table 6 -‐ Average Exam Scores per Age Range
Age Range Freq Percentage Reading Exam Average/ Group
Critical Thinking Exam Average/ group
18 and under 1 1.7% 19 -‐ 20 47 78.3% 59 64 21 -‐ 25 11 18.3% 58 62 40 and older 1 1.7%
Figure 110 -‐ Average Reading Exam Scores per Age Range
41.7% 58.3%
Average Cri6cal Thinking Exam Scores by Gender
Male Female
Avg score: 64
Avg score: 64
63.9 AUC Average for the Critical Thinking exam 59.4 US Average for the Critical Thinking exam
Totals
78.3%
18.3%
Average Reading Exam Scores per Age Range
18 and under 19 - 20 21 - 25 40 and older
Avg Score: 59
Avg Score: 58
CAAP REPORT 2015
Page 13 DAIR, 2015
Figure 111 -‐ Average Critical Thinking Exam Scores per Age Range
4. ENGLISH AS A FIRST LANGUAGE Table 7 shows a summary of tested AUC students’ responses with regards to English as a first language. The count of students in each category, the percentage from total population and the average exam scores in each category for categories having five or more students are presented. Table 7 -‐ Average Exam Scores with regards to English as a first language
English Frequency Percentage Reading Exam Average
Critical Thinking Exam Average
First Language 6 10.0% 60 66 Not First Language 54 90.0% 59 64
Figure 112 -‐ Average Reading Exam Score with regards to English as a First Language
78.3%
18.3%
Average Critical Thinking Exam Scores per Age Range
18 and under 19 - 20 21 - 25 40 and older
Avg Score: 64 Avg Score: 62
10.0%
90.0%
Average Reading Exam Scores with regards to English as a First Language
First Language Not First Language
Avg Score: 60
Avg Score: 59

CAAP REPORT 2015
Page 14 DAIR, 2015
Figure 113 -‐ Average Critical Thinking Exam Score by English as a First Language
As shown in the results, students who responded that English is their first language scored higher than those who responded that English is not their first language in both exams. However, the difference between the performances of the two groups is not significant.
10.0%
90.0%
Average Cri6cal Thinking Exam Scores by English as a First Language
First Language
Not First Language
Avg Score: 66
Avg Score: 64

CAAP REPORT 2015
Page 15 DAIR, 2015
VI. SUMMARY BY STUDENT MAJOR (SELF-‐REPORTED) AND GPA (SYSTEM-‐EXTRACTED)
1. COLLEGE MAJOR Table 8 shows a summary of tested AUC students’ responses with regards to their college. It is presented as the count of students in each category, the percentage from total population and the average exam scores in each category for categories having five or more students.
It is important to note that the greater the number of tested students in a major, the more valid the results are. In some majors where there are very few students, results could not be generated, as ACT does not report test scores for groups less than 5 in number.
Table 8 -‐ Average Exam Scores and GPA by College Major
College Major Freq Percentage Average GPA
READING EXAM AVERAGE
CRITICAL THINKING EXAM AVERAGE
Undecided 1 1.7% Architecture 2 3.3% Business 14 23.3% 3.6 58 64 Communications 6 10.0% 3.66 59 62 Computer and Info Sciences
2 3.3%
Engineering 15 25.0% 3.19 59 64 Letters 1 1.7% Mathematics 3 5.0% Philosophy 2 3.3% Social Sciences 11 18.3 3.61 61 66
Figure 19 and Figure 20, show the performance of the tested students in the reading exam and the critical thinking exam respectively with regards to their majors, taking into consideration their average GPA and the number of participating students. Colors have been used to differentiate between student groups with respect to their reported major, where the size of the bubble shows the number of participants in each group. The average reading exam score per group is plotted on the vertical y-‐axis versus the average GPA per group on the horizontal x-‐axis.

CAAP REPORT 2015
Page 16 DAIR, 2015
Figure 114 -‐ Average Reading Score by College Major and Average GPA
As shown in Figure 19, students from the Social Sciences major (11 students) scored higher than any other majors in the reading exam despite the fact that they do not have the highest average GPA.
The average reading score for the tested Engineering students (59) is higher than the average reading score for the tested Business students (58) despite the fact that the average GPA for the tested Engineering students (3.19) is less than the average GPA for the tested Business students (3.6). The total average score for all tested AUC students (58.9) and the total average GPA for the tested AUC students (3.53).
It is also clear in Figure 19 that both Engineering major students and Communications major have the same average in the reading exam, despite the difference in GPA. However, it is important to note that the number of Communications students taking the exam (6) is quite small in comparison to the number of students participating from the other majors, which could have an effect on the results.
Overall, the results show that for this sample of students GPA is not directly proportional to test scores, i.e. as student GPA increases their test scores do not increase.
(3.19, 59)
15
(3.6, 58)
14 (3.66, 59)
6
11 (3.61, 61)
CAAP REPORT 2015
Page 17 DAIR, 2015
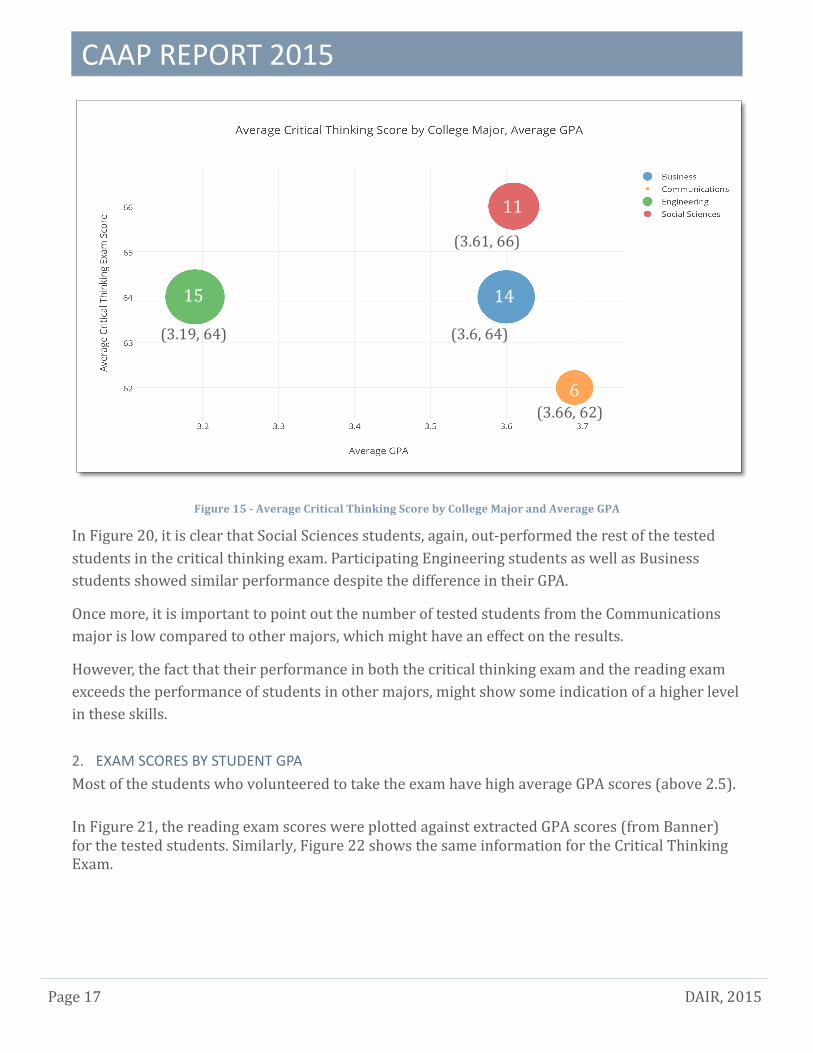
Figure 15 -‐ Average Critical Thinking Score by College Major and Average GPA
In Figure 20, it is clear that Social Sciences students, again, out-‐performed the rest of the tested students in the critical thinking exam. Participating Engineering students as well as Business students showed similar performance despite the difference in their GPA.
Once more, it is important to point out the number of tested students from the Communications major is low compared to other majors, which might have an effect on the results.
However, the fact that their performance in both the critical thinking exam and the reading exam exceeds the performance of students in other majors, might show some indication of a higher level in these skills.
2. EXAM SCORES BY STUDENT GPA Most of the students who volunteered to take the exam have high average GPA scores (above 2.5). In Figure 21, the reading exam scores were plotted against extracted GPA scores (from Banner) for the tested students. Similarly, Figure 22 shows the same information for the Critical Thinking Exam.
15
6
14
11
(3.19, 64)
(3.66, 62)
(3.6, 64)
(3.61, 66)

CAAP REPORT 2015
Page 18 DAIR, 2015
Figure 16 -‐ Reading Exam Scores by Student GPA
Figure 17 -‐ Critical Thinking Exam Scores by Student GPA
Table 9 -‐ Average Exam Scores by GPA
GPA Percentage of Students Reading Average Score Critical Thinking Average Score
Below 2.0 0% -‐ -‐ 2.01-‐2.5 0% -‐ -‐ 2.51-‐3.0 7% Not Reported Not Reported 3.01-‐3.50 37% 58 63 3.51 and above 57% 59 65
0 10 20 30 40 50 60 70 80
0 0.5 1 1.5 2 2.5 3 3.5 4 4.5
Reading Score
GPA
Reading Scores
0 10 20 30 40 50 60 70 80
0 0.5 1 1.5 2 2.5 3 3.5 4 4.5
Critical Thinking Score
GPA
Critical Thinking Scores