Embed Size (px)
Citation preview
8/10/2019 Ca Poly FormulaSAE Engine Development
http://slidepdf.com/reader/full/ca-poly-formulasae-engine-development 1/142
Cal Poly FormulaSAE Engine Development
Sponsor: Cal Poly SLO Formula SAE
SPEED Systems
Matthew Ales - [email protected]
Rafael Mendoza - [email protected]
Mitch Thomas - [email protected]
Leon Vinokurov - [email protected]
Mechanical Engineering
California Polytechnic State University, San Luis Obispo
June 2010
©2010 Matthew Ales, Rafael Mendoza, Mitch Thomas, Leon Vinokurov
8/10/2019 Ca Poly FormulaSAE Engine Development
http://slidepdf.com/reader/full/ca-poly-formulasae-engine-development 2/142
2
Table of ContentsTable of Figures ....................................................................................................................... 5
Table of Tables ........................................................................................................................ 8
Executive Summary ......................................................................................................................... 9
1. Introduction ............................................................................................................................... 11
2. Background ................................................................................................................................ 12
3. Objective .................................................................................................................................... 14
4. Method of Approach ................................................................................................................. 16
5. Management Plan ..................................................................................................................... 19
6. Design ........................................................................................................................................ 20
6.1 Ricardo WAVE Model .......................................................................................................... 20
6.2 Gearing ................................................................................................................................ 26
6.2.1 Optimizing the Current Gear Ratios............................................................................. 26
6.2.2 Using Non-Traditional Gears ........................................................................................ 28
6.2.3 Using Gears from other Yamaha 450 Models .............................................................. 31
6.2.4 Final Drive Ratio ........................................................................................................... 33
6.3 Valve Timing ........................................................................................................................ 34
6.3.1 Tractive Effort Curve Modification .............................................................................. 35
6.3.2 Determining Maximum Valve Lift ................................................................................ 38
6.3.3 Valve Duration and Timing .......................................................................................... 40
6.3.5 Valve Train Dynamics ................................................................................................... 42
6.3.6 Camshaft Options ........................................................................................................ 44
6.4 Intake ................................................................................................................................... 46
6.4.1 Intake Tuning ............................................................................................................... 46
6.4.2 Working around the Restrictor .................................................................................... 51
6.4.3 Bell Mouths .................................................................................................................. 546.5 Exhaust Tuning .................................................................................................................... 56
6.6 Compression Ratio and Combustion Chamber ................................................................... 59
7. Manufacturing ........................................................................................................................... 62
8/10/2019 Ca Poly FormulaSAE Engine Development
http://slidepdf.com/reader/full/ca-poly-formulasae-engine-development 3/142
3
7.1 Intake ................................................................................................................................... 62
7.1.1 Restrictor ..................................................................................................................... 62
7.1.2 Bell Mouths .................................................................................................................. 63
7.1.3 Intake Runner and Plenum .......................................................................................... 64
7.2 Exhaust ................................................................................................................................ 66
7.3 Compression ........................................................................................................................ 67
7.4 Camshafts ............................................................................................................................ 71
7.5 Gearing ................................................................................................................................ 73
8. Testing ....................................................................................................................................... 74
8.1 WAVE Model Verification .................................................................................................... 74
8.1.1 WAVE Model Verification Testing Plan ........................................................................ 74
8.2 FSAE Dyno Testing ............................................................................................................... 76
8.2.1 FSAE Engine Baseline ................................................................................................... 76
8.2.2 Testing Procedure ........................................................................................................ 77
8.2.3 Intake Testing Results .................................................................................................. 78
8.2.4 Exhaust Testing Results ............................................................................................... 80
8.2.5 High Compression Piston Testing Results .................................................................... 82
8.2.6 Camshaft Testing Results ............................................................................................. 84
8.3 Recommended FSAE On-Car Testing ................................................................................... 85
8.3.1 Acceleration Testing Plan ............................................................................................ 85
8.3.2 Autocross Testing Plan ................................................................................................. 86
8.3.3 Other Testing ............................................................................................................... 87
9. Conclusion and Recommendations ........................................................................................... 88
References ..................................................................................................................................... 91
Appendices .................................................................................................................................... 92Appendix A: Decision Matrix, QFD and Management Plan ....................................................... 92
Appendix B: Tractive Effort Curve Calculations ......................................................................... 98
Appendix C: Camshaft Calculations and Measurements ........................................................ 100
8/10/2019 Ca Poly FormulaSAE Engine Development
http://slidepdf.com/reader/full/ca-poly-formulasae-engine-development 4/142
4
C.1 Valve Train Measurements and Dynamics ................................................................... 100
C.2 Valve Lift Calculations ................................................................................................... 101
Appendix D: Intake Diagrams .................................................................................................. 104
Appendix E: Falicon Cam Sprocket Installation Instructions ................................................... 114
Appendix F: Full Testing Results .............................................................................................. 115
F. 1 Individual Intake Test Results: ..................................................................................... 115
F.2 Individual Exhaust Test Results ..................................................................................... 120
F.3 Individual High Compression Piston Test Results ......................................................... 123
Appendix G. Exhaust CAD ........................................................................................................ 125
Appendix H: Ricardo WAVE Tutorial ....................................................................................... 130
8/10/2019 Ca Poly FormulaSAE Engine Development
http://slidepdf.com/reader/full/ca-poly-formulasae-engine-development 5/142
5
Table of Figures
Figure 1: A Formula Car on a Chassis Dynamometer .................................................................... 11Figure 2: All the competitors at a FormulaSAE competition. ........................................................ 12
Figure 3: The WR450 Engine on the Dyno. .................................................................................... 12Figure 4: The Cal Poly FormulaSAE Car.......................................................................................... 14Figure 5: Ricardo WAVE model representation of the engine. ..................................................... 20Figure 6: Power comparison of TU Delft, WAVE Model, and Cal Poly’s baseline. ........................ 22Figure 7: Intake Cam Timing Sweep Keeping Stock Exhaust Timing ............................................. 24Figure 8: Exhaust Cam Timing Sweep Keeping Stock Intake Timing ............................................. 25Figure 9: Baseline Tractive Effort Curve ........................................................................................ 26Figure 10: Tractive Effort Curve for Increased Sprocket ............................................................... 29Figure 11: Tractive Effort of Different Gears ................................................................................. 31Figure 12: Power Curve of Stock WR450 Engine ........................................................................... 35
Figure 13: Stock Tractive Effort ..................................................................................................... 36Figure 14: Flat Torque Curve Tractive Effort ................................................................................. 36Figure 15: Early Torque Peak Tractive Effort Curve....................................................................... 37Figure 16: Rear Torque Peak Tractive Effort Curve. ...................................................................... 37Figure 17: Effects of Mach index (x-axis) on Volumetric Efficiency (y-axis) .................................. 38Figure 18: Falicon Cam Sprocket Set ............................................................................................. 42Figure 19: Valve lift measurements ............................................................................................... 43Figure 20: Typical Race Engine Valve Dynamics. Velocity and Acceleration units in Thousands ofinches ............................................................................................................................................. 44Figure 21: Aftermarket Cams, Hot Cams, Inc. ............................................................................... 45Figure 22: Pressure Wave in Idealized Intake ............................................................................... 47Figure 23: Proposed Design for Variable-Geometry Intake with Continuous Adjustment ........... 49Figure 24: Effects of Plenum on Theoretical Air Flow speed at Restrictor .................................... 53Figure 25: Picture of Test Plenum with Medium body and Short bell mouth .............................. 53Figure 26: Vena Contracta Effect at Pipe Entrance ....................................................................... 54Figure 27: Comparison of Straight End with two Bell Mouth Shapes ........................................... 54Figure 28: CFD Comparison of Different Bell Mouths, Elliptical at bottom. from Blair, et al. ...... 56Figure 29: Example of a Stepped Exhaust Pipe ............................................................................. 58Figure 30: FMF Power Bomb Muffler ............................................................................................ 59Figure 31: Squish effects. From meched.com ............................................................................... 60Figure 32: Quench area. The mixture gets squished where the combustion chamber is level withthe head surface. From members.cox.net .................................................................................... 60Figure 33: Valve Shrouding. Flow around area B is noticeably less than flow around area Abecause area B is shrouded. From gofastnews.com ..................................................................... 61Figure 34: Additional Restrictor diffuser length ............................................................................ 62Figure 35: Machining inlet portion of main restrictor section ...................................................... 62
8/10/2019 Ca Poly FormulaSAE Engine Development
http://slidepdf.com/reader/full/ca-poly-formulasae-engine-development 6/142
6
Figure 36: Body of bell mouth inner and outer profile ................................................................. 63Figure 37: Completed Bell Mouth ................................................................................................. 64Figure 38: Short Bell Mouth .......................................................................................................... 64Figure 39: Plenum end caps on laser cutter .................................................................................. 64Figure 42: Fully assembled and operational SPEED intake ........................................................... 65
Figure 40: Injector Mount ............................................................................................................. 65Figure 41: Bell Mouths welded to runners .................................................................................... 65Figure 43: Stepped exhaust pipe ................................................................................................... 66Figure 44: Exhaust tuned for 5000 RPM ........................................................................................ 66Figure 45: All exhaust components ............................................................................................... 67Figure 46: JE High Compression Piston ......................................................................................... 67Figure 47: Valve cover removed, Camshafts Visible ..................................................................... 68Figure 48: Piston and Cylinder ....................................................................................................... 68Figure 49: Head of engine showing valves and top of combustion chamber ............................... 68Figure 50: Stock Piston. Scored with all ring gaps aligned ........................................................... 69Figure 51: New Piston on scale...................................................................................................... 70Figure 52: New Piston installed on Connecting Rod ..................................................................... 70Figure 53: Piston in Cylinder .......................................................................................................... 71Figure 54: New Hot Cams camshafts ............................................................................................. 72Figure 55: Falicon replacement Cam Sprockets ............................................................................ 72Figure 56: Hot Cams camshafts with Falicon adjustable sprockets .............................................. 72Figure 57: Potential Sprocket ........................................................................................................ 73Figure 58: Baseline Engine Torque and Power Curves .................................................................. 77Figure 59: Long Bell Mouth in Plenum .......................................................................................... 78Figure 60: Short Bell Mouth in Plenum ......................................................................................... 78Figure 61: Engine Power for 7 Different Intake Configurations .................................................... 79Figure 62: Engine Torque for 7 Different Intake Configurations ................................................... 79Figure 63: Engine Power for 3 Different Exhaust Configurations, using best Intake Configuration ....................................................................................................................................................... 81Figure 64: Engine Torque for 3 Different Exhaust Configurations, using Best Intake Configuration ....................................................................................................................................................... 81Figure 65: Engine Power using High Compression Piston ............................................................. 83Figure 66: Engine Torque using High Compression Piston ............................................................ 84Figure 67: QFD House of Quality ................................................................................................... 93Figure 68: Current design of restrictor. Venturi nozzle shape leaves little room for improvement. ..................................................................................................................................................... 104 Figure 69: Tilting Bell Mouth Design, High Speed (short) Configuration .................................... 105Figure 70: Tilting Bell Mouth Design, Low Speed (long) Configuration ....................................... 106Figure 71: Design for Test Plenum with Selectable Bell Mouths ................................................ 106Figure 72: Design for One Piece Plenum with Integrated Selectable Bell Mouths ..................... 107Figure 73: Drawing of Long Bell Mouth ....................................................................................... 108
8/10/2019 Ca Poly FormulaSAE Engine Development
http://slidepdf.com/reader/full/ca-poly-formulasae-engine-development 7/142
8/10/2019 Ca Poly FormulaSAE Engine Development
http://slidepdf.com/reader/full/ca-poly-formulasae-engine-development 8/142
8
Table of TablesTable 1: List of Engineering Requirements for the FormulaSAE Engine Development Project .... 15Table 2: Percent Gain in Power and Torque with Varying Compression Ratio ............................. 24Table 3 : Table of Transmission Ratios .......................................................................................... 28Table 4: Time to Speed for Different Sprocket Ratios ................................................................... 30Table 5: Table of Transmission Ratios for YFZ450 Quad ............................................................... 32Table 6: Time to Speed for WR and YFZ Gears .............................................................................. 32Table 7: Time to Speed for Different Final Drive Ratios ................................................................ 33Table 8: Comparison of 3 Best Gearing Options ........................................................................... 34Table 9: Valve Lift Needed for Different Engine Speeds ............................................................... 40Table 10: Recommended Parameters for a High-Performance Cam, from Ferguson & Kirkpatrick ....................................................................................................................................................... 41Table 11: Current Cam Specifications ........................................................................................... 45Table 12: Hot Cams, Inc. Cam Specifications ................................................................................. 45Table 13: Intake Tracts for the Engine at Different Speeds, Speeds of Interest Highlighted ........ 48Table 14 : Restrictor Choked Flow Calculations ............................................................................ 52Table 15: Exhaust Tract Lengths for the Single-Cylinder Engine at Various Speeds ..................... 58Table 16: Decision Matrix .............................................................................................................. 92Table 17: Stock Cam Profile Measurements ............................................................................... 100Table 18: Example Combustion Model, notice the multipliers ................................................... 137
8/10/2019 Ca Poly FormulaSAE Engine Development
http://slidepdf.com/reader/full/ca-poly-formulasae-engine-development 9/142
8/10/2019 Ca Poly FormulaSAE Engine Development
http://slidepdf.com/reader/full/ca-poly-formulasae-engine-development 10/142
10
at lower engine speeds, the effects of the restrictor are minimized when compared to higher
engine speeds.
The engine intake directly affects the ability of the engine to intake air. More air in the cylinder
means more fuel burned and more power, so devising a way to maximize the amount of air inthe cylinder is an excellent way to increase engine power. As the engine is essentially sucking air
in from the atmosphere, nearly anything that reduced head loss in the intake tract was
beneficial. Wave dynamics were equally, if not more, important in intake design. By careful
analysis of pressure wave dynamics, the intake tract was optimized for increased power at a
chosen engine speed.
As with the intake system, the exhaust system focused on reducing pumping losses and
harnessing wave dynamics to increase engine performance at a specific engine speed.
All of these efforts together give the FormulaSAE team the performance it needs to perform
well at the FormulaSAE competition in Detroit. As a result of our efforts, the engine makes 42
horsepower at peak, which is a 13.5% increase. The engine’s peak torque is now 27.5 lb-ft,
which is a 14.5% increase. The engine also has a 10% increase in power, as well as a 12.5%
increase in torque across the powerband, as we shifted the powerband to a lower engine speed.
8/10/2019 Ca Poly FormulaSAE Engine Development
http://slidepdf.com/reader/full/ca-poly-formulasae-engine-development 11/142
11
1. Introduction
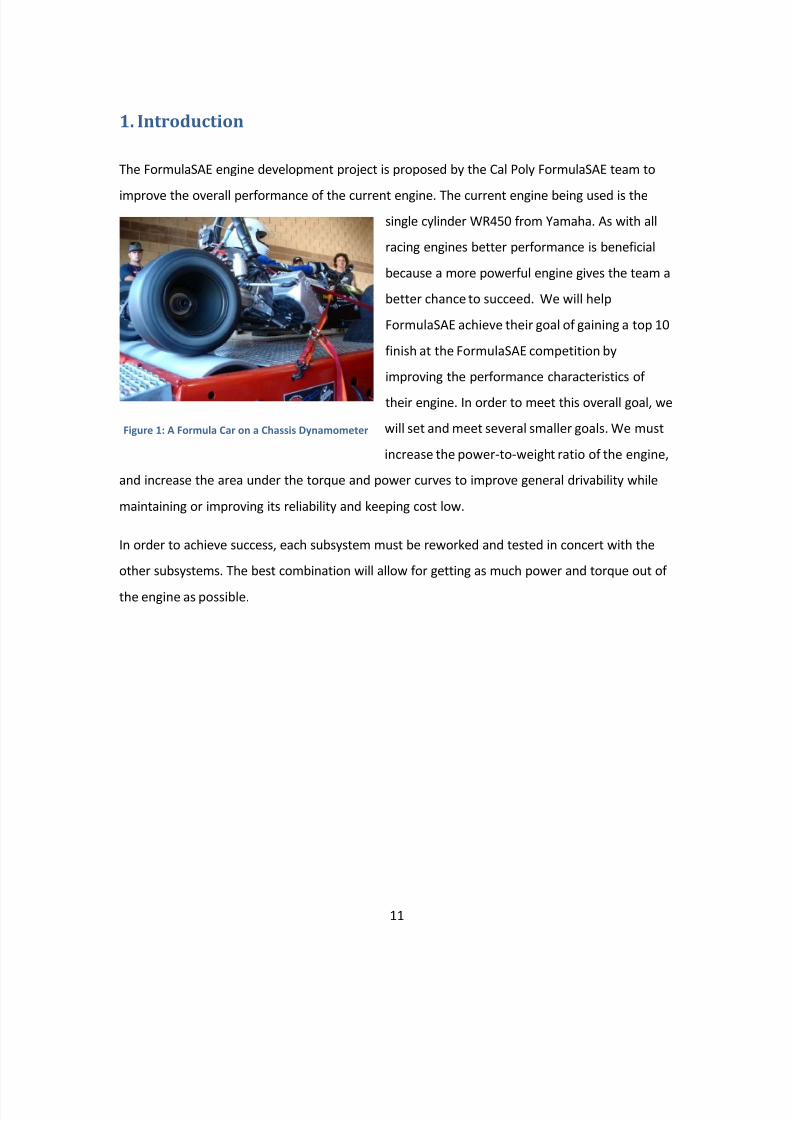
The FormulaSAE engine development project is proposed by the Cal Poly FormulaSAE team to
improve the overall performance of the current engine. The current engine being used is thesingle cylinder WR450 from Yamaha. As with all
racing engines better performance is beneficial
because a more powerful engine gives the team a
better chance to succeed. We will help
FormulaSAE achieve their goal of gaining a top 10
finish at the FormulaSAE competition by
improving the performance characteristics of
their engine. In order to meet this overall goal, we
will set and meet several smaller goals. We must
increase the power-to-weight ratio of the engine,
and increase the area under the torque and power curves to improve general drivability while
maintaining or improving its reliability and keeping cost low.
In order to achieve success, each subsystem must be reworked and tested in concert with the
other subsystems. The best combination will allow for getting as much power and torque out of
the engine as possible.
Figure 1: A Formula Car on a Chassis Dynamometer
8/10/2019 Ca Poly FormulaSAE Engine Development
http://slidepdf.com/reader/full/ca-poly-formulasae-engine-development 12/142
12
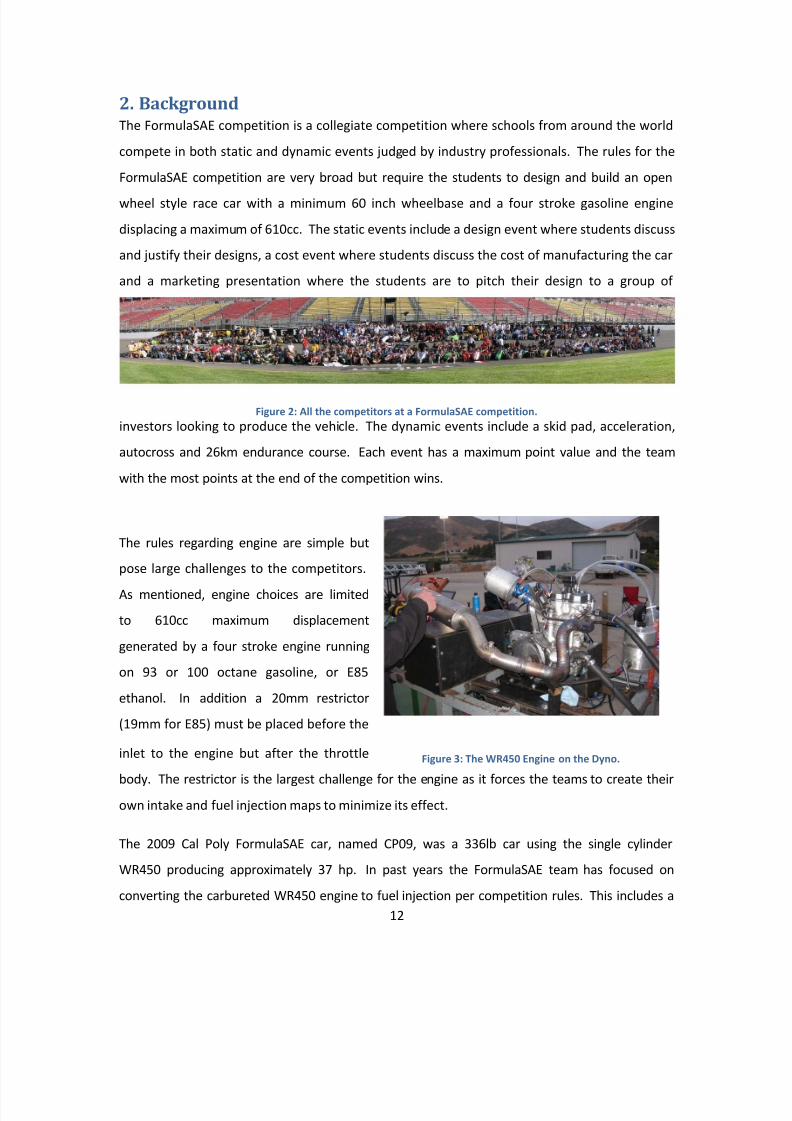
2. BackgroundThe FormulaSAE competition is a collegiate competition where schools from around the world
compete in both static and dynamic events judged by industry professionals. The rules for the
FormulaSAE competition are very broad but require the students to design and build an open
wheel style race car with a minimum 60 inch wheelbase and a four stroke gasoline engine
displacing a maximum of 610cc. The static events include a design event where students discuss
and justify their designs, a cost event where students discuss the cost of manufacturing the car
and a marketing presentation where the students are to pitch their design to a group of
investors looking to produce the vehicle. The dynamic events include a skid pad, acceleration,
autocross and 26km endurance course. Each event has a maximum point value and the team
with the most points at the end of the competition wins.
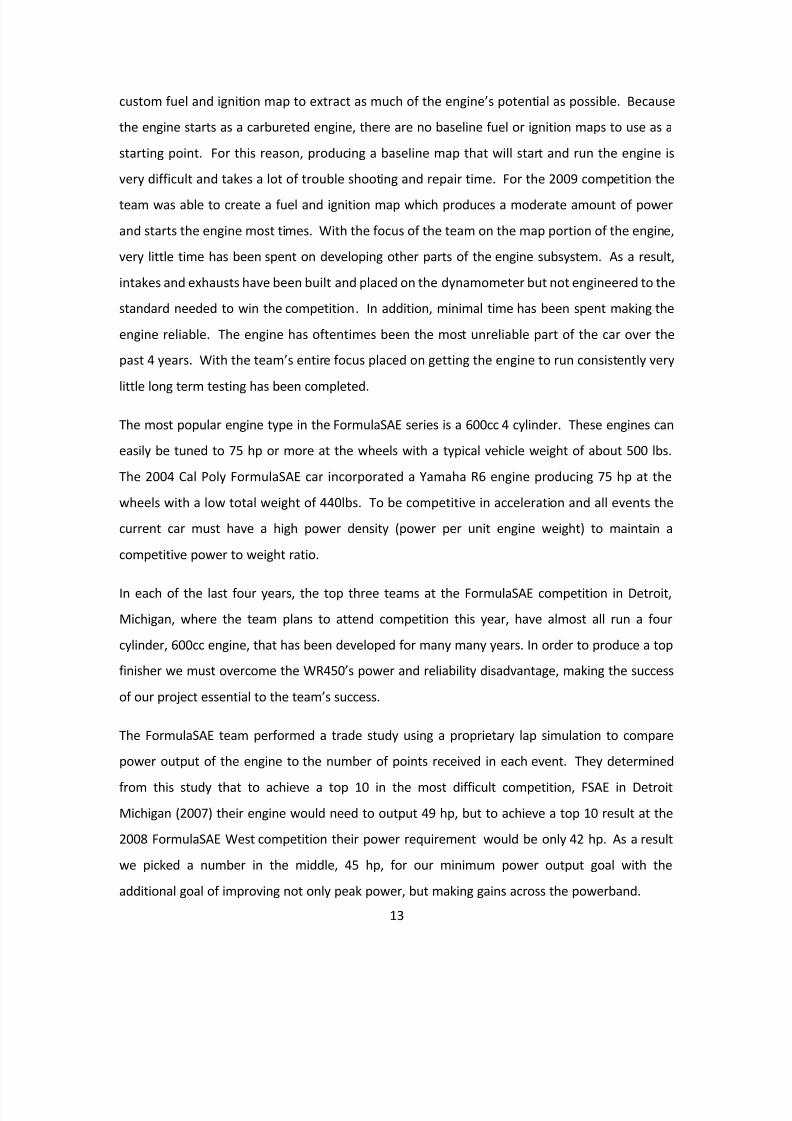
The rules regarding engine are simple but
pose large challenges to the competitors.
As mentioned, engine choices are limited
to 610cc maximum displacement
generated by a four stroke engine running
on 93 or 100 octane gasoline, or E85
ethanol. In addition a 20mm restrictor
(19mm for E85) must be placed before the
inlet to the engine but after the throttle
body. The restrictor is the largest challenge for the engine as it forces the teams to create theirown intake and fuel injection maps to minimize its effect.
The 2009 Cal Poly FormulaSAE car, named CP09, was a 336lb car using the single cylinder
WR450 producing approximately 37 hp. In past years the FormulaSAE team has focused on
converting the carbureted WR450 engine to fuel injection per competition rules. This includes a
Figure 2: All the competitors at a FormulaSAE competition.
Figure 3: The WR450 Engine on the Dyno.
8/10/2019 Ca Poly FormulaSAE Engine Development
http://slidepdf.com/reader/full/ca-poly-formulasae-engine-development 13/142
13
custom fuel and ignition map to extract as much of the engine’s potential as possible. Because
the engine starts as a carbureted engine, there are no baseline fuel or ignition maps to use as a
starting point. For this reason, producing a baseline map that will start and run the engine is
very difficult and takes a lot of trouble shooting and repair time. For the 2009 competition the
team was able to create a fuel and ignition map which produces a moderate amount of power
and starts the engine most times. With the focus of the team on the map portion of the engine,
very little time has been spent on developing other parts of the engine subsystem. As a result,
intakes and exhausts have been built and placed on the dynamometer but not engineered to the
standard needed to win the competition. In addition, minimal time has been spent making the
engine reliable. The engine has oftentimes been the most unreliable part of the car over the
past 4 years. With the team’s entire focus placed on getting the engine to run consistently very
little long term testing has been completed.
The most popular engine type in the FormulaSAE series is a 600cc 4 cylinder. These engines can
easily be tuned to 75 hp or more at the wheels with a typical vehicle weight of about 500 lbs.
The 2004 Cal Poly FormulaSAE car incorporated a Yamaha R6 engine producing 75 hp at the
wheels with a low total weight of 440lbs. To be competitive in acceleration and all events the
current car must have a high power density (power per unit engine weight) to maintain a
competitive power to weight ratio.
In each of the last four years, the top three teams at the FormulaSAE competition in Detroit,
Michigan, where the team plans to attend competition this year, have almost all run a four
cylinder, 600cc engine, that has been developed for many many years. In order to produce a top
finisher we must overcome the WR450’s power and reliability disadvantage, making the success
of our project essential to the team’s success.
The FormulaSAE team performed a trade study using a proprietary lap simulation to compare
power output of the engine to the number of points received in each event. They determined
from this study that to achieve a top 10 in the most difficult competition, FSAE in DetroitMichigan (2007) their engine would need to output 49 hp, but to achieve a top 10 result at the
2008 FormulaSAE West competition their power requirement would be only 42 hp. As a result
we picked a number in the middle, 45 hp, for our minimum power output goal with the
additional goal of improving not only peak power, but making gains across the powerband.
8/10/2019 Ca Poly FormulaSAE Engine Development
http://slidepdf.com/reader/full/ca-poly-formulasae-engine-development 14/142
14
3. Objective
Our engineering target was 45 horsepower peak, without excessive weight gain. As weight gain
might have been unavoidable, we considered it acceptable so long as the power to weight ratioof the car as a whole increased. Our other objectives were a power increase throughout the
entire powerband and no decrease in engine reliability and maintainability.
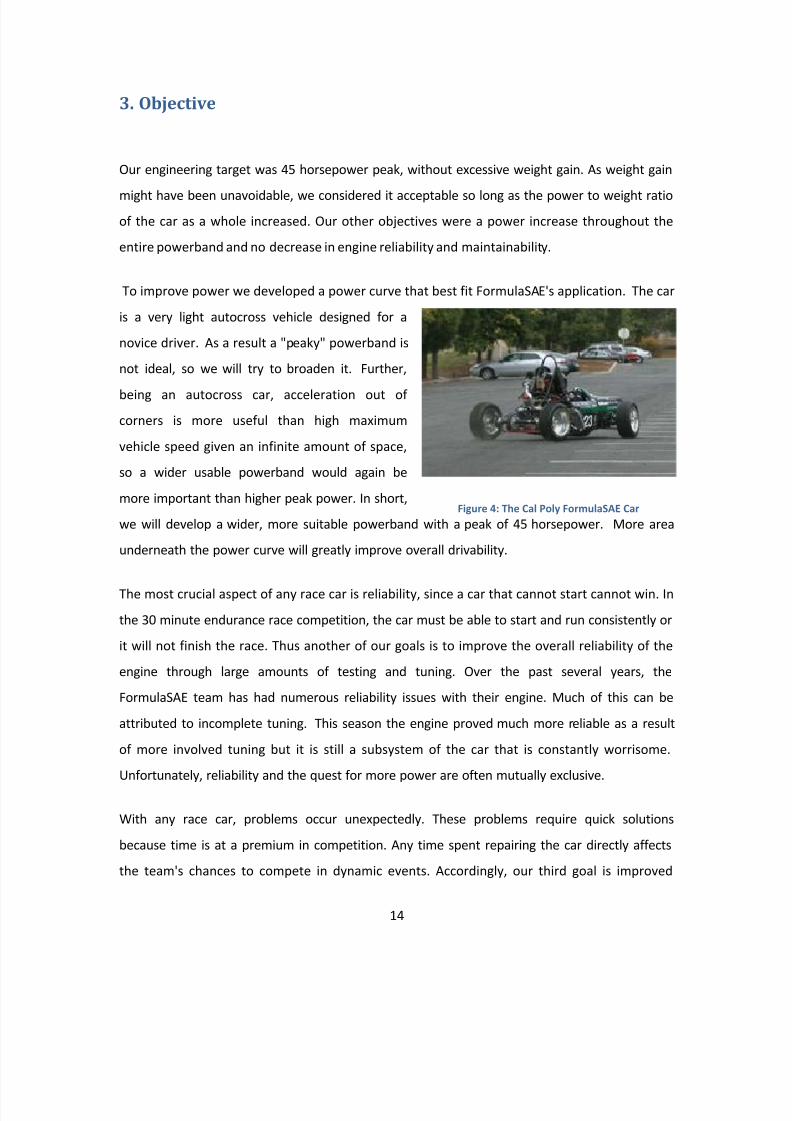
To improve power we developed a power curve that best fit FormulaSAE's application. The car
is a very light autocross vehicle designed for a
novice driver. As a result a "peaky" powerband is
not ideal, so we will try to broaden it. Further,
being an autocross car, acceleration out of
corners is more useful than high maximum
vehicle speed given an infinite amount of space,
so a wider usable powerband would again be
more important than higher peak power. In short,
we will develop a wider, more suitable powerband with a peak of 45 horsepower. More area
underneath the power curve will greatly improve overall drivability.
The most crucial aspect of any race car is reliability, since a car that cannot start cannot win. In
the 30 minute endurance race competition, the car must be able to start and run consistently or
it will not finish the race. Thus another of our goals is to improve the overall reliability of the
engine through large amounts of testing and tuning. Over the past several years, the
FormulaSAE team has had numerous reliability issues with their engine. Much of this can be
attributed to incomplete tuning. This season the engine proved much more reliable as a result
of more involved tuning but it is still a subsystem of the car that is constantly worrisome.
Unfortunately, reliability and the quest for more power are often mutually exclusive.
With any race car, problems occur unexpectedly. These problems require quick solutions
because time is at a premium in competition. Any time spent repairing the car directly affects
the team's chances to compete in dynamic events. Accordingly, our third goal is improved
Figure 4: The Cal Poly FormulaSAE Car
8/10/2019 Ca Poly FormulaSAE Engine Development
http://slidepdf.com/reader/full/ca-poly-formulasae-engine-development 15/142
15
maintainability. Whatever time the team can save in the pits through a more easily maintainable
engine is more time on the track accruing points toward the overall standings.
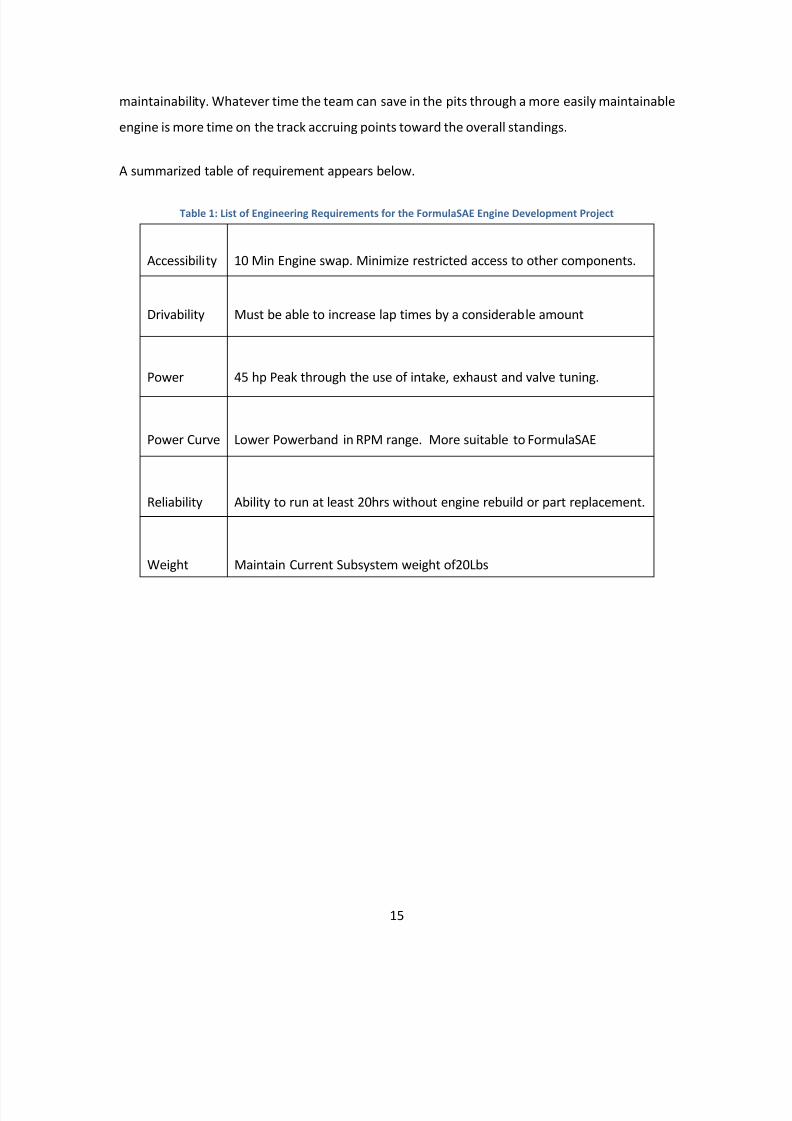
A summarized table of requirement appears below.
Table 1: List of Engineering Requirements for the FormulaSAE Engine Development Project
Accessibility 10 Min Engine swap. Minimize restricted access to other components.
Drivability Must be able to increase lap times by a considerable amount
Power 45 hp Peak through the use of intake, exhaust and valve tuning.
Power Curve Lower Powerband in RPM range. More suitable to FormulaSAE
Reliability Ability to run at least 20hrs without engine rebuild or part replacement.
Weight Maintain Current Subsystem weight of20Lbs
8/10/2019 Ca Poly FormulaSAE Engine Development
http://slidepdf.com/reader/full/ca-poly-formulasae-engine-development 16/142
16
4. Method of Approach
To meet the desired goals we had a brainstorming session to get all possible ideas down on
paper. Once enough ideas were generated, we sat down with the FormulaSAE Team lead, JoshRoepke, and current FormulaSAE engine lead, Cody Scott, to create a decision matrix (Table 16) .
The decision matrix contained all the possible options for modifying the engine. We then added
all the requirements that our team needed to meet. The requirements were reliability, power
increase, low weight, low cost, and feasibility to complete. We then weighted these 5 criteria 1-
5 with 5 being the most important to the design. Once all the requirements were weighted we
then ranked each component on how well it met each requirement, again on a 5-point scale,.
We then multiplied by the weights and summed up the total (see Figure 67) . The four with the
highest point value were to: design new intake and exhaust tracts, modify the engine for higher
compression and develop a new valve lift profile.
We began by performing extensive research to familiarize ourselves with the design of the
current engine and its components. After establishing a baseline of how well the current
components work, we began designing our own systems that will optimize engine performance
toward our goals.
The first step of evaluating these designs was creating a Ricardo WAVE model. The effectiveness
of different intake, exhaust and cam designs will be modeled. To build an accurate model we
will need to spend time measuring various aspects of the engine, such as tract lengths and
diameters. In addition to finding out what works best, this process will also show how the
engine reacts to the various components.
We will then determine several plausible designs for each subcomponent then test each to
determine the best one. We plan to use a dynamometer (dyno) for testing to determine which
combinations of designs is the best. Our goal is to achieve 45 hp and 40lb-ft of torque as
measured on the dyno. Also, dyno testing will be needed to re-tune the ignition and fuel maps
with the new components before they are installed on the car for competition. Once dyno
8/10/2019 Ca Poly FormulaSAE Engine Development
http://slidepdf.com/reader/full/ca-poly-formulasae-engine-development 17/142
17
tuning is complete, the engine will be installed on the car and tested. On car testing is necessary
to see how the components respond to transient conditions that will be seen in real driving but
are difficult to simulate on the dyno. (Appendix A: Decision Matrix, QFD and Management Plan)
To achieve the desired horsepower and torque gain we designed an intake, exhaust, camshaftand combustion chamber specifically made for this car to minimize the effect of the 20mm
restrictor. All of the parts interact with one another and are all interdependent in terms of
performance gains. The gains from the individual parts cannot be superimposed onto one
another and will require individual as well as collective testing to determine total system gains.
We used resonance tuning on the intake and exhaust to improve performance by using pressure
waves in these systems to force more air into the cylinder and then suck it out more efficiently.
Intake and exhaust tuning are similar in harnessing pressure waves originating from the valves,
but may not work to their full potentials if both are designed for the same engine speed. Thus
our exhaust and intake tracts will be set up to complement one another and spread their gains
over a larger operating range. We chose to tune the intake for around eight thousand rpm and
the exhaust for about five thousand rpm in order to widen the torque curve in the operating
range of the engine.
Cam profile and valve timing are crucial for getting the best results from the engine. We bought
adjustable sprockets, which were essential for testing valve timing. From dyno data it can be
determined that the stock camshaft from Yamaha is designed well for a high-revving dirt bike as
the engine makes over 40 hp between 7-12k rpm. This design does not translate well to the
FormulaSAE competition, since the restrictor required by FormulaSAE rules limits airflow, and
thus lowers the maximum useful speed of the engine. We also designed the power and torque
curves with a custom camshaft profile. We purchased a set of Hot Cams aftermarket camshafts
which matched our design requirements for lift and duration. This was much more cost and
time effective since making camshafts is a very specialized process.
The final way we plan to improve horsepower and torque is to increase the compression ratio of
the engine. This can be achieved because of the relatively lower volumetric efficiency caused by
the restrictor in addition to running on 100 octane gasoline. The chosen piston raises
8/10/2019 Ca Poly FormulaSAE Engine Development
http://slidepdf.com/reader/full/ca-poly-formulasae-engine-development 18/142
18
compression from 12.3:1 to 13.5:1 and it was chosen over a 14:1 piston for reliability purposes.
We did not want this engine to require frequent rebuilds, and the lower of the two “high”
compression ratios gave a larger safety margin when tuning and running the engine.
The metric for determining the success of the final design include peak torque and power, 75meter acceleration time and points scored in each event, as well as others. Once we completed
our QFD analysis of all these components we found that our 75m acceleration time would be
the most effective method for measuring success of our design. This made sense because
acceleration is directly affected by the power to weight ratio of the vehicle. If power increased
while maintaining the same or less weight, then the car would be able to get to speed faster
thus gaining the team points.
8/10/2019 Ca Poly FormulaSAE Engine Development
http://slidepdf.com/reader/full/ca-poly-formulasae-engine-development 19/142
19
5. Management Plan
FormulaSAE engine development was a large project that involves the development of several
different subcomponents. The plan of attack for our project was to split up each subcomponentand work on them individually and as a group to develop the optimal designs. By working on
them individually, each subcomponent had one person focused solely on that component. As a
result, that one person focused their attention on making their component as well-engineered
as it could be. At the same time, we as a group constantly reviewed all the components to
ensure that they worked together to best meet FormulaSAE's goals.
The bulk of this project involved dyno testing. There are many inherent problems with dyno
testing and tuning. As a result both SPEED Systems and the FormulaSAE team wanted to have as
much testing time as possible. Because the dyno needed to be run by a FormulaSAE team
member, dyno time was an extremely limited resource. To combat this we planned to have all
our components ready to go on the dyno by the first week of spring quarter. There were many
fitment issues and because the engine, like all single-cylinder engines, is essentially a shake
table, the weakest link in the system broke on a regular basis. In an ideal world testing could
have been completed in approximately 3 weeks working multiple days a week, but because of
the tendency for engine components to break we planned for triple that amount of time.
Manufacturing time for this project was fairly short. Because the two most manufacturing
intensive components must be ordered from outside vendors, the manufacturing time was a
mere 6 weeks. To be completely ready to test in the third quarter it was critical that all our
components were ready to go by spring break. This short manufacturing time allowed us an
extra 4 weeks during winter quarter to perfect our designs.
The items that had large potential to delay us were the third quarter testing plans and the
ordered parts. The ordered parts could have had long lead times. By finishing the component
design early we ordered our parts sooner so as not to delay testing if they were not available.
From April to June there was a lot of dyno testing completed, consisting of switching
components on the engine on a weekly basis. In order to complete all our testing on time we
had to work hard and stay on schedule.
8/10/2019 Ca Poly FormulaSAE Engine Development
http://slidepdf.com/reader/full/ca-poly-formulasae-engine-development 20/142
20
6. Design
The Cal Poly FormulaSAE engine development project is broken up into five main sections.
Gearing, Camshaft, Intake, Exhaust and Combustion Chamber design. Each one of these areascan be addressed individually though they interact heavily with each other.
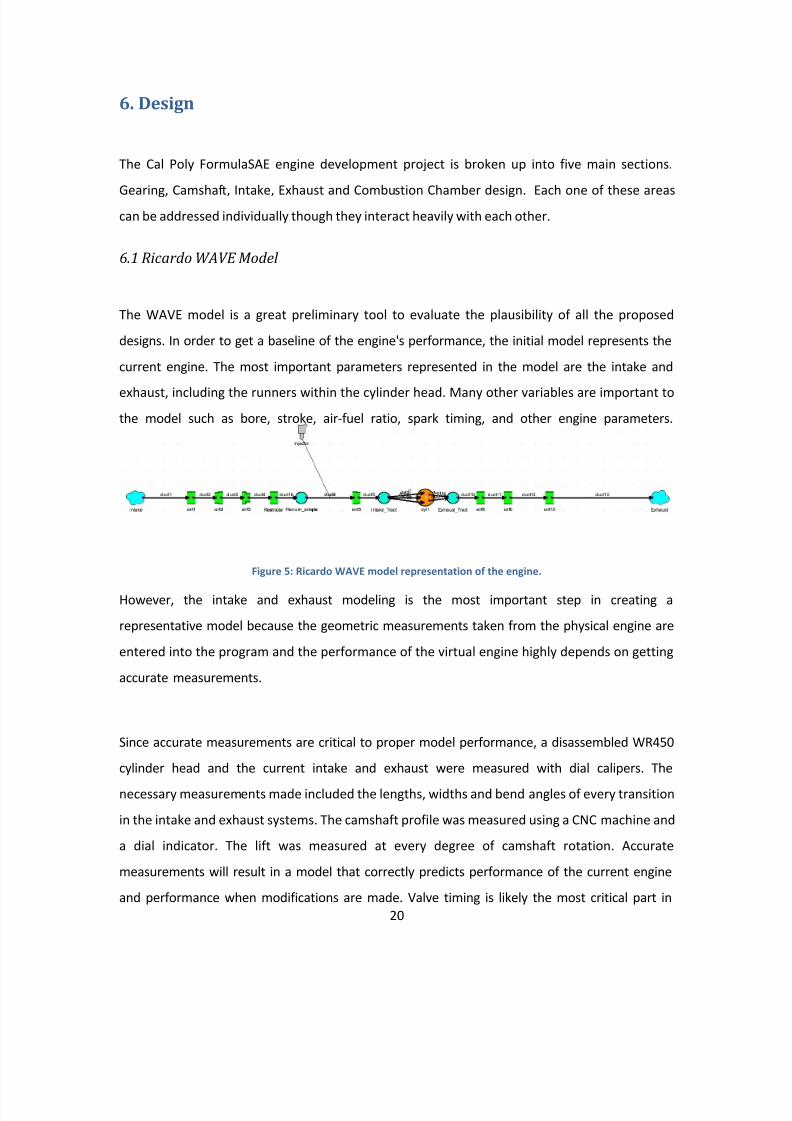
6.1 Ricardo WAVE Model
The WAVE model is a great preliminary tool to evaluate the plausibility of all the proposed
designs. In order to get a baseline of the engine's performance, the initial model represents the
current engine. The most important parameters represented in the model are the intake and
exhaust, including the runners within the cylinder head. Many other variables are important tothe model such as bore, stroke, air-fuel ratio, spark timing, and other engine parameters.
Figure 5: Ricardo WAVE model representation of the engine.
However, the intake and exhaust modeling is the most important step in creating a
representative model because the geometric measurements taken from the physical engine are
entered into the program and the performance of the virtual engine highly depends on getting
accurate measurements.
Since accurate measurements are critical to proper model performance, a disassembled WR450
cylinder head and the current intake and exhaust were measured with dial calipers. The
necessary measurements made included the lengths, widths and bend angles of every transition
in the intake and exhaust systems. The camshaft profile was measured using a CNC machine and
a dial indicator. The lift was measured at every degree of camshaft rotation. Accurate
measurements will result in a model that correctly predicts performance of the current engine
and performance when modifications are made. Valve timing is likely the most critical part in
8/10/2019 Ca Poly FormulaSAE Engine Development
http://slidepdf.com/reader/full/ca-poly-formulasae-engine-development 21/142
21
order to have a representative model in WAVE and it’s likely the toughest one to get
measurements of. The measurements of the stock cams give a very long duration of 320
degrees at zero lift, and maximum lift of around 0.345 inches. Using these measurements in the
model results in low readings, thus the duration was decreased when implemented in order to
account for measurement error and the assumed flow coefficient modeling in WAVE. The
decrease in duration only affected low lift duration, as duration at 0.050 inches of lift was kept
as measured. The simulation was affected by the long duration measured at very low lifts
(below 0.050 inches) because the flow coefficients used by WAVE assume that the valves flow
better than in reality. The assumed flow coefficients used in WAVE attempt to predict flow past
the valves, but they cannot exactly model this. Therefore, the duration at low lifts was assumed
to be smaller than measured and was decreased to less than 300 degrees, with duration at
0.050 inches staying at about 245 crankshaft degrees in order to account for inaccuracies inmeasurements and the assumed flow coefficients in WAVE.
Fuel delivery is accurately modeled in the program as a “pulse-width injector.” The actual table
used in the MoTec control unit on the car was used to input the fueling curve into the software.
The wide-open throttle pulse width was used in the model since the throttle is not modeled,
thus it represents a full-throttle dynamometer test. A spark timing model is also not included
but is unnecessary because Ricardo WAVE uses a “50% burn point” which is the location in crank
degrees where the mixture is half-burned. Since the burn point stays fairly constant, due to
changing the spark timing, over the engine’s speed range a variable burn point is not needed to
achieve an accurate model.
After all the necessary parameters are incorporated into the virtual engine it will enable tuning
of the system within the simulation, reducing the need for testing of the physical engine. A
change in the model will show how performance changes with a modification and those trends
should accurately predict how the actual engine will react. As long as the measurements are
correct, the simulation will predict the performance of the physical engine very accurately.
Once the model can accurately predict how geometric changes affect engine performance it can
8/10/2019 Ca Poly FormulaSAE Engine Development
http://slidepdf.com/reader/full/ca-poly-formulasae-engine-development 22/142
22
be used as a powerful tool in deciding on the most worthwhile modifications. It is also a great
tool for optimizing a certain design by showing how performance changes by varying a certain
property of an intake or exhaust tract, such as length or diameter. The WAVE model enables a
theoretical design to be simulated before anything has to be fabricated, fitted and tested on a
dynamometer.
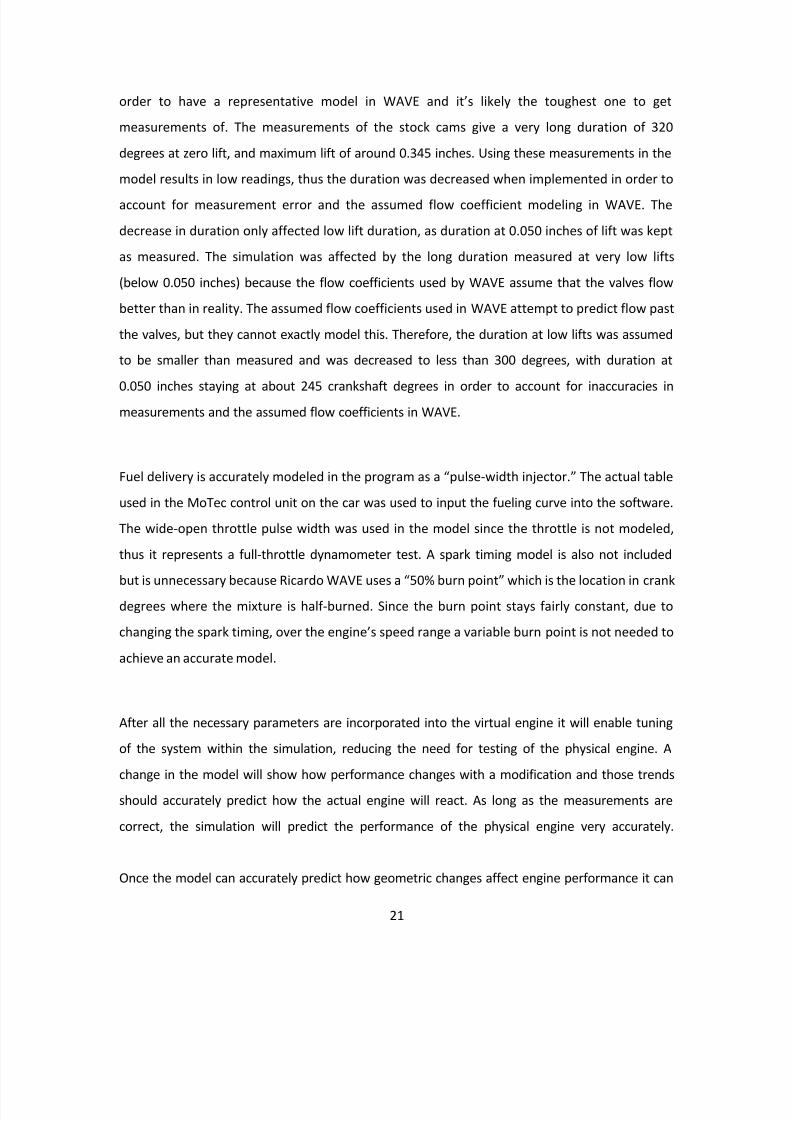
One fact that must be noted is that WAVE predicts power at the flywheel, and the dyno
measures power at the brake. There are power losses between the flywheel and the brake that
must be accounted for. WAVE features a calculation of drive train losses but not necessarily for
this project’s specific application. Therefore, WAVE results should be assumed to be slightly high
when compared to dyno readings.
Figure 6: Power comparison of TU Delft, WAVE Model, and Cal Poly’s baseline.
In order to validate the accuracy of the model, the stock engine was tested on the dyno. A valid
model will properly predict the results of changes made to engine parameters. The real engine’s
valve timing is a parameter that can be altered with an adjustable camshaft sprocket. A change
0
10
20
30
40
50
60
4000 5000 6000 7000 8000 9000 10000
H o r s e P o w e r
RPM
Delft Power
WAVE Model
Dyno Baseline
8/10/2019 Ca Poly FormulaSAE Engine Development
http://slidepdf.com/reader/full/ca-poly-formulasae-engine-development 23/142
23
in valve timing can also be quickly achieved in the software. Figure 6 shows a comparison
between the current engine, WAVE model and the results of a dyno test performed by Delft
Technical University of the Netherlands of the same engine model. The WAVE model shows
slightly higher power production but this can be accounted for by the losses induced during the
power transmission between the flywheel and the water brake on the real dyno. Otherwise, the
trends shown in Ricardo are similar to what the dyno produces as well as TU Delft, albeit Delft
has clearly put a good amount of development into their engine. With some more development
of the WAVE model, including up to date geometry changes of the intake and exhaust will make
for an even more accurate and representative model.
The software revealed that the peaks are due to intake and exhaust geometry. As the exhaustlengths are changed the results from the model show that the power and torque curves are
dramatically altered when a short, medium or long piping of the same diameter is used. The
short exhaust pipe examined is 20 inches, medium is 30 inches, and the long pipe is 50 inches to
show the extremes of the three situations. The short pipe peaked at high speeds and had a
higher peak power, but the peak was past the rev-limit of the engine. The medium-length pipe
has a high peak at 8000 rpm but there is a loss of power at 5000 rpm because the characteristics
of that geometry give resonance peaks before and after that point. The long pipe peaked at
8000 rpm and had a smooth increase in power with no local peaks but power dropped off after
8000 rpm much more than the other setups. The optimal setup will smooth out the power and
torque curves at lower engine revolutions while maintaining or increasing peak power. Thus, the
area under the curve increases and improves overall performance and drivability.
8/10/2019 Ca Poly FormulaSAE Engine Development
http://slidepdf.com/reader/full/ca-poly-formulasae-engine-development 24/142
24
Table 2: Percent Gain in Power and Torque with Varying Compression Ratio
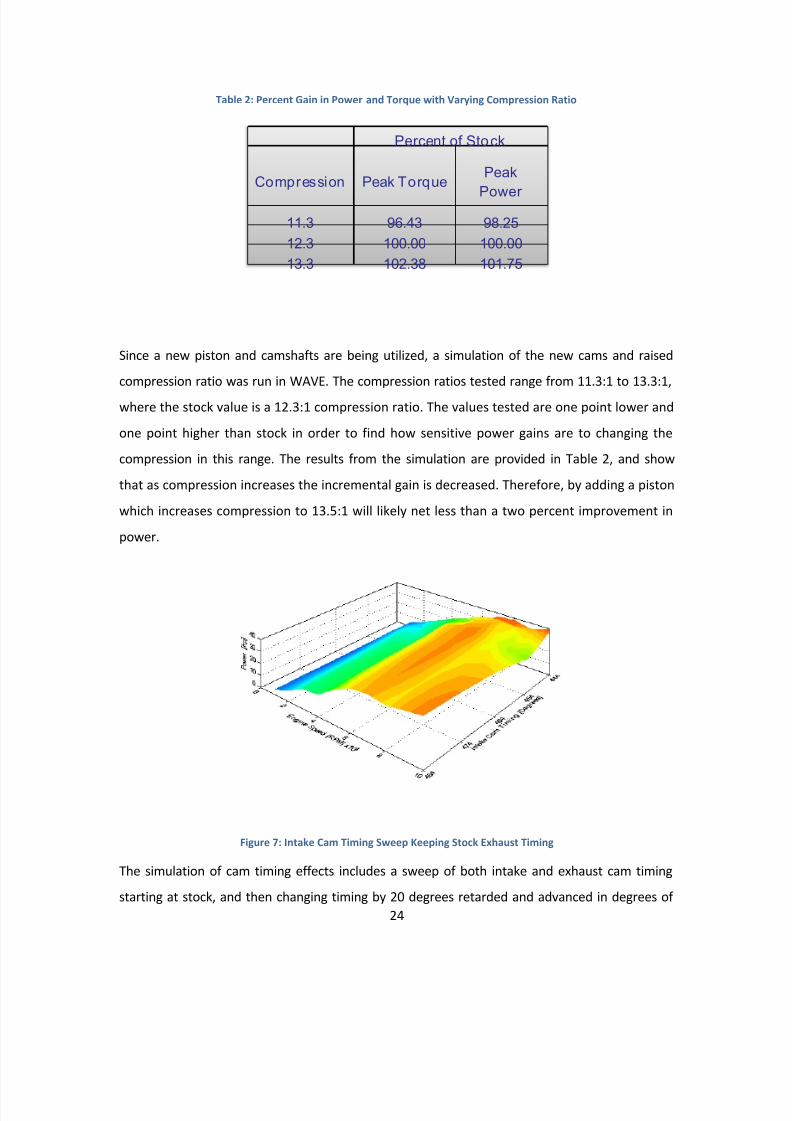
Since a new piston and camshafts are being utilized, a simulation of the new cams and raised
compression ratio was run in WAVE. The compression ratios tested range from 11.3:1 to 13.3:1,
where the stock value is a 12.3:1 compression ratio. The values tested are one point lower and
one point higher than stock in order to find how sensitive power gains are to changing the
compression in this range. The results from the simulation are provided in Table 2, and show
that as compression increases the incremental gain is decreased. Therefore, by adding a piston
which increases compression to 13.5:1 will likely net less than a two percent improvement in
power.
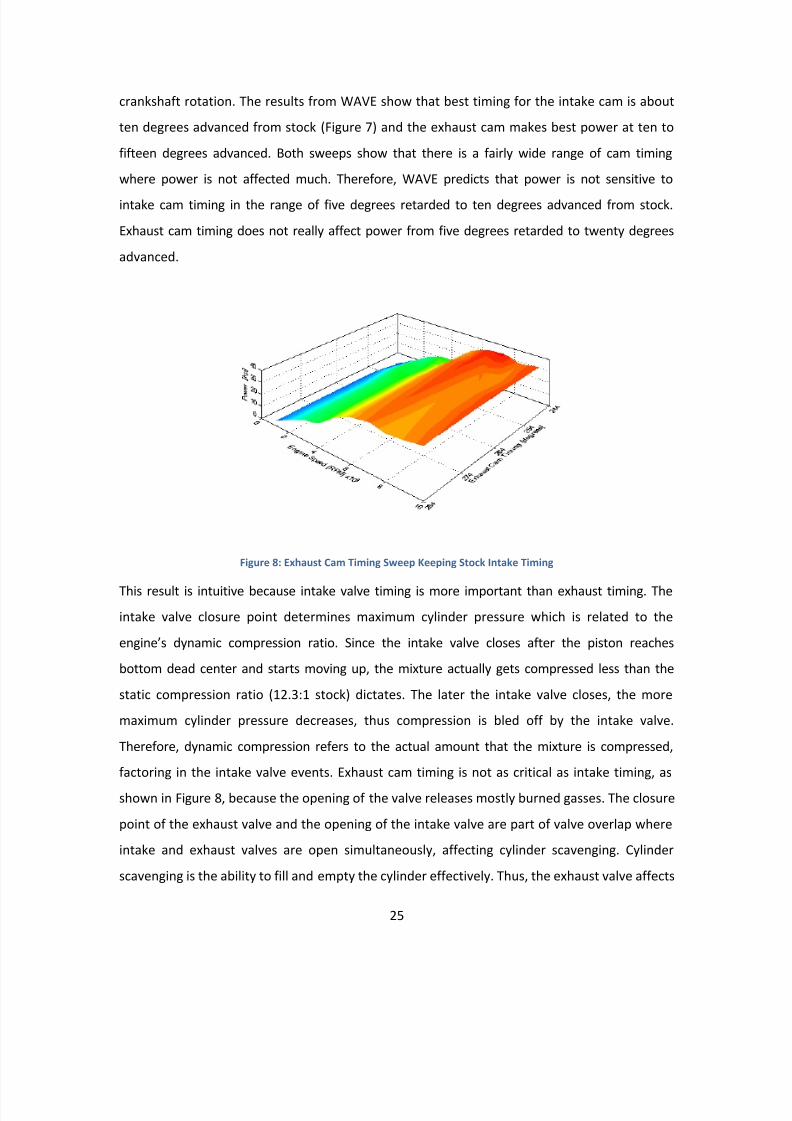
Figure 7: Intake Cam Timing Sweep Keeping Stock Exhaust Timing
The simulation of cam timing effects includes a sweep of both intake and exhaust cam timing
starting at stock, and then changing timing by 20 degrees retarded and advanced in degrees of
Percent of Stock
Compression Peak TorquePeak
Power 11.3 96.43 98.2512.3 100.00 100.0013.3 102.38 101.75
8/10/2019 Ca Poly FormulaSAE Engine Development
http://slidepdf.com/reader/full/ca-poly-formulasae-engine-development 25/142
25
crankshaft rotation. The results from WAVE show that best timing for the intake cam is about
ten degrees advanced from stock (Figure 7) and the exhaust cam makes best power at ten to
fifteen degrees advanced. Both sweeps show that there is a fairly wide range of cam timing
where power is not affected much. Therefore, WAVE predicts that power is not sensitive to
intake cam timing in the range of five degrees retarded to ten degrees advanced from stock.
Exhaust cam timing does not really affect power from five degrees retarded to twenty degrees
advanced.
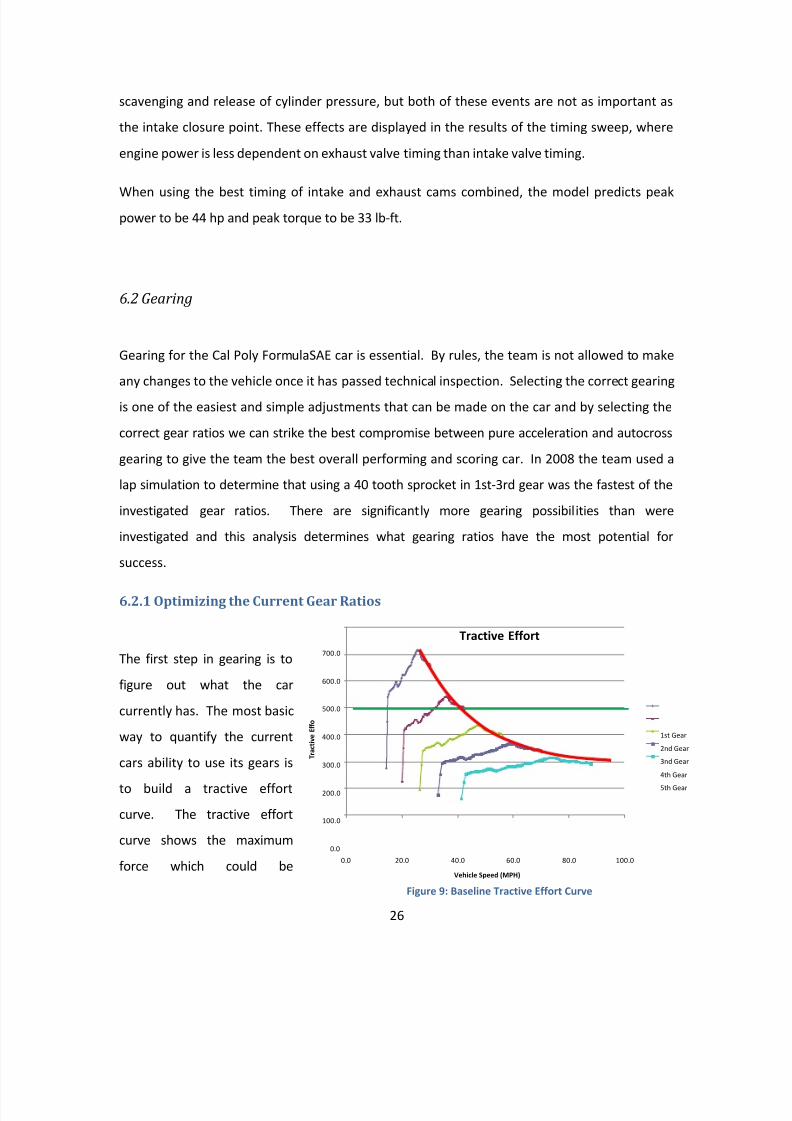
Figure 8: Exhaust Cam Timing Sweep Keeping Stock Intake Timing
This result is intuitive because intake valve timing is more important than exhaust timing. Theintake valve closure point determines maximum cylinder pressure which is related to the
engine’s dynamic compression ratio. Since the intake valve closes after the piston reaches
bottom dead center and starts moving up, the mixture actually gets compressed less than the
static compression ratio (12.3:1 stock) dictates. The later the intake valve closes, the more
maximum cylinder pressure decreases, thus compression is bled off by the intake valve.
Therefore, dynamic compression refers to the actual amount that the mixture is compressed,
factoring in the intake valve events. Exhaust cam timing is not as critical as intake timing, as
shown in Figure 8, because the opening of the valve releases mostly burned gasses. The closure
point of the exhaust valve and the opening of the intake valve are part of valve overlap where
intake and exhaust valves are open simultaneously, affecting cylinder scavenging. Cylinder
scavenging is the ability to fill and empty the cylinder effectively. Thus, the exhaust valve affects
8/10/2019 Ca Poly FormulaSAE Engine Development
http://slidepdf.com/reader/full/ca-poly-formulasae-engine-development 26/142
26
scavenging and release of cylinder pressure, but both of these events are not as important as
the intake closure point. These effects are displayed in the results of the timing sweep, where
engine power is less dependent on exhaust valve timing than intake valve timing.
When using the best timing of intake and exhaust cams combined, the model predicts peakpower to be 44 hp and peak torque to be 33 lb-ft.
6.2 Gearing
Gearing for the Cal Poly FormulaSAE car is essential. By rules, the team is not allowed to make
any changes to the vehicle once it has passed technical inspection. Selecting the correct gearing
is one of the easiest and simple adjustments that can be made on the car and by selecting the
correct gear ratios we can strike the best compromise between pure acceleration and autocross
gearing to give the team the best overall performing and scoring car. In 2008 the team used a
lap simulation to determine that using a 40 tooth sprocket in 1st-3rd gear was the fastest of the
investigated gear ratios. There are significantly more gearing possibilities than were
investigated and this analysis determines what gearing ratios have the most potential for
success.
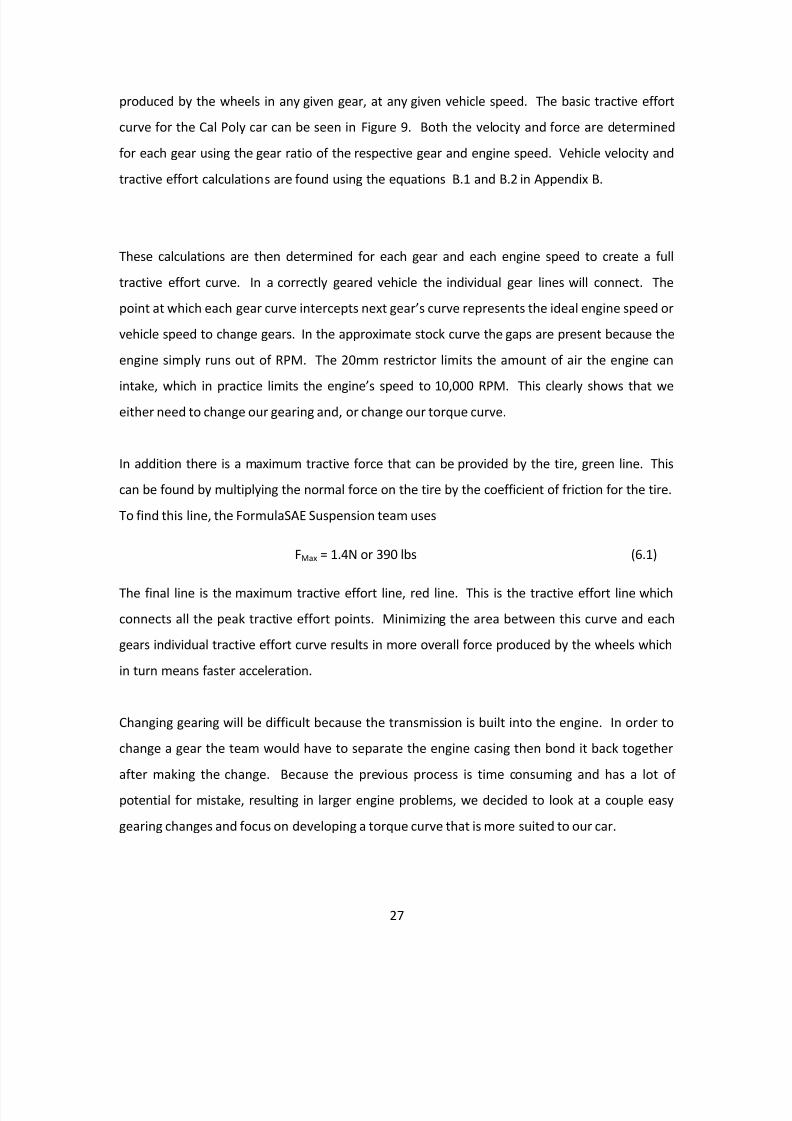
6.2.1 Optimizing the Current Gear Ratios
The first step in gearing is to
figure out what the car
currently has. The most basic
way to quantify the current
cars ability to use its gears is
to build a tractive effort
curve. The tractive effort
curve shows the maximum
force which could be
Tractive Effort
0.0
100.0
200.0
300.0
400.0
500.0
600.0
700.0
0.0 20.0 40.0 60.0 80.0 100.0
Vehicle Speed (MPH)
T r a c t i v e E f f o
1st Gear
2nd Gear
3nd Gear
4th Gear
5th Gear
Figure 9: Baseline Tractive Effort Curve
8/10/2019 Ca Poly FormulaSAE Engine Development
http://slidepdf.com/reader/full/ca-poly-formulasae-engine-development 27/142
27
produced by the wheels in any given gear, at any given vehicle speed. The basic tractive effort
curve for the Cal Poly car can be seen in Figure 9. Both the velocity and force are determined
for each gear using the gear ratio of the respective gear and engine speed. Vehicle velocity and
tractive effort calculations are found using the equations B.1 and B.2 in Appendix B.
These calculations are then determined for each gear and each engine speed to create a full
tractive effort curve. In a correctly geared vehicle the individual gear lines will connect. The
point at which each gear curve intercepts next gear’s curve represents the ideal engine speed or
vehicle speed to change gears. In the approximate stock curve the gaps are present because the
engine simply runs out of RPM. The 20mm restrictor limits the amount of air the engine can
intake, which in practice limits the engine’s speed to 10,000 RPM. This clearly shows that weeither need to change our gearing and, or change our torque curve.
In addition there is a maximum tractive force that can be provided by the tire, green line. This
can be found by multiplying the normal force on the tire by the coefficient of friction for the tire.
To find this line, the FormulaSAE Suspension team uses
FMax = 1.4N or 390 lbs (6.1)
The final line is the maximum tractive effort line, red line. This is the tractive effort line which
connects all the peak tractive effort points. Minimizing the area between this curve and each
gears individual tractive effort curve results in more overall force produced by the wheels which
in turn means faster acceleration.
Changing gearing will be difficult because the transmission is built into the engine. In order to
change a gear the team would have to separate the engine casing then bond it back together
after making the change. Because the previous process is time consuming and has a lot of
potential for mistake, resulting in larger engine problems, we decided to look at a couple easy
gearing changes and focus on developing a torque curve that is more suited to our car.
8/10/2019 Ca Poly FormulaSAE Engine Development
http://slidepdf.com/reader/full/ca-poly-formulasae-engine-development 28/142
28
6.2.2 Using Non-Traditional Gears
The autocross and endurance events are the highest point paying events in the dynamic portion
of the competition. As a result these two events are the ones that most teams need to design
for. These courses are designed to have an average speed of around 35 mph and a top speed of
about 60-65 mph. Because these courses are so tight there are a lot of shifts, most teams only
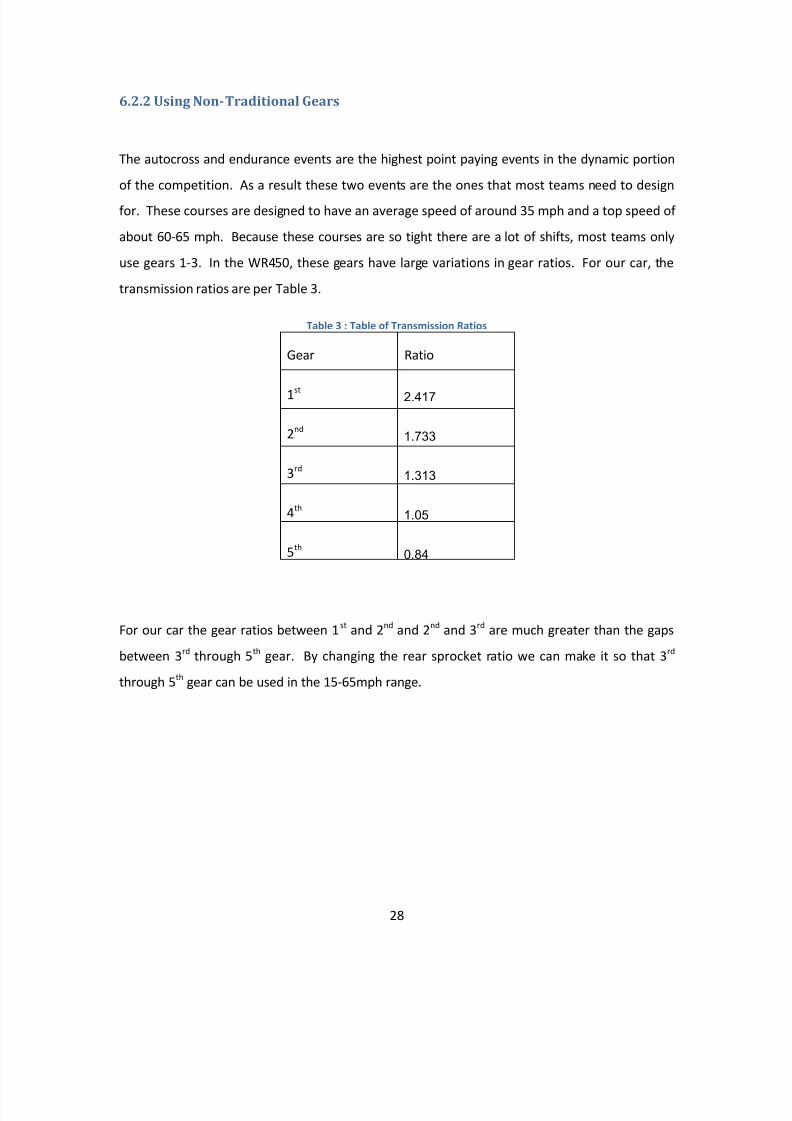
use gears 1-3. In the WR450, these gears have large variations in gear ratios. For our car, the
transmission ratios are per Table 3.
Table 3 : Table of Transmission Ratios
Gear Ratio
1st 2.417
2nd 1.733
3rd 1.313
4th 1.05
5th 0.84
For our car the gear ratios between 1 st and 2 nd and 2 nd and 3 rd are much greater than the gaps
between 3 rd through 5 th gear. By changing the rear sprocket ratio we can make it so that 3 rd
through 5 th gear can be used in the 15-65mph range.
8/10/2019 Ca Poly FormulaSAE Engine Development
http://slidepdf.com/reader/full/ca-poly-formulasae-engine-development 29/142
29
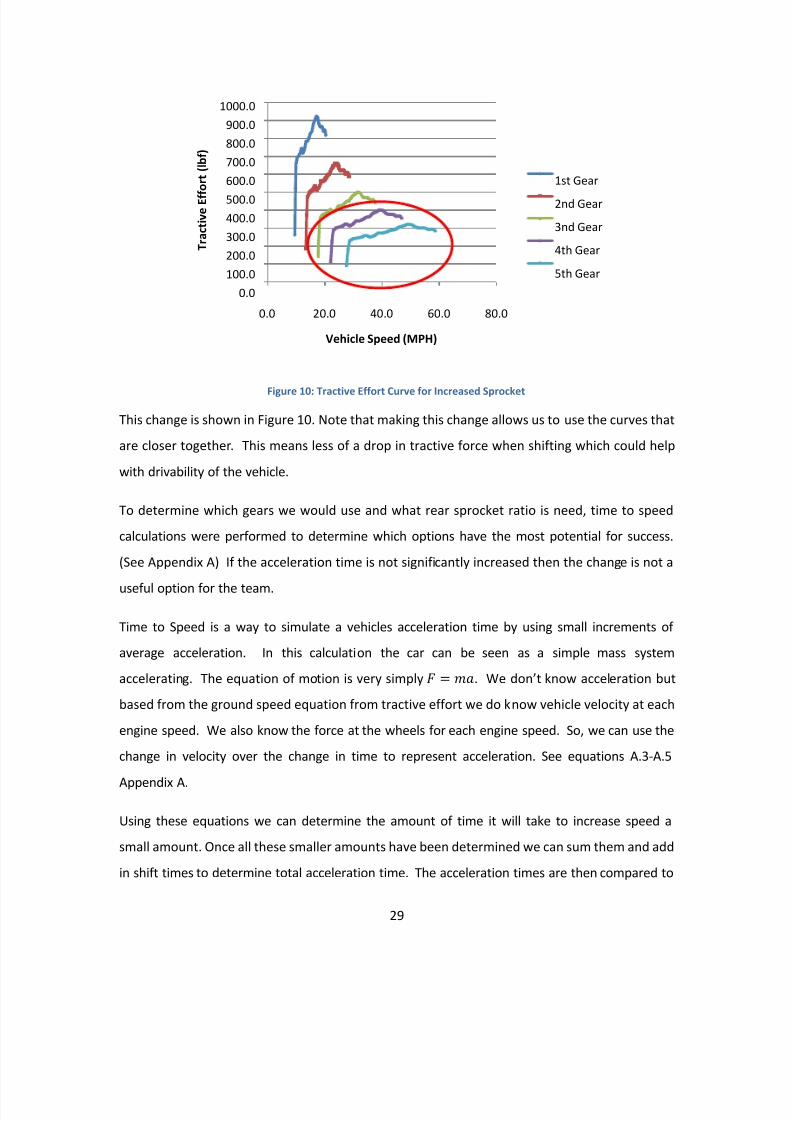
Figure 10: Tractive Effort Curve for Increased Sprocket
This change is shown in Figure 10. Note that making this change allows us to use the curves that
are closer together. This means less of a drop in tractive force when shifting which could help
with drivability of the vehicle.
To determine which gears we would use and what rear sprocket ratio is need, time to speed
calculations were performed to determine which options have the most potential for success.
(See Appendix A) If the acceleration time is not significantly increased then the change is not a
useful option for the team.
Time to Speed is a way to simulate a vehicles acceleration time by using small increments of
average acceleration. In this calculation the car can be seen as a simple mass system
accelerating. The equation of motion is very simply = . We don’t know acceleration but
based from the ground speed equation from tractive effort we do know vehicle velocity at each
engine speed. We also know the force at the wheels for each engine speed. So, we can use the
change in velocity over the change in time to represent acceleration. See equations A.3-A.5
Appendix A.
Using these equations we can determine the amount of time it will take to increase speed a
small amount. Once all these smaller amounts have been determined we can sum them and add
in shift times to determine total acceleration time. The acceleration times are then compared to
0.0100.0200.0300.0400.0500.0
600.0700.0800.0900.0
1000.0
0.0 20.0 40.0 60.0 80.0
T r a c t i v e E f
f o r t
( l b f )
Vehicle Speed (MPH)
1st Gear
2nd Gear
3nd Gear
4th Gear
5th Gear
8/10/2019 Ca Poly FormulaSAE Engine Development
http://slidepdf.com/reader/full/ca-poly-formulasae-engine-development 30/142
30
determine which has the most potential for success. Table 4 shows that it is theoretically
possible that using 2nd-4th gear will result in a significantly faster acceleration time than the
current gearing.
Table 4: Time to Speed for Different Sprocket Ratios
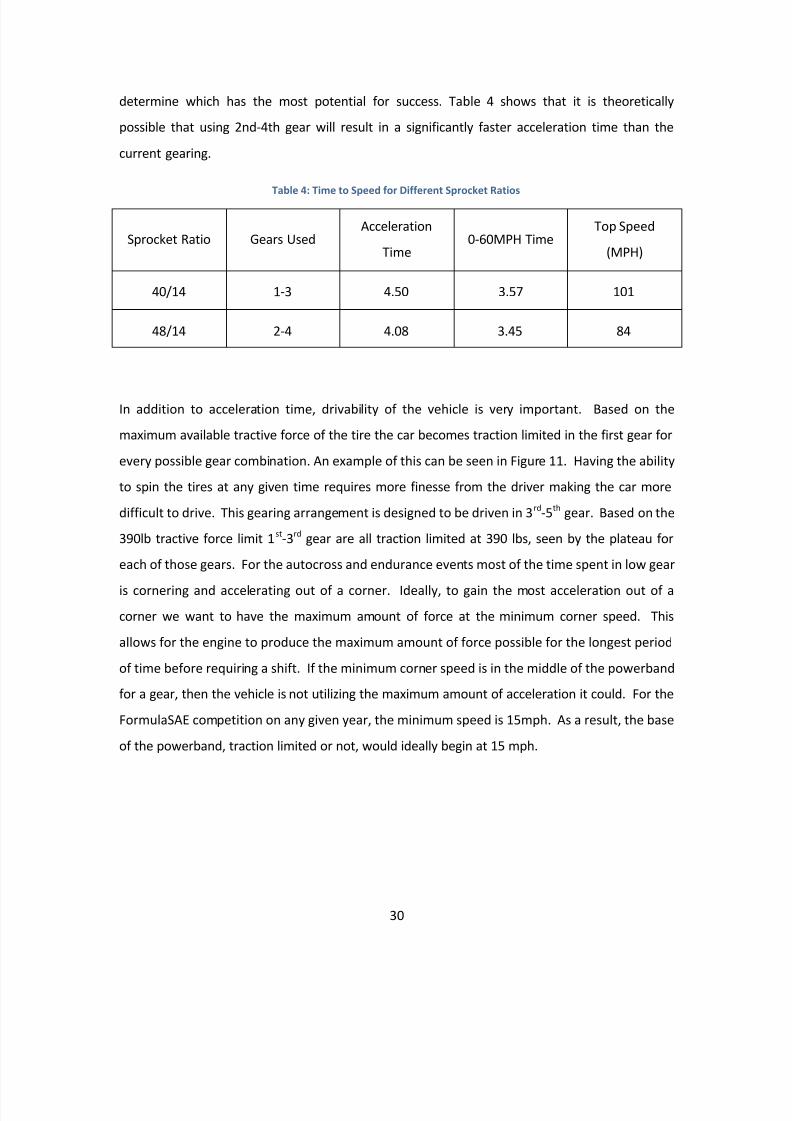
In addition to acceleration time, drivability of the vehicle is very important. Based on the
maximum available tractive force of the tire the car becomes traction limited in the first gear for
every possible gear combination. An example of this can be seen in Figure 11. Having the ability
to spin the tires at any given time requires more finesse from the driver making the car more
difficult to drive. This gearing arrangement is designed to be driven in 3 rd-5th gear. Based on the
390lb tractive force limit 1 st-3rd gear are all traction limited at 390 lbs, seen by the plateau for
each of those gears. For the autocross and endurance events most of the time spent in low gear
is cornering and accelerating out of a corner. Ideally, to gain the most acceleration out of acorner we want to have the maximum amount of force at the minimum corner speed. This
allows for the engine to produce the maximum amount of force possible for the longest period
of time before requiring a shift. If the minimum corner speed is in the middle of the powerband
for a gear, then the vehicle is not utilizing the maximum amount of acceleration it could. For the
FormulaSAE competition on any given year, the minimum speed is 15mph. As a result, the base
of the powerband, traction limited or not, would ideally begin at 15 mph.
Sprocket Ratio Gears UsedAcceleration
Time0-60MPH Time
Top Speed
(MPH)
40/14 1-3 4.50 3.57 101
48/14 2-4 4.08 3.45 84
8/10/2019 Ca Poly FormulaSAE Engine Development
http://slidepdf.com/reader/full/ca-poly-formulasae-engine-development 31/142
31
When accelerating out of a corner a progressive throttle input is necessary to prevent the car
from under steering or throttle induced over steering. Thus the driver will not be giving the car
full throttle and will not necessarily be asking the engine to produce more than the traction
limit. It is however, advantageous to be able to reach the traction limit at any given time. If a
good driver can stay on the edge of traction then theoretically they can achieve the maximum
vehicle acceleration. To determine which set of gears, 1st-4th, or 3rd-5th is better for the
competition, we will have to perform on car testing on a repeatable course.
6.2.3 Using Gears from other Yamaha 450 Models
To fully explore the extent of gearing possibilities we can input the YFZ Quad gear ratios into our
models. The YFZ Quad engine has closer gear ratios than the WR because it requires more
torque in each gear to power through resistive terrain and does not need the top speed
capabilities that the motorcycle has. The gear ratios are per Table 5,
0
50
100
150
200
250
300
350
400
450
0 10 20 30 40 50 60 70 80 90
F o r c e f r o m W h e e l s (
l b f )
Speed (mph)
Force at Wheels per Gear 2010 Cal Poly FSAE
1st Gear
2nd Gear
3rd Gear
4th Gear
5th Gear M i n S p e e d
M a x
S p e e d
Figure 11: Tractive Effort of Different Gears
8/10/2019 Ca Poly FormulaSAE Engine Development
http://slidepdf.com/reader/full/ca-poly-formulasae-engine-development 32/142
32
Table 5: Table of Transmission Ratios for YFZ450 Quad
Gear Ratio
1st 2.416
2nd 1.928
3rd 1.562
4th 1.277
5th 1.050
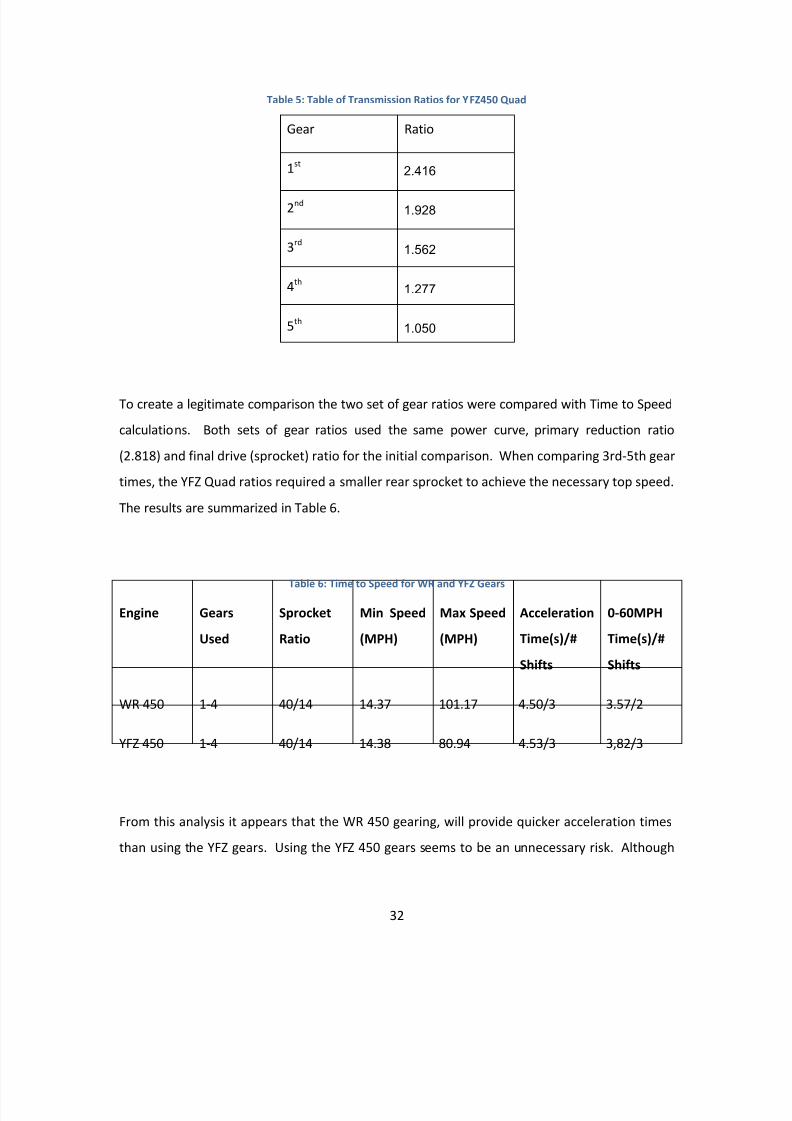
To create a legitimate comparison the two set of gear ratios were compared with Time to Speed
calculations. Both sets of gear ratios used the same power curve, primary reduction ratio
(2.818) and final drive (sprocket) ratio for the initial comparison. When comparing 3rd-5th gear
times, the YFZ Quad ratios required a smaller rear sprocket to achieve the necessary top speed.
The results are summarized in Table 6.
Table 6: Time to Speed for WR and YFZ Gears
Engine Gears
Used
Sprocket
Ratio
Min Speed
(MPH)
Max Speed
(MPH)
Acceleration
Time(s)/#
Shifts
0-60MPH
Time(s)/#
Shifts
WR 450 1-4 40/14 14.37 101.17 4.50/3 3.57/2
YFZ 450 1-4 40/14 14.38 80.94 4.53/3 3,82/3
From this analysis it appears that the WR 450 gearing, will provide quicker acceleration times
than using the YFZ gears. Using the YFZ 450 gears seems to be an unnecessary risk. Although
8/10/2019 Ca Poly FormulaSAE Engine Development
http://slidepdf.com/reader/full/ca-poly-formulasae-engine-development 33/142
33
they maintain a competitive acceleration time, the times are slower and the added risk
associated with changing the gears is not worth taking the time to test.
6.2.4 Final Drive Ratio
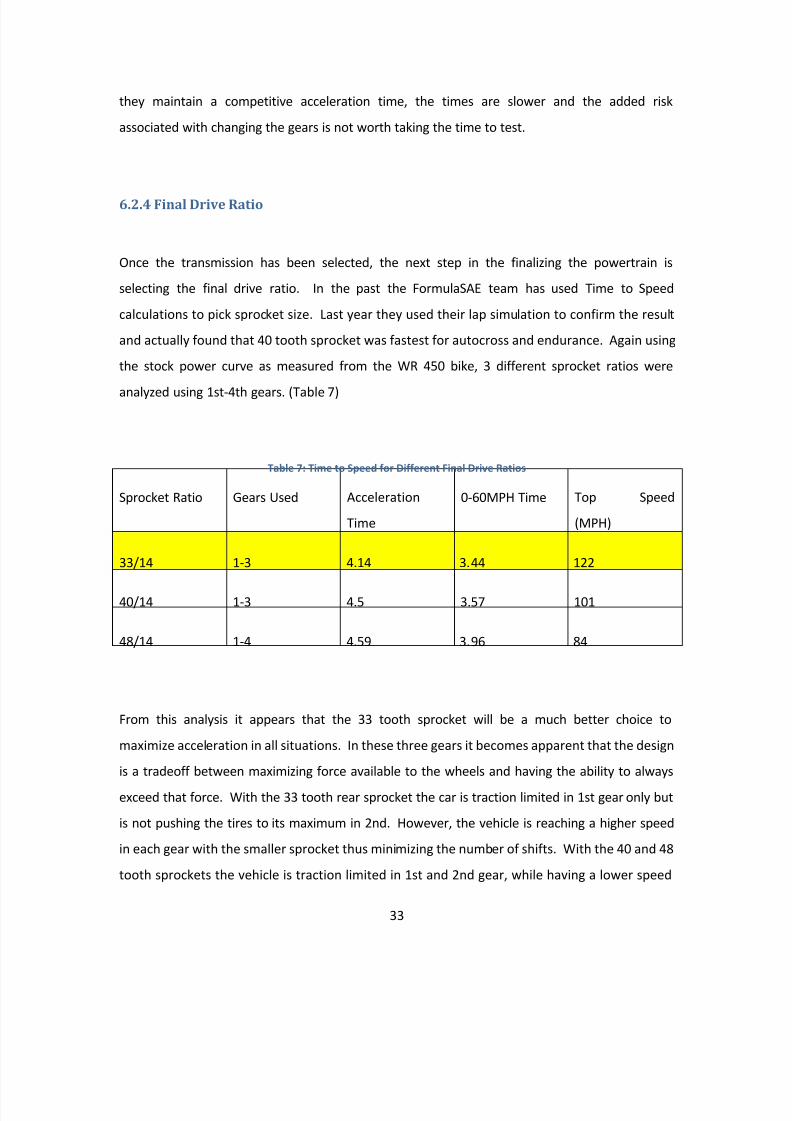
Once the transmission has been selected, the next step in the finalizing the powertrain is
selecting the final drive ratio. In the past the FormulaSAE team has used Time to Speed
calculations to pick sprocket size. Last year they used their lap simulation to confirm the result
and actually found that 40 tooth sprocket was fastest for autocross and endurance. Again using
the stock power curve as measured from the WR 450 bike, 3 different sprocket ratios were
analyzed using 1st-4th gears. (Table 7)
Table 7: Time to Speed for Different Final Drive Ratios
Sprocket Ratio Gears Used Acceleration
Time
0-60MPH Time Top Speed
(MPH)
33/14 1-3 4.14 3.44 122
40/14 1-3 4.5 3.57 101
48/14 1-4 4.59 3.96 84
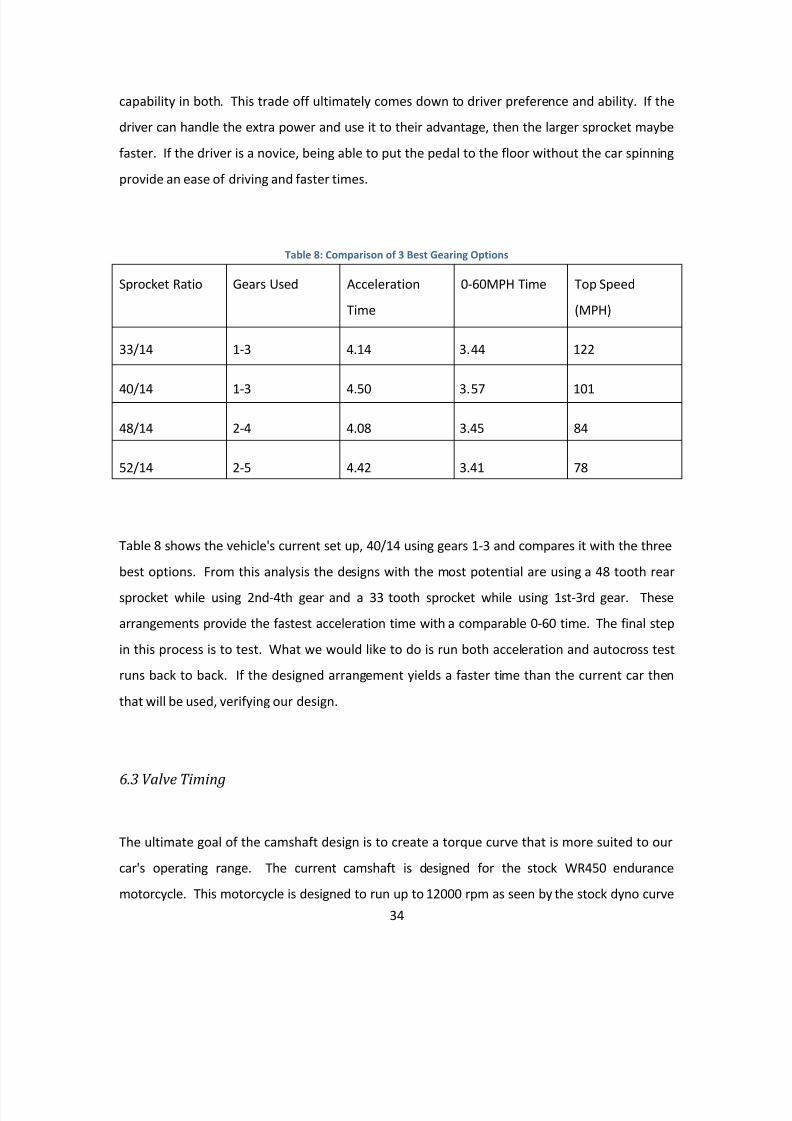
From this analysis it appears that the 33 tooth sprocket will be a much better choice to
maximize acceleration in all situations. In these three gears it becomes apparent that the design
is a tradeoff between maximizing force available to the wheels and having the ability to always
exceed that force. With the 33 tooth rear sprocket the car is traction limited in 1st gear only but
is not pushing the tires to its maximum in 2nd. However, the vehicle is reaching a higher speed
in each gear with the smaller sprocket thus minimizing the number of shifts. With the 40 and 48
tooth sprockets the vehicle is traction limited in 1st and 2nd gear, while having a lower speed
8/10/2019 Ca Poly FormulaSAE Engine Development
http://slidepdf.com/reader/full/ca-poly-formulasae-engine-development 34/142
8/10/2019 Ca Poly FormulaSAE Engine Development
http://slidepdf.com/reader/full/ca-poly-formulasae-engine-development 35/142
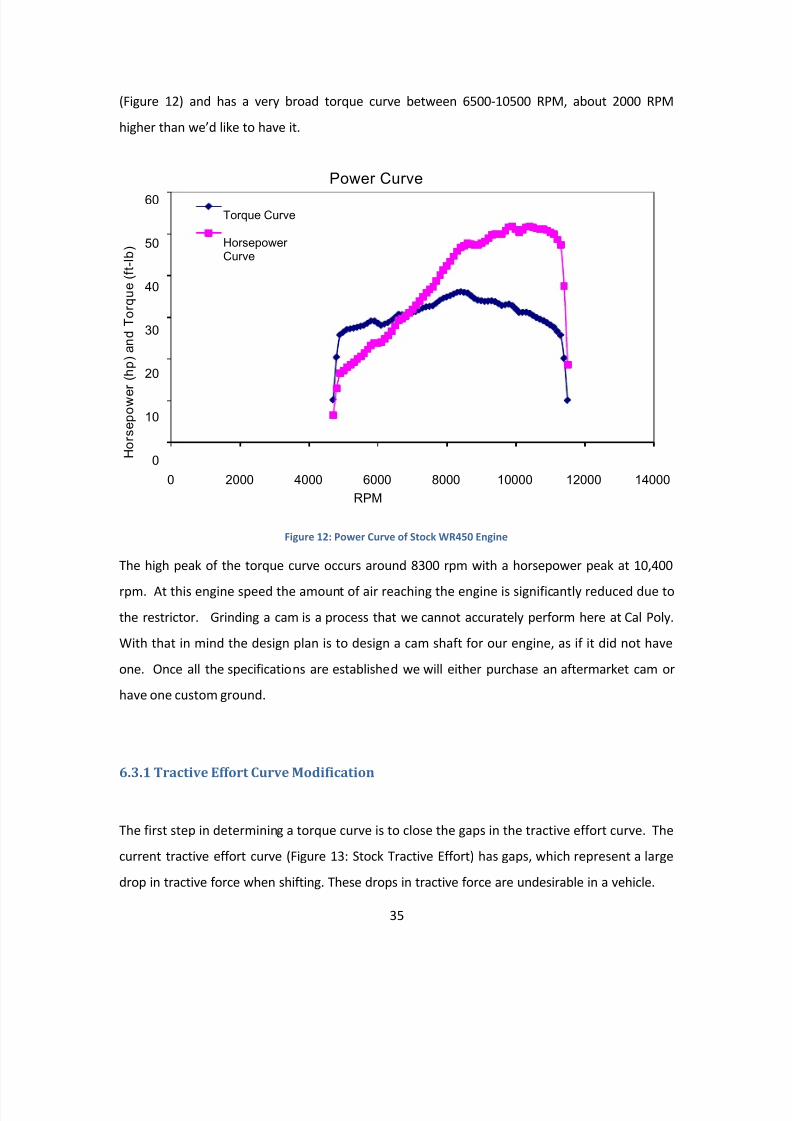
35
(Figure 12) and has a very broad torque curve between 6500-10500 RPM, about 2000 RPM
higher than we’d like to have it.
Figure 12: Power Curve of Stock WR450 Engine
The high peak of the torque curve occurs around 8300 rpm with a horsepower peak at 10,400
rpm. At this engine speed the amount of air reaching the engine is significantly reduced due to
the restrictor. Grinding a cam is a process that we cannot accurately perform here at Cal Poly.
With that in mind the design plan is to design a cam shaft for our engine, as if it did not have
one. Once all the specifications are established we will either purchase an aftermarket cam or
have one custom ground.
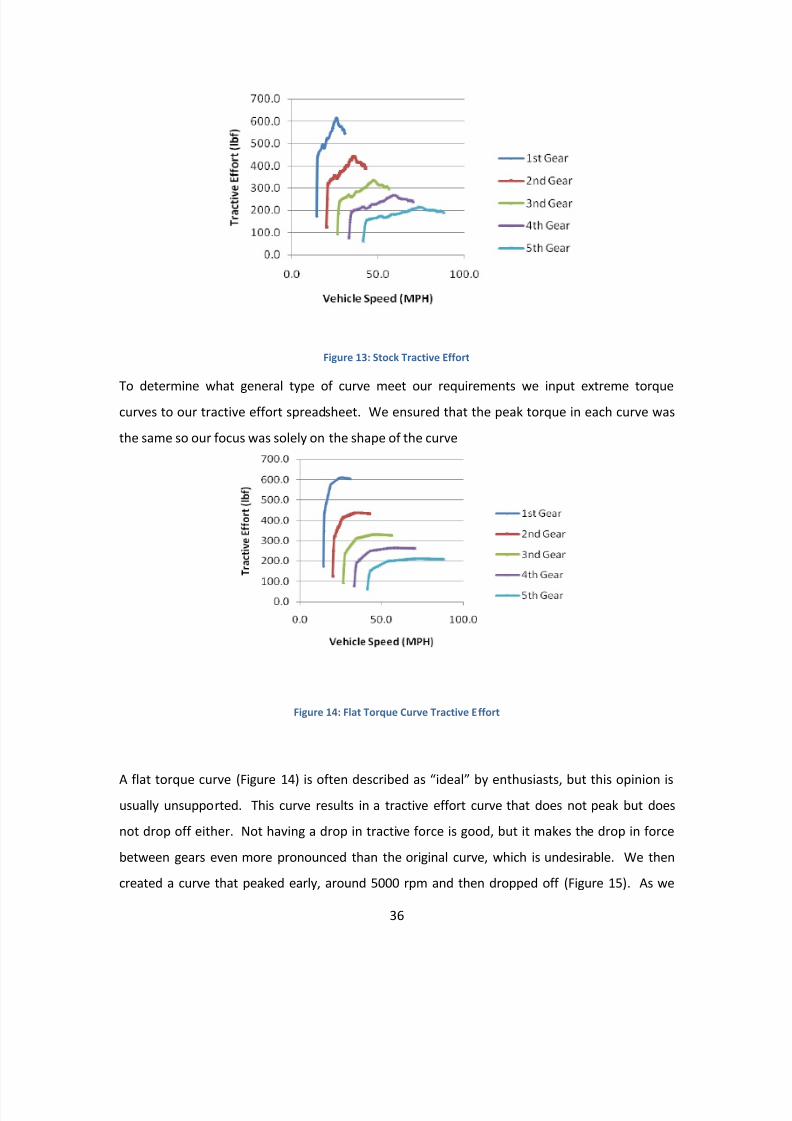
6.3.1 Tractive Effort Curve Modification
The first step in determining a torque curve is to close the gaps in the tractive effort curve. The
current tractive effort curve (Figure 13: Stock Tractive Effort) has gaps, which represent a large
drop in tractive force when shifting. These drops in tractive force are undesirable in a vehicle.
0
10
20
30
40
50
60
0 2000 4000 6000 8000 10000 12000 14000
H o r s e p o w e r
( h p
) a n
d T o r q u e
( f t - l b )
RPM
Power Curve
Torque Curve
HorsepowerCurve
8/10/2019 Ca Poly FormulaSAE Engine Development
http://slidepdf.com/reader/full/ca-poly-formulasae-engine-development 36/142
36
Figure 13: Stock Tractive Effort
To determine what general type of curve meet our requirements we input extreme torquecurves to our tractive effort spreadsheet. We ensured that the peak torque in each curve was
the same so our focus was solely on the shape of the curve
Figure 14: Flat Torque Curve Tractive Effort
A flat torque curve (Figure 14) is often described as “ideal” by enthusiasts, but this opinion isusually unsupported. This curve results in a tractive effort curve that does not peak but does
not drop off either. Not having a drop in tractive force is good, but it makes the drop in force
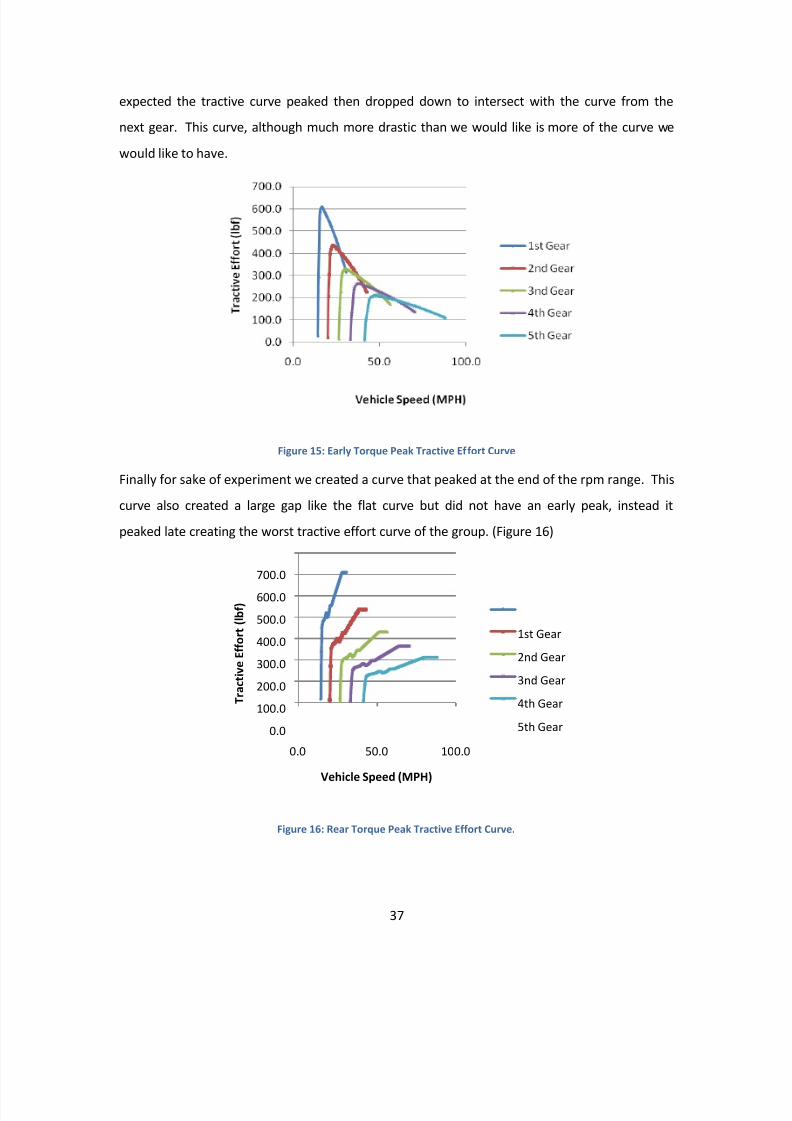
between gears even more pronounced than the original curve, which is undesirable. We then
created a curve that peaked early, around 5000 rpm and then dropped off (Figure 15) . As we
8/10/2019 Ca Poly FormulaSAE Engine Development
http://slidepdf.com/reader/full/ca-poly-formulasae-engine-development 37/142
37
expected the tractive curve peaked then dropped down to intersect with the curve from the
next gear. This curve, although much more drastic than we would like is more of the curve we
would like to have.
Figure 15: Early Torque Peak Tractive Effort Curve
Finally for sake of experiment we created a curve that peaked at the end of the rpm range. This
curve also created a large gap like the flat curve but did not have an early peak, instead it
peaked late creating the worst tractive effort curve of the group. (Figure 16)
Figure 16: Rear Torque Peak Tractive Effort Curve.
0.0
100.0
200.0
300.0
400.0
500.0
600.0
700.0
0.0 50.0 100.0
T r a c t i v e E f f o r t
( l b f )
Vehicle Speed (MPH)
1st Gear
2nd Gear
3nd Gear
4th Gear
5th Gear
8/10/2019 Ca Poly FormulaSAE Engine Development
http://slidepdf.com/reader/full/ca-poly-formulasae-engine-development 38/142
38
For the FormulaSAE car a powerband that peaks earlier in the rpm range and maintains its
torque rating towards the end of the rpm range is more effective. Ideally, toward the end of the
rpm range the torque would begin to drop off, thus preventing the sudden drop in tractive
effort between gears. The current powerband begins at 4700rpm and ends at 12000rpm. If we
were to maintain the current length of the powerband, the new curve would begin around
3500rpm and end around 10,000rpm, or the maximum engine speed at which the restrictor can
operate without significant restriction of flow.
6.3.2 Determining Maximum Valve Lift
In an ideal intake the intake valve opening(s) will be the point of maximum restriction of the
intake. With that said, designing a valve so that it does not choke at maximum flow is critical for
an engine to perform well at higher speeds. This is where design of the valve lift will start.
For this project we will retain the stock valves from the WR450 head. It currently has three
intake valves each with a diameter of 27mm and two exhaust valves with a diameter of 28mm.
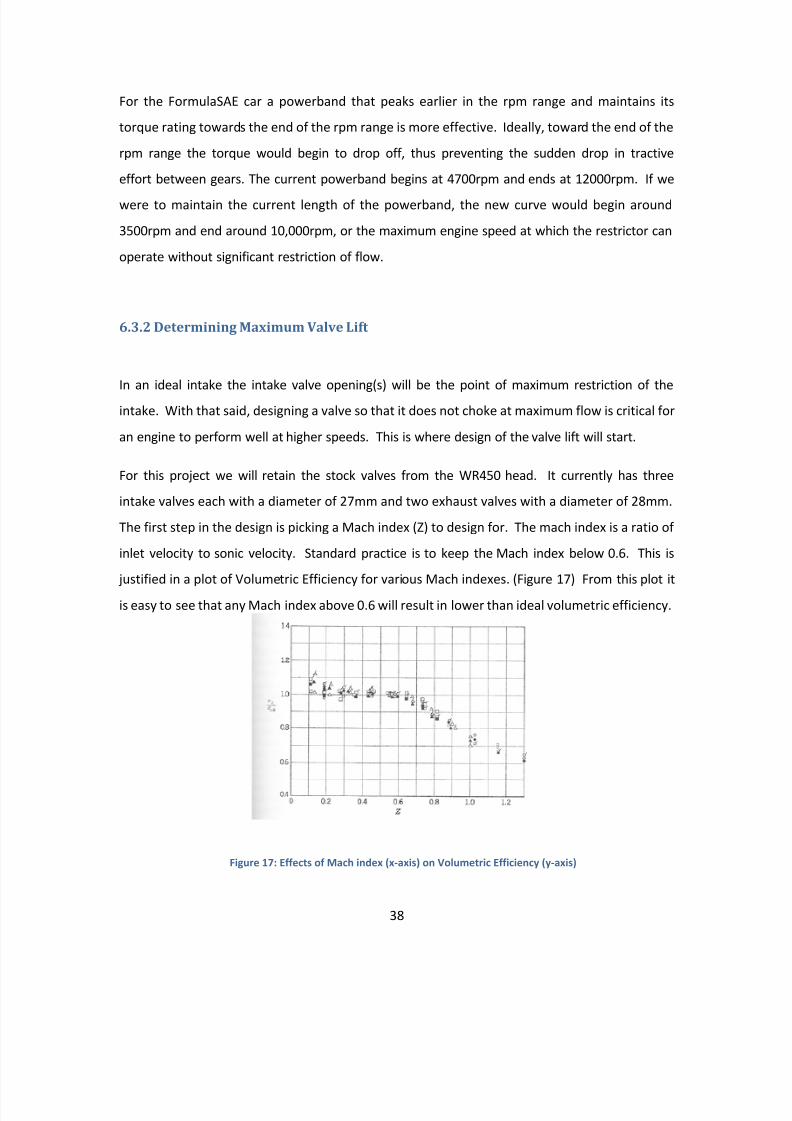
The first step in the design is picking a Mach index (Z) to design for. The mach index is a ratio of
inlet velocity to sonic velocity. Standard practice is to keep the Mach index below 0.6. This is
justified in a plot of Volumetric Efficiency for various Mach indexes. (Figure 17) From this plot it
is easy to see that any Mach index above 0.6 will result in lower than ideal volumetric efficiency.
Figure 17: Effects of Mach index (x-axis) on Volumetric Efficiency (y-axis)
8/10/2019 Ca Poly FormulaSAE Engine Development
http://slidepdf.com/reader/full/ca-poly-formulasae-engine-development 39/142
39
A Mach index less than 0.6 provides extra assurance that the flow will not be sonic through the
valve but will require a larger flow area resulting, in our case, in extra lift. Once the Mach index
has been determined, design can begin.
When designing the valve the end result is a valve effective area. This is the maximum areathrough which air will flow when the valve is open. for low lift situations the effective area is
the area of the valve or 2,
= = 42 (6.2)
where d is the valve diameter. At higher lifts however, the area next to the valve is larger so the
effective area becomes 2,
= = (6.3)
where l is the valve lift and C f and C d are flow coefficients. We are designing our maximum lift,
thus if we can determine the effective area needed at our maximum engine speed then we can
determine what the maximum valve lift needs to be. Beginning with the intake valve, to
determine the maximum effective area the following equation is used 2,
= 42
̅ �
(6.4)
This equation provides the mean effective area based on the Mach index, bore of the piston, b,
the mean piston speed, � , and the speed of sound in the intake tract, c i. For a full calculation
see Appendix C.2. Once the effective area is calculated it must be divided by an average flow
coefficient to determine the representative area of the valve. Once the valve representative
area is calculated, the lift can be calculated with equation (6.3).
The exhaust can be calculated in the same way but can be simplified down into an equation
relating effective area of both the intake and exhaust valves to a ratio gas temperatures 2.
̅ ̅ =
1/2
(6.5)
This equation assumes a Mach index of 0.6 through the exhaust and intake valve. In addition to
8/10/2019 Ca Poly FormulaSAE Engine Development
http://slidepdf.com/reader/full/ca-poly-formulasae-engine-development 40/142
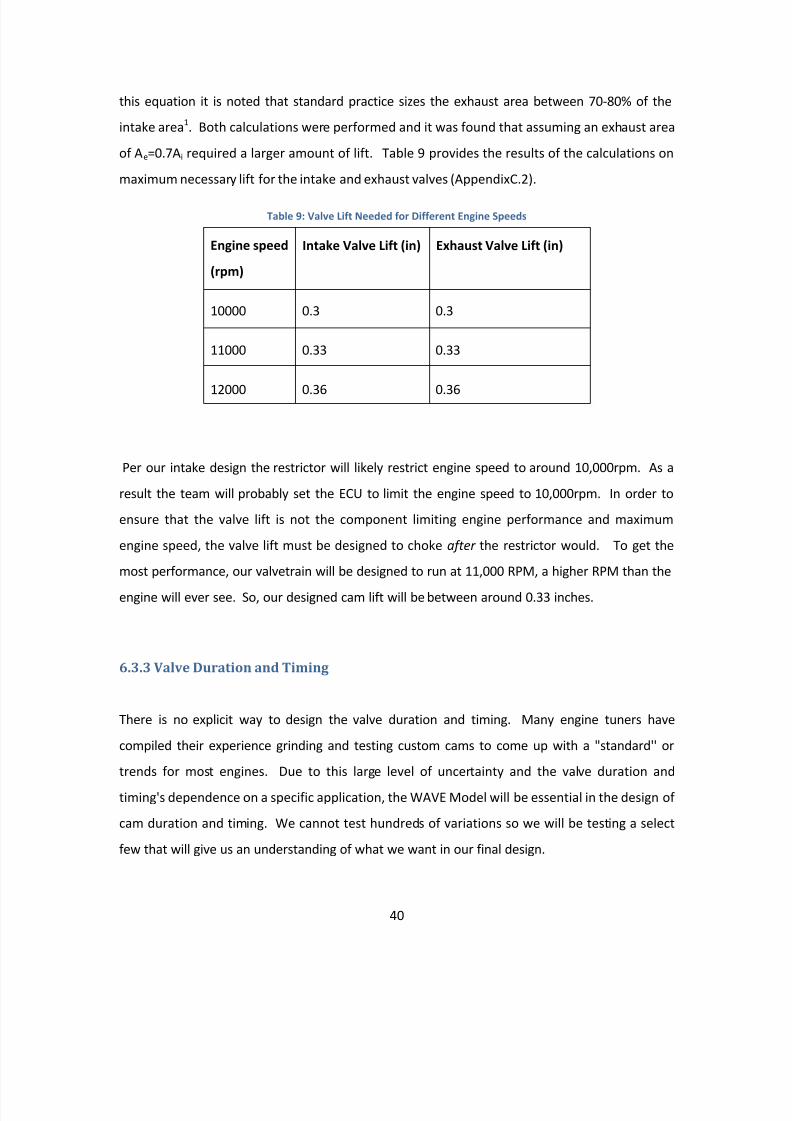
40
this equation it is noted that standard practice sizes the exhaust area between 70-80% of the
intake area 1. Both calculations were performed and it was found that assuming an exhaust area
of Ae=0.7Ai required a larger amount of lift. Table 9 provides the results of the calculations on
maximum necessary lift for the intake and exhaust valves (AppendixC.2).
Table 9: Valve Lift Needed for Different Engine Speeds
Engine speed
(rpm)
Intake Valve Lift (in) Exhaust Valve Lift (in)
10000 0.3 0.3
11000 0.33 0.33
12000 0.36 0.36
Per our intake design the restrictor will likely restrict engine speed to around 10,000rpm. As a
result the team will probably set the ECU to limit the engine speed to 10,000rpm. In order to
ensure that the valve lift is not the component limiting engine performance and maximum
engine speed, the valve lift must be designed to choke after the restrictor would. To get the
most performance, our valvetrain will be designed to run at 11,000 RPM, a higher RPM than the
engine will ever see. So, our designed cam lift will be between around 0.33 inches.
6.3.3 Valve Duration and Timing
There is no explicit way to design the valve duration and timing. Many engine tuners have
compiled their experience grinding and testing custom cams to come up with a "standard'' or
trends for most engines. Due to this large level of uncertainty and the valve duration and
timing's dependence on a specific application, the WAVE Model will be essential in the design of
cam duration and timing. We cannot test hundreds of variations so we will be testing a select
few that will give us an understanding of what we want in our final design.
8/10/2019 Ca Poly FormulaSAE Engine Development
http://slidepdf.com/reader/full/ca-poly-formulasae-engine-development 41/142
41
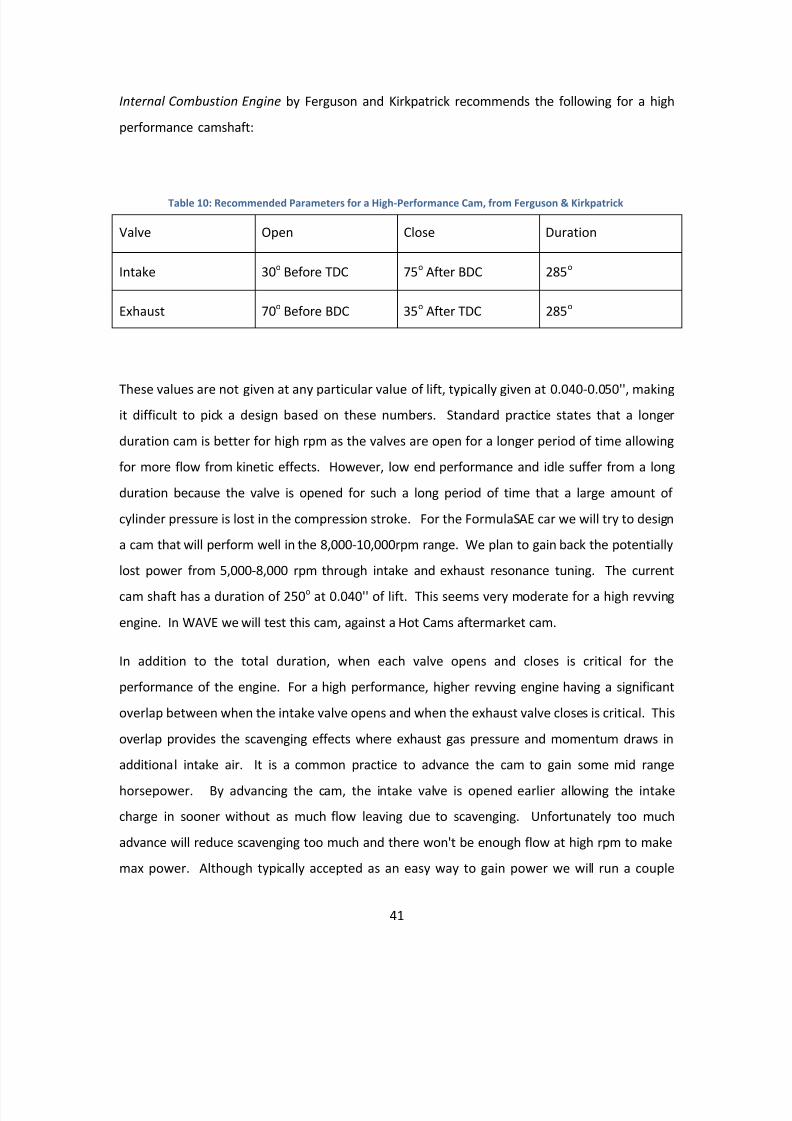
Internal Combustion Engine by Ferguson and Kirkpatrick recommends the following for a high
performance camshaft:
Table 10: Recommended Parameters for a High-Performance Cam, from Ferguson & Kirkpatrick
Valve Open Close Duration
Intake 30 o Before TDC 75 o After BDC 285o
Exhaust 70 o Before BDC 35 o After TDC 285o
These values are not given at any particular value of lift, typically given at 0.040-0.050'', makingit difficult to pick a design based on these numbers. Standard practice states that a longer
duration cam is better for high rpm as the valves are open for a longer period of time allowing
for more flow from kinetic effects. However, low end performance and idle suffer from a long
duration because the valve is opened for such a long period of time that a large amount of
cylinder pressure is lost in the compression stroke. For the FormulaSAE car we will try to design
a cam that will perform well in the 8,000-10,000rpm range. We plan to gain back the potentially
lost power from 5,000-8,000 rpm through intake and exhaust resonance tuning. The current
cam shaft has a duration of 250 o at 0.040'' of lift. This seems very moderate for a high revving
engine. In WAVE we will test this cam, against a Hot Cams aftermarket cam.
In addition to the total duration, when each valve opens and closes is critical for the
performance of the engine. For a high performance, higher revving engine having a significant
overlap between when the intake valve opens and when the exhaust valve closes is critical. This
overlap provides the scavenging effects where exhaust gas pressure and momentum draws in
additional intake air. It is a common practice to advance the cam to gain some mid range
horsepower. By advancing the cam, the intake valve is opened earlier allowing the intake
charge in sooner without as much flow leaving due to scavenging. Unfortunately too much
advance will reduce scavenging too much and there won't be enough flow at high rpm to make
max power. Although typically accepted as an easy way to gain power we will run a couple
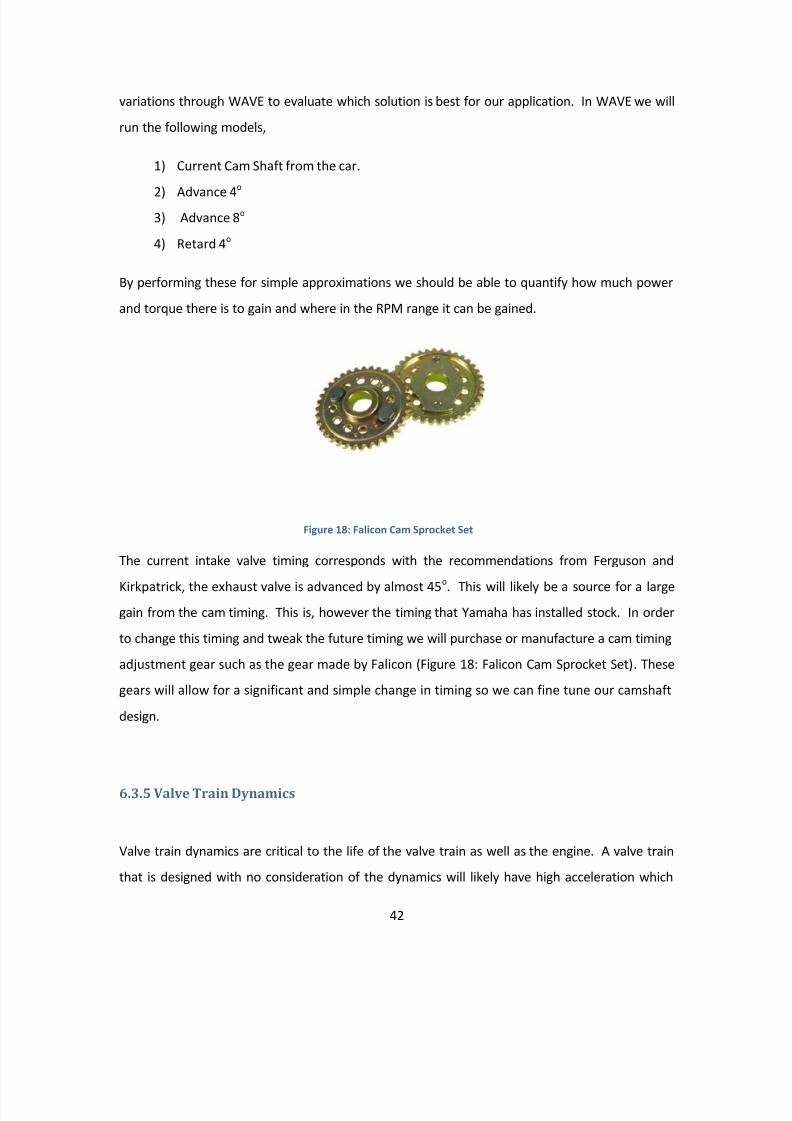
8/10/2019 Ca Poly FormulaSAE Engine Development
http://slidepdf.com/reader/full/ca-poly-formulasae-engine-development 42/142
42
variations through WAVE to evaluate which solution is best for our application. In WAVE we will
run the following models,
1) Current Cam Shaft from the car.
2) Advance 4o
3) Advance 8 o
4) Retard 4 o
By performing these for simple approximations we should be able to quantify how much power
and torque there is to gain and where in the RPM range it can be gained.
The current intake valve timing corresponds with the recommendations from Ferguson and
Kirkpatrick, the exhaust valve is advanced by almost 45o
. This will likely be a source for a largegain from the cam timing. This is, however the timing that Yamaha has installed stock. In order
to change this timing and tweak the future timing we will purchase or manufacture a cam timing
adjustment gear such as the gear made by Falicon (Figure 18: Falicon Cam Sprocket Set) . These
gears will allow for a significant and simple change in timing so we can fine tune our camshaft
design.
6.3.5 Valve Train Dynamics
Valve train dynamics are critical to the life of the valve train as well as the engine. A valve train
that is designed with no consideration of the dynamics will likely have high acceleration which
Figure 18: Falicon Cam Sprocket Set
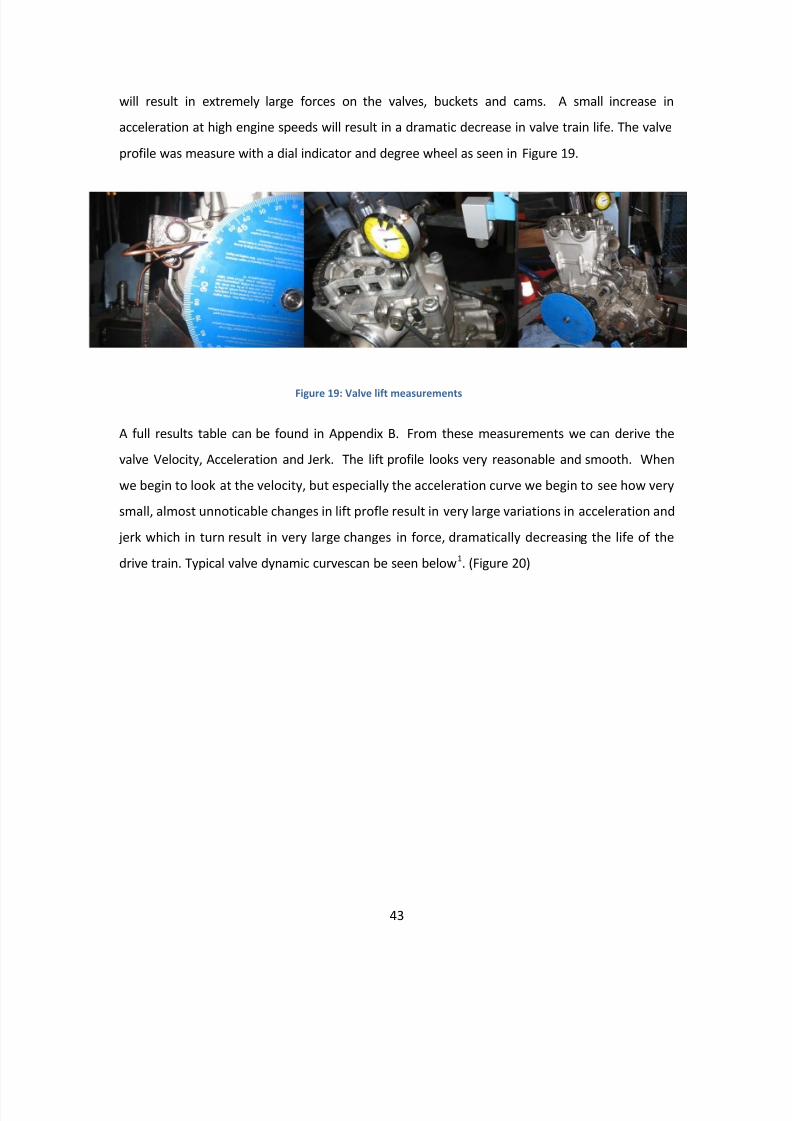
8/10/2019 Ca Poly FormulaSAE Engine Development
http://slidepdf.com/reader/full/ca-poly-formulasae-engine-development 43/142
43
will result in extremely large forces on the valves, buckets and cams. A small increase in
acceleration at high engine speeds will result in a dramatic decrease in valve train life. The valve
profile was measure with a dial indicator and degree wheel as seen in Figure 19.
A full results table can be found in Appendix B. From these measurements we can derive the
valve Velocity, Acceleration and Jerk. The lift profile looks very reasonable and smooth. When
we begin to look at the velocity, but especially the acceleration curve we begin to see how very
small, almost unnoticable changes in lift profle result in very large variations in acceleration and
jerk which in turn result in very large changes in force, dramatically decreasing the life of the
drive train. Typical valve dynamic curvescan be seen below 1. (Figure 20)
Figure 19: Valve lift measurements
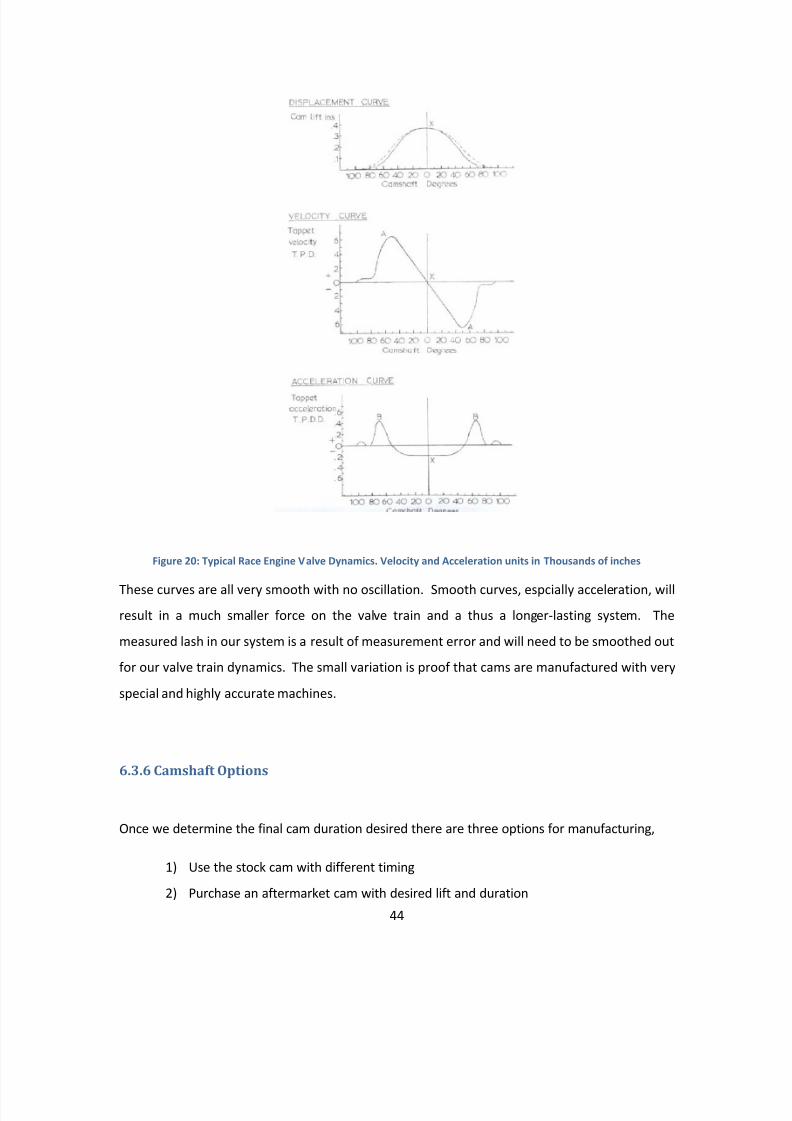
8/10/2019 Ca Poly FormulaSAE Engine Development
http://slidepdf.com/reader/full/ca-poly-formulasae-engine-development 44/142
44
Figure 20: Typical Race Engine Valve Dynamics. Velocity and Acceleration units in Thousands of inches
These curves are all very smooth with no oscillation. Smooth curves, espcially acceleration, willresult in a much smaller force on the valve train and a thus a longer-lasting system. The
measured lash in our system is a result of measurement error and will need to be smoothed out
for our valve train dynamics. The small variation is proof that cams are manufactured with very
special and highly accurate machines.
6.3.6 Camshaft Options
Once we determine the final cam duration desired there are three options for manufacturing,
1) Use the stock cam with different timing
2) Purchase an aftermarket cam with desired lift and duration
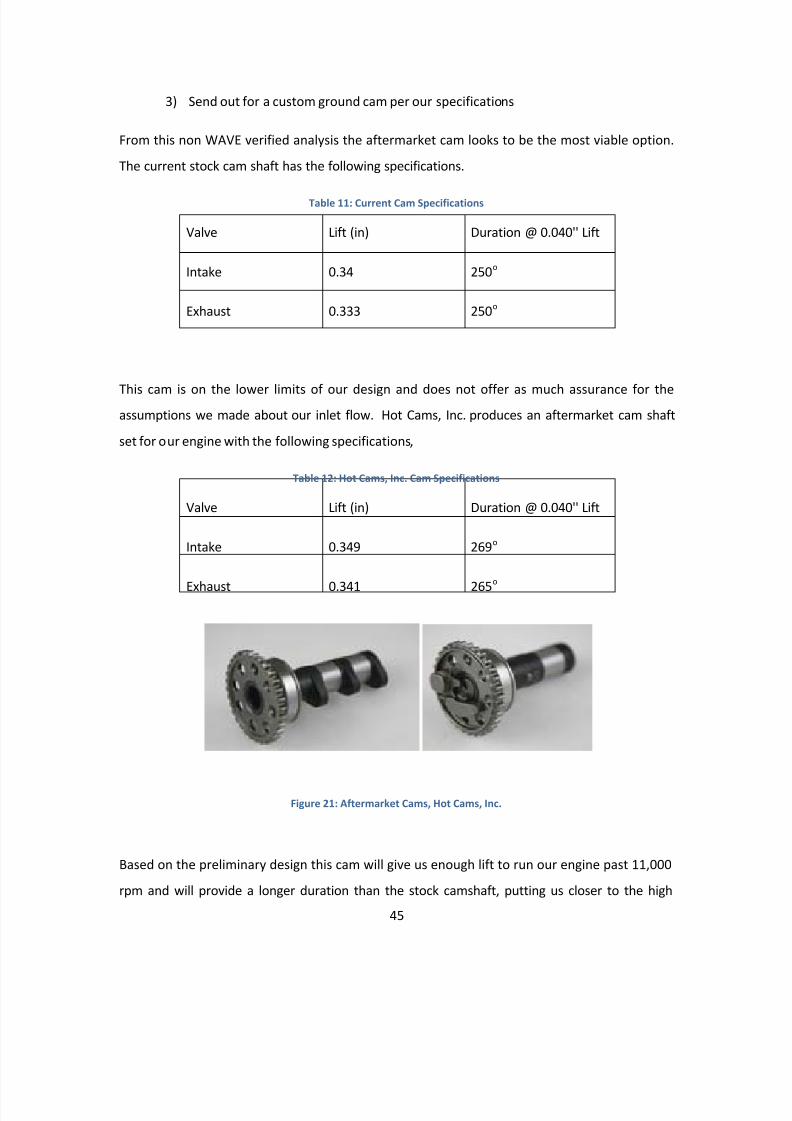
8/10/2019 Ca Poly FormulaSAE Engine Development
http://slidepdf.com/reader/full/ca-poly-formulasae-engine-development 45/142
45
3) Send out for a custom ground cam per our specifications
From this non WAVE verified analysis the aftermarket cam looks to be the most viable option.
The current stock cam shaft has the following specifications.
Table 11: Current Cam Specifications
Valve Lift (in) Duration @ 0.040'' Lift
Intake 0.34 250 o
Exhaust 0.333 250 o
This cam is on the lower limits of our design and does not offer as much assurance for theassumptions we made about our inlet flow. Hot Cams, Inc. produces an aftermarket cam shaft
set for our engine with the following specifications,
Table 12: Hot Cams, Inc. Cam Specifications
Valve Lift (in) Duration @ 0.040'' Lift
Intake 0.349 269 o
Exhaust 0.341 265o
Figure 21: Aftermarket Cams, Hot Cams, Inc.
Based on the preliminary design this cam will give us enough lift to run our engine past 11,000
rpm and will provide a longer duration than the stock camshaft, putting us closer to the high
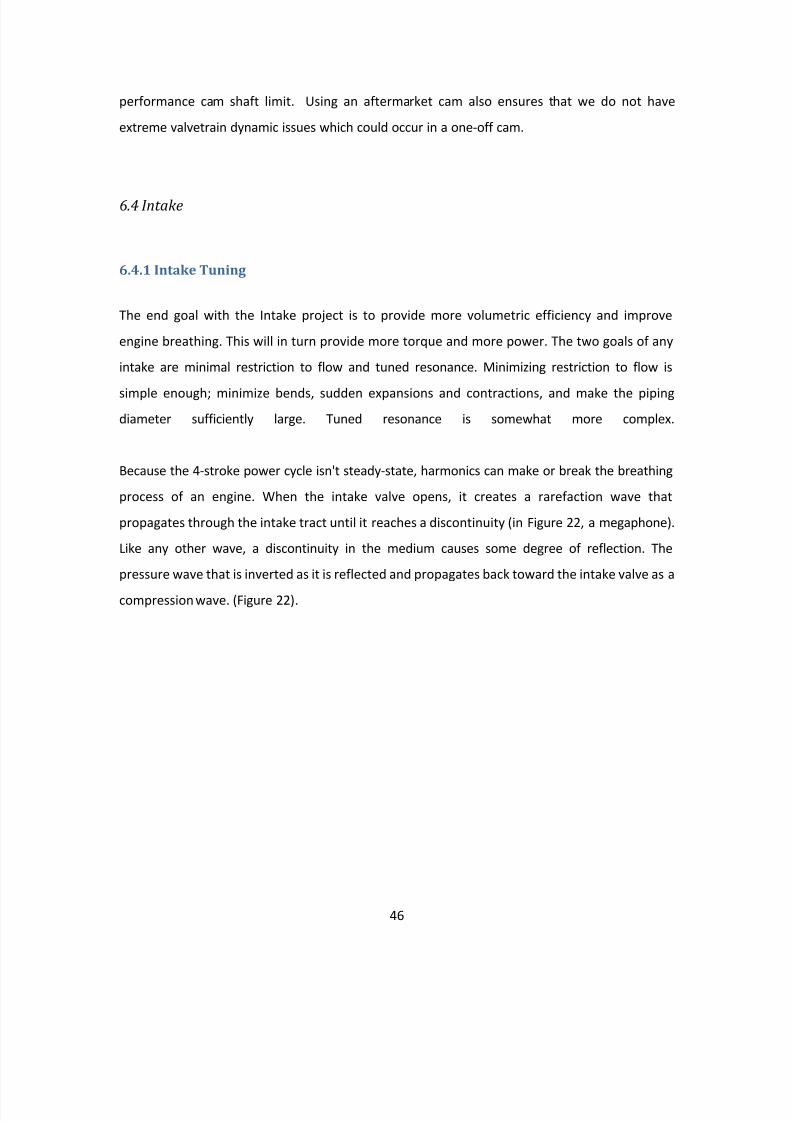
8/10/2019 Ca Poly FormulaSAE Engine Development
http://slidepdf.com/reader/full/ca-poly-formulasae-engine-development 46/142
46
performance cam shaft limit. Using an aftermarket cam also ensures that we do not have
extreme valvetrain dynamic issues which could occur in a one-off cam.
6.4 Intake
6.4.1 Intake Tuning
The end goal with the Intake project is to provide more volumetric efficiency and improve
engine breathing. This will in turn provide more torque and more power. The two goals of any
intake are minimal restriction to flow and tuned resonance. Minimizing restriction to flow is
simple enough; minimize bends, sudden expansions and contractions, and make the pipingdiameter sufficiently large. Tuned resonance is somewhat more complex.
Because the 4-stroke power cycle isn't steady-state, harmonics can make or break the breathing
process of an engine. When the intake valve opens, it creates a rarefaction wave that
propagates through the intake tract until it reaches a discontinuity (in Figure 22, a megaphone).
Like any other wave, a discontinuity in the medium causes some degree of reflection. The
pressure wave that is inverted as it is reflected and propagates back toward the intake valve as a
compression wave. (Figure 22) .
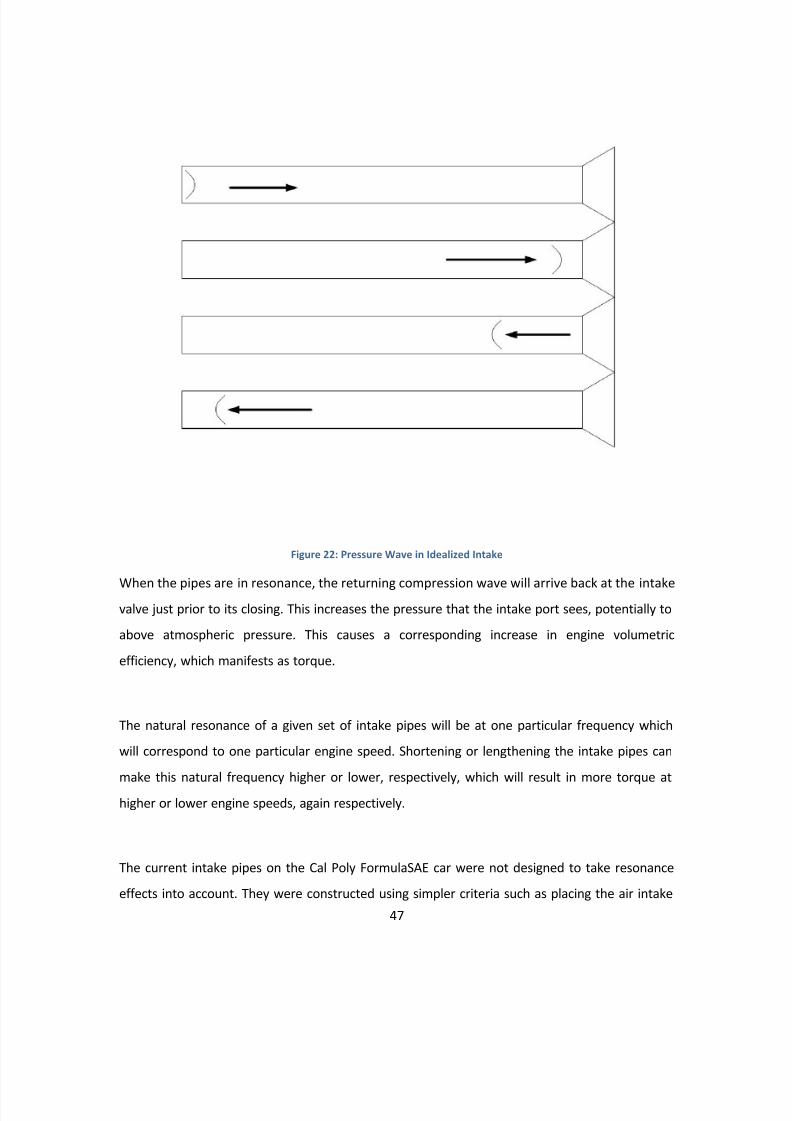
8/10/2019 Ca Poly FormulaSAE Engine Development
http://slidepdf.com/reader/full/ca-poly-formulasae-engine-development 47/142
47
Figure 22: Pressure Wave in Idealized Intake
When the pipes are in resonance, the returning compression wave will arrive back at the intakevalve just prior to its closing. This increases the pressure that the intake port sees, potentially to
above atmospheric pressure. This causes a corresponding increase in engine volumetric
efficiency, which manifests as torque.
The natural resonance of a given set of intake pipes will be at one particular frequency which
will correspond to one particular engine speed. Shortening or lengthening the intake pipes can
make this natural frequency higher or lower, respectively, which will result in more torque at
higher or lower engine speeds, again respectively.
The current intake pipes on the Cal Poly FormulaSAE car were not designed to take resonance
effects into account. They were constructed using simpler criteria such as placing the air intake
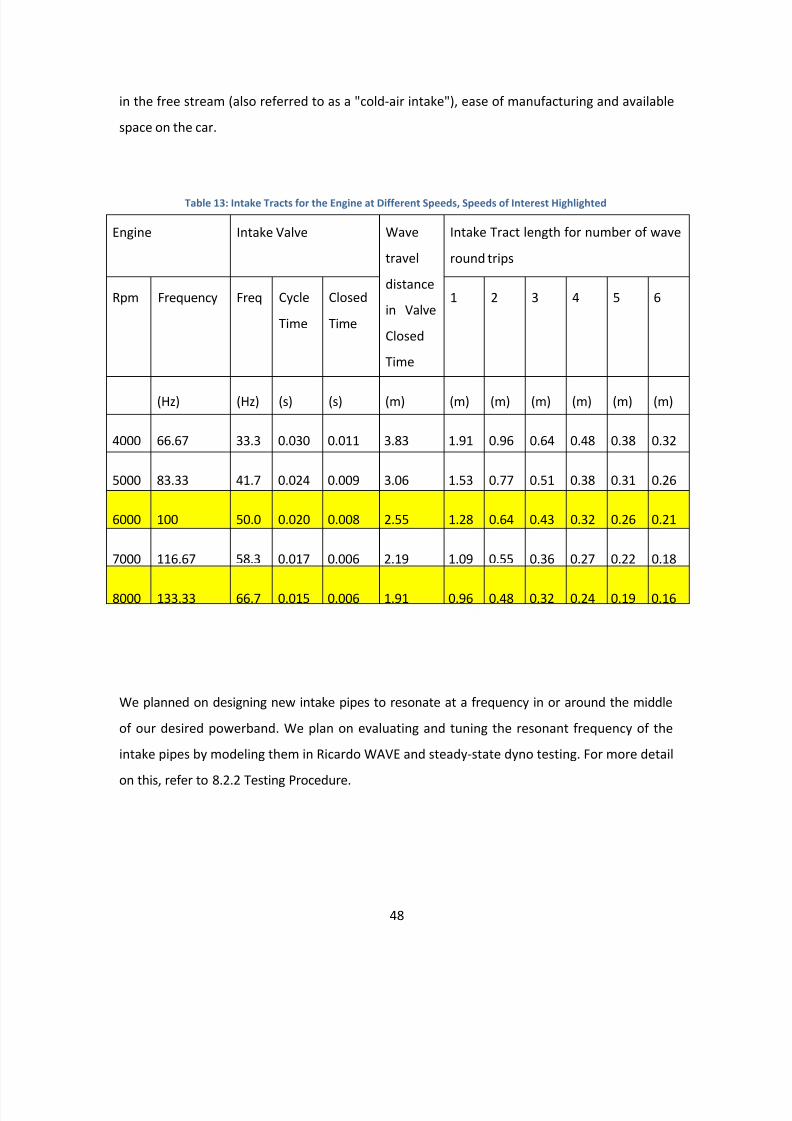
8/10/2019 Ca Poly FormulaSAE Engine Development
http://slidepdf.com/reader/full/ca-poly-formulasae-engine-development 48/142
48
in the free stream (also referred to as a "cold-air intake"), ease of manufacturing and available
space on the car.
Table 13: Intake Tracts for the Engine at Different Speeds, Speeds of Interest Highlighted
Engine Intake Valve Wave
travel
distance
in Valve
Closed
Time
Intake Tract length for number of wave
round trips
Rpm Frequency Freq Cycle
Time
Closed
Time
1 2 3 4 5 6
(Hz) (Hz) (s) (s) (m) (m) (m) (m) (m) (m) (m)
4000 66.67 33.3 0.030 0.011 3.83 1.91 0.96 0.64 0.48 0.38 0.32
5000 83.33 41.7 0.024 0.009 3.06 1.53 0.77 0.51 0.38 0.31 0.26
6000 100 50.0 0.020 0.008 2.55 1.28 0.64 0.43 0.32 0.26 0.21
7000 116.67 58.3 0.017 0.006 2.19 1.09 0.55 0.36 0.27 0.22 0.18
8000 133.33 66.7 0.015 0.006 1.91 0.96 0.48 0.32 0.24 0.19 0.16
We planned on designing new intake pipes to resonate at a frequency in or around the middle
of our desired powerband. We plan on evaluating and tuning the resonant frequency of the
intake pipes by modeling them in Ricardo WAVE and steady-state dyno testing. For more detail
on this, refer to 8.2.2 Testing Procedure.
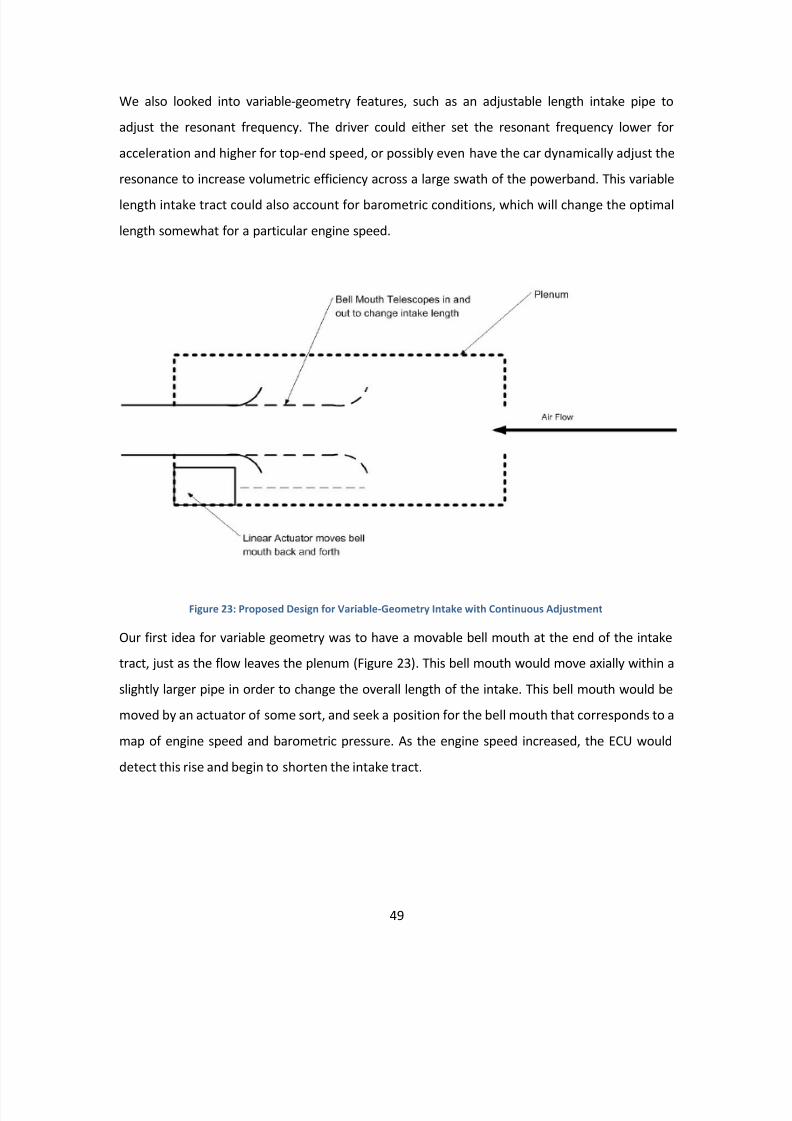
8/10/2019 Ca Poly FormulaSAE Engine Development
http://slidepdf.com/reader/full/ca-poly-formulasae-engine-development 49/142
49
We also looked into variable-geometry features, such as an adjustable length intake pipe to
adjust the resonant frequency. The driver could either set the resonant frequency lower for
acceleration and higher for top-end speed, or possibly even have the car dynamically adjust the
resonance to increase volumetric efficiency across a large swath of the powerband. This variable
length intake tract could also account for barometric conditions, which will change the optimal
length somewhat for a particular engine speed.
Figure 23: Proposed Design for Variable-Geometry Intake with Continuous Adjustment
Our first idea for variable geometry was to have a movable bell mouth at the end of the intake
tract, just as the flow leaves the plenum (Figure 23) . This bell mouth would move axially within a
slightly larger pipe in order to change the overall length of the intake. This bell mouth would be
moved by an actuator of some sort, and seek a position for the bell mouth that corresponds to a
map of engine speed and barometric pressure. As the engine speed increased, the ECU would
detect this rise and begin to shorten the intake tract.
8/10/2019 Ca Poly FormulaSAE Engine Development
http://slidepdf.com/reader/full/ca-poly-formulasae-engine-development 50/142
50
We expect the engine to operate between 4,000 rpm to 8,000 rpm at competition. While the
proposed variable length intake would ideally allow tuning along this entire range, the length
would have to double (or halve) to allow this at one harmonic frequency. One solution to this
would be to switch from one harmonic frequency to another during acceleration. This would
allow the lowest and highest engine speeds to be in resonance, and also reduces greatly the
stroke distance needed.
The current technical problem associated with this first design centered on the actuator itself.
The actuator would need a stroke length of at least 150mm and the ability to traverse through
that stroke length in 0.75 seconds. Most linear actuators are not capable of the combination of
speed and stroke length this application will require, and those that do are prohibitively
expensive and/or prohibitively large. We decided that the effort to locate or fabricate such an
actuator would be excessive for the potential power gain.
We also explored several other conceptual configurations for a variable-geometry intake. These
other configurations were discrete changes from one resonant length to another.
The first of these was to have a smaller Bell Mouth that could mate inside a larger one. The
smaller bell mouth would tilt into and out of contact with the larger, stationary bell mouth.
These could have a long or short configuration (see Figure 69: Tilting Bell Mouth Design, High
Speed (short) Configuration and Figure 70: Tilting Bell Mouth Design, Low Speed (long)
Configuration) . This design could use a servomotor instead of a linear actuator, but we
determined that the tolerance required for it to work properly would require too much of our
limited time.
The second concept was to have both bell mouths stationary in the plenum, and have the ECU
pick between them using a valve. We designed a test piece version (Figure 71) , and also a one-
piece rapid-prototyped final version (Figure 72) . We did not explore these designs due to our
concerns about not being able to fully seal the valves, both at the intake tract to plenum
interface and the intake tract to the atmosphere
.
8/10/2019 Ca Poly FormulaSAE Engine Development
http://slidepdf.com/reader/full/ca-poly-formulasae-engine-development 51/142
51
6.4.2 Working around the Restrictor
The 20mm Restrictor is one of the thorniest problems we face. It greatly reduces the amount ofair the engine can inhale, which provides its own problems of decreased air for combustion, and
also creates additional problems as we attempt to work around it. The most common way to
work around a restrictor is through the use of an intake plenum. The plenum, a chamber in
series with the intake pipes, serves as a reservoir which can buffer out the intake pulse to a
certain extent, which in turn allows the restrictor to see a constant flow rate lower than its
theoretical peak flow rate with no plenum. Unfortunately, the plenum also buffers any pulse
from the throttle body, which greatly reduces throttle response and thus drivability.
Preliminary calculations on the restrictor indicate that with an infinitely large plenum, the
restrictor will reach sonic conditions at around 8,000 rpm. (Table 14 : Restrictor Choked Flow
Calculations) With no plenum, and with the intake flow idealized as a square wave, the restrictor
will reach sonic conditions at around 3,500 rpm, but will not be choked until 11,000 rpm. This
illustrates the value of a plenum, but does little to show us what size will best balance throttle
response with smooth flow. These calculations are summarized in Figure 24 below.
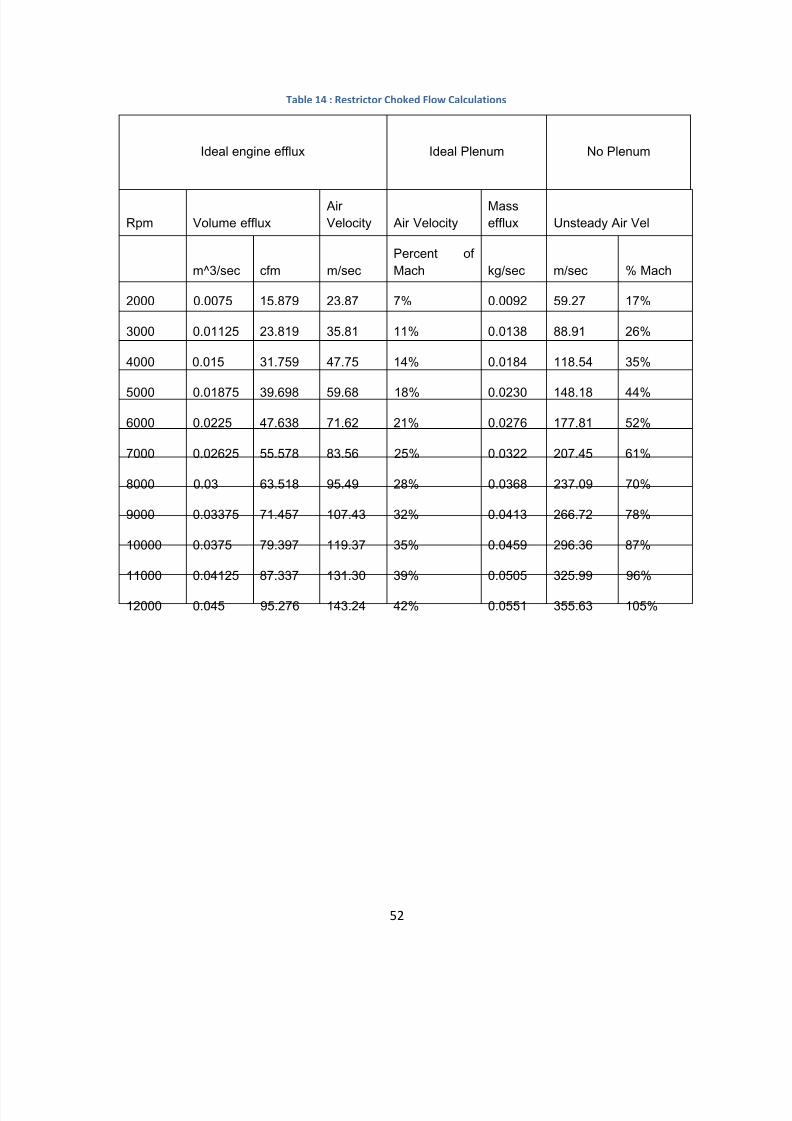
8/10/2019 Ca Poly FormulaSAE Engine Development
http://slidepdf.com/reader/full/ca-poly-formulasae-engine-development 52/142
52
Table 14 : Restrictor Choked Flow Calculations
Ideal engine efflux Ideal Plenum No Plenum
Rpm Volume efflux AirVelocity Air Velocity
Massefflux Unsteady Air Vel
m^3/sec cfm m/secPercent ofMach kg/sec m/sec % Mach
2000 0.0075 15.879 23.87 7% 0.0092 59.27 17%
3000 0.01125 23.819 35.81 11% 0.0138 88.91 26%
4000 0.015 31.759 47.75 14% 0.0184 118.54 35%
5000 0.01875 39.698 59.68 18% 0.0230 148.18 44%
6000 0.0225 47.638 71.62 21% 0.0276 177.81 52%
7000 0.02625 55.578 83.56 25% 0.0322 207.45 61%
8000 0.03 63.518 95.49 28% 0.0368 237.09 70%
9000 0.03375 71.457 107.43 32% 0.0413 266.72 78%
10000 0.0375 79.397 119.37 35% 0.0459 296.36 87%
11000 0.04125 87.337 131.30 39% 0.0505 325.99 96%
12000 0.045 95.276 143.24 42% 0.0551 355.63 105%
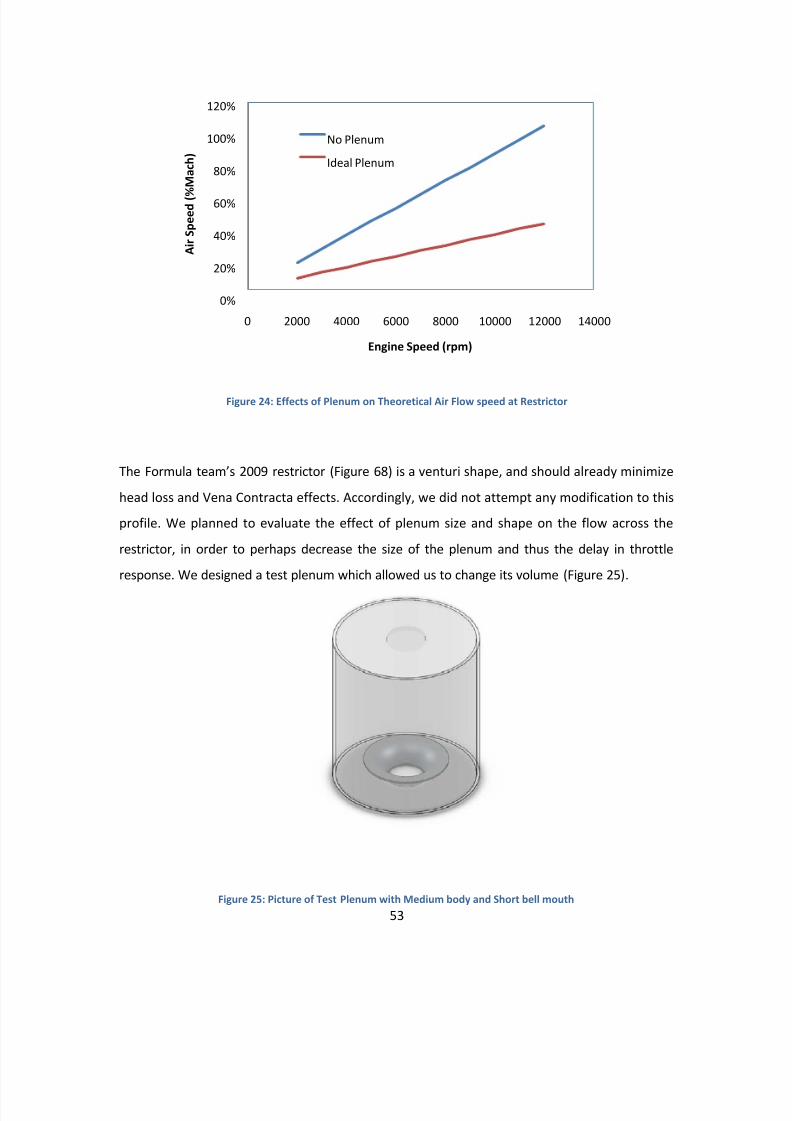
8/10/2019 Ca Poly FormulaSAE Engine Development
http://slidepdf.com/reader/full/ca-poly-formulasae-engine-development 53/142
53
Figure 24: Effects of Plenum on Theoretical Air Flow speed at Restrictor
The Formula team’s 2009 restrictor (Figure 68) is a venturi shape, and should already minimize
head loss and Vena Contracta effects. Accordingly, we did not attempt any modification to this
profile. We planned to evaluate the effect of plenum size and shape on the flow across the
restrictor, in order to perhaps decrease the size of the plenum and thus the delay in throttle
response. We designed a test plenum which allowed us to change its volume (Figure 25) .
Figure 25: Picture of Test Plenum with Medium body and Short bell mouth
0%
20%
40%
60%
80%
100%
120%
0 2000 4000 6000 8000 10000 12000 14000
A i r S p e e d ( %
M a c h
)
Engine Speed (rpm)
No Plenum
Ideal Plenum
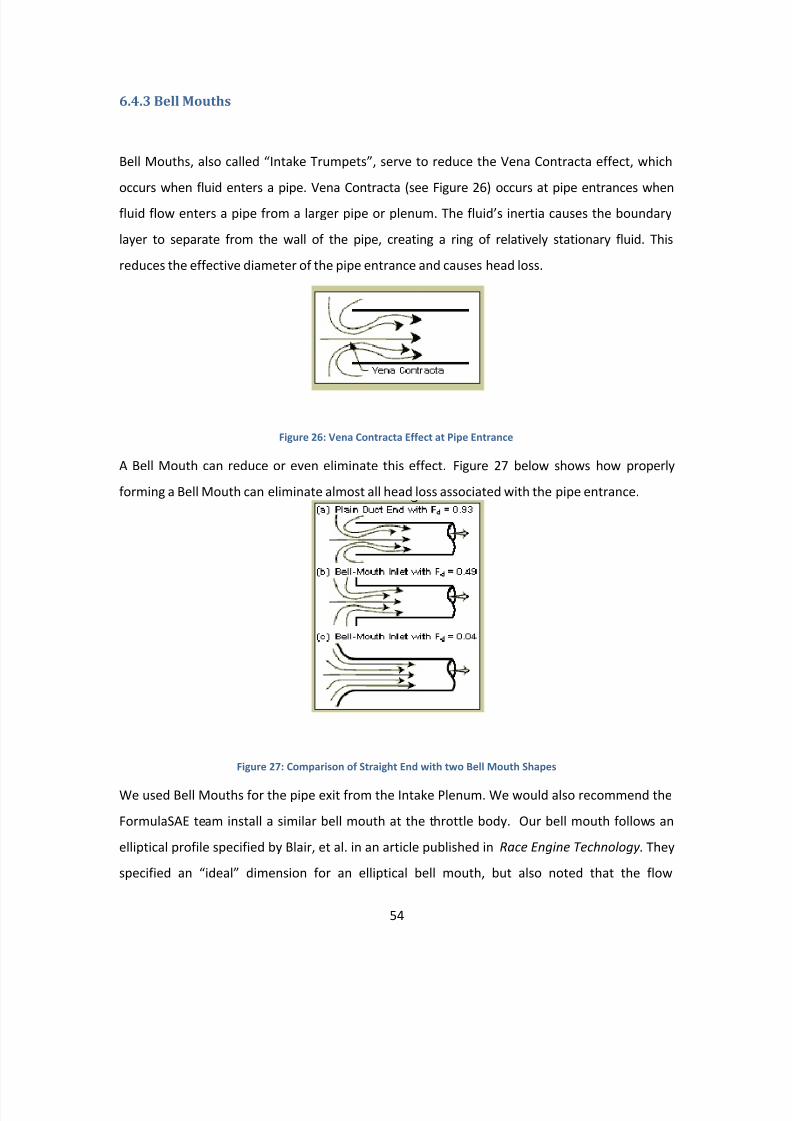
8/10/2019 Ca Poly FormulaSAE Engine Development
http://slidepdf.com/reader/full/ca-poly-formulasae-engine-development 54/142

8/10/2019 Ca Poly FormulaSAE Engine Development
http://slidepdf.com/reader/full/ca-poly-formulasae-engine-development 55/142
55
difference between their “ideal” and a non-ideal was only a percent or two. We used their
profile for our bell mouth designs nonetheless. We designed a short and a long bell mouth,
specified in Figure 73: Drawing of Long Bell Mouth and Figure 74: Drawing of Short Bell Mouth .
The length of the bell mouth feature dictates the intensity of the resonant effect, as well as the
range of its effects, longer bell mouths causing lower intensity effects over broader ranges. For a
more detailed explanation of this phenomenon, see Figure 29 and its accompanying discussion
on page 58.
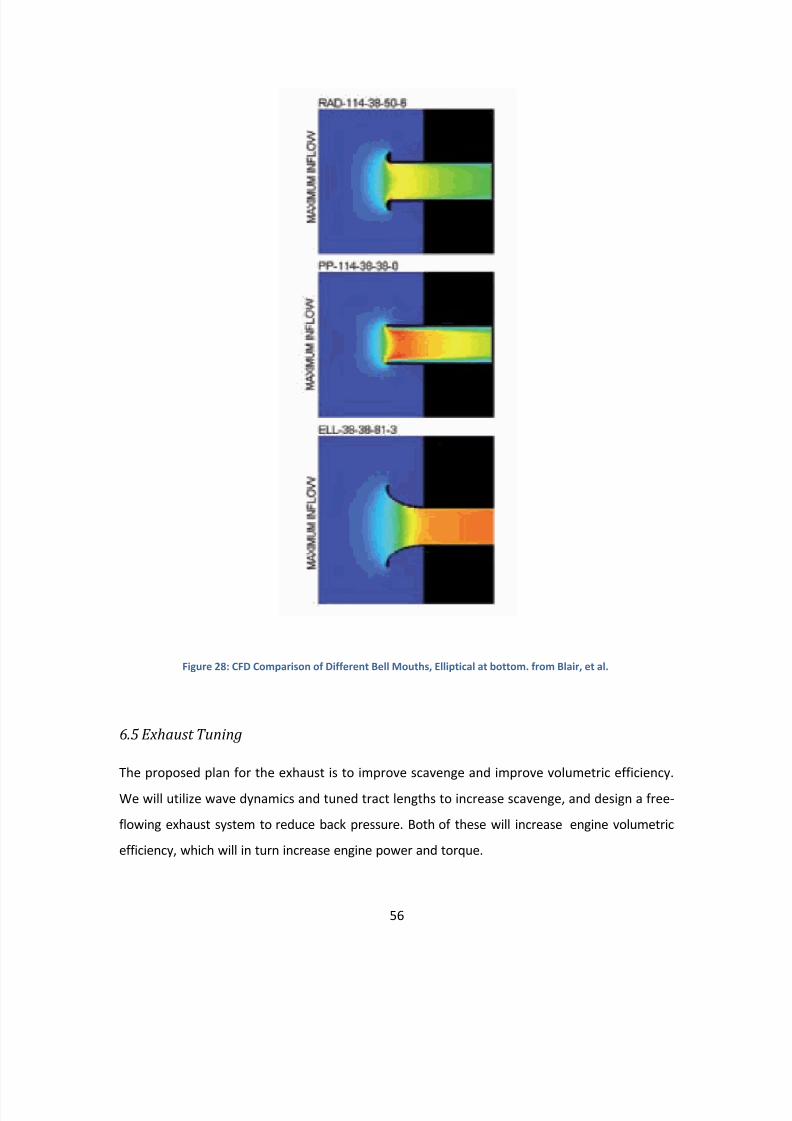
8/10/2019 Ca Poly FormulaSAE Engine Development
http://slidepdf.com/reader/full/ca-poly-formulasae-engine-development 56/142
56
Figure 28: CFD Comparison of Different Bell Mouths, Elliptical at bottom. from Blair, et al.
6.5 Exhaust Tuning
The proposed plan for the exhaust is to improve scavenge and improve volumetric efficiency.
We will utilize wave dynamics and tuned tract lengths to increase scavenge, and design a free-
flowing exhaust system to reduce back pressure. Both of these will increase engine volumetric
efficiency, which will in turn increase engine power and torque.
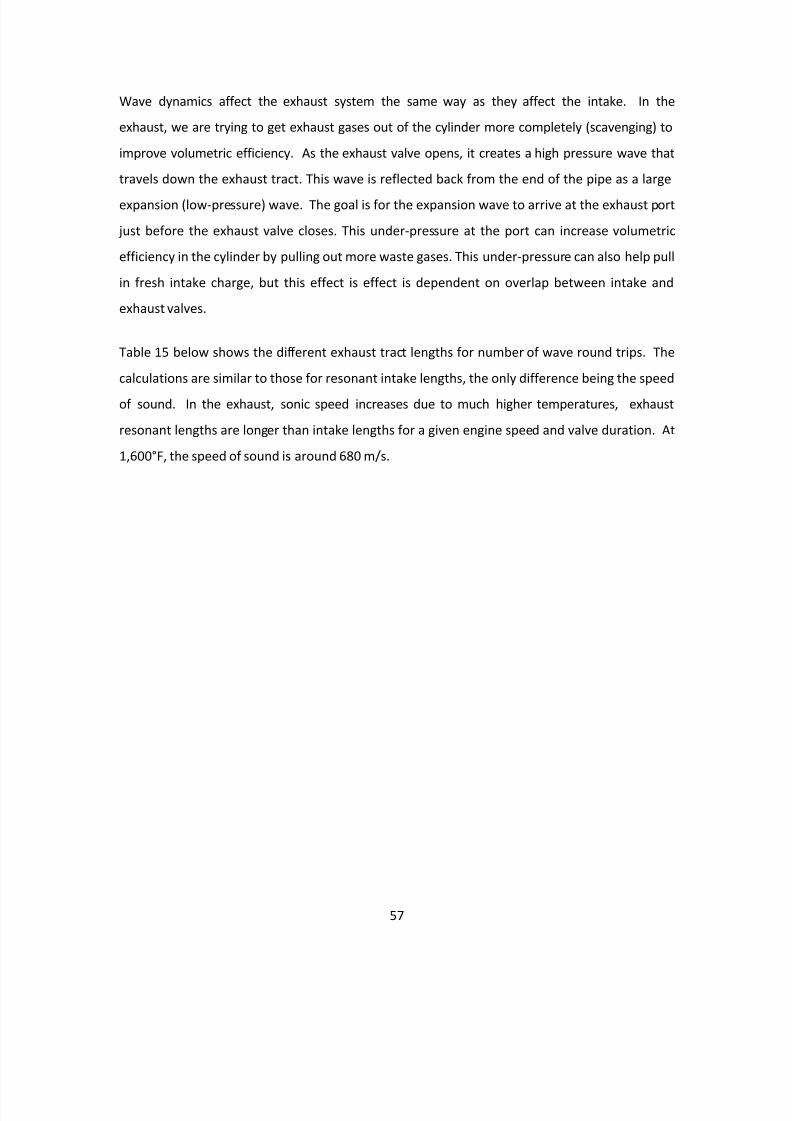
8/10/2019 Ca Poly FormulaSAE Engine Development
http://slidepdf.com/reader/full/ca-poly-formulasae-engine-development 57/142
57
Wave dynamics affect the exhaust system the same way as they affect the intake. In the
exhaust, we are trying to get exhaust gases out of the cylinder more completely (scavenging) to
improve volumetric efficiency. As the exhaust valve opens, it creates a high pressure wave that
travels down the exhaust tract. This wave is reflected back from the end of the pipe as a large
expansion (low-pressure) wave. The goal is for the expansion wave to arrive at the exhaust port
just before the exhaust valve closes. This under-pressure at the port can increase volumetric
efficiency in the cylinder by pulling out more waste gases. This under-pressure can also help pull
in fresh intake charge, but this effect is effect is dependent on overlap between intake and
exhaust valves.
Table 15 below shows the different exhaust tract lengths for number of wave round trips. The
calculations are similar to those for resonant intake lengths, the only difference being the speed
of sound. In the exhaust, sonic speed increases due to much higher temperatures, exhaust
resonant lengths are longer than intake lengths for a given engine speed and valve duration. At
1,600°F, the speed of sound is around 680 m/s.
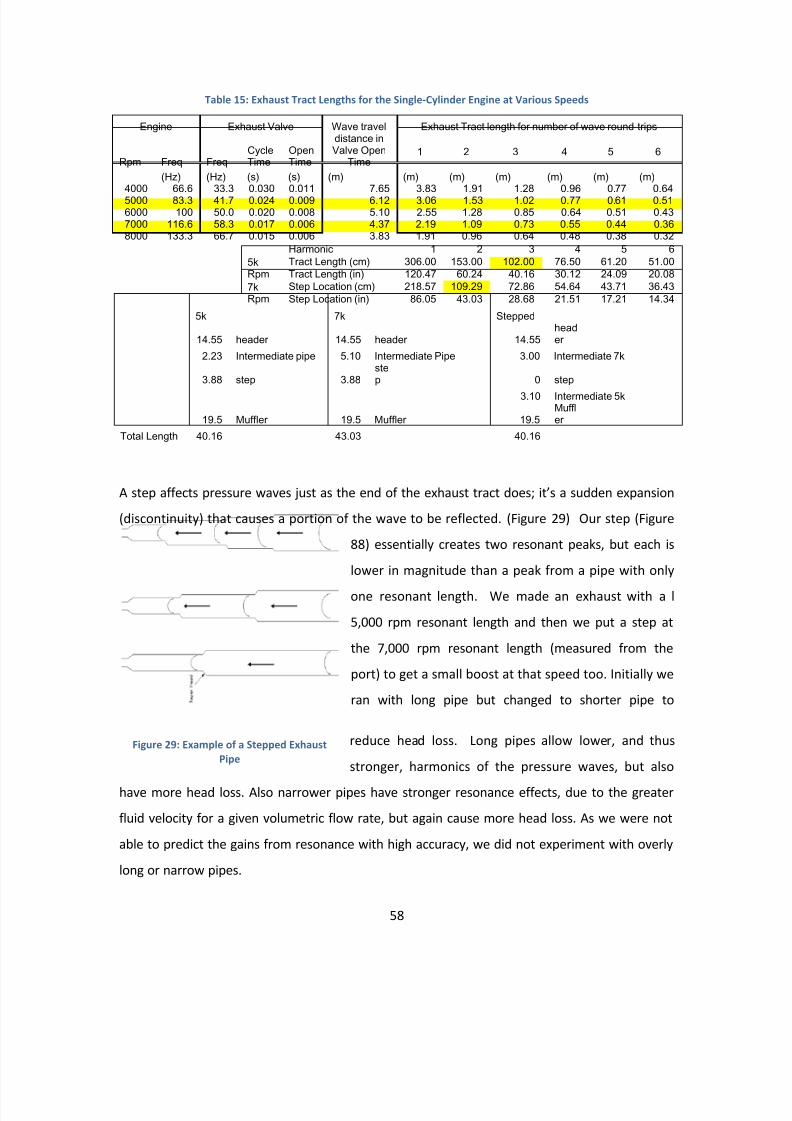
8/10/2019 Ca Poly FormulaSAE Engine Development
http://slidepdf.com/reader/full/ca-poly-formulasae-engine-development 58/142
58
Table 15: Exhaust Tract Lengths for the Single-Cylinder Engine at Various Speeds
Engine Exhaust Valve Wave traveldistance inValve Open
Time
Exhaust Tract length for number of wave round trips
Rpm Freq FreqCycleTime
OpenTime
1 2 3 4 5 6
(Hz) (Hz) (s) (s) (m) (m) (m) (m) (m) (m) (m)4000 66.6 33.3 0.030 0.011 7.65 3.83 1.91 1.28 0.96 0.77 0.645000 83.3 41.7 0.024 0.009 6.12 3.06 1.53 1.02 0.77 0.61 0.516000 100 50.0 0.020 0.008 5.10 2.55 1.28 0.85 0.64 0.51 0.437000 116.6 58.3 0.017 0.006 4.37 2.19 1.09 0.73 0.55 0.44 0.368000 133.3 66.7 0.015 0.006 3.83 1.91 0.96 0.64 0.48 0.38 0.32
Harmonic 1 2 3 4 5 65kRpm
Tract Length (cm) 306.00 153.00 102.00 76.50 61.20 51.00Tract Length (in) 120.47 60.24 40.16 30.12 24.09 20.08
7kRpm
Step Location (cm) 218.57 109.29 72.86 54.64 43.71 36.43Step Location (in) 86.05 43.03 28.68 21.51 17.21 14.34
5k 7k Stepped
14.55 header 14.55 header 14.55header
2.23 Intermediate pipe 5.10 Intermediate Pipe 3.00 Intermediate 7k
3.88 step 3.88step 0 step
3.10 Intermediate 5k
19.5 Muffler 19.5 Muffler 19.5Muffler
Total Length 40.16 43.03 40.16
A step affects pressure waves just as the end of the exhaust tract does; it’s a sudden expansion
(discontinuity) that causes a portion of the wave to be reflected. (Figure 29) Our step (Figure
88) essentially creates two resonant peaks, but each is
lower in magnitude than a peak from a pipe with only
one resonant length. We made an exhaust with a l
5,000 rpm resonant length and then we put a step at
the 7,000 rpm resonant length (measured from the
port) to get a small boost at that speed too. Initially we
ran with long pipe but changed to shorter pipe to
reduce head loss. Long pipes allow lower, and thus
stronger, harmonics of the pressure waves, but also
have more head loss. Also narrower pipes have stronger resonance effects, due to the greater
fluid velocity for a given volumetric flow rate, but again cause more head loss. As we were not
able to predict the gains from resonance with high accuracy, we did not experiment with overly
long or narrow pipes.
Figure 29: Example of a Stepped ExhaustPipe
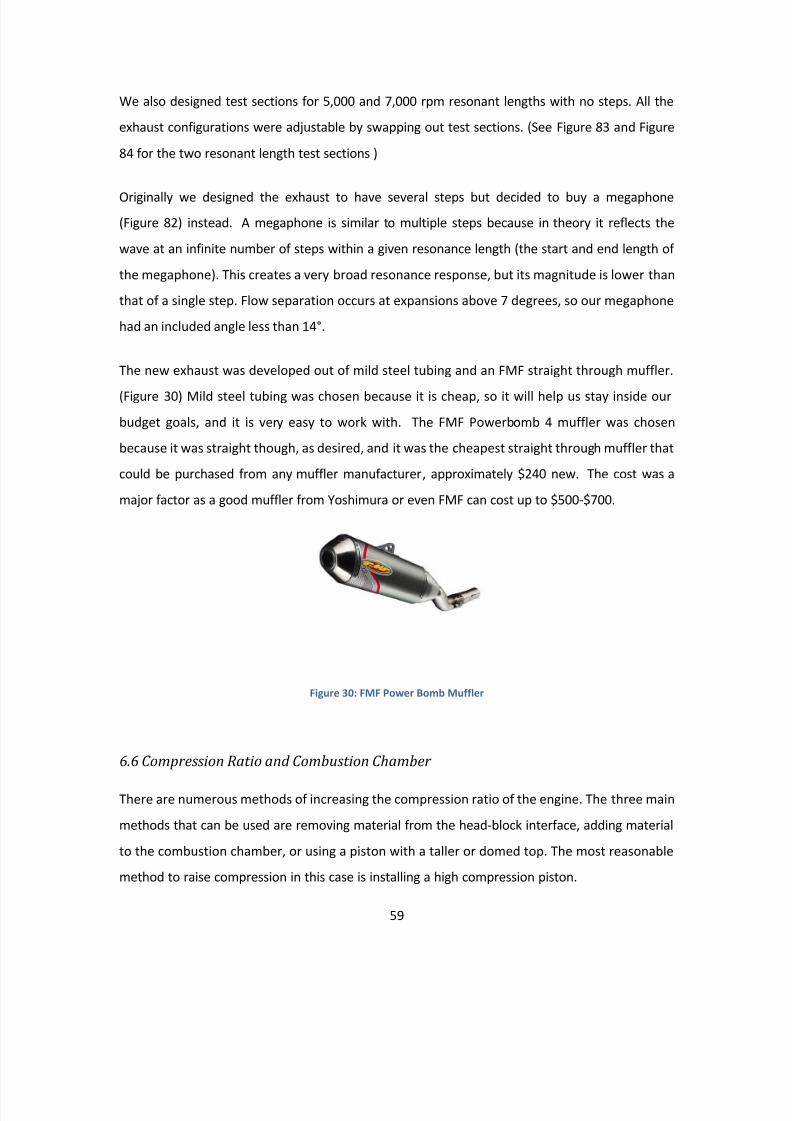
8/10/2019 Ca Poly FormulaSAE Engine Development
http://slidepdf.com/reader/full/ca-poly-formulasae-engine-development 59/142
59
We also designed test sections for 5,000 and 7,000 rpm resonant lengths with no steps. All the
exhaust configurations were adjustable by swapping out test sections. (See Figure 83 and Figure
84 for the two resonant length test sections )
Originally we designed the exhaust to have several steps but decided to buy a megaphone(Figure 82) instead. A megaphone is similar to multiple steps because in theory it reflects the
wave at an infinite number of steps within a given resonance length (the start and end length of
the megaphone). This creates a very broad resonance response, but its magnitude is lower than
that of a single step. Flow separation occurs at expansions above 7 degrees, so our megaphone
had an included angle less than 14°.
The new exhaust was developed out of mild steel tubing and an FMF straight through muffler.
(Figure 30) Mild steel tubing was chosen because it is cheap, so it will help us stay inside our
budget goals, and it is very easy to work with. The FMF Powerbomb 4 muffler was chosen
because it was straight though, as desired, and it was the cheapest straight through muffler that
could be purchased from any muffler manufacturer, approximately $240 new. The cost was a
major factor as a good muffler from Yoshimura or even FMF can cost up to $500-$700.
Figure 30: FMF Power Bomb Muffler
6.6 Compression Ratio and Combustion Chamber
There are numerous methods of increasing the compression ratio of the engine. The three main
methods that can be used are removing material from the head-block interface, adding material
to the combustion chamber, or using a piston with a taller or domed top. The most reasonable
method to raise compression in this case is installing a high compression piston.
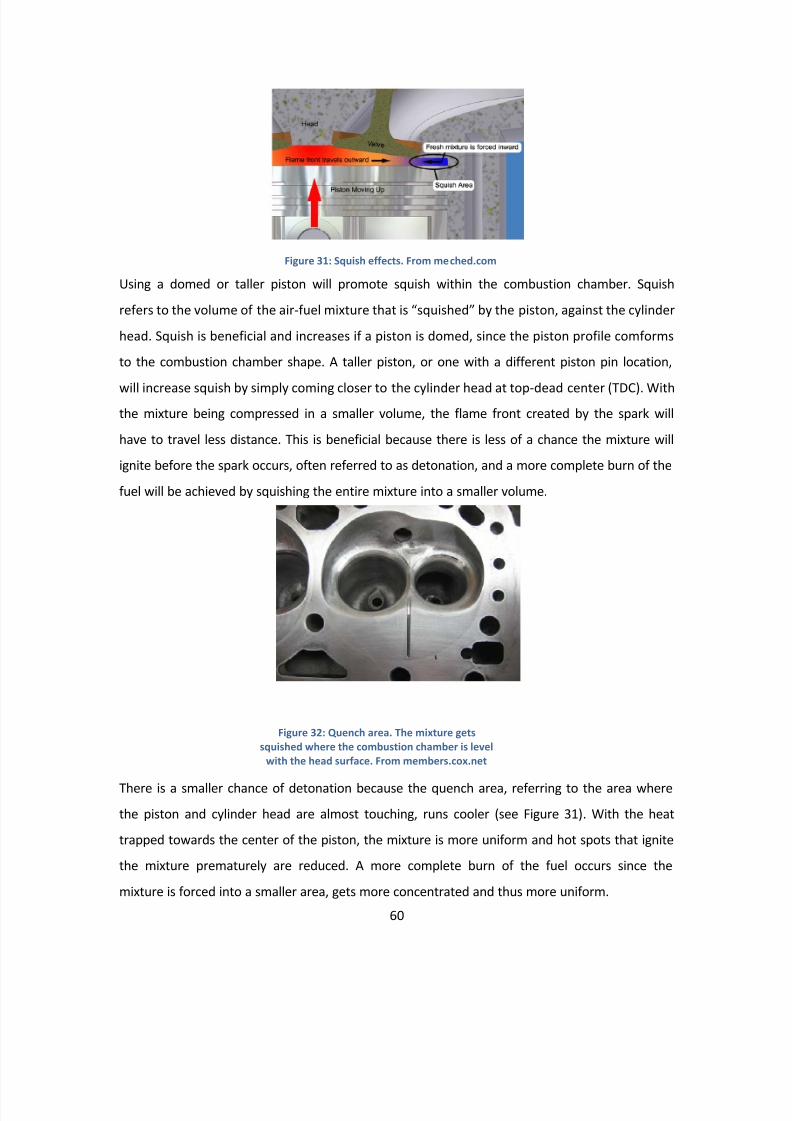
8/10/2019 Ca Poly FormulaSAE Engine Development
http://slidepdf.com/reader/full/ca-poly-formulasae-engine-development 60/142
60
Using a domed or taller piston will promote squish within the combustion chamber. Squish
refers to the volume of the air-fuel mixture that is “squished” by the piston, against the cylinder
head. Squish is beneficial and increases if a piston is domed, since the piston profile comforms
to the combustion chamber shape. A taller piston, or one with a different piston pin location,
will increase squish by simply coming closer to the cylinder head at top-dead center (TDC). Withthe mixture being compressed in a smaller volume, the flame front created by the spark will
have to travel less distance. This is beneficial because there is less of a chance the mixture will
ignite before the spark occurs, often referred to as detonation, and a more complete burn of the
fuel will be achieved by squishing the entire mixture into a smaller volume.
There is a smaller chance of detonation because the quench area, referring to the area where
the piston and cylinder head are almost touching, runs cooler (see Figure 31) . With the heat
trapped towards the center of the piston, the mixture is more uniform and hot spots that ignite
the mixture prematurely are reduced. A more complete burn of the fuel occurs since the
mixture is forced into a smaller area, gets more concentrated and thus more uniform.
Figure 31: Squish effects. From meched.com
Figure 32: Quench area. The mixture getssquished where the combustion chamber is level
with the head surface. From members.cox.net
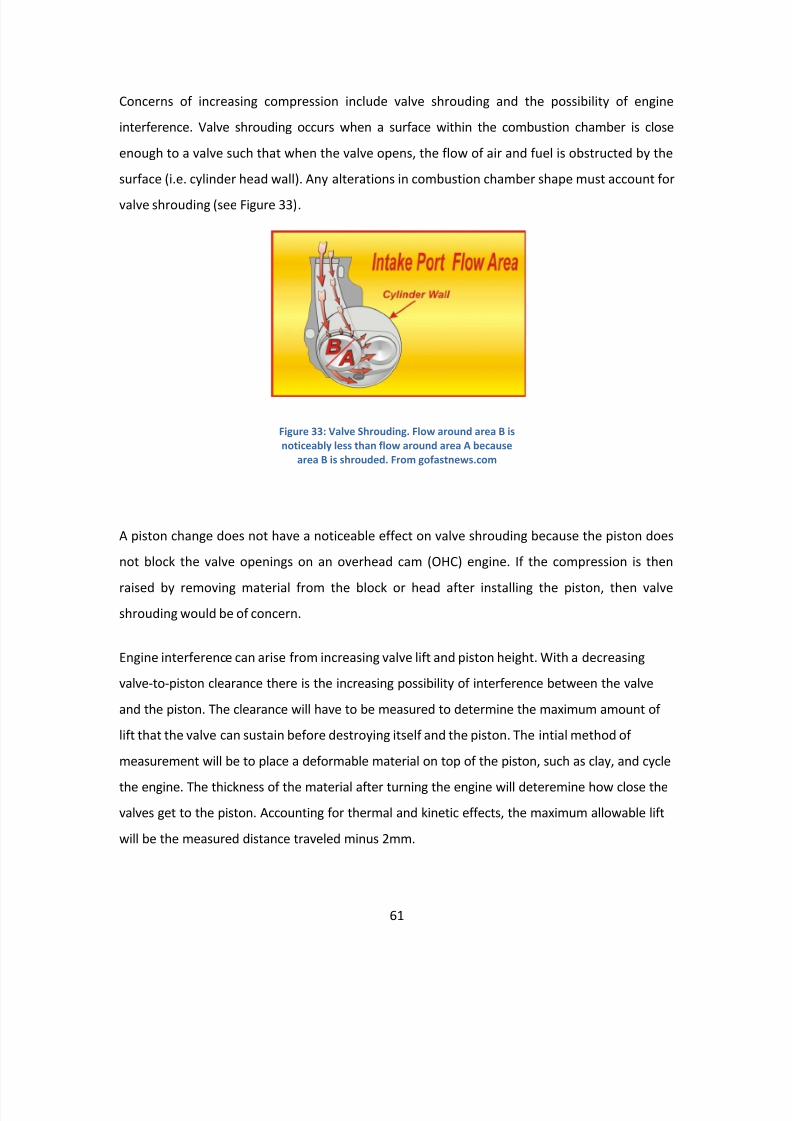
8/10/2019 Ca Poly FormulaSAE Engine Development
http://slidepdf.com/reader/full/ca-poly-formulasae-engine-development 61/142
61
Concerns of increasing compression include valve shrouding and the possibility of engine
interference. Valve shrouding occurs when a surface within the combustion chamber is close
enough to a valve such that when the valve opens, the flow of air and fuel is obstructed by the
surface (i.e. cylinder head wall). Any alterations in combustion chamber shape must account for
valve shrouding (see Figure 33) .
A piston change does not have a noticeable effect on valve shrouding because the piston does
not block the valve openings on an overhead cam (OHC) engine. If the compression is then
raised by removing material from the block or head after installing the piston, then valveshrouding would be of concern.
Engine interference can arise from increasing valve lift and piston height. With a decreasing
valve-to-piston clearance there is the increasing possibility of interference between the valve
and the piston. The clearance will have to be measured to determine the maximum amount of
lift that the valve can sustain before destroying itself and the piston. The intial method of
measurement will be to place a deformable material on top of the piston, such as clay, and cycle
the engine. The thickness of the material after turning the engine will deteremine how close thevalves get to the piston. Accounting for thermal and kinetic effects, the maximum allowable lift
will be the measured distance traveled minus 2mm.
Figure 33: Valve Shrouding. Flow around area B isnoticeably less than flow around area A because
area B is shrouded. From gofastnews.com
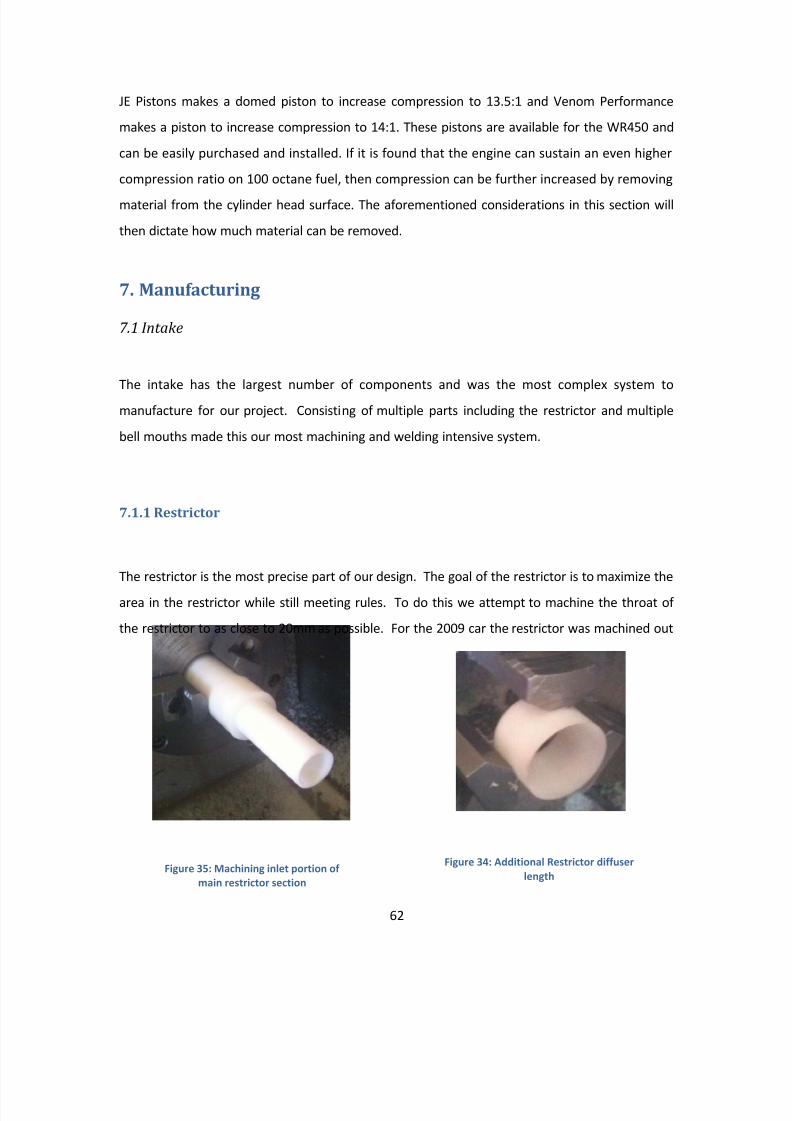
8/10/2019 Ca Poly FormulaSAE Engine Development
http://slidepdf.com/reader/full/ca-poly-formulasae-engine-development 62/142
62
JE Pistons makes a domed piston to increase compression to 13.5:1 and Venom Performance
makes a piston to increase compression to 14:1. These pistons are available for the WR450 and
can be easily purchased and installed. If it is found that the engine can sustain an even higher
compression ratio on 100 octane fuel, then compression can be further increased by removing
material from the cylinder head surface. The aforementioned considerations in this section will
then dictate how much material can be removed.
7. Manufacturing
7.1 Intake
The intake has the largest number of components and was the most complex system to
manufacture for our project. Consisting of multiple parts including the restrictor and multiple
bell mouths made this our most machining and welding intensive system.
7.1.1 Restrictor
The restrictor is the most precise part of our design. The goal of the restrictor is to maximize the
area in the restrictor while still meeting rules. To do this we attempt to machine the throat of
the restrictor to as close to 20mm as possible. For the 2009 car the restrictor was machined out
Figure 34: Additional Restrictor diffuserlength
Figure 35: Machining inlet portion ofmain restrictor section
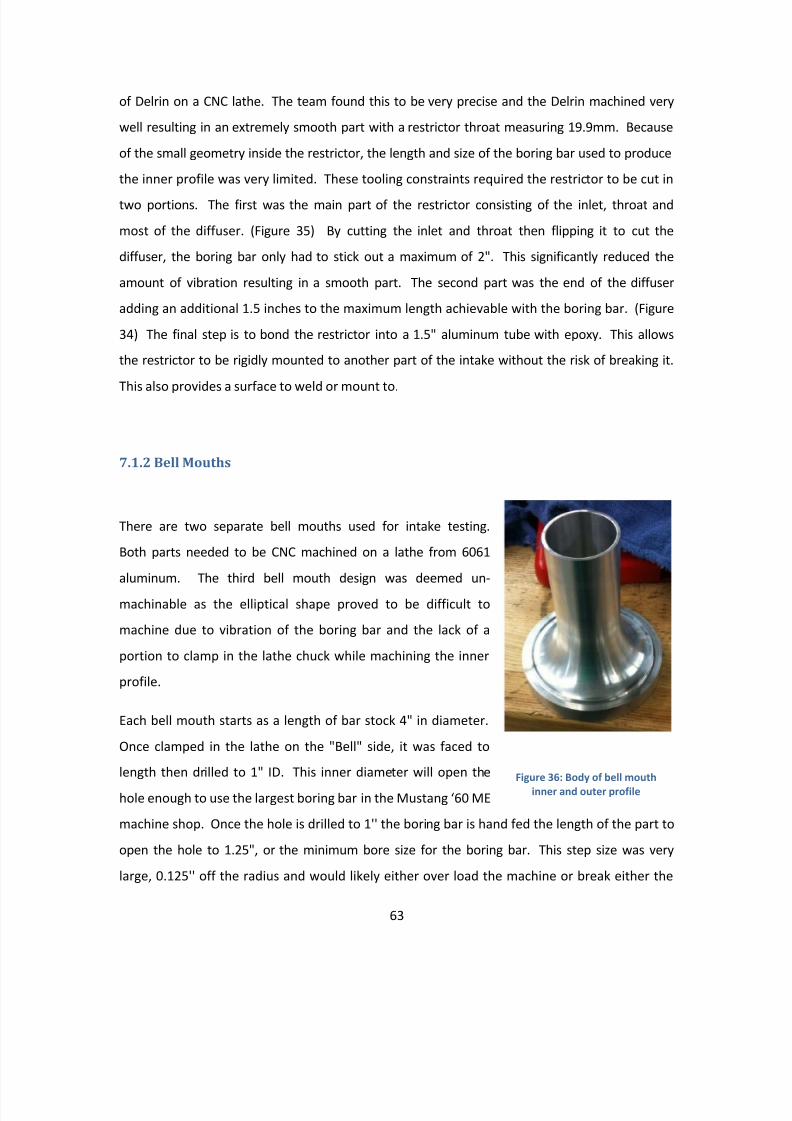
8/10/2019 Ca Poly FormulaSAE Engine Development
http://slidepdf.com/reader/full/ca-poly-formulasae-engine-development 63/142
63
of Delrin on a CNC lathe. The team found this to be very precise and the Delrin machined very
well resulting in an extremely smooth part with a restrictor throat measuring 19.9mm. Because
of the small geometry inside the restrictor, the length and size of the boring bar used to produce
the inner profile was very limited. These tooling constraints required the restrictor to be cut in
two portions. The first was the main part of the restrictor consisting of the inlet, throat and
most of the diffuser. (Figure 35) By cutting the inlet and throat then flipping it to cut the
diffuser, the boring bar only had to stick out a maximum of 2". This significantly reduced the
amount of vibration resulting in a smooth part. The second part was the end of the diffuser
adding an additional 1.5 inches to the maximum length achievable with the boring bar. (Figure
34) The final step is to bond the restrictor into a 1.5" aluminum tube with epoxy. This allows
the restrictor to be rigidly mounted to another part of the intake without the risk of breaking it.
This also provides a surface to weld or mount to.
7.1.2 Bell Mouths
There are two separate bell mouths used for intake testing.
Both parts needed to be CNC machined on a lathe from 6061
aluminum. The third bell mouth design was deemed un-
machinable as the elliptical shape proved to be difficult to
machine due to vibration of the boring bar and the lack of a
portion to clamp in the lathe chuck while machining the inner
profile.
Each bell mouth starts as a length of bar stock 4" in diameter.
Once clamped in the lathe on the "Bell" side, it was faced to
length then drilled to 1" ID. This inner diameter will open the
hole enough to use the largest boring bar in the Mustang ‘60 ME
machine shop. Once the hole is drilled to 1'' the boring bar is hand fed the length of the part to
open the hole to 1.25", or the minimum bore size for the boring bar. This step size was very
large, 0.125'' off the radius and would likely either over load the machine or break either the
Figure 36: Body of bell mouthinner and outer profile
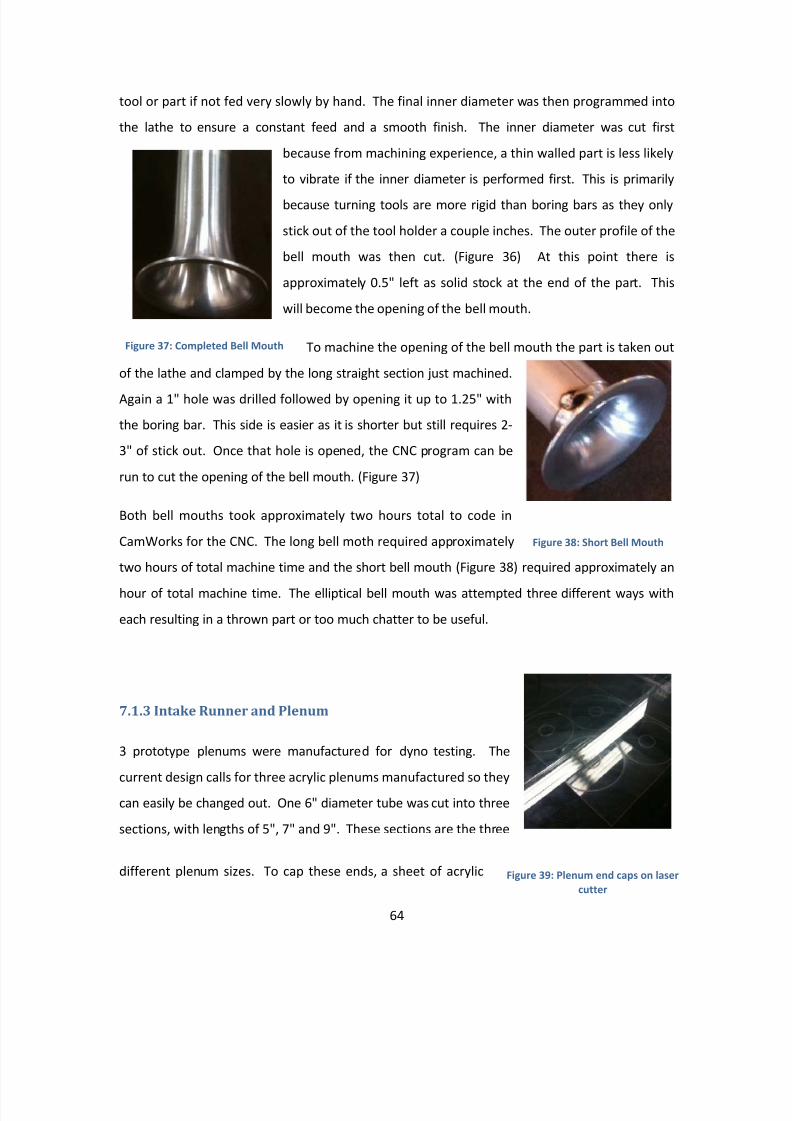
8/10/2019 Ca Poly FormulaSAE Engine Development
http://slidepdf.com/reader/full/ca-poly-formulasae-engine-development 64/142
64
tool or part if not fed very slowly by hand. The final inner diameter was then programmed into
the lathe to ensure a constant feed and a smooth finish. The inner diameter was cut first
because from machining experience, a thin walled part is less likely
to vibrate if the inner diameter is performed first. This is primarily
because turning tools are more rigid than boring bars as they only
stick out of the tool holder a couple inches. The outer profile of the
bell mouth was then cut. (Figure 36) At this point there is
approximately 0.5" left as solid stock at the end of the part. This
will become the opening of the bell mouth.
To machine the opening of the bell mouth the part is taken out
of the lathe and clamped by the long straight section just machined.
Again a 1" hole was drilled followed by opening it up to 1.25" with
the boring bar. This side is easier as it is shorter but still requires 2-
3" of stick out. Once that hole is opened, the CNC program can be
run to cut the opening of the bell mouth. (Figure 37)
Both bell mouths took approximately two hours total to code in
CamWorks for the CNC. The long bell moth required approximately
two hours of total machine time and the short bell mouth (Figure 38) required approximately an
hour of total machine time. The elliptical bell mouth was attempted three different ways with
each resulting in a thrown part or too much chatter to be useful.
7.1.3 Intake Runner and Plenum
3 prototype plenums were manufactured for dyno testing. The
current design calls for three acrylic plenums manufactured so they
can easily be changed out. One 6" diameter tube was cut into three
sections, with lengths of 5", 7" and 9". These sections are the three
different plenum sizes. To cap these ends, a sheet of acrylic
Figure 37: Completed Bell Mouth
Figure 38: Short Bell Mouth
Figure 39: Plenum end caps on lasercutter
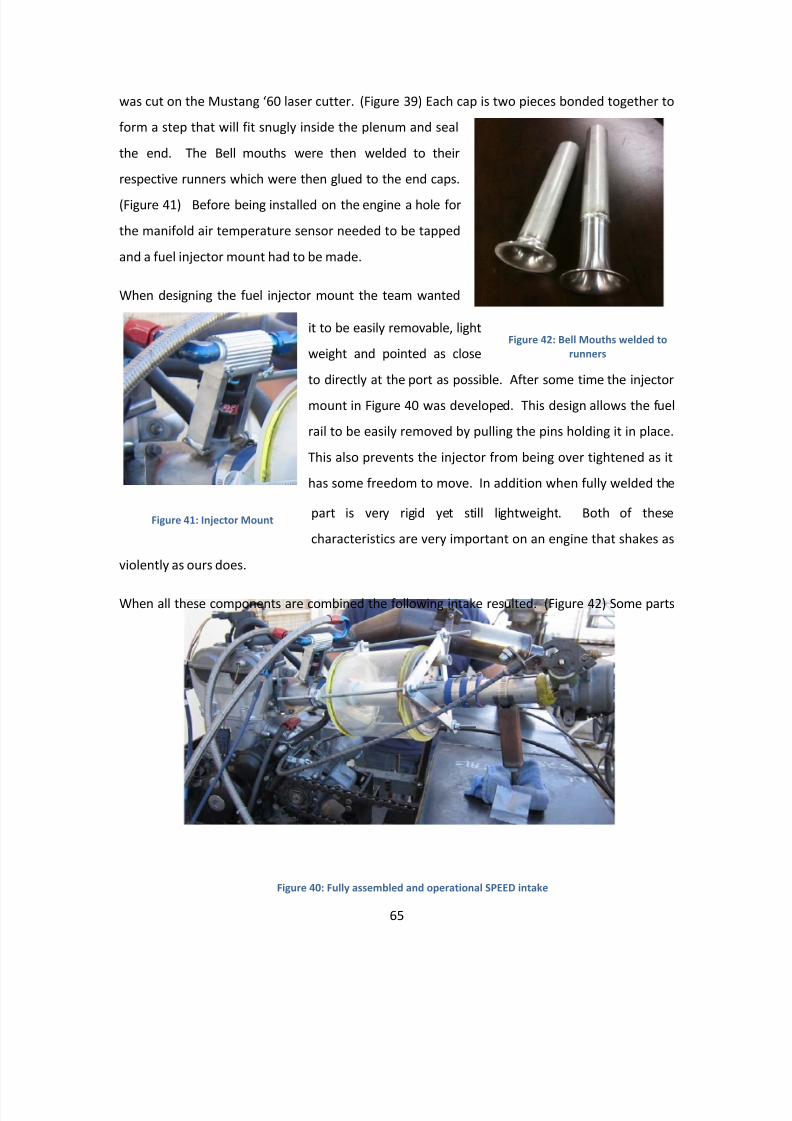
8/10/2019 Ca Poly FormulaSAE Engine Development
http://slidepdf.com/reader/full/ca-poly-formulasae-engine-development 65/142
65
was cut on the Mustang ‘60 laser cutter. (Figure 39) Each cap is two pieces bonded together to
form a step that will fit snugly inside the plenum and seal
the end. The Bell mouths were then welded to their
respective runners which were then glued to the end caps.
(Figure 41) Before being installed on the engine a hole for
the manifold air temperature sensor needed to be tapped
and a fuel injector mount had to be made.
When designing the fuel injector mount the team wanted
it to be easily removable, light
weight and pointed as close
to directly at the port as possible. After some time the injector
mount in Figure 40 was developed. This design allows the fuel
rail to be easily removed by pulling the pins holding it in place.
This also prevents the injector from being over tightened as it
has some freedom to move. In addition when fully welded the
part is very rigid yet still lightweight. Both of these
characteristics are very important on an engine that shakes as
violently as ours does.
When all these components are combined the following intake resulted. (Figure 42) Some parts
Figure 42: Bell Mouths welded torunners
Figure 41: Injector Mount
Figure 40: Fully assembled and operational SPEED intake
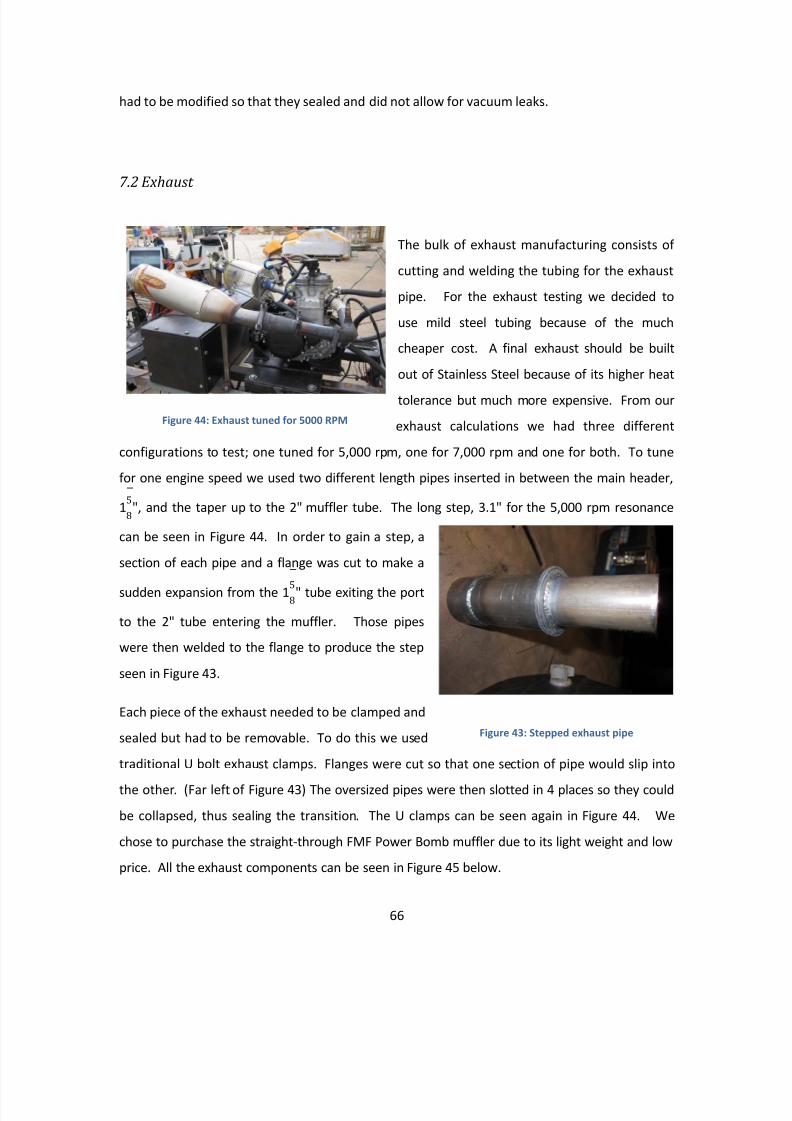
8/10/2019 Ca Poly FormulaSAE Engine Development
http://slidepdf.com/reader/full/ca-poly-formulasae-engine-development 66/142
66
had to be modified so that they sealed and did not allow for vacuum leaks.
7.2 Exhaust
The bulk of exhaust manufacturing consists of
cutting and welding the tubing for the exhaust
pipe. For the exhaust testing we decided to
use mild steel tubing because of the much
cheaper cost. A final exhaust should be built
out of Stainless Steel because of its higher heat
tolerance but much more expensive. From our
exhaust calculations we had three different
configurations to test; one tuned for 5,000 rpm, one for 7,000 rpm and one for both. To tune
for one engine speed we used two different length pipes inserted in between the main header,
15
8", and the taper up to the 2" muffler tube. The long step, 3.1" for the 5,000 rpm resonance
can be seen in Figure 44. In order to gain a step, a
section of each pipe and a flange was cut to make a
sudden expansion from the 1 58" tube exiting the port
to the 2" tube entering the muffler. Those pipes
were then welded to the flange to produce the step
seen in Figure 43.
Each piece of the exhaust needed to be clamped and
sealed but had to be removable. To do this we used
traditional U bolt exhaust clamps. Flanges were cut so that one section of pipe would slip into
the other. (Far left of Figure 43) The oversized pipes were then slotted in 4 places so they could
be collapsed, thus sealing the transition. The U clamps can be seen again in Figure 44. We
chose to purchase the straight-through FMF Power Bomb muffler due to its light weight and low
price. All the exhaust components can be seen in Figure 45 below.
Figure 44: Exhaust tuned for 5000 RPM
Figure 43: Stepped exhaust pipe
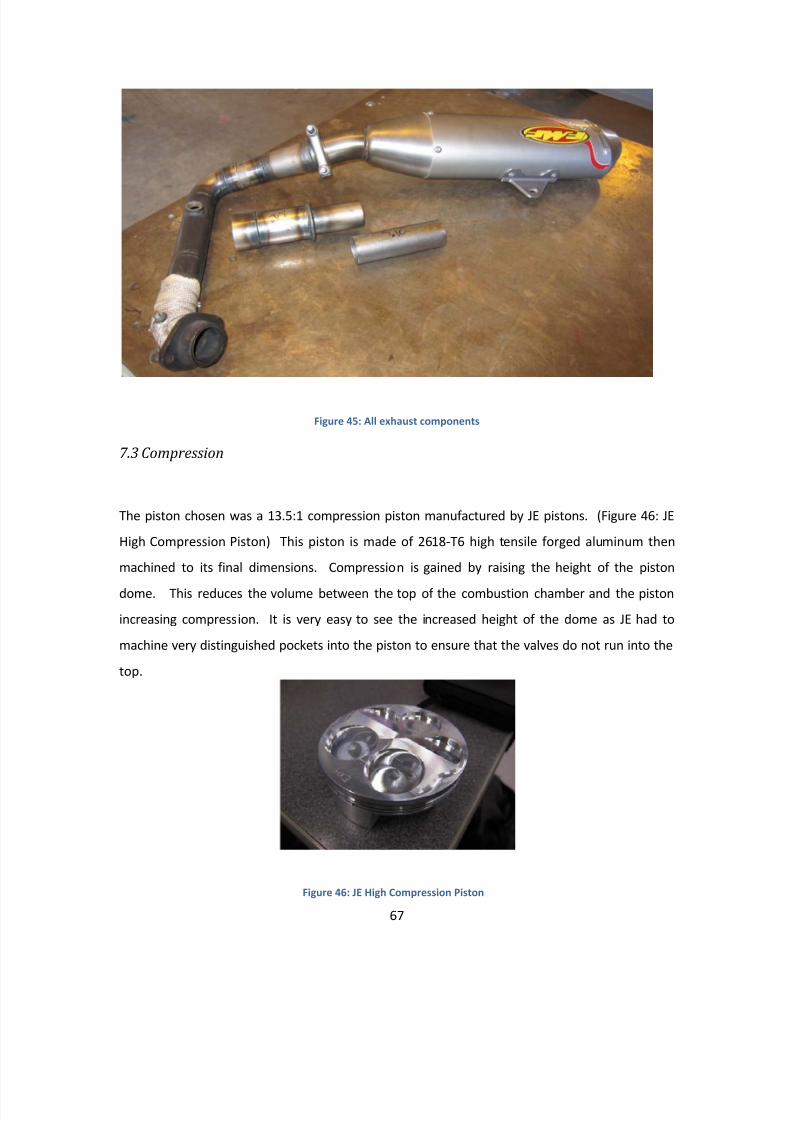
8/10/2019 Ca Poly FormulaSAE Engine Development
http://slidepdf.com/reader/full/ca-poly-formulasae-engine-development 67/142
67
Figure 45: All exhaust components
7.3 Compression
The piston chosen was a 13.5:1 compression piston manufactured by JE pistons. (Figure 46: JE
High Compression Piston) This piston is made of 2618-T6 high tensile forged aluminum then
machined to its final dimensions. Compression is gained by raising the height of the piston
dome. This reduces the volume between the top of the combustion chamber and the piston
increasing compression. It is very easy to see the increased height of the dome as JE had to
machine very distinguished pockets into the piston to ensure that the valves do not run into the
top.
Figure 46: JE High Compression Piston
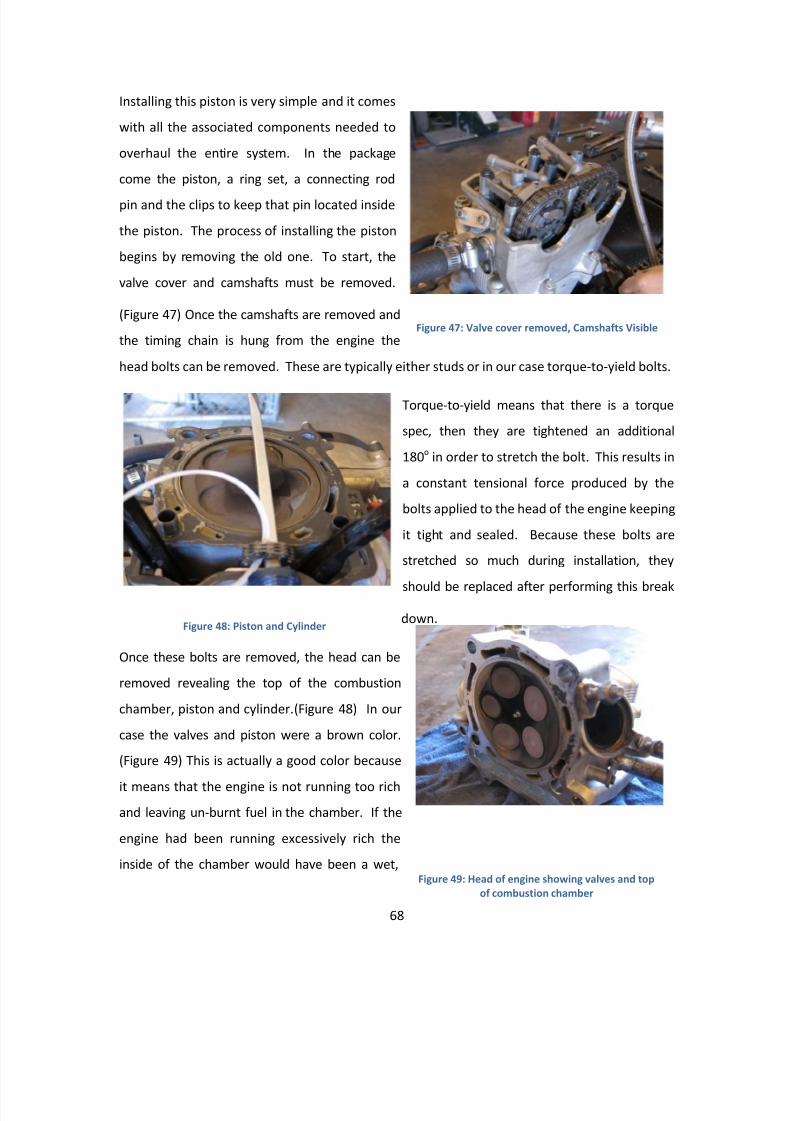
8/10/2019 Ca Poly FormulaSAE Engine Development
http://slidepdf.com/reader/full/ca-poly-formulasae-engine-development 68/142
68
Installing this piston is very simple and it comes
with all the associated components needed to
overhaul the entire system. In the package
come the piston, a ring set, a connecting rod
pin and the clips to keep that pin located inside
the piston. The process of installing the piston
begins by removing the old one. To start, the
valve cover and camshafts must be removed.
(Figure 47) Once the camshafts are removed and
the timing chain is hung from the engine the
head bolts can be removed. These are typically either studs or in our case torque-to-yield bolts.
Torque-to-yield means that there is a torque
spec, then they are tightened an additional
180 o in order to stretch the bolt. This results in
a constant tensional force produced by the
bolts applied to the head of the engine keeping
it tight and sealed. Because these bolts are
stretched so much during installation, they
should be replaced after performing this break
down.
Once these bolts are removed, the head can be
removed revealing the top of the combustion
chamber, piston and cylinder. (Figure 48) In our
case the valves and piston were a brown color.
(Figure 49) This is actually a good color because
it means that the engine is not running too richand leaving un-burnt fuel in the chamber. If the
engine had been running excessively rich the
inside of the chamber would have been a wet,
Figure 47: Valve cover removed, Camshafts Visible
Figure 48: Piston and Cylinder
Figure 49: Head of engine showing valves and topof combustion chamber
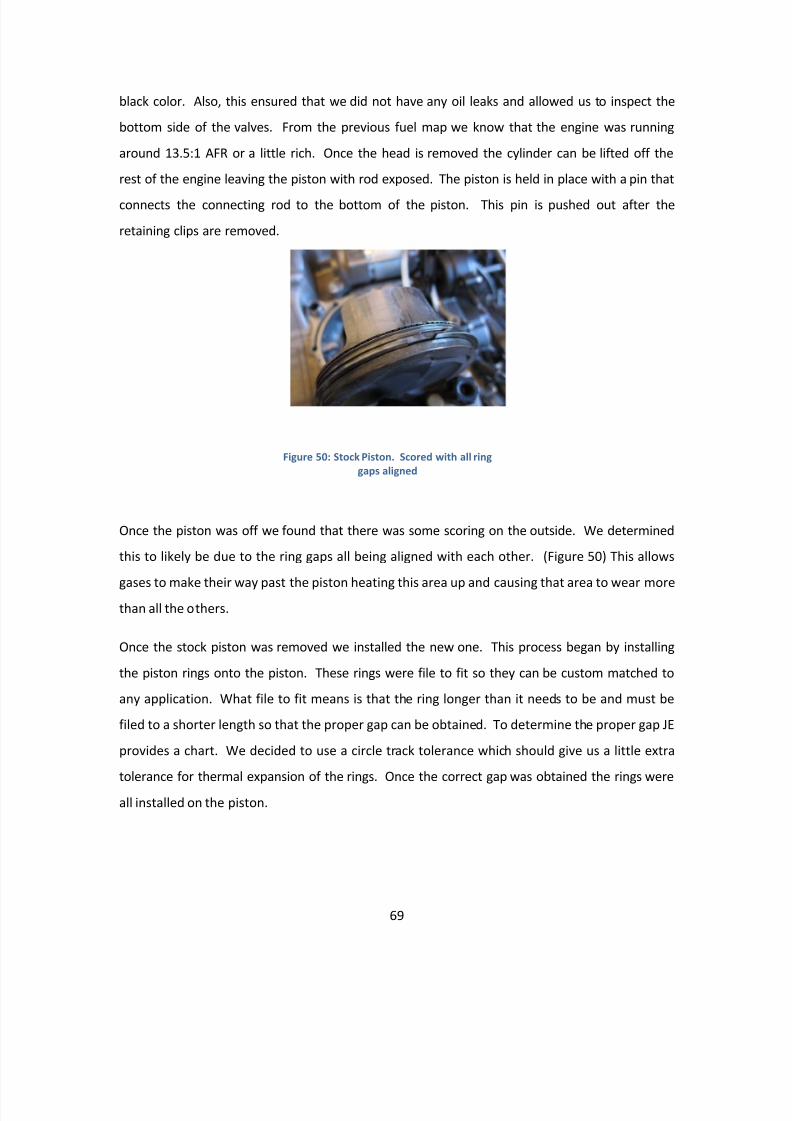
8/10/2019 Ca Poly FormulaSAE Engine Development
http://slidepdf.com/reader/full/ca-poly-formulasae-engine-development 69/142
69
black color. Also, this ensured that we did not have any oil leaks and allowed us to inspect the
bottom side of the valves. From the previous fuel map we know that the engine was running
around 13.5:1 AFR or a little rich. Once the head is removed the cylinder can be lifted off the
rest of the engine leaving the piston with rod exposed. The piston is held in place with a pin that
connects the connecting rod to the bottom of the piston. This pin is pushed out after the
retaining clips are removed.
Once the piston was off we found that there was some scoring on the outside. We determined
this to likely be due to the ring gaps all being aligned with each other. (Figure 50) This allows
gases to make their way past the piston heating this area up and causing that area to wear morethan all the others.
Once the stock piston was removed we installed the new one. This process began by installing
the piston rings onto the piston. These rings were file to fit so they can be custom matched to
any application. What file to fit means is that the ring longer than it needs to be and must be
filed to a shorter length so that the proper gap can be obtained. To determine the proper gap JE
provides a chart. We decided to use a circle track tolerance which should give us a little extra
tolerance for thermal expansion of the rings. Once the correct gap was obtained the rings were
all installed on the piston.
Figure 50: Stock Piston. Scored with all ringgaps aligned
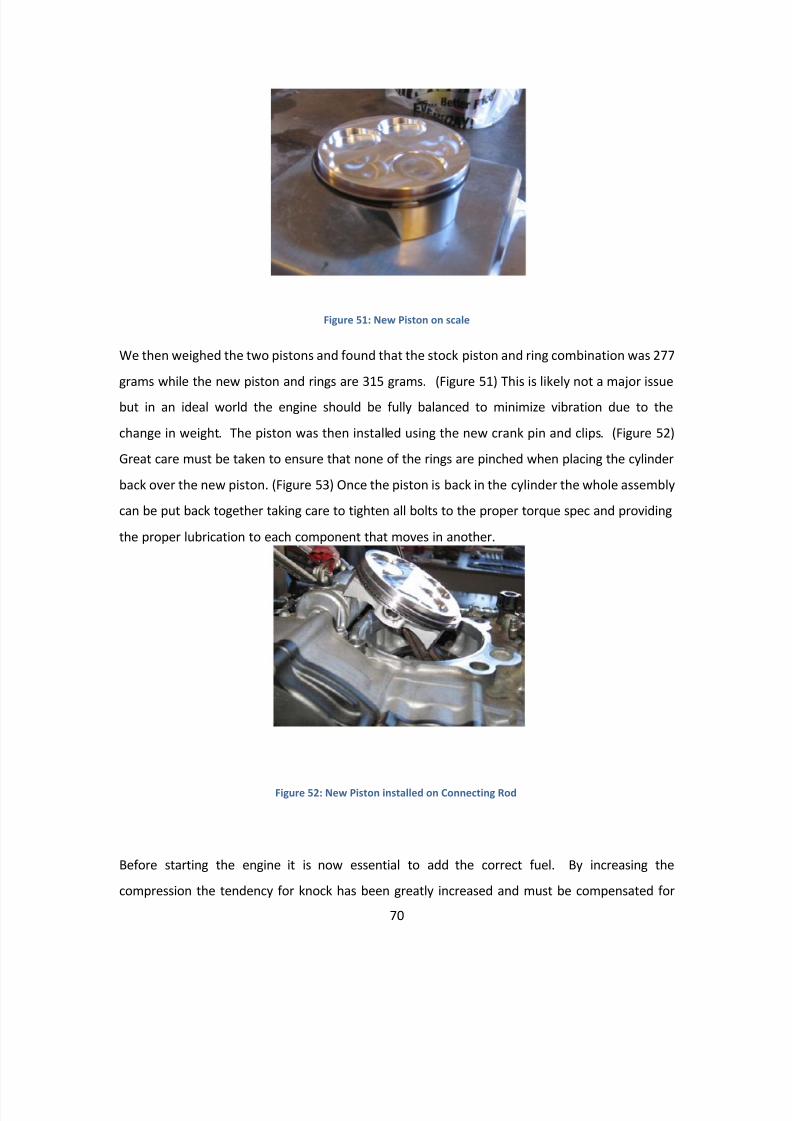
8/10/2019 Ca Poly FormulaSAE Engine Development
http://slidepdf.com/reader/full/ca-poly-formulasae-engine-development 70/142
70
We then weighed the two pistons and found that the stock piston and ring combination was 277
grams while the new piston and rings are 315 grams. (Figure 51) This is likely not a major issue
but in an ideal world the engine should be fully balanced to minimize vibration due to the
change in weight. The piston was then installed using the new crank pin and clips. (Figure 52)
Great care must be taken to ensure that none of the rings are pinched when placing the cylinder
back over the new piston. (Figure 53) Once the piston is back in the cylinder the whole assembly
can be put back together taking care to tighten all bolts to the proper torque spec and providing
the proper lubrication to each component that moves in another.
Before starting the engine it is now essential to add the correct fuel. By increasing the
compression the tendency for knock has been greatly increased and must be compensated for
Figure 51: New Piston on scale
Figure 52: New Piston installed on Connecting Rod
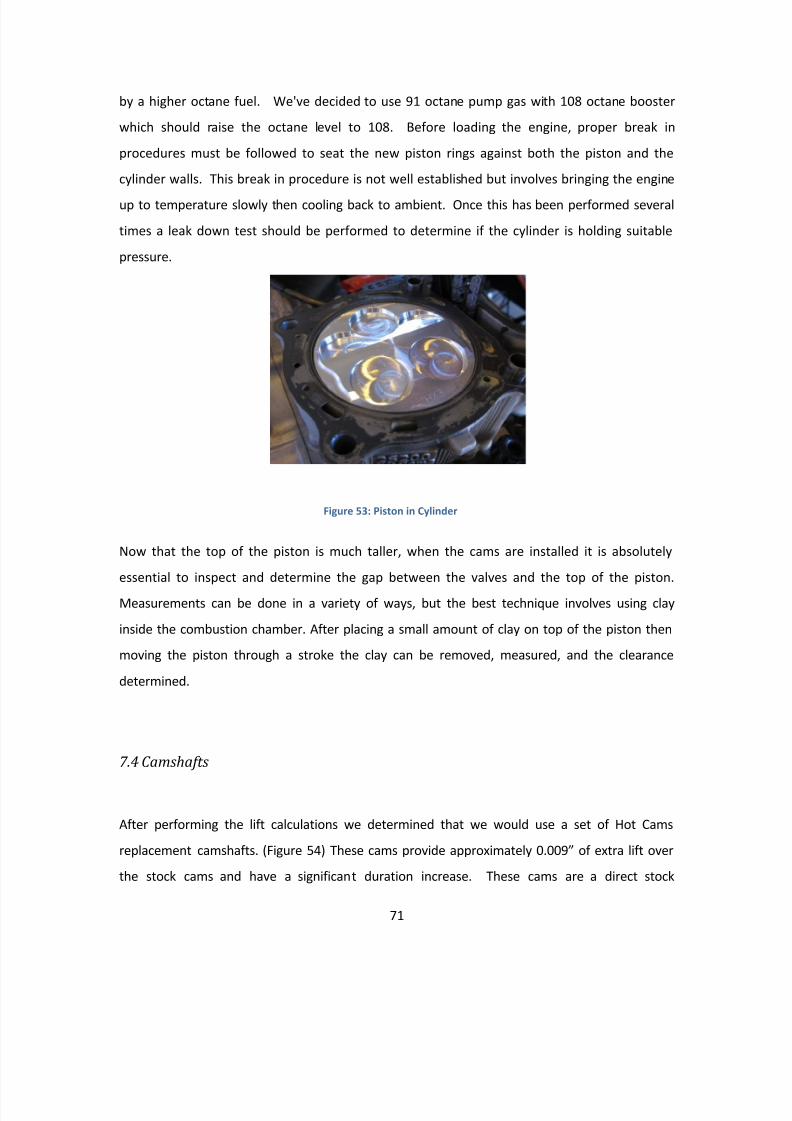
8/10/2019 Ca Poly FormulaSAE Engine Development
http://slidepdf.com/reader/full/ca-poly-formulasae-engine-development 71/142
71
by a higher octane fuel. We've decided to use 91 octane pump gas with 108 octane booster
which should raise the octane level to 108. Before loading the engine, proper break in
procedures must be followed to seat the new piston rings against both the piston and the
cylinder walls. This break in procedure is not well established but involves bringing the engine
up to temperature slowly then cooling back to ambient. Once this has been performed several
times a leak down test should be performed to determine if the cylinder is holding suitable
pressure.
Now that the top of the piston is much taller, when the cams are installed it is absolutely
essential to inspect and determine the gap between the valves and the top of the piston.
Measurements can be done in a variety of ways, but the best technique involves using clay
inside the combustion chamber. After placing a small amount of clay on top of the piston then
moving the piston through a stroke the clay can be removed, measured, and the clearance
determined.
7.4 Camshafts
After performing the lift calculations we determined that we would use a set of Hot Cams
replacement camshafts. (Figure 54) These cams provide approximately 0.009” of extra lift over
the stock cams and have a significant duration increase. These cams are a direct stock
Figure 53: Piston in Cylinder
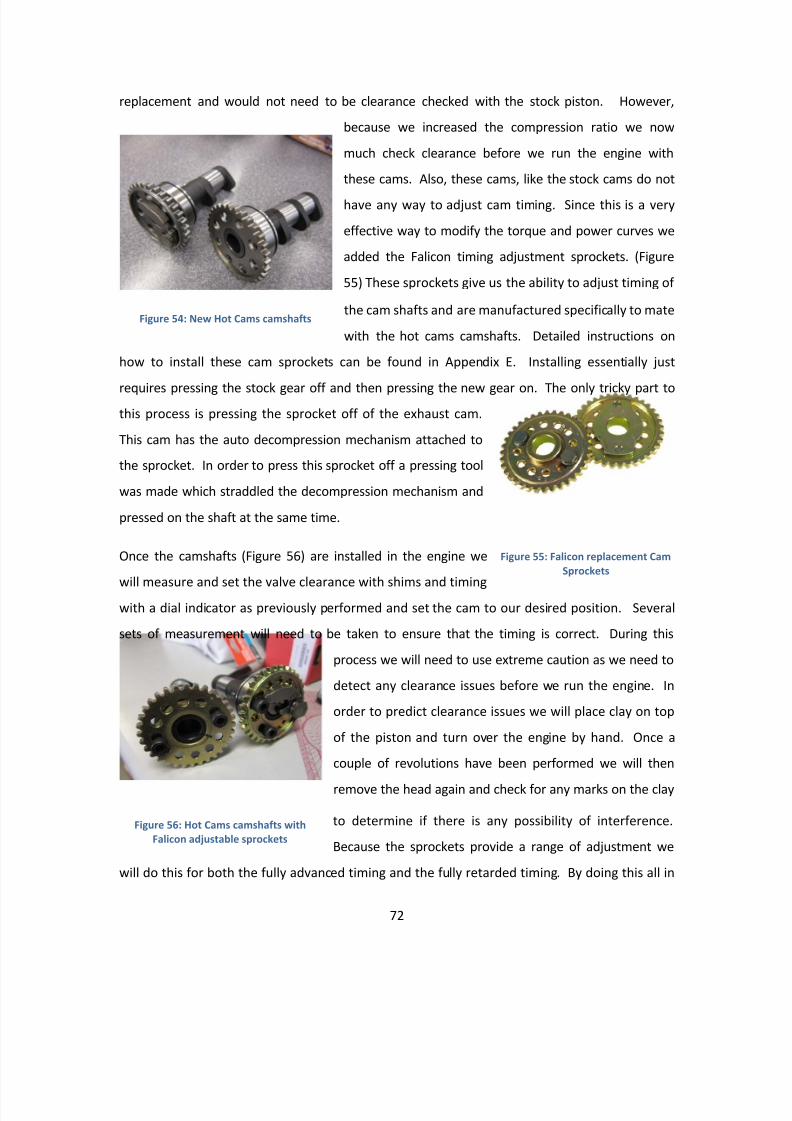
8/10/2019 Ca Poly FormulaSAE Engine Development
http://slidepdf.com/reader/full/ca-poly-formulasae-engine-development 72/142
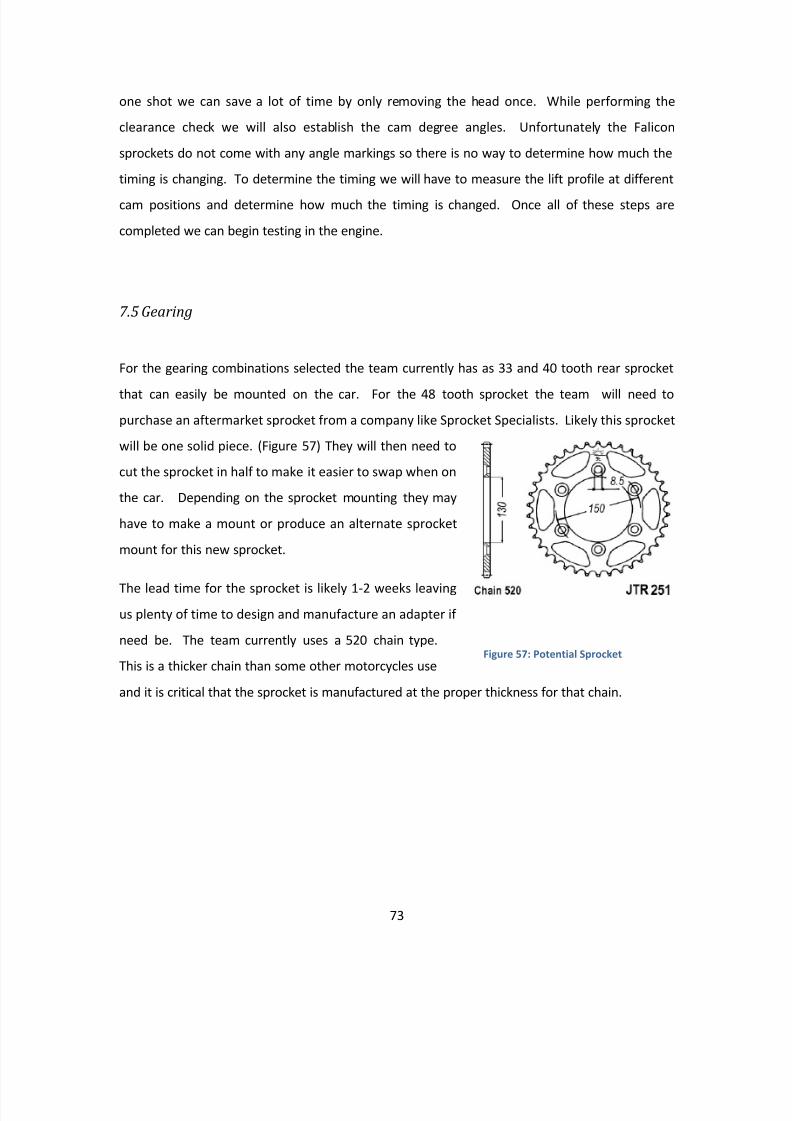
8/10/2019 Ca Poly FormulaSAE Engine Development
http://slidepdf.com/reader/full/ca-poly-formulasae-engine-development 73/142
73
one shot we can save a lot of time by only removing the head once. While performing the
clearance check we will also establish the cam degree angles. Unfortunately the Falicon
sprockets do not come with any angle markings so there is no way to determine how much the
timing is changing. To determine the timing we will have to measure the lift profile at different
cam positions and determine how much the timing is changed. Once all of these steps are
completed we can begin testing in the engine.
7.5 Gearing
For the gearing combinations selected the team currently has as 33 and 40 tooth rear sprocket
that can easily be mounted on the car. For the 48 tooth sprocket the team will need topurchase an aftermarket sprocket from a company like Sprocket Specialists. Likely this sprocket
will be one solid piece. (Figure 57) They will then need to
cut the sprocket in half to make it easier to swap when on
the car. Depending on the sprocket mounting they may
have to make a mount or produce an alternate sprocket
mount for this new sprocket.
The lead time for the sprocket is likely 1-2 weeks leavingus plenty of time to design and manufacture an adapter if
need be. The team currently uses a 520 chain type.
This is a thicker chain than some other motorcycles use
and it is critical that the sprocket is manufactured at the proper thickness for that chain.
Figure 57: Potential Sprocket
8/10/2019 Ca Poly FormulaSAE Engine Development
http://slidepdf.com/reader/full/ca-poly-formulasae-engine-development 74/142
74
8. Testing
As with design the testing portion of the SPEED System's FormulaSAE development project is
broken down into multiple sections, WAVE Model, Dyno and on car testing. Because most ofthe designs are very theoretical and there are not many formulas or rules of thumb to go by so
testing is the main mechanism used to determine trends in component design.
8.1 WAVE Model VerificationIn order to use the WAVE model as a legitimate design tool we must verify that it is accurately
predicting the output of the engine. To verify this we compiled a list of easily testable changes
that can be made while the engine is on the dyno. The current dyno used by the FormulaSAE
team is a water brake dyno with a 50 lb load cell. The engine spins the dyno using a chain and
two sprockets, exactly the way it powers the car. This makes the power recorded from the dyno
very similar to the power actually produced at the wheels by the car.
8.1.1 WAVE Model Verification Testing Plan
While running this test we will be monitoring all the engine systems. We will also be recording
the following:
1) Engine speed - Recorded by Dynomite software
2) Torque - Calculated based on load cell value and lever arm
3) Horsepower - Calculated based on Torque and Engine speed
Due to time constraints we decided to use component testing to validate our designs and our
WAVE model. The major tests were as follows:
1) Increase intake runner length
a) When increasing the intake runner length we are investigating how the power and
torque curves are affected due to the new "tuned" resonance point. When doing
8/10/2019 Ca Poly FormulaSAE Engine Development
http://slidepdf.com/reader/full/ca-poly-formulasae-engine-development 75/142
75
this test we are looking to see where the curves increase and decrease and by how
much. This will quantify how much performance can be gained at various points
from just tuning the intake.
2) Remove Plenum
a) By removing the plenum we hope to quantify how its importance to the car's
performance. While running this test we are extremely interested in determining
when the power starts to drop off due to choked flow through the restrictor. We
expect to see a significant decrease in power from 3500rpm and a sudden drop in
power around 8500rpm. These are the points where the flow theoretically will
become incompressible and choked respectively without a plenum.
3) Increase Muffler length
a) By increasing the length of the muffler we will determine how much of an effect thelength of the exhaust has on the power curve. We are looking for how the power
and torque curves shift as well as how much they shift. We expect that lengthening
the exhaust will increase the torque in the lower rpm range.
4) Remove Muffler
a) By removing the muffler we will quantify what the effect of added restriction in the
exhaust is. Also, this will change the length of the exhaust pipe and will change the
resonance point. This should be noticeable on the powerband in the form of a spike
at a higher rpm.
If by performing the same tests in the model and comparing the curves we can make an
educated decision on the accuracy of the model. To be considered a "verified model" it must
predict the actual engine behavior in the following ways:
1) Engine speed
a) The WAVE model must show the same trends as the dyno. If the dyno shows an
increase in power or torque at a certain rpm then the dyno must also show an
increase in the same area within 5% of the given RPM. Ex. if the dyno shows a
horsepower increase from 4000-5000 rpm then the WAVE model must also show an
increase beginning from 3800-4200 rpm and ending at 4750-5250 rpm.
2) Horsepower and Torque
8/10/2019 Ca Poly FormulaSAE Engine Development
http://slidepdf.com/reader/full/ca-poly-formulasae-engine-development 76/142
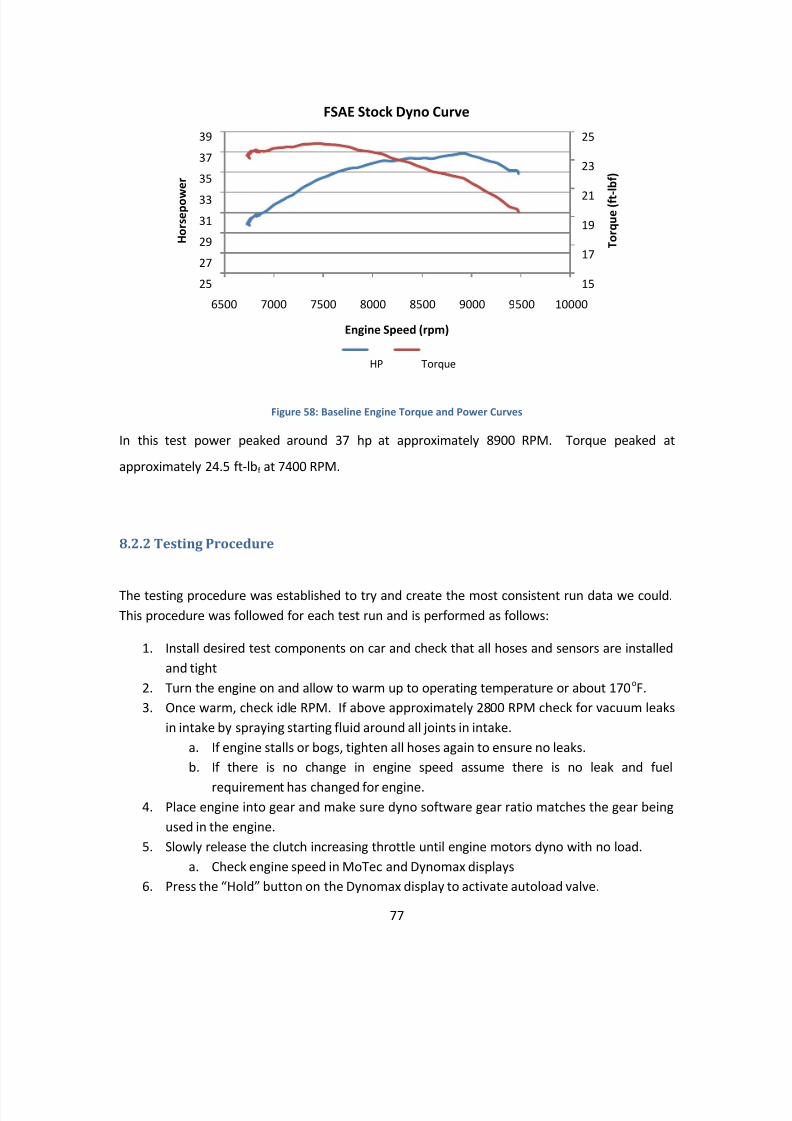
8/10/2019 Ca Poly FormulaSAE Engine Development
http://slidepdf.com/reader/full/ca-poly-formulasae-engine-development 77/142
77
Figure 58: Baseline Engine Torque and Power Curves
In this test power peaked around 37 hp at approximately 8900 RPM. Torque peaked at
approximately 24.5 ft-lb f at 7400 RPM.
8.2.2 Testing Procedure
The testing procedure was established to try and create the most consistent run data we could.This procedure was followed for each test run and is performed as follows:
1. Install desired test components on car and check that all hoses and sensors are installedand tight
2. Turn the engine on and allow to warm up to operating temperature or about 170 oF.3. Once warm, check idle RPM. If above approximately 2800 RPM check for vacuum leaks
in intake by spraying starting fluid around all joints in intake.a. If engine stalls or bogs, tighten all hoses again to ensure no leaks.b. If there is no change in engine speed assume there is no leak and fuel
requirement has changed for engine.4. Place engine into gear and make sure dyno software gear ratio matches the gear being
used in the engine.5. Slowly release the clutch increasing throttle until engine motors dyno with no load.
a. Check engine speed in MoTec and Dynomax displays6. Press the “Hold” button on the Dynomax display to activate autoload valve.
15
17
19
21
23
25
25
27
29
3133
35
37
39
6500 7000 7500 8000 8500 9000 9500 10000
T o r q u e
( f t - l b
f )
H o r s e p o w
e r
Engine Speed (rpm)
FSAE Stock Dyno Curve
HP Torque
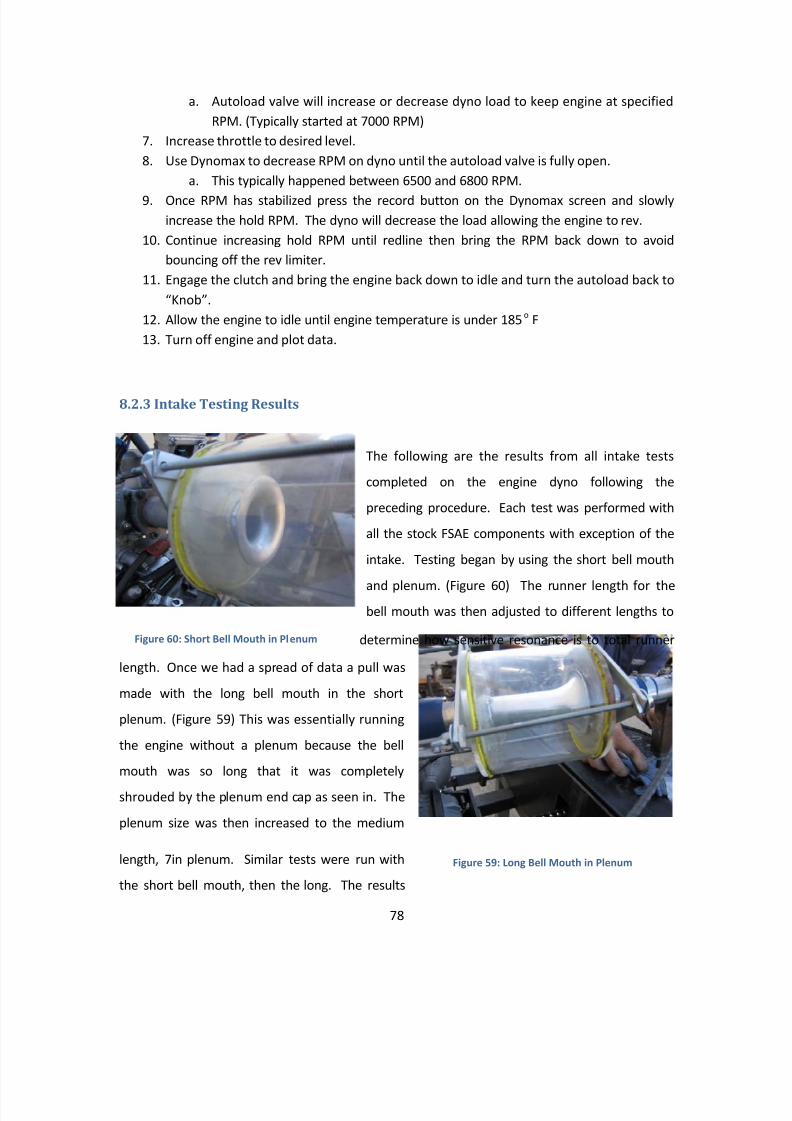
8/10/2019 Ca Poly FormulaSAE Engine Development
http://slidepdf.com/reader/full/ca-poly-formulasae-engine-development 78/142
78
a. Autoload valve will increase or decrease dyno load to keep engine at specifiedRPM. (Typically started at 7000 RPM)
7. Increase throttle to desired level.8. Use Dynomax to decrease RPM on dyno until the autoload valve is fully open.
a. This typically happened between 6500 and 6800 RPM.
9. Once RPM has stabilized press the record button on the Dynomax screen and slowlyincrease the hold RPM. The dyno will decrease the load allowing the engine to rev.
10. Continue increasing hold RPM until redline then bring the RPM back down to avoidbouncing off the rev limiter.
11. Engage the clutch and bring the engine back down to idle and turn the autoload back to“Knob”.
12. Allow the engine to idle until engine temperature is under 185 o F13. Turn off engine and plot data.
8.2.3 Intake Testing Results
The following are the results from all intake tests
completed on the engine dyno following the
preceding procedure. Each test was performed with
all the stock FSAE components with exception of the
intake. Testing began by using the short bell mouth
and plenum. (Figure 60) The runner length for thebell mouth was then adjusted to different lengths to
determine how sensitive resonance is to total runner
length. Once we had a spread of data a pull was
made with the long bell mouth in the short
plenum. (Figure 59) This was essentially running
the engine without a plenum because the bell
mouth was so long that it was completely
shrouded by the plenum end cap as seen in. The
plenum size was then increased to the medium
length, 7in plenum. Similar tests were run with
the short bell mouth, then the long. The results
Figure 60: Short Bell Mouth in Plenum
Figure 59: Long Bell Mouth in Plenum
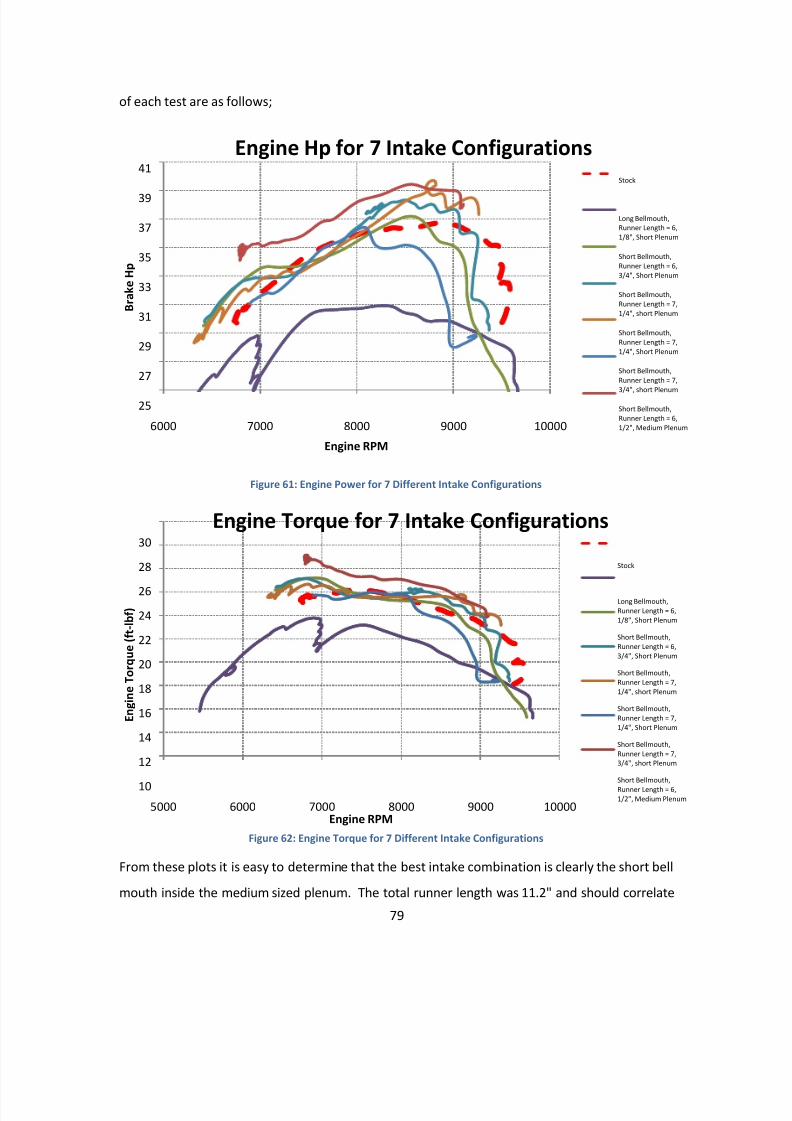
8/10/2019 Ca Poly FormulaSAE Engine Development
http://slidepdf.com/reader/full/ca-poly-formulasae-engine-development 79/142
79
of each test are as follows;
Figure 61: Engine Power for 7 Different Intake Configurations
Figure 62: Engine Torque for 7 Different Intake Configurations
From these plots it is easy to determine that the best intake combination is clearly the short bell
mouth inside the medium sized plenum. The total runner length was 11.2" and should correlate
25
27
29
31
33
35
37
39
41
6000 7000 8000 9000 10000
B r a k e H p
Engine RPM
Engine Hp for 7 Intake ConfigurationsStock
Long Bellmouth,Runner Length = 6,1/8", Short Plenum
Short Bellmouth,Runner Length = 6,3/4", Short Plenum
Short Bellmouth,Runner Length = 7,1/4", short Plenum
Short Bellmouth,Runner Length = 7,1/4", Short Plenum
Short Bellmouth,Runner Length = 7,
3/4", short Plenum
Short Bellmouth,Runner Length = 6,1/2", Medium Plenum
10
12
14
16
18
20
22
24
26
28
30
5000 6000 7000 8000 9000 10000
E n g i n e T o r q u e
( f t - l b f )
Engine RPM
Engine Torque for 7 Intake Configurations
Stock
Long Bellmouth,Runner Length = 6,1/8", Short Plenum
Short Bellmouth,Runner Length = 6,3/4", Short Plenum
Short Bellmouth,Runner Length = 7,1/4", short Plenum
Short Bellmouth,Runner Length = 7,1/4", Short Plenum
Short Bellmouth,Runner Length = 7,3/4", short Plenum
Short Bellmouth,Runner Length = 6,1/2", Medium Plenum
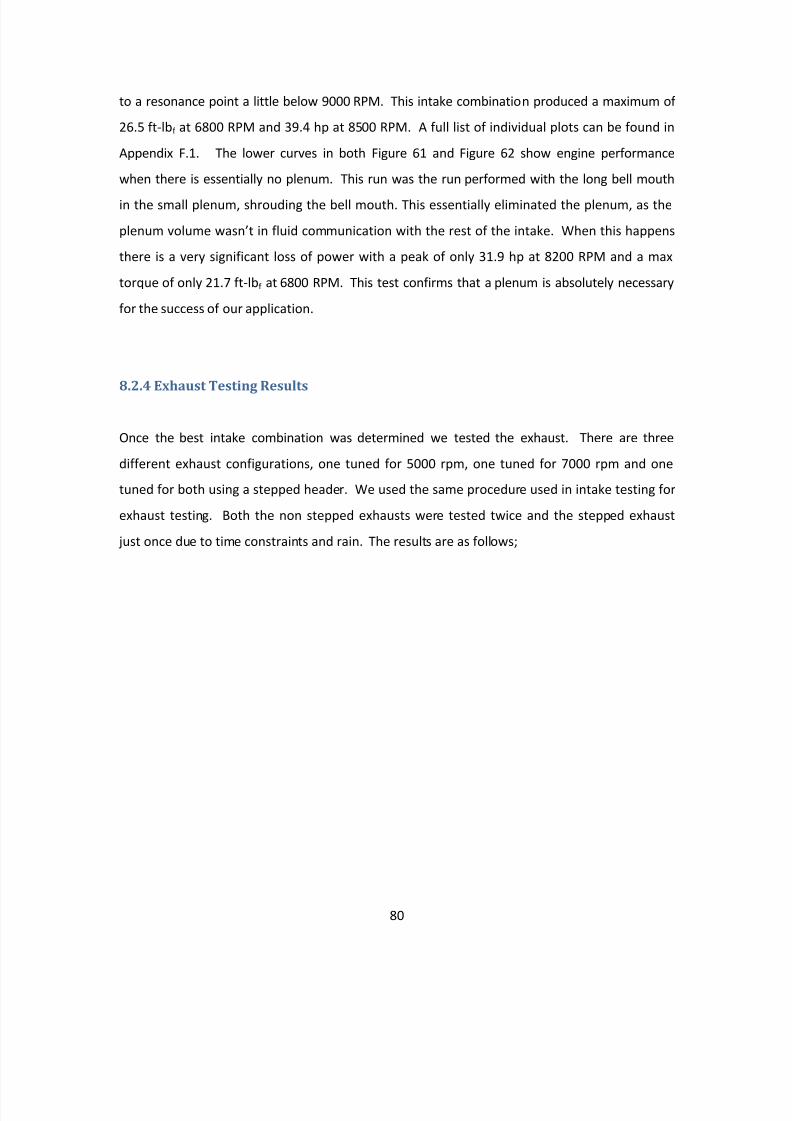
8/10/2019 Ca Poly FormulaSAE Engine Development
http://slidepdf.com/reader/full/ca-poly-formulasae-engine-development 80/142
80
to a resonance point a little below 9000 RPM. This intake combination produced a maximum of
26.5 ft-lb f at 6800 RPM and 39.4 hp at 8500 RPM. A full list of individual plots can be found in
Appendix F.1. The lower curves in both Figure 61 and Figure 62 show engine performance
when there is essentially no plenum. This run was the run performed with the long bell mouth
in the small plenum, shrouding the bell mouth. This essentially eliminated the plenum, as the
plenum volume wasn’t in fluid communication with the rest of the intake. When this happens
there is a very significant loss of power with a peak of only 31.9 hp at 8200 RPM and a max
torque of only 21.7 ft-lb f at 6800 RPM. This test confirms that a plenum is absolutely necessary
for the success of our application.
8.2.4 Exhaust Testing Results
Once the best intake combination was determined we tested the exhaust. There are three
different exhaust configurations, one tuned for 5000 rpm, one tuned for 7000 rpm and one
tuned for both using a stepped header. We used the same procedure used in intake testing for
exhaust testing. Both the non stepped exhausts were tested twice and the stepped exhaust
just once due to time constraints and rain. The results are as follows;
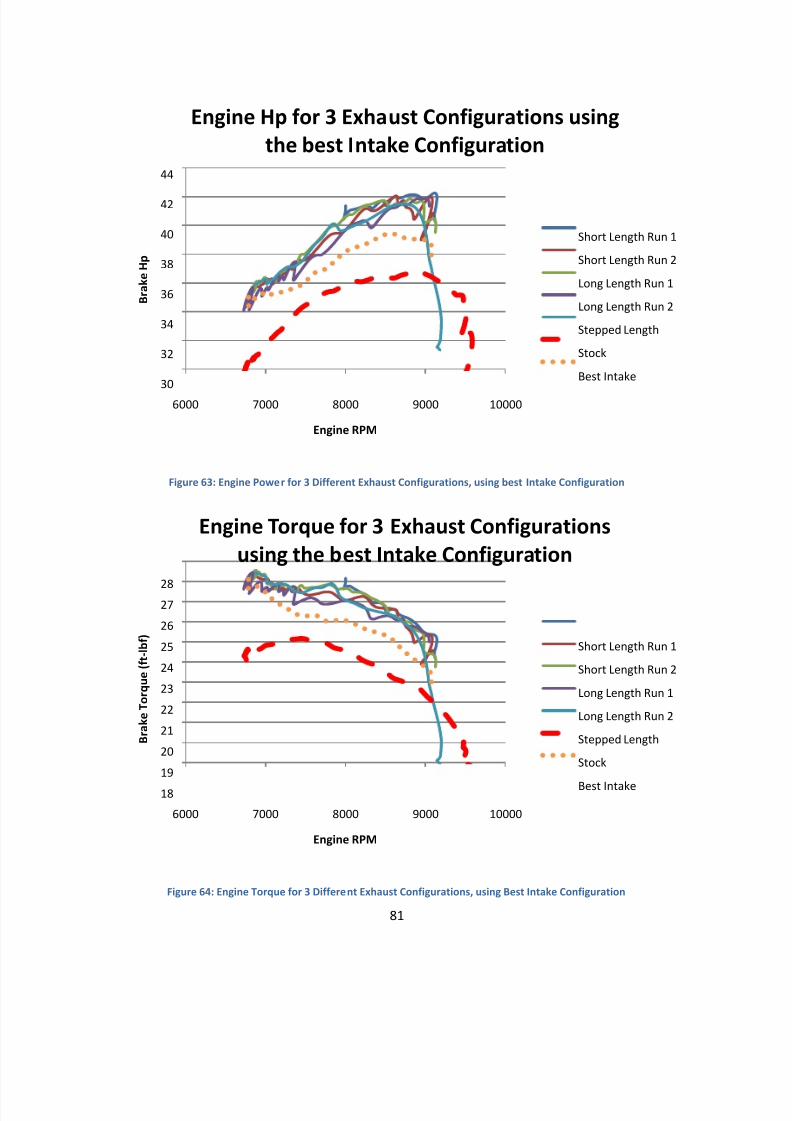
8/10/2019 Ca Poly FormulaSAE Engine Development
http://slidepdf.com/reader/full/ca-poly-formulasae-engine-development 81/142
81
Figure 63: Engine Power for 3 Different Exhaust Configurations, using best Intake Configuration
Figure 64: Engine Torque for 3 Different Exhaust Configurations, using Best Intake Configuration
30
32
34
36
38
40
42
44
6000 7000 8000 9000 10000
B r a k e H p
Engine RPM
Engine Hp for 3 Exhaust Configurations usingthe best Intake Configuration
Short Length Run 1
Short Length Run 2
Long Length Run 1
Long Length Run 2
Stepped Length
Stock
Best Intake
18
19
20
21
22
23
24
25
26
2728
6000 7000 8000 9000 10000
B r a k e T o r q u e
( f t - l b f )
Engine RPM
Engine Torque for 3 Exhaust Configurationsusing the best Intake Configuration
Short Length Run 1
Short Length Run 2
Long Length Run 1
Long Length Run 2
Stepped Length
Stock
Best Intake
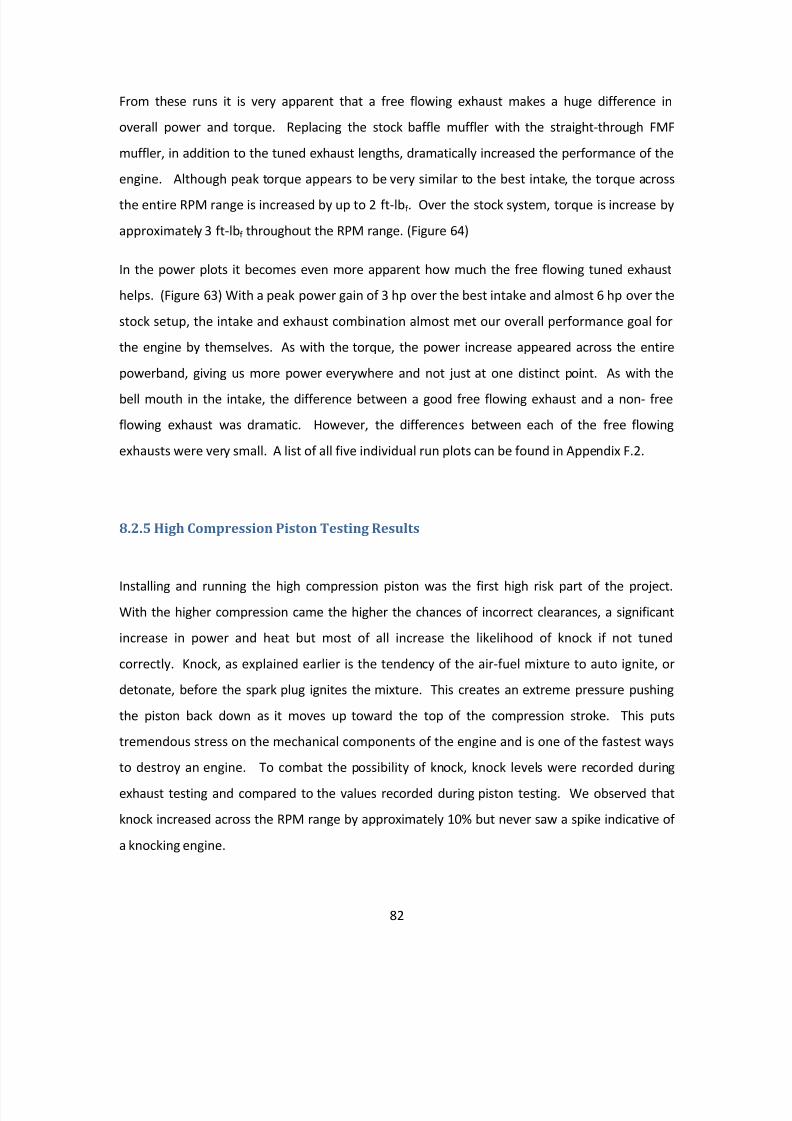
8/10/2019 Ca Poly FormulaSAE Engine Development
http://slidepdf.com/reader/full/ca-poly-formulasae-engine-development 82/142
82
From these runs it is very apparent that a free flowing exhaust makes a huge difference in
overall power and torque. Replacing the stock baffle muffler with the straight-through FMF
muffler, in addition to the tuned exhaust lengths, dramatically increased the performance of the
engine. Although peak torque appears to be very similar to the best intake, the torque across
the entire RPM range is increased by up to 2 ft-lb f . Over the stock system, torque is increase by
approximately 3 ft-lb f throughout the RPM range. (Figure 64)
In the power plots it becomes even more apparent how much the free flowing tuned exhaust
helps. (Figure 63) With a peak power gain of 3 hp over the best intake and almost 6 hp over the
stock setup, the intake and exhaust combination almost met our overall performance goal for
the engine by themselves. As with the torque, the power increase appeared across the entire
powerband, giving us more power everywhere and not just at one distinct point. As with the
bell mouth in the intake, the difference between a good free flowing exhaust and a non- free
flowing exhaust was dramatic. However, the differences between each of the free flowing
exhausts were very small. A list of all five individual run plots can be found in Appendix F.2.
8.2.5 High Compression Piston Testing Results
Installing and running the high compression piston was the first high risk part of the project.With the higher compression came the higher the chances of incorrect clearances, a significant
increase in power and heat but most of all increase the likelihood of knock if not tuned
correctly. Knock, as explained earlier is the tendency of the air-fuel mixture to auto ignite, or
detonate, before the spark plug ignites the mixture. This creates an extreme pressure pushing
the piston back down as it moves up toward the top of the compression stroke. This puts
tremendous stress on the mechanical components of the engine and is one of the fastest ways
to destroy an engine. To combat the possibility of knock, knock levels were recorded during
exhaust testing and compared to the values recorded during piston testing. We observed that
knock increased across the RPM range by approximately 10% but never saw a spike indicative of
a knocking engine.
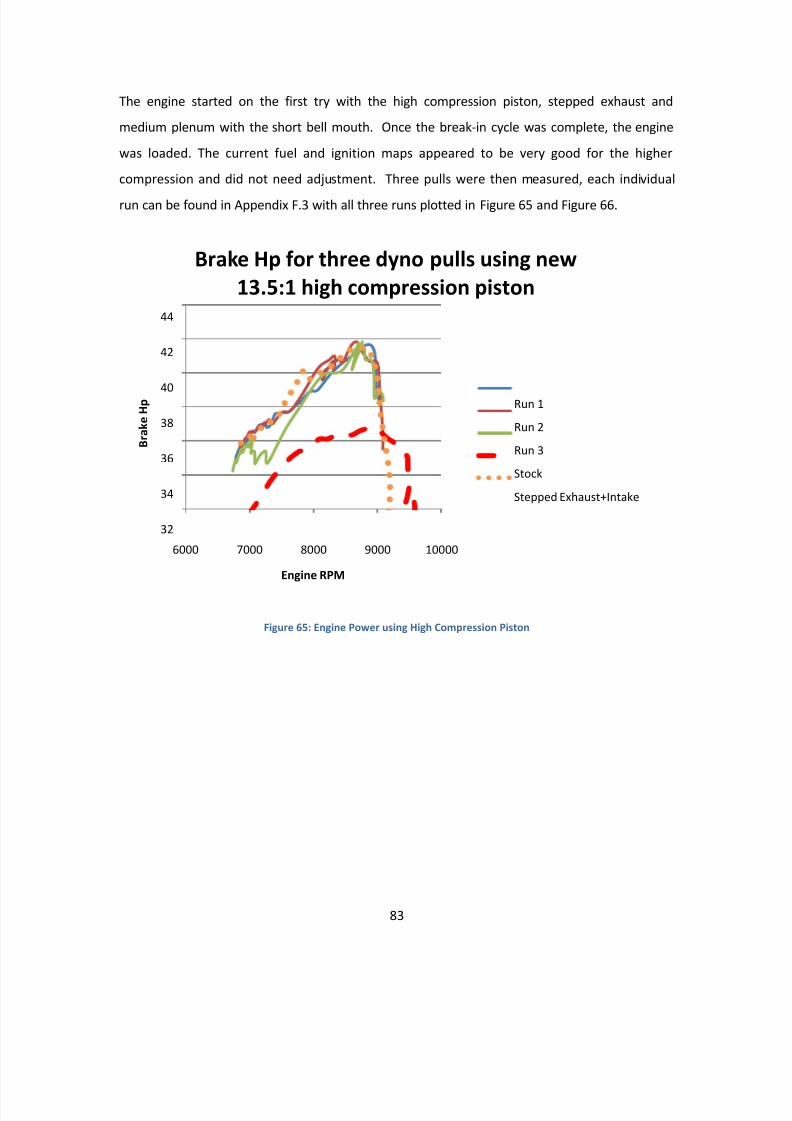
8/10/2019 Ca Poly FormulaSAE Engine Development
http://slidepdf.com/reader/full/ca-poly-formulasae-engine-development 83/142
83
The engine started on the first try with the high compression piston, stepped exhaust and
medium plenum with the short bell mouth. Once the break-in cycle was complete, the engine
was loaded. The current fuel and ignition maps appeared to be very good for the higher
compression and did not need adjustment. Three pulls were then measured, each individual
run can be found in Appendix F.3 with all three runs plotted in Figure 65 and Figure 66.
Figure 65: Engine Power using High Compression Piston
32
34
36
38
40
42
44
6000 7000 8000 9000 10000
B r a k e H p
Engine RPM
Brake Hp for three dyno pulls using new13.5:1 high compression piston
Run 1
Run 2
Run 3
Stock
Stepped Exhaust+Intake
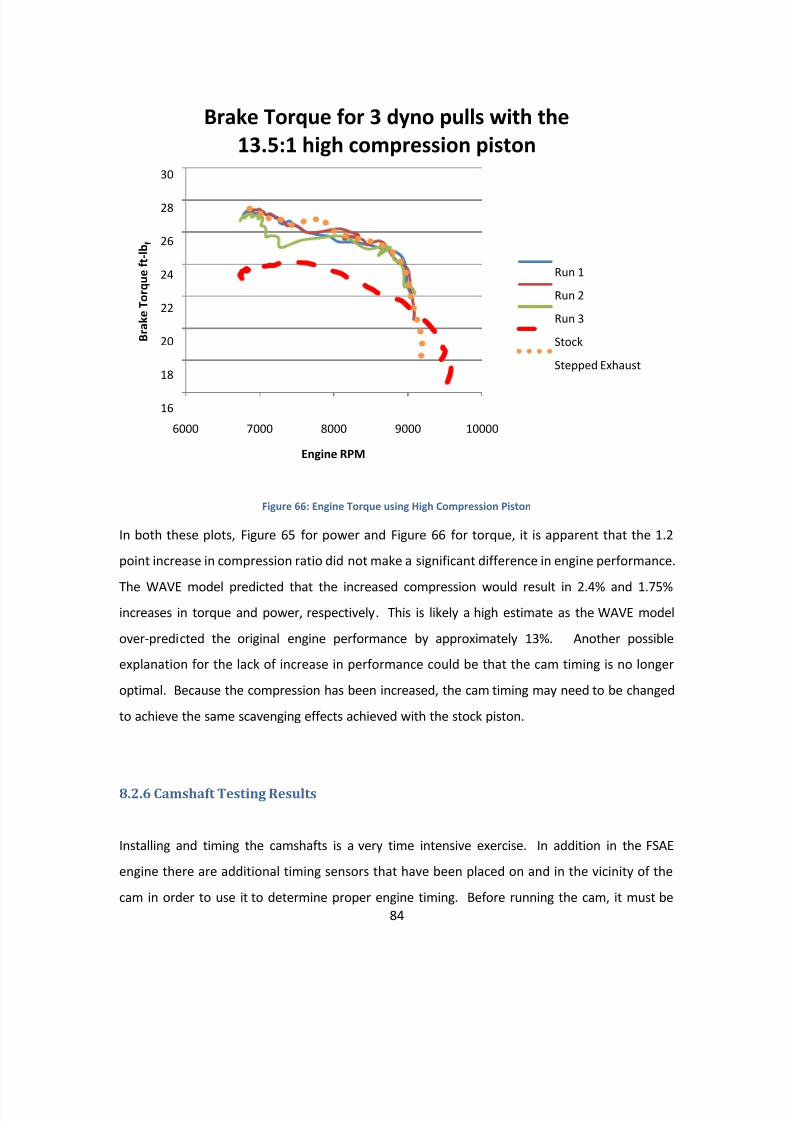
8/10/2019 Ca Poly FormulaSAE Engine Development
http://slidepdf.com/reader/full/ca-poly-formulasae-engine-development 84/142
84
Figure 66: Engine Torque using High Compression Piston
In both these plots, Figure 65 for power and Figure 66 for torque, it is apparent that the 1.2
point increase in compression ratio did not make a significant difference in engine performance.
The WAVE model predicted that the increased compression would result in 2.4% and 1.75%increases in torque and power, respectively. This is likely a high estimate as the WAVE model
over-predicted the original engine performance by approximately 13%. Another possible
explanation for the lack of increase in performance could be that the cam timing is no longer
optimal. Because the compression has been increased, the cam timing may need to be changed
to achieve the same scavenging effects achieved with the stock piston.
8.2.6 Camshaft Testing Results
Installing and timing the camshafts is a very time intensive exercise. In addition in the FSAE
engine there are additional timing sensors that have been placed on and in the vicinity of the
cam in order to use it to determine proper engine timing. Before running the cam, it must be
16
18
20
22
24
26
28
30
6000 7000 8000 9000 10000
B r a k e T o r q u e
f t - l b f
Engine RPM
Brake Torque for 3 dyno pulls with the13.5:1 high compression piston
Run 1
Run 2
Run 3
Stock
Stepped Exhaust
8/10/2019 Ca Poly FormulaSAE Engine Development
http://slidepdf.com/reader/full/ca-poly-formulasae-engine-development 85/142
8/10/2019 Ca Poly FormulaSAE Engine Development
http://slidepdf.com/reader/full/ca-poly-formulasae-engine-development 86/142
86
time. By averaging five runs we hope to minimize the effect of driver and surface inconsistency
between runs.
Once the current vehicle runs its acceleration runs, mark the cone locations with chalk to ensure
that we set the course up in the same location. The next morning at approximately the sametime the course should be set up again and the tests repeated using the same procedure as the
day before.
In addition to acceleration times, driver feedback is very important. We want to watch and
understand when the driver is shifting the car, in order to understand if they feel like they have
more torque or less torque with the stock setup, and as a result more or less traction.
8.3.2 Autocross Testing Plan
As with acceleration testing, autocross testing should also be performed over a two day period.
With autocross the team should record times over 3 sets of 5 laps, averaging each set to
eliminate variation. In addition to times, driver feedback in the autocross is very important. If
the car is produces too much torque and is unpredictable then the team will need to either tune
back the car or change the gearing. The driver should keep in mind the following questions
during testing:
1) Is acceleration faster, slower, or equivalent?
2) Is the power delivery predictable?
3) When does power application break tires loose?
4) Is throttle response better, worse or equivalent to the stock car?
The answers to these questions will likely be predictable based on lap times. Faster acceleration
with a smooth power delivery and a controllable throttle will make a faster overall car. But ifsome are better and some are worse then we want to know and try to improve our product.
8/10/2019 Ca Poly FormulaSAE Engine Development
http://slidepdf.com/reader/full/ca-poly-formulasae-engine-development 87/142
87
8.3.3 Other Testing
One of our design criteria was to keep our components to less than 20lbs. To make sure that we
met this goal each component needs to be weighed before it goes on to the car. Comparing the
component weights against the current components will determine how much weight each
system gained or lost.
Reliability testing will not be performed in the timeline of this project. As much as we would like
to drive the car for 20hrs or more it is not likely that the team will have that much available
time. However, when they do begin to drive on a consistent basis they should record problems
that occur with the engine and note the amount of time the engine has been running before
each problem to try and fix any problem areas that may arise.
8/10/2019 Ca Poly FormulaSAE Engine Development
http://slidepdf.com/reader/full/ca-poly-formulasae-engine-development 88/142
88
9. Conclusion and Recommendations
The main goal of the project was to achieve a torque curve that is relatively flat and does not
peak and then drop off. Based on the baseline dyno pull we hoped to push both the torque and
power curves down into the lower engine speeds, in order to gain some of the low-end torque
the WR450 has while trying to avoid the restrictor’s flow choking at higher speeds. Based on
the testing results achieved with our intake, exhaust and high compression piston, it is apparent
that we did succeed in moving the torque curve down into the lower speed range. Although it
was not possible to load the engine at speeds below 6,500 rpm with the current dyno setup, it is
apparent that the curves are shitted when comparing the final power and torque curves to thebaseline. When examining the baseline curve, it is easy to see that the curve is rising beginning
at 6,000 rpm and peaks around 7,500 rpm. It then drops steadily until the 10,000 rpm redline.
The new torque curve begins at its peak, around 6,800 rpm, and slowly decreases to the 10,000
rpm redline. Assuming that the beginning of the curve is the peak then we successfully moved
the curve down at least 700-1,000 rpm. In addition to shifting the curve, the maximum torque
output was increased to approximately 27.5 ft-lb f at 6,800 rpm from 24.25 ft-lb f at 7,500 rpm.
The overall power goal was 45 hp, an increase of 5 hp over the FormulaSAE reported 40 hp withthe original intake and exhaust setup. After baselining the original setup we found that it only
produced 37 hp at 8,800 rpm. After the completion of high compression piston testing, our
system produced a little over 42 hp at approximately 8,800 rpm. This is a 5 hp increase which
was the desired hp gain the team was looking for. This 5 hp increase was a 13.5% increase over
the baseline, a very respectable increase regardless of the application.
Due to the time constraints placed on the project there are many things that the team should
continue to investigate in order to conclude this project. The first is the completion of camshafttesting. As explained in the testing section camshaft testing is very involved and will likely
require tuning of the fuel and ignition map. In addition to camshaft testing, additional
calibration should be done for the dyno. Currently the load cell was calibrated by hanging a
weight from it. In order to calibrate the dyno properly we recommend finding an electric motor
8/10/2019 Ca Poly FormulaSAE Engine Development
http://slidepdf.com/reader/full/ca-poly-formulasae-engine-development 89/142
89
with a known torque curve and compare it to the torque curve produced by our dyno. By
comparing the two curves the team can find any discrepancies produced while the dyno is
rotating. We also recommend getting a smaller sprocket for the dyno. The dyno was unable to
produce enough resistance to load the engine below 6,500 rpm. In order to combat this
problem the dyno must have the ability to spin faster and create more resistance. During our
testing the engine was in 5 th gear, its highest gear. Installing a smaller sprocket will allow the
dyno to load lower in 5 th and potentially allow the team to also run in 4 th if they desire to.
In order to help future teams, we recommend that FormulaSAE spend significant time verifying
the WAVE model. Once the WAVE model is adjusted to consistently predict engine
performance, future teams can use it to investigate the effects of modifications like increased
displacement, or even forced induction. The area requiring the most work is the modeling of
the restrictor. From experience we know that the engine hp and torque should drop off
dramatically once the restrictor begins to choke the intake flow. In the WAVE model the power
and torque continue to increase as engine speed increases. This is not correct and could likely
be corrected with continued development.
The final recommendation we have is the completion of final vehicle-ready parts out of the
correct material. We recommend that the intake plenum be made of aluminum sheet. By
producing the entire intake out of a similar material it can be welded, which improves total
system rigidity and reduces the possibility of vacuum leaks from portions not sealing. In
addition, making the entire intake out aluminum will make mounting much easier. The current
mounting for the intake is poor at best due to the acrylic plenums but aluminum plenums will
increase the mounting options dramatically. The current exhaust was made of 1018 mild steel
because it was cheap and easy to work with and modify. Unfortunately, the heat capacity of
this material is very low leaving it prone to cracking and warping, especially in the heat affected
zones next to the welds. We would recommend a final exhaust be made of Stainless Steel.
Stainless Steel is widely used in high performance applications because of its ability to absorb
the extra heat created from running the engine at high load for long periods of time.
Manufacturing this exhaust would be a little more time intensive as Stainless Steel requires
special welding techniques and it would cost a lot more. However, the benefits of Stainless
Steel are well worth the cost and will result in fewer exhaust problems.
8/10/2019 Ca Poly FormulaSAE Engine Development
http://slidepdf.com/reader/full/ca-poly-formulasae-engine-development 90/142
90
With the additions of these recommendations to our current development the 2010-2011
FormulaSAE team could have a very solid engine. The engine development for the WR450 has
been very slow up to this point but this senior project has advanced the team leaps and bounds.We feel that we have set the team up for success and have laid the ground work for a very
successful engine program in the future.
8/10/2019 Ca Poly FormulaSAE Engine Development
http://slidepdf.com/reader/full/ca-poly-formulasae-engine-development 91/142
91
References
1. Taylor, C., Internal Combustion Engine in Theory and Practice, Volume 1, The
MIT Press, 1985 pg 171-175
2. Ferguson, C. and Kirkpatrick, A., Internal Combustion Engines, John Wiley and
Sons, 2001, pg 165-175
3. Blair, G.P. and Cahoon, M., “Best Bell”, Race Engine Technology. Sept. 2006
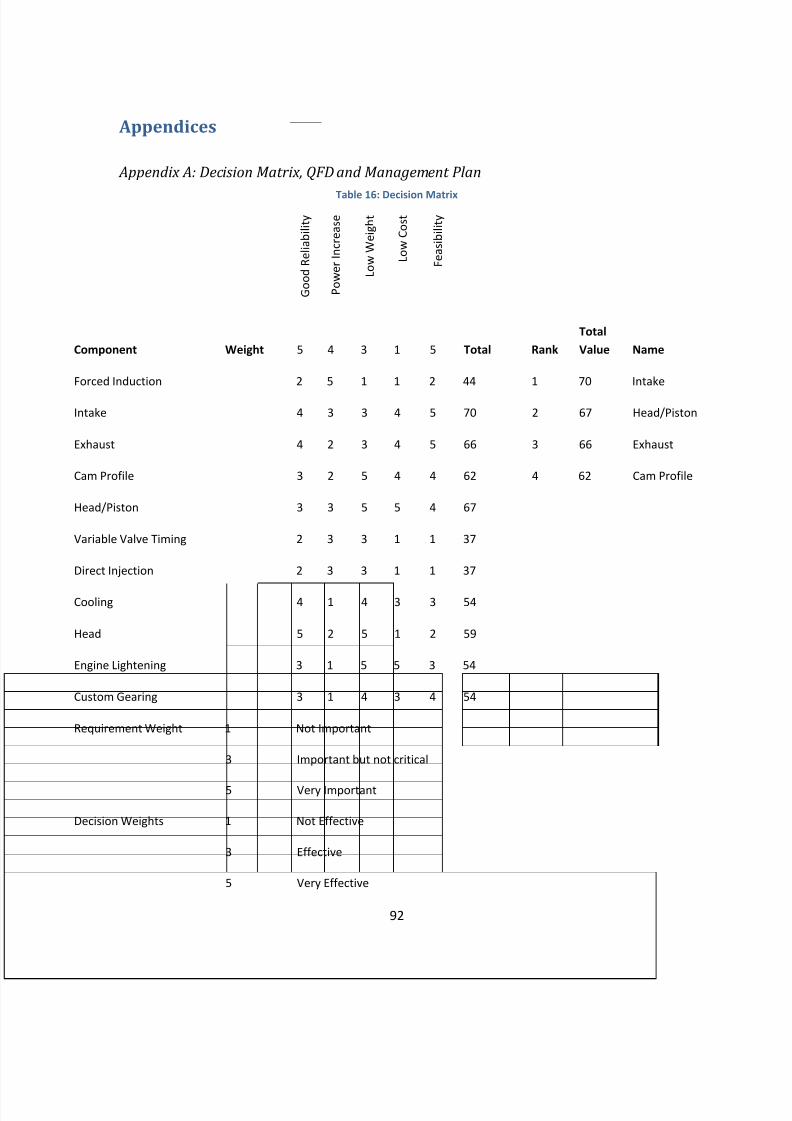
8/10/2019 Ca Poly FormulaSAE Engine Development
http://slidepdf.com/reader/full/ca-poly-formulasae-engine-development 92/142
92
Appendices
Appendix A: Decision Matrix, QFD and Management Plan
Table 16: Decision Matrix
G o o d R e l i a b i l i t y
P o w e r I n c r e a s e
L o w W e i g h t
L o w C o s t
F e a s i b i l i t y
Component Weight 5 4 3 1 5 Total RankTotalValue Name
Forced Induction 2 5 1 1 2 44 1 70 Intake
Intake 4 3 3 4 5 70 2 67 Head/Piston
Exhaust 4 2 3 4 5 66 3 66 Exhaust
Cam Profile 3 2 5 4 4 62 4 62 Cam Profile
Head/Piston 3 3 5 5 4 67
Variable Valve Timing 2 3 3 1 1 37
Direct Injection 2 3 3 1 1 37
Cooling 4 1 4 3 3 54
Head 5 2 5 1 2 59
Engine Lightening 3 1 5 5 3 54
Custom Gearing 3 1 4 3 4 54
Requirement Weight 1 Not Important
3 Important but not critical
5 Very Important
Decision Weights 1 Not Effective
3 Effective
5 Very Effective
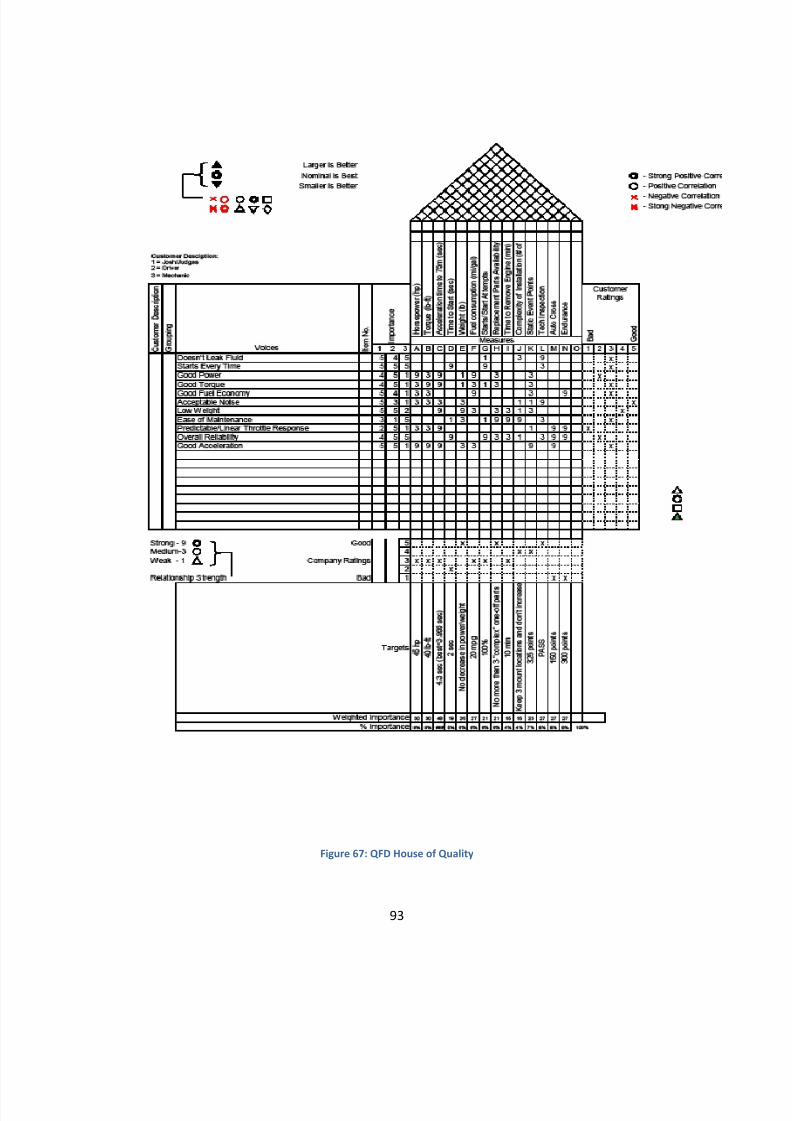
8/10/2019 Ca Poly FormulaSAE Engine Development
http://slidepdf.com/reader/full/ca-poly-formulasae-engine-development 93/142
93
Figure 67: QFD House of Quality
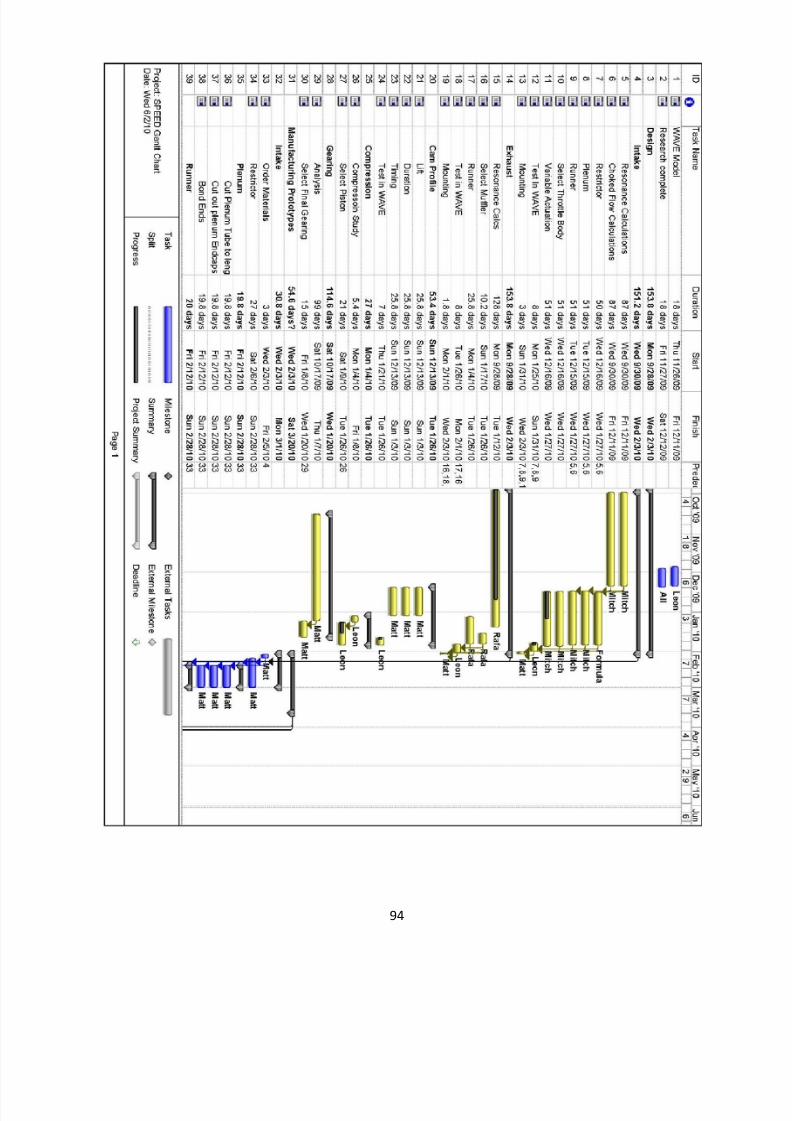
8/10/2019 Ca Poly FormulaSAE Engine Development
http://slidepdf.com/reader/full/ca-poly-formulasae-engine-development 94/142
94
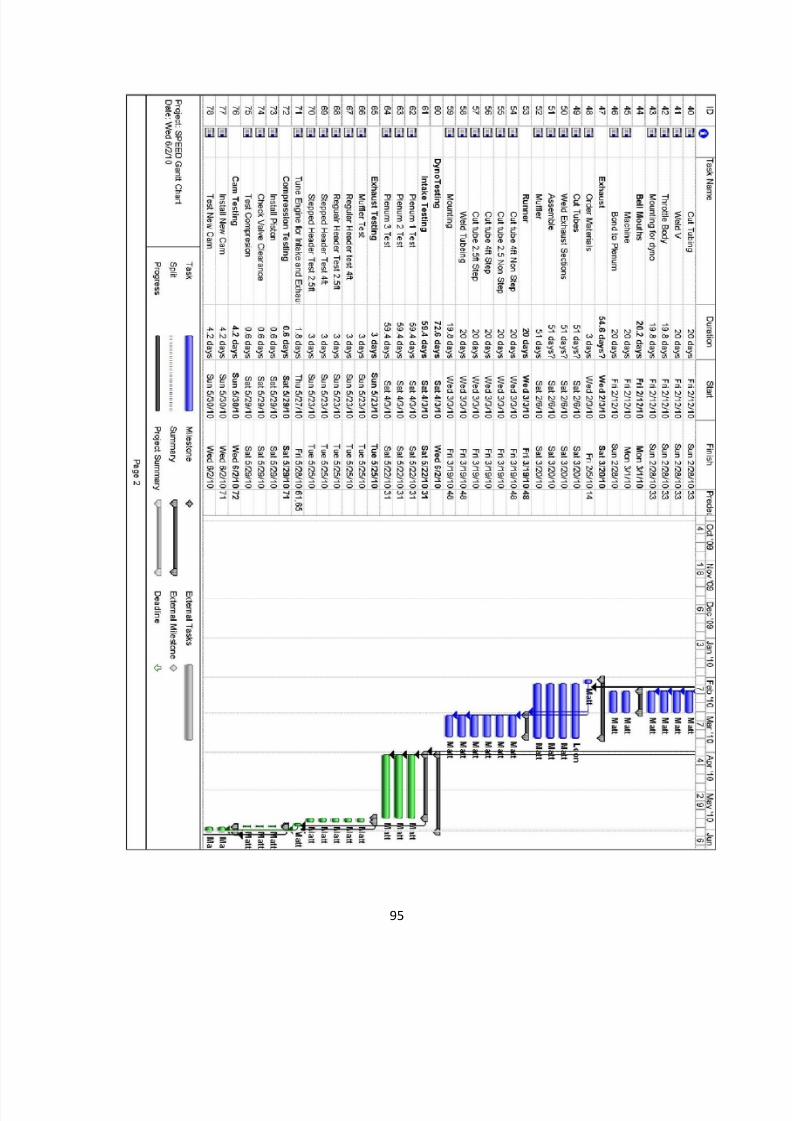
8/10/2019 Ca Poly FormulaSAE Engine Development
http://slidepdf.com/reader/full/ca-poly-formulasae-engine-development 95/142
95
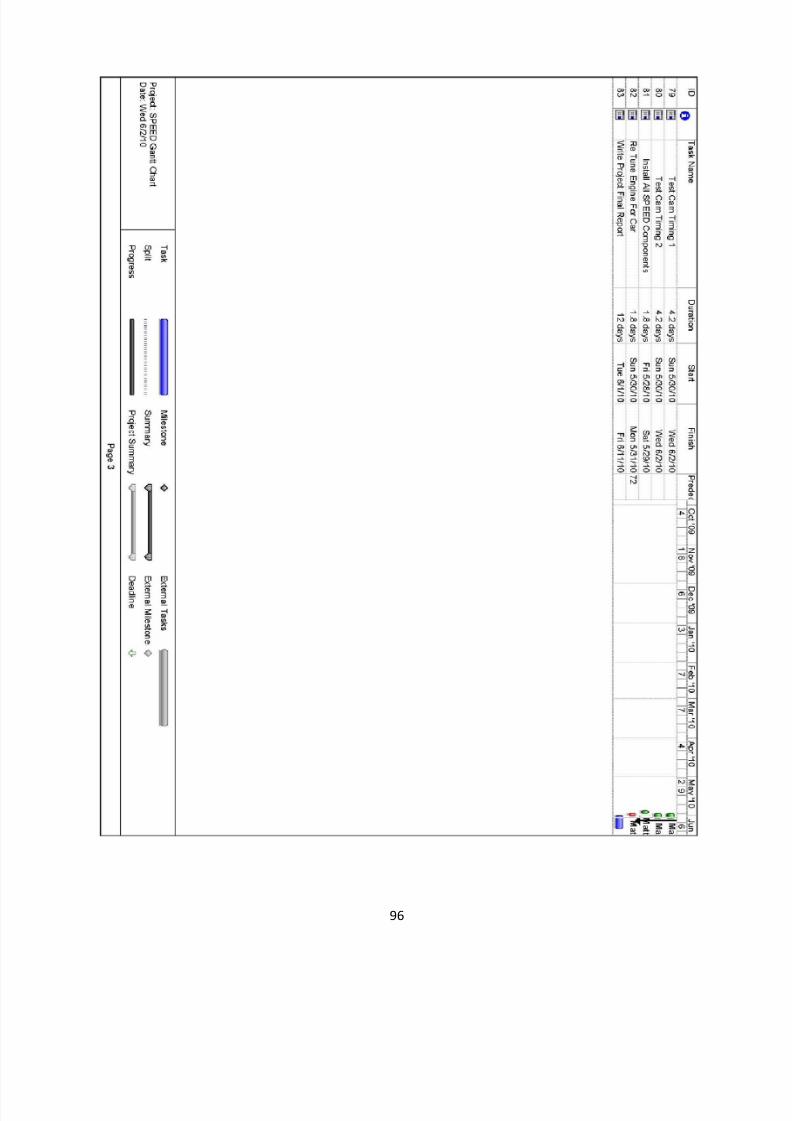
8/10/2019 Ca Poly FormulaSAE Engine Development
http://slidepdf.com/reader/full/ca-poly-formulasae-engine-development 96/142
96
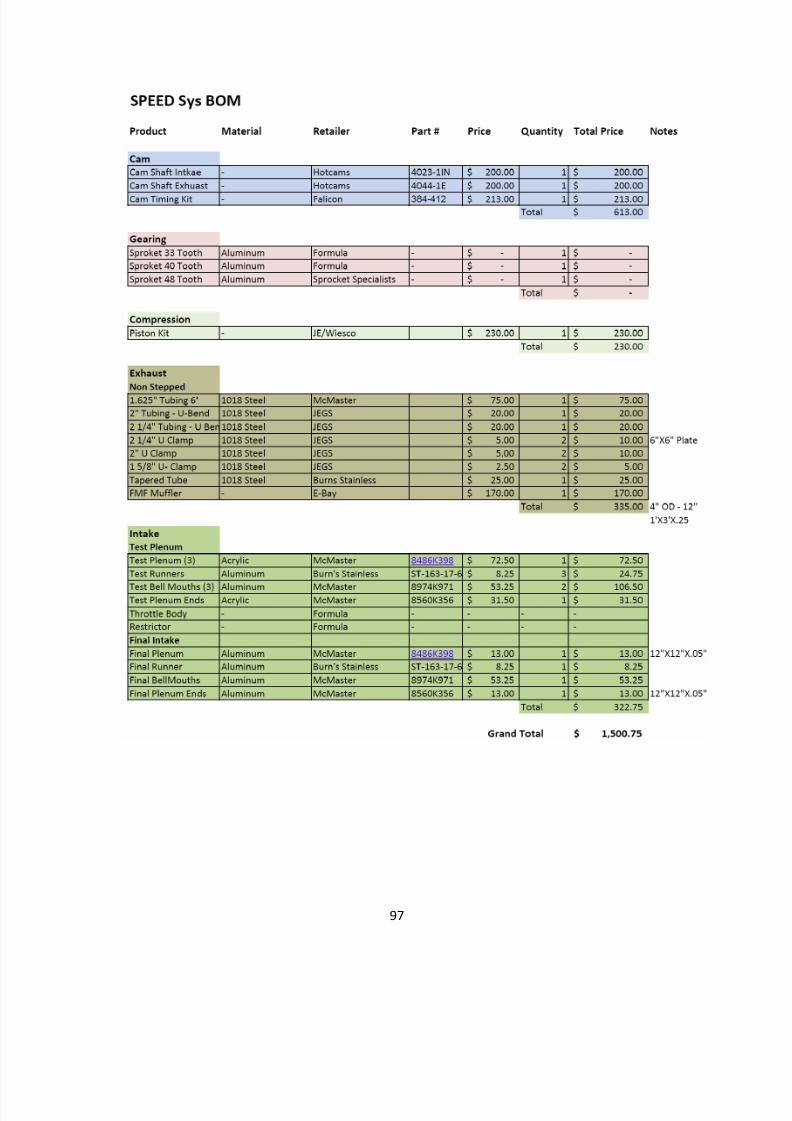
8/10/2019 Ca Poly FormulaSAE Engine Development
http://slidepdf.com/reader/full/ca-poly-formulasae-engine-development 97/142
97
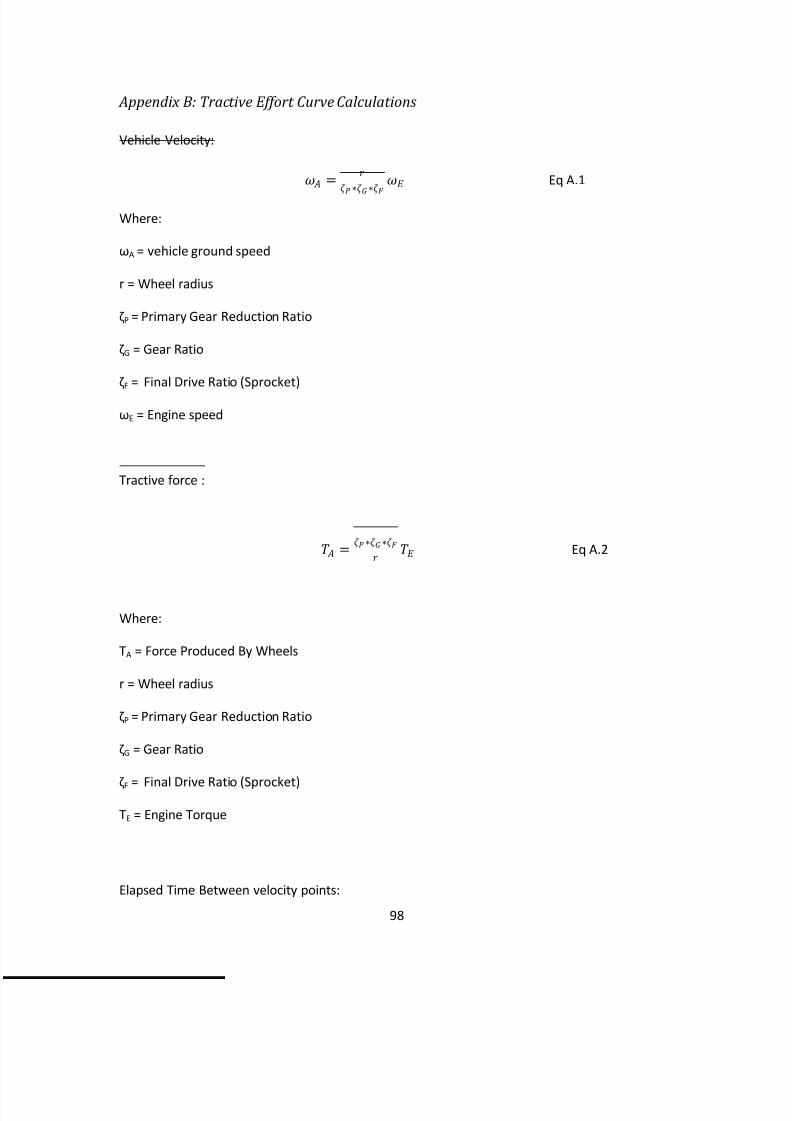
8/10/2019 Ca Poly FormulaSAE Engine Development
http://slidepdf.com/reader/full/ca-poly-formulasae-engine-development 98/142
98
Appendix B: Tractive Effort Curve Calculations
Vehicle Velocity:
=
∗∗
Eq A.1
Where:
ω A = vehicle ground speed
r = Wheel radius
ζP = Primary Gear Reduction Ratio
ζG = Gear Ratio
ζF = Final Drive Ratio (Sprocket)
ω E = Engine speed
Tractive force :
= ∗∗ Eq A.2
Where:
TA = Force Produced By Wheels
r = Wheel radius
ζP = Primary Gear Reduction Ratio
ζG = Gear Ratio
ζF = Final Drive Ratio (Sprocket)
TE = Engine Torque
Elapsed Time Between velocity points:
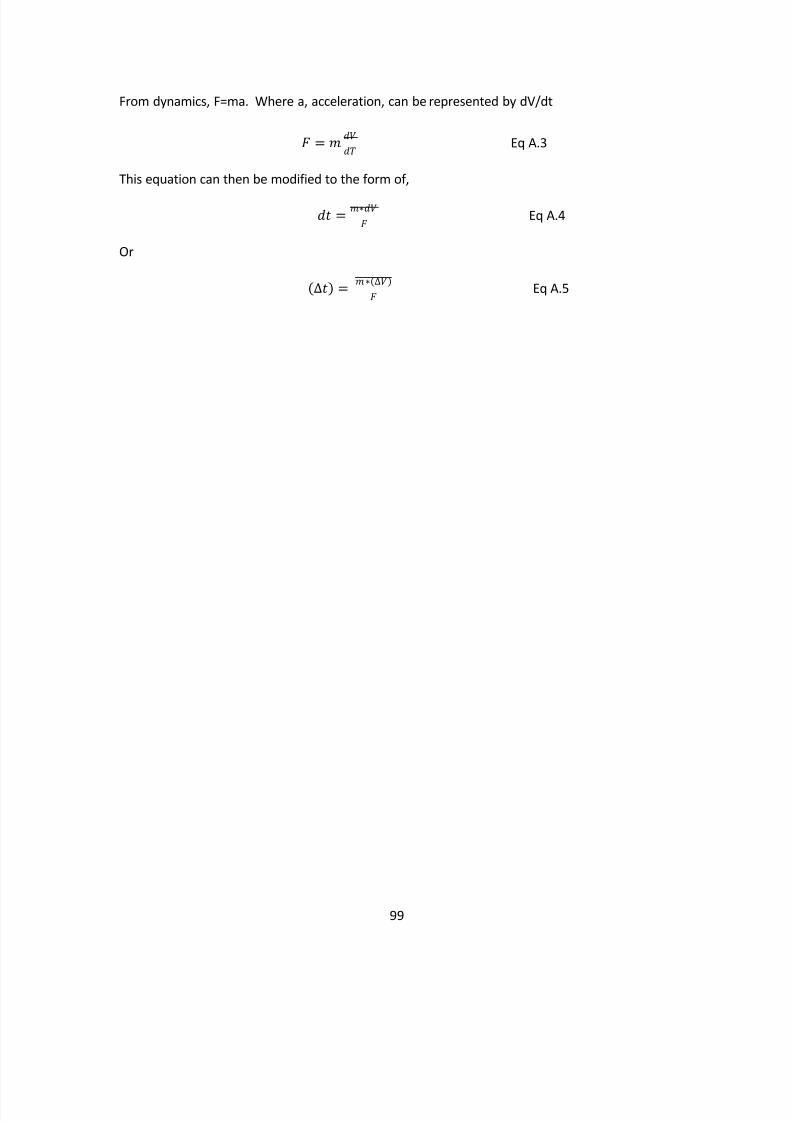
8/10/2019 Ca Poly FormulaSAE Engine Development
http://slidepdf.com/reader/full/ca-poly-formulasae-engine-development 99/142
99
From dynamics, F=ma. Where a, acceleration, can be represented by dV/dt
= Eq A.3
This equation can then be modified to the form of,
= ∗ Eq A.4
Or
(∆) = ∗(∆) Eq A.5
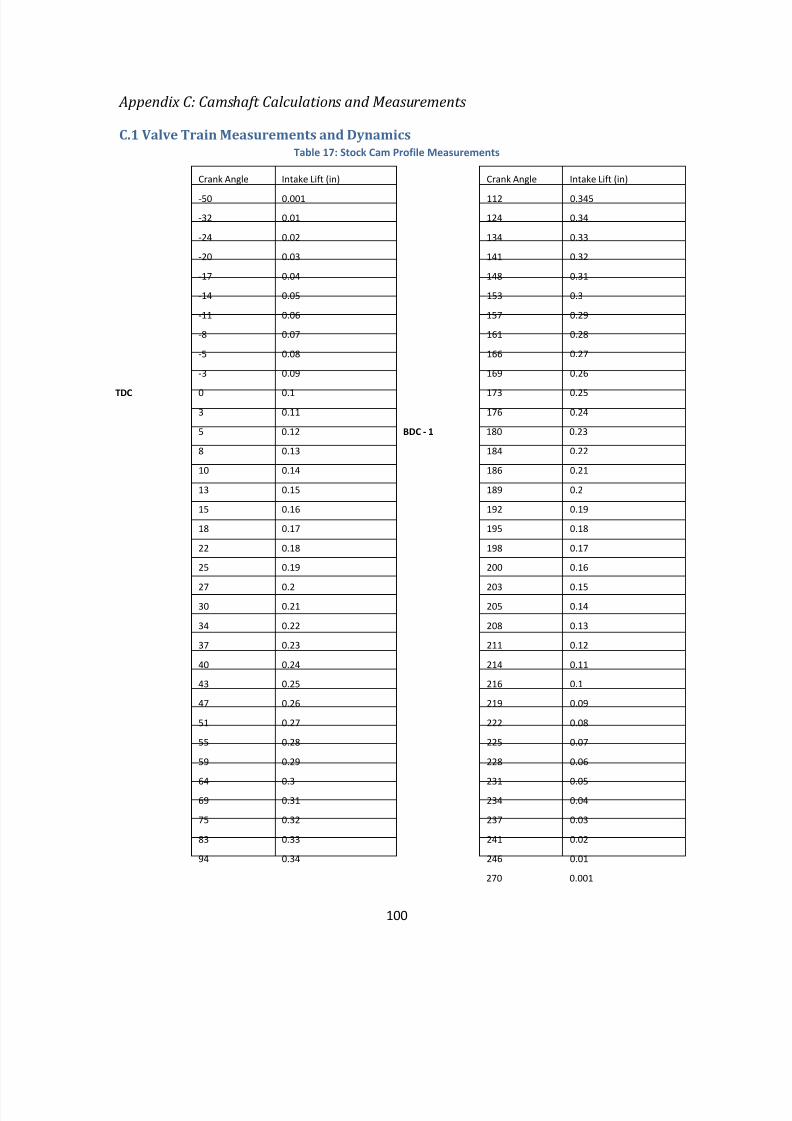
8/10/2019 Ca Poly FormulaSAE Engine Development
http://slidepdf.com/reader/full/ca-poly-formulasae-engine-development 100/142
100
Appendix C: Camshaft Calculations and Measurements
C.1 Valve Train Measurements and Dynamics Table 17: Stock Cam Profile Measurements
Crank Angle Intake Lift (in) Crank Angle Intake Lift (in)
-50 0.001 112 0.345
-32 0.01 124 0.34
-24 0.02 134 0.33
-20 0.03 141 0.32
-17 0.04 148 0.31
-14 0.05 153 0.3
-11 0.06 157 0.29
-8 0.07 161 0.28
-5 0.08 166 0.27
-3 0.09 169 0.26
TDC 0 0.1 173 0.253 0.11 176 0.24
5 0.12 BDC - 1 180 0.23
8 0.13 184 0.22
10 0.14 186 0.21
13 0.15 189 0.2
15 0.16 192 0.19
18 0.17 195 0.18
22 0.18 198 0.17
25 0.19 200 0.16
27 0.2 203 0.1530 0.21 205 0.14
34 0.22 208 0.13
37 0.23 211 0.12
40 0.24 214 0.11
43 0.25 216 0.1
47 0.26 219 0.09
51 0.27 222 0.08
55 0.28 225 0.07
59 0.29 228 0.06
64 0.3 231 0.0569 0.31 234 0.04
75 0.32 237 0.03
83 0.33 241 0.02
94 0.34 246 0.01
270 0.001
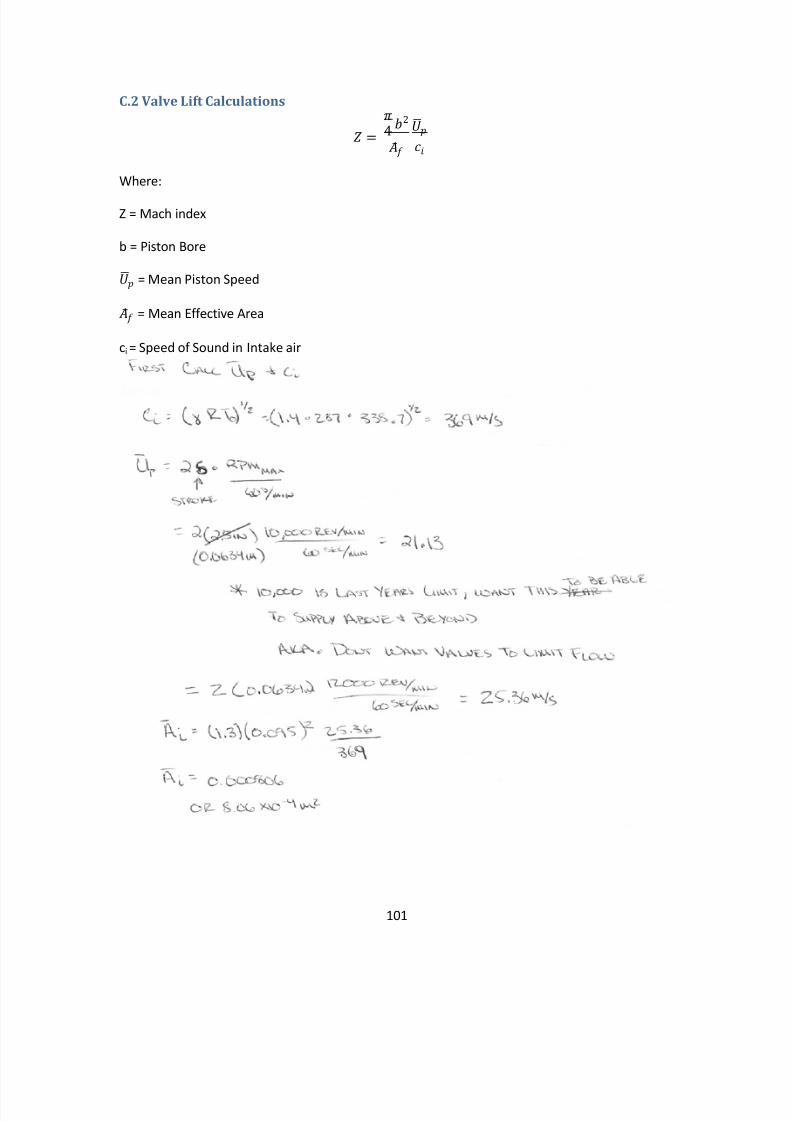
8/10/2019 Ca Poly FormulaSAE Engine Development
http://slidepdf.com/reader/full/ca-poly-formulasae-engine-development 101/142
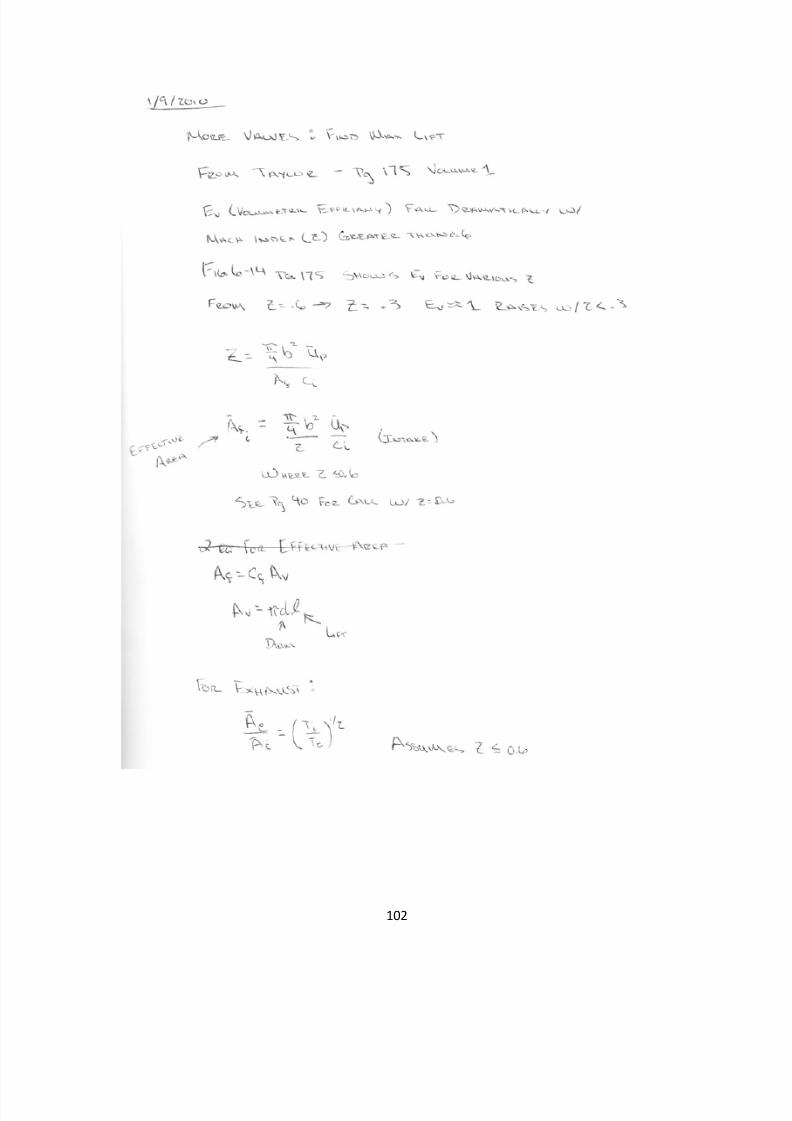
8/10/2019 Ca Poly FormulaSAE Engine Development
http://slidepdf.com/reader/full/ca-poly-formulasae-engine-development 102/142
102
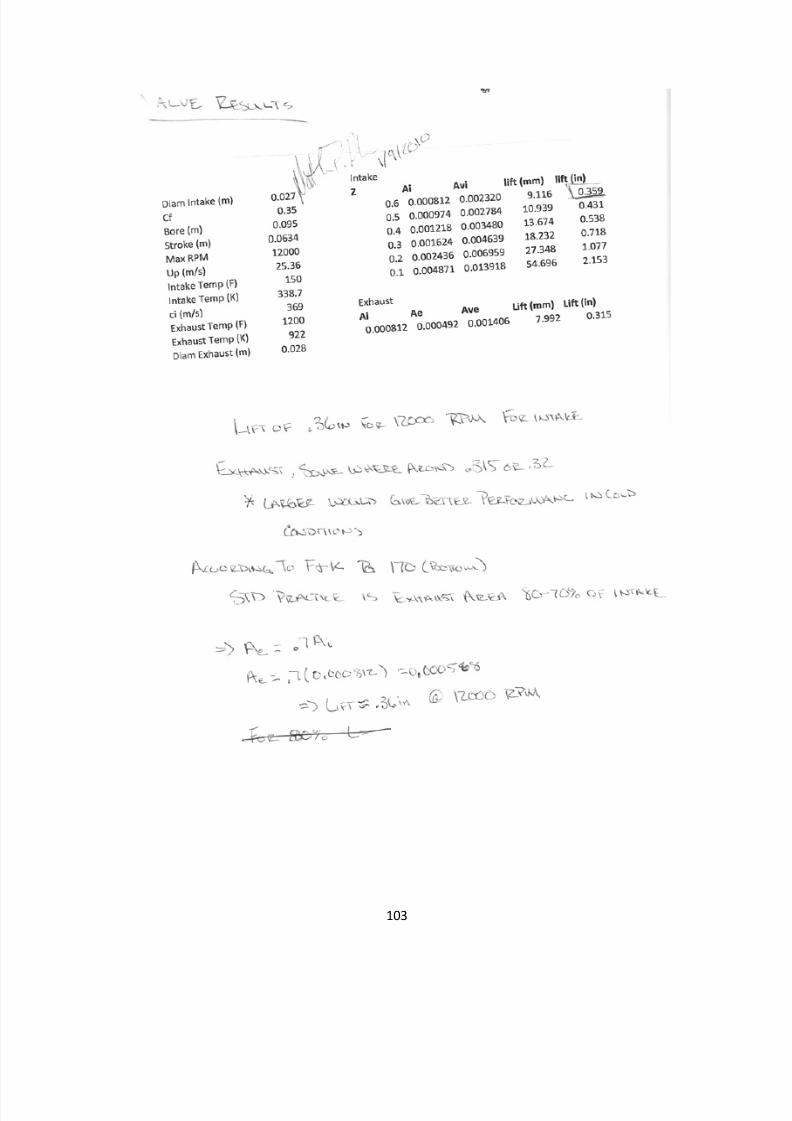
8/10/2019 Ca Poly FormulaSAE Engine Development
http://slidepdf.com/reader/full/ca-poly-formulasae-engine-development 103/142
103
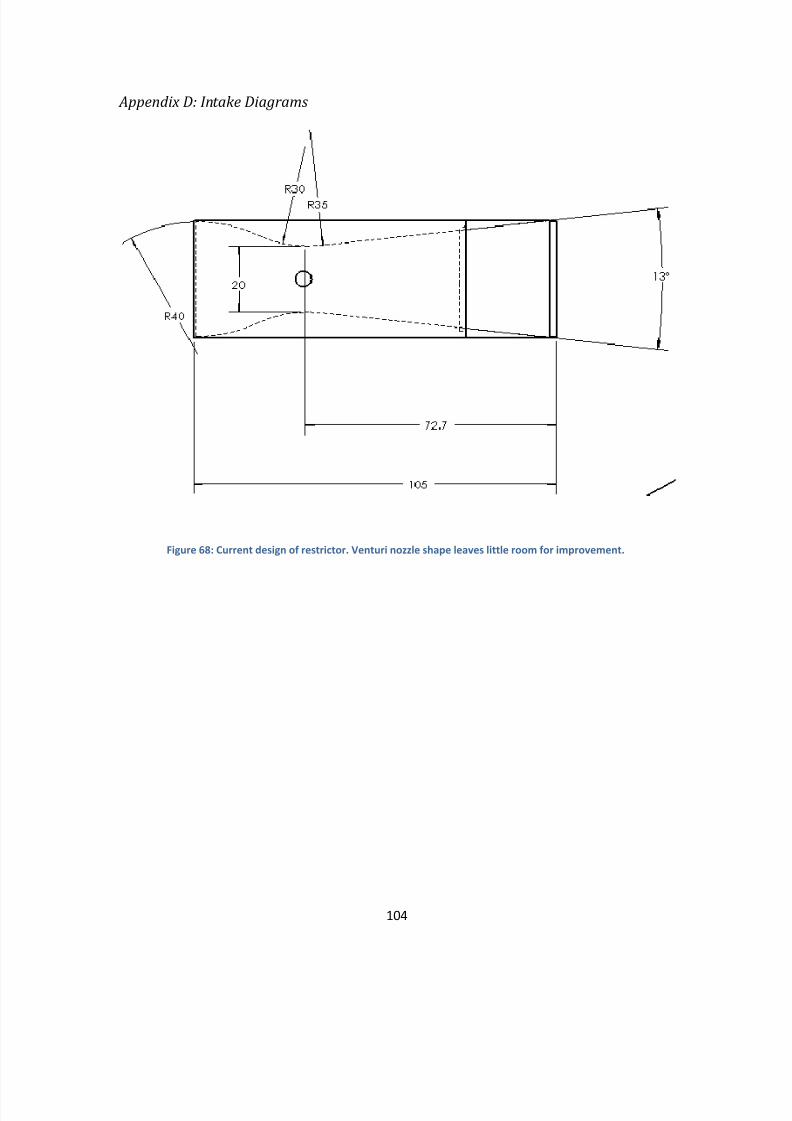
8/10/2019 Ca Poly FormulaSAE Engine Development
http://slidepdf.com/reader/full/ca-poly-formulasae-engine-development 104/142
104
Appendix D: Intake Diagrams
Figure 68: Current design of restrictor. Venturi nozzle shape leaves little room for improvement.
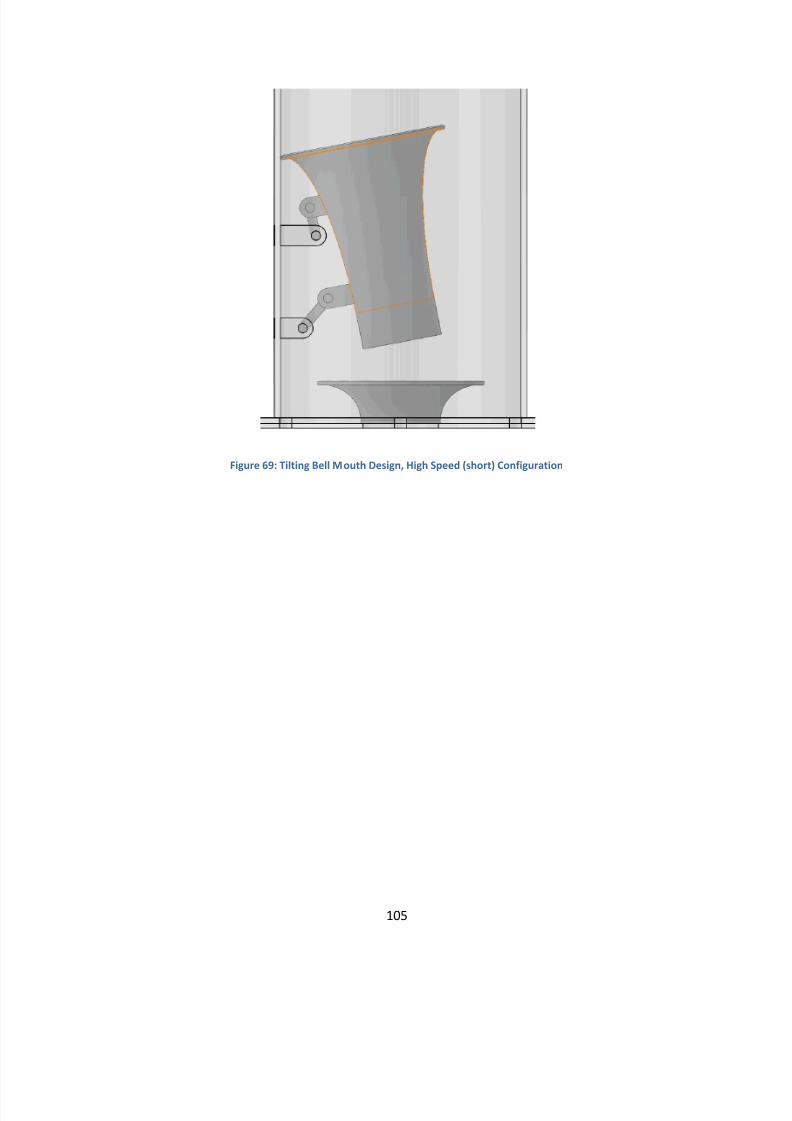
8/10/2019 Ca Poly FormulaSAE Engine Development
http://slidepdf.com/reader/full/ca-poly-formulasae-engine-development 105/142
105
Figure 69: Tilting Bell Mouth Design, High Speed (short) Configuration
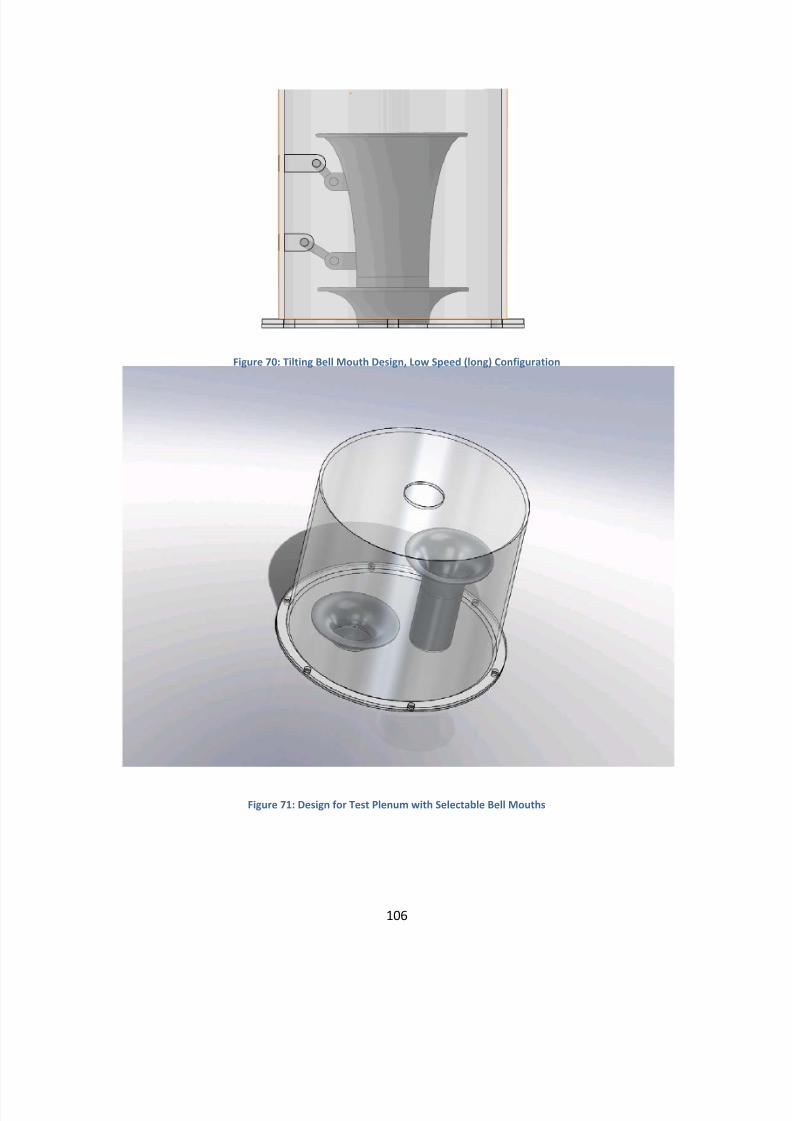
8/10/2019 Ca Poly FormulaSAE Engine Development
http://slidepdf.com/reader/full/ca-poly-formulasae-engine-development 106/142
106
Figure 70: Tilting Bell Mouth Design, Low Speed (long) Configuration
Figure 71: Design for Test Plenum with Selectable Bell Mouths
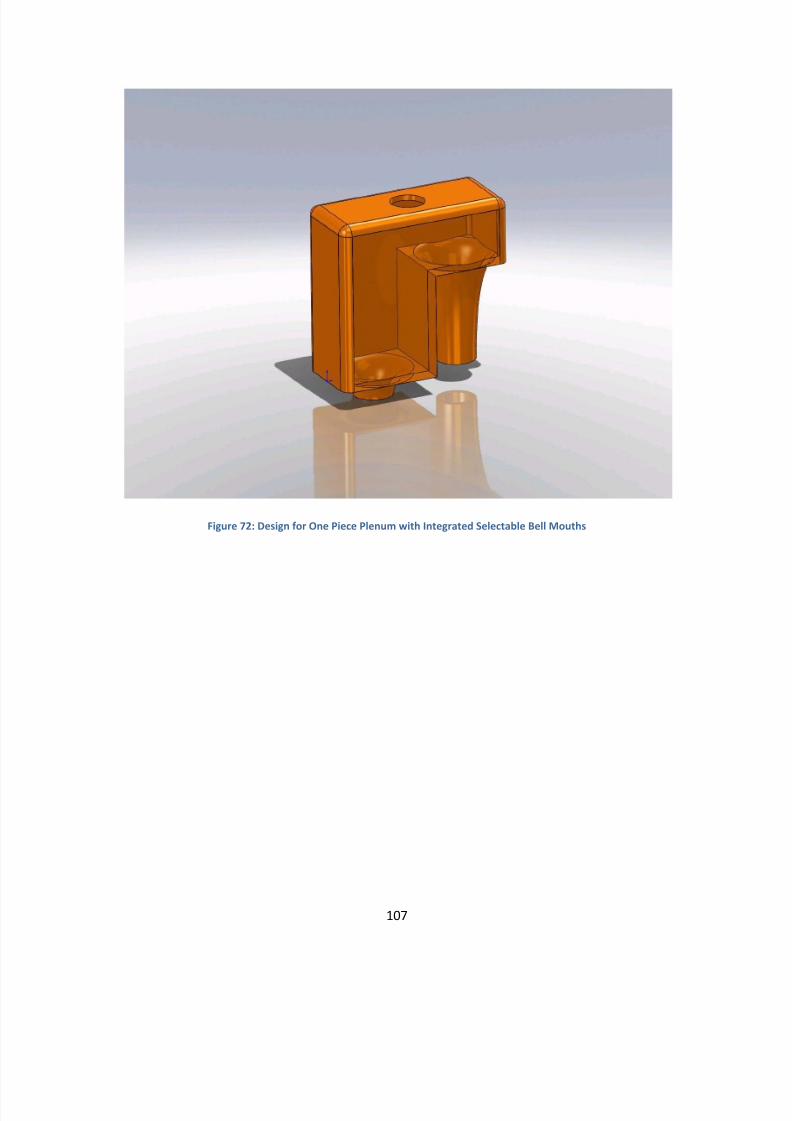
8/10/2019 Ca Poly FormulaSAE Engine Development
http://slidepdf.com/reader/full/ca-poly-formulasae-engine-development 107/142
107
Figure 72: Design for One Piece Plenum with Integrated Selectable Bell Mouths
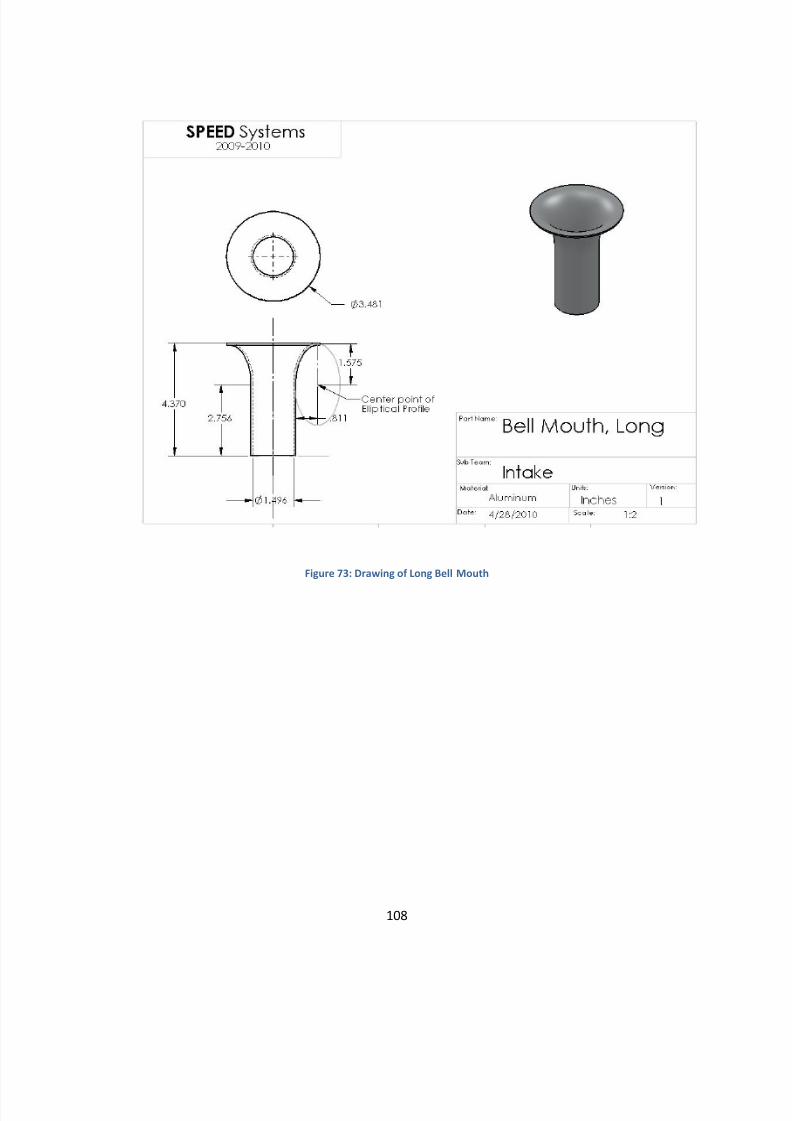
8/10/2019 Ca Poly FormulaSAE Engine Development
http://slidepdf.com/reader/full/ca-poly-formulasae-engine-development 108/142
108
Figure 73: Drawing of Long Bell Mouth
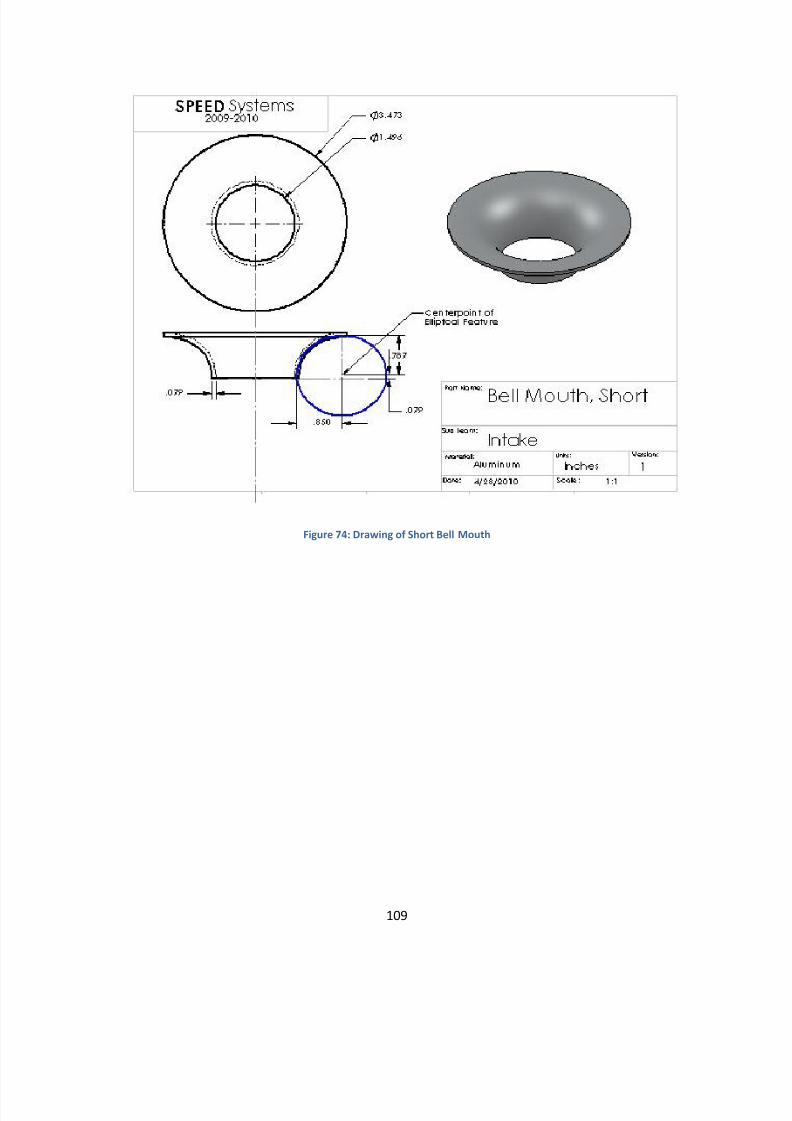
8/10/2019 Ca Poly FormulaSAE Engine Development
http://slidepdf.com/reader/full/ca-poly-formulasae-engine-development 109/142
109
Figure 74: Drawing of Short Bell Mouth
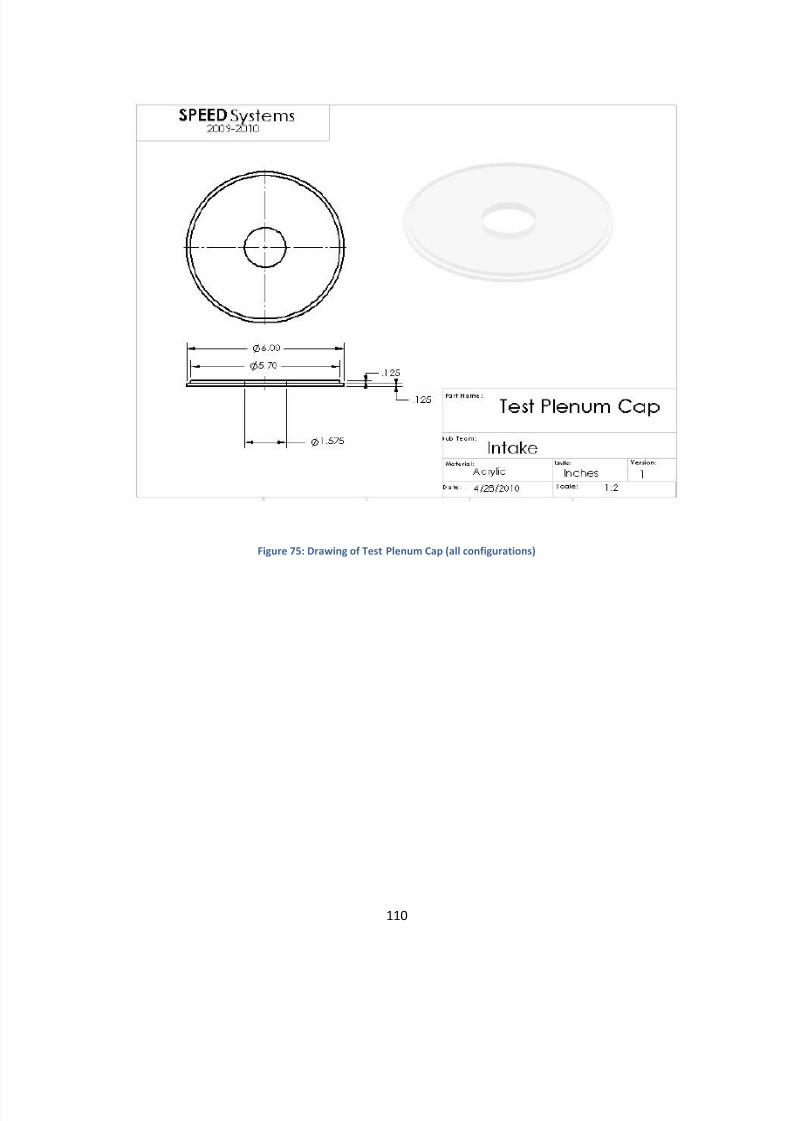
8/10/2019 Ca Poly FormulaSAE Engine Development
http://slidepdf.com/reader/full/ca-poly-formulasae-engine-development 110/142
110
Figure 75: Drawing of Test Plenum Cap (all configurations)
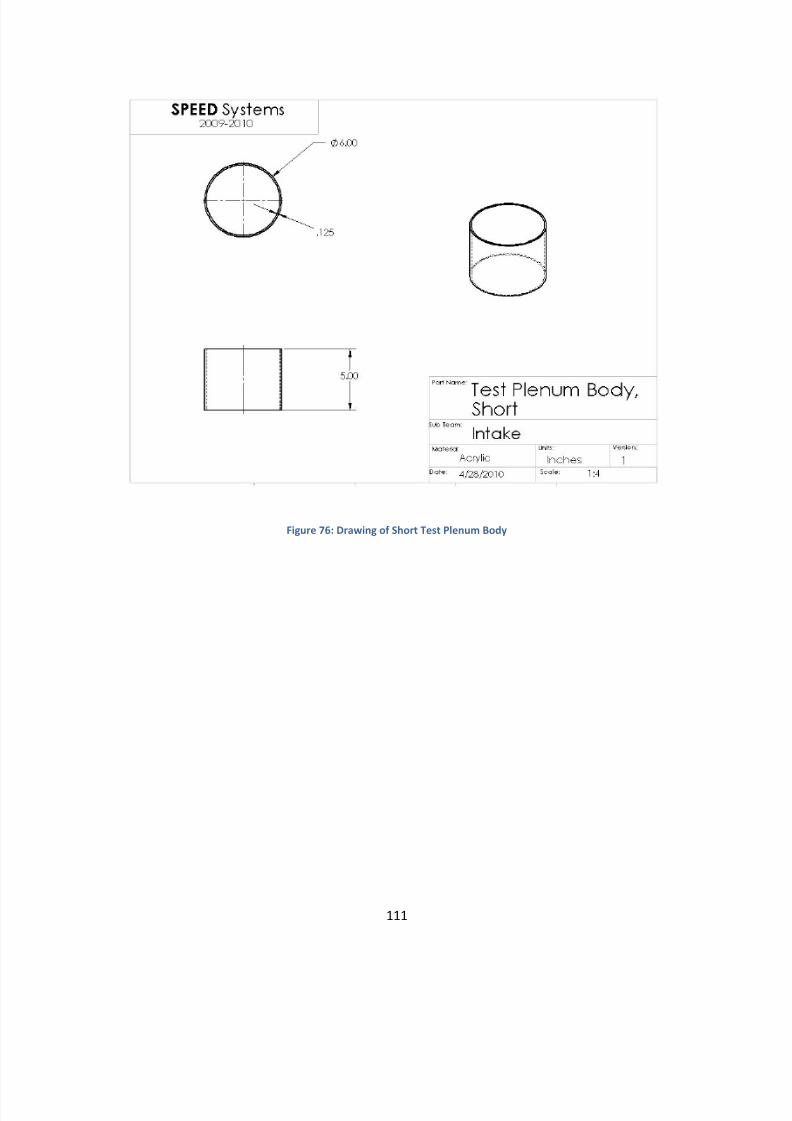
8/10/2019 Ca Poly FormulaSAE Engine Development
http://slidepdf.com/reader/full/ca-poly-formulasae-engine-development 111/142
111
Figure 76: Drawing of Short Test Plenum Body
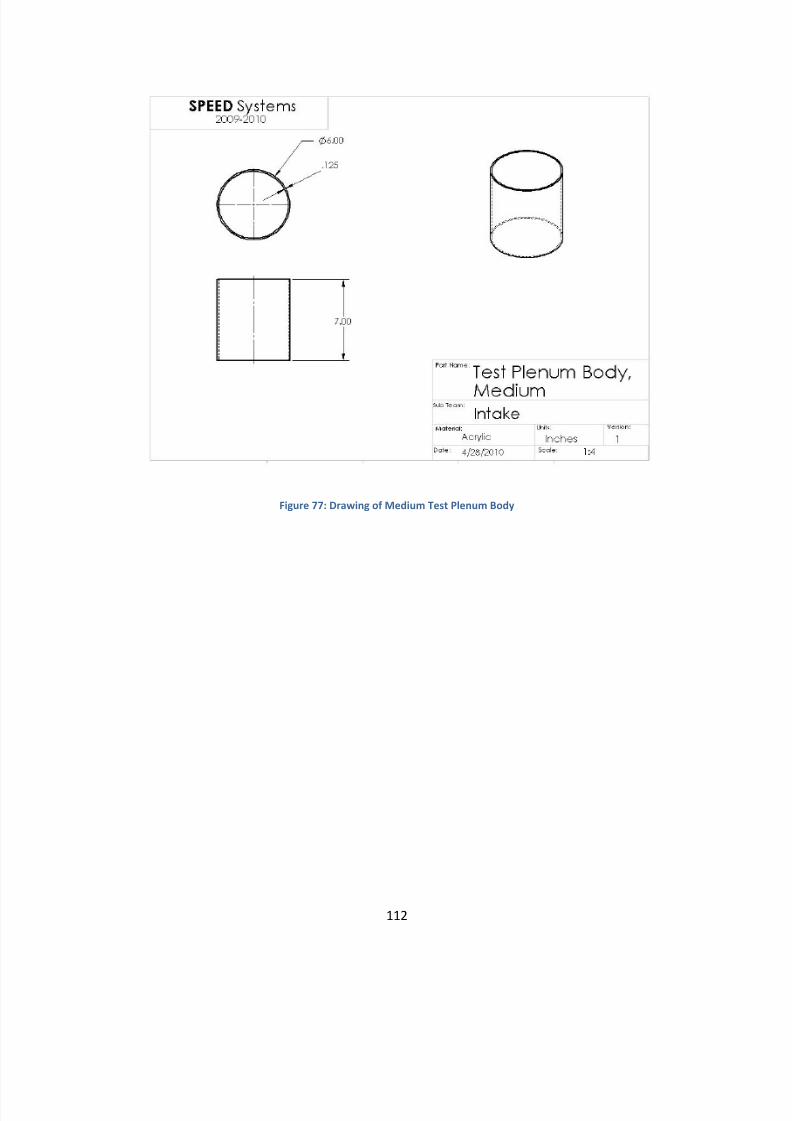
8/10/2019 Ca Poly FormulaSAE Engine Development
http://slidepdf.com/reader/full/ca-poly-formulasae-engine-development 112/142
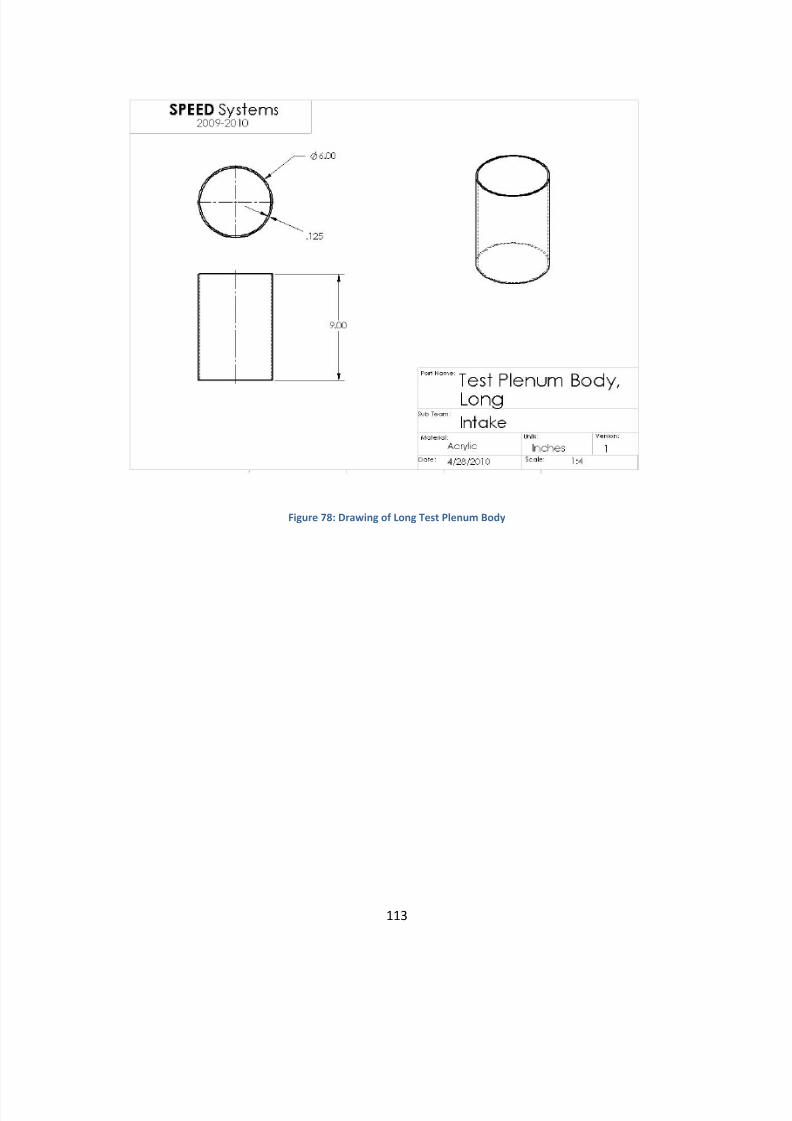
8/10/2019 Ca Poly FormulaSAE Engine Development
http://slidepdf.com/reader/full/ca-poly-formulasae-engine-development 113/142
113
Figure 78: Drawing of Long Test Plenum Body
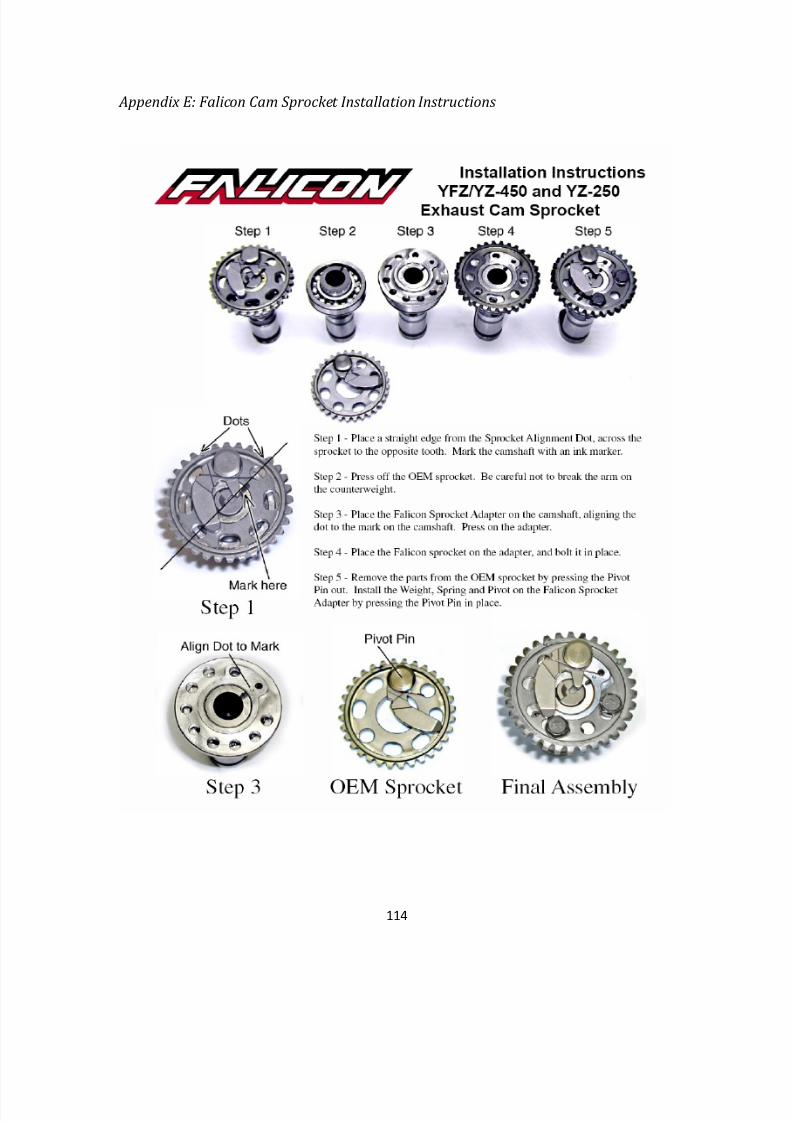
8/10/2019 Ca Poly FormulaSAE Engine Development
http://slidepdf.com/reader/full/ca-poly-formulasae-engine-development 114/142
114
Appendix E: Falicon Cam Sprocket Installation Instructions
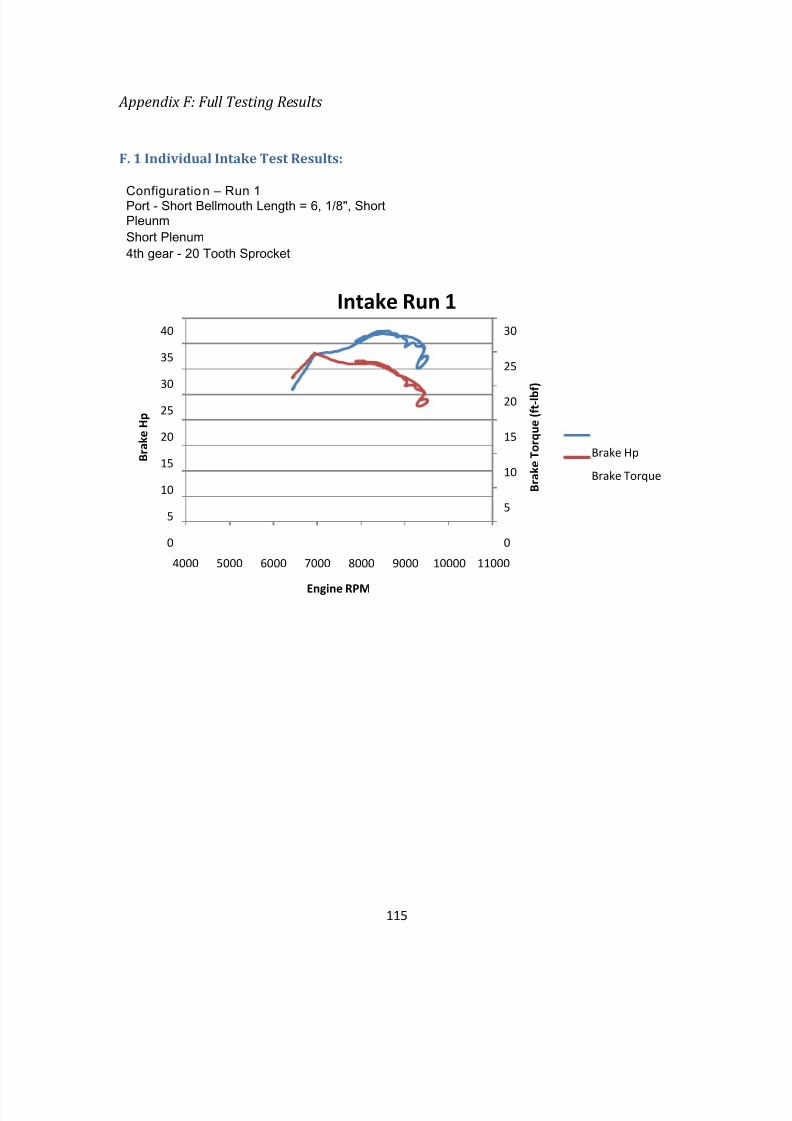
8/10/2019 Ca Poly FormulaSAE Engine Development
http://slidepdf.com/reader/full/ca-poly-formulasae-engine-development 115/142
115
Appendix F: Full Testing Results
F. 1 Individual Intake Test Results:
Configuratio n – Run 1Port - Short Bellmouth Length = 6, 1/8", ShortPleunmShort Plenum4th gear - 20 Tooth Sprocket
0
5
10
15
20
25
30
0
5
10
15
20
25
30
35
40
4000 5000 6000 7000 8000 9000 10000 11000
B r a k e T o r q u e
( f t - l b f )
B r a k e H p
Engine RPM
Intake Run 1
Brake Hp
Brake Torque
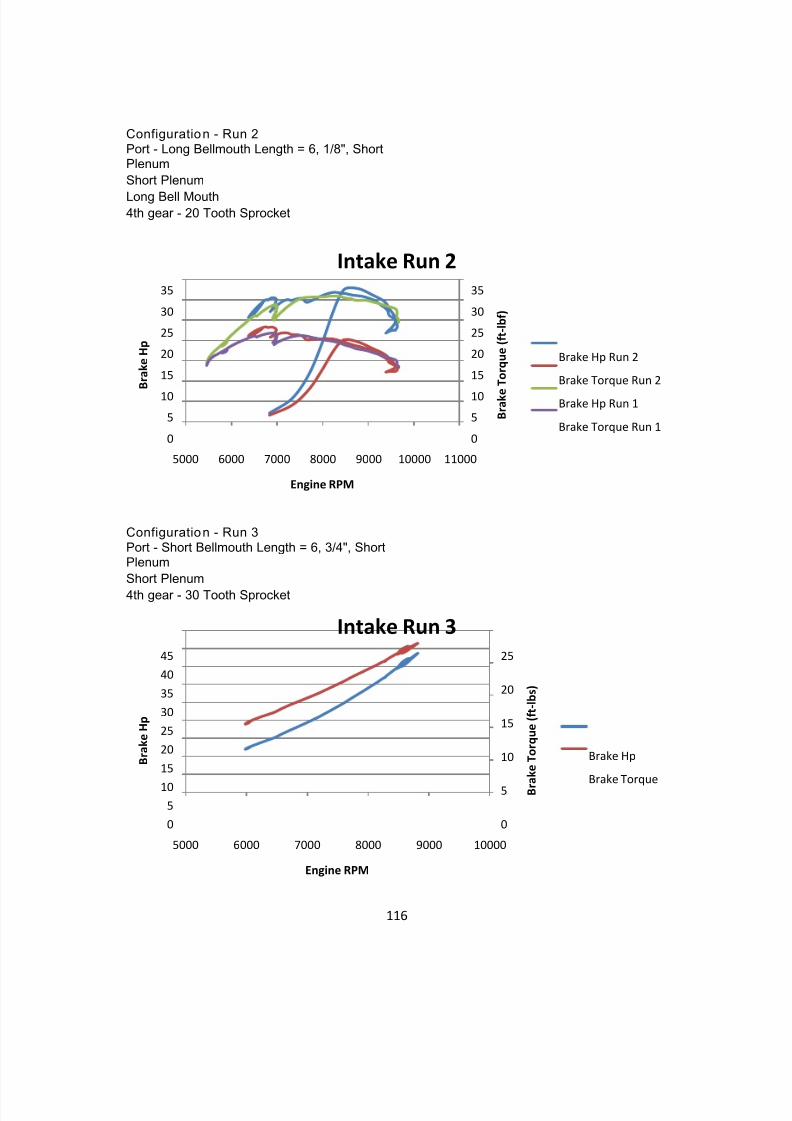
8/10/2019 Ca Poly FormulaSAE Engine Development
http://slidepdf.com/reader/full/ca-poly-formulasae-engine-development 116/142
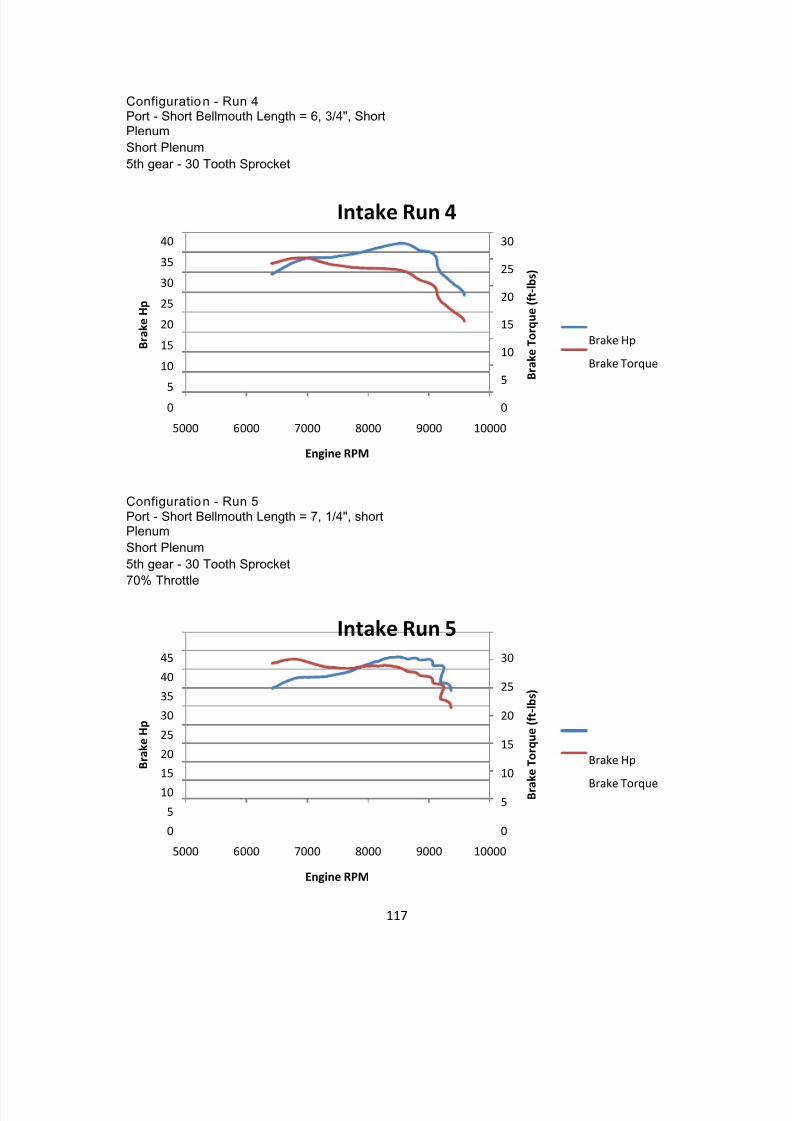
8/10/2019 Ca Poly FormulaSAE Engine Development
http://slidepdf.com/reader/full/ca-poly-formulasae-engine-development 117/142
117
Configuratio n - Run 4Port - Short Bellmouth Length = 6, 3/4", ShortPlenumShort Plenum5th gear - 30 Tooth Sprocket
Configuratio n - Run 5Port - Short Bellmouth Length = 7, 1/4", shortPlenumShort Plenum5th gear - 30 Tooth Sprocket70% Throttle
0
5
10
15
20
25
30
05
10
15
20
25
30
35
40
5000 6000 7000 8000 9000 10000
B r a k e T o r q u e
( f t - l b s )
B r a k e H p
Engine RPM
Intake Run 4
Brake Hp
Brake Torque
0
5
10
15
20
25
30
0
5
10
15
20
25
30
35
40
45
5000 6000 7000 8000 9000 10000
B r a k e T o r q u e
( f t - l b s )
B r a k e H p
Engine RPM
Intake Run 5
Brake Hp
Brake Torque
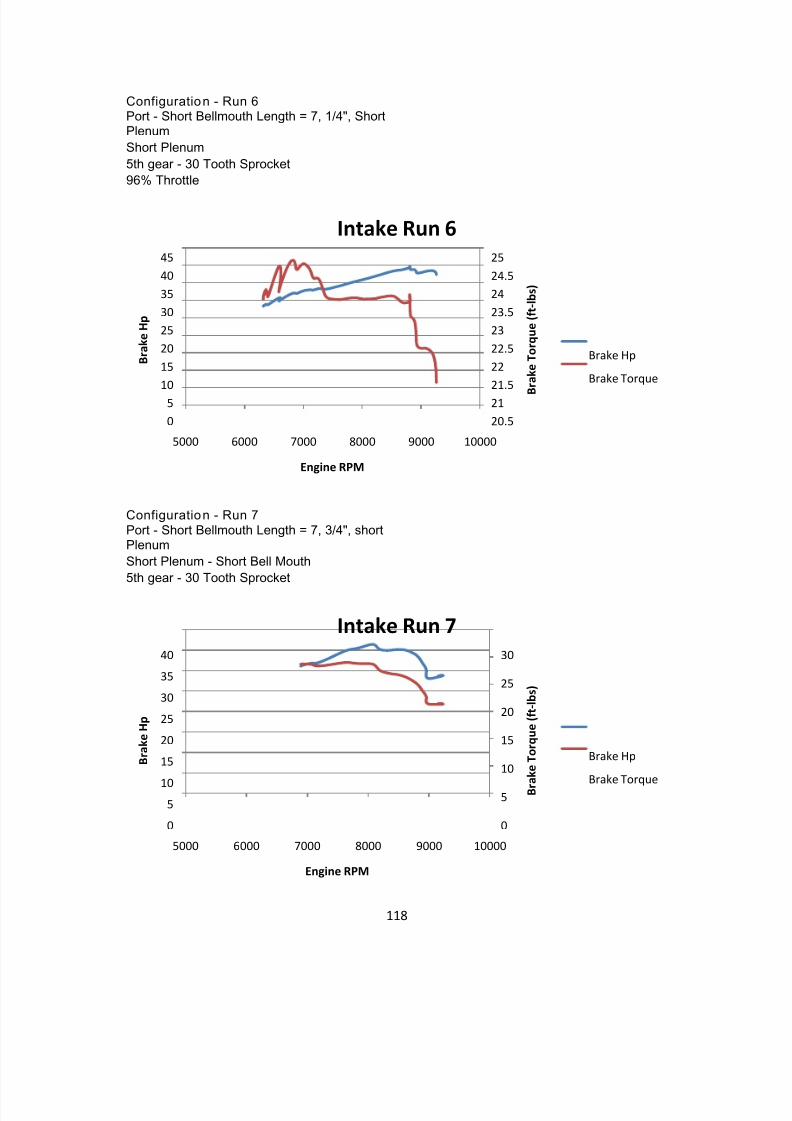
8/10/2019 Ca Poly FormulaSAE Engine Development
http://slidepdf.com/reader/full/ca-poly-formulasae-engine-development 118/142
118
Configuratio n - Run 6Port - Short Bellmouth Length = 7, 1/4", ShortPlenumShort Plenum5th gear - 30 Tooth Sprocket96% Throttle
Configuratio n - Run 7Port - Short Bellmouth Length = 7, 3/4", shortPlenumShort Plenum - Short Bell Mouth5th gear - 30 Tooth Sprocket
20.52121.52222.52323.52424.525
05
1015202530354045
5000 6000 7000 8000 9000 10000
B r a k e T o r q u e
( f t - l b s )
B r a k e H p
Engine RPM
Intake Run 6
Brake Hp
Brake Torque
0
5
10
15
20
25
30
0
510
15
20
25
30
35
40
5000 6000 7000 8000 9000 10000
B r a k e T o r q u e
( f t - l b s )
B r a k e H p
Engine RPM
Intake Run 7
Brake Hp
Brake Torque
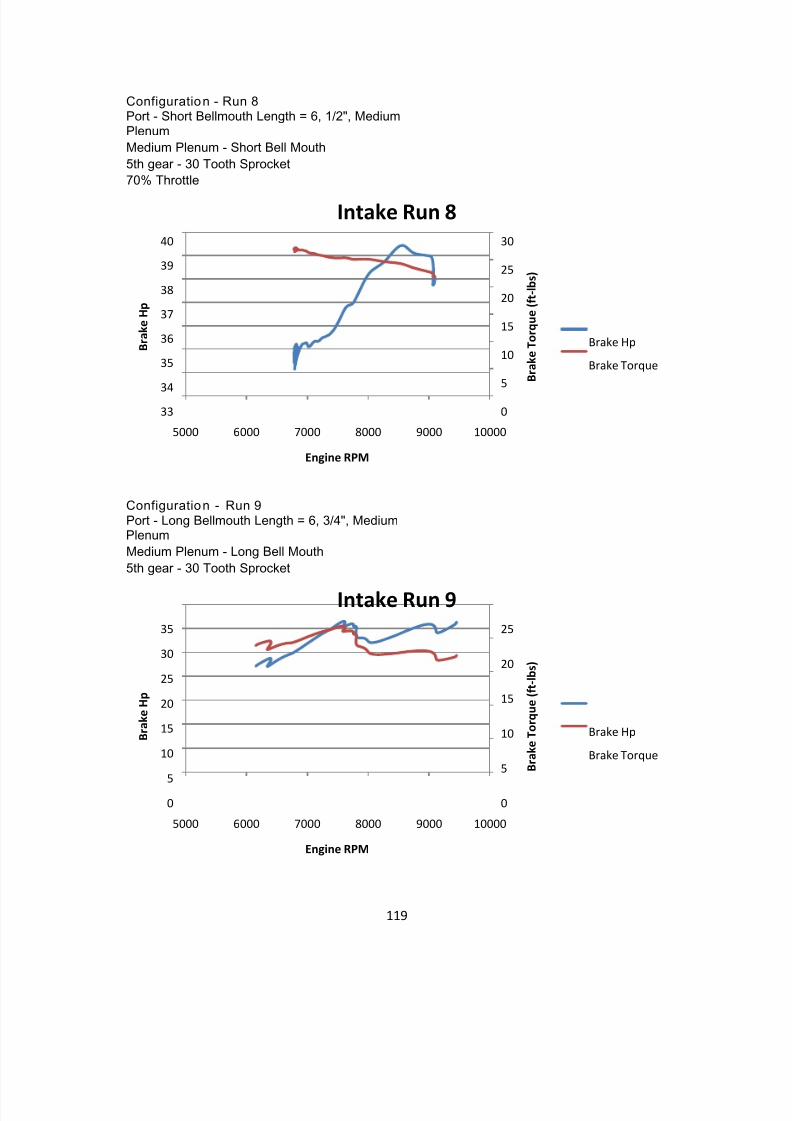
8/10/2019 Ca Poly FormulaSAE Engine Development
http://slidepdf.com/reader/full/ca-poly-formulasae-engine-development 119/142
119
Configuratio n - Run 8Port - Short Bellmouth Length = 6, 1/2", MediumPlenumMedium Plenum - Short Bell Mouth5th gear - 30 Tooth Sprocket70% Throttle
Configuratio n - Run 9Port - Long Bellmouth Length = 6, 3/4", MediumPlenumMedium Plenum - Long Bell Mouth5th gear - 30 Tooth Sprocket
0
5
10
15
20
25
30
3334
35
36
37
38
39
40
5000 6000 7000 8000 9000 10000
B r a k e T o r q u e
( f t - l b s )
B r a k e H p
Engine RPM
Intake Run 8
Brake Hp
Brake Torque
0
5
10
15
20
25
0
5
10
15
20
25
30
35
5000 6000 7000 8000 9000 10000
B r a k e T o r q u e
( f t - l b s )
B r a k e H p
Engine RPM
Intake Run 9
Brake Hp
Brake Torque
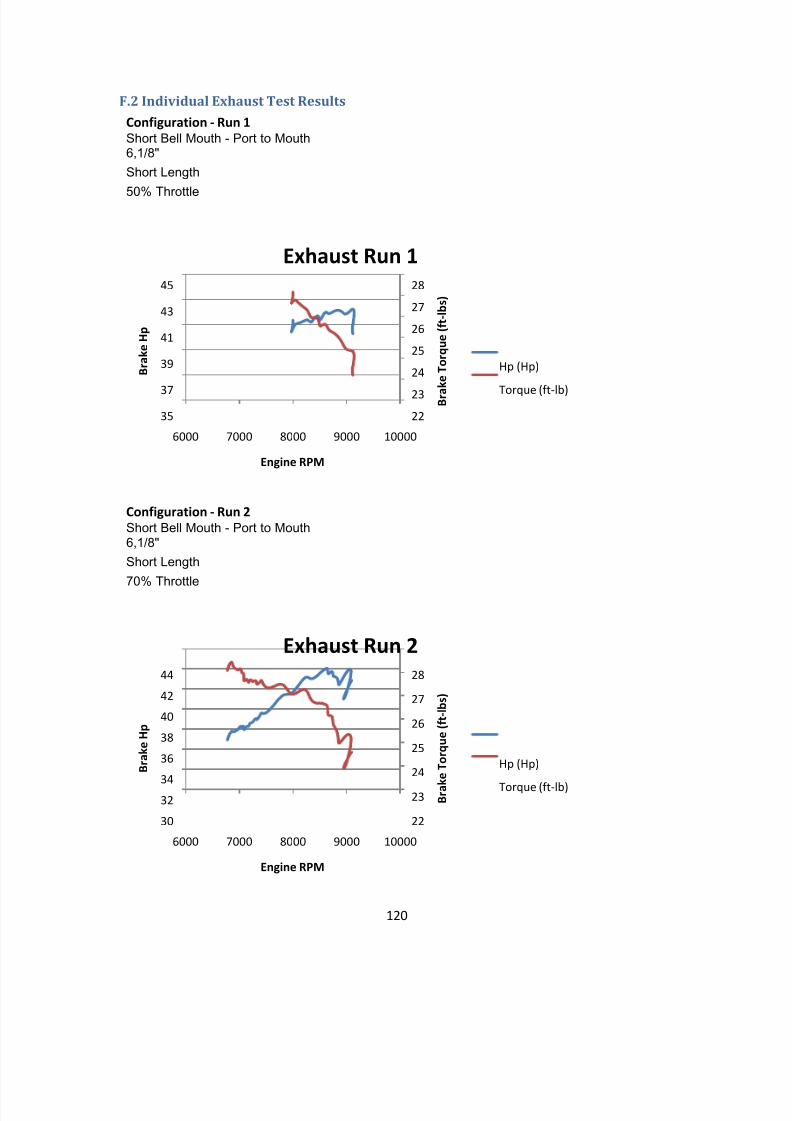
8/10/2019 Ca Poly FormulaSAE Engine Development
http://slidepdf.com/reader/full/ca-poly-formulasae-engine-development 120/142
120
F.2 Individual Exhaust Test ResultsConfiguration - Run 1Short Bell Mouth - Port to Mouth6,1/8"Short Length
50% Throttle
Configuration - Run 2Short Bell Mouth - Port to Mouth6,1/8"Short Length
70% Throttle
2223
24
25
26
27
28
3537
39
41
43
45
6000 7000 8000 9000 10000
B r a k e T o r q u e
( f t - l b s )
B r a k e H p
Engine RPM
Exhaust Run 1
Hp (Hp)
Torque (ft-lb)
22
23
24
25
26
27
28
30
32
34
36
38
40
42
44
6000 7000 8000 9000 10000
B r a
k e T o r q u e
( f t - l b s )
B r a k e H p
Engine RPM
Exhaust Run 2
Hp (Hp)
Torque (ft-lb)
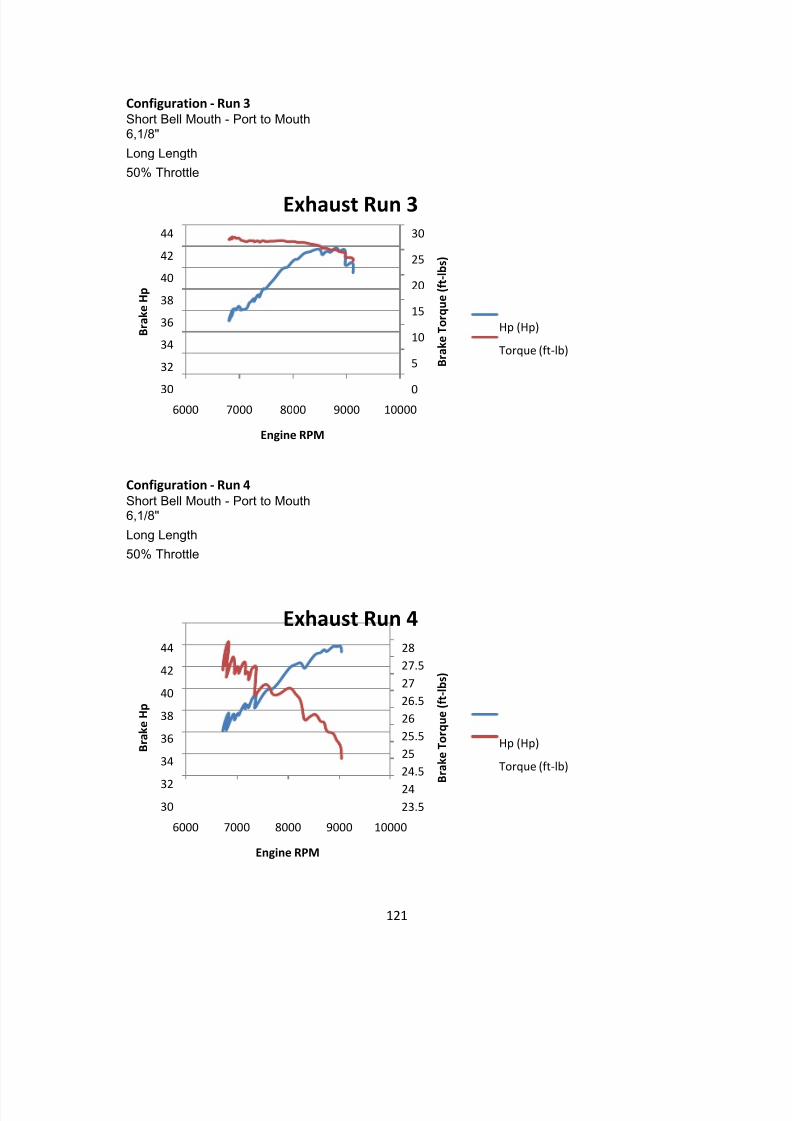
8/10/2019 Ca Poly FormulaSAE Engine Development
http://slidepdf.com/reader/full/ca-poly-formulasae-engine-development 121/142
121
Configuration - Run 3Short Bell Mouth - Port to Mouth6,1/8"
Long Length50% Throttle
Configuration - Run 4Short Bell Mouth - Port to Mouth6,1/8"
Long Length50% Throttle
0
5
10
15
20
25
30
30
32
34
36
38
40
42
44
6000 7000 8000 9000 10000
B r a k e T o r q u e
( f t - l b s )
B r a k e H p
Engine RPM
Exhaust Run 3
Hp (Hp)
Torque (ft-lb)
23.524
24.52525.52626.52727.528
3032
34
36
38
40
42
44
6000 7000 8000 9000 10000
B r a k e T o r q u e
( f t - l b s )
B r a k e H p
Engine RPM
Exhaust Run 4
Hp (Hp)
Torque (ft-lb)
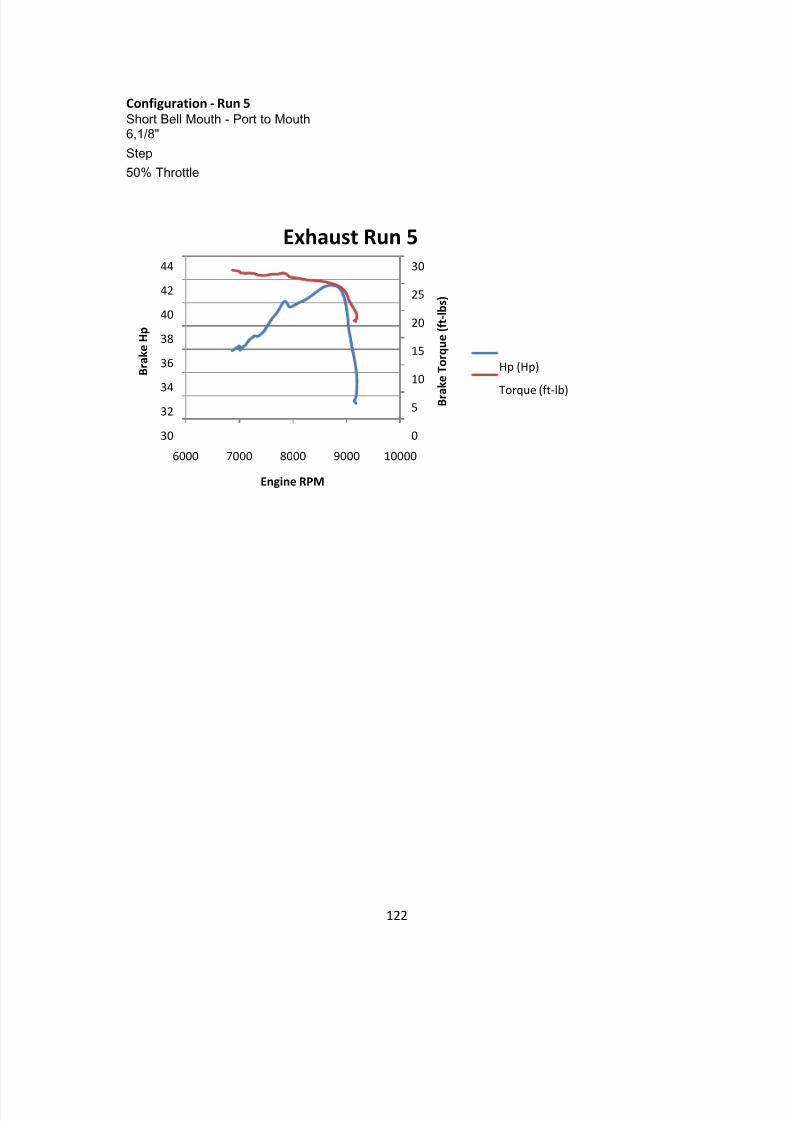
8/10/2019 Ca Poly FormulaSAE Engine Development
http://slidepdf.com/reader/full/ca-poly-formulasae-engine-development 122/142
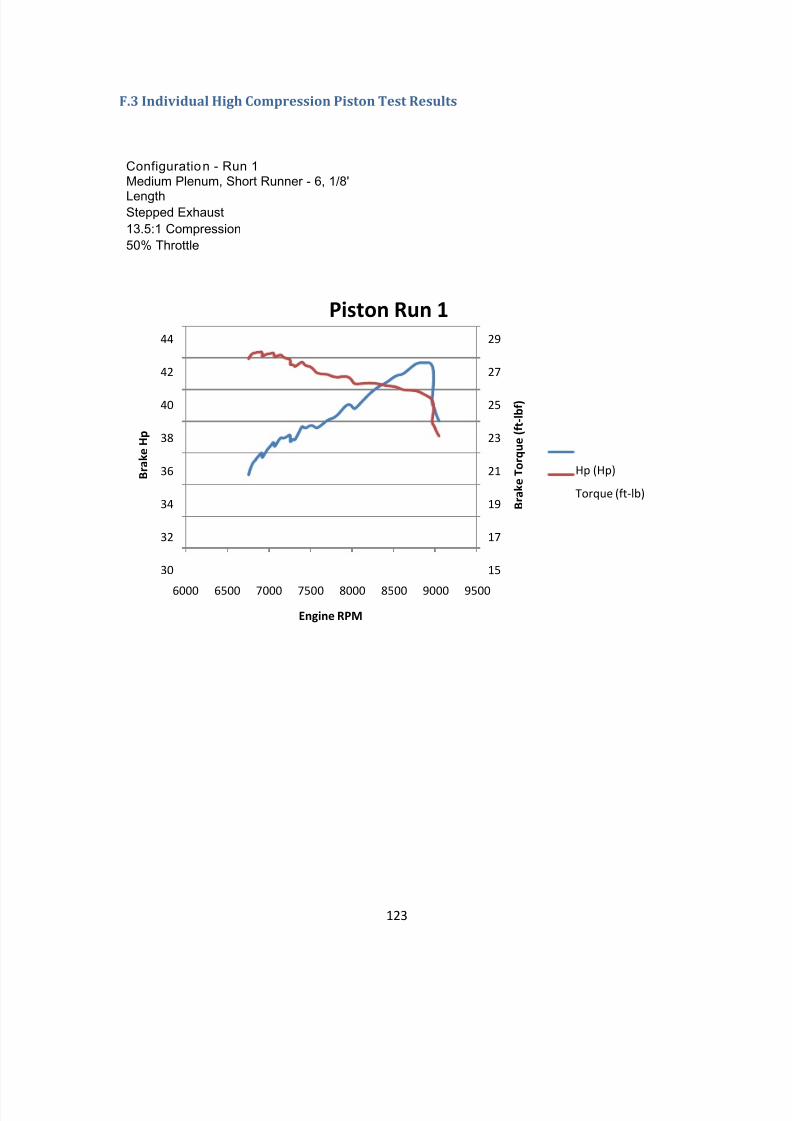
8/10/2019 Ca Poly FormulaSAE Engine Development
http://slidepdf.com/reader/full/ca-poly-formulasae-engine-development 123/142
123
F.3 Individual High Compression Piston Test Results
Configuratio n - Run 1Medium Plenum, Short Runner - 6, 1/8'
LengthStepped Exhaust13.5:1 Compression50% Throttle
15
17
19
21
23
25
27
29
30
32
34
36
38
40
42
44
6000 6500 7000 7500 8000 8500 9000 9500
B r a k e T o r q u e
( f t - l b f )
B r a k e H p
Engine RPM
Piston Run 1
Hp (Hp)
Torque (ft-lb)
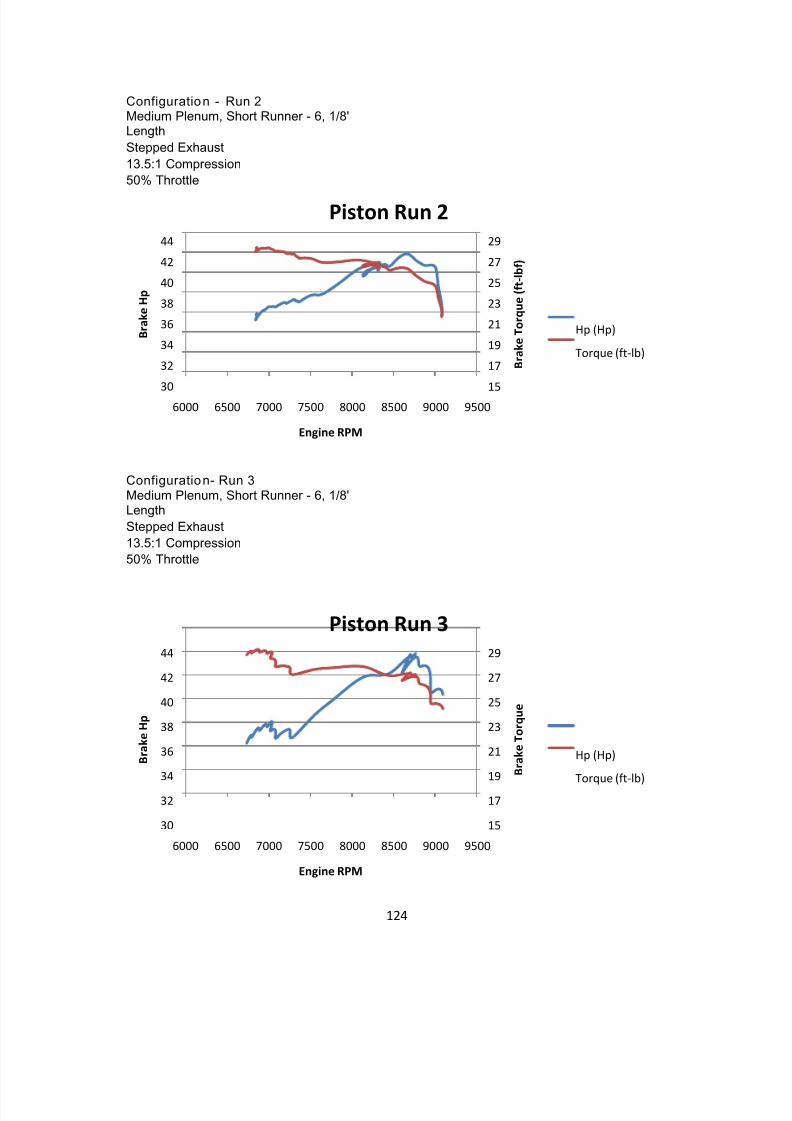
8/10/2019 Ca Poly FormulaSAE Engine Development
http://slidepdf.com/reader/full/ca-poly-formulasae-engine-development 124/142
124
Configuratio n - Run 2Medium Plenum, Short Runner - 6, 1/8'LengthStepped Exhaust13.5:1 Compression50% Throttle
Configuratio n- Run 3Medium Plenum, Short Runner - 6, 1/8'LengthStepped Exhaust13.5:1 Compression50% Throttle
15
17
19
21
23
25
27
29
30
32
34
36
38
40
42
44
6000 6500 7000 7500 8000 8500 9000 9500
B r a k e T o r q u e
( f t - l b f )
B r a k e H p
Engine RPM
Piston Run 2
Hp (Hp)
Torque (ft-lb)
15
17
19
21
23
25
27
29
30
32
34
36
38
40
42
44
6000 6500 7000 7500 8000 8500 9000 9500
B r a k e T o r q u e
B r a k e H p
Engine RPM
Piston Run 3
Hp (Hp)
Torque (ft-lb)
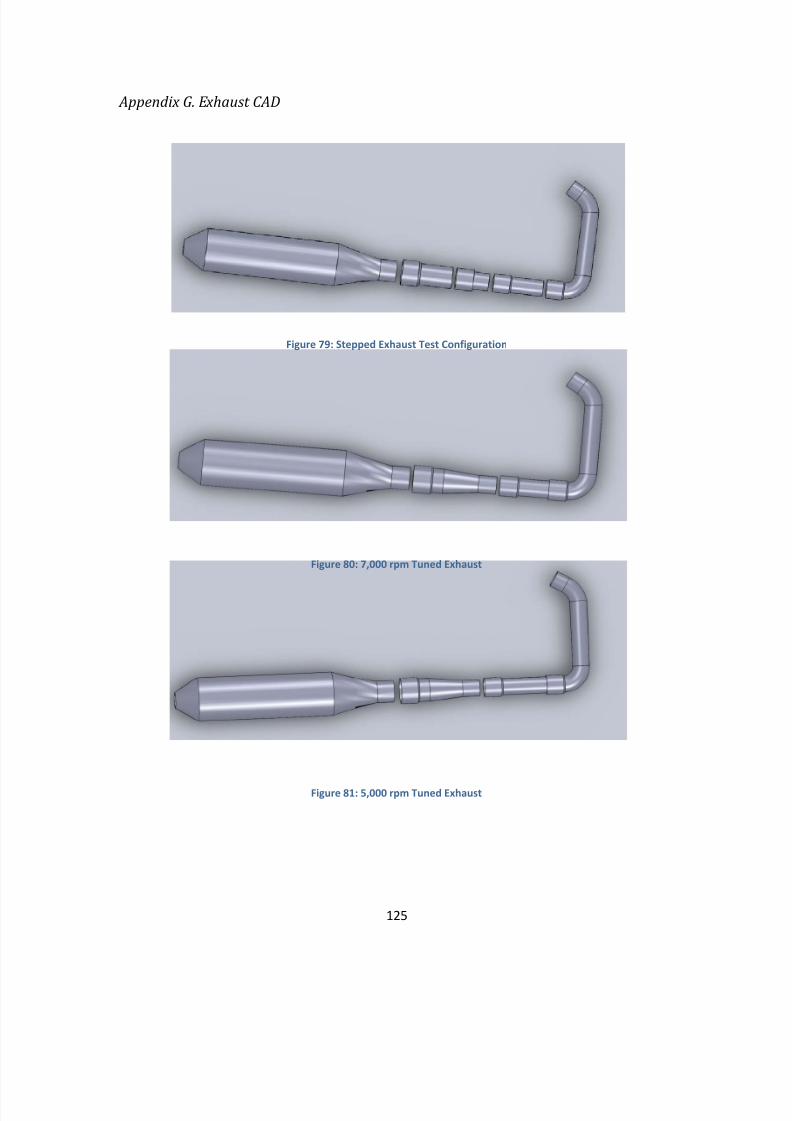
8/10/2019 Ca Poly FormulaSAE Engine Development
http://slidepdf.com/reader/full/ca-poly-formulasae-engine-development 125/142
125
Appendix G. Exhaust CAD
Figure 79: Stepped Exhaust Test Configuration
Figure 80: 7,000 rpm Tuned Exhaust
Figure 81: 5,000 rpm Tuned Exhaust
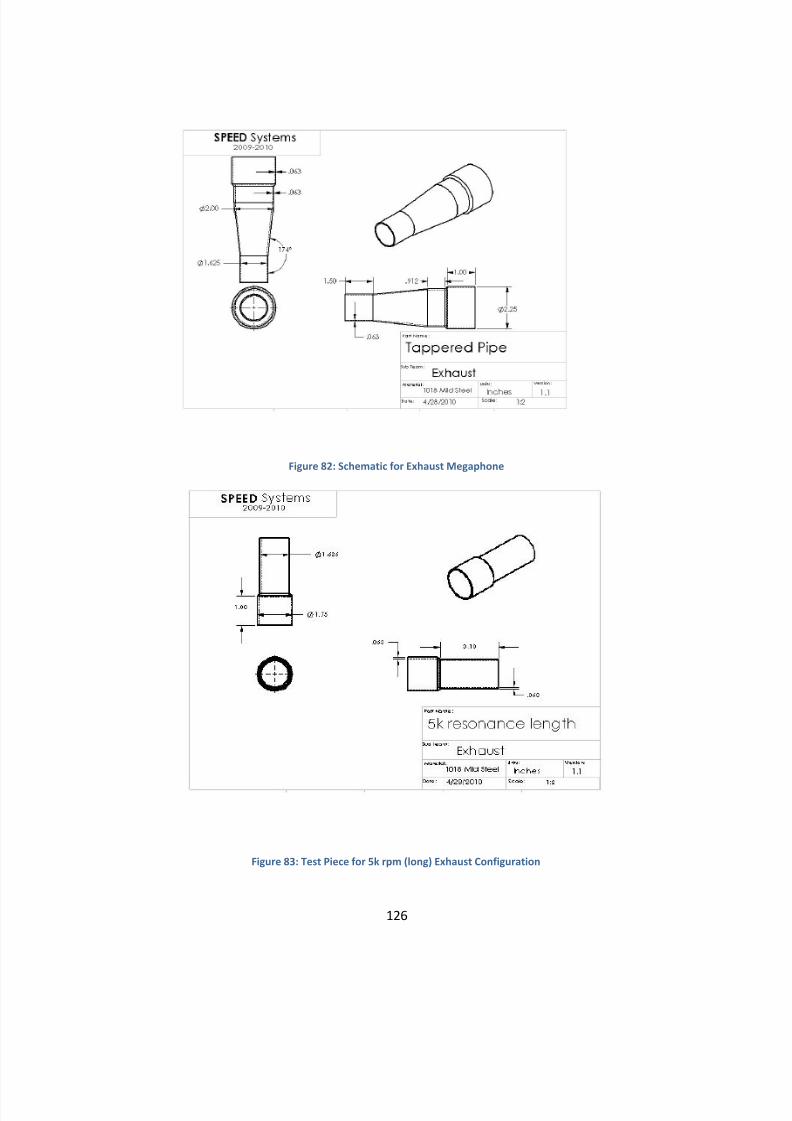
8/10/2019 Ca Poly FormulaSAE Engine Development
http://slidepdf.com/reader/full/ca-poly-formulasae-engine-development 126/142
126
Figure 82: Schematic for Exhaust Megaphone
Figure 83: Test Piece for 5k rpm (long) Exhaust Configuration
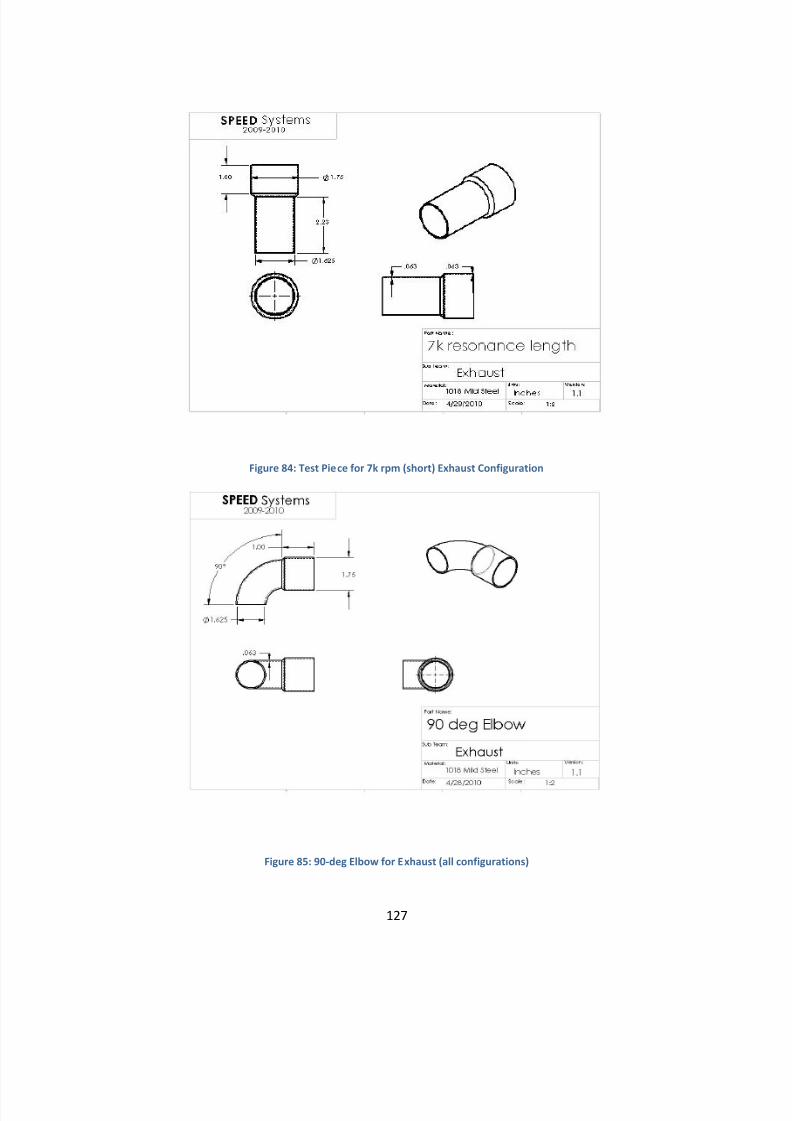
8/10/2019 Ca Poly FormulaSAE Engine Development
http://slidepdf.com/reader/full/ca-poly-formulasae-engine-development 127/142
127
Figure 84: Test Piece for 7k rpm (short) Exhaust Configuration
Figure 85: 90-deg Elbow for Exhaust (all configurations)
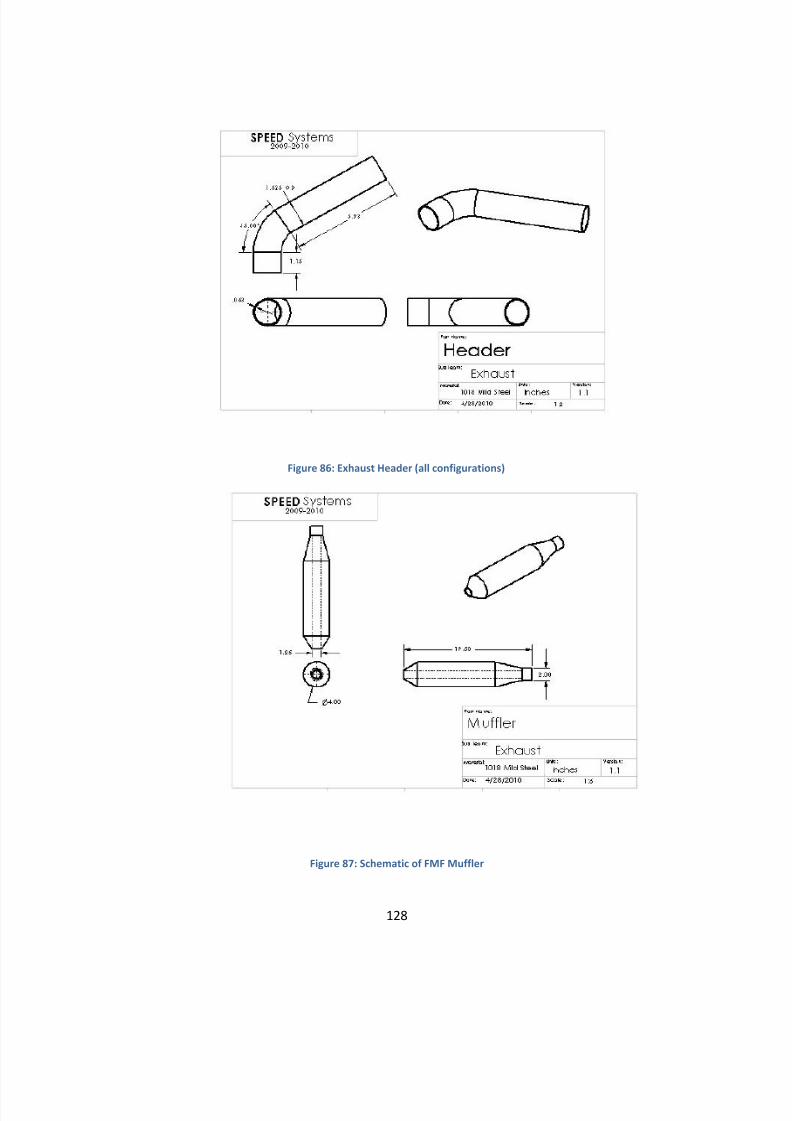
8/10/2019 Ca Poly FormulaSAE Engine Development
http://slidepdf.com/reader/full/ca-poly-formulasae-engine-development 128/142
128
Figure 86: Exhaust Header (all configurations)
Figure 87: Schematic of FMF Muffler
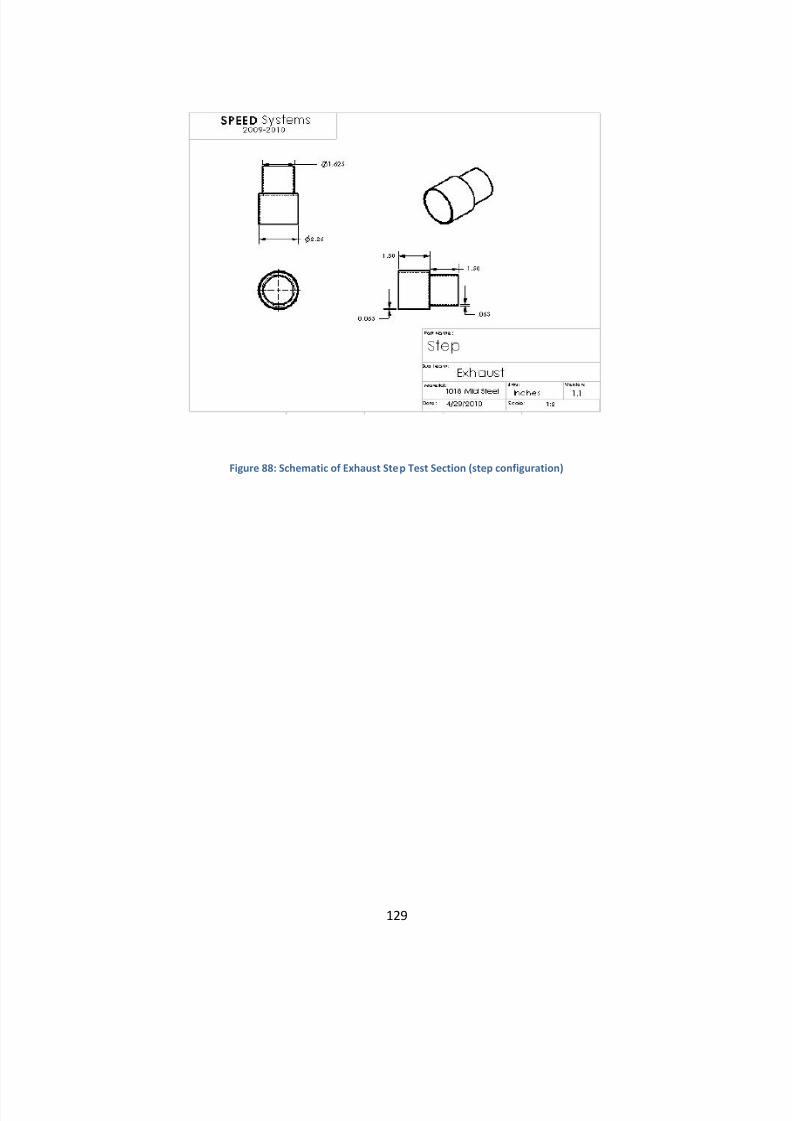
8/10/2019 Ca Poly FormulaSAE Engine Development
http://slidepdf.com/reader/full/ca-poly-formulasae-engine-development 129/142
129
Figure 88: Schematic of Exhaust Step Test Section (step configuration)
8/10/2019 Ca Poly FormulaSAE Engine Development
http://slidepdf.com/reader/full/ca-poly-formulasae-engine-development 130/142
130
Appendix H: Ricardo WAVE Tutorial
Created by Leon Vinokurov
5/31/2010
Ricardo WAVE Tutorial
To access the built in tutorial:
Open WAVE Find Help drop down menu above the toolbar Click on Help and go to WAVE Help… Or you can just press F1 on the keyboard
Click the WAVEBuild icon Select Tutorials in the box on the left Go to Beginner Tutorial >>> Building an SI model
Leon’s Tutorial
This is the method of how the WR450 model was created and what
improvements can be made, as well as tips on engine measurements, graphcreation and building multi-cylinder models. This tutorial is based on thebuilt in help in WAVE.
You can follow along with the WAVE Tutorial while using this one, to gain abigger, more in-depth understanding of what is going on.
If questions remain, consult the Help menu in WAVE or contact me.
*Drop down menus in italics
**Selections are in bold
Step 1: Measurements
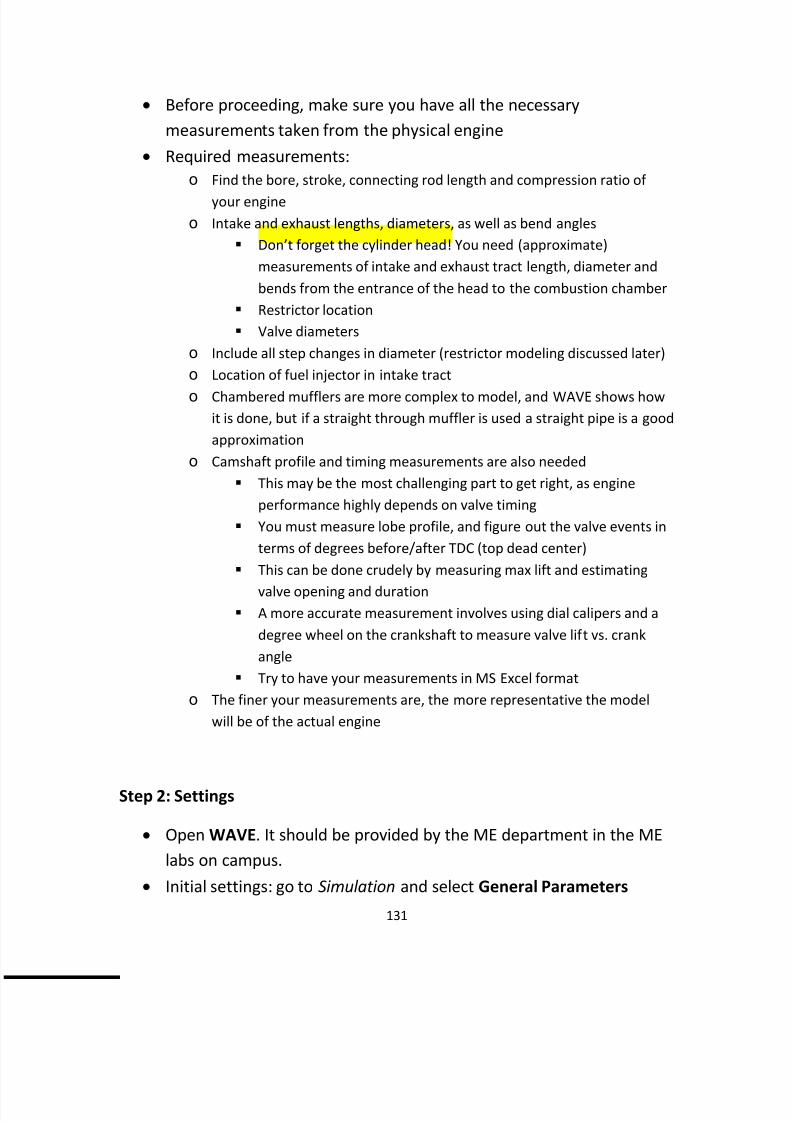
8/10/2019 Ca Poly FormulaSAE Engine Development
http://slidepdf.com/reader/full/ca-poly-formulasae-engine-development 131/142
131
• Before proceeding, make sure you have all the necessarymeasurements taken from the physical engine
• Required measurements:o Find the bore, stroke, connecting rod length and compression ratio of
your engineo Intake and exhaust lengths, diameters, as well as bend angles
Don’t forget the cylinder head! You need (approximate)measurements of intake and exhaust tract length, diameter andbends from the entrance of the head to the combustion chamber
Restrictor location Valve diameters
o Include all step changes in diameter (restrictor modeling discussed later)o Location of fuel injector in intake tracto Chambered mufflers are more complex to model, and WAVE shows how
it is done, but if a straight through muffler is used a straight pipe is a goodapproximation
o Camshaft profile and timing measurements are also needed This may be the most challenging part to get right, as engine
performance highly depends on valve timing You must measure lobe profile, and figure out the valve events in
terms of degrees before/after TDC (top dead center) This can be done crudely by measuring max lift and estimating
valve opening and duration A more accurate measurement involves using dial calipers and a
degree wheel on the crankshaft to measure valve lift vs. crankangle
Try to have your measurements in MS Excel formato The finer your measurements are, the more representative the model
will be of the actual engine
Step 2: Settings
• Open WAVE . It should be provided by the ME department in the MElabs on campus.
• Initial settings: go to Simulation and select General Parameters
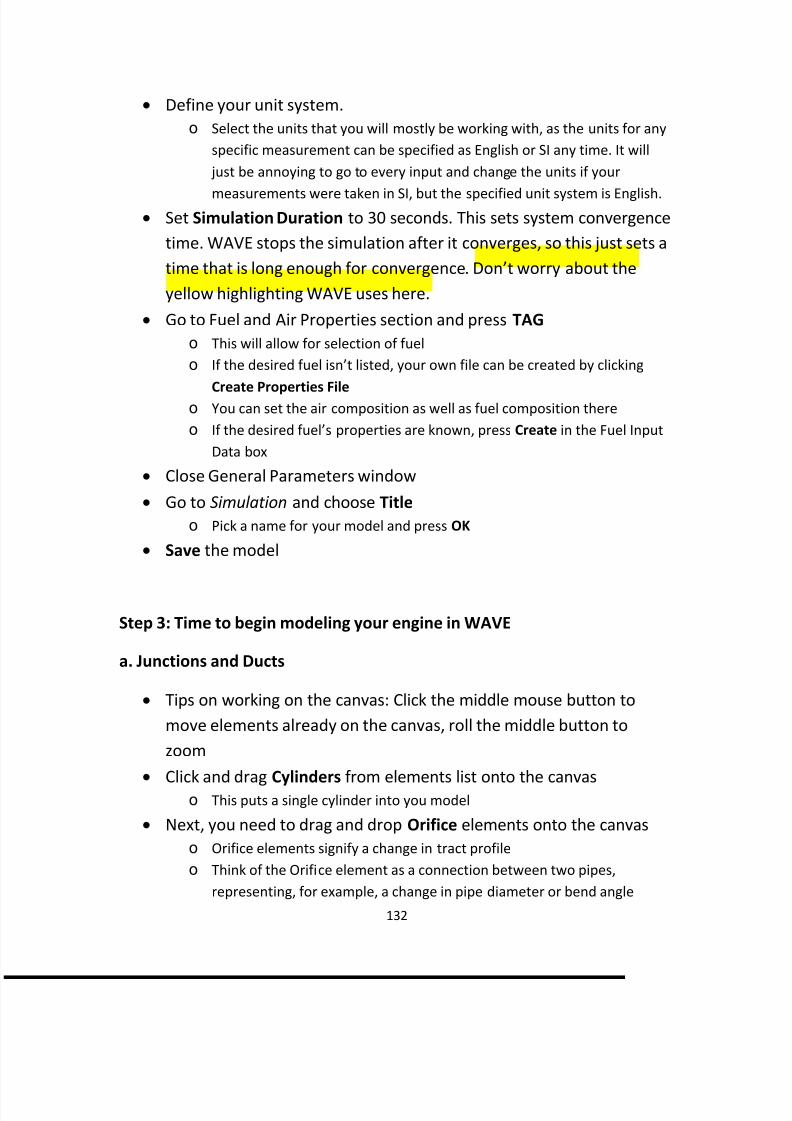
8/10/2019 Ca Poly FormulaSAE Engine Development
http://slidepdf.com/reader/full/ca-poly-formulasae-engine-development 132/142
132
• Define your unit system.o Select the units that you will mostly be working with, as the units for any
specific measurement can be specified as English or SI any time. It will just be annoying to go to every input and change the units if your
measurements were taken in SI, but the specified unit system is English.• Set Simulation Duration to 30 seconds. This sets system convergence
time. WAVE stops the simulation after it converges, so this just sets atime that is long enough for convergence. Don’t worry about theyellow highlighting WAVE uses here.
• Go to Fuel and Air Properties section and press TAG o This will allow for selection of fuelo If the desired fuel isn’t listed, your own file can be created by clicking
Create Properties File o You can set the air composition as well as fuel composition thereo If the desired fuel’s properties are known, press Create in the Fuel Input
Data box• Close General Parameters window• Go to Simulation and choose Title
o Pick a name for your model and press OK • Save the model
Step 3: Time to begin modeling your engine in WAVE
a. Junctions and Ducts
• Tips on working on the canvas: Click the middle mouse button tomove elements already on the canvas, roll the middle button tozoom
•
Click and drag Cylinders from elements list onto the canvas
o This puts a single cylinder into you model• Next, you need to drag and drop Orifice elements onto the canvas
o Orifice elements signify a change in tract profileo Think of the Orifice element as a connection between two pipes,
representing, for example, a change in pipe diameter or bend angle
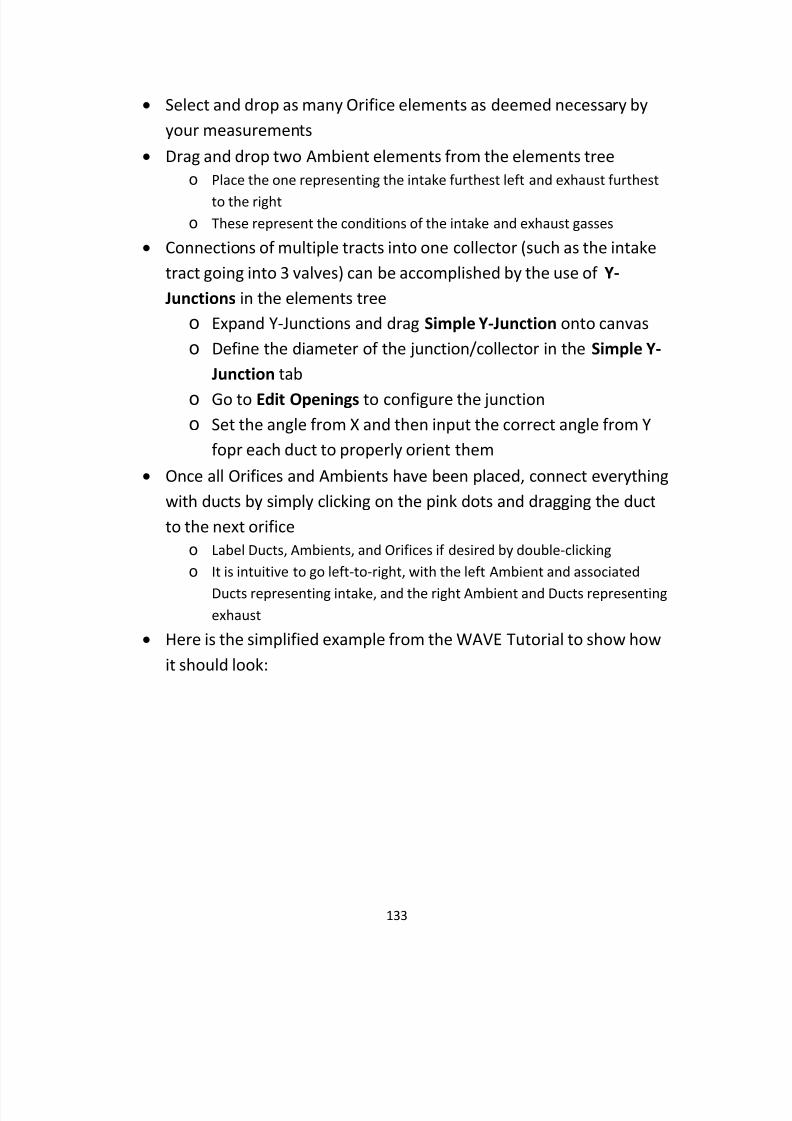
8/10/2019 Ca Poly FormulaSAE Engine Development
http://slidepdf.com/reader/full/ca-poly-formulasae-engine-development 133/142
133
• Select and drop as many Orifice elements as deemed necessary byyour measurements
• Drag and drop two Ambient elements from the elements treeo Place the one representing the intake furthest left and exhaust furthest
to the righto These represent the conditions of the intake and exhaust gasses
• Connections of multiple tracts into one collector (such as the intaketract going into 3 valves) can be accomplished by the use of Y-Junctions in the elements tree
o Expand Y-Junctions and drag Simple Y-Junction onto canvaso Define the diameter of the junction/collector in the Simple Y-
Junction tabo Go to Edit Openings to configure the junctiono Set the angle from X and then input the correct angle from Y
fopr each duct to properly orient them• Once all Orifices and Ambients have been placed, connect everything
with ducts by simply clicking on the pink dots and dragging the ductto the next orifice
o Label Ducts, Ambients, and Orifices if desired by double-clickingo It is intuitive to go left-to-right, with the left Ambient and associated
Ducts representing intake, and the right Ambient and Ducts representingexhaust
• Here is the simplified example from the WAVE Tutorial to show howit should look:
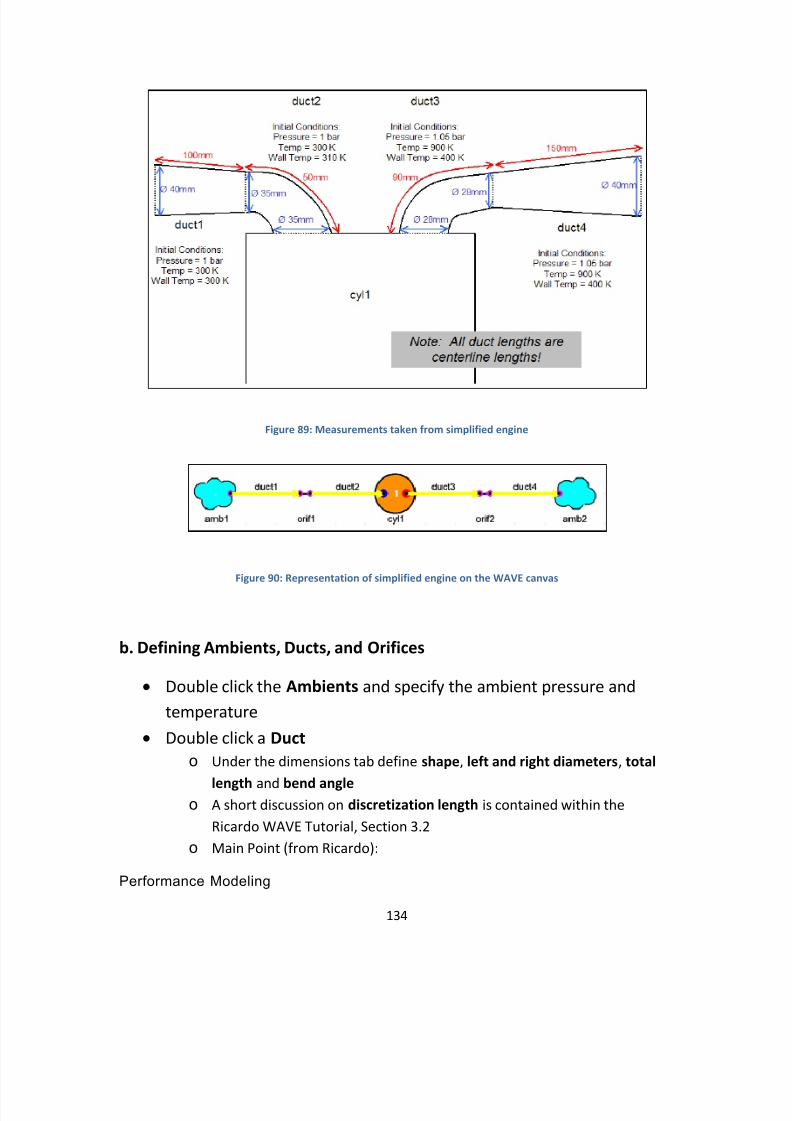
8/10/2019 Ca Poly FormulaSAE Engine Development
http://slidepdf.com/reader/full/ca-poly-formulasae-engine-development 134/142
134
Figure 89: Measurements taken from simplified engine
Figure 90: Representation of simplified engine on the WAVE canvas
b. Defining Ambients, Ducts, and Orifices
• Double click the Ambients and specify the ambient pressure andtemperature
• Double click a Duct o Under the dimensions tab define shape , left and right diameters , total
length and bend angle o A short discussion on discretization length is contained within the
Ricardo WAVE Tutorial, Section 3.2o Main Point (from Ricardo):
Performance Modeling
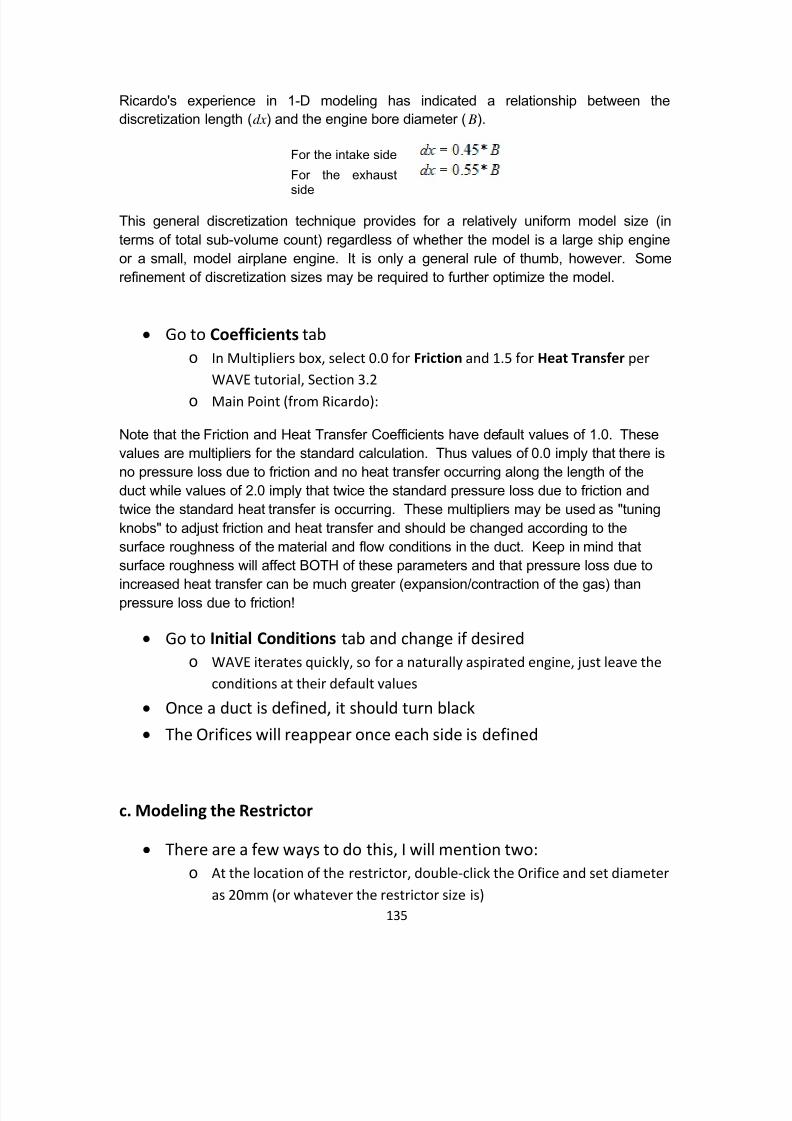
8/10/2019 Ca Poly FormulaSAE Engine Development
http://slidepdf.com/reader/full/ca-poly-formulasae-engine-development 135/142
135
Ricardo's experience in 1-D modeling has indicated a relationship between thediscretization length ( dx ) and the engine bore diameter ( B ).
For the intake side
For the exhaust
side
This general discretization technique provides for a relatively uniform model size (interms of total sub-volume count) regardless of whether the model is a large ship engineor a small, model airplane engine. It is only a general rule of thumb, however. Somerefinement of discretization sizes may be required to further optimize the model.
• Go to Coefficients tabo In Multipliers box, select 0.0 for Friction and 1.5 for Heat Transfer per
WAVE tutorial, Section 3.2o Main Point (from Ricardo):
Note that the Friction and Heat Transfer Coefficients have default values of 1.0. Thesevalues are multipliers for the standard calculation. Thus values of 0.0 imply that there isno pressure loss due to friction and no heat transfer occurring along the length of theduct while values of 2.0 imply that twice the standard pressure loss due to friction andtwice the standard heat transfer is occurring. These multipliers may be used as "tuningknobs" to adjust friction and heat transfer and should be changed according to thesurface roughness of the material and flow conditions in the duct. Keep in mind thatsurface roughness will affect BOTH of these parameters and that pressure loss due to
increased heat transfer can be much greater (expansion/contraction of the gas) thanpressure loss due to friction!
• Go to Initial Conditions tab and change if desiredo WAVE iterates quickly, so for a naturally aspirated engine, just leave the
conditions at their default values• Once a duct is defined, it should turn black• The Orifices will reappear once each side is defined
c. Modeling the Restrictor
• There are a few ways to do this, I will mention two:o At the location of the restrictor, double-click the Orifice and set diameter
as 20mm (or whatever the restrictor size is)
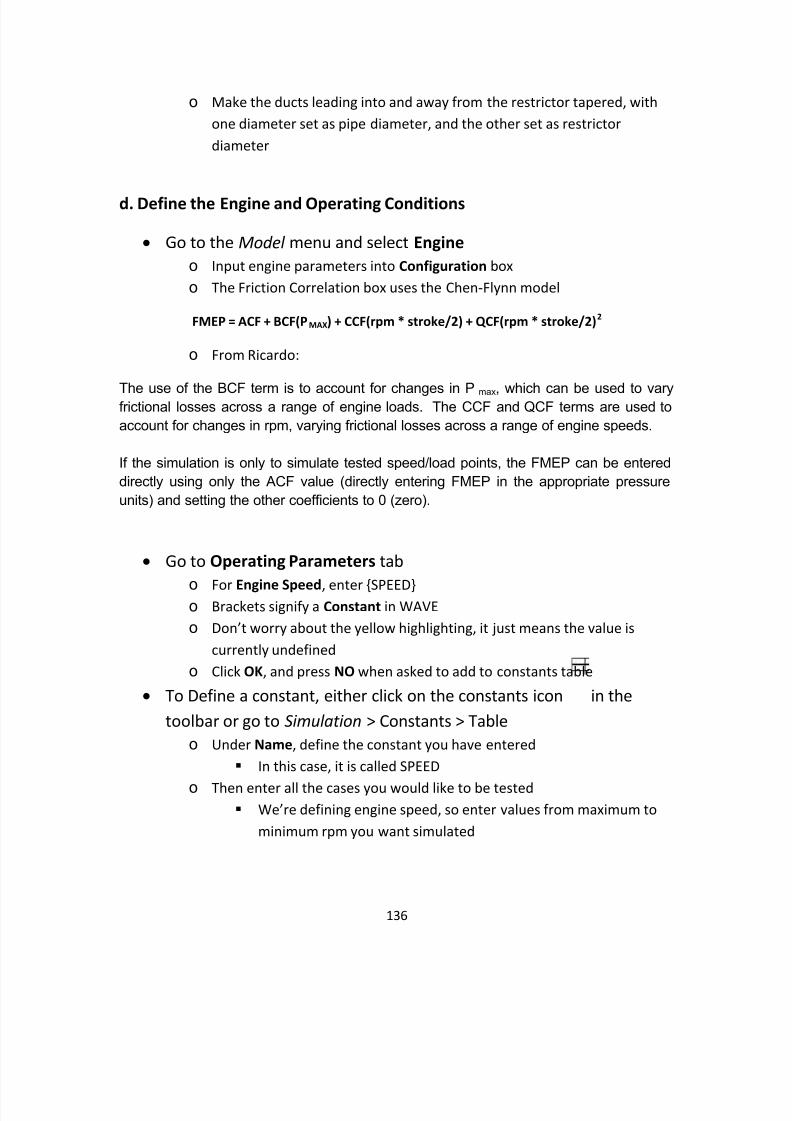
8/10/2019 Ca Poly FormulaSAE Engine Development
http://slidepdf.com/reader/full/ca-poly-formulasae-engine-development 136/142
136
o Make the ducts leading into and away from the restrictor tapered, withone diameter set as pipe diameter, and the other set as restrictordiameter
d. Define the Engine and Operating Conditions
• Go to the Model menu and select Engine o Input engine parameters into Configuration boxo The Friction Correlation box uses the Chen-Flynn model
FMEP = ACF + BCF(PMAX) + CCF(rpm * stroke/2) + QCF(rpm * stroke/2) 2
o From Ricardo:
The use of the BCF term is to account for changes in P max , which can be used to varyfrictional losses across a range of engine loads. The CCF and QCF terms are used toaccount for changes in rpm, varying frictional losses across a range of engine speeds.
If the simulation is only to simulate tested speed/load points, the FMEP can be entereddirectly using only the ACF value (directly entering FMEP in the appropriate pressureunits) and setting the other coefficients to 0 (zero).
• Go to Operating Parameters tab
o For Engine Speed , enter {SPEED}o Brackets signify a Constant in WAVEo Don’t worry about the yellow highlighting, it just means the value is
currently undefinedo ClickOK, and press NO when asked to add to constants table
• To Define a constant, either click on the constants icon in thetoolbar or go to Simulation > Constants > Table
o Under Name , define the constant you have entered In this case, it is called SPEED
o Then enter all the cases you would like to be tested We’re defining engine speed, so enter values from maximum to
minimum rpm you want simulated
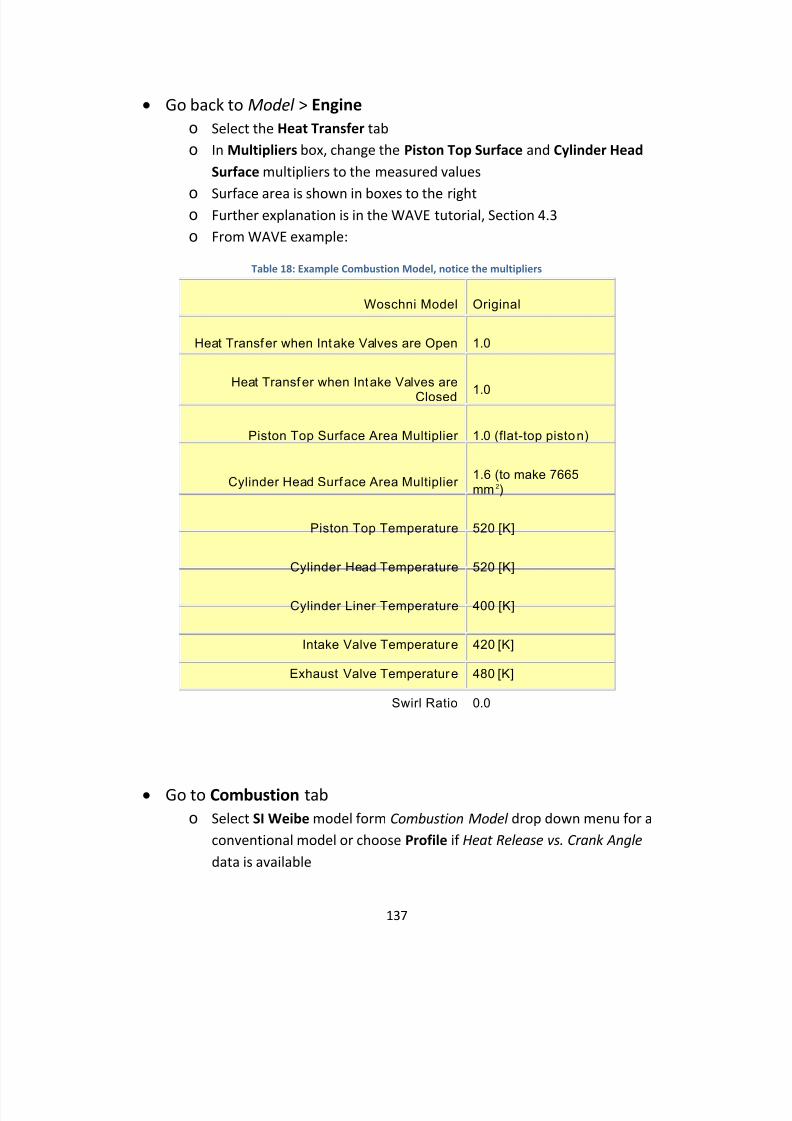
8/10/2019 Ca Poly FormulaSAE Engine Development
http://slidepdf.com/reader/full/ca-poly-formulasae-engine-development 137/142
137
• Go back to Model > Engine o Select the Heat Transfer tabo In Multipliers box, change the Piston Top Surface and Cylinder Head
Surface multipliers to the measured values
o Surface area is shown in boxes to the righto Further explanation is in the WAVE tutorial, Section 4.3o From WAVE example:
Table 18: Example Combustion Model, notice the multipliers
Woschni Model Original
Heat Transf er when Int ake Valves are Open 1.0
Heat Transf er when Intake Valves areClosed 1.0
Piston Top Surface Area Multiplier 1.0 (flat-top pisto n)
Cylinder Head Surf ace Area Multiplier 1.6 (to make 7665mm 2)
Piston Top Temperature 520 [K]
Cylinder Head Temperature 520 [K]
Cylinder Liner Temperature 400 [K]
Intake Valve Temperature 420 [K]
Exhaust Valve Temperatur e 480 [K]
Swirl Ratio 0.0
• Go to Combustion tabo Select SI Weibe model form Combustion Model drop down menu for a
conventional model or choose Profile if Heat Release vs. Crank Angle data is available
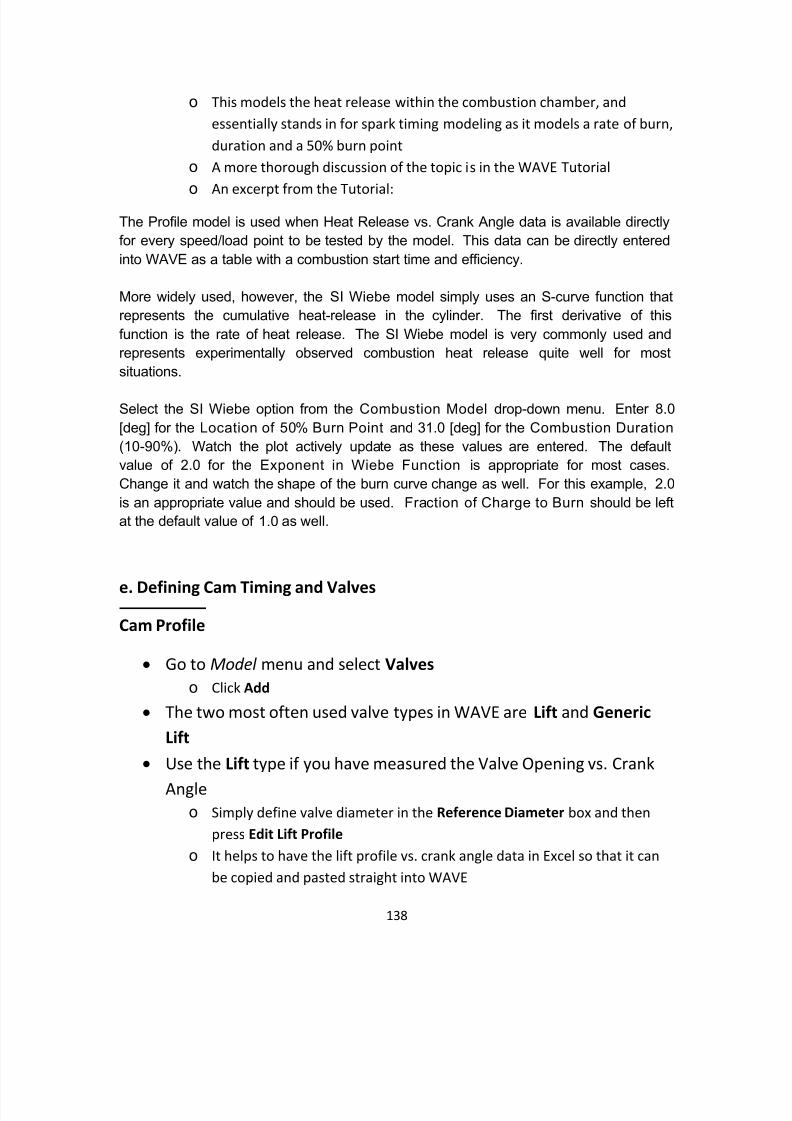
8/10/2019 Ca Poly FormulaSAE Engine Development
http://slidepdf.com/reader/full/ca-poly-formulasae-engine-development 138/142
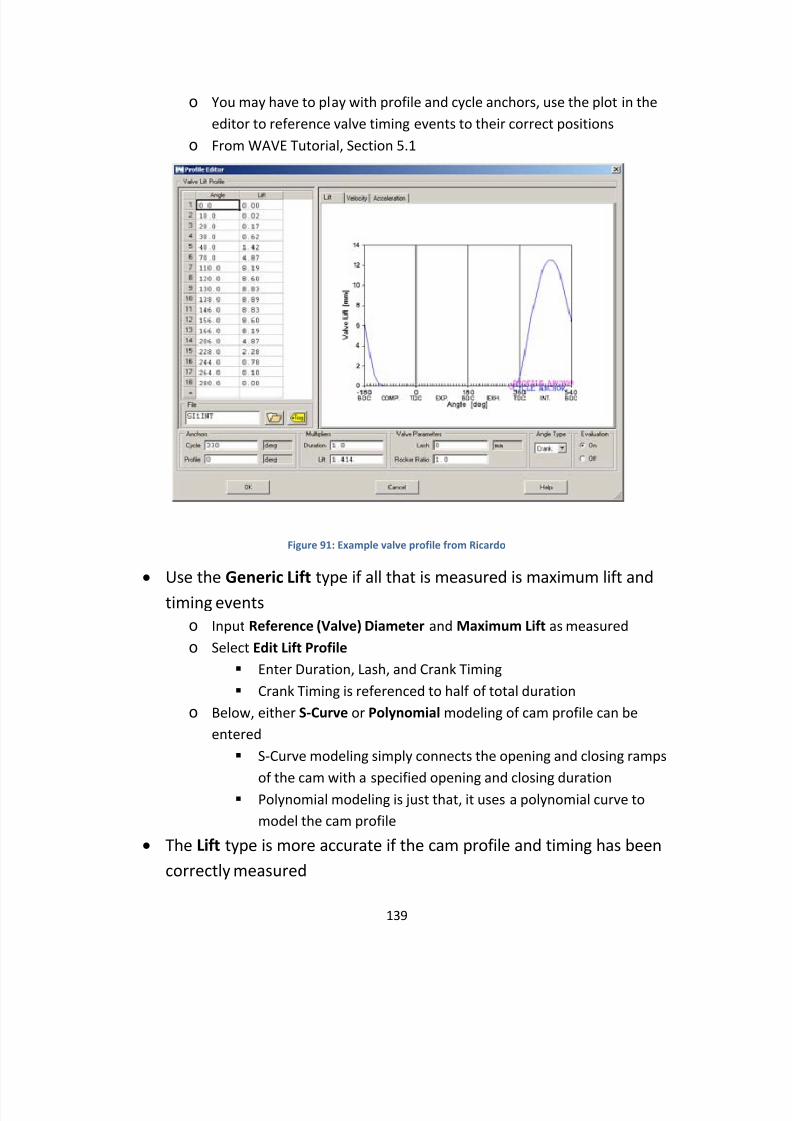
8/10/2019 Ca Poly FormulaSAE Engine Development
http://slidepdf.com/reader/full/ca-poly-formulasae-engine-development 139/142
8/10/2019 Ca Poly FormulaSAE Engine Development
http://slidepdf.com/reader/full/ca-poly-formulasae-engine-development 140/142
140
• Otherwise if that data is unavailable, use Generic Lift and try to makea good approximation
Valve Flow Coefficients
• Once you are done modeling the cam profile, click Edit FlowCoefficient Profiles
o If flow bench data is available, that can be utilizedo Otherwise, select TAG and choose a flow profileo See WAVE Tutorial, Section 5.3 for detailed explanation
• Press OK • Select Add to input more valve profiles into WAVE
o It can store as many profiles as desired
Specifying Valves Within the Model
• Pay attention to the color of the dots that connect the intake andexhaust tracts to the cylinder!
o BLUE means intake valve, RED means exhaust valveo These can be changed by double-clicking on the cylinder icon on the
canvas and selecting Type within the Engine Valves tab• To specify valves in your model double-click the cylinder icon on the
canvaso In Engine Valves tab, click the Type menu and select either intake or
exhaust, just keep track of which duct goes to which valveo Select the profile of the desired valve by using the Valve # menuo Once all valves in the cylinder are specified, click OK
f. Fuel Injectors
• WAVE does fuel injection in two ways:o
Setting the AFRo Setting the mass of fuel injected
• In my WR450 model, I used a Pulse Width Injectoro It is based on the fuel map of the actual engine
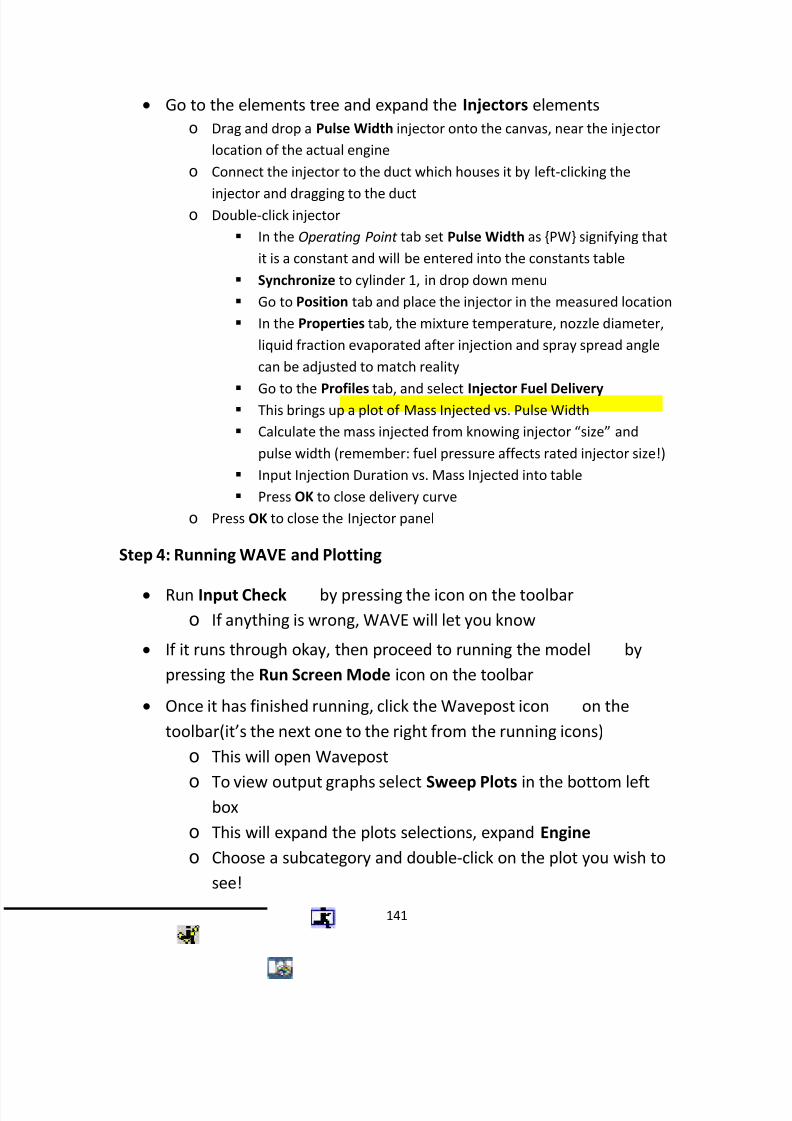
8/10/2019 Ca Poly FormulaSAE Engine Development
http://slidepdf.com/reader/full/ca-poly-formulasae-engine-development 141/142
141
• Go to the elements tree and expand the Injectors elementso Drag and drop a Pulse Width injector onto the canvas, near the injector
location of the actual engineo Connect the injector to the duct which houses it by left-clicking the
injector and dragging to the ducto Double-click injector
In the Operating Point tab set Pulse Width as {PW} signifying thatit is a constant and will be entered into the constants table
Synchronize to cylinder 1, in drop down menu Go to Position tab and place the injector in the measured location In the Properties tab, the mixture temperature, nozzle diameter,
liquid fraction evaporated after injection and spray spread anglecan be adjusted to match reality
Go to the Profiles tab, and select Injector Fuel Delivery This brings up a plot of Mass Injected vs. Pulse Width Calculate the mass injected from knowing injector “size” and
pulse width (remember: fuel pressure affects rated injector size!) Input Injection Duration vs. Mass Injected into table Press OK to close delivery curve
o Press OK to close the Injector panel
Step 4: Running WAVE and Plotting
• Run Input Check by pressing the icon on the toolbaro If anything is wrong, WAVE will let you know
• If it runs through okay, then proceed to running the model bypressing the Run Screen Mode icon on the toolbar
• Once it has finished running, click the Wavepost icon on thetoolbar(it’s the next one to the right from the running icons)
o This will open Wavepost
o To view output graphs select Sweep Plots in the bottom leftbox
o This will expand the plots selections, expand Engine o Choose a subcategory and double-click on the plot you wish to
see!
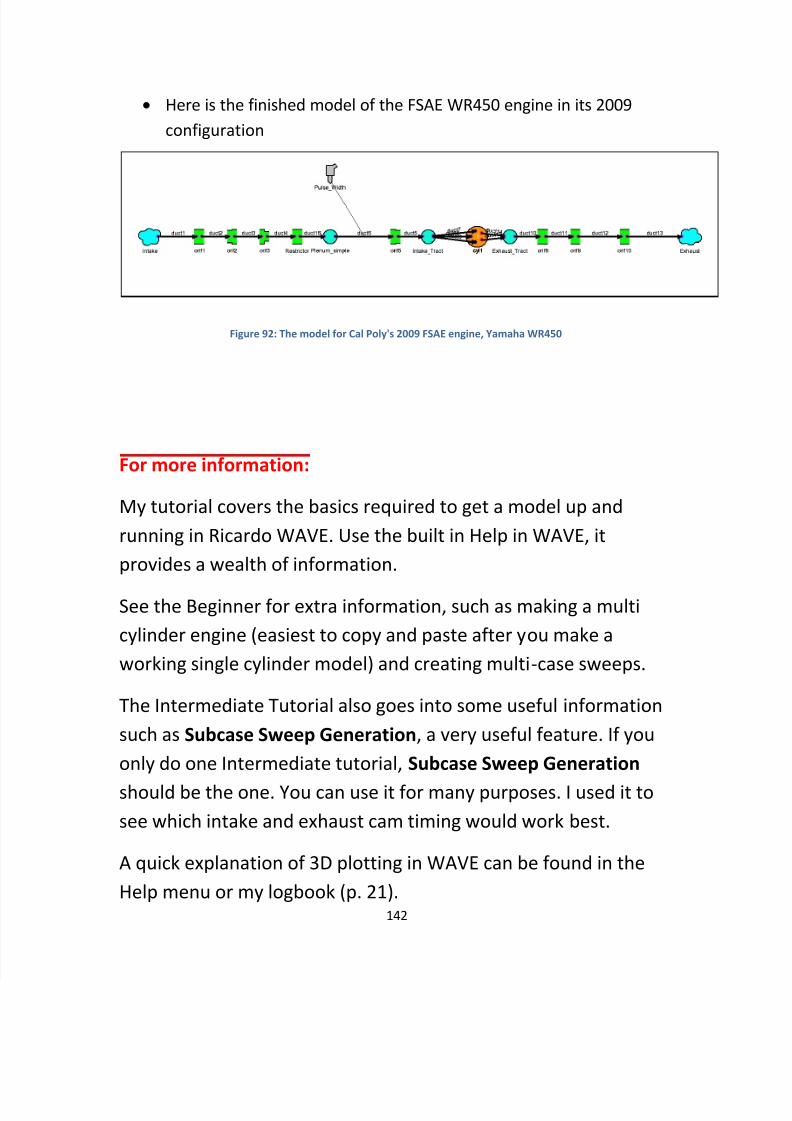
8/10/2019 Ca Poly FormulaSAE Engine Development
http://slidepdf.com/reader/full/ca-poly-formulasae-engine-development 142/142
• Here is the finished model of the FSAE WR450 engine in its 2009configuration
Figure 92: The model for Cal Poly's 2009 FSAE engine, Yamaha WR450
For more information:
My tutorial covers the basics required to get a model up andrunning in Ricardo WAVE. Use the built in Help in WAVE, itprovides a wealth of information.