Embed Size (px)
Citation preview
ASX Announcemen
BY ELECT
17 Septem CompanyAustralia CALTEXCALTEX
Slides forMr Simonshow in attached
Over the presentatprovided
Peter LimCompany Contact nu Attach.
nt - International Road S
TRONIC LOD
mber 2012
y Announcn Securitie
X AUSTRAX PRESEN
r presentatn Hepwort
the northfor immed
course of tions to in
d in the atta
m y Secretar
umber: (02)
Show Presentation.docx
DGEMENT
CA
cements Ofs Exchange
ALIA LIMITATION –
tions to beth (Chief Fhern hemidiate release
the road shnvestors anached slide
ry
) 9250 5562 /
x
ALTEX AUACN
LEVEL 24SYDNEY N
ffice e
ITED – INTERNA
e made by Financial Osphere come to the ma
how, Mr Send analysts
s.
/ 0414 815 73
USTRALIN 004 201
4, 2 MARKETNSW 2000 A
ATIONAL
Mr JulianOfficer) as mmencing arket.
egal and M. The pres
32
IA LIMIT307
T STREETAUSTRALIA
L ROAD SH
n Segal (Mapart of aon 17 Se
Mr Hepwortentations w
A
TED
HOW
anaging Din internat
eptember 2
th will be mwill be bas
ASX ANNOU
irector & Ctional inve2012 (UK
making a nsed on the
UNCEMENT
CEO) and estor road time) are
number of e material
CALTEX AUSTRALIA LIMITEDNon-Deal Roadshow
September 2012
2
Overview
Caltex is • One integrated transport fuels company• Underpinned by comprehensive infrastructure• With a diverse set of customers spanning consumer, commercial and wholesale• And with significant growth opportunities close to its core
High confidence in the company’s ability to continue to execute and deliver
Financially in control of Caltex’s destiny
Key takeaways• Leading position in an attractive industry• Lower earnings and cash-flow volatility through reduced exposure to refining • Re-allocation of capital to growth• Clear growth pathway across products, infrastructure, channels, geographies • Over time, increasing balance sheet flexibility
3
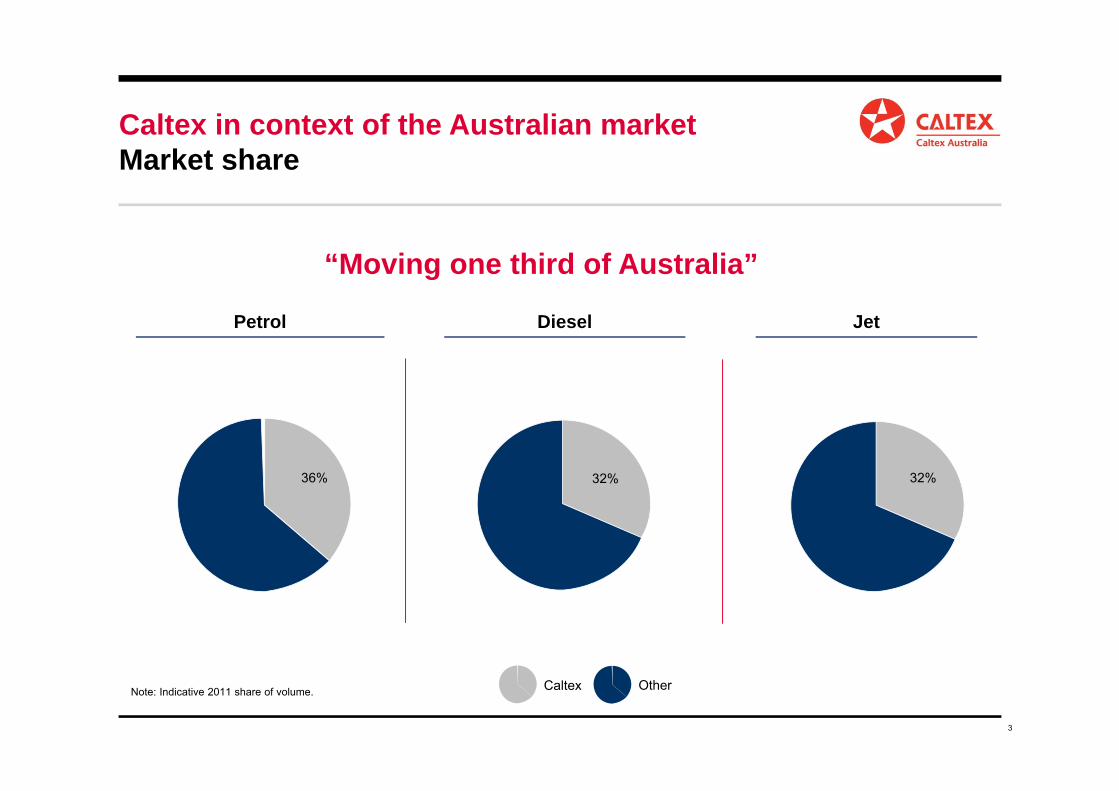
Caltex in context of the Australian market Market share
Note: Indicative 2011 share of volume. Caltex Other
Jet
32%
“Moving one third of Australia”
36%
Petrol Diesel
32%
4
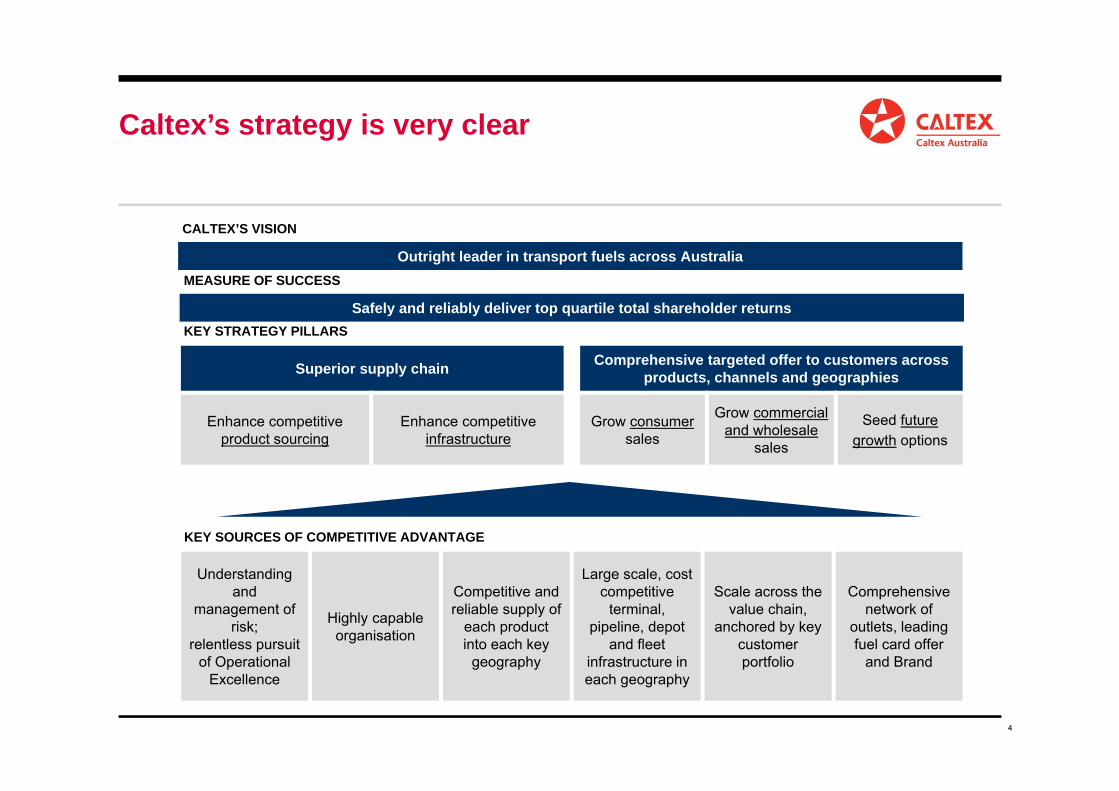
Caltex’s strategy is very clear
KEY STRATEGY PILLARS
Superior supply chain Comprehensive targeted offer to customers acrossproducts, channels and geographies
Enhance competitive product sourcing
Enhance competitive infrastructure
Grow consumersales
Grow commercial and wholesale
sales
Seed futuregrowth options
CALTEX’S VISION
Outright leader in transport fuels across AustraliaMEASURE OF SUCCESS
Safely and reliably deliver top quartile total shareholder returns
KEY SOURCES OF COMPETITIVE ADVANTAGE
Understanding and
management of risk;
relentless pursuit of Operational
Excellence
Highly capable organisation
Competitive and reliable supply of
each product into each key
geography
Large scale, cost competitive
terminal, pipeline, depot
and fleet infrastructure in each geography
Scale across the value chain,
anchored by key customer portfolio
Comprehensive network of
outlets, leading fuel card offer
and Brand
5
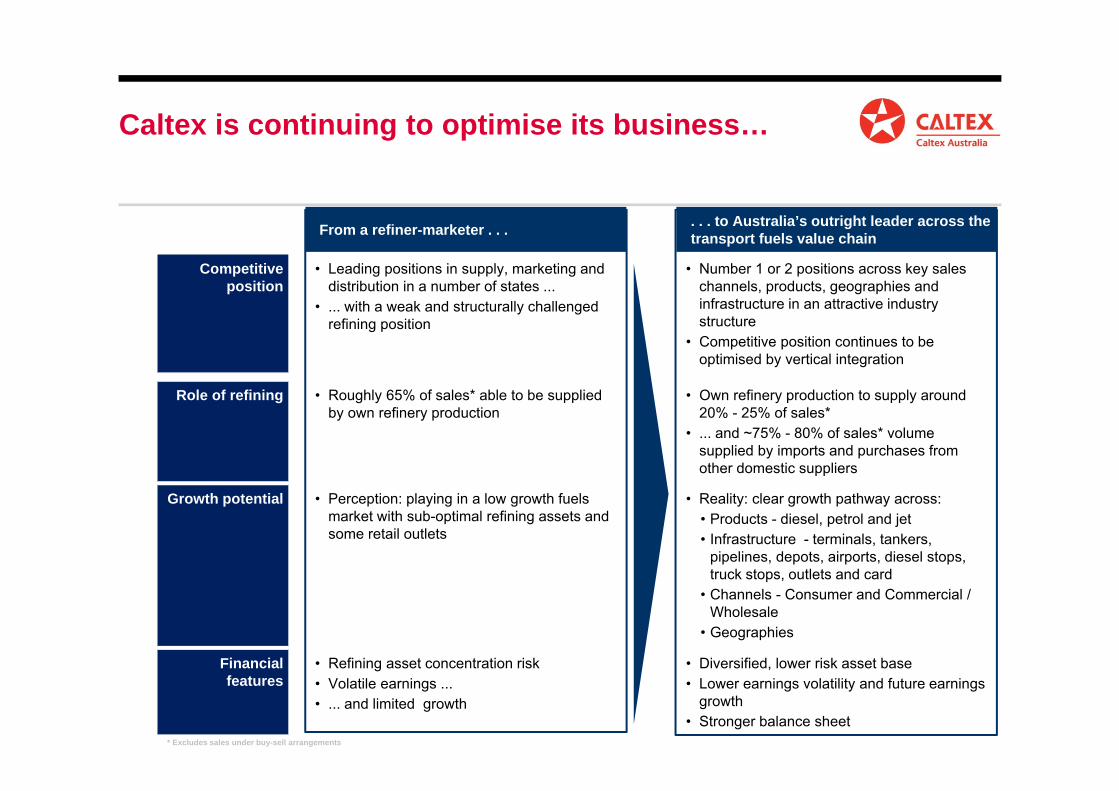
Caltex is continuing to optimise its business…
From a refiner-marketer . . . . . . to Australia’s outright leader across the transport fuels value chain
Competitive position
• Leading positions in supply, marketing and distribution in a number of states ...
• ... with a weak and structurally challenged refining position
• Number 1 or 2 positions across key sales channels, products, geographies and infrastructure in an attractive industry structure
• Competitive position continues to be optimised by vertical integration
Role of refining • Roughly 65% of sales* able to be supplied by own refinery production
• Own refinery production to supply around 20% - 25% of sales*
• ... and ~75% - 80% of sales* volume supplied by imports and purchases from other domestic suppliers
Growth potential • Perception: playing in a low growth fuels market with sub-optimal refining assets and some retail outlets
• Reality: clear growth pathway across: • Products - diesel, petrol and jet • Infrastructure - terminals, tankers,
pipelines, depots, airports, diesel stops, truck stops, outlets and card
• Channels - Consumer and Commercial / Wholesale
• Geographies
Financial features
• Refining asset concentration risk• Volatile earnings ... • ... and limited growth
• Diversified, lower risk asset base• Lower earnings volatility and future earnings
growth• Stronger balance sheet
* Excludes sales under buy-sell arrangements
6
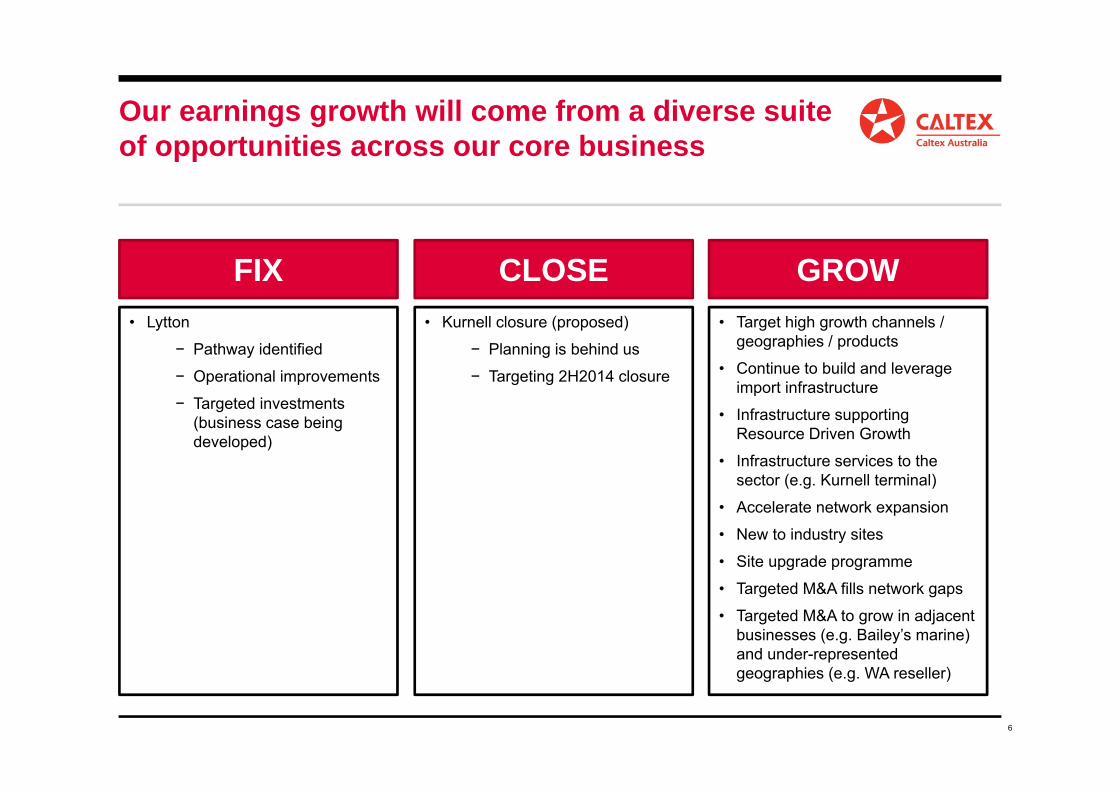
Our earnings growth will come from a diverse suite of opportunities across our core business
FIX CLOSE GROW• Kurnell closure (proposed)
− Planning is behind us
− Targeting 2H2014 closure
• Target high growth channels / geographies / products
• Continue to build and leverage import infrastructure
• Infrastructure supporting Resource Driven Growth
• Infrastructure services to the sector (e.g. Kurnell terminal)
• Accelerate network expansion
• New to industry sites
• Site upgrade programme
• Targeted M&A fills network gaps
• Targeted M&A to grow in adjacent businesses (e.g. Bailey’s marine) and under-represented geographies (e.g. WA reseller)
• Lytton
− Pathway identified
− Operational improvements
− Targeted investments (business case being developed)
7
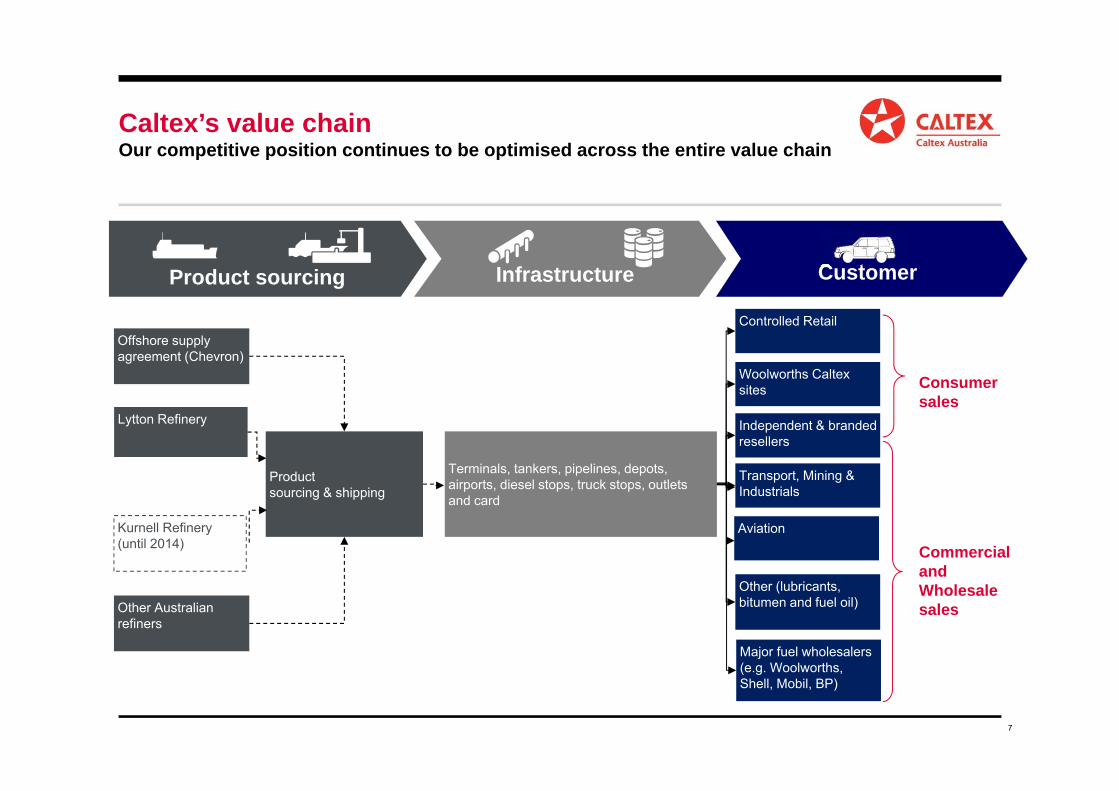
Caltex’s value chainOur competitive position continues to be optimised across the entire value chain
Commercial and Wholesale sales
Product sourcing & shipping
Terminals, tankers, pipelines, depots, airports, diesel stops, truck stops, outlets and card
Lytton Refinery
Controlled Retail
Woolworths Caltex sites
Independent & branded resellers
Transport, Mining & Industrials
Consumersales
Offshore supply agreement (Chevron)
Kurnell Refinery (until 2014)
Other (lubricants, bitumen and fuel oil)
Major fuel wholesalers (e.g. Woolworths, Shell, Mobil, BP)
Aviation
Other Australian refiners
Product sourcing Infrastructure Customer
8
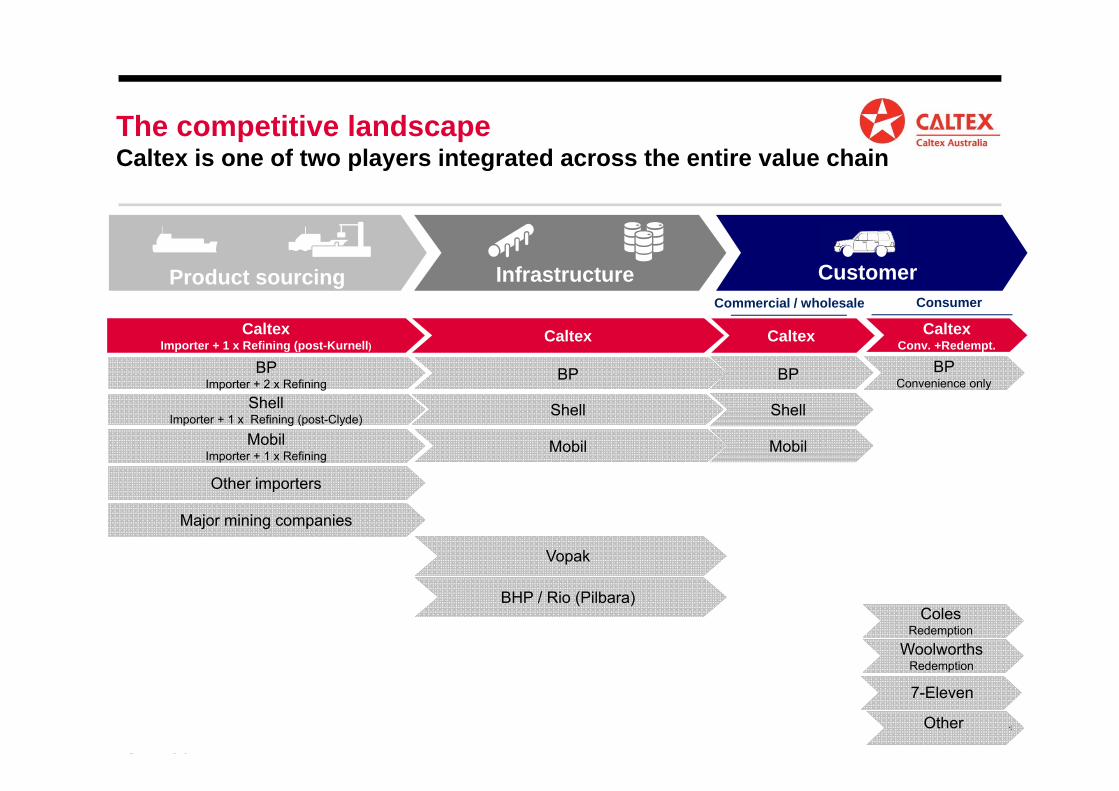
The competitive landscapeCaltex is one of two players integrated across the entire value chain
Product sourcing Infrastructure Customer
BP
ShellImporter + 1 x Refining (post-Clyde)
Shell
Caltex Importer + 1 x Refining (post-Kurnell) Caltex Caltex
Conv. +Redempt.
Mobil Importer + 1 x Refining
Mobil
Vopak
Other
ConsumerCommercial / wholesale
Caltex
BP BP Convenience only
BP Importer + 2 x Refining
Woolworths Redemption
S C lt
Coles Redemption
7-Eleven
Other importers
Major mining companies
BHP / Rio (Pilbara)
Shell
Mobil
9
Coal38%
Petroleum products
35%
Gas23%
Other5%
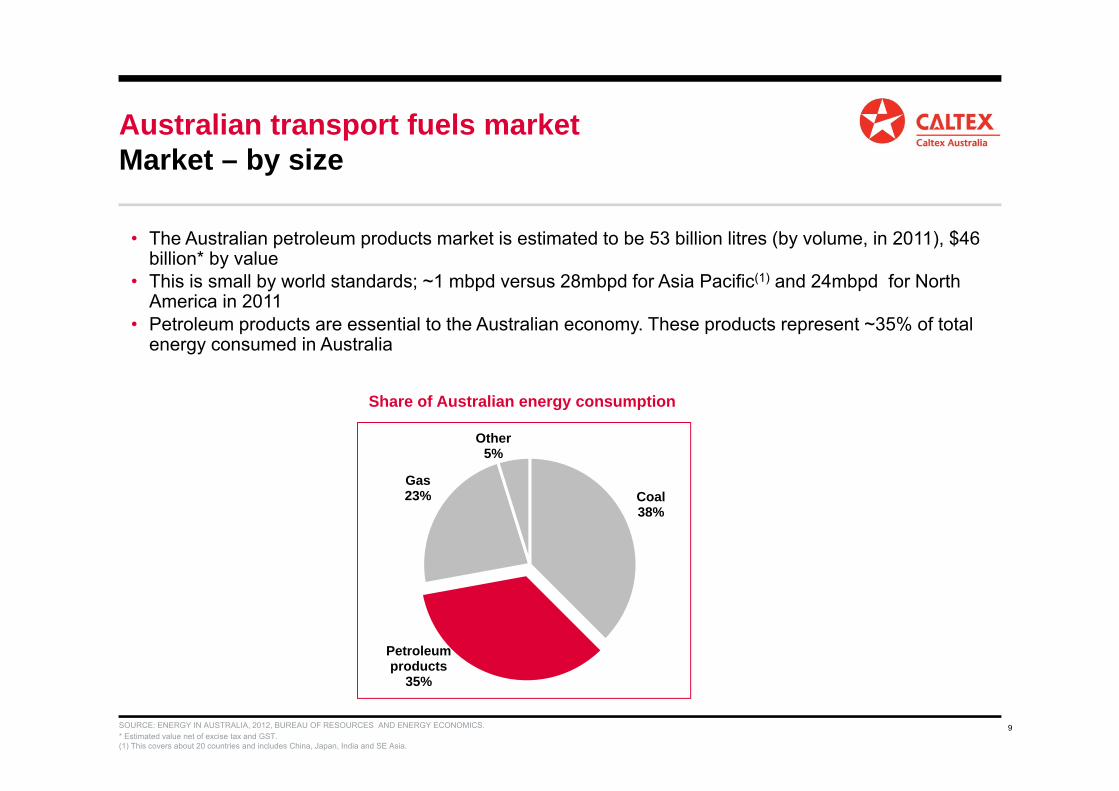
Australian transport fuels marketMarket – by size
• The Australian petroleum products market is estimated to be 53 billion litres (by volume, in 2011), $46 billion* by value
• This is small by world standards; ~1 mbpd versus 28mbpd for Asia Pacific(1) and 24mbpd for North America in 2011
• Petroleum products are essential to the Australian economy. These products represent ~35% of total energy consumed in Australia
SOURCE: ENERGY IN AUSTRALIA, 2012, BUREAU OF RESOURCES AND ENERGY ECONOMICS.* Estimated value net of excise tax and GST. (1) This covers about 20 countries and includes China, Japan, India and SE Asia.
Share of Australian energy consumption
10SOURCE: ENERGY IN AUSTRALIA, 2012, BUREAU OF RESOURCES AND ENERGY ECONOMICS.
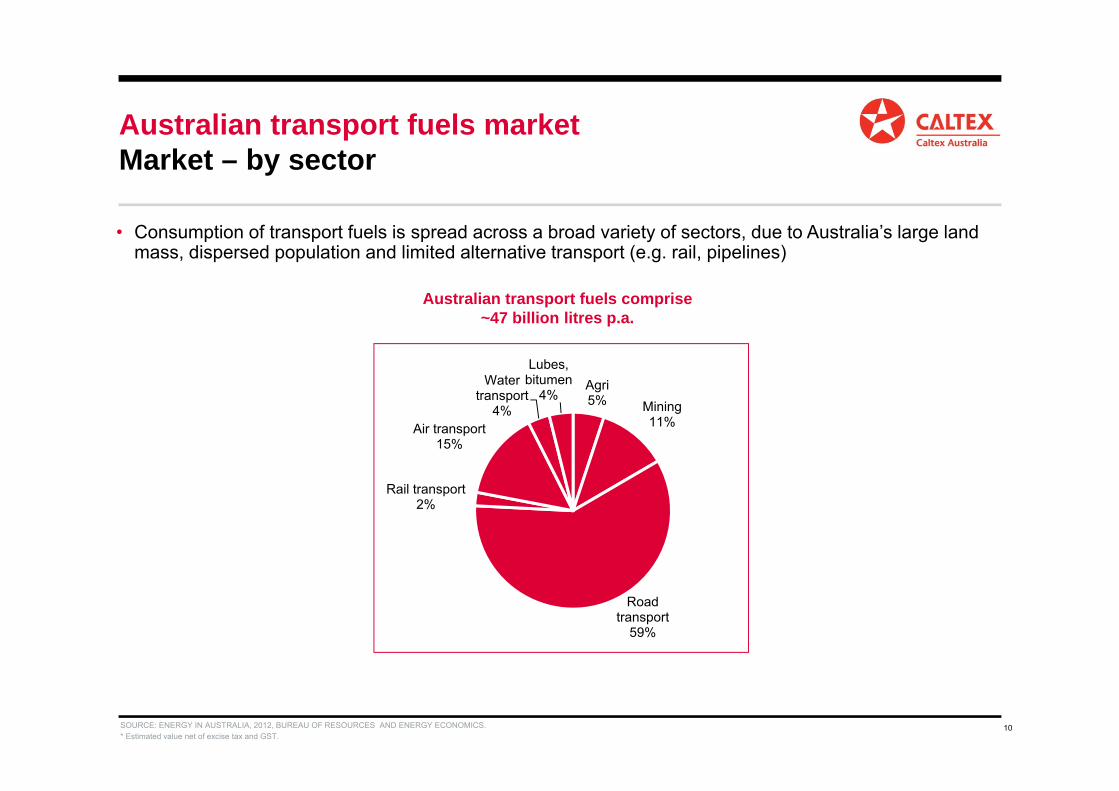
Australian transport fuels marketMarket – by sector
• Consumption of transport fuels is spread across a broad variety of sectors, due to Australia’s large land mass, dispersed population and limited alternative transport (e.g. rail, pipelines)
Australian transport fuels comprise ~47 billion litres p.a.
* Estimated value net of excise tax and GST.
Agri5% Mining
11%
Road transport
59%
Rail transport2%
Air transport15%
Water transport
4%
Lubes, bitumen
4%
11
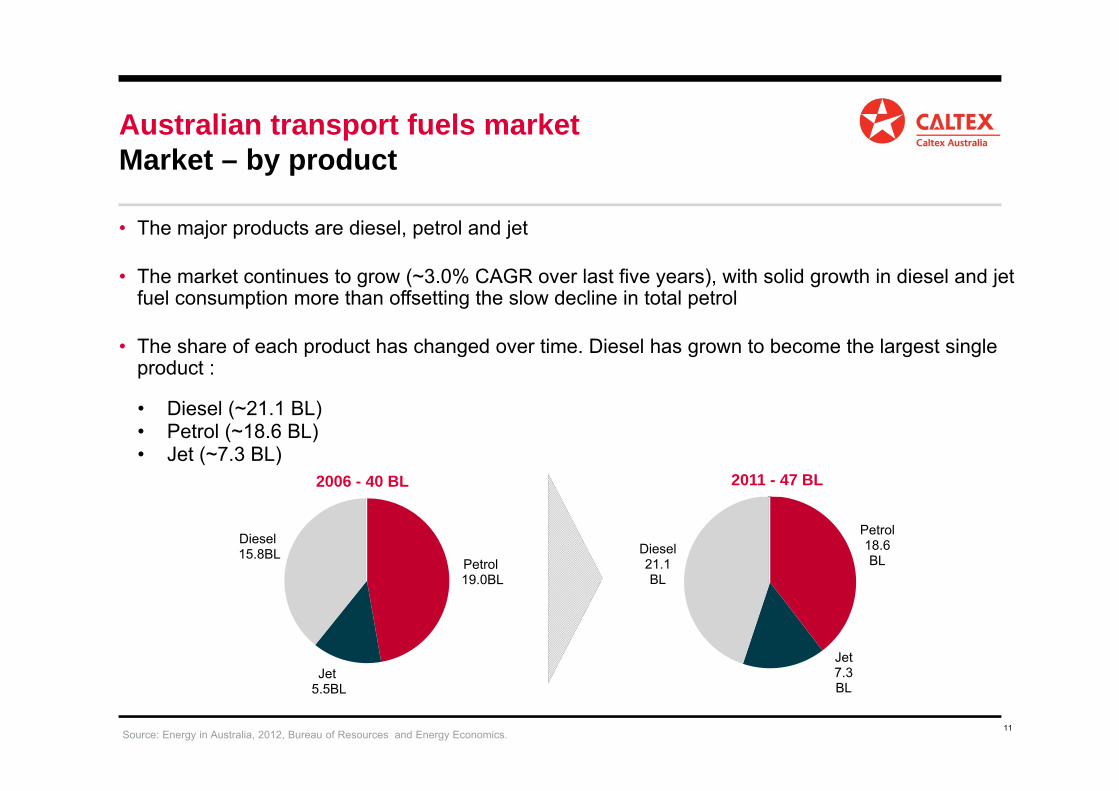
• The major products are diesel, petrol and jet
• The market continues to grow (~3.0% CAGR over last five years), with solid growth in diesel and jet fuel consumption more than offsetting the slow decline in total petrol
• The share of each product has changed over time. Diesel has grown to become the largest single product :
• Diesel (~21.1 BL)• Petrol (~18.6 BL)• Jet (~7.3 BL)
Australian transport fuels marketMarket – by product
Source: Energy in Australia, 2012, Bureau of Resources and Energy Economics.
Petrol19.0BL
Jet5.5BL
000
Diesel15.8BL
0000
Petrol18.6BL
Jet7.3BL000
Diesel21.1BL
00002006 - 40 BL 2011 - 47 BL
12
Australian transport fuels marketMarket segments – economic drivers
Product/segment Macro drivers Micro drivers
Petrol & retail diesel -consumer transport fuels
• Australian car fleet size, impacted by:- Population growth- New vehicle sales• Household income & consumer confidence• Business activity & employment
• Consumer preferences – shift to diesel vehicles• Vehicle technology – fuel efficiency, uptake of hybrids
and diesel vehicles• Consumer travel patterns (e.g. public transport)• Product availability at retail sites• High performance engines requiring high octane fuels• Regulation • Public transport
Diesel – heavy vehicle transport
• Australian GDP – freight transport linked to economic activity
• Vehicle technology & fuel efficiency• Competes with electric rail • Regulation
Diesel – mining • Volume of Australian resources production, impacted by:
- Asian economic activity - Long term commodity prices- Mining investment- Australian cost competitiveness
• Vehicle technology & fuel efficiency• Level of mining activity • Types of mines
- Iron ore versus coal versus precious metals- Underground versus open cut
Jet – air transport • Global & Australian GDP• Discretionary, price sensitive air travel • Business & consumer confidence
• Aircraft technology & fuel efficiency• New entrants to Australian market• Airline refuelling patterns• Airport infrastructure and capacity
13
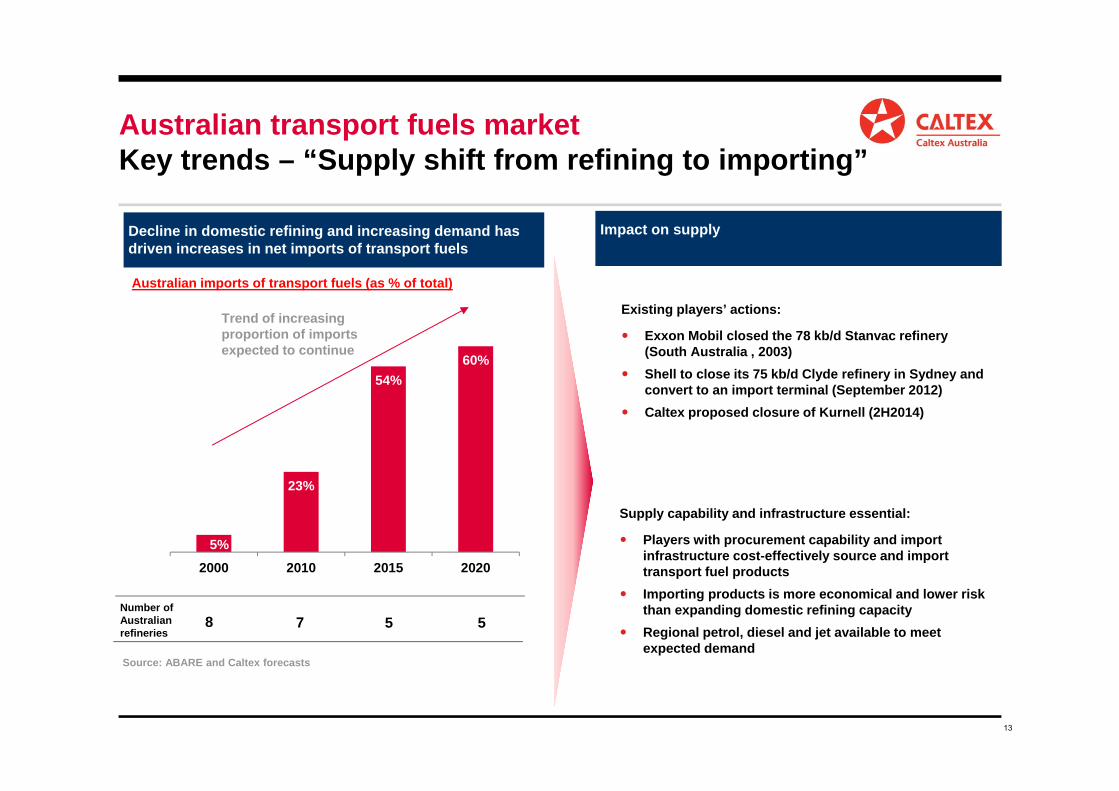
5%
23%
54%60%
2000 2010 2015 2020
Impact on supply Decline in domestic refining and increasing demand has driven increases in net imports of transport fuels
Existing players’ actions:
Exxon Mobil closed the 78 kb/d Stanvac refinery (South Australia , 2003)
Shell to close its 75 kb/d Clyde refinery in Sydney and convert to an import terminal (September 2012)
Caltex proposed closure of Kurnell (2H2014)
Source: ABARE and Caltex forecasts
Trend of increasing proportion of imports expected to continue
Supply capability and infrastructure essential:
Players with procurement capability and import infrastructure cost-effectively source and import transport fuel products
Importing products is more economical and lower risk than expanding domestic refining capacity
Regional petrol, diesel and jet available to meet expected demand
Number of Australian refineries
8 7 5 5
Australian imports of transport fuels (as % of total)
Australian transport fuels marketKey trends – “Supply shift from refining to importing”
14
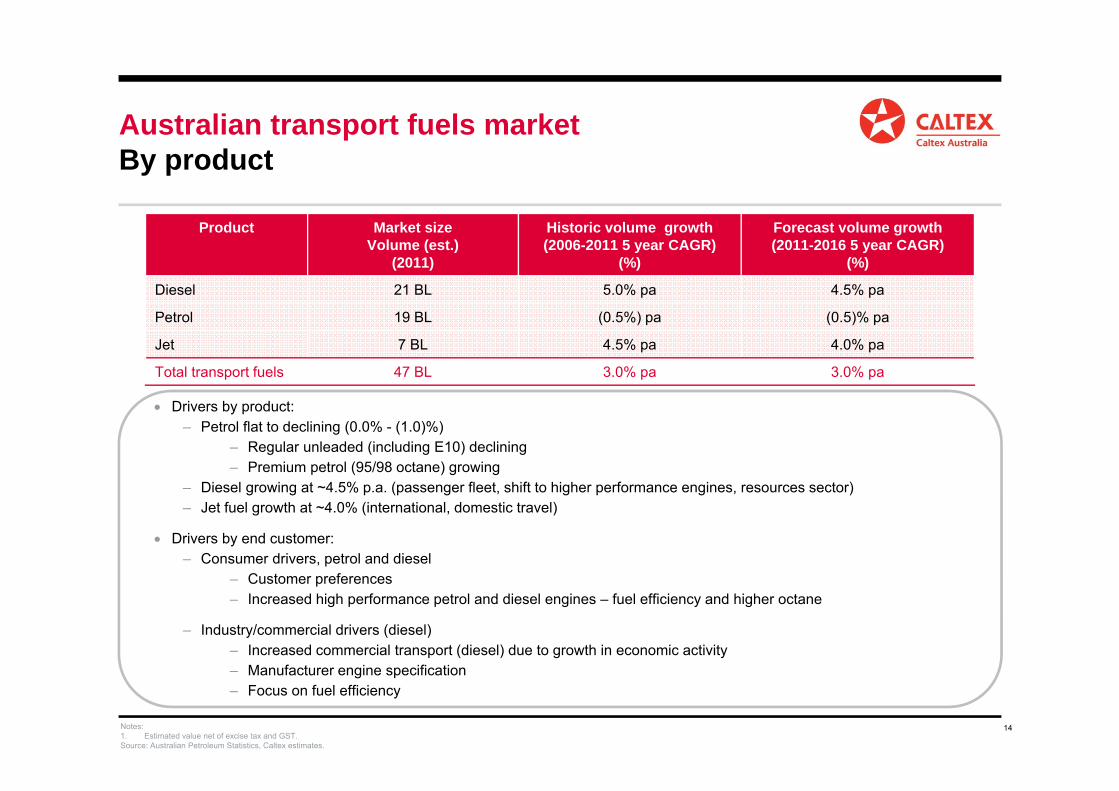
Australian transport fuels marketBy product
Drivers by product:– Petrol flat to declining (0.0% - (1.0)%)
– Regular unleaded (including E10) declining – Premium petrol (95/98 octane) growing
– Diesel growing at ~4.5% p.a. (passenger fleet, shift to higher performance engines, resources sector) – Jet fuel growth at ~4.0% (international, domestic travel)
Drivers by end customer: – Consumer drivers, petrol and diesel
– Customer preferences– Increased high performance petrol and diesel engines – fuel efficiency and higher octane
– Industry/commercial drivers (diesel)– Increased commercial transport (diesel) due to growth in economic activity– Manufacturer engine specification– Focus on fuel efficiency
Notes:1. Estimated value net of excise tax and GST.Source: Australian Petroleum Statistics, Caltex estimates.
Product Market size Volume (est.)
(2011)
Historic volume growth (2006-2011 5 year CAGR)
(%)
Forecast volume growth (2011-2016 5 year CAGR)
(%)
Diesel 21 BL 5.0% pa 4.5% pa
Petrol 19 BL (0.5%) pa (0.5)% pa
Jet 7 BL 4.5% pa 4.0% pa
Total transport fuels 47 BL 3.0% pa 3.0% pa
15
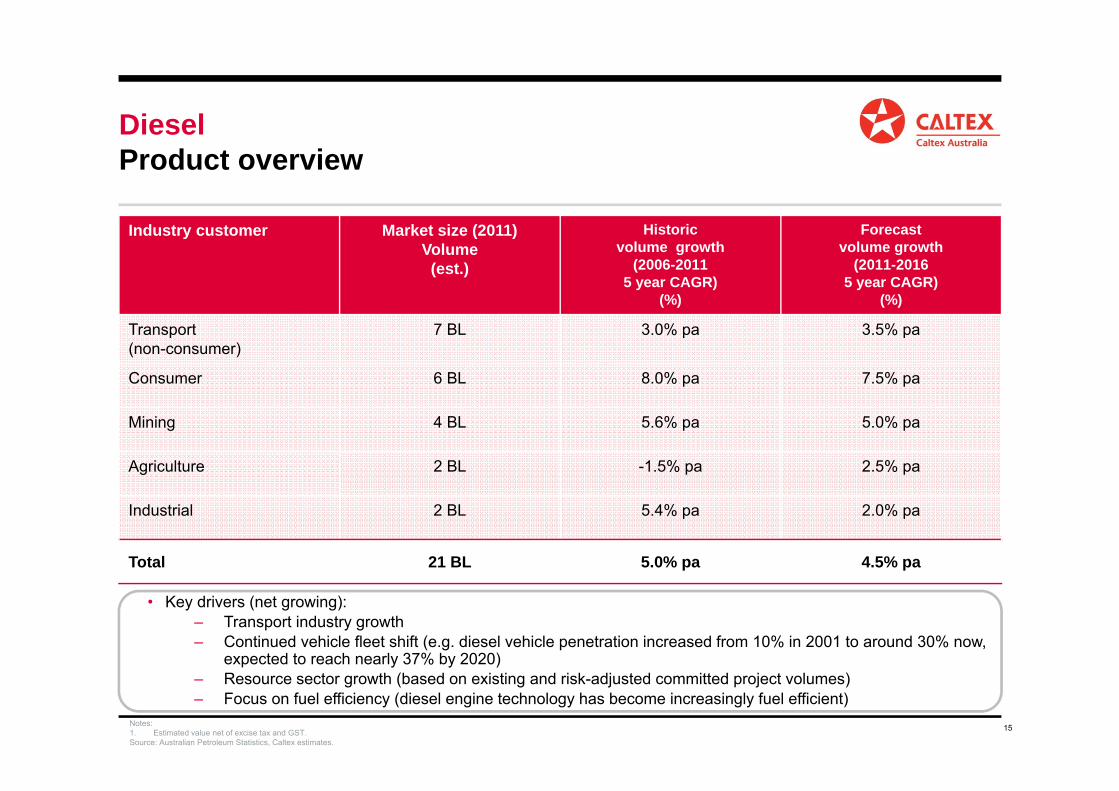
DieselProduct overview
• Key drivers (net growing): – Transport industry growth – Continued vehicle fleet shift (e.g. diesel vehicle penetration increased from 10% in 2001 to around 30% now,
expected to reach nearly 37% by 2020) – Resource sector growth (based on existing and risk-adjusted committed project volumes) – Focus on fuel efficiency (diesel engine technology has become increasingly fuel efficient)
Notes:1. Estimated value net of excise tax and GST.Source: Australian Petroleum Statistics, Caltex estimates.
Industry customer Market size (2011)Volume
(est.)
Historicvolume growth
(2006-20115 year CAGR)
(%)
Forecast volume growth
(2011-20165 year CAGR)
(%)
Transport (non-consumer)
7 BL 3.0% pa 3.5% pa
Consumer 6 BL 8.0% pa 7.5% pa
Mining 4 BL 5.6% pa 5.0% pa
Agriculture 2 BL -1.5% pa 2.5% pa
Industrial 2 BL 5.4% pa 2.0% pa
Total 21 BL 5.0% pa 4.5% pa
16
Source: Caltex estimate.
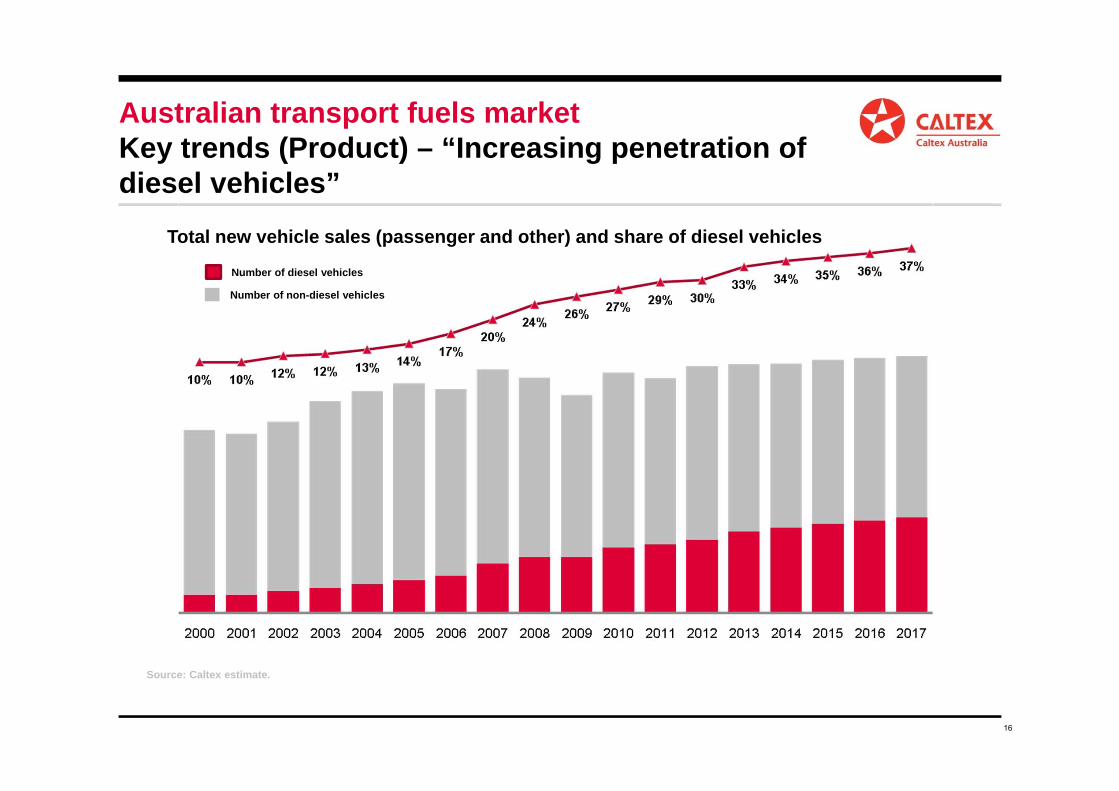
Australian transport fuels marketKey trends (Product) – “Increasing penetration of diesel vehicles”
Total new vehicle sales (passenger and other) and share of diesel vehicles
Number of diesel vehicles
Number of non-diesel vehicles
17
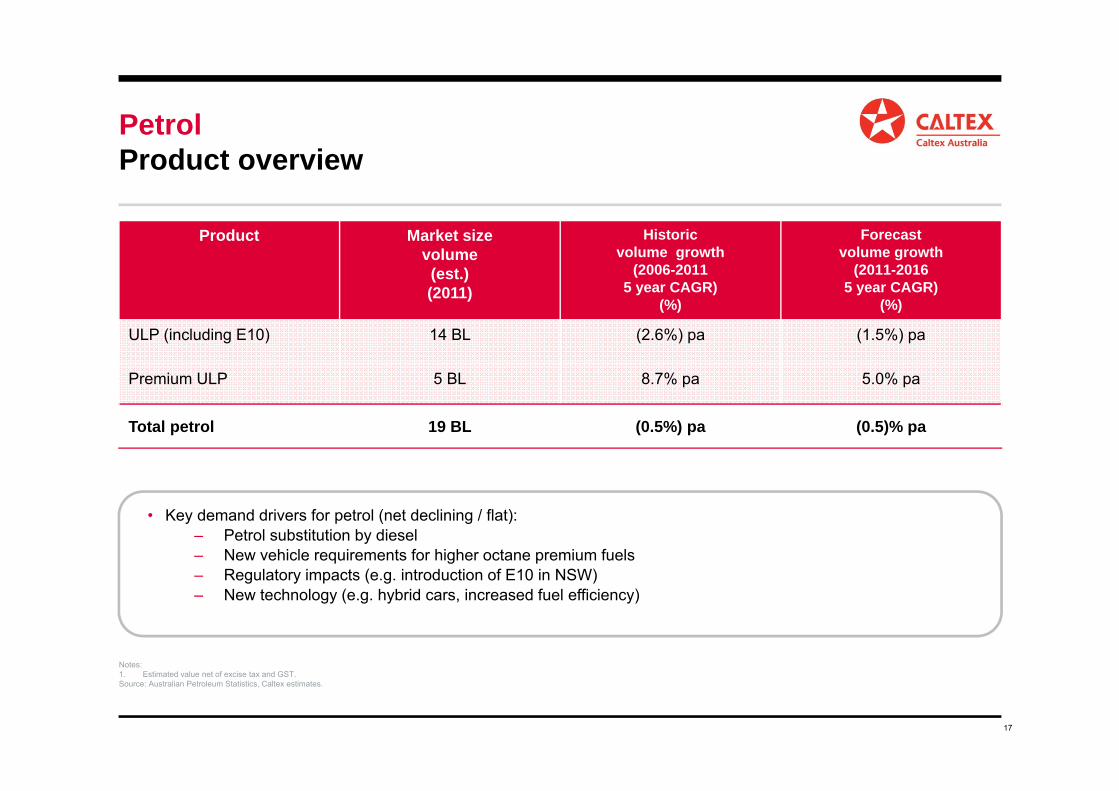
PetrolProduct overview
• Key demand drivers for petrol (net declining / flat): – Petrol substitution by diesel– New vehicle requirements for higher octane premium fuels– Regulatory impacts (e.g. introduction of E10 in NSW) – New technology (e.g. hybrid cars, increased fuel efficiency)
Notes:1. Estimated value net of excise tax and GST.Source: Australian Petroleum Statistics, Caltex estimates.
Product Market size volume(est.) (2011)
Historicvolume growth
(2006-20115 year CAGR)
(%)
Forecast volume growth
(2011-20165 year CAGR)
(%)
ULP (including E10) 14 BL (2.6%) pa (1.5%) pa
Premium ULP 5 BL 8.7% pa 5.0% pa
Total petrol 19 BL (0.5%) pa (0.5)% pa
18
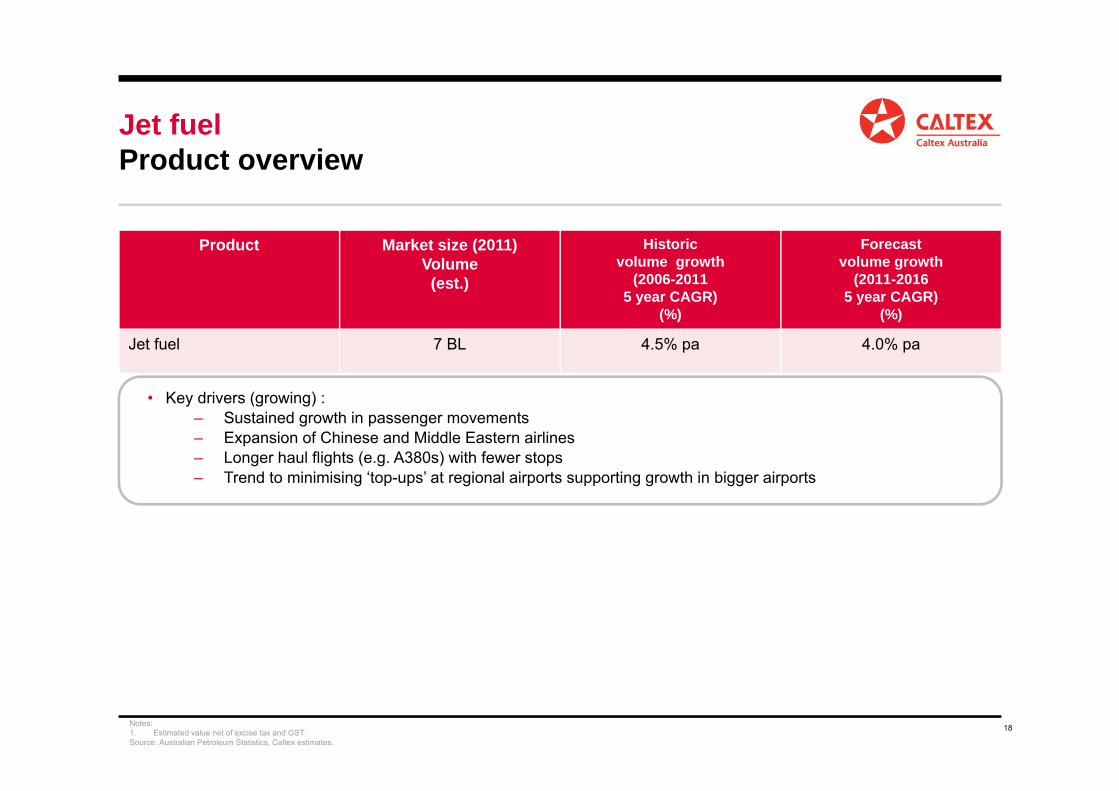
Jet fuelProduct overview
• Key drivers (growing) : – Sustained growth in passenger movements – Expansion of Chinese and Middle Eastern airlines– Longer haul flights (e.g. A380s) with fewer stops– Trend to minimising ‘top-ups’ at regional airports supporting growth in bigger airports
Notes:1. Estimated value net of excise tax and GST.Source: Australian Petroleum Statistics, Caltex estimates.
Product Market size (2011)Volume
(est.)
Historicvolume growth
(2006-20115 year CAGR)
(%)
Forecast volume growth
(2011-20165 year CAGR)
(%)
Jet fuel 7 BL 4.5% pa 4.0% pa
19
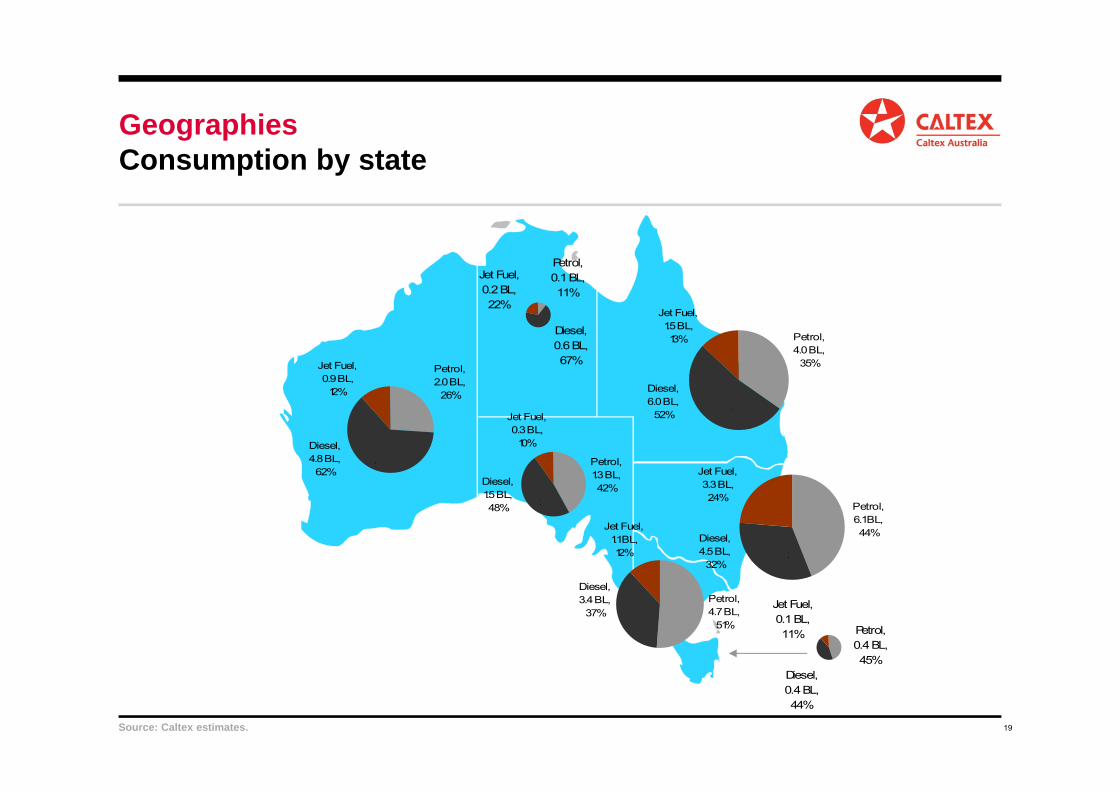
Jet Fuel, 0.3 BL, 10%
Petrol, 1.3 BL, 42%
Diesel, 1.5 BL, 48% x
Jet Fuel, 1.1 BL, 12%
Petrol, 4.7 BL,
51%
Diesel, 3.4 BL,
37% x
Jet Fuel, 3.3 BL, 24%
Petrol, 6.1 BL, 44%Diesel,
4.5 BL, 32%
x
Jet Fuel, 1.5 BL, 13% Petrol,
4.0 BL, 35%
Diesel, 6.0 BL,
52% x
Jet Fuel, 0.9 BL, 12%
Petrol, 2.0 BL,
26%
Diesel, 4.8 BL, 62%
x
Jet Fuel, 0.1 BL, 11% Petrol,
0.4 BL, 45%
Diesel, 0.4 BL, 44%
Jet Fuel, 0.2 BL, 22%
Petrol, 0.1 BL, 11%
Diesel, 0.6 BL, 67%
GeographiesConsumption by state
Source: Caltex estimates.
20
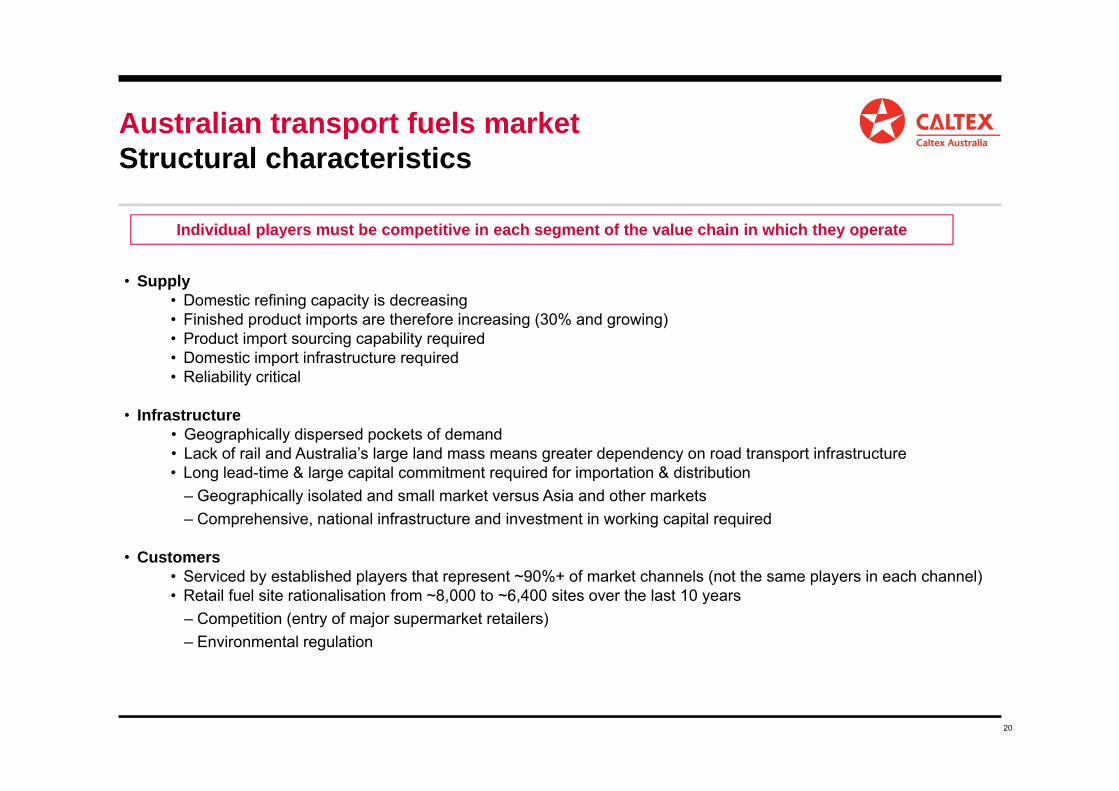
Australian transport fuels market Structural characteristics
• Supply• Domestic refining capacity is decreasing• Finished product imports are therefore increasing (30% and growing)• Product import sourcing capability required• Domestic import infrastructure required• Reliability critical
• Infrastructure• Geographically dispersed pockets of demand• Lack of rail and Australia’s large land mass means greater dependency on road transport infrastructure• Long lead-time & large capital commitment required for importation & distribution
– Geographically isolated and small market versus Asia and other markets– Comprehensive, national infrastructure and investment in working capital required
• Customers• Serviced by established players that represent ~90%+ of market channels (not the same players in each channel)• Retail fuel site rationalisation from ~8,000 to ~6,400 sites over the last 10 years
– Competition (entry of major supermarket retailers)– Environmental regulation
Individual players must be competitive in each segment of the value chain in which they operate
SUPPLY
22
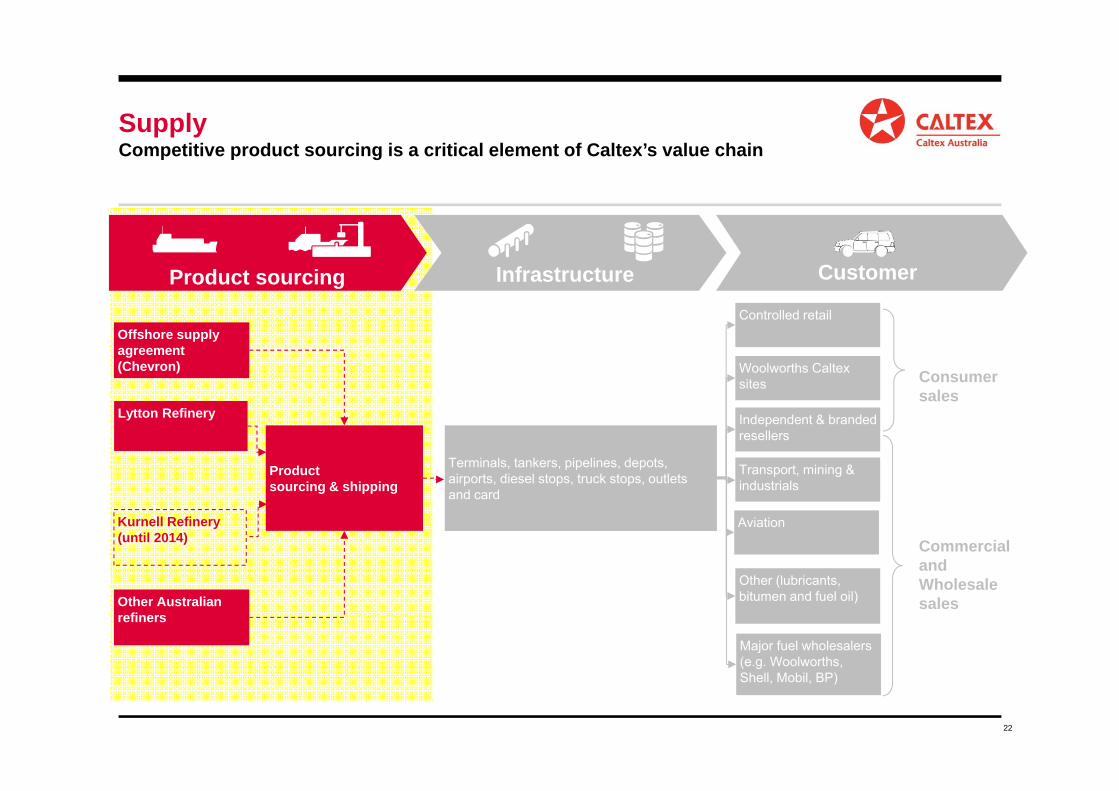
SupplyCompetitive product sourcing is a critical element of Caltex’s value chain
Commercial and Wholesale sales
Terminals, tankers, pipelines, depots, airports, diesel stops, truck stops, outlets and card
Controlled retail
Woolworths Caltex sites
Independent & branded resellers
Transport, mining & industrials
Consumersales
Other (lubricants, bitumen and fuel oil)
Major fuel wholesalers (e.g. Woolworths, Shell, Mobil, BP)
Aviation
Product sourcing & shipping
Lytton Refinery
Offshore supply agreement (Chevron)
Kurnell Refinery (until 2014)
Other Australian refiners
Product sourcing Infrastructure Customer
23
Rationale for Proposed Kurnell ClosureTwelve month detailed review culminated in 26 July Supply Chain Restructure announcement
Kurnell refinery has been losing money (expected to continue)
Kurnell is at a competitive disadvantage compared to regional pacesetter refineries
– Shipping constraints
– Yield of high value products, particularly premium petrol
Comprehensive review around Kurnell, all options exhausted
Proposed closure in approximately two years time (2H 2014)
Net cash cost of closure to be broadly offset by one-off and recurring cash benefits
There is sufficient product supply in the region to replace Kurnell production and meet Caltex’s forecast growth. Accessing supply is underpinned by a long term product supply agreement with Chevron
24
Supply chainReliable, secure supply from three sources
Chevron Product Supply Agreement (PSA) and Marine Services Agreement (MSA)
Lytton refinery production
Other domestic suppliers (Buy-Sell)
1
2
3
25
Provides security of product volumes
Caltex’s security of supply will be underpinned by a long term arrangement with Chevron to source and procure all of Caltex’s ‘out of country’ product requirements (petrol, diesel and jet)
Competitive supply price
Under the arm’s length arrangement, Chevron will procure and supply to Caltex imported product at market-based prices
Long term secure supply
The arrangement is evergreen
Caltex retains flexibility and optionality
Caltex retains flexibility to determine how much product will be sourced locally (e.g. under existing buy/sell arrangements with other local refiners) and how much it will source “out of country” via Chevron
Chevron supply and shipping agreementsThe product procurement and supply arrangements with Chevron underpin competitive product sourcing
INFRASTRUCTURE
27
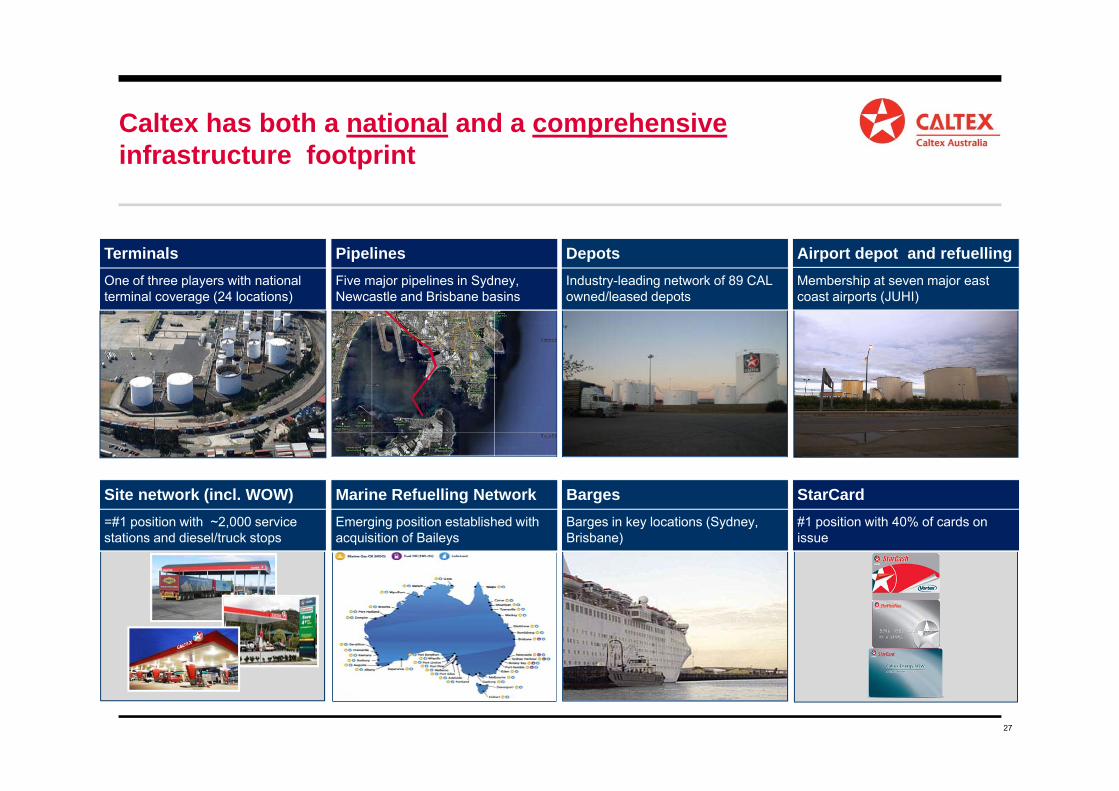
Caltex has both a national and a comprehensiveinfrastructure footprint
TBC
Emerging position established with acquisition of Baileys
Marine Refuelling NetworkBarges in key locations (Sydney, Brisbane)
Barges#1 position with 40% of cards on issue
StarCard=#1 position with ~2,000 service stations and diesel/truck stops
Site network (incl. WOW)
Five major pipelines in Sydney, Newcastle and Brisbane basins
One of three players with national terminal coverage (24 locations)
Industry-leading network of 89 CAL owned/leased depots
PipelinesTerminals DepotsMembership at seven major east coast airports (JUHI)
Airport depot and refuelling
28
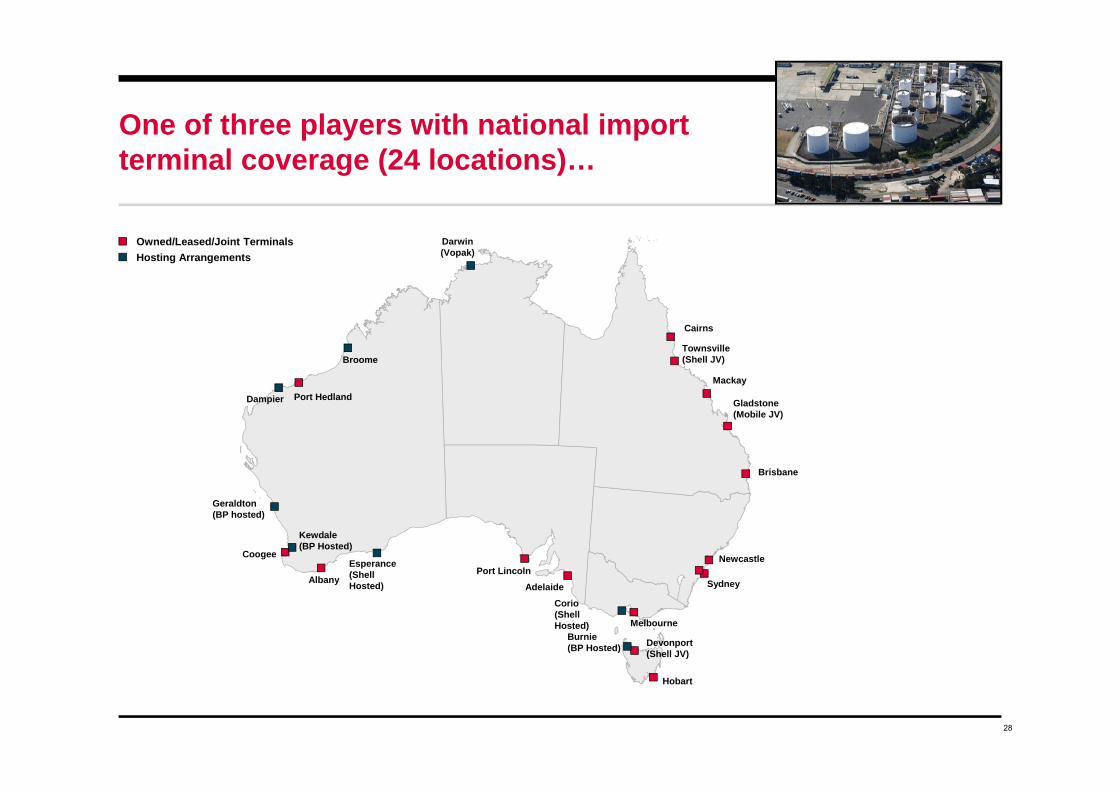
One of three players with national import terminal coverage (24 locations)…
Owned/Leased/Joint Terminals Hosting Arrangements
Darwin(Vopak)
Port Hedland
Geraldton(BP hosted)
Coogee
Albany
Esperance(Shell Hosted)
Port LincolnAdelaide
Corio (Shell Hosted) Melbourne
Burnie (BP Hosted) Devonport
(Shell JV)
Hobart
Brisbane
Gladstone (Mobile JV)
Mackay
Townsville (Shell JV)
Cairns
Sydney
Newcastle
Kewdale(BP Hosted)
Dampier
Broome
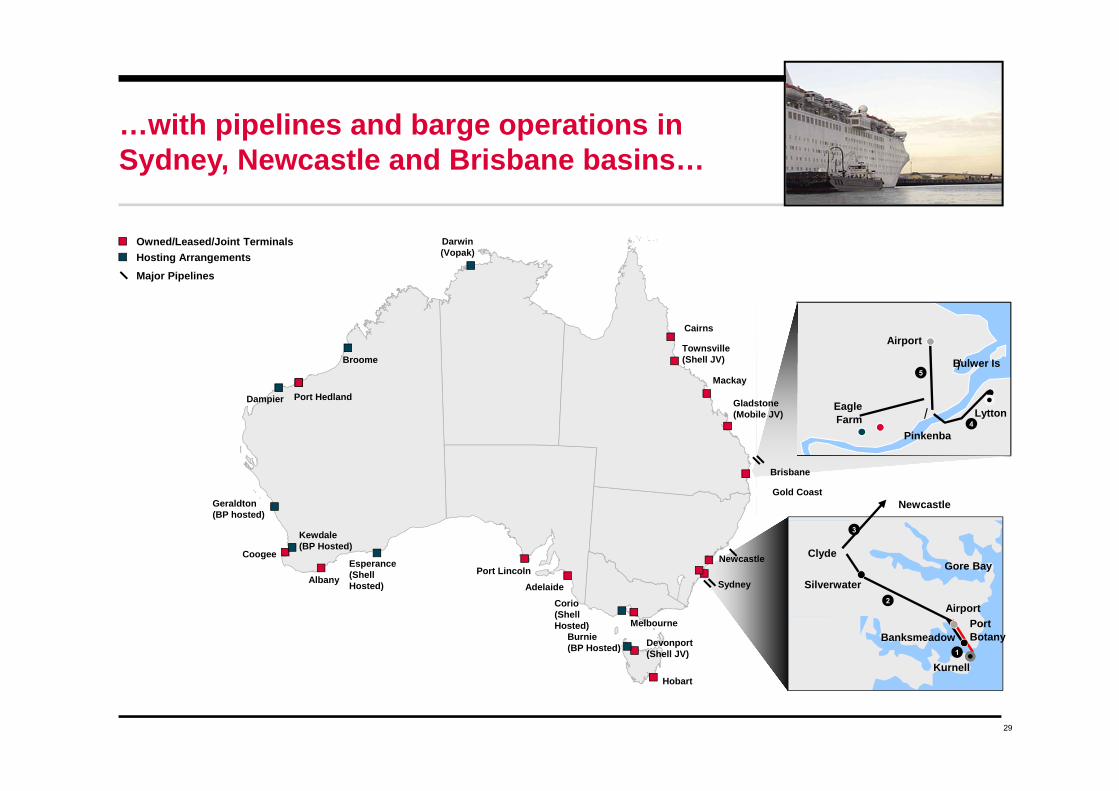
29
Airport
Eagle Farm
Pinkenba
Lytton
Bulwer Is
Airport
Kurnell
Gore Bay
Silverwater
Clyde
Newcastle
BanksmeadowPort Botany
…with pipelines and barge operations in Sydney, Newcastle and Brisbane basins…
Owned/Leased/Joint Terminals Hosting Arrangements
Darwin(Vopak)
Port Hedland
Geraldton(BP hosted)
Coogee
Albany
Esperance(Shell Hosted)
Port LincolnAdelaide
Corio (Shell Hosted) Melbourne
Burnie (BP Hosted) Devonport
(Shell JV)
Hobart
Brisbane
Gladstone (Mobile JV)
Mackay
Townsville (Shell JV)
Cairns
Newcastle
Gold Coast
Kewdale(BP Hosted)
Sydney
Major Pipelines
Dampier
Broome
30
Airport
Eagle Farm
Pinkenba
Lytton
Bulwer Is
…and an industry–leading network of 89 Caltex owned/leased depots and membership of JUHIs at seven major east coast airports…
Airport
Kurnell
Gore Bay
Silverwater
Clyde
Newcastle
BanksmeadowPort Botany
Owned/Leased/Joint Terminals Hosting Arrangements
JUHI MembershipCaltex Depots
Gold Coast
Darwin(Vopak)
Port Hedland
Geraldton(BP hosted)
Coogee
Albany
Esperance(Shell Hosted)
Port LincolnAdelaide
Corio (Shell Hosted) Melbourne
Burnie (BP Hosted) Devonport
(Shell JV)
Hobart
Brisbane
Gladstone (Mobile JV)
Mackay
Townsville (Shell JV)
Cairns
Newcastle
Kewdale(BP Hosted)
Sydney
Major Pipelines
Dampier
Broome
31
Airport
Eagle Farm
Pinkenba
Lytton
Bulwer Is
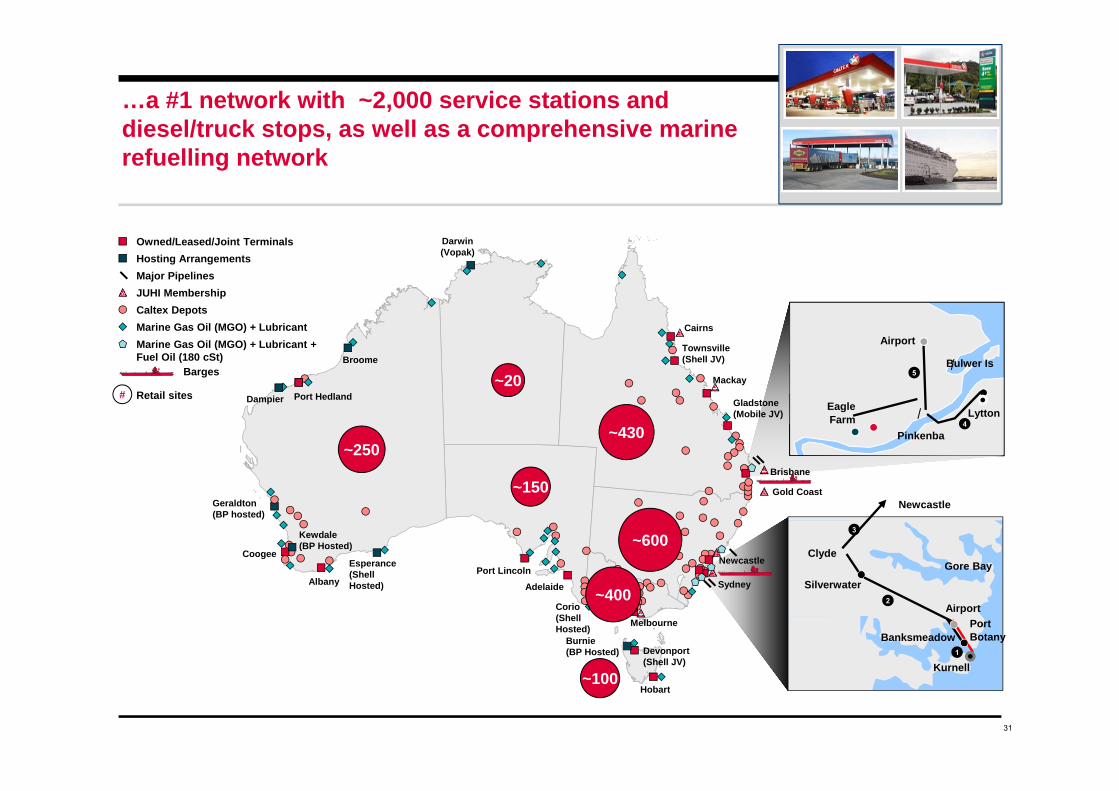
…a #1 network with ~2,000 service stations and diesel/truck stops, as well as a comprehensive marine refuelling network
Airport
Kurnell
Gore Bay
Silverwater
Clyde
Newcastle
BanksmeadowPort Botany
Owned/Leased/Joint Terminals Hosting Arrangements
JUHI MembershipCaltex Depots
Brisbane
Gold Coast
Marine Gas Oil (MGO) + LubricantMarine Gas Oil (MGO) + Lubricant +Fuel Oil (180 cSt)
Barges
Darwin(Vopak)
Port Hedland
Geraldton(BP hosted)
Coogee
Albany
Esperance(Shell Hosted)
Port LincolnAdelaide
Corio(Shell Hosted) Melbourne
Burnie(BP Hosted) Devonport
(Shell JV)
Hobart
Gladstone (Mobile JV)
Mackay
Townsville (Shell JV)
Cairns
Newcastle
Kewdale(BP Hosted) ~600
Sydney
Major Pipelines
# Retail sites
~400
~100
~430
~20
~250
~150
Dampier
Broome
DISTRIBUTION
33
Reseller
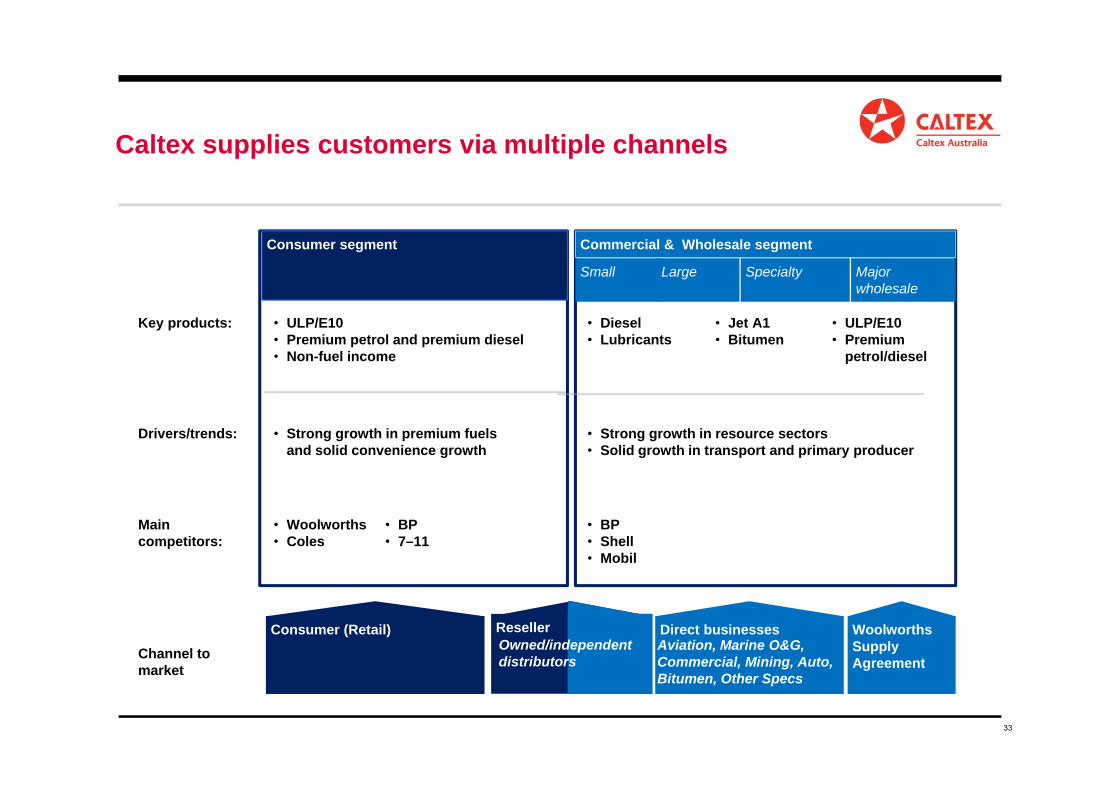
Key products:
Drivers/trends:
Channel to market
Consumer segment Commercial & Wholesale segment
• ULP/E10• Premium petrol and premium diesel• Non-fuel income
• Strong growth in premium fuels and solid convenience growth
Consumer (Retail)
• Diesel• Lubricants
• Strong growth in resource sectors • Solid growth in transport and primary producer
Direct businesses
Small Large Specialty Major wholesale
WoolworthsSupply Agreement
• Jet A1• Bitumen
• ULP/E10• Premium
petrol/diesel
Main competitors:
• Woolworths• Coles
• BP• Shell• Mobil
• BP• 7–11
Caltex supplies customers via multiple channels
Aviation, Marine O&G, Commercial, Mining, Auto, Bitumen, Other Specs
Owned/independent distributors
34
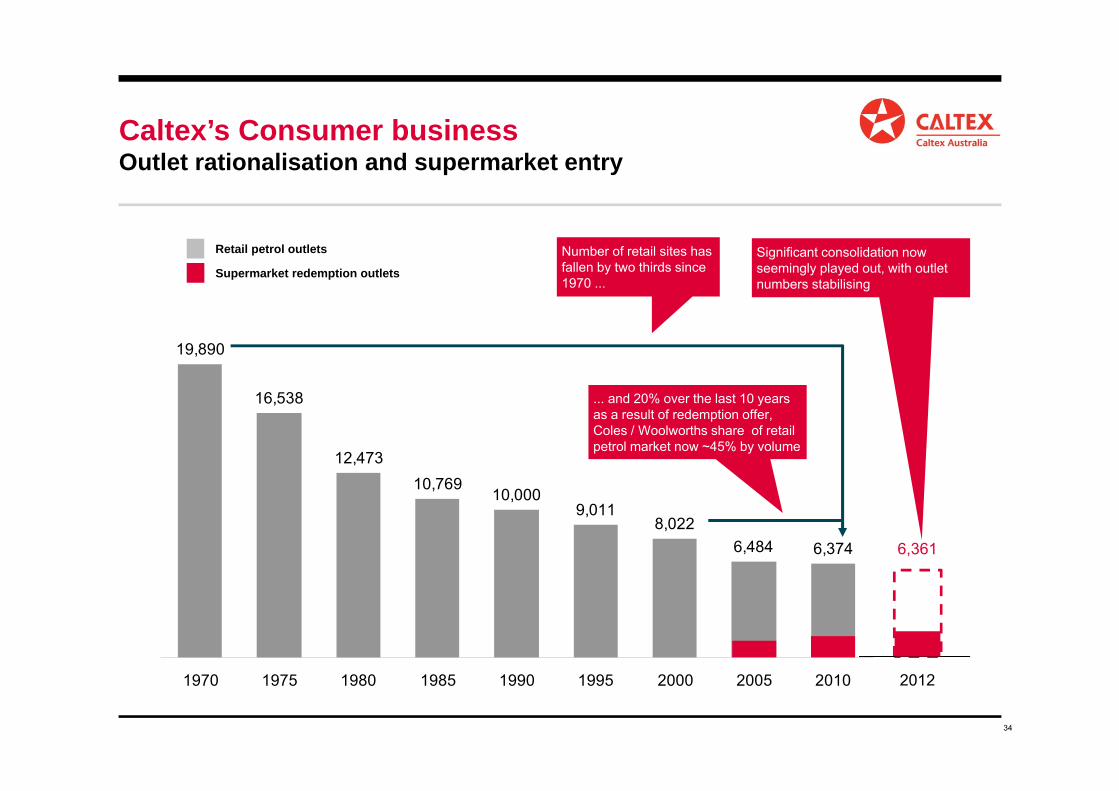
19,890
16,538
12,47310,769
10,0009,011
8,0226,484 6,374
1970 1975 1980 1985 1990 1995 2000 2005 2010
... and 20% over the last 10 years as a result of redemption offer, Coles / Woolworths share of retail petrol market now ~45% by volume
Number of retail sites has fallen by two thirds since 1970 ...
Caltex’s Consumer businessOutlet rationalisation and supermarket entry
6,361
2012
Supermarket redemption outlets
Retail petrol outlets Significant consolidation now seemingly played out, with outlet numbers stabilising
35
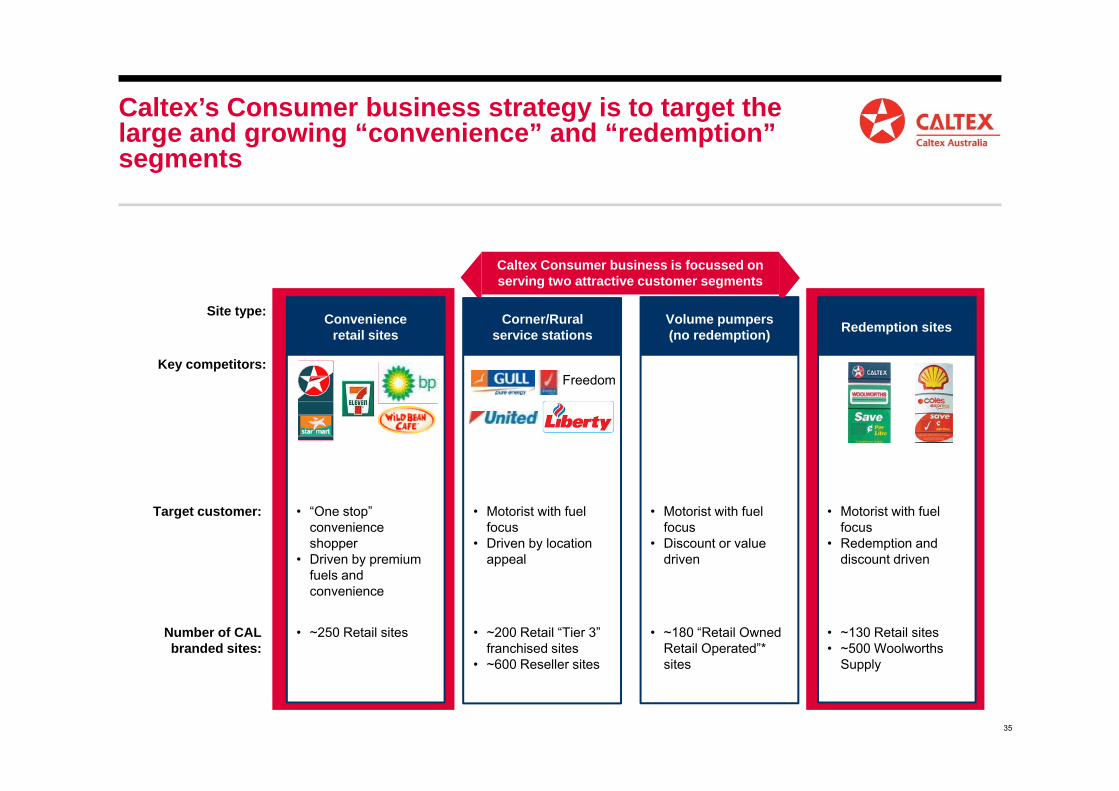
Caltex Consumer business is focussed on serving two attractive customer segments
Site type: Convenienceretail sites
Corner/Ruralservice stations
Volume pumpers(no redemption) Redemption sites
Key competitors:
Target customer: • “One stop” convenience shopper
• Driven by premium fuels and convenience
• Motorist with fuel focus
• Driven by location appeal
• Motorist with fuel focus
• Discount or value driven
• Motorist with fuel focus
• Redemption and discount driven
Number of CAL branded sites:
• ~250 Retail sites • ~200 Retail “Tier 3” franchised sites
• ~600 Reseller sites
• ~180 “Retail Owned Retail Operated”* sites
• ~130 Retail sites• ~500 Woolworths
Supply
Caltex’s Consumer business strategy is to target the large and growing “convenience” and “redemption” segments
Freedom
36
Mining
Marine / Oil & gas
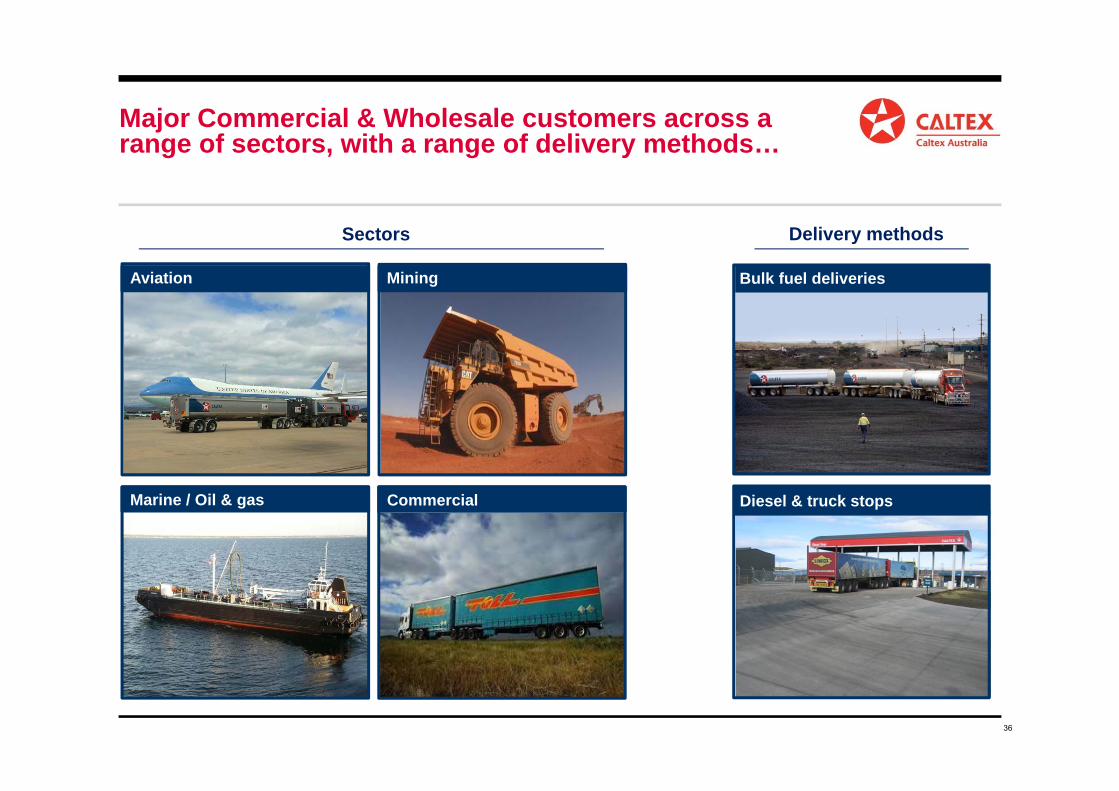
Major Commercial & Wholesale customers across a range of sectors, with a range of delivery methods…
Bulk fuel deliveries
Sectors Delivery methods
Aviation
Diesel & truck stopsCommercial
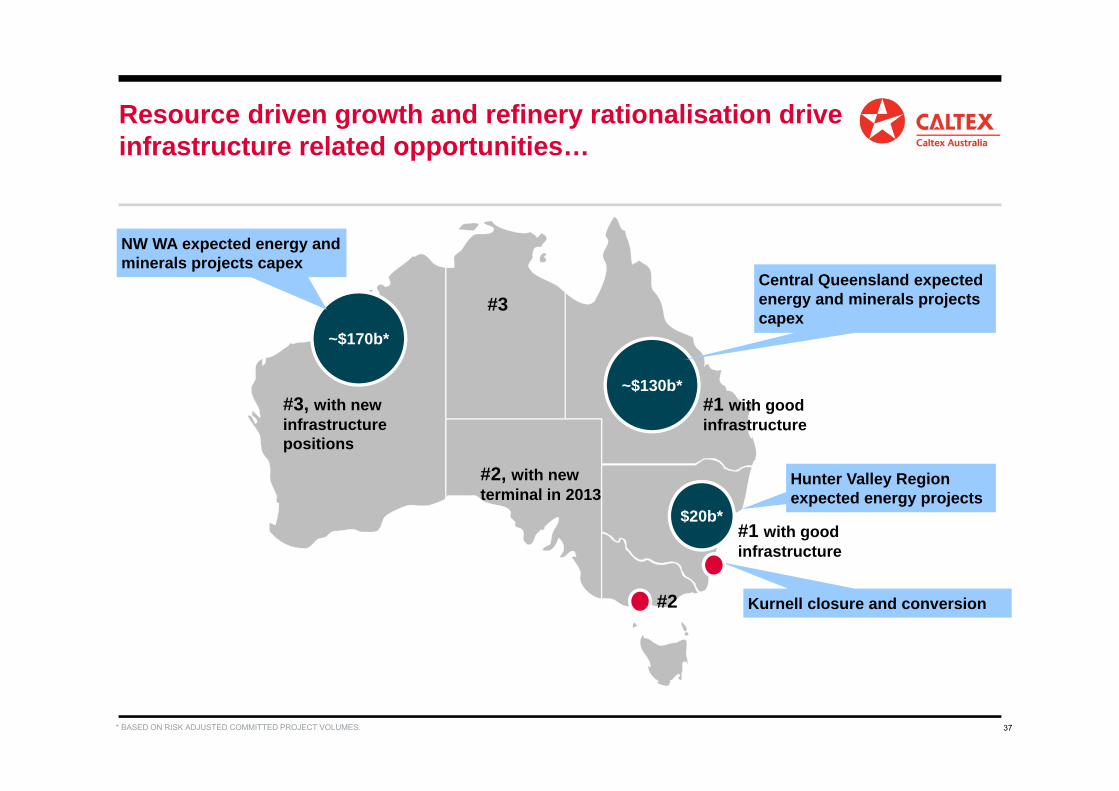
37* BASED ON RISK ADJUSTED COMMITTED PROJECT VOLUMES.
Kurnell closure and conversion
Resource driven growth and refinery rationalisation drive infrastructure related opportunities…
$20b*
Hunter Valley Region expected energy projects
~$130b*
Central Queensland expected energy and minerals projects capex
~$170b*
NW WA expected energy and minerals projects capex
#3, with new infrastructure positions
#2, with new terminal in 2013
#1 with good infrastructure
#1 with good infrastructure
#2
#3
38
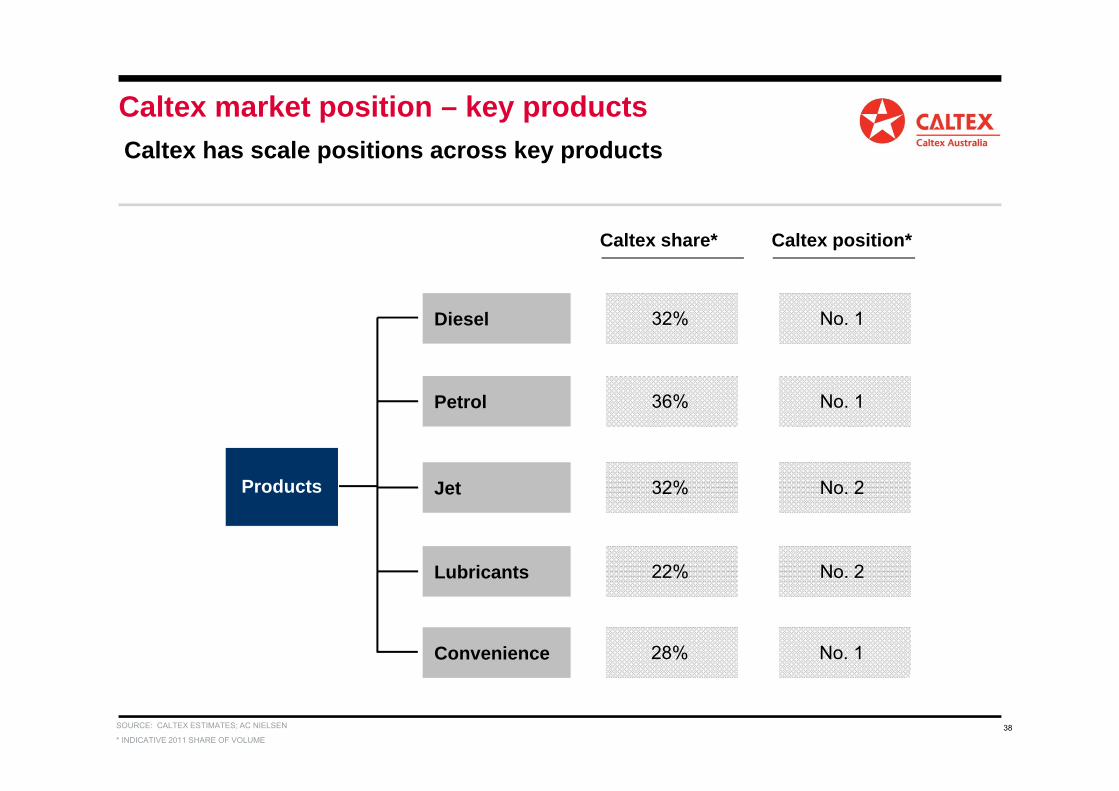
Diesel 32% No. 1
Caltex share* Caltex position*
Products
Petrol 36% No. 1
Jet 32% No. 2
Lubricants 22% No. 2
SOURCE: CALTEX ESTIMATES; AC NIELSEN
Convenience 28% No. 1
Caltex has scale positions across key productsCaltex market position – key products
* INDICATIVE 2011 SHARE OF VOLUME
39
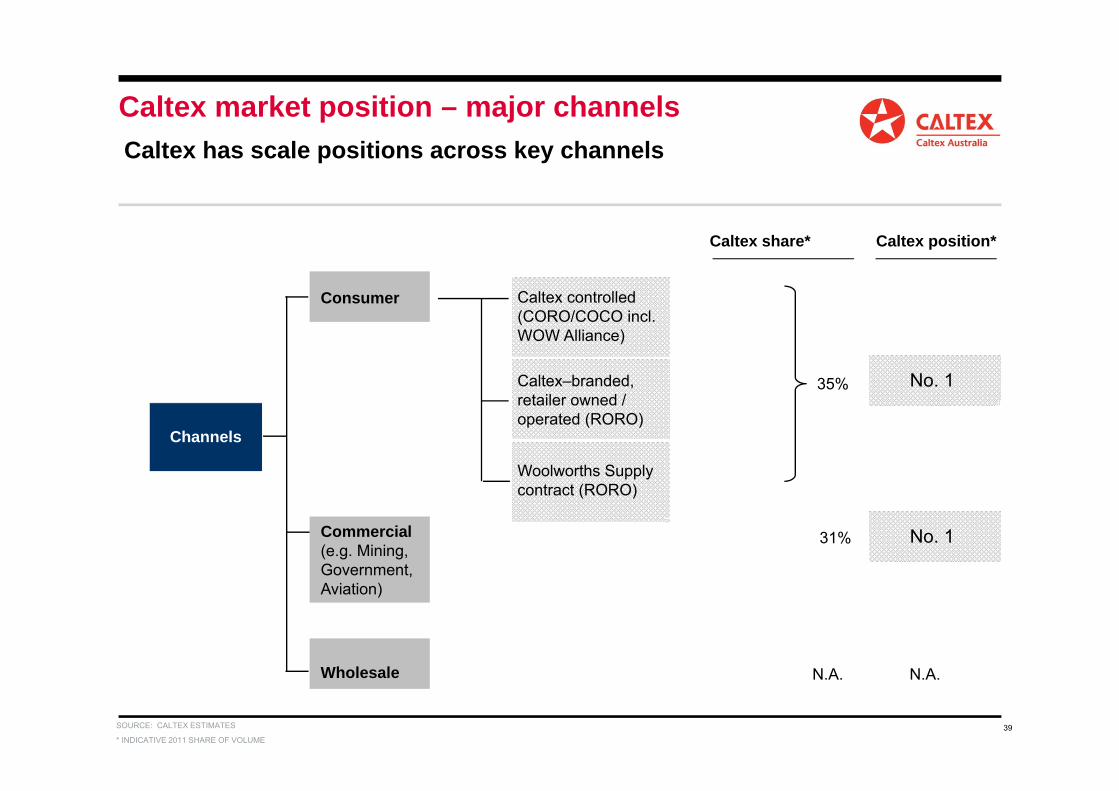
Caltex has scale positions across key channels
Consumer
Caltex share* Caltex position*
Channels
Commercial(e.g. Mining,Government,Aviation)
31%
Caltex controlled (CORO/COCO incl. WOW Alliance)
Caltex–branded, retailer owned / operated (RORO)
Woolworths Supply contract (RORO)
35%
Wholesale N.A. N.A.
Caltex market position – major channels
No. 1
No. 1
SOURCE: CALTEX ESTIMATES
* INDICATIVE 2011 SHARE OF VOLUME
40
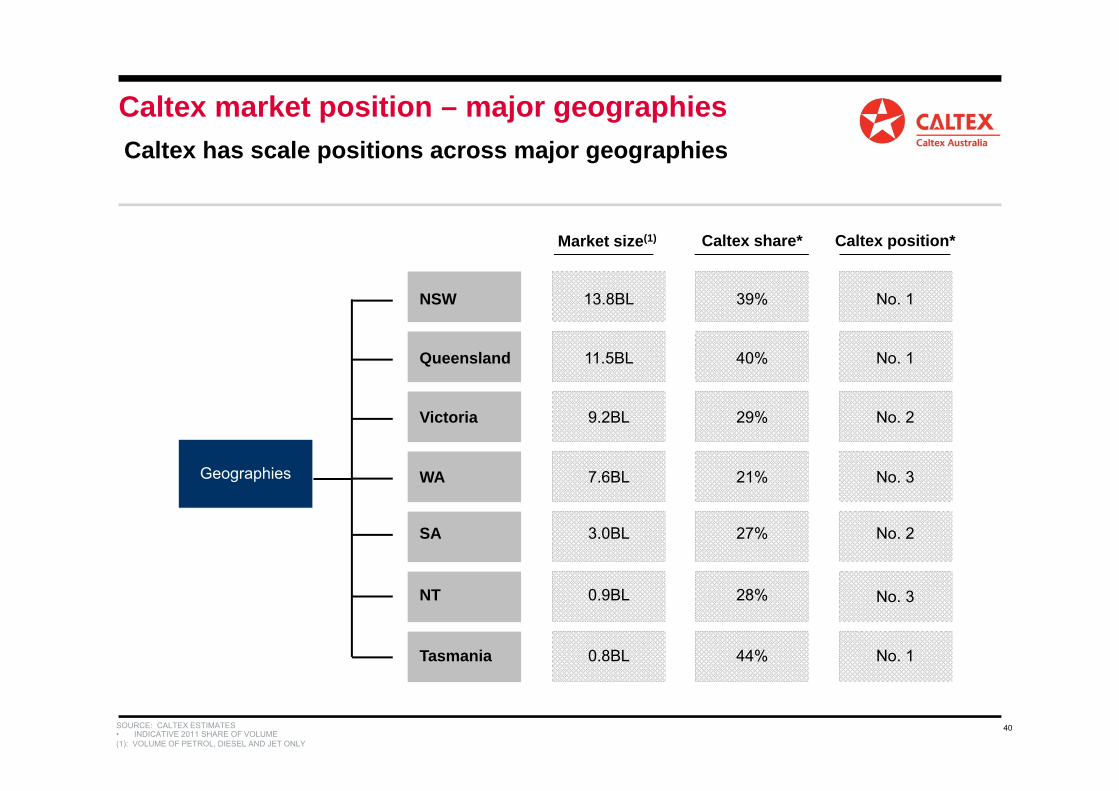
Caltex has scale positions across major geographies
NSW 39%
Caltex share*
Geographies
Queensland 40%
Victoria 29%
SA 27%
Tasmania 44%
WA 21%
NT 28%
13.8BL
Market size(1)
11.5BL
9.2BL
3.0BL
0.8BL
7.6BL
0.9BL
No. 1
Caltex position*
No. 1
No. 2
No. 2
No. 3
No. 3
No. 1
Caltex market position – major geographies
SOURCE: CALTEX ESTIMATES• INDICATIVE 2011 SHARE OF VOLUME(1): VOLUME OF PETROL, DIESEL AND JET ONLY
FINANCIALS
42
(300)
(200)
(100)
0
100
200
300
400
500
600
700
800
2001 2003 2005 2007 2009 2011
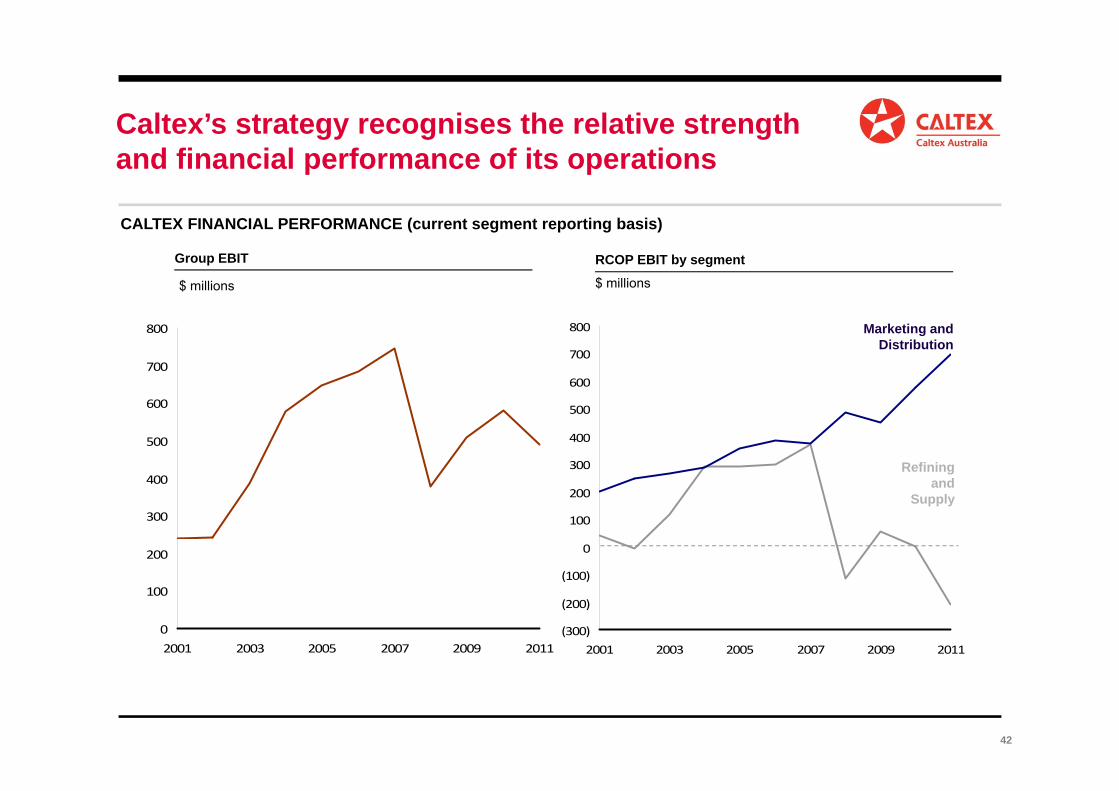
Marketing and Distribution
Refining and
Supply
RCOP EBIT by segment
$ millions
CALTEX FINANCIAL PERFORMANCE (current segment reporting basis)
Caltex’s strategy recognises the relative strength and financial performance of its operations
Group EBIT
$ millions
0
100
200
300
400
500
600
700
800
2001 2003 2005 2007 2009 2011

43
Kurnell closure potentially adds cash-flow volatility and risk in the short term
Item Description Indicative amount
Timing
Closure costs (pre-tax) Mainly redundancy ($80m) and decommissioning expenditure ($80m)
$(160)m Majority of redundancy and decommissioning expenditure will be paid within 12-24 months of closure
Environmental remediation (pre-tax)
Removal or treatment of waste materials and site and land rehabilitation
$(270)m (discounted)
Expenditure will be paid over a long-term period, with majority expected to be paid after 2016
Terminal conversion costs
Conversion and expansion of current import facilities
$(250)m Work has commenced in 2012, and will be completed by 2017
Working capital release Working capital requirements of operating a refined product import facility are lower than operating an oil refinery
~$200m Working capital release expected to be realised within 12 months of closure
Tax credit Benefit from tax writedown of assets
~$120m Tax benefit expected to be realised within 12 month period of closure
Tax write-down of c.$400m in assets
44
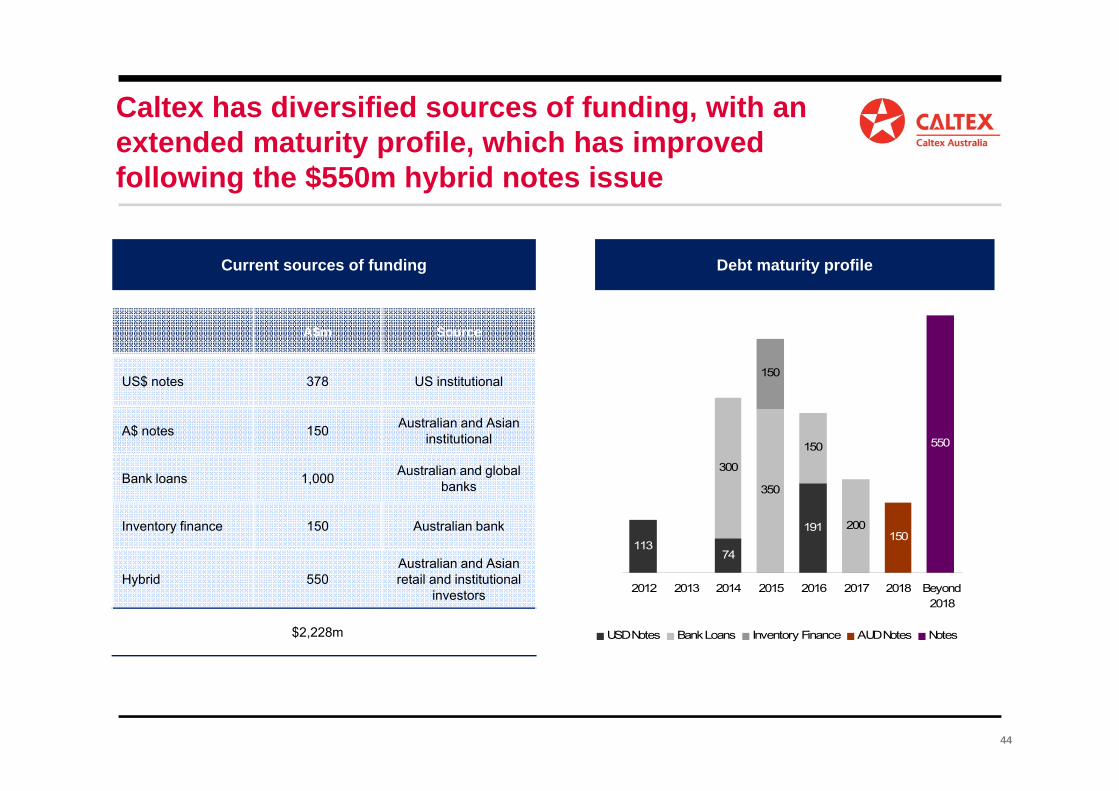
Caltex has diversified sources of funding, with an extended maturity profile, which has improved following the $550m hybrid notes issue
Debt maturity profile Current sources of funding
A$m Source
US$ notes 378 US institutional
A$ notes 150 Australian and Asian institutional
Bank loans 1,000 Australian and global banks
Inventory finance 150 Australian bank
Hybrid 550Australian and Asian retail and institutional
investors
$2,228m
11374
191
300
350
150
200
150
550
150
2012 2013 2014 2015 2016 2017 2018 Beyond2018
USD Notes Bank Loans Inventory Finance AUD Notes Notes
1H2012 RESULTS SUMMARY
46
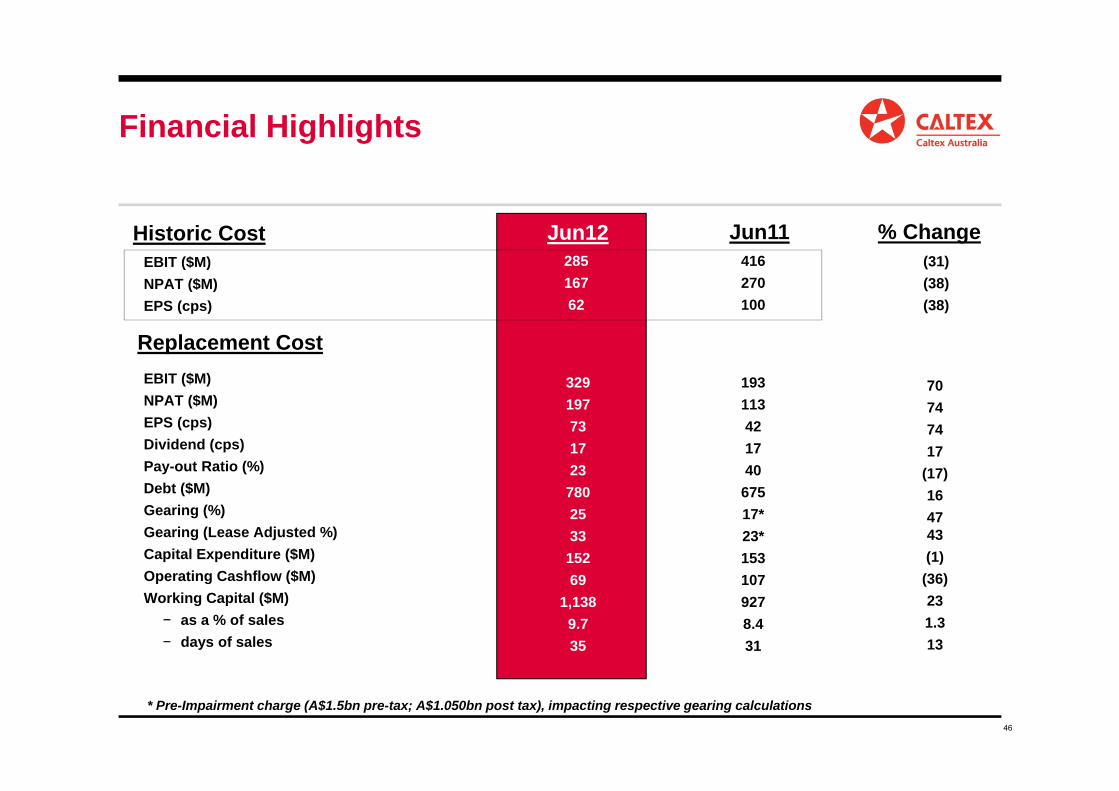
Jun12 Jun11EBIT ($M)NPAT ($M)EPS (cps)
416270100
Historic Cost28516762
% Change
193113421740
67517*23*1531079278.431
329197731723
7802533
15269
1,1389.735
EBIT ($M)NPAT ($M)EPS (cps)Dividend (cps)Pay-out Ratio (%)Debt ($M)Gearing (%)Gearing (Lease Adjusted %)Capital Expenditure ($M)Operating Cashflow ($M)Working Capital ($M)
− as a % of sales− days of sales
70747417
(17)164743(1)
(36)231.313
Replacement Cost
(31)(38)(38)
* Pre-Impairment charge (A$1.5bn pre-tax; A$1.050bn post tax), impacting respective gearing calculations
Financial Highlights
47
• Result in line with recent profit guidance.
• Growth in Marketing continues, Refining breaks even.
• Supply Chain Restructure – Kurnell conversion to a major import terminal.
• Strong balance sheet strengthened further via successful Hybrid raising, as it executes its growth plans and implements supply chain restructure (Kurnell conversion).
• Dividend (17cps fully franked) realigned to revised dividend pay-out ratio.
1H2012 Results SummaryKey highlights
48
• $197M RCOP NPAT and $167M HCOP NPAT• Strong Marketing performance, Refining challenges temporarily abate• Refinery result boosted by favourable impact of asset impairment on depreciation charge and improved operating performance
• Balance sheet remains strong, intention to maintain BBB+ credit rating• Working capital / average debt up due to higher proportion of longer haul crudes (West Africa)
• Marketing EBIT up 8% year on year. Growth driven by premium gasolines(+14%), diesel (+3%), jet fuel (+6%) and lubricants (+6%) volumes , partially offset by lower gasoline volumes
• Stronger refiner margins. Improved Refinery reliability with transport fuels production up 8.5%.
• Average Caltex Refiner Margin US$2.05/BBL higher than 1H 2011:• Light-Heavy spread US$3.57/BBL lower, resulting in higher Singapore WAM; • Crude premiums and freight costs higher than prior year, reflecting strong competition for
regional crudes and greater proportion of long haul crudes; • AUD average crude price in line with prior year
Company result in line with previous guidance
Balance sheet remains strong
Strong Marketing performance continues
Improved Refining performance off a low (comparable) base
Marketing Growth Continues, Refining Breaks Even
49
• Constant vigilance for both process and personal safety. Continued improvement in safety incident frequency.
• Marketing outlook positive. Good underlying demand across premium fuels, diesel and jet. Market share gains in lubricants. Benefit from recent infrastructure spend.
• Recent refiner margin strength expected to continue. Improved short term Refining outlook.
• Supply chain restructure announcement to reduce earnings volatility, asset concentration risk (refining exposure) and develop a sustainable competitive long term supply capability whilst providing the opportunity to increasingly redeploy funds to the growth business.
Safety Performance
Short term outlook
Strong Marketing Performance, Refining Challenges
50
CALTEX AUSTRALIA 50
• Continued investment in development of Caltex’s supply chain, supporting current and future business.
• Proposed closure of the Kurnell refinery and conversion to a major import terminal. Closure in approximately two years time (2H 2014).
• Continued operation of Lytton refinery. Necessary focus on operational and financial performance improvements, in conjunction with engaging key stakeholders. Potentially supported by modest incremental capital expenditure investment.
• Reduced exposure to refining earnings volatility and asset concentration risk. Own refinery supply will reduce to 25% of requirements (from approximately 55%).
• Long term secure supply from Chevron.
Supply Chain RestructureKurnell: Transition to a Major Import Terminal
51
EBIT (RCOP) CAGR of at least 5% from:
Retail premium fuels (across petrol and diesel markets)
Diesel growth at or above market rate
Jet fuels
Finished lubricants gains
Non-Fuel income growth at or above market
EBIT 8% above 1H FY11
Premium petrol sales +14%, as share of total petrol volumes increased to 26% (22% pcp).
Retail diesel volume growth drives total diesel volumes (+3.3%)
Premium diesel sales have effectively doubled since FY10 as the share of retail diesel increased to 33% of a growing diesel market
Jet fuel volume growth +6% above 1H FY11.
Lubricants volumes grew +6.4% to 40ML. Market share gains continue
Non-fuel income up +2% from higher card income (due to higher fuel sales / board prices), despite flat weekly shop sales (soft economic conditions, adverse weather).
Caltex continues to be market leading convenience retailer
What we are targeting What we Delivered
Organic Growth in Marketing Continues
52
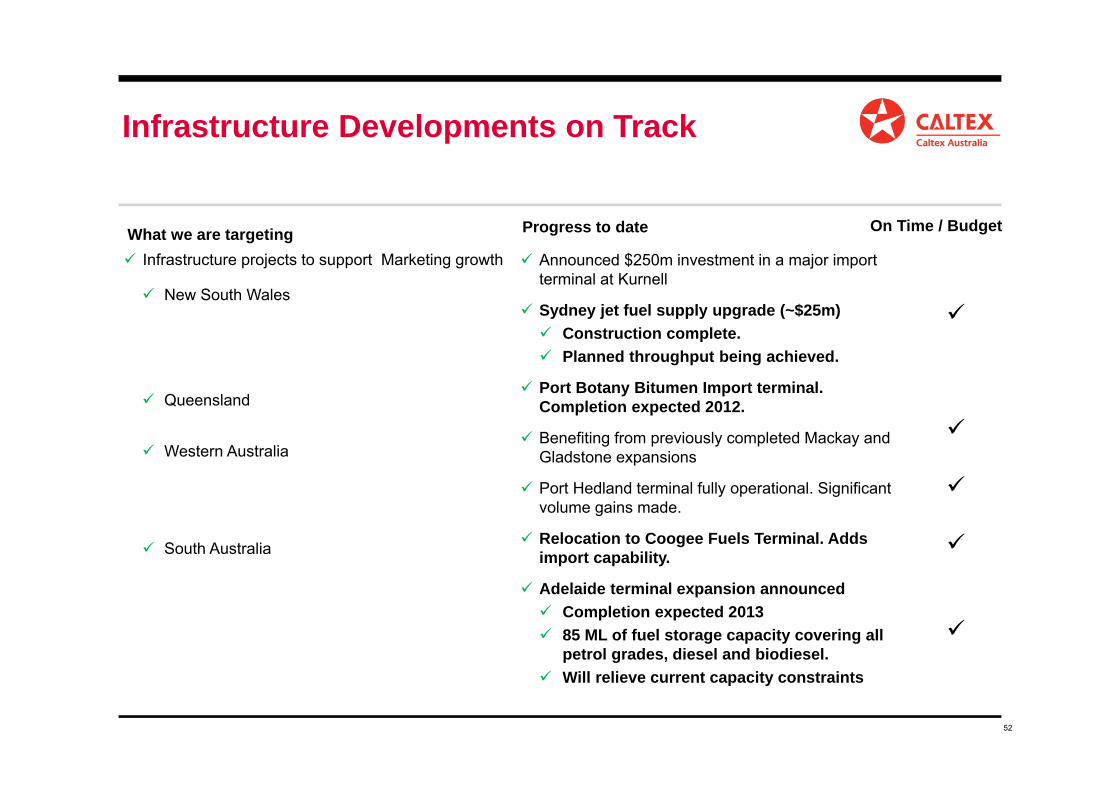
Infrastructure projects to support Marketing growth
New South Wales
Queensland
Western Australia
South Australia
What we are targeting Announced $250m investment in a major import
terminal at Kurnell
Sydney jet fuel supply upgrade (~$25m) Construction complete. Planned throughput being achieved.
Port Botany Bitumen Import terminal. Completion expected 2012.
Benefiting from previously completed Mackay and Gladstone expansions
Port Hedland terminal fully operational. Significant volume gains made.
Relocation to Coogee Fuels Terminal. Adds import capability.
Adelaide terminal expansion announced Completion expected 2013 85 ML of fuel storage capacity covering all
petrol grades, diesel and biodiesel. Will relieve current capacity constraints
Progress to date On Time / Budget
Infrastructure Developments on Track
53
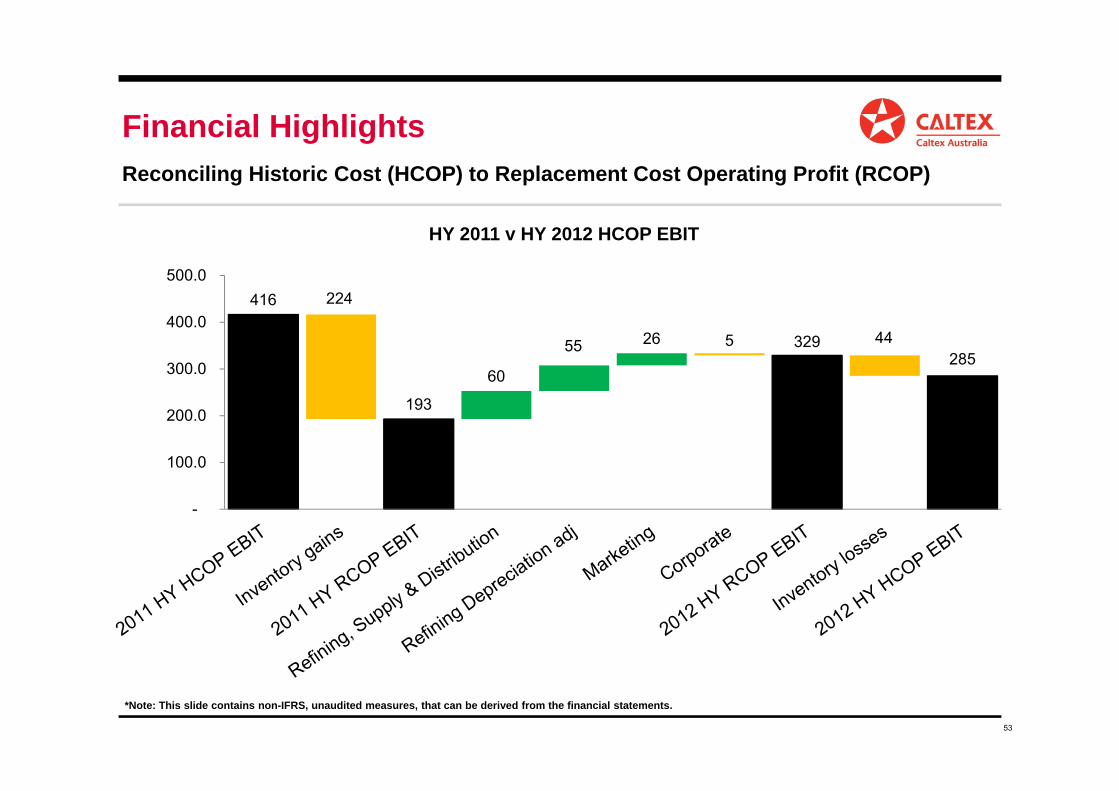
*Note: This slide contains non-IFRS, unaudited measures, that can be derived from the financial statements.
416 224
193
60
55 26 5 329 44285
-
100.0
200.0
300.0
400.0
500.0
HY 2011 v HY 2012 HCOP EBIT
Financial HighlightsReconciling Historic Cost (HCOP) to Replacement Cost Operating Profit (RCOP)
54
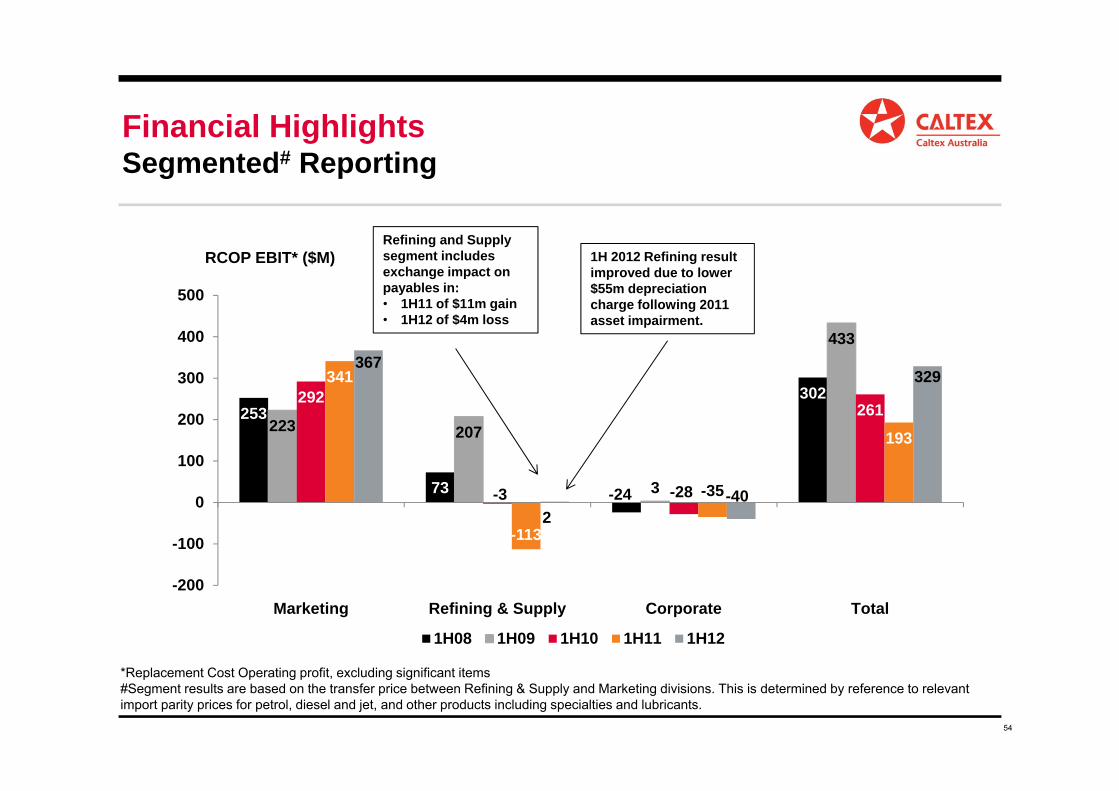
253
73 -24
302
223 207
3
433
292
-3 -28
261
341
-113
-35
193
367
2-40
329
-200
-100
0
100
200
300
400
500
Marketing Refining & Supply Corporate Total
1H08 1H09 1H10 1H11 1H12
*Replacement Cost Operating profit, excluding significant items#Segment results are based on the transfer price between Refining & Supply and Marketing divisions. This is determined by reference to relevant import parity prices for petrol, diesel and jet, and other products including specialties and lubricants.
RCOP EBIT* ($M)Refining and Supply segment includes exchange impact on payables in:• 1H11 of $11m gain • 1H12 of $4m loss
1H 2012 Refining result improved due to lower $55m depreciation charge following 2011 asset impairment.
Financial HighlightsSegmented# Reporting
55
*Note: This slide contains non-IFRS, unaudited measures, that can be derived from the financial statements.
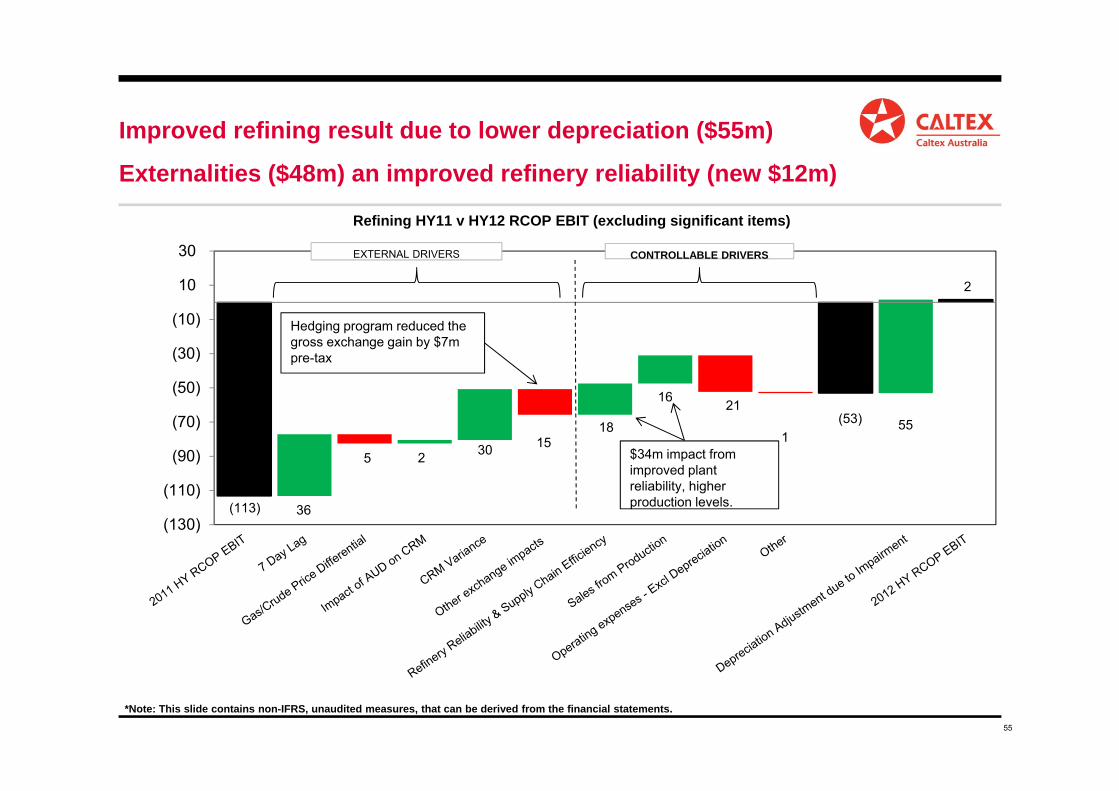
(113)
(53)
2 -
36
5 2 30 15 18
16 21
1 55
(130)
(110)
(90)
(70)
(50)
(30)
(10)
10
30
Refining HY11 v HY12 RCOP EBIT (excluding significant items)
Hedging program reduced the gross exchange gain by $7m pre-tax
EXTERNAL DRIVERS
$34m impact from improved plant reliability, higher production levels.
CONTROLLABLE DRIVERS
Improved refining result due to lower depreciation ($55m)
Externalities ($48m) an improved refinery reliability (new $12m)
56
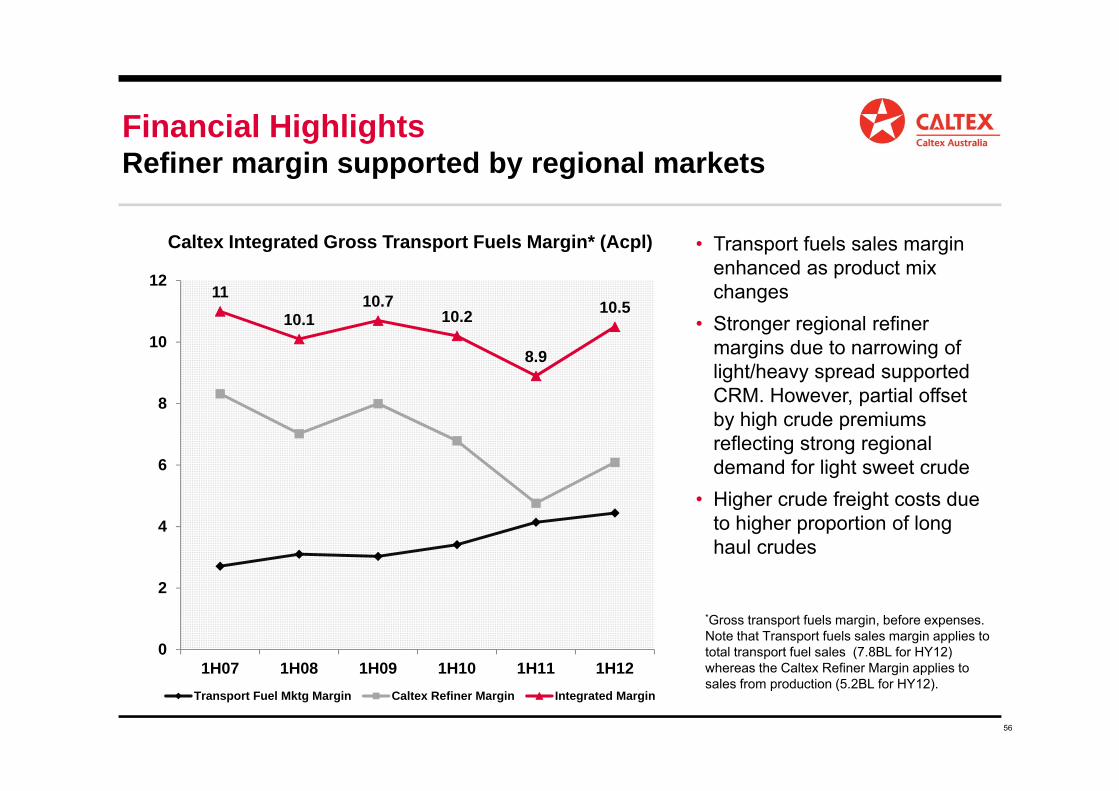
• Transport fuels sales margin enhanced as product mix changes
• Stronger regional refiner margins due to narrowing of light/heavy spread supported CRM. However, partial offset by high crude premiums reflecting strong regional demand for light sweet crude
• Higher crude freight costs due to higher proportion of long haul crudes
1110.1
10.710.2
8.9
10.5
0
2
4
6
8
10
12
1H07 1H08 1H09 1H10 1H11 1H12Transport Fuel Mktg Margin Caltex Refiner Margin Integrated Margin
Caltex Integrated Gross Transport Fuels Margin* (Acpl)
*Gross transport fuels margin, before expenses. Note that Transport fuels sales margin applies to total transport fuel sales (7.8BL for HY12) whereas the Caltex Refiner Margin applies to sales from production (5.2BL for HY12).
Financial HighlightsRefiner margin supported by regional markets
57
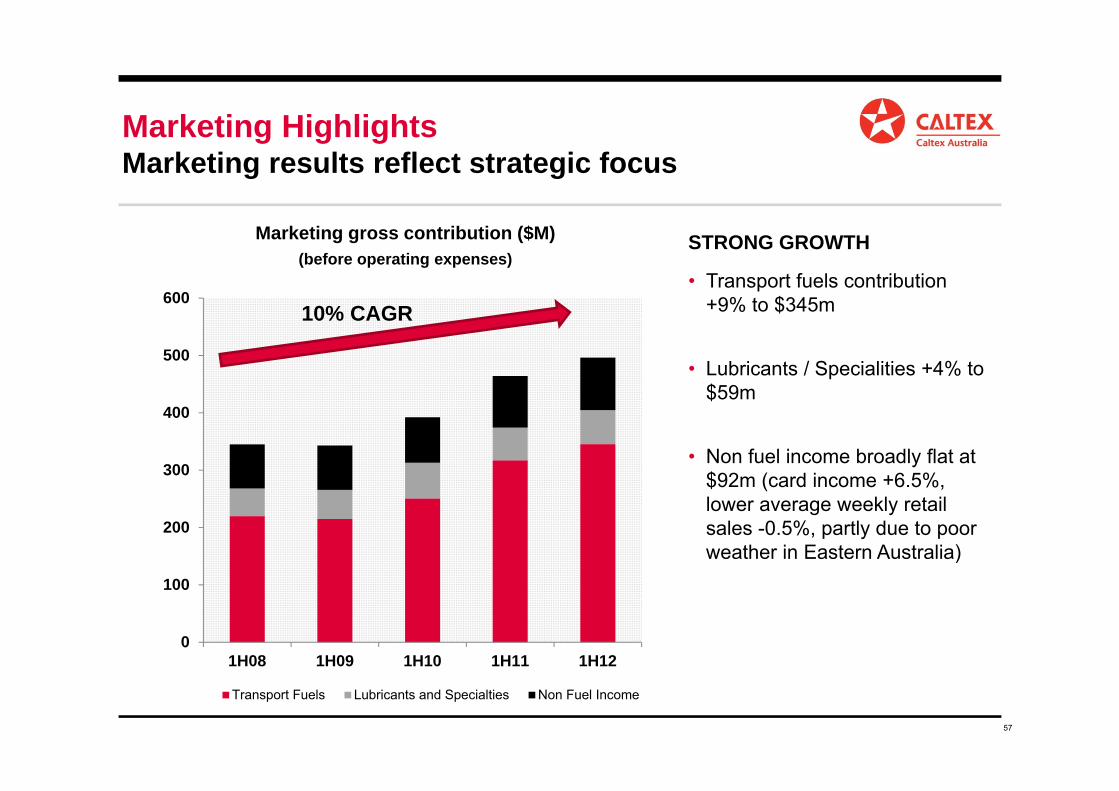
• Transport fuels contribution +9% to $345m
• Lubricants / Specialities +4% to $59m
• Non fuel income broadly flat at $92m (card income +6.5%, lower average weekly retail sales -0.5%, partly due to poor weather in Eastern Australia)
0
100
200
300
400
500
600
1H08 1H09 1H10 1H11 1H12
Transport Fuels Lubricants and Specialties Non Fuel Income
Marketing gross contribution ($M)(before operating expenses)
STRONG GROWTH
10% CAGR
Marketing HighlightsMarketing results reflect strategic focus
58
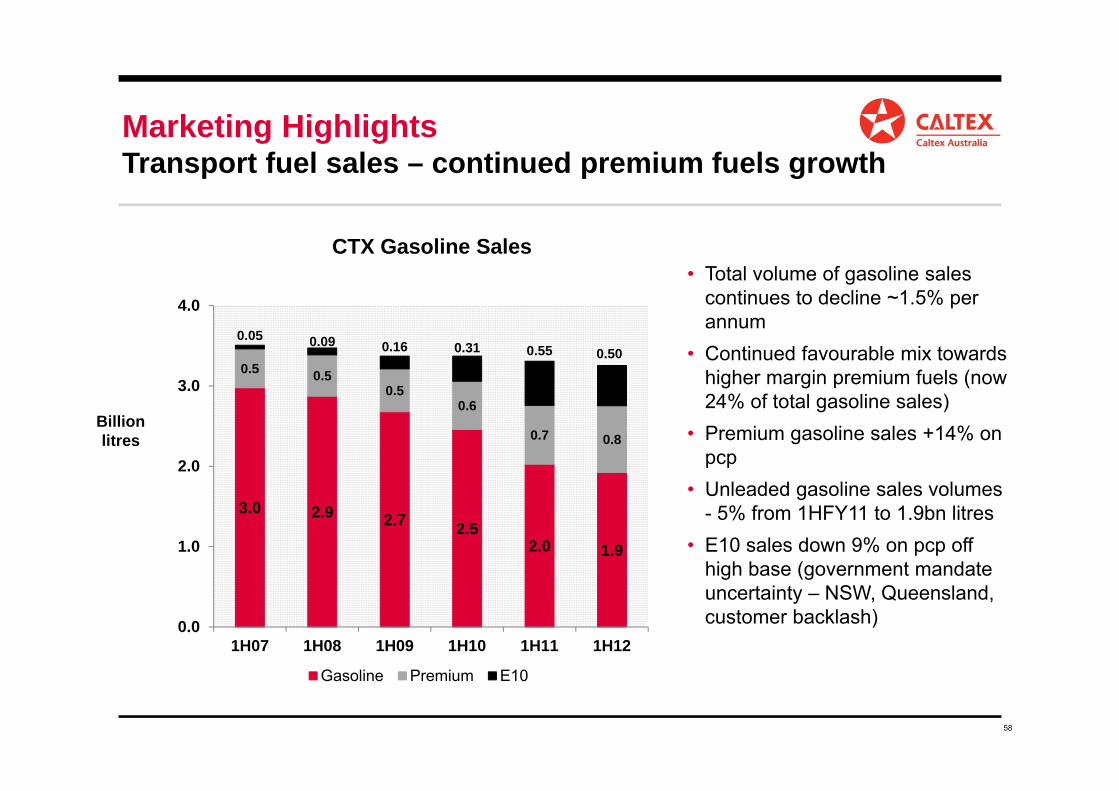
3.0 2.9 2.7 2.52.0 1.9
0.5 0.50.5
0.6
0.7 0.8
0.05 0.09 0.16 0.31 0.55 0.50
0.0
1.0
2.0
3.0
4.0
1H07 1H08 1H09 1H10 1H11 1H12
Gasoline Premium E10
• Total volume of gasoline sales continues to decline ~1.5% per annum
• Continued favourable mix towards higher margin premium fuels (now 24% of total gasoline sales)
• Premium gasoline sales +14% on pcp
• Unleaded gasoline sales volumes - 5% from 1HFY11 to 1.9bn litres
• E10 sales down 9% on pcp off high base (government mandate uncertainty – NSW, Queensland, customer backlash)
CTX Gasoline Sales
Billion litres
Marketing HighlightsTransport fuel sales – continued premium fuels growth
59
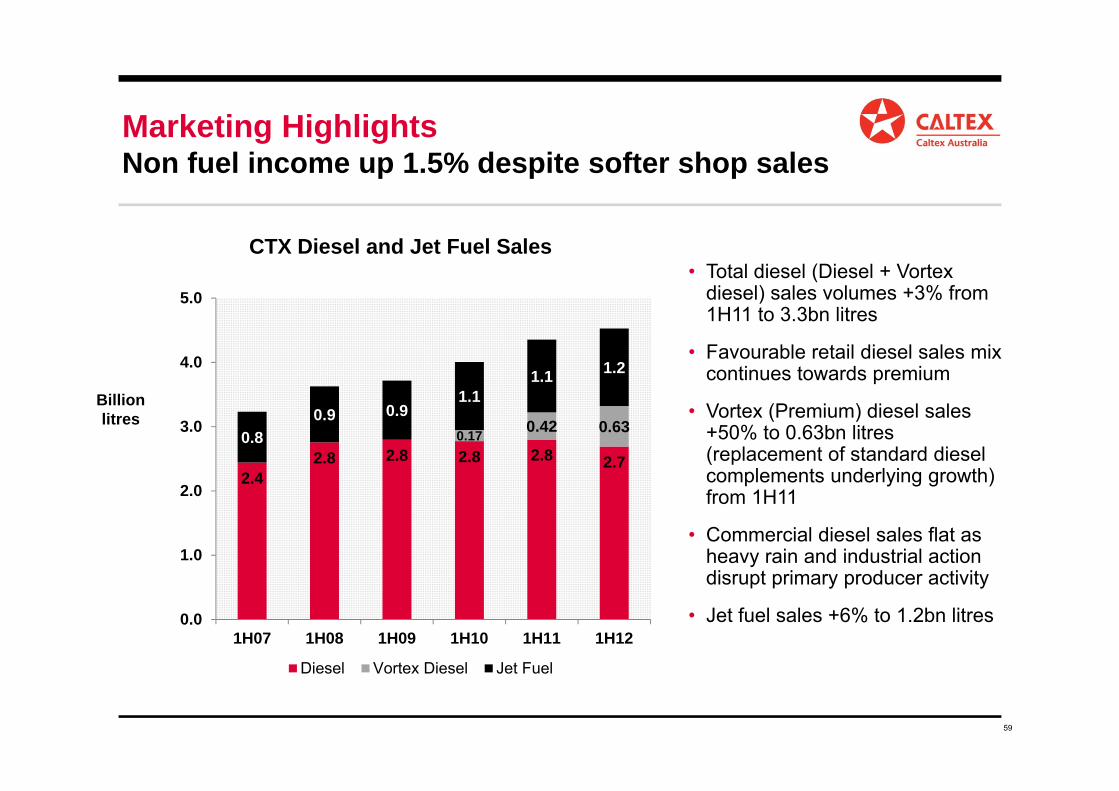
2.42.8 2.8 2.8 2.8 2.7
0.17 0.42 0.630.80.9 0.9
1.11.1 1.2
0.0
1.0
2.0
3.0
4.0
5.0
1H07 1H08 1H09 1H10 1H11 1H12
Diesel Vortex Diesel Jet Fuel
• Total diesel (Diesel + Vortex diesel) sales volumes +3% from 1H11 to 3.3bn litres
• Favourable retail diesel sales mix continues towards premium
• Vortex (Premium) diesel sales +50% to 0.63bn litres (replacement of standard diesel complements underlying growth) from 1H11
• Commercial diesel sales flat as heavy rain and industrial action disrupt primary producer activity
• Jet fuel sales +6% to 1.2bn litres
CTX Diesel and Jet Fuel Sales
Billion litres
Marketing HighlightsNon fuel income up 1.5% despite softer shop sales
60
10.27
5.95
8.39 7.98
9.67
7.82
9.87
-0.53
0.41
0.27 0.34
0.23
0.36
-0.70
7.88
5.055.77
4.87
6.79
4.76
6.09
-2
0
2
4
6
8
10
12
FY08 FY09 FY10 FY11 1H10 1H11 1H12
Realised CRM (USD/bbl) Lag (USD/bbl) CRM (Acpl)
Caltex Refiner MarginBuild-up (US$/bbl)
2012 2011
Singapore WAMB 14.73 11.11
Add:Product freight 4.46 4.50Quality premium 2.02 1.86
Less:Crude freight 3.28 2.90Crude premiumB 3.96 2.72Yield loss 4.10 4.03
BSingapore WAM based on Dated Brent benchmark. Crude discount/premium includes discounts and premiums relative to Dated Brent and the spread between Dated Brent and crudes purchased on the basis of other benchmarks.
*The Caltex Refiner Margin (CRM) represents the difference between the cost of importing a standard Caltex basket of products to Eastern Australia and the cost of importing the crude oil required to make that product basket. The CRM calculation represents: average Singapore refiner margin + product quality premium + crude discount/(premium) + product freight - crude freight - yield loss
The CRM was positively impacted by a market price timing lag of US $0.70/bbl (A$24m EBIT) in 1H12
Supply Chain HighlightsCaltex Refiner Margin
61
‐
5
10
15
20
25
30
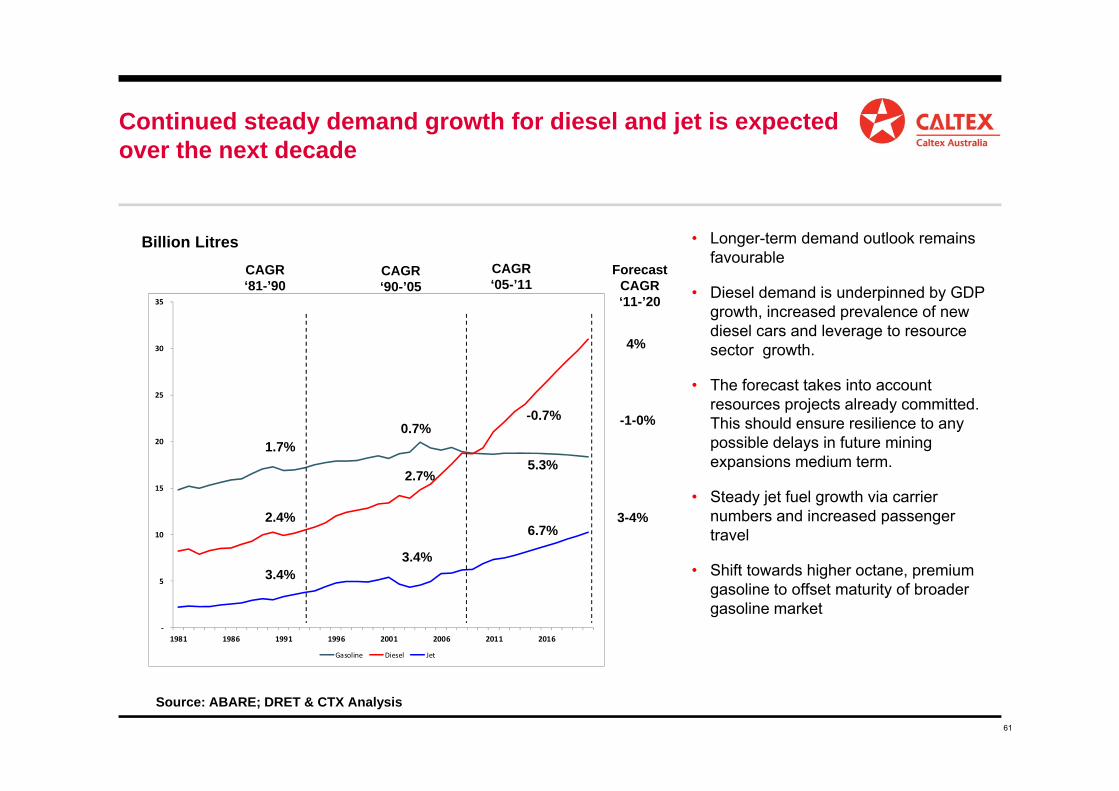
35
1981 1986 1991 1996 2001 2006 2011 2016
Gasoline Diesel Jet
Billion Litres • Longer-term demand outlook remains favourable
• Diesel demand is underpinned by GDP growth, increased prevalence of new diesel cars and leverage to resource sector growth.
• The forecast takes into account resources projects already committed. This should ensure resilience to any possible delays in future mining expansions medium term.
• Steady jet fuel growth via carrier numbers and increased passenger travel
• Shift towards higher octane, premium gasoline to offset maturity of broader gasoline market
Source: ABARE; DRET & CTX Analysis
CAGR‘81-’90
CAGR‘90-’05
CAGR‘05-’11
1.7%
2.4%
3.4%
0.7%
2.7%
3.4%
-0.7%
5.3%
6.7%
-1-0%
4%
3-4%
Forecast CAGR‘11-’20
Continued steady demand growth for diesel and jet is expected over the next decade
62
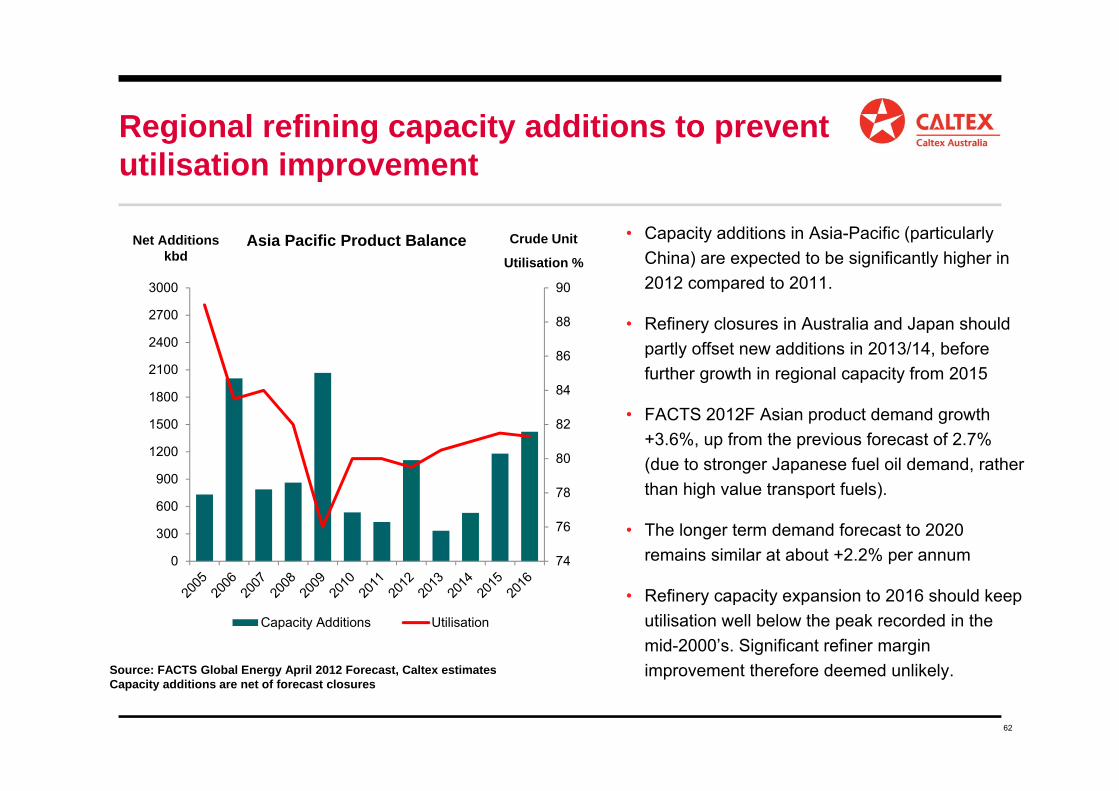
• Capacity additions in Asia-Pacific (particularly China) are expected to be significantly higher in 2012 compared to 2011.
• Refinery closures in Australia and Japan should partly offset new additions in 2013/14, before further growth in regional capacity from 2015
• FACTS 2012F Asian product demand growth +3.6%, up from the previous forecast of 2.7% (due to stronger Japanese fuel oil demand, rather than high value transport fuels).
• The longer term demand forecast to 2020 remains similar at about +2.2% per annum
• Refinery capacity expansion to 2016 should keep utilisation well below the peak recorded in the mid-2000’s. Significant refiner margin improvement therefore deemed unlikely.
74
76
78
80
82
84
86
88
90
0
300
600
900
1200
1500
1800
2100
2400
2700
3000
Asia Pacific Product Balance
Capacity Additions Utilisation
Net Additions kbd
Crude Unit
Utilisation %
Source: FACTS Global Energy April 2012 Forecast, Caltex estimatesCapacity additions are net of forecast closures
Regional refining capacity additions to prevent utilisation improvement
63
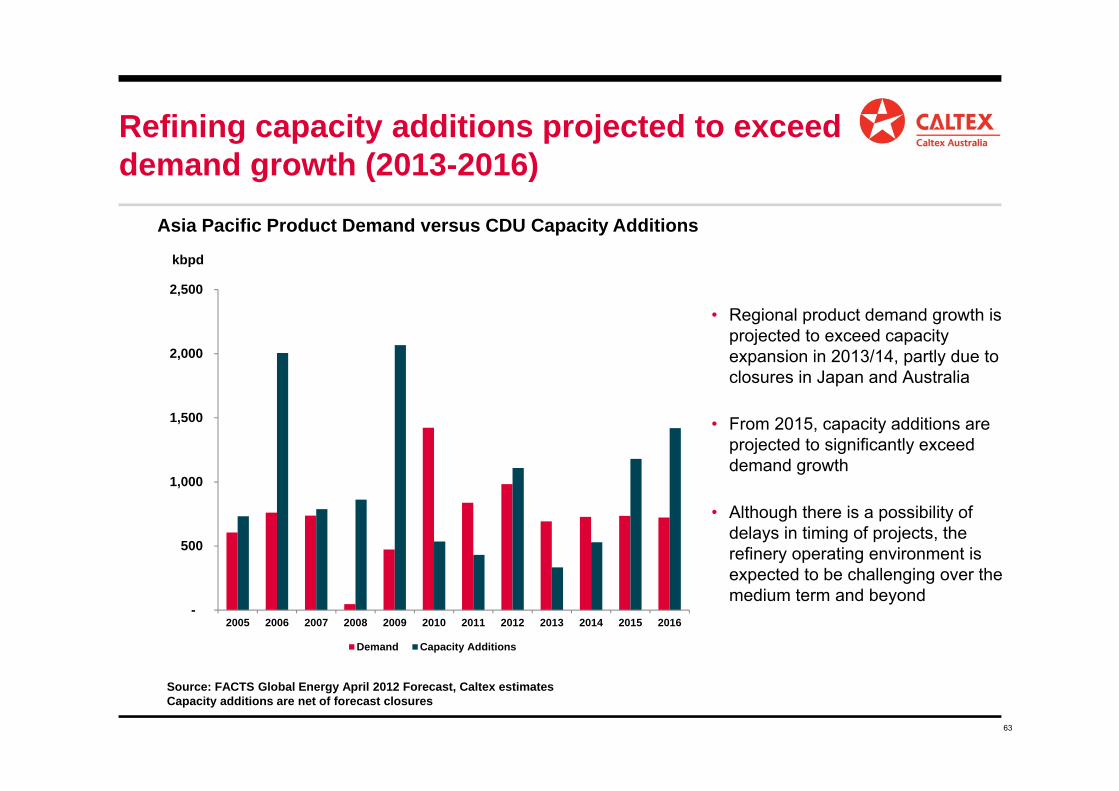
• Regional product demand growth is projected to exceed capacity expansion in 2013/14, partly due to closures in Japan and Australia
• From 2015, capacity additions are projected to significantly exceed demand growth
• Although there is a possibility of delays in timing of projects, the refinery operating environment is expected to be challenging over the medium term and beyond
-
500
1,000
1,500
2,000
2,500
2005 2006 2007 2008 2009 2010 2011 2012 2013 2014 2015 2016
Demand Capacity Additions
Asia Pacific Product Demand versus CDU Capacity Additions
kbpd
Source: FACTS Global Energy April 2012 Forecast, Caltex estimatesCapacity additions are net of forecast closures
Refining capacity additions projected to exceed demand growth (2013-2016)
64
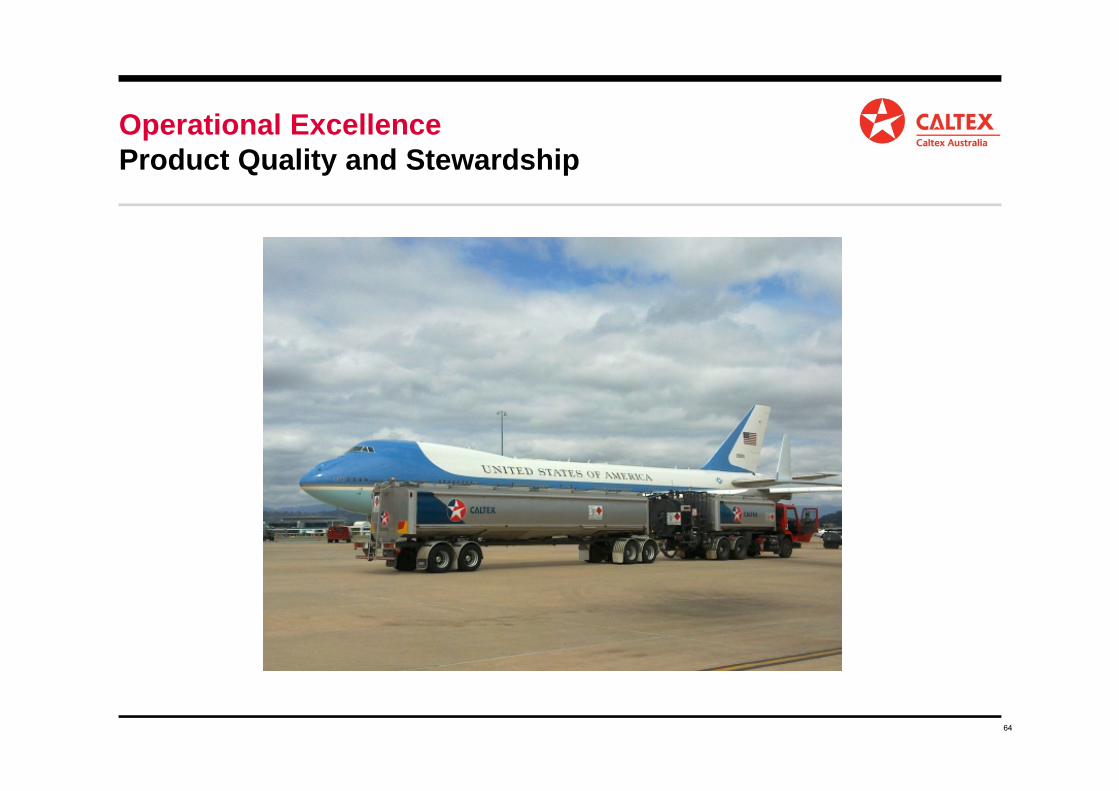
Operational Excellence Product Quality and Stewardship
65
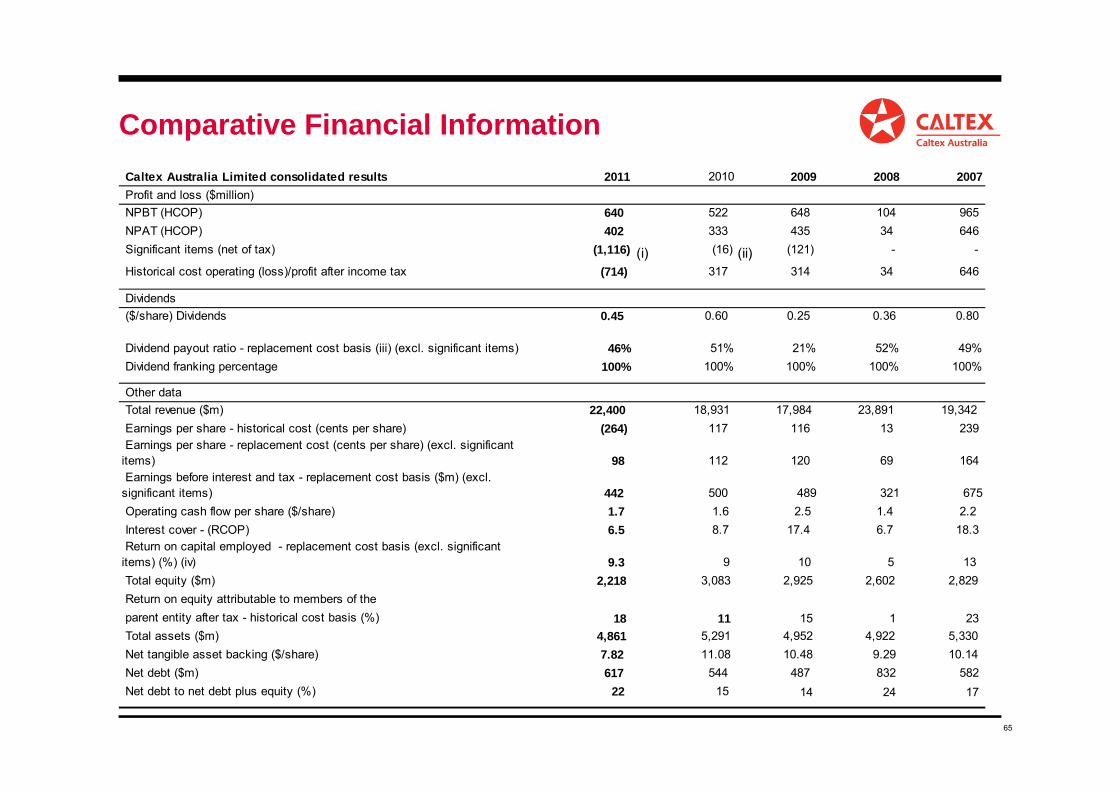
Comparative Financial InformationCaltex Australia Limited consolidated results 2011 2010 2009 2008 2007Profit and loss ($million)
NPBT (HCOP) 640 522 648 104 965 NPAT (HCOP) 402 333 435 34 646 Significant items (net of tax) (1,116) (16) (121) - -
Historical cost operating (loss)/profit after income tax (714) 317 314 34 646
Dividends ($/share) Dividends 0.45 0.60 0.25 0.36 0.80
Dividend payout ratio - replacement cost basis (iii) (excl. significant items) 46% 51% 21% 52% 49% Dividend franking percentage 100% 100% 100% 100% 100%
Other data Total revenue ($m) 22,400 18,931 17,984 23,891 19,342 Earnings per share - historical cost (cents per share) (264) 117 116 13 239 Earnings per share - replacement cost (cents per share) (excl. significant items) 98 112 120 69 164 Earnings before interest and tax - replacement cost basis ($m) (excl. significant items) 442 500 489 321 675 Operating cash flow per share ($/share) 1.7 1.6 2.5 1.4 2.2 Interest cover - (RCOP) 6.5 8.7 17.4 6.7 18.3 Return on capital employed - replacement cost basis (excl. significant items) (%) (iv) 9.3 9 10 5 13 Total equity ($m) 2,218 3,083 2,925 2,602 2,829 Return on equity attributable to members of the parent entity after tax - historical cost basis (%) 18 11 15 1 23 Total assets ($m) 4,861 5,291 4,952 4,922 5,330 Net tangible asset backing ($/share) 7.82 11.08 10.48 9.29 10.14 Net debt ($m) 617 544 487 832 582 Net debt to net debt plus equity (%) 22 15 14 24 17
(ii)(i)
66
Important Notice
2011 2012 .