Embed Size (px)
Citation preview
AS S O C I A T I O N O F B A Y AR E A GO V E R N M E N T S Representing City and County Governments of the San Francisco Bay Area
C A L L A N D N O T I C E
CALL AND NOTICE OF A SPECIAL MEETING OF THE GENERAL ASSEMBLY OF THE ASSOCIATION OF BAY AREA GOVERNMENTS
As President of the General Assembly of the Association of Bay Area Governments (ABAG), I am calling a special meeting of the ABAG General Assembly Business Meeting as follows:
Special Meeting
Monday, June 5, 2017, 1:00 p.m. to 2:00 p.m.
Location:
Bay Area Metro Center Yerba Buena Conference Room 375 Beale Street San Francisco, California
The ABAG General Assembly may act on any item on this agenda.
Agenda and attachments available at www.abag.ca.gov
For information, contact Fred Castro, Clerk of the Board, at (415) 820 7913.
1. CALL TO ORDER AND PLEDGE OF ALLEGIANCE
2. CONFIRMATION OF QUORUM
INFORMATION
3. PUBLIC COMMENT
INFORMATION
4. PRESIDENT’S REPORT
INFORMATION
5. ACTING EXECUTIVE DIRECTOR’S REPORT
INFORMATION
6. APPROVAL OF GENERAL ASSEMBLY SUMMARY MINUTES OF MEETING ON APIRL 21, 2016, AND SUMMARY MINUTES OF MEETING ON MAY 19, 2016
ACTION
Call and Notice

ABAG General Assembly June 5, 2017 2 7. ADOPTION OF PROPOSED ANNUAL BUDGET AND WORK PROGRAM FOR FISCAL
YEAR 2017-2018, INCLUDING MEMBER DUES
ACTION
8. ANNOUNCEMENTS
INFORMATION
9. ADJOURNMENT
Submitted:
/s/ Julie Pierce ABAG President Councilmember, City of Clayton
Date Submitted: April 27, 2017
Date Posted: April 28, 2017
Call and Notice

AS S O C I A T I O N O F B A Y AR E A GO V E R N M E N T S Representing City and County Governments of the San Francisco Bay Area
A G E N D A
REVISED
ABAG GENERAL ASSEMBLY BUSINESS MEETING
Special Meeting
Monday, June 5, 2017, 1:00 p.m. to 2:00 p.m.
Location:
Bay Area Metro Center Yerba Buena Conference Room 375 Beale Street San Francisco, California
The ABAG General Assembly may act on any item on this agenda.
Agenda and attachments available at www.abag.ca.gov
For information, contact Fred Castro, Clerk of the Board, at (415) 820 7913.
1. CALL TO ORDER AND PLEDGE OF ALLEGIANCE
2. CONFIRMATION OF QUORUM
INFORMATION
3. PUBLIC COMMENT
INFORMATION
4. PRESIDENT’S REPORT
INFORMATION
5. ACTING EXECUTIVE DIRECTOR’S REPORT
INFORMATION
6. APPROVAL OF GENERAL ASSEMBLY SUMMARY MINUTES OF MEETING ON APIRL 21, 2016, AND SUMMARY MINUTES OF MEETING ON MAY 19, 2016
ACTION
Attachments: Summary Minutes of April 21, 2016; Summary Minutes of May 19, 2016
Agenda

ABAG General Assembly June 5, 2017 2 7. ADOPTION OF PROPOSED ANNUAL BUDGET AND WORK PROGRAM FOR FISCAL
YEAR 2017-2018, INCLUDING MEMBER DUES
ACTION
Attachments: Proposed Annual Budget and Work Program 2017-2018; Work Plan Communications; Work Plan Planning
Additional Attachments: Memo Financial Considerations; Memo Audited Financial Reports; Basic Financial Statement; Memorandum Internal Control Required Communications; Single Audit Report; Memo Financial Reports March 2017; Indices Financial Reports March 2017; Consultant Expenses by Program; FTEs by Program; Memo Regional Planning Committee
8. ANNOUNCEMENTS
INFORMATION
9. ADJOURNMENT
Submitted:
/s/ Brad Paul, Acting Secretary-Treasurer
Date Submitted: April 27, 2017
Date Posted: May 23, 2017
Agenda

SUMMARY MINUTES (DRAFT) ABAG General Assembly Business Meeting
April 21, 2016 Oakland Museum of California
James Moore Theater 1000 Oak Street
Oakland, California
1. CALL TO ORDER AND PLEDGE OF ALLEGIANCE
The ABAG General Assembly Business Meeting was called to order by President Julie Pierce, Councilmember, City of Clayton, at about 12:14 p.m.
2. CONFIRMATION OF QUORUM
Fred Castro, Clerk of the Board, conducted roll call. County delegates present were eight (8). City/Town delegates present were sixty (58).
Kenneth Moy, Legal Counsel, and Fred Castro, Clerk of the Board, reported that quorum was present.
County Delegates and Alternates Present
Scott Haggerty, Supervisor, County of Alameda Karen Mitchoff, Supervisor, County of Contra Costa Damon Connolly, Supervisor, County of Marin Mark Luce, Supervisor, County of Napa Eric Mar, Supervisor, City and County of San Francisco Dave Cortese, Supervisor, County of Santa Clara Erin Hannigan, Supervisor, County of Solano David Rabbitt, Supervisor, County of Sonoma
County Delegates Absent
Warren Slocum, Supervisor, County of San Mateo
City/Town Delegates and Alternates Present
County of Alameda
Marilyn Ezzy Ashcraft, Councilmember, City of Alameda Peter Maas, Councilmember, City of Albany Lori Droste, Councilmember, District 8, City of Berkeley Don Biddle, Councilmember, City of Dublin Scott Donahue, Vice Mayor, City of Emeryville Francisco Zermeno, Councilmember, City of Hayward Lynette Gibson-McElhaney, Councilmember, District 3, City of Oakland Paul Benoit, City Administrator, City of Piedmont Deborah Cox, Councilmember, District 1, City of San Leandro Emily Duncan, Councilmember, City of Union City
County of Contra Costa
Wade Harper, Mayor, City of Antioch Julie Pierce, Councilmember, City of Clayton
Item 6, Summary Minutes 20160421

SUMMARY MINUTES (DRAFT)
ABAG General Assembly Business Meeting April 21, 2016
Oakland Museum of California James Moore Theater
1000 Oak Street Oakland, California
Page 2
2
Timothy Grayson, Councilmember, City of Concord Gabriel Quinto, Councilmember, City of El Cerrito Eve Phillips, Vice Mayor, City of Orinda Maureen Toms, Councilmember, City of Pinole Ben Johnson, Mayor, City of Pittsburg Thomas K. Butt, Mayor, City of Richmond Rich Kinney, Mayor, City of San Pablo Dave Hudson, Councilmember, City of San Ramon Rich Carlston, Councilmember, City of Walnut Creek Newell Arnerich, Councilmember, Town of Danville Phil Arth, Councilmember, Town of Moraga
County of Marin
Marty Winter, Councilmember, City of Belvedere Jessica Sloan, Vice Mayor, City of Mill Valley Pam Drew, Councilmember, City of Novato Raymond A. Withy, Councilmember, City of Sausalito Renee Goddard, Mayor, Town of Fairfax Joe Chinn, Town Manager, Town of Ross Matt Brown, Councilmember, Town of San Anselmo
County of Napa
Leon Garcia, Mayor, City of American Canyon Chris Canning, Mayor, City of Calistoga Jill Techel, Mayor, City of Napa Paul Dohring, Councilmember, City of St. Helena
City and County of San Francisco
County of San Mateo
Elizabeth Lewis, Mayor, Town of Atherton Greg Scoles, City Manager, City of Belmont Cliff Lentz, Mayor, City of Brisbane Carlos Romero, Councilmember, City of East Palo Alto Kirsten Keith, Mayor Pro Tem, City of Menlo Park Gina Papan, Councilmember, City of Millbrae Sue Digre, Councilmember, City of Pacifica Jeffrey Gee, Councilmember, City of Redwood City Mark Olbert, Councilmember, City of San Carlos Rick Bonilla, Councilmember, City of San Mateo Pradeep Gupta, Vice Mayor, City of South San Francisco
County of Santa Clara
Jean Mordo, Councilmember, City of Los Altos
Item 6, Summary Minutes 20160421

SUMMARY MINUTES (DRAFT)
ABAG General Assembly Business Meeting April 21, 2016
Oakland Museum of California James Moore Theater
1000 Oak Street Oakland, California
Page 3
3
Marcia Jensen, Councilmember, Town of Los Gatos Patricia Showalter, Mayor, City of Mountain View Cory Walbach, Councilmember, City of Palo Alto
County of Solano
Mark Hughes, Vice Mayor, City of Benicia Steven Bird, Councilmember, City of Dixon David Hampton, Councilmember, City of Rio Vista Curtis Hunt, Councilmember, City of Vacaville Katy Miessner, Councilmember, City of Vallejo
County of Sonoma
Susan Harvey, Councilmember, City of Cotati Jake Mackenzie, Vice Mayor, City of Rohnert Park Julie Combs, Councilmember, City of Santa Rosa Mark Millan, Mayor, Town of Windsor
City/Town Delegates Absent
County of Alameda
Fred Diaz, City Manager, City of Fremont John Marchand, Mayor, City of Livermore Mike Bucci, Councilmember, City of Newark Arne Olson, Councilmember, City of Pleasanton
County of Contra Costa
Robert (Bob) Taylor, Mayor, City of Brentwood Bill Kelly, Councilmember, City of Hercules Brandt Andersson, Councilmember, City of Lafayette Mark Ross, Councilmember, City of Martinez Sue Higgins, Vice Mayor, City of Oakley Michael Harris, Vice Mayor, City of Pleasant Hill
County of Marin
Catherine Way, Mayor, City of Larkspur Maribeth Bushey, Councilmember, City of San Rafael Jim Fraser, Vice Mayor, Town of Tiburon
County of Napa
Richard Hall, Vice Mayor, Town of Yountville
City and County of San Francisco
Nicole Wheaton, Director of Legislative and Govt Affairs, City and County of San Francisco
Item 6, Summary Minutes 20160421

SUMMARY MINUTES (DRAFT)
ABAG General Assembly Business Meeting April 21, 2016
Oakland Museum of California James Moore Theater
1000 Oak Street Oakland, California
Page 4
4
County of San Mateo
Michael Brownrigg, Councilmember, City of Burlingame Joanne F. del Rosario, Mayor, Town of Colma David J. Canepa, Vice Mayor, City of Daly City Herb Perez, Mayor, City of Foster City Debbie Ruddock, Vice Mayor, City of Half Moon Bay Alvin L. Royse, Councilmember, Town of Hillsborough Maryann Moi Darwin, Councilmember, Town of Portola Valley Jim Ruane, Mayor, City of San Bruno Deborah C. Gordon, Mayor, Town of Woodside
County of Santa Clara
Jeffrey R. Cristina, Councilmember, City of Campbell Darcy Paul, Councilmember, City of Cupertino Daniel Harney, Councilmember, City of Gilroy John Radford, Councilmember, Town of Los Altos Hills Garry Barbadillo, Councilmember, City of Milpitas Lon Allan, Mayor, City of Monte Sereno Gordon Siebert, Councilmember, City of Morgan Hill Ash Kalra, Councilmember, District 2, City of San Jose Teresa O'Neill, Vice Mayor, City of Santa Clara Mary-Lynne Bernald, Councilmember, City of Saratoga Jim Davis, Councilmember, City of Sunnyvale
County of Solano
Harry T. Price, Mayor, City of Fairfield Michael A. Segala, Councilmember, City of Suisun City
County of Sonoma
Augustine “Gus” Wolter, Vice Mayor, City of Cloverdale Brigette Mansell, Councilmember, City of Healdsburg David Glass, Mayor, City of Petaluma Patrick Slayter, Councilmember, City of Sebastopol Gary Edwards, Councilmember, City of Sonoma
3. PUBLIC COMMENT
The following individuals gave public comment: Pat Eklund, Councilmember, City of Novato; Scott Haggerty, Supervisor, County of Alameda; Kirsten Keith, Mayor Pro Tem, City of Menlo Park; Pam Drew, Councilmember, City of Novato.
4. APPROVAL OF GENERAL ASSEMBLY BUSINESS MEETING SUMMARY MINUTES OF MAY 14, 2015
Item 6, Summary Minutes 20160421

SUMMARY MINUTES (DRAFT)
ABAG General Assembly Business Meeting April 21, 2016
Oakland Museum of California James Moore Theater
1000 Oak Street Oakland, California
Page 5
5
President Pierce recognized a county motion by Scott Haggerty, Supervisor, County of Alameda, and a second by Karen Mitchoff, Supervisor, County of Contra Costa, to approve the minutes of the General Assembly Business Meeting of May 14, 2015.
The aye votes were: 8
Scott Haggerty, Supervisor, County of Alameda Karen Mitchoff, Supervisor, County of Contra Costa Damon Connolly, Supervisor, County of Marin Mark Luce, Supervisor, County of Napa Eric Mar, Supervisor, City and County of San Francisco Dave Cortese, Supervisor, County of Santa Clara Erin Hannigan, Supervisor, County of Solano David Rabbitt, Supervisor, County of Sonoma
Then nay votes were: 0
Abstentions were: 0
Absences were: 1
Warren Slocum, Supervisor, County of San Mateo
The County motion passed.
President Pierce recognized a city motion by Rick Bonilla, Councilmember, City of San Mateo, and a second by Pradeep Gupta, Vice Mayor, City of South San Francisco, to approve the minutes of the General Assembly Business Meeting of May 14, 2015.
The aye votes were: 58
County of Alameda
Marilyn Ezzy Ashcraft, Councilmember, City of Alameda Peter Maas, Councilmember, City of Albany Lori Droste, Councilmember, District 8, City of Berkeley Don Biddle, Councilmember, City of Dublin Scott Donahue, Vice Mayor, City of Emeryville Francisco Zermeno, Councilmember, City of Hayward Lynette Gibson-McElhaney, Councilmember, District 3, City of Oakland Paul Benoit, City Administrator, City of Piedmont Deborah Cox, Councilmember, District 1, City of San Leandro Emily Duncan, Councilmember, City of Union City
County of Contra Costa
Wade Harper, Mayor, City of Antioch Julie Pierce, Councilmember, City of Clayton Timothy Grayson, Councilmember, City of Concord Gabriel Quinto, Councilmember, City of El Cerrito
Item 6, Summary Minutes 20160421

SUMMARY MINUTES (DRAFT)
ABAG General Assembly Business Meeting April 21, 2016
Oakland Museum of California James Moore Theater
1000 Oak Street Oakland, California
Page 6
6
Eve Phillips, Vice Mayor, City of Orinda Maureen Toms, Councilmember, City of Pinole Ben Johnson, Mayor, City of Pittsburg Thomas K. Butt, Mayor, City of Richmond Rich Kinney, Mayor, City of San Pablo Dave Hudson, Councilmember, City of San Ramon Rich Carlston, Councilmember, City of Walnut Creek Newell Arnerich, Councilmember, Town of Danville Phil Arth, Councilmember, Town of Moraga
County of Marin
Mary Neilan, City Manager, City of Belvedere Jessica Sloan, Vice Mayor, City of Mill Valley Pam Drew, Councilmember, City of Novato Raymond A. Withy, Councilmember, City of Sausalito Renee Goddard, Mayor, Town of Fairfax Joe Chinn, Town Manager, Town of Ross Matt Brown, Councilmember, Town of San Anselmo
County of Napa
Leon Garcia, Mayor, City of American Canyon Chris Canning, Mayor, City of Calistoga Jill Techel, Mayor, City of Napa Paul Dohring, Councilmember, City of St. Helena
City and County of San Francisco
County of San Mateo
Elizabeth Lewis, Mayor, Town of Atherton Greg Scoles, City Manager, City of Belmont Cliff Lentz, Mayor, City of Brisbane Carlos Romero, Councilmember, City of East Palo Alto Kirsten Keith, Mayor Pro Tem, City of Menlo Park Gina Papan, Councilmember, City of Millbrae Sue Digre, Councilmember, City of Pacifica Jeffrey Gee, Councilmember, City of Redwood City Mark Olbert, Councilmember, City of San Carlos Rick Bonilla, Councilmember, City of San Mateo Pradeep Gupta, Vice Mayor, City of South San Francisco
County of Santa Clara
Jean Mordo, Councilmember, City of Los Altos Marcia Jensen, Councilmember, Town of Los Gatos Patricia Showalter, Mayor, City of Mountain View
Item 6, Summary Minutes 20160421

SUMMARY MINUTES (DRAFT)
ABAG General Assembly Business Meeting April 21, 2016
Oakland Museum of California James Moore Theater
1000 Oak Street Oakland, California
Page 7
7
Cory Walbach, Councilmember, City of Palo Alto
County of Solano
Mark Hughes, Vice Mayor, City of Benicia Steven Bird, Councilmember, City of Dixon David Hampton, Councilmember, City of Rio Vista Curtis Hunt, Councilmember, City of Vacaville Katy Miessner, Councilmember, City of Vallejo
County of Sonoma
Susan Harvey, Councilmember, City of Cotati Jake Mackenzie, Vice Mayor, City of Rohnert Park Julie Combs, Councilmember, City of Santa Rosa Mark Millan, Mayor, Town of Windsor
Then nay votes were: 0
Abstentions were: 0
Absences were: 42
County of Alameda
Fred Diaz, City Manager, City of Fremont John Marchand, Mayor, City of Livermore Mike Bucci, Councilmember, City of Newark Arne Olson, Councilmember, City of Pleasanton
County of Contra Costa
Robert (Bob) Taylor, Mayor, City of Brentwood Bill Kelly, Councilmember, City of Hercules Brandt Andersson, Councilmember, City of Lafayette Mark Ross, Councilmember, City of Martinez Sue Higgins, Vice Mayor, City of Oakley Michael Harris, Vice Mayor, City of Pleasant Hill
County of Marin
Catherine Way, Mayor, City of Larkspur Maribeth Bushey, Councilmember, City of San Rafael Jim Fraser, Vice Mayor, Town of Tiburon
County of Napa
Richard Hall, Vice Mayor, Town of Yountville
City and County of San Francisco
Item 6, Summary Minutes 20160421

SUMMARY MINUTES (DRAFT)
ABAG General Assembly Business Meeting April 21, 2016
Oakland Museum of California James Moore Theater
1000 Oak Street Oakland, California
Page 8
8
Nicole Wheaton, Director of Legislative and Govt Affairs, City and County of San Francisco
County of San Mateo
Michael Brownrigg, Councilmember, City of Burlingame Joanne F. del Rosario, Mayor, Town of Colma David J. Canepa, Vice Mayor, City of Daly City Herb Perez, Mayor, City of Foster City Debbie Ruddock, Vice Mayor, City of Half Moon Bay Alvin L. Royse, Councilmember, Town of Hillsborough Maryann Moi Darwin, Councilmember, Town of Portola Valley Jim Ruane, Mayor, City of San Bruno Deborah C. Gordon, Mayor, Town of Woodside
County of Santa Clara
Jeffrey R. Cristina, Councilmember, City of Campbell Darcy Paul, Councilmember, City of Cupertino Daniel Harney, Councilmember, City of Gilroy John Radford, Councilmember, Town of Los Altos Hills Garry Barbadillo, Councilmember, City of Milpitas Lon Allan, Mayor, City of Monte Sereno Gordon Siebert, Councilmember, City of Morgan Hill Ash Kalra, Councilmember, District 2, City of San Jose Teresa O'Neill, Vice Mayor, City of Santa Clara Mary-Lynne Bernald, Councilmember, City of Saratoga Jim Davis, Councilmember, City of Sunnyvale
County of Solano
Harry T. Price, Mayor, City of Fairfield Michael A. Segala, Councilmember, City of Suisun City
County of Sonoma
Augustine “Gus” Wolter, Vice Mayor, City of Cloverdale Brigette Mansell, Councilmember, City of Healdsburg David Glass, Mayor, City of Petaluma Patrick Slayter, Councilmember, City of Sebastopol Gary Edwards, Councilmember, City of Sonoma
The City/Town motion passed.
5. PRESIDENT’S REPORT
President Pierce reported on the Executive Board as the Council of Governments for the region.
Item 6, Summary Minutes 20160421

SUMMARY MINUTES (DRAFT)
ABAG General Assembly Business Meeting April 21, 2016
Oakland Museum of California James Moore Theater
1000 Oak Street Oakland, California
Page 9
9
6. ADOPTION OF PROPOSED ANNUAL BUDGET AND WORK PLAN FOR FISCAL YEAR 2016-2017, INCLUDING MEMBER DUES
President Pierce recognized Executive Director Ezra Rapport who presented a summary of the Annual Budget and Work Program for fiscal year 2016-2017, including programs and services, and annual member dues, which was reviewed by the Finance and Personnel Committee and forwarded by the Executive Board to the General Assembly for approval.
Rapport reported on the San Francisco Estuary Partnership, the BayREN Program, the membership dues increase based on population increase and cost of living adjustment. He commented on the Metropolitan Transportation Commissions Resolution 4210 and ABAG Resolution No. 12-15.
Members discussed ABAG’s financial situation and response to MTC’s Resolution 4210; distribution and posting of meeting notice and agenda; the report of Management Partners; state revenues.
President Pierce recognized a county motion by David Rabbitt, Supervisor, County of Sonoma, and a second my Mark Luce, Supervisor, County of Napa, to approve the Annual Budget and Work Program for fiscal year 2016-2017, including annual member dues.
The aye votes were: 8
Scott Haggerty, Supervisor, County of Alameda Karen Mitchoff, Supervisor, County of Contra Costa Damon Connolly, Supervisor, County of Marin Mark Luce, Supervisor, County of Napa Eric Mar, Supervisor, City and County of San Francisco Dave Cortese, Supervisor, County of Santa Clara Erin Hannigan, Supervisor, County of Solano David Rabbitt, Supervisor, County of Sonoma
Then nay votes were: 0
Abstentions were: 0
Absences were: 1
Warren Slocum, Supervisor, County of San Mateo
The County motion passed.
President Pierce recognized a city motion by Ben Johnson, Mayor, City of Pittsburg, and a second by Mark Hughes, Vice Mayor, City of Benicia, to approve the Annual Budget and Work Program for fiscal year 2016-2017, including annual member dues.
The aye votes were: 56
County of Alameda
Marilyn Ezzy Ashcraft, Councilmember, City of Alameda
Item 6, Summary Minutes 20160421
SUMMARY MINUTES (DRAFT)
ABAG General Assembly Business Meeting April 21, 2016
Oakland Museum of California James Moore Theater
1000 Oak Street Oakland, California
Page 10
10
Peter Maas, Councilmember, City of Albany Lori Droste, Councilmember, District 8, City of Berkeley Don Biddle, Councilmember, City of Dublin Scott Donahue, Vice Mayor, City of Emeryville Francisco Zermeno, Councilmember, City of Hayward Lynette Gibson-McElhaney, Councilmember, District 3, City of Oakland Paul Benoit, City Administrator, City of Piedmont Deborah Cox, Councilmember, District 1, City of San Leandro Emily Duncan, Councilmember, City of Union City
County of Contra Costa
Wade Harper, Mayor, City of Antioch Julie Pierce, Councilmember, City of Clayton Timothy Grayson, Councilmember, City of Concord Gabriel Quinto, Councilmember, City of El Cerrito Maureen Toms, Councilmember, City of Pinole Ben Johnson, Mayor, City of Pittsburg Thomas K. Butt, Mayor, City of Richmond Dave Hudson, Councilmember, City of San Ramon Rich Carlston, Councilmember, City of Walnut Creek Newell Arnerich, Councilmember, Town of Danville Phil Arth, Councilmember, Town of Moraga
County of Marin
Mary Neilan, City Manager, City of Belvedere Jessica Sloan, Vice Mayor, City of Mill Valley Pam Drew, Councilmember, City of Novato Raymond A. Withy, Councilmember, City of Sausalito Renee Goddard, Mayor, Town of Fairfax Joe Chinn, Town Manager, Town of Ross Matt Brown, Councilmember, Town of San Anselmo
County of Napa
Leon Garcia, Mayor, City of American Canyon Chris Canning, Mayor, City of Calistoga Jill Techel, Mayor, City of Napa Paul Dohring, Councilmember, City of St. Helena
City and County of San Francisco
County of San Mateo
Elizabeth Lewis, Mayor, Town of Atherton Greg Scoles, City Manager, City of Belmont Cliff Lentz, Mayor, City of Brisbane
Item 6, Summary Minutes 20160421

SUMMARY MINUTES (DRAFT)
ABAG General Assembly Business Meeting April 21, 2016
Oakland Museum of California James Moore Theater
1000 Oak Street Oakland, California
Page 11
11
Carlos Romero, Councilmember, City of East Palo Alto Kirsten Keith, Mayor Pro Tem, City of Menlo Park Gina Papan, Councilmember, City of Millbrae Sue Digre, Councilmember, City of Pacifica Jeffrey Gee, Councilmember, City of Redwood City Mark Olbert, Councilmember, City of San Carlos Rick Bonilla, Councilmember, City of San Mateo Pradeep Gupta, Vice Mayor, City of South San Francisco
County of Santa Clara
Jean Mordo, Councilmember, City of Los Altos Marcia Jensen, Councilmember, Town of Los Gatos Patricia Showalter, Mayor, City of Mountain View Cory Walbach, Councilmember, City of Palo Alto
County of Solano
Mark Hughes, Vice Mayor, City of Benicia Steven Bird, Councilmember, City of Dixon David Hampton, Councilmember, City of Rio Vista Curtis Hunt, Councilmember, City of Vacaville Katy Miessner, Councilmember, City of Vallejo
County of Sonoma
Susan Harvey, Councilmember, City of Cotati Jake Mackenzie, Vice Mayor, City of Rohnert Park Julie Combs, Councilmember, City of Santa Rosa Mark Millan, Mayor, Town of Windsor
Then nay votes were: 2
Eve Phillips, Vice Mayor, City of Orinda Rich Kinney, Mayor, City of San Pablo
Abstentions were: 0
Absences were: 42
County of Alameda
Fred Diaz, City Manager, City of Fremont John Marchand, Mayor, City of Livermore Mike Bucci, Councilmember, City of Newark Arne Olson, Councilmember, City of Pleasanton
County of Contra Costa
Robert (Bob) Taylor, Mayor, City of Brentwood Bill Kelly, Councilmember, City of Hercules
Item 6, Summary Minutes 20160421

SUMMARY MINUTES (DRAFT)
ABAG General Assembly Business Meeting April 21, 2016
Oakland Museum of California James Moore Theater
1000 Oak Street Oakland, California
Page 12
12
Brandt Andersson, Councilmember, City of Lafayette Mark Ross, Councilmember, City of Martinez Sue Higgins, Vice Mayor, City of Oakley Michael Harris, Vice Mayor, City of Pleasant Hill
County of Marin
Catherine Way, Mayor, City of Larkspur Maribeth Bushey, Councilmember, City of San Rafael Jim Fraser, Vice Mayor, Town of Tiburon
County of Napa
Richard Hall, Vice Mayor, Town of Yountville
City and County of San Francisco
Nicole Wheaton, Director of Legislative and Govt Affairs, City and County of San Francisco
County of San Mateo
Michael Brownrigg, Councilmember, City of Burlingame Joanne F. del Rosario, Mayor, Town of Colma David J. Canepa, Vice Mayor, City of Daly City Herb Perez, Mayor, City of Foster City Debbie Ruddock, Vice Mayor, City of Half Moon Bay Alvin L. Royse, Councilmember, Town of Hillsborough Maryann Moi Darwin, Councilmember, Town of Portola Valley Jim Ruane, Mayor, City of San Bruno Deborah C. Gordon, Mayor, Town of Woodside
County of Santa Clara
Jeffrey R. Cristina, Councilmember, City of Campbell Darcy Paul, Councilmember, City of Cupertino Daniel Harney, Councilmember, City of Gilroy John Radford, Councilmember, Town of Los Altos Hills Garry Barbadillo, Councilmember, City of Milpitas Lon Allan, Mayor, City of Monte Sereno Gordon Siebert, Councilmember, City of Morgan Hill Ash Kalra, Councilmember, District 2, City of San Jose Teresa O'Neill, Vice Mayor, City of Santa Clara Mary-Lynne Bernald, Councilmember, City of Saratoga Jim Davis, Councilmember, City of Sunnyvale
County of Solano
Harry T. Price, Mayor, City of Fairfield
Item 6, Summary Minutes 20160421

SUMMARY MINUTES (DRAFT)
ABAG General Assembly Business Meeting April 21, 2016
Oakland Museum of California James Moore Theater
1000 Oak Street Oakland, California
Page 13
13
Michael A. Segala, Councilmember, City of Suisun City
County of Sonoma
Augustine “Gus” Wolter, Vice Mayor, City of Cloverdale Brigette Mansell, Councilmember, City of Healdsburg David Glass, Mayor, City of Petaluma Patrick Slayter, Councilmember, City of Sebastopol Gary Edwards, Councilmember, City of Sonoma
The City/Town motion passed.
7. ADOPTION OF PROPOSED AMENDMENT TO ABAG BYLAWS
No action was taken on this item due to the time of day.
8. ANNOUNCEMENTS
There were no announcements.
9. ADJOURNMENT
Meeting adjourned at about 12:51 p.m.
Submitted:
/s/ Brad Paul, Acting Secretary-Treasurer
Date Submitted: April 26, 2017
Date Approved:
Item 6, Summary Minutes 20160421

Blank Page

SUMMARY MINUTES (DRAFT) ABAG General Assembly Business Meeting
May 19, 2016 ABAG, 101 8th Street
Oakland, California
1. CALL TO ORDER AND PLEDGE OF ALLEGIANCE
The meeting was called to order by President Julie Pierce, Councilmember, City of Clayton, at about 12:20 p.m.
2. CONFIRMATION OF QUORUM
Fred Castro, Clerk of the Board, conducted roll call. County delegates present were six (6). City/Town delegates present were fifty-eight (58).
Kenneth Moy, Legal Counsel, and Fred Castro, Clerk of the Board, reported that quorum was present.
County Delegates and Alternates Present
Scott Haggerty, Supervisor, County of Alameda Karen Mitchoff, Supervisor, County of Contra Costa Katie Rice, Supervisor, County of Marin Mark Luce, Supervisor, County of Napa Eric Mar, Supervisor, City and County of San Francisco David Rabbitt, Supervisor, County of Sonoma
County Delegates Absent
Dave Cortese, Supervisor, County of Santa Clara Linda J. Seifert, Supervisor, County of Solano Warren Slocum, Supervisor, County of San Mateo
City/Town Delegates and Alternates Present
County of Alameda
Marilyn Ezzy Ashcraft, Councilmember, City of Alameda Peter Maass, Mayor, City of Albany Lori Droste, Councilmember, City of Berkeley Don Biddle, Councilmember, City of Dublin Scott Donahue, Vice Mayor, City of Emeryville Vinnie Bacon, Councilmember, City of Fremont Barbara Halliday, Mayor, City of Hayward John Marchand, Mayor, City of Livermore Annie Campbell Washington, Councilmember, City of Oakland Deborah Cox, Councilmember, City of San Leandro Carol Dutra Vernaci, Councilmember, City of Union City
County of Contra Costa
Julie Pierce, Councilmember, City of Clayton Timothy Grayson, Councilmember, City of Concord Gabriel Quinto, Councilmember, City of El Cerrito
Item 6, Summary Minutes 20160519

SUMMARY MINUTES (DRAFT)
ABAG General Assembly May 19, 2016
ABAG, 101 8th Street Oakland, California
Page 2
2
Bill Kelly, Councilmember, City of Hercules Brandt Andersson, Mayor, City of Lafayette Eve Phillips, Mayor, City of Orinda Maureen Toms, Mayor, City of Pinole Ben Johnson, Vice Mayor, City of Pittsburg Sue Noack, Councilmember, City of Pleasant Hill Tom Butt, Mayor, City of Richmond Rich Kinney, Councilmember, City of San Pablo Rich Carlston, Councilmember, City of Walnut Creek
County of Marin
Catherine Way, Mayor, City of Larkspur Jessica Sloan, Councilmember, City of Mill Valley Pam Drew, Councilmember, City of Novato Matt Brown, Mayor, Town of San Anselmo Ray Withy, Councilmember, City of Sausalito Renee Goddard, Mayor, Town of Fairfax Elizabeth Brekhus, Councilmember, Town of Ross
County of Napa
Leon Garcia, Mayor, City of American Canyon Paul Dohring, Mayor, City of St. Helena John Dunbar, Councilmember, Town of Yountville
County of San Mateo
Elizabeth Lewis, Councilmember, Town of Atherton Greg Scoles, Councilmember, City of Belmont Lori Liu, Councilmember, City of Brisbane Michael Brownrigg, Mayor, City of Burlingame Sean Rabe, City Manager, Town of Colma Carlos Romero, Councilmember, City of East Palo Alto Catherine Mahanpour, Councilmember, City of Foster City Gina Papan, Councilmember, City of Millbrae John Keener, Councilmember, City of Pacifica Mark Olbert, Mayor, City of San Carlos Rick Bonilla, Councilmember, City of San Mateo Pradeep Gupta, Vice Mayor, City of South San Francisco Craig Hughes, Councilmember, Town of Portola Valley
County of Santa Clara
Savit Vaidhyanathan, Councilmember, City of Cupertino Gordon Seibert, Mayor, City of Morgan Hill Greg Scharff, Councilmember, City of Palo Alto Teresa O’Neill, Mayor, City of Santa Clara Mary Lynne Bernald, Councilmember, City of Saratoga
Item 6, Summary Minutes 20160519

SUMMARY MINUTES (DRAFT)
ABAG General Assembly May 19, 2016
ABAG, 101 8th Street Oakland, California
Page 3
3
Jim Davis, Councilmember, City of Sunnyvale Rob Rennie, Councilmember, Town of Los Gatos
County of Solano
Elizabeth Patterson, Mayor, City of Benicia Steve Bird, Councilmember, City of Dixon Curtis Hunt, Councilmember, City of Vacaville
County of Sonoma
David Glass, Mayor, City of Petaluma Julie Combs, Councilmember, City of Santa Rosa
City/Town Delegates Absent
County of Alameda
Mike Bucci, Councilmember, City of Newark Paul Benoit, City Administrator, City of Piedmont Arne Olson, Councilmember, City of Pleasanton
County of Contra Costa
Wade Harper, Mayor, City of Antioch Robert (Bob) Taylor, Mayor, City of Brentwood Newell Arnerich, Councilmember, Town of Danville Mark Ross, Councilmember, City of Martinez Sue Higgins, Mayor, City of Oakley Bill Clarkson, Mayor, City of San Ramon Phil Arth, Councilmember, Town of Moraga
County of Marin
Marty Winter, Councilmember, City of Belvedere Maribeth Bushey, Councilmember, City of San Rafael Jim Fraser, Vice Mayor, Town of Tiburon
County of Napa
Chris Canning, Mayor, City of Calistoga Jill Techel, Mayor, City of Napa
City and County of San Francisco
Edwin Lee, Mayor, City and County of San Francisco
County of San Mateo
David Canepa, Vice Mayor, City of Daly City Robert Kowalczyk, Mayor, City of Half Moon Bay Richard Cline, Councilmember, City of Menlo Park Shelly Masur, Councilmember, City of Redwood City Jim Ruane, Mayor, City of San Bruno
Item 6, Summary Minutes 20160519

SUMMARY MINUTES (DRAFT)
ABAG General Assembly May 19, 2016
ABAG, 101 8th Street Oakland, California
Page 4
4
Alvin Royse, Councilmember, Town of Hillsborough Deborah Gordon, Mayor, Town of Woodside
County of Santa Clara
Jeffrey R. Cristina, Councilmember, City of Campbell Daniel Harney, Councilmember, City of Gilroy Jean Mordo, Councilmember, City of Los Altos John Radford, Councilmember, Town of Los Altos Hills Jose Esteves, Mayor, City of Milpitas Craig Burton, Councilmember, City of Monte Sereno Patricia Showalter, Mayor, City of Mountain View Sam Liccardo, Mayor, City of San Jose
County of Solano
Harry T. Price, Mayor, City of Fairfield David Hampton, Councilmember, City of Rio Vista Michael Hudson, Councilmember, City of Suisun City Bob Sampayan, Councilmember, City of Vallejo
County of Sonoma
Augustine Wolter, Vice Mayor, City of Cloverdale Susan Harvey, Councilmember, City of Cotati Brigette Mansell, Councilmember, City of Healdsburg Jake Mackenzie, Councilmember, City of Rohnert Park Patrick Slayter, Mayor, City of Sebastopol Gary Edwards, Councilmember, City of Sonoma Mark Milllan, Vice Mayor, Town of Windsor
3. PUBLIC COMMENT
There was no public comment.
4. PRESIDENT’S REPORT
There was no report.
5. EXECUTIVE DIRECTOR’S REPORT
There was no report.
6. REPORT ON THE ABAG-MTC MERGER STUDY OPTIONS ANALYSIS AND RECOMMENDTION
A. Lynne Dantzker, Management Partners, reviewed and explained the Options presented in their Merger Study Options Analysis and Recommendation Report (April 2016), including the steps leading up to its release and potential next steps.
Ezra Rapport, ABAG Executive Director, reported on the ABAG-MTC Merger Study Options Analysis and Recommendation, including a summary analysis of Option 4 and
Item 6, Summary Minutes 20160519

SUMMARY MINUTES (DRAFT)
ABAG General Assembly May 19, 2016
ABAG, 101 8th Street Oakland, California
Page 5
5
Option 7; memorandum of understanding and contract for services; and pursuing a new governance model.
B. General Assembly discussed Options presented in the Management Partners merger report and any additional options/alternatives or modified option/alternative presented by any representative of the member cites/counties of the General Assembly.
Delegates discussed the Plan Bay Area statutory responsibilities; MTC transportation model, planning funding, and merger structure; merging governance bodies; Options 4 and 7, and Option 6; the binding or advisory vote of the General Assembly on the Executive Board; regional coherence, Option7 and timeline; protecting ABAG integrity; memorandum of understanding and contract for services, MTC Resolution 4210; planning staff.
The following individuals gave public comment: Gerald Cauthen, Bay Area Transportation Working Group; Matt Vander Sluis, Greenbelt Alliance; Tony Thurmond, Assemblymember; Sonja Trauss, San Francisco Bay Area Renters Federation.
Mark Luce, Supervisor, County of Napa, commented on Option 7 and the following: MTC Resolution 4210; governance and representation; financial stability; organizational structure; and governance.
Pat Eklund, Vice Mayor, City of Novato, commented on Option 4 and the following: governance, ABAG Bylaws and General Assembly policy decision; staffing; SB 375 responsibilities; discussion of options; conflict resolution, MTC Resolution 4210 and ABAG Resolution 12-15.
Vice President Rabbitt, Supervisor, County of Sonoma, chaired the meeting.
C. General Assembly voted on the options presented in the Report and on any additional option/alternative or modified option/alternative by any representative of the member cities/counties of the General Assembly.
Vice President Rabbitt recognized a city motion by Elizabeth Brekhus, Councilmember, Town of Ross, and a second by Matt Brown, Mayor, City of San Anselmo, to recommend adoption of Option 4.
President Pierce commented on the process related to Option 7, an implementation plan, full integration, protecting ABAG integrity; governance; contract of services and memorandum of understanding; staff integration funding.
Vice President Rabbitt recognized a substitute city motion by Greg Scharff, Councilmember, City of Palo Alto, and a second by Elizabeth Lewis, Councilmember, Town of Atherton, to recommend adoption of Option 7 with a solid reporting line between ABAG and the MTC Executive Director.
The following individuals gave public comment: Ken Bukowski, Regional-Video.com; Sharon McCreadie; Niall; Patricia Perry; Josephine Zuniga.
Delegates discussed Option 4 and Option 7.
Item 6, Summary Minutes 20160519

SUMMARY MINUTES (DRAFT)
ABAG General Assembly May 19, 2016
ABAG, 101 8th Street Oakland, California
Page 6
6
The following delegates commented on this item: Brandt Andersson, City of Lafayette; Elizabeth Brekhus, Town of Ross; Michael Brownrigg, City of Burlingame; Richard Carlston, City of Walnut Creek; Julie Combs, City of Santa Rosa; Jim Davis, City of Sunnyvale; Scott Donahue, City of Emeryville; Pam Drew, City of Novato; Pat Eklund, City of Novato; David Glass, City of Petaluma; Pradeep Gupta, City of South San Francisco; Scott Haggerty, County of Alameda; Barbara Halliday, City of Hayward; Ben Johnson, City of Pittsburg; Bill Kelly, City of Hercules; Mark Luce, County of Napa; Karen Mitchoff, County of Contra Costa; Carlos Romero, City of East Palo Alto; Greg Scharff, City of Palo Alto; Ray Withy, City of Sausalito.
Vice President Rabbitt recognized an amendment to the substitute city motion to approve the staff recommendation to support Option 4 and Option 7 and principles included in the staff report, with the opportunity for a solid reporting line between ABAG and the MTC Executive Director with the selection of a new Executive Director, which was accepted by the second of the substitute motion.
Delegates continued discussion on Option 4 and Option 7.
The aye votes were: 28
City/Town Delegates and Alternates Aye
County of Alameda
Marilyn Ezzy Ashcraft, Councilmember, City of Alameda Peter Maass, Mayor, City of Albany Lori Droste, Councilmember, City of Berkeley Don Biddle, Councilmember, City of Dublin John Marchand, Mayor, City of Livermore
County of Contra Costa
Julie Pierce, Councilmember, City of Clayton Timothy Grayson, Councilmember, City of Concord Sue Noack, Councilmember, City of Pleasant Hill Rich Kinney, Councilmember, City of San Pablo Rich Carlston, Councilmember, City of Walnut Creek
County of Marin
Catherine Way, Mayor, City of Larkspur
County of Napa
Leon Garcia, Mayor, City of American Canyon John Dunbar, Councilmember, Town of Yountville
County of San Mateo
Elizabeth Lewis, Councilmember, Town of Atherton Greg Scoles, Councilmember, City of Belmont Lori Liu, Councilmember, City of Brisbane Sean Rabe, City Manager, Town of Colma
Item 6, Summary Minutes 20160519
SUMMARY MINUTES (DRAFT)
ABAG General Assembly May 19, 2016
ABAG, 101 8th Street Oakland, California
Page 7
7
Carlos Romero, Councilmember, City of East Palo Alto John Keener, Councilmember, City of Pacifica Mark Olbert, Mayor, City of San Carlos Pradeep Gupta, Vice Mayor, City of South San Francisco Craig Hughes, Councilmember, Town of Portola Valley
County of Santa Clara
Savit Vaidhyanathan, Councilmember, City of Cupertino Gordon Seibert, Mayor, City of Morgan Hill Greg Scharff, Councilmember, City of Palo Alto Mary Lynne Bernald, Councilmember, City of Saratoga Rob Rennie, Councilmember, Town of Los Gatos
County of Solano
County of Sonoma
Julie Combs, Councilmember, City of Santa Rosa
The nay votes were: 23
City/Town Delegates and Alternates Nay
County of Alameda
Scott Donahue, Vice Mayor, City of Emeryville Barbara Halliday, Mayor, City of Hayward Deborah Cox, Councilmember, City of San Leandro Carol Dutra Vernaci, Councilmember, City of Union City
County of Contra Costa
Gabriel Quinto, Councilmember, City of El Cerrito Bill Kelly, Councilmember, City of Hercules Brandt Andersson, Mayor, City of Lafayette Eve Phillips, Mayor, City of Orinda Maureen Toms, Mayor, City of Pinole Tom Butt, Mayor, City of Richmond
County of Marin
Pam Drew, Councilmember, City of Novato Matt Brown, Mayor, Town of San Anselmo Ray Withy, Councilmember, City of Sausalito Renee Goddard, Mayor, Town of Fairfax Elizabeth Brekhus, Councilmember, Town of Ross
County of Napa
Paul Dohring, Mayor, City of St. Helena
County of San Mateo
Item 6, Summary Minutes 20160519

SUMMARY MINUTES (DRAFT)
ABAG General Assembly May 19, 2016
ABAG, 101 8th Street Oakland, California
Page 8
8
Michael Brownrigg, Mayor, City of Burlingame Catherine Mahanpour, Councilmember, City of Foster City Gina Papan, Councilmember, City of Millbrae Rick Bonilla, Councilmember, City of San Mateo
County of Santa Clara
Teresa O’Neill, Mayor, City of Santa Clara Jim Davis, Councilmember, City of Sunnyvale
County of Solano
Steve Bird, Councilmember, City of Dixon
County of Sonoma
Absent were: 49
City/Town Delegates Absent
County of Alameda
Vinnie Bacon, Councilmember, City of Fremont Mike Bucci, Councilmember, City of Newark Annie Campbell Washington, Councilmember, City of Oakland Paul Benoit, City Administrator, City of Piedmont Arne Olson, Councilmember, City of Pleasanton
County of Contra Costa
Wade Harper, Mayor, City of Antioch Robert (Bob) Taylor, Mayor, City of Brentwood Newell Arnerich, Councilmember, Town of Danville Mark Ross, Councilmember, City of Martinez Sue Higgins, Mayor, City of Oakley Ben Johnson, Vice Mayor, City of Pittsburg Bill Clarkson, Mayor, City of San Ramon Phil Arth, Councilmember, Town of Moraga
County of Marin
Marty Winter, Councilmember, City of Belvedere Jessica Sloan, Councilmember, City of Mill Valley Maribeth Bushey, Councilmember, City of San Rafael Jim Fraser, Vice Mayor, Town of Tiburon
County of Napa
Chris Canning, Mayor, City of Calistoga Jill Techel, Mayor, City of Napa
City and County of San Francisco
Edwin Lee, Mayor, City and County of San Francisco
Item 6, Summary Minutes 20160519

SUMMARY MINUTES (DRAFT)
ABAG General Assembly May 19, 2016
ABAG, 101 8th Street Oakland, California
Page 9
9
County of San Mateo
David Canepa, Vice Mayor, City of Daly City Robert Kowalczyk, Mayor, City of Half Moon Bay Richard Cline, Councilmember, City of Menlo Park Shelly Masur, Councilmember, City of Redwood City Jim Ruane, Mayor, City of San Bruno Alvin Royse, Councilmember, Town of Hillsborough Deborah Gordon, Mayor, Town of Woodside
County of Santa Clara
Jeffrey R. Cristina, Councilmember, City of Campbell Daniel Harney, Councilmember, City of Gilroy Jean Mordo, Councilmember, City of Los Altos John Radford, Councilmember, Town of Los Altos Hills Jose Esteves, Mayor, City of Milpitas Craig Burton, Councilmember, City of Monte Sereno Patricia Showalter, Mayor, City of Mountain View Sam Liccardo, Mayor, City of San Jose
County of Solano
Elizabeth Patterson, Mayor, City of Benicia Harry T. Price, Mayor, City of Fairfield David Hampton, Councilmember, City of Rio Vista Michael Hudson, Councilmember, City of Suisun City Curtis Hunt, Councilmember, City of Vacaville Bob Sampayan, Councilmember, City of Vallejo
County of Sonoma
Augustine Wolter, Vice Mayor, City of Cloverdale Susan Harvey, Councilmember, City of Cotati Brigette Mansell, Councilmember, City of Healdsburg David Glass, Mayor, City of Petaluma Jake Mackenzie, Councilmember, City of Rohnert Park Patrick Slayter, Mayor, City of Sebastopol Gary Edwards, Councilmember, City of Sonoma Mark Milllan, Vice Mayor, Town of Windsor
The city motion passed.
President Pierce recognized a county motion by Karen Mitchoff, Supervisor, County of Contra Costa, and a second by Eric Mar, Supervisor, City and County of San Francisco, to recommend adoption of Option 4 and Option 7 and principles included in the staff report.
The aye votes were: 4
Karen Mitchoff, Supervisor, County of Contra Costa Mark Luce, Supervisor, County of Napa
Item 6, Summary Minutes 20160519

SUMMARY MINUTES (DRAFT)
ABAG General Assembly May 19, 2016
ABAG, 101 8th Street Oakland, California
Page 10
10
Eric Mar, Supervisor, City and County of San Francisco David Rabbitt, Supervisor, County of Sonoma
Then nay votes were: 2
Scott Haggerty, Supervisor, County of Alameda Katie Rice, Supervisor, County of Marin
Abstentions were: 0
Absences were: 3
Linda Seifert, Supervisor, County of Solano Warren Slocum, Supervisor, County of San Mateo Dave Cortese, Supervisor, County of Santa Clara
The County motion passed.
Vice President Rabbitt recognized a motion by Pam Drew, Councilmember, City of Novato, and a second by Matt Brown, Mayor, Town of San Anselmo, to limit and prohibit the ABAG Executive Board from implementing Resolution 12-15 and to send a letter to the Legislature for relief for regular source of funds.
Vice President Rabbitt recognized a substitute motion by Elizabeth Brekhus, Councilmember, Town of Ross, and a second by Renee Goddard, Mayor, Town of Fairfax, to send a letter from the ABAG General Assembly to the Legislature for asking to fund and govern transportation and planning in the Council of Governments.
Quorum was not present.
7. ANNOUNCEMENTS
There were no announcements.
8. ADJOURNMENT
Meeting adjourned at about 3:33 p.m.
Submitted:
/s/ Brad Paul, Acting Secretary-Treasurer
Date Submitted: April 26, 2017
Date Approved:
Item 6, Summary Minutes 20160519

ABAGBUDGET & WORKPROGRAMPROPOSED
FISCAL YEAR 2017-18
Item 7

EXECUTIVEBOARD
MEMBERS
Candace AndersenSupervisor, County of Contra Costa
Len AugustineMayor, City of Vacaville
Annie Campbell Washington Councilmember, City of Oakland
David CanepaSupervisor, County of San Mateo
Cindy ChavezSupervisor, County of Santa Clara
Lan DiepCouncilmember, City of San Jose
Pat EklundCouncilmember, City of Novato
Leon GarciaMayor, City of American Canyon
Liz GibbonsMayor, City of Campbell
Lynette Gibson McElhaneyCouncilmember, City of Oakland
Abel J. GuillenCouncilmember, City of Oakland
Pradeep GuptaMayor, City of South San Francisco
Scott HaggertySupervisor, County of Alameda
Barbara HallidayMayor, City of Hayward
Erin HanniganSupervisor, County of Solano
Dave HudsonCouncilmember, City of San Ramon
Sergio JimenezCouncilmember, City of San Jose
Edwin LeeMayor, City and County of San Francisco
Wayne J. LeeMayor, City of Millbrae
Jake MackenzieVice Mayor, City of Rohnert Park
Nathan MileySupervisor, County of Alameda
Karen MitchoffSupervisor, County of Contra Costa
Raul PeralezCouncilmember, City of San Jose
Dave PineSupervisor, County of San Mateo
John RahaimPlanning Director, City and County of San Francisco
Belia RamosSupervisor, County of Napa
Dennis RodoniSupervisor, County of Marin
Todd RufoEconomic and Workforce Development Director, City and County of San Francisco
Greg ScharffMayor, City of Palo Alto
Trish SpencerMayor, City of Alameda
Norman YeeSupervisor, City and County of San Francisco
OFFICERS
PRESIDENT
Julie PierceCouncilmemberCity of Clayton
VICE PRESIDENT
David Rabbitt
Supervisor
County of Sonoma
IMMEDIATE PAST PRESIDENT
David D. Cortese
Supervisor
County of Santa Clara
TREASURER
Brad Paul
Acting Executive Director
SECRETARY/LEGAL COUNSEL
Kenneth Moy
Legal Counsel
ADVISORY MEMBERS
William D. KissingerBoard Member, San Francisco Bay Regional Water Quality Control Board
2 ABAG BUDGET & WORK PROGRAM
Item 7

The Association of Bay Area Governments (ABAG) fosters collaborative partnerships among local governments in planning for our shared future. Now, there is an opportunity for ABAG to provide a stronger commitment, additional staff, and an expanded financial position to carry out this important work, supporting local governments and our region.
During 2016-2017, we were and are engaged in a significant transition for ABAG. Out of the 2016 General Assembly and the 2016 Special General Assembly, a direction was charted for ABAG and the Metropolitan Transportation Commission (MTC) to conduct a staff consolidation and then to look at changes to the governing bodies for both organizations. The end result of this effort will be two separate and independent organizations with their own statutory requirements, policy positions, programs and services, assets, and debts, with a consolidated staff at MTC serving both organizations.
The staff consolidation process and continuing work activities are well underway with the February 2017 release of a draft Contract for Services between the ABAG Executive Board and MTC. The process has also included fiscal analysis of both organizations and Human Resources and organizational development consultants are providing services toward the transition. Members have been closely involved in the process with additional meetings at the ABAG Executive Board, additional outreach and a Special General Assembly in January 2017. Opportunities for members and stakeholders to get involved will continue through the rest of the fiscal year. More information about the process and activities is available on ABAG’s website and is discussed in the ABAG President’s message in this document.
ABAG, along with MTC and the Bay Area Air Quality Management District, moved into the new Bay Area Metro Center in May 2016. Plans to bring the San Francisco Estuary Partnership staff and the San Francisco Bay Conservation and Development Commission to the building are in the works.
Fiscal Year 2016-2017 saw work to update Plan Bay Area in conjunction with MTC and with the cities, towns, and counties, their local elected officials and residents, and stakeholders that make up the Bay Area. Work on Plan Bay Area 2040 is on-going with adoption of the Plan and EIR estimated in 2017. The plan and the EIR are informed by the relationships developed by ABAG’s land-use planners with local jurisdictions and on-going extensive dialogue with stakeholders.
We have been talking about our programs in a new way, as local collaboration programs. ABAG land-use planners are directly assigned on a county-wide basis, and these planning and other program staff have developed collaborative partnerships with policymakers and staff in the Bay Area’s cities, towns, and counties.
The local collaboration programs all thrive because of an interconnectedness with ABAG planning staff and connections among the programs themselves. Some of our programs: ABAG PLAN, ABAG Finance Authority, ABAG POWER, Resilience Program, BayREN, San Francisco Bay Trail, and San Francisco Bay Area Water Trail, San Francisco Estuary Partnership, and the San Francisco Bay Restoration Authority were not often discussed at the ABAG Executive Board, as they may be governed through a separate board or committee. They might not be as well-known as ABAG’s planning work, which is the foundation for the organization and the path that all these programs follow, developing and maintaining a connection with policymakers and staff in the Bay Area’s cities, towns, and counties.
Key to the future of ABAG, regional planning, and the local collaboration programs is the great work that the staff do, working with the communities of the Bay Area. The details of all of ABAG’s programs and activities are contained in this Budget and Work Program and on our website. Please contact me or staff if you have any questions. [email protected]
LETTER FROM THE EXECUTIVEDIRECTOR
BRAD PAULActing Executive Director
ABAG BUDGET & WORK PROGRAM 3
Item 7

JULIE PIERCEABAG PresidentCouncilmember, City of Clayton
DAVID RABBITTABAG Vice PresidentSupervisor, County of Sonoma
“I want to thank our ABAG staff at all levels for their continued tireless support.”
During this time of transition with staff consolidation, our responsibility is to assure that ABAG continues to provide services that support the Bay Area’s local governments, now and in the future. As work on the staff merger continues, we are committed to creating a better regional agency, one that is more efficient, stronger, and has a greater potential to provide more effective programs and services to the members that we serve and the nearly seven million people that live in the Bay Area.
During 2016-2017, the Executive Board was focused on preparing for the staff consolidation and developing the structure and the documents that govern the implementation: the contract to consolidate staff functions under one executive director (CS) and the memorandum of understanding regarding potential future new governance options (MOU). These contracts are between the ABAG Executive Board and the Metropolitan Transportation Commission and will codify how the combined staff will continue to provide services that support the Bay Area’s local governments.
Additionally, the agencies adopted an Implementation Action Plan to guide the staff consolidation. Senior staffs have been working diligently to develop the draft CS with extensive input from ABAG and MTC policy bodies. To strengthen the process, an Ad Hoc Committee of the Admistrative Committee of the Executive Board was formed to provide feedback on staff consolidation tasks. Members include both myself and Vice President Supervisor David Rabbitt, South San Francisco Mayor Pradeep Gupta (Chair of ABAG’s Regional Planning Committee), Novato Mayor Pat Eklund, Palo Alto Mayor Greg Scharff and San Jose Councilmember Raul Peralez.
Since regional land use planning and local governments are directly represented in the ABAG governance structure, we held a Special General Assembly on January 30, 2017 to provide a forum for local jurisdictions and other stakeholders to directly participate in this discussion. The upcoming General Assembly as well as the Administrative Committee and Executive Board meetings are other opportunities to work together with all of you as we study this new framework for regional governance. These meetings are identified on the ABAG website.
Much was also accomplished last year on Plan Bay Area 2040. On-going, extensive dialogue with local elected officials, local staff, and stakeholders has begun and will continue this spring as we move towards passing the update in summer 2017. There will be many opportunities for stakeholder and local government participation. We look forward to this continuing conversation as we plan together for the Bay Area of the future that our children and grandchildren will enjoy.
I want to thank our ABAG staff at all levels for their continued tireless support. During the staff consolidatation process, the Executive Board and I have committed and re-committed to protecting both current employees and ABAG retirees. Making sure that employees are made whole and maintaining retirees’ earned benefits is the right thing to do.
Staff continues to provide the exceptional high level of expertise and service that we members have come to expect, even during this transitional time. I am sure that this dedication to excellent work will continue once the staff merger is complete. This is an opportunity to enhance what the regional agencies provide for all member jurisdictions and the staff are an integral part of those services.
Working together as a region, we can do great things for the future of our Bay Area.
LETTER FROM THE PRESIDENT
4 ABAG BUDGET & WORK PROGRAM
Item 7

TABLE OF CONTENTS
ABAG BUDGET & WORK PROGRAM 5
ABOUT ABAG 6–9
PLANNING AND RESEARCH* 10–25
LOCAL COLLABORATION PROGRAMS 26–31
EXTERNAL AFFAIRS 32–35
BUDGET 36–46
CONTACT INFORMATION 47
* After integration, Planning and Research will be the Integrated Regional Planning Program
Item 7

01 ABOUT ABAG
HIGHLIGHTS • Founded in 1961 as the State’s first Council of Governments to provide a forum for local elected officials to discuss topical issues that transcend town, city, and county borders.
• Fifty-five+ years later, ABAG provides a range of regional planning activities and services from the Local Collaboration Programs to towns, cities, and counties of the San Francisco Bay Area.
• Established as a Joint Powers Authority, each member jurisdiction is directly represented in the General Assembly, the governing body.
Item 7

INTRODUCTION
As the San Francisco Bay Area’s regional Council of Governments, the Association of Bay Area Governments (ABAG) provides a range of services to its member cities, towns, and counties.
ABAG was created in 1961, to provide a forum for local elected officials to discuss topical issues, specifically around regional planning and in later years, services. ABAG was the first Council of Governments established in California.
Recognizing that community issues transcend local boundaries, ABAG now examines issues of regional and local concern addressing planning and research needs related to land use, environmental, and water resource protection; disaster resilience and energy efficiency; provides risk and claims management; and financial services to local counties, cities, and towns.
ABAG is a joint powers authority and membership is comprised of the 101 cities and towns and the nine counties of the San Francisco Bay Area. Elected officials from each serve as governance for the organization. Organizational and governance charts are included in this document on the following pages.
As described in the President’s and Executive Director’s messages, ABAG and MTC are entering into (1) a contract to consolidate staff functions under one executive director (CS) and (2) a memorandum of understanding regarding new governance options (MOU).
As of July 1, 2017, the ABAG staff is expected to merge with MTC. ABAG and MTC will remain separate governance entities with their own statutory authorities and responsibilities, policy positions, assets, liabilities, revenues, and debts; as will the Local Collaboration Programs. The consolidated staff will serve both organizations.
This document, the Budget and Work Program, contains the details of the programs and services provided in 2016-2017 and the planned activities and budget for 2017-2018. Additional information is provided at www.abag.ca.gov. If you do not find the information you need in this 2017-2018 Budget and Work Program, please contact ABAG President Julie Pierce ([email protected]) or Acting Executive Director Brad Paul ([email protected]).
ABAG BUDGET & WORK PROGRAM 7
Item 7

GOVERNANCECHART
Members
101 Towns and CIties and Nine Counties
Appointments
Bay Conservation and Development Commission
(4)
Metropolitan Transportation Commission
(1)
Bay Area CounciI Economic Institute
(13)
San Francisco Estuary Partnership
(3)
Regional Seaport Advisory Committee
(2)
San Francisco Bay Restoration Authority
(7)
General Assembly
Administrative Committee
Regional Planning Committee
Legislation and Governmental
Organization Committee
Financial and Personnel Committee
Standing Committees
Inter Agency Committees
Regional Airport Planning Committee
Bay Area Regional Collaborative
ABAG Executive Board
President Julie Pierce
8 ABAG BUDGET & WORK PROGRAM
Item 7

CONSOLIDATED ORGANIZATIONAL CHART
Office of General Counsel
Executive Staff
Metropolitan Transportation Commission
Chair Jake Mackenzie
Steve Heminger
Executive Director
Contract for Services
Memorandum of Understanding
ABAG Finance Authority
San FranciscoEstuary Partnership
Staffing for San Francisco Bay
Restoration Authority
Energy Programs
POWER
BayREN
ABAG PLAN
SHARP
Local Government Services
Brad Paul
Deputy Executive Director
Programming and Allocations
Integrated Land Use and Transportation
Planning Department
Housing
Jobs & Workforce
Resilience
Trails & Open Space
Complete Communities
Local Engagement & Research Teams
Legislation and Public Affairs
Communications
Legislative Activity
Website
Policy
Alix Bockelman
Deputy Executive Director
Administration and Facilities
CapitalDevelopment
Electronic Payments
Technology Services
IT
Operations
Andrew Fremier
Deputy Executive Director
Treasury
Budget and Revenue
Account Fiscal Management
Finance
Brian Mayhew
Chief Financial Officer
ABAG BUDGET & WORK PROGRAM 9
Item 7

02 PLANNING AND RESEARCH*
HIGHLIGHTS • Supports Bay Area’s diverse communities with regional planning services
• Long term relationships created at the regional and at the local level with elected officials and staff of towns, cities, and counties
THETEAMS
• Research and Local Engagement provides substantial knowledge and innovation
• Local collaboration is an essential dimension of the planning and research programs
• Research Team provides the analytic tools and data to support Bay Area regional and local planning
* After integration, Planning and Research Department will be the Integrated Regional Planning Program (Integrated Planning Program). In discussion of activities in fiscal year 2016-2017, the Planning Program will be referred to as ABAG Planning and Research.
PROGRAM OVERVIEW
Five interconnected programs supported by local engagement and research teams
THE PROGRAMS
Housing, Jobs and Workforce, Complete Communities, Resilience, and Open Space and Trails offer much for local governments
Item 7

INTRODUCTION
As the San Francisco Bay Area’s Council of Governments, ABAG has focused on creating a collaborative regional land use planning process that supports our valuable assets: local and cultural diversity, technological innovation, and natural resources. Building upon this collaborative platform, the 2017-18 work program integrates MTC’s staff and resources to serve the needs of the Bay Area’s diverse communities. Transportation expertise and funding can strengthen the work of ABAG’s Council of Governments on housing, infrastructure and land use. Planning and Research programs will continue to support the preservation of our open space and the vitality of our diverse economy. Recognizing these resources, today, concerted efforts will be essential to address our substantial housing challenges and help carry out the Plan Bay Area 2040 Implementation Action Plan. While the Bay Area has experienced substantial and successful job growth for more than seven years, the majority of our workers have experienced lower wages along with limited and unaffordable housing, which in turn is triggering substantial congestion and longer commutes. These challenges are compounded by the aging of infrastructure, climate change, and the probability of a major earthquake. Housing our population requires a comprehensive local and regional approach on complete communities, where new residential buildings provide adequate affordability and are supported by access to transit, food, schools, services, and open space.
Based on an understanding of these assets and challenges, the work program for the ABAG Planning and Research Department has been organized into five comprehensive and interconnected programs and two teams that provide an institutional platform of knowledge and innovation to serve the Bay Area’s towns, cities, and counties. After July 1, 2017, this work will continue via the Integrated Regional Planning Program (Integrated Planning Program). Today, our five programs include: Housing, Jobs and Workforce, Complete Communities, Resilience, and Open Space and Trails. In order for staff to be responsive to the needs of cities and provide substantial knowledge and innovation, these five programs have been shaped by two major cross-cutting teams: Local Engagement and Research. Local Engagement provides specific input on local priorities such as housing investment needs, support for middle-wage jobs, technical assistance on soft-story buildings, completion of trails, design of public space, or earthquake resilience. The programs are also well informed with a solid data foundation on economic, demographic, and land use trends as well as state of the art analytical tools.
Housing1. Regional Housing Needs Allocation (RHNA)*2. Plan Bay Area land use pattern*
3. Best practies, & funding strategies4. Housing needs and production analysis
Jobs & Workforce1. Regional growth forecast*2. Regional Economic Development District
3. Priority Production Areas
Resilience1. Natural disaster preparation and recovery2. Safe housing & communities
3. Resilient regional infrastructure and water
Trails & Open Space1. Bay Trail & Water Trail*2. Plan Bay Area open space*
3. Priority Conservation Areas (PCAs)4. SF Bay Restoration Authority*
Complete Communities1. Priority Development Areas (PDAs)2. Placemaking
3. Planning grants & local technical support4. Corridors & Centers
Local Engagement
Res
earc
h
* ABAG legal mandate Other planning services created through Executive Board Action
ABAG BUDGET & WORK PROGRAM 11
Item 7
INTRODUCTION
02S E C T I O N
P L A N N I N G A N DR E S E A R C H
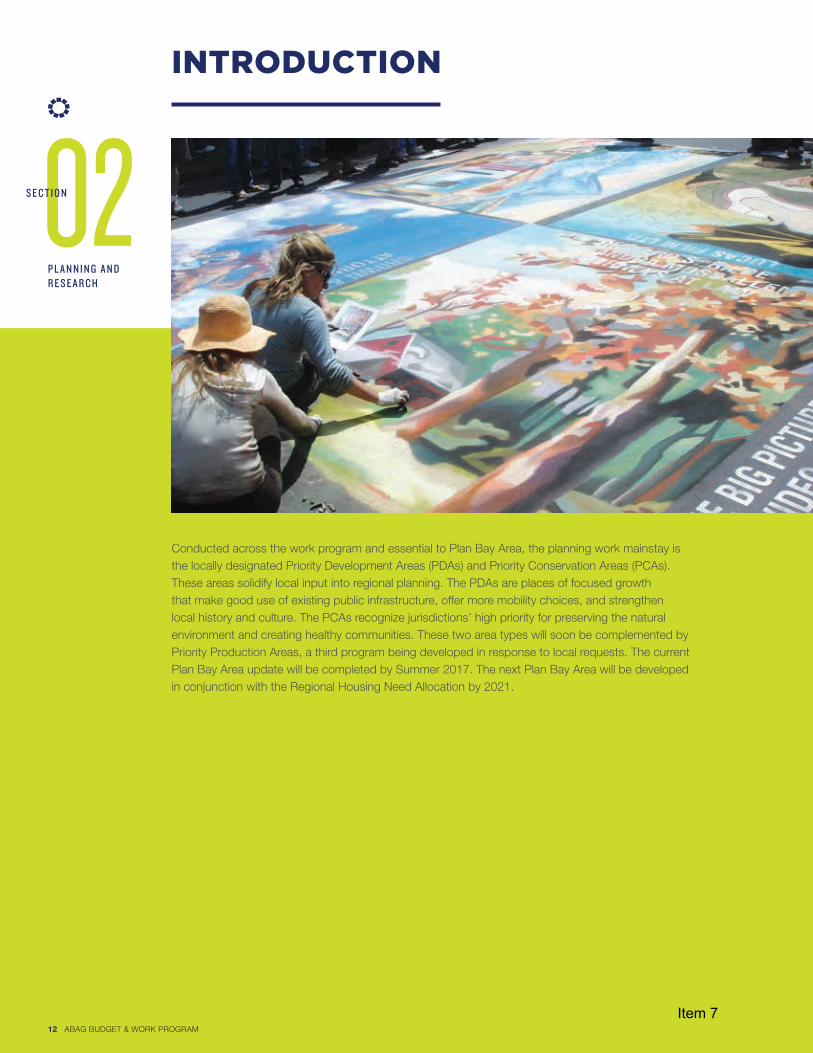
Conducted across the work program and essential to Plan Bay Area, the planning work mainstay is the locally designated Priority Development Areas (PDAs) and Priority Conservation Areas (PCAs). These areas solidify local input into regional planning. The PDAs are places of focused growth that make good use of existing public infrastructure, offer more mobility choices, and strengthen local history and culture. The PCAs recognize jurisdictions’ high priority for preserving the natural environment and creating healthy communities. These two area types will soon be complemented by Priority Production Areas, a third program being developed in response to local requests. The current Plan Bay Area update will be completed by Summer 2017. The next Plan Bay Area will be developed in conjunction with the Regional Housing Need Allocation by 2021.
12 ABAG BUDGET & WORK PROGRAM
Item 7

LOCAL ENGAGEMENT TEAM
02S E C T I O N
P L A N N I N G A N DR E S E A R C H
Planning program staff works closely with staff and elected officials in towns, cities, counties, and partner agencies, and with colleagues in ABAG’s local collaboration programs—ABAG Finance Authority, ABAG POWER, BayREN, San Francisco Bay Trail, San Francisco Bay Area Water Trail, and the San Francisco Estuary Partnership.
Local collaboration is also an essential dimension of the planning and research programs. The Regional Planning Committee (RPC) is a platform of dialogue among elected officials and stakeholders to advise the Executive Board on key decisions such as PDAs, PCAs, land use growth allocation or Regional Housing Need Alocation (RHNA). The RPC hosts three sub-committees with specific tasks: Housing, Economic and Workforce Development, and Resilient Infrastructure. In addition, the planning and research department is an integral part of the ABAG General Assembly (GA) and the Delegate Meetings as well as Plan Bay Area and the ABAG Administration Committee retreat. The GA is an opportunity to discuss key regional concerns and projects with our Bay Area elected officials, once or twice a year. This is complemented by the Delegate Meetings, which discuss more specific issues by county at least once a year.
At the staff level, meetings with city managers and planning directors by county have been essential to understand core issues on the ground and target our efforts. To address issues by jurisdiction, planners are assigned to engage with each city and county of the Bay Area. Planners are responsible for participating in planning directors’ meetings, coordinating with elected officials, addressing key issues, and ensuring that local concerns are addressed in regional plans and strategies.
ABAG’s Research Team provides the analytic tools and data to support Bay Area regional and local planning. The research team presents a unique understanding of conditions and trends. The team puts local conditions in a regional context, addresses a comprehensive set of economic and demographic factors at a regional level, and is sensitive to factors interacting with land use, housing, transportation, environmental, and economic policy.
ABAG BUDGET & WORK PROGRAM 13
Item 7

RESEARCH
02S E C T I O N
P L A N N I N G A N DR E S E A R C H
ABAG’s research program provides information services to the planning team, partner regional agencies (e.g., MTC, BCDC), local jurisdictions, and outside parties. Our motivating analytical challenge is to provide understanding of a large and diverse region which has an economy that is the envy of the world yet is saddled with a number of endemic challenges, chiefly the timely and geographically sensible provision of housing, providing a trained workforce to meet the needs of expanding employers, and a transportation network able to serve the region. While there are many prominent research groups in the region, ABAG’s research program has a unique focus that puts local conditions in a regional context, addresses a comprehensive set of economic and demographic conditions at a regional level, and is sensitive to the interactions of these factors with land use, housing, transportation, environmental, and economic policy.
Major tasks in 2016-2017 included:
Forecasting growth: the ABAG Research Program develops and maintains approaches for projecting employment, output, income, population, households, and housing demand for the 9-county Bay Area, including adding version 2.0 of the REMI model to the agency’s forecasting tools, maintaining background information on jurisdiction general plans and zoning ordinances; communicating with jurisdictions on the local implications of the projected distribution of the regional forecast; and working with the Metropolitan Transportation Commission (MTC) staff to refine the UrbanSim model of the region.
2016-17 HIGHLIGHTS
• Forecasting growth
• Understanding economic development
• Improving housing data
• Applying economic analysis to resilience research
14 ABAG BUDGET & WORK PROGRAM
Item 7

Understanding Economic Development: Conducted background analysis in the Comprehensive Economic Development Strategy, including analysis of Bay Area economic clusters, updates on income and housing market data, and analysis of the effects of demographic changes on occupations and skills of Bay Area workers.
Improving Housing Data: the collection and mapping of housing data from our member cities allows analysis by the housing program of jurisdiction efforts towards affordable and sustainable housing development.
Applying Economic Analysis to resilience research: working with the EERI and researchers from four other institutions, our team will design a survey to track impacts of natural disasters, such as earthquakes on local business. The survey is being tested in Napa and Cushing, Oklahoma.
Goals and tasks for the 2017-2018 fiscal year include:
Update our regular projection series by publishing Projections 2017, a document based on the geographic distribution of the regional forecast, that provides data on the population, housing, and employment forecast at the jurisdiction level for 5-year increments between 2010 and 2040.
Expand the use of the REMI model to conduct impact analyses, such as partnering with USGS to examine the economic impacts of a scenario describing an earthquake along the Hayward fault.
Further data development at the industry and occupation level to improve our understanding of the industrial location patterns, occupational structure and relative alignment of workforce skills, and growing industry sector needs.
Expand data collection and communications to provide up to date snapshots of land use and development activity in the region.
Analyze the relationship between housing price changes and (lack of) new housing production throughout the region at neighborhood and regional scales.
2017-18 GOALS
• Publishing Projections 2017
• Expand the use of the REMI model
• Further data development at the industry and occupation level
• Expand data collection and communications
• Analyze housing data
ABAG BUDGET & WORK PROGRAM 15
ABAG from US Census Bureau, CTP 2006-10 release
How the Bay Area Commutes: Orgins and Destinations by County
Item 7

HOUSING
02S E C T I O N
P L A N N I N G A N DR E S E A R C H
2016-17 HIGHLIGHTS
• Developed and presented 2015 housing permit location data, city-by-city housing policy database, housing policy toolkit, and seismic safety assessment manual
• Supported Grand Boulevard Initiative’s housing toolkit, East Bay Corridors Initiative’s softstory safety model ordinance
• Convened Housing Subcommittee of the Regional Planning Committee to identify and advance a broadly endorsed regional housing action initiative, and partnered with MTC to produce Housing Forum.
During 2016-2017, ABAG continued its long-standing, proactive support of housing action by its member jurisdictions and implementation partners.
Impact Information — ABAG developed and presented compelling information to promote an understanding of regional housing development patterns (2015 housing permit location data), housing policy consensus (city-by-city housing policy database, Maintaining Housing Affordability and Neighborhood Stability in the Bay Area — a distillation of 13 housing solution implementation toolkits), and housing implementation tools (housing policy toolkit, seismic safety assessment manual).
Technical Assistance — Supported local and subregional efforts (Grand Boulevard Initiative’s housing toolkit, East Bay Corridors Initiative’s softstory safety model ordinance) to adopt and implement best-practices.
Consensus & Constituency Development — ABAG convened a Housing Subcommittee of its Regional Planning Committee to identify and advance a broadly endorsed regional housing action initiative, and partnered with MTC to produce an illuminating Housing Forum.
16 ABAG BUDGET & WORK PROGRAM
Item 7

In 2017-2018, the Integrated Planning Program will continue to facilitate the creation of an adequate housing supply to house future and current generations of Bay Area residents from all backgrounds: plentiful (so overcrowding and long commutes become unnecessary), affordable (to Bay Area residents at all incomes), resilient (safe during and habitable after natural disasters), sustainable (energy and water efficient) and secure (against involuntary displacement).
Local development that creates great places in complete communities and regional co-benefits — the Integrated Planning Program will work with local jurisdictions and stakeholders to support timely housing development and preservation that conforms to local, regional, and state requirements, especially in high-opportunity / low-Green House Gas areas; job and transit proximate areas; and especially for permanently affordable housing.
Safer Smarter Homes — the Integrated Planning Program will provide leadership and technical assistance to accelerate “integrated retrofits” so existing homes become more hazard resilient, more energy/water efficient, and more accommodating of a wider range of life-cycle and life-style choices (such as adding accessory units).
Regional Housing Trust Fund to dramatically increase funding — the Integrated Planning Program will support state, regional, and local efforts to develop dedicated revenue sources for housing infrastructure, affordable housing development gap financing, and affordable housing operating subsidies by incubating innovative regional institutional structures that can amplify and unify state and local efforts, public and private.
2017-18 GOALS
• Continue to support timely housing development and preservation (e.g., encouraging accessory units, supporting acquisition/rehabilitation)
• Provide leadership and technical assistance to accelerate “integrated retrofits” – safer, smarter homes
• Support efforts to create a Regional Housing trust fund to increase funding for affordable housing needs.
ABAG BUDGET & WORK PROGRAM 17
Item 7

JOBS AND WORKFORCE
02S E C T I O N
P L A N N I N G A N DR E S E A R C H
The ABAG economic and workforce development program is a response to the call for regional economic and workforce development coordination after Plan Bay Area 2013. Built on existing efforts and partnerships at the regional and local level, the ABAG program works to move across silos, and provide a sound understanding of the relationship between the region’s policy and regulatory environment and economic opportunity, increase opportunities for collaboration and cooperation among economic and workforce organizations in the region, and maintain the competitiveness of the region’s industries while expanding access to opportunities for all Bay Area residents.
2016-17 HIGHLIGHTS
• Launched an effort to establish a Bay Area Regional Economic Development District. Working with US Economic Development Administration (USEDA), ABAG established an Economic Strategy Committee to act as a Technical Advisory Committee, and organized a team to create a Comprehensive Economic Development Strategy (CEDS) report, beginning a broad based engagement strategy with regional stakeholders to achieve regional consensus around economic and workforce development strategies.
• Developed a draft regional CEDS report. ABAG drafted an economic profile of the region, an analysis of strengths, weaknesses, opportunities, and threats (SWOT analysis), and a framework for a Strategic Action Plan that includes a vision statement, goals, objectives and supporting strategies.
• Developed a Priority Production Area program. Responding to the need of goods movement and firms located on industrial land that constitute a critical component of the regional economy, ABAG partnered with Professor Karen Chapple and UC Berkeley on a study of supply, demand, and absorption of industrial land and space and outlined a Priority Production Area program to address the needs of production, distribution, and repair functions in the region.
18 ABAG BUDGET & WORK PROGRAM
Item 7

JOBS AND WORKFORCE
2017-18 GOALS
The program’s goals for the 2017-2018 fiscal year are to establish the platform for regional collaboration on economic and workforce development and to develop implementation tools to address issues such as retention of critical industrial land supply. Specific efforts will include:
• Continue with the process of establishing a Regional Economic Development District by finalizing the CEDS report, adoption of the Strategic Action Plan by county Boards of Supervisors, ABAG, and working with regional representatives, business, workforce equity, and other stakeholders to create a governance structure.
• Support economic and workforce development implementation actions through providing technical assistance, leveraging federal, state, public, and private grants for local jurisdictions, and developing a clearing house of economic development actions and best practices in the region.
• Expand the Priority Production Area concept into a regional program to be implemented at the local level by providing a set of criteria for identifying critical areas for survival of industrial, middle wage jobs, and model program descriptions and ordinances.
ABAG BUDGET & WORK PROGRAM 19
Item 7

RESILIENCE
02S E C T I O N
P L A N N I N G A N DR E S E A R C H
The ABAG Resilience Program is a unique effort to continually improve the Bay Area’s capacity to recover from natural disasters. Resilience Program staff work closely with Bay Area cities, counties, and other agencies to reduce the impacts of climate change and natural hazards. Hazards include: drought, earthquake, extreme heat, flooding, landslides, sea level rise, and wildfires. The program supports local decision makers, serving as a regional convener for life-saving resilience planning, and providing technical assistance for local action to improve resilience.
In 2016-2017, ABAG — provided hands-on assistance to 80+ city and county administrators in plan-writing workshops for Best-practice Hazard Mitigation Plans. Approved plans allow access to FEMA funds post-disaster.
To strengthen At-Risk Apartment Buildings — tens of thousands of apartments in hundreds of buildings are earthquake vulnerable — ABAG is helping 15 cities conduct assessments, adopt ordinances and establish programs to save lives and prevent displacement, as part of ABAG’s East Bay Corridors Initiative.
Developed a Water Resilience Initiative in response to multi-year drought and heightened risk of El Nino flooding, ABAG convened an Infrastructure Subcommittee of the Regional Planning Committee to explore solutions and opportunities common to cities, counties, and water districts. ABAG developed new tools to support this process, including a comprehensive inventory of all agencies’ respective water responsibilities.
2016-17 HIGHLIGHTS
• Provided hands-on assistance to 80+ city and county administrators in Best-practice Hazard Mitigation Plan writing
• Assisted 15 cities in Strengthening At-Risk Apartment Buildings
• Convened an Infrastructure Subcommittee of the Regional Planning Committee to explore a Water Resilience Initiative
20 ABAG BUDGET & WORK PROGRAM
Item 7

RESILIENCE
In 2017-2018, the Resilience Program will share Local Government Best Practices — Some of the most innovative resilience solutions are coming from Bay Area cities and counties. We are expanding a local government policy database to connect cities with existing resources to move initiatives forward.
Continue to focus on soft-story safety — Resilience will continue to provide technical assistance to help cities and counties make earthquake-vulnerable homes safe.
Energy assurance is part of Resilience — We will work with local governments to integrate energy assurance projects into resilience planning, for example, microgrids.
2017-18 GOALS
• Sharing Local Government Best Practices
• Continuing focus on Soft-Story safety
• Work with local governments to integrate energy assurance projects
ABAG BUDGET & WORK PROGRAM 21
A magnitude 7.0 earthquake releases 33 times more energy than a magnitude 6.0 and 1000 times more than a magnitude 5.0 earthquake. The M7.8 1906 earthquake released 500 times more energy than the M6.0 2014 South Napa Earthquake. (Sphere volume is representative of quake energy.)
6.9
M7.8
6.0
Data Sources:1. bayareacensus.ca.gov2. Ellsworth (1990)
1906 M7.8The “Big One”
1989 M6.9Loma Prieta
2014 M6.0South Napa
Over this 58 year period the Bay Area region did not
experience a M6.0 or greater earthquake while the region
added four million people.
Bay Area Earthquakes (>M6.0)2
Bay Area Population Growth1
1 million
2 million
3 million
4 million
5 million
6 million
1830 1850 1870 1890 1910 1930 1950 1970 1990 2010 >>
Item 7

The San Francisco Bay Trail, the San Francisco Bay Area Water Trail, and the Priority Conservation Area program are regional projects coordinated by ABAG and implemented by local agencies and organizations to advance the protection and stewardship of natural resources and expand the system of urban trails, parks, bikeways and bay access to increase the quality of life, health, and economic prosperity of the region.
In 2016, the San Francisco Bay Trail reached 350 out of 500 miles — that’s 70% complete — with the construction of seven miles of trail, including 4 miles in Hayward at Eden Landing Ecological Preserve, 2.5 miles at Sears Point Restoration Area in Sonoma County and the last stretch of the pathway on the East Span of the San Francisco-Oakland Bay Bridge linking to Yerba Buena Island. Six new Bay Trail smart phone audio tours were created around the region and the San Francisco Bay Trail Design Guidelines & Toolkit was released to local partners outlining recommended principles for designing and developing the remaining trail gaps.
02S E C T I O N
P L A N N I N G A N DR E S E A R C H
REGIONAL TRAILS & OPEN SPACE
2016-17 HIGHLIGHTS
• Seven miles constructed, reaching the milestone of 350 miles and 70% complete
• Bay Trail Design Guidelines & Toolkit released to shoreline partners outlining the principles for designing and developing the remaining sections of Bay Trail
• Six new Bay Trail smart audio phone tours were created and a $15,000 grant was secured from Google to complete a tour at the Google campus in Mountain View
2017-18 GOALS
• Seek and provide funding to implementing agencies to significantly advance the development of the Bay Trail
• Expand awareness of the Bay Trail through new smart phone audio tours, Migrations regional art program, and other outreach tools
• Develop a strategy to analyze the condition of existing segments of Bay Trail in coordination with shoreline partners
22 ABAG BUDGET & WORK PROGRAM
Item 7

The San Francisco Bay Area Water Trail has hit its stride with 30 officially-designated sites to date. The Water Trail is a growing network of launching and landing sites, or “trailheads,” around San Francisco Bay. Each trailhead enables non-motorized small boat users to enjoy the historic, scenic, cultural, and environmental richness of the San Francisco Bay and its nearby tributary waters. Potentially, more than 100 existing marinas, waterfront parks, and other publicly accessible sites will become part of the Water Trail through regional collaboration. In 2016, the Water Trail grant program, made possible by the State Coastal Conservancy, awarded nearly $500,000 to local jurisdictions for site enhancements. Also, Water Trail staff worked with the East Bay Regional Park District to create a comprehensive, two-county Water Trail Implementation Plan that serves as a model for other areas of the region.
2016-17 HIGHLIGHTS
• Designated the 30th Water Trail site
• Allocated over $490,000 for water access improvements
• Completed East Bay Regional Park District Water Trail Implementation Plan
2017-18 GOALS
• Designate up to 50 Water Trail sites
• Complete a set of Water Trail maps and update the Water Trail website
• Develop a detailed list of projects and assist partners with applying for available funds
The Priority Conservation Area (PCA) program is a component of Plan Bay Area that emphasizes the importance of open spaces providing agricultural, natural resource, scenic, recreational, urban greening and/or ecological value in the nine-county area. These areas are identified through consensus by local jurisdictions and park/open space districts as lands in need of protection or enhancement due to pressure from urban development or other factors. In 2016, the program reached a total of 165 designated PCAs representing a variety of landscapes within which projects will be eligible for One Bay Area Grant (OBAG) funds.
2017-18 GOALS
• Solicit applications and manage a competitive grant program under the One Bay Area Grant (OBAG) program in partnership with MTC and the State Coastal Conservancy to fund eligible projects within PCA boundaries
• Update and maintain a comprehensive and informative PCA website with county-specific PCA maps as a public and local agency resource
ABAG BUDGET & WORK PROGRAM 23
Item 7

COMPLETE COMMUNITIES
02S E C T I O N
P L A N N I N G A N DR E S E A R C H
Together with Priority Conservation Areas (PCAs), Priority Development Areas are the foundation for sustainable regional growth and Plan Bay Area. A partnership between MTC and ABAG, the Priority Development Area program supports community-based PDA plans across the region and provides focused implementation initiatives.
Work in 2016-2017 focused on:
Regional Planning Grants — ABAG managed 15 planning grants that allow Bay Area cities and counties to deliver locally adopted plans for PDAs that address a full range of issues and set the stage for a transparent development process consistent with the community’s vision.
Complete Communities — Staff worked with a cross-section of local staff, design professionals, developers, schools, and community organizations to advance placemaking strategies, including urban greening, profiles of successful places, and forums for regional dialogue about community assets and aspirations for PDAs.
Corridors and Centers — ABAG brought together cities connected by transit corridors, and the region’s three largest cities, to identify common challenges and pursue shared opportunities. 2016-17 saw the implementation of priorities identified by Corridor jurisdictions including a model ordinance for safe housing; corridor-wide green infrastructure priorities; an EPA Brownfields grant; and $50 million for catalyst affordable housing and transportation projects.
2016-17 HIGHLIGHTS
• Managed 15 planning grants
• Worked with a cross-section of cities about community assets and aspirations for PDAs
• Brought together cities connected by transit corridors, and the region’s three largest cities, to identify common challenges and pursue shared opportunities.
24 ABAG BUDGET & WORK PROGRAM
Item 7

2017-18 GOALS
• Identify and expand successful elements of the PDA program and add new focus areas
• Continue to implement Corridors and Centers Collaboration
• Facilititate, engage, and provide forums to discuss PDA local issues and aspirations
• Create web-based tools to assist in identifying locations that currently have incentives for housing in place.
Efforts in 2017-18 are:
Tailored PDA Planning Grants — In partnership with MTC, the Integrated Planning Program will expand successful elements of the PDA program and add new focus areas responsive to emerging challenges identified through consultation with local staff. New guidelines and a Call for Projects will be released in mid-2017.
Corridors and Centers Collaboration — Continue to implement the East Bay Corridor Initiative’s priorities, convene the region’s three largest cities to identify shared objectives; and utilize housing expertise to support the Grand Boulevard Initiative.
Regional placemaking and PDA dialogue — Through direct engagement with local officials and the Places of the Bay Area website, the Integrated Planning Program will provide forums for people with diverse perspectives to discuss local issues and aspirations related to PDAs.
Entitlement efficiency — the Integrated Planning Program will create web-based tools to assist local planners and developers in identifying locations that have existing incentives for housing and commercial development, particularly affordable housing.
ABAG BUDGET & WORK PROGRAM 25
Item 7

03 LOCAL COLLABORATION PROGRAMS
HIGHLIGHTS
PROGRAM OVERVIEW
• Millions of dollars saved by counties, cities, and towns in staff time and administrative costs.
• All 101 Bay Area cities and nine counties rely on Local Collaboration Programs to serve their communities.
• Life-saving best practices and quality of life improvements are offered for all Bay Area residents.
• Local Collaboration Programs are administered by ABAG staff.
• Many Local Collaboration Programs have an independent governing board comprised of city and county representatives.
THE BOTTOM
LINE
• In the last five years, grant income has increased 225%, from $16 million to almost $52 million.
• The combined reserve amounts exceed $35 million.
Item 7

SAN FRANCISCO ESTUARY PARTNERSHIP
03S E C T I O N
L O C A L C O L L A B O R AT I O N P R O G R A M S
The San Francisco Estuary Partnership (Partnership) and its cooperating agencies and organizations both initiated, and continued work on a wide array of projects and activities in support of the Partnership’s mandate: To protect, enhance, and restore the San Francisco Bay-Delta Estuary. The Partnership currently manages $100 million in funding for local and regional restoration, water quality, and climate resiliency projects and programs.
2016-17 HIGHLIGHTS
• Released the 2016 Estuary Blueprint, a regional comprehensive vision for the future of the San Francisco Estuary. More than 100 scientists, regulators, businesses, municipalities, non-governmental organizations, and citizens collaborated with the Partnership to develop four long-term goals and 32 actions to be taken over the next five years to protect, restore, and sustain the San Francisco Estuary.
• Completed GreenPlan Bay Area, a collaborative effort between San Francisco Estuary Partnership, San Francisco Estuary Institute, and Bay Area municipalities to develop and pilot the use of a watershed-based green infrastructure planning tool.
• Continued public outreach efforts such as the planning and execution of the 2016 Bay Delta Science Conference in partnership with the Delta Science Program, the release of brochures for local governments on natural infrastructure and green streets, and the 25th year of publication of our award-winning ESTUARY News magazine.
2017-18 GOALS
• Working with partners to implement and track successes of the Estuary Blueprint.
• Planning and execution of the highly successful 2017 State of the Estuary Conference, with 800 attendees expected.
• Expanding the Clean Vessel Act Program with new funding and new initiatives. The Program focuses on reducing water quality impacts by undertaking outreach and education efforts with boaters to prevent sewage discharge.
ABAG BUDGET & WORK PROGRAM 27
Item 7

POWER
03S E C T I O N
L O C A L C O L L A B O R AT I O N P R O G R A M S
Since its formation in 1998, ABAG POWER has played a critical role in serving the energy needs of many local governments and public agencies in the Bay Area. Since its inception in a time of rapidly evolving energy markets, the objective of the program has been to provide leadership for local governments in the areas of energy procurement and energy management by creating voluntary, region-wide energy purchasing pools administered by ABAG POWER. Pooled purchasing allows the program to negotiate preferential pricing of energy supply for use in public facilities like hospitals, police and fire stations, zoos, and community centers. Today, the program strives to fulfill measurable and often competing goals of cost savings and price stability. These goals differ from that of Pacific Gas & Electric Company (PG&E) which is incentivized to provide low-cost gas on a near term (monthly) basis.
ABAG POWER’s natural gas purchasing pool recently completed its nineteenth year of operation and currently serves nearly 40 member agencies throughout PG&E’s service territory. Each member is guaranteed a voice in program operations and decisions through its representative to the ABAG POWER Board of Directors and Executive Committee. The pool’s annual usage footprint is roughly equivalent to gas usage from 12,000 homes in California. For much of the past year, market rates for natural gas declined significantly and remained relatively low, however, price volatility remains a significant risk and can be caused by many factors including abnormal weather patterns, political instability, the price of alternative products (e.g., oil), and regulatory actions. ABAG POWER closely monitors these price volatility factors as part of their service and continues to follow regulatory actions that may affect the natural gas and electrical energy markets.
2016-17 HIGHLIGHTS
• ABAG POWER’s commodity rates remained more stable than PG&E’s during the past fiscal year
• The recent addition of a promising natural gas supplier and continued refinements to the program’s gas purchasing strategy provide increased potential for savings.
• Recently, the program has seen three consecutive year-on-year decreases in ABAG’s administrative operating fees.
2017-18 GOALS
• The Executive Committee will continue to discuss and analyze refinements to the gas purchasing strategy and customer service and billing/reporting aspects of the program.
• In coming years, continue efforts to fulfill environmental responsibility and sustainability by promoting use of renewable gas where appropriate.
• Continue to examine opportunities to expand the program’s membership while successfully adapting to California’s aggressive environmental policy goals.
28 ABAG BUDGET & WORK PROGRAM
Item 7

BayREN
03S E C T I O N
L O C A L C O L L A B O R AT I O N P R O G R A M S
Formed in 2012 as a collaboration between ABAG and the nine Bay Area counties, the Bay Area Regional Energy Network (BayREN) helps Bay Area residents and communities become more energy efficient. BayREN draws on the expertise, experience, and proven track record of local Bay Area governments to build the internal capacity of local cities and counties to administer successful climate, resource, and sustainability programs. BayREN has a portfolio of energy efficiency programs that include: single family and multifamily energy retrofit programs that offer monetary incentives; Codes and Standards that works with local building officials to better understand and comply with the State Energy Code; and several financing programs including an on bill water efficiency program and a zero interest loan funds for eligible multifamily energy retrofit projects. BayREN is primarily funded by Public Goods Charges approved by the California Public Utilities Commission, and currently has an annual budget of over $16 million.
2016-17 HIGHLIGHTS
• Paid rebates of over $10 million to Bay Area single family and multifamily homeowners for making energy retrofits to their properties, resulting in energy savings, healthier living environments, and progress toward state and local Greenhouse Gas reductions.
• Awarded two new grants from a state and federal agency, meeting the goal of diversifying our funding sources. Also successfully obtained a three year — rather than one year — contract totaling $50,611,000.
• Multiple recognitions of accomplishments and successful regional structure in reports by state agencies, nonprofit organizations, and other stakeholders.
2017-18 GOALS
• Continue with successful programs, but also obtain approval for new programs. Expansion includes commercial and public sector program offerings.
• Greater diversification of funding.
• Increased and continued collaboration with BAAQMD and BARC (and MTC).
ABAG BUDGET & WORK PROGRAM 29
Item 7

ABAG PLAN
03S E C T I O N
L O C A L C O L L A B O R AT I O N P R O G R A M S
ABAG PLAN was formed in 1986 to meet the needs of small and medium-sized cities and towns across the Bay Area who were otherwise unable to obtain affordable insurance. ABAG PLAN provides general liability, property and crime insurance by establishing stable, cost-effective self-insurance and risk management programs to help protect Bay Area cities from the damages and costs accrued from accidents or other incidents. Members are 28 towns and cities from six Bay Area counties. Serving as an essential resource for members, ABAG PLAN helps to insulate cities and towns from losses and manage fiscal resources by working to mitigate risks. Since many members may not have an in-house risk management department, ABAG PLAN staff serve as an extension of city staff with services, training, and strategic support, and thus setting us apart from other risk pools.
ABAG PLAN provides members with:
Insurance Program — Self-insured, risk sharing pool with broad coverage, interest on reserves, and a return of assets
Claims Management — Dedicated claims examiners who provide investigative services, advice, and strategy
Risk Management — Strategic advice and support around best practices for risk management and mitigation; member surplus funding reallocated as risk management grants to long term risk mitigating activities and trainings.
ABAG PLAN offers workshops both via online training and in person, e.g. Defensive Driving or Sidewalk Liability Prevention. Larger educational programs include the annual “Be Sewer Smart!” Summit, which provides valuable tips to prevent sewer challenges, and the Urban Forest Forum, sponsored in collaboration with the Urban Forest Council, which provides tools for mitigating and managing potential risks associated with trees and landscaping.
2016-17 HIGHLIGHTS
• Maintained a balanced budget and offered stable rates for premium contributions to the members. This greatly helps the jurisdictions’ budget planning.
• Successfully managed investments and claim outcomes to grow budget surplus (equity).
• Continued customized assistance to members in assessing and maintaining best practices in order to reduce losses and preserve fiscal resources for the individual members as well as the pool at large.
2017-18 GOALS
• Maintain cost stabilization and affordable protection options for the members going forward.
• Continue assistance to members with strategic risk management planning and increase risk management training offerings while remaining responsive to requested and relevant topics. Continue the positive correlation between knowledge/implementation and outcomes/lower claim activity.
• Ongoing performance improvement of contracted partners to assure program is operating optimally.
30 ABAG BUDGET & WORK PROGRAM
Item 7

03S E C T I O N
L O C A L C O L L A B O R AT I O N P R O G R A M S
The ABAG Finance Authority has been providing conduit financing to various public and private organizations throughout the state of California since 1990.
As a conduit issuer, the Finance Authority provides a convenient, cost saving, and secure method of accessing the market to aid in the financing needs of public agencies and their non-profit and for-profit partners. To date, we have provided over $8 billion in low cost investment capital for projects in more than 240 local jurisdictions. We have helped our members fund construction of affordable housing and retirement facilities, new hospitals and medical clinics, private schools and cultural institutions, transit systems, water and wastewater systems, and other essential public infrastructure. We take special focus on assisting in the construction and preservation of affordable housing, providing financing to date for nearly twelve-thousand units in one hundred affordable apartment communities.
Recent financing activities include: the Morgan Autism Center in San Jose, $9.7 million in tax-exempt bonds; the Independent Order of the Odd Fellows, an organization committed to helping others, $71.4 million in tax-exempt bonds for the construction of its Meadows of Napa Valley continuing care retirement community; the Crean Lutheran High School of Irvine, $33 million in tax-exempt financing to refund outstanding debt and raise new money to continue construction of existing facilities; and the Presidio Knolls School in San Francisco with a $4.9 million tax-exempt financing to refund an existing loan and to renovate existing facilities.
2016-17 HIGHLIGHTS
• Hired experienced public finance professionals to rebuild and relaunch the conduit issuance program; revised and rebuilt website, including new online application and fee structure
• Implemented marketing strategy to generate new business; attended and presented at California Society of Municipal Analysts (CSMA) annual conference; met with industry professionals
• Assisted three non-profit educational institutions and a retirement community with issuing tax-exempt financings
2017-18 GOALS
• Create a new JPA for conduit financing to member agencies
• Be an industry leader in meeting and exceeding State reporting requirements for conduit issuers
• Investigate and pursue new financing opportunities to assist ABAG members with financing needs
ABAG FINANCE AUTHORITY
ABAG BUDGET & WORK PROGRAM 31
Item 7

04 EXTERNAL AFFAIRS
HIGHLIGHTS & PROGRAM OVERVIEW
• Informing and engaging ABAG’s membership, as well as local elected officials, local government staff, and the general public about ABAG’s programs and services related to land use, the environment, resilience, risk management, and energy efficiency.
• Providing outreach activities, media relations, and regional and local events; delivered via the website, electronic communication, printed reports, and in person.
• Work collaboratively to influence legislation related to land use, housing, and energy and water efficiency.
• Provide fiscal management services to Local Collaboration Programs.
Item 7

LEGISLATIVE ACTIVITY
04S E C T I O N
E X T E R N A LA F FA I R S
The ABAG Legislative and Governmental Organization (L&GO) Committee is a platform for elected officials from the Bay Area’s cities, towns, and counties to work collaboratively to influence legislation that impacts local governments. In 2016, Alameda County Supervisor Scott Haggerty served as L&GO Chair. Approximately 30 state bills were reviewed by the Committee during the 2016 legislative session. Key areas of emphasis for the L&GO Committee included local governments, land use and housing, energy efficiency, environment, hazardous waste, and resiliency.
ABAG’s L&GO Committee actively supported legislation related to land use, housing, and energy and water efficiency. The L&GO supported AB 2406 (Thurmond) Housing: Junior Accessory Dwelling Units that was chaptered into law, as well as SB 1030 (McGuire) Sonoma County Regional Climate Protection Authority that became law. The L&GO also pursued ABAG POWER authored Water Efficiency Financing Legislation in 2016.
Activities included a Legislative Workshop and Reception co-hosted by ABAG, MTC and the California State Association of Counties. The program featured legislative committee chairs along with several other leading state legislators and staff from State Department of Housing and Community Development. These legislators and agency leaders discussed bills and initiatives related to local governments, land use, housing, transportation, and environmental challenges. More than 70 attendees participated in this important forum for local elected officials.
2016-17 HIGHLIGHTS
• Conducted policy briefings and pursued legislation addressing the committee priorities.
• Produced Legislative Workshop and Reception co-hosted by ABAG, MTC and the California State Association of Counties.
• Facilitated discussions with legislators about Bay Area needs and challenges.
2017-18 GOALS
• Continue to pursue legislation that provides resources and incentives for planning, infrastructure, and services to assist local governments, as well as State and Federal legislation establishing innovative financing and project delivery mechanisms.
• Continue to focus on SB 375 and Plan Bay Area Implementation through legislative objectives such as affordable housing funding and housing element reform.
• ABAG will continue to monitor implementation of the Cap and Trade Program. Continue to seek voter threshold reduction for infrastructure taxes and bonds statewide and locally.
• Increase focus on physical and economic resilience.
ABAG BUDGET & WORK PROGRAM 33
Item 7

COMMUNICATIONS
04S E C T I O N
E X T E R N A LA F FA I R S
The Communications Department worked with all departments to promote ABAG’s mission and to inform and engage members. The group led a strategic campaign to expand the awareness and understanding of ABAG’s programs and services and raise awareness of the benefits to local governments. The strategy was rolled out with streamlined program fact sheets and presentations before the ABAG Executive Board throughout Fall and Winter of 2016-2017. Major efforts included production and management of regional conferences and workshops, publications, media relations, and web outreach centered on ABAG programs and services.
Events included the Spring General Assembly in 2016, as well as a 2016 Special General Assembly on May 19th to discuss merger options and vote on a recommendation to the ABAG Executive Board, and a Special General Assembly in January 2017. The Communications group also worked with ABAG’s Acting Executive Director and Planning staff to facilitate Delegate meetings in the region. Delegate meetings served as an important tool for information exchange and collaboration amongst cities within the counties. Communications also assisted with production of the Bay Area Confluence forum in November. Each of these events brought together more than 100 local elected officials.
In addition to facilitating these regional forums and other activities, monthly electronic newsletters with organizational updates, planning information, and program/service highlights were distributed. The revamped ABAG website was used to feature news announcements and twitter feeds. Updates on ABAG initiatives, programs, and services were consistently provided on the website. Overall outreach was expanded to facilitate better use of ABAG programs and services.
2016-17 HIGHLIGHTS
• Planned and coordinated General Assemblies (GA), including Special GAs in 2016 and 2017. Outreach and engagement for regional Plan Bay Area open houses in 2016 Spring/Summer.
• Produced regular news updates and twitter feeds on the ABAG website. Disseminated timely communications through extensive news blasts linking to conference proceedings and presentations.
• Also helped relaunch the ABAG Finance Authority with an all new website and collateral material.
2017-18 GOALS
• Plan and coordinate General Assemblies, other regional forums, and county-wide Delegate meetings.
• Continue to expand the use of the website and social media to communicate with member cities, towns, and counties; key stakeholders; and the public. Facilitate access to ABAG programs, projects, initiatives, and resources using the website and social media.
• Continue to distribute a monthly electronic newsletter with updates and planning information. Secure media interviews with media outlets with high visibility.
34 ABAG BUDGET & WORK PROGRAM
Item 7

04S E C T I O N
E X T E R N A LA F FA I R S
FISCAL MANAGEMENT SERVICES
ABAG continues to offer fiscal management services to Bay Area public purpose entities and region-wide grant programs. Financial services are provided to ABAG PLAN Corporation, ABAG Workers Compensation Shared Risk Pool, ABAG Finance Authority for Nonprofit Corporations, ABAG Publicly Owned Energy Resources, and the San Francisco Bay Area Water Emergency Transit Authority. These services include accounting, financial reports, cash management, investments, debt issuance, grants management, and other related financial support services.
Major grants for which ABAG exercised fiscal oversight in year 2016-2017 totaled $51 million. These include grants for the promotion and incentivizing the evaluation of energy efficiency of homes and the installation of enhancements such as insulation, double-paned windows and solar panels, as well as grants to enhance water quality of the Delta and San Francisco Bay including water recycling, cleaning up creeks emptying into the Bay, and capturing water in natural medians instead into storm drains.
Our accounting procedures and controls for these grants are examined by our independent auditors as part of the ABAG annual audit and larger federal grants are examined in a “Single Audit” performed in accordance with Federal auditing standards. Our independent auditors continue to provide unmodified (positive) opinions as to our fiscal accountability, and have reported no fiscal deficiencies or substantial weaknesses in internal accounting and administrative controls. Starting on July 1, 2017, these services will be carried out by the consolidated ABAG/MTC staff.
2016-17 HIGHLIGHTS
Provided fiscal management services for the following entities:
• ABAG-related: ABAG PLAN Corporation, ABAG Comp Shared Risk Pool, ABAG Finance Authority, ABAG Publicly Owned Energy Resources, San Francisco Estuary Partnership
• Other: San Francisco Bay Restoration Authority, San Francisco Bay Area Water Emergency Transit Authority.
2017-18 GOALS
• Fiscal management services for the San Francisco Bay Restoration Authority will significantly increase due to the passage of Measure AA in June 2016. Management of the ABAG PLAN Corporation, ABAG Comp Shared Risk Pool, ABAG Finance Authority, and ABAG Publicly Owned Energy Resources will continue.
• Continue oversight of major grants with error-free fiscal management services.
• Conduct regularly scheduled meetings with our significant entities to review service levels, discuss service enhancements, and to facilitate increased involvement of the managers in the budget process.
• Provide timely and accurate comprehensive financial information to the Boards and the public.
ABAG BUDGET & WORK PROGRAM 35
Item 7
05 BUDGET
Item 7

PHOTO TO BE A
DDED
Item 7

BUDGET HIGHLIGHTS
CHART
TO BE A
DDED
38 ABAG BUDGET & WORK PROGRAM
Item 7

OPERATING BUDGET
ABAG BUDGET & WORK PROGRAM 39
FY 14-15 ACTUAL
FY 15-16 ACTUAL
FY 16-17 ADOPTED
FY 17-18 PROPOSED
REVENUES
Federal $5,186,616 $5,906,289 $6,387,059 8,732,955
State 24,008,892 44,131,536 42,729,572 53,446,623
Other Contracts 1,181,055 1,944,977 2,600,317 2,846,651
Service Programs 5,437,298 4,717,179 4,545,000 4,033,648
Membership Dues 1,820,316 1,896,480 1,957,767 2,065,639
Total Revenues $37,634,177 $58,596,461 $58,219,715 $71,125,516
EXPENSES
Salaries and Benefits 11,367,923 10,818,257 11,828,400 11,840,899
Consultant Services 14,161,428 35,271,608 28,249,460 41,950,448
Passthrough 9,084,115 10,120,973 15,761,546 15,208,973
Temporary Personnel Services 183,356 266,355 167,682 439,486
Equipment and Supplies 116,144 103,822 130,000 146,096
Outside Printing 72,985 77,895 66,746 89,609
Conference and meeting 114,928 218,371 298,544 363,150
Depreciation 152,823 166,035 150,000 150,000
Interest 85,806 70,352 78,471 38,500
Building Maintanance 259,586 286,768 270,000 214,000
Utilities 123,529 135,824 130,000 100,000
Insurance 145,446 159,676 165,000 162,500
Postage 20,824 10,970 19,044 15,594
Telephone 62,468 83,845 57,128 60,739
Committee (per diem) 71,550 85,200 97,888 107,732
Other 765,217 485,000 699,806 237,790
Total Expenses $36,788,128 $58,360,951 $58,169,715 $71,125,516
Net Surplus (deficit) $846,049 $235,510 $50,000 $0
Item 7

BUDGET
REVENUES FY 14-15 ACTUAL
FY 15-16 ACTUAL
FY 16-17 ADOPTED
FY 17-18 PROPOSED
FEDERAL REVENUES
EPA - Environmental Programs $1,971,454 $2,305,606 $2,439,748 $3,382,009
MTC - FTA 232,147 245,981 243,592
MTC - FHWA 995,379 1,019,529 1,030,190
MTC - STP Exchange 1,321,632 1,365,065 1,372,233
MTC - HUD Grant 75,000
U.S. Geological Survey 204,671 64,362 34,136 131,319
U.S. Dept. of Interior 163,567 156,649
U.S. Dept. of Homeland Security 749,097 667,161 480,000
EPA Brownfield Assessment 600,000
U.S. Dept. of Energy 641,970
Discontinued Prog. and Audit Adjustments
222,766
Subtotal $5,186,616 $5,906,289 $6,387,059 $4,635,298
STATE REVENUES
MTC - TDA $112,862 $289,720 $240,547
MTC: Bay Trail 5% Bridge Toll Revenues 236,181 296,885 273,340 $273,341
Coastal Conservancy: Bay Trail Block Grant #4
606,554 606,281 145,507
Cal Trans 260,663 900,000
State Water Resources Control Board (2,360) 379 361,580 17,226
California Resources Agency 49,368 139,199 114,677 311,660
CA Dept. of Conservation (Prop. 84) 1,038,451 550,975
CA Dept. of Water Resources 3,516,659 24,606,229 26,915,461 33,754,614
CA Div. of Boating & Waterways 236,861
CA Public Utilities Commission 16,571,760 17,422,227 12,837,000 16,894,934
Delta Stewardship Council 194,815 190,874 286,967 184,714
CA Earthquake Authority 39,023
MTC: Bay Trail 2% Bridge Toll Revenues 450,000
Coastal Conservancy: Water Trail Block Grant
950,000
Coastal Conservancy: Bay Trail Block Grant #5
300,000
Discontinued Prog. and Audit Adjustments
1,384,916
Subtotal $24,008,892 $44,102,769 $ 42,729,572 $52,718,857
PROPOSED REVENUES BY FUNDING SOURCES
40 ABAG BUDGET & WORK PROGRAM
Item 7

BUDGET
REVENUES FY 14-15 ACTUAL
FY 15-16 ACTUAL
FY 16-17 ADOPTED
FY 17-18 PROPOSED
OTHER CONTRACTS
BALANCE Foundation $12,025 $17,044 $12,500
Haz Waste MOU Committee 77,455 90,927
MTC 429,871 376,986 911,439 $477,500
MTC Tenant Improvements 550,000
Santa Clara Water District 120,669 133,004 172,150 172,150
Fiscal Agent Services (WETA) 108,717 114,688 129,000
Alameda County SFEP 151,652 166,514 158,266 168,573
Coastal Conservancy 127,977 457,390 50,000 536,216
Admin. Civil Liability/Northbay Outreach 20,000
SFPUC - Estuary (215)
STARS Deferred Comp Program (4,500) 2,400 2,400
City & County of San Francisco
City of Oakland 15,022 90,176
Consortium of Public Agencies 82,440 50,658 100,000
East Bay Municipal Utility District 37,002
County of Marin 115,988 172,187 143,957 94,326
Sonoma County Water District 133,713 200,605 150,454
Rockefeller Philanthropy Advisors 158,290 150,000 141,710
Resource for Community Development 1,367
Local Government Commission 3,244
Contra Costa County 110,728
San Francisco Bay Restoration 555,700
Other Grants 5,156 439,294
Discontinued Prog. and Audit Adjustments
(267,527)
Subtotal $1,181,055 $1,973,744 $2,600,317 $2,846,651
SERVICE PROGRAMS
Publications $9,074 $6,615 $5,000
Training 660,385 579,007 75,000
Financial Services 1,407,498 809,531 1,050,000 $995,004
Workers' Compensation 133,148 122,145 150,000 158,971
ABAG PLAN Corp 2,188,969 2,275,282 2,450,000 2,159,835
Bay Trail Nonprofit 28,565 30,109 25,000 12,300
Web Hosting 1,440 1,080
POWER Purchasing Pool Fees 365,241 345,181 440,000 317,538
Conference Services 267,706 200,038 200,000
ABAG General Fund
Other 375,272 348,191 150,000 390,000
Subtotal $5,437,298 $4,717,179 $4,545,000 $4,033,648
MEMBERSHIP DUES
ABAG Dues (local and cooperating) 1,820,316 1,896,480 1,957,767 2,065,639
Total Revenues $37,634,177 $58,596,461 $58,219,715 $66,300,093
PROPOSED REVENUES BY FUNDING SOURCES
ABAG BUDGET & WORK PROGRAM 41
Item 7

E X P E N S E S R E V E N U E S O U R C E STOTAL
EXPENSESMTC
FUNDEDABAG
FUNDED FEDERAL STATE OTHER SERVICES MEMBERSHIP TOTALREVENUES
Planning1 Contract for Services2
ProgramExpenses
PLANNING & RESEARCH*
Land Use $3,306,374 $3,306,374
Bay Trail / Water Trail 1,900,077 $1,900,077 $418,848 $1,468,929 $12,300 $1,900,077
Resilience 1,113,708 1,113,708 566,319 547,389 1,113,708
Other Planning 608,876 608,876 608,876 608,876
Subtotal 6,929,035 3,306,374 3,622,661 1,175,195 418,848 2,016,318 12,300 3,622,661
LOCAL COLLABORATION PROGRAMS
San Francisco Estuary 39,255,509 $791,283 38,464,225 2,818,133 35,405,074 241,018 38,464,225
Power Purchasing Pool & Energy Programs 1,025,926 1,025,926 641,970 32,803 33,615 317,538 1,025,926
BayRen 16,862,131 16,862,131 16,862,131 16,862,131
Financial Services 995,004 995,004 995,004 995,004
ABAG PLAN Corp. 2,159,835 2,159,835 2,159,835 2,159,835
Workers' Compensation 158,971 158,971 158,971 158,971
SF Restoration Authority 555,700 555,700 555,700 555,700
Subtotal 61,013,076 791,283 60,221,792 3,460,103 52,300,008 830,333 3,631,348 60,221,792
EXTERNAL AFFAIRS
Communications 588,056 588,056 588,056 588,056
Legislative Activity 97,027 97,027 97,027 97,027
Subtotal 685,083 685,083 685,083 685,083
Management & Administration 2,498,322 727,765 1,770,557 390,000 1,380,556 1,770,556
TOTAL $71,125,516 $3,306,374 $1,519,048 $66,300,093 $4,635,298 $52,718,857 $2,846,651 $4,033,648 $2,065,639 $66,300,093
GRAND TOTAL $71,125,516 $3,306,374 $1,519,048 $66,300,093 $4,635,298 $52,718,857 $2,846,651 $4,033,648 $2,065,639 $66,300,093
PROPOSED REVENUES AND EXPENSES BY PROGRAM
Note: The proposed FY 17-18 budget assumes that the local collaboration programs will continue to receive the same level of management and administrative support services as provided in the past.
42 ABAG BUDGET & WORK PROGRAM
* After integration, Planning and Research Department will be the Integrated Regional Planning Program (Integrated Planning Program).
Item 7

E X P E N S E S R E V E N U E S O U R C E STOTAL
EXPENSESMTC
FUNDEDABAG
FUNDED FEDERAL STATE OTHER SERVICES MEMBERSHIP TOTALREVENUES
Planning1 Contract for Services2
ProgramExpenses
PLANNING & RESEARCH*
Land Use $3,306,374 $3,306,374
Bay Trail / Water Trail 1,900,077 $1,900,077 $418,848 $1,468,929 $12,300 $1,900,077
Resilience 1,113,708 1,113,708 566,319 547,389 1,113,708
Other Planning 608,876 608,876 608,876 608,876
Subtotal 6,929,035 3,306,374 3,622,661 1,175,195 418,848 2,016,318 12,300 3,622,661
LOCAL COLLABORATION PROGRAMS
San Francisco Estuary 39,255,509 $791,283 38,464,225 2,818,133 35,405,074 241,018 38,464,225
Power Purchasing Pool & Energy Programs 1,025,926 1,025,926 641,970 32,803 33,615 317,538 1,025,926
BayRen 16,862,131 16,862,131 16,862,131 16,862,131
Financial Services 995,004 995,004 995,004 995,004
ABAG PLAN Corp. 2,159,835 2,159,835 2,159,835 2,159,835
Workers' Compensation 158,971 158,971 158,971 158,971
SF Restoration Authority 555,700 555,700 555,700 555,700
Subtotal 61,013,076 791,283 60,221,792 3,460,103 52,300,008 830,333 3,631,348 60,221,792
EXTERNAL AFFAIRS
Communications 588,056 588,056 588,056 588,056
Legislative Activity 97,027 97,027 97,027 97,027
Subtotal 685,083 685,083 685,083 685,083
Management & Administration 2,498,322 727,765 1,770,557 390,000 1,380,556 1,770,556
TOTAL $71,125,516 $3,306,374 $1,519,048 $66,300,093 $4,635,298 $52,718,857 $2,846,651 $4,033,648 $2,065,639 $66,300,093
GRAND TOTAL $71,125,516 $3,306,374 $1,519,048 $66,300,093 $4,635,298 $52,718,857 $2,846,651 $4,033,648 $2,065,639 $66,300,093
ABAG BUDGET & WORK PROGRAM 43
1 This funding has historically flowed to ABAG from MTC to fund planning activities.
2 This funding is the additional cost to fund the staff consolidation activities.
Item 7

JURISDICTION ESTIMATEDPOPULATION1/1/2016
DUES
APPROVEDFY 16-17
PROPOSEDFY 17-18
COUNTY OF ALAMEDA 1,627,865 $158,336 $167,209
Alameda 79,277 $15,364 $16,208
Albany 18,893 $4,346 $4,571
Berkeley 119,915 $22,037 $23,255
Dublin 57,349 $11,534 $12,163
Emeryville 11,721 $2,792 $2,930
Fremont 229,324 $34,687 $36,616
Hayward 158,985 $26,341 $27,802
Livermore 88,138 $17,086 $18,027
Newark 44,733 $9,331 $9,836
Oakland 422,856 $51,322 $54,186
Piedmont 11,219 $2,898 $3,041
Pleasanton 74,982 $15,035 $15,860
San Leandro 87,700 $17,538 $18,504
Union City 72,952 $14,647 $15,450
COUNTY OF CONTRA COSTA 1,123,429 $113,894 $120,271
Antioch 112,968 $20,714 $21,858
Brentwood 58,784 $11,654 $$12,289
Clayton 11,209 $2,932 3,077
Concord 129,707 $22,957 $24,227
Danville 42,865 $9,231 $9,731
El Cerrito 24,378 $5,459 $5,746
Hercules 24,791 $5,554 $5,846
Lafayette 24,924 $5,627 $5,924
Martinez 37,057 $8,005 $8,436
Moraga 16,513 $3,938 $4,140
Oakley 40,141 $8,278 $8,724
Orinda 18,749 $4,355 $4,581
Pinole 18,739 $4,420 $4,650
Pittsburg 67,817 $13,705 $14,455
Pleasant Hill 34,077 $7,379 $7,774
Richmond 110,378 $20,594 $21,731
San Pablo 30,829 $6,517 $6,864
San Ramon 78,363 $15,718 $16,582
Walnut Creek 70,018 $13,565 $14,307
PROPOSED ABAG MEMBERSHIP DUES
Base member dues increased from $737 for fiscal year 2016-17 to $759.33 as a result of the prescribed CPI adjustment of 3.03% for the 12 months ended October 31, 2016. The dues rates for each 50,000 population tier were also increased 3.03%.
Total dues for fiscal year 2017-18 have increased 5.51% as a result of a 3.03% consumer price index adjustment and a 1.85% increase in population for the nine counties served by the Association.
44 ABAG BUDGET & WORK PROGRAM
Item 7

JURISDICTION ESTIMATEDPOPULATION1/1/2016
DUES
APPROVED FY 16-17
PROPOSEDFY 17-18
COUNTY OF MARIN 262,274 $37,617 $39,711
Belvedere 2,162 $1,149 $1,195
Fairfax 7,426 $2,221 $2,327
Larkspur 12,445 $3,137 $3,295
Mill Valley 14,880 $3,544 $3,724
Novato 54,749 $11,116 $11,721
Ross 2,527 $1,222 $1,271
San Anselmo 12,867 $3,200 $3,361
San Rafael 60,582 $12,155 $12,818
Sausalito 7,217 $2,156 $2,258
Tiburon 9,503 $2,526 $2,648
COUNTY OF NAPA 142,028 $24,761 $26,132
American Canyon 20,374 $4,654 $4,897
Calistoga 5,180 $1,760 $1,840
Napa 80,576 $15,794 $16,662
St. Helena 6,004 $1,916 $2,005
Yountville 2,987 $1,324 $1,379
COUNTY AND CITY OF SAN FRANCISCO
County 866,583 $90,640 $95,711
City 866,583 $90,640 $95,711
COUNTY OF SAN MATEO 766,041 $82,281 $86,883
Atherton 7,150 $2,085 $2,183
Belmont 27,834 $5,937 $6,252
Brisbane 4,699 $1,620 $1,692
Burlingame 29,724 $6,548 $6,897
Colma 1,509 $1,025 $1,063
Daly City 109,139 $20,400 $21,527
East Palo Alto 30,545 $6,402 $6,742
Foster City 33,201 $7,034 $7,410
Half Moon Bay 12,528 $3,080 $3,234
Hillsborough 11,687 $2,957 $3,104
Menlo Park 33,863 $7,206 $7,591
Millbrae 23,136 $5,189 $5,461
Pacifica 37,806 $8,232 $8,675
Portola Valley 4,751 $1,617 $1,689
Redwood City 85,992 $16,322 $17,219
San Bruno 45,360 $9,371 $9,878
San Carlos 29,008 $6,462 $6,806
San Mateo 102,659 $19,847 $20,943
So. San Francisco 64,585 $13,440 $14,176
Woodside 5,664 $1,814 $1,897
PROPOSED ABAG MEMBERSHIP DUES
Base member dues increased from $737 for fiscal year 2016-17 to $759.33 as a result of the prescribed CPI adjustment of 3.03% for the 12 months ended October 31, 2016. The dues rates for each 50,000 population tier were also increased 3.03%.
Total dues for fiscal year 2017-18 have increased 5.51% as a result of a 3.03% consumer price index adjustment and a 1.85% increase in population for the nine counties served by the Association.
ABAG BUDGET & WORK PROGRAM 45
Item 7

JURISDICTION ESTIMATEDPOPULATION1/1/2016
DUES
APPROVED FY 16-17
PROPOSEDFY 17-18
COUNTY OF SANTA CLARA 1,927,888 $185,006 $195,377
Campbell 42,584 $8,875 $9,354
Cupertino 58,185 $12,255 $12,924
Gilroy 55,170 $11,010 $11,610
Los Altos 31,353 $6,576 $6,927
Los Altos Hills 8,658 $2,359 $2,472
Los Gatos 31,376 $6,668 $7,023
Milpitas 75,521 $14,621 $15,423
Monte Sereno 3,475 $1,408 $1,468
Morgan Hill 43,645 $8,859 $9,338
Mountain View 77,925 $15,599 $16,456
Palo Alto 68,207 $13,576 $14,320
San Jose 1,042,094 $106,085 $112,024
Santa Clara 123,752 $22,314 $23,548
Saratoga 30,219 $6,725 $7,083
Sunnyvale 148,372 $25,728 $27,154
COUNTY OF SOLANO 431,498 $53,035 $55,994
Benicia 27,501 $6,120 $6,445
Dixon 19,018 $4,462 $4,693
Fairfield 112,637 $21,168 $22,337
Rio Vista 8,601 $2,330 $2,442
Suisun City 29,091 $6,353 $6,691
Vacaville 97,667 $18,691 $19,722
Vallejo 117,322 $22,151 $23,376
COUNTY OF SONOMA 501,959 $59,064 $62,362
Cloverdale 8,825 $2,430 $2,547
Cotati 7,153 $2,165 $2,268
Healdsburg 11,699 $3,009 $3,159
Petaluma 60,375 $12,215 $12,882
Rohnert Park 42,003 $8,723 $9,194
Santa Rosa 175,667 $28,888 $30,492
Sebastopol 7,527 $2,196 $2,301
Sonoma 10,865 $2,863 $3,004
Windsor 27,031 $6,051 $6,372
TOTALS 7,649,565 $1,957,767 $2,065,639
DUES PER CAPITA RATES
First 50,000 0.194414872 0.2053333
Next 50,000 0.184182511 0.1945263
Next 100,000 0.126199127 0.1332865
Remaining Population over 200,000 0.090385861 0.0954620
Total dues for fiscal year 2017-18 have increased 5.51% as a result of a 3.03% consumer price index adjustment and a 1.85% increase in population for the nine counties served by the Association.
PROPOSED ABAG MEMBERSHIP DUES
Base member dues increased from $737 for fiscal year 2016-17 to $759.33 as a result of the prescribed CPI adjustment of 3.03% for the 12 months ended October 31, 2016. The dues rates for each 50,000 population tier were also increased 3.03%.
46 ABAG BUDGET & WORK PROGRAM
Item 7

CONTACT INFO
Brad PaulActing Executive [email protected]
Julie PierceABAG [email protected]
RESEARCH AND PLANNING
SAN FRANCISCO ESTUARY PARTNERSHIP
POWER
BayREN
ABAG PLAN
ABAG FINANCE AUTHORITY
LEGISLATIVE ACTIVITY
COMMUNICATIONS
FISCAL MANAGEMENT SERVICES
BUDGET AND DUES
ABAG BUDGET & WORK PROGRAM 47
Item 7

375 Beale Street, Suite 700San Francisco, CA 94105
415.820.7900 PHONE415.820.7970 [email protected] E-MAILwww.abag.ca.gov WEB
Item 7

DRAFT INTEGRATED REGIONAL PLANNING PROGRAM: 2017-18
1
HOUSING
KEY TASK TASK DETAILS
1. Compilation of Housing Permit Data
1a. Survey all Bay Area jurisdictions to collect data about location and affordability for all permits issued. Vet data and work with jurisdictions to gather missing data and resolve data inconsistencies.
1b. Compile permit data into a uniform region-wide database.
1c. Geocode all permits and analyze data to understand trends about permit location (relative to PDAs, TPAs, Housing Element sites, etc.), affordability, and unit types. Identify engaging ways to share analysis results.
1d. Publish RHNA Progress Report and GIS files based on compiled data.
2. Improve Permit Data Accuracy, Scope, and Ease of Collection
2a. Refine ABAG/MTC internal building data collection processes to improve data timeliness, consistency, and accuracy.
2b. Continue to work with HCD to improve data required from jurisdictions and/or transfer of data collected through APRs.
2c. Continue partnership with OpenSMC and jurisdictions to develop technical tools to improve the quality of housing data collected from local governments and the ease of reporting that data.
2d. Pursue legislative changes as needed to improve data collection processes, accuracy and scope.
3. Online Policy Directory
3a. Compile results of local jurisdiction survey about adopted policies and programs into region-wide database. Gather missing data, such as links to ordinances.
3b. Expand the display/search functionality of online directory and make information more visual. Create infographics depicting the Bay Area policy landscape.
3c. Develop online database of existing affordable housing of all types.
4. Housing Policy Toolkit
4a. Compile examples of best policies, programs, practices, model ordinances, etc. for all policies in the toolkit; display online.
4b. Develop FAQ related to Bay Area housing issues and oft-requested metrics. Identify existing policy papers and, if needed, conduct research to answer questions. Develop format for presenting information online.
This list of anticipated planning program tasks under the 2017-2018 Budget & Work Plan was compiled by ABAG senior planning staff in consultation with their counterparts at MTC. The work, however, will be carried out by the new Integrated Regional Planning Program staff that will result from the consolidation of MTC’s and ABAG’s separate planning and research teams on July 1, 2017.
The items listed below represent the best thinking of staff today as we look ahead to the coming fiscal year. As was the case with past Budget & Work Plans, individual tasks listed here could be delayed or altered, and new tasks may be added based on new information and opportunities that present themselves in 2017-2018.
Item 7, Work Plan Planning

DRAFT INTEGRATED REGIONAL PLANNING PROGRAM: 2017-18
2
HOUSING
KEY TASK TASK DETAILS
5. Technical Assistance
5a. Help jurisdictions implement State-mandated plans: SCS, Housing elements, Climate Action Plan, Local Hazard Mitigation Plan etc.
5b. Support ABAG/MTC housing initiatives, such as CASA, TOAH, NOAH, OBAG, JumpStart, etc.
5c. Continue to support sub-regional initiatives, including East Bay Corridors Initiative, Grand Boulevard Initiative, and existing and potential RHNA subregions.
5d. Work with East Bay Corridors Initiative to provide technical assistance to promote and facilitate soft-story assessments, soft-story ordinance adoption, and soft-story retrofit financing as well as the creation of local programs for permitting and financing integrated retrofits that address seismic, water, and energy upgrades and promote housing affordability.
5e. Expand consultative services to planning/housing staff and policy leaders in cities, counties and institutions who are working to advance specific ABAG-endorsed land use policies and practices.
6. Collaboration and Engagement
6a. Pro-actively engage jurisdictions’ elected officials and staff, practitioners and advocates to advance conversations that promote housing production, preservation, affordability and neighborhood stabilization.
6b. Support the efforts of the Housing Subcommittee of the Regional Planning Committee to strengthen the linkage between staff-level and policy-level actions, and between ABAG and key implementation partners, to advance regional housing goals and related legislation.
6c. With the guidance of the Regional Planning Committee Housing Subcommittee, explore incubation of a Regional Housing Trust Fund to increase resources available for housing production and preservation.
7. Legislation7a. Support legislation and regulatory reforms that enable cities and counties to advance specific
ABAG-endorsed local land-use policies and practices.
Plan for Major Future Tasks
Convene a Housing Methodology Committee (HMC) to assist ABAG in fulfilling its mandate to conduct the RHNA process.
Work with the HMC to implement the requirements of the RHNA process, per State statutes.
Item 7, Work Plan Planning

DRAFT INTEGRATED REGIONAL PLANNING PROGRAM: 2017-18
3
JOBS AND WORKFORCE
KEY TASK TASK DETAILS
1. Regional Economic Development District
1a. Complete Comprehensive Economic Development Strategy (CEDS)
1a(i). Continue presentations to development organizations and boards of supervisors, work with supervisors to adopt goals and objectives
1a(ii). Incorporate comments from general public, elected officials and agency staff into draft CEDS (to be released in 2017).
1a(iii). In conjunction with RPC Economic Strategy Committee, public partners, business partners, MTC, and other stakeholders, establish governance structure, action plan, and metrics.
1a(iv). Submit application to US Economic Development Administration for designation as the Regional Economic Development District of the Bay Area
1b. Maintain Regional Economic Development District Functions
1b(i). Technical assistance, coordinating functions, and collaborative activity towards maintaining the region’s economic strength and broadening access to opportunity; ongoing meetings with local economic and workforce development representatives to stay abreast of current economic conditions and their impacts on business and households.
2. Industrial Lands Policy and Information
2a. Define a Priority Production Area (PPA) program that will enhance the strength of sectors dependent on this space without threatening the critical path for housing production in the region
2b. Meet with key stakeholders and elected officials in the region to explain the results of the UC Berkeley industrial lands study, answer questions and obtain feedback.
3. Regional Coordination, Partnerships for Economic and Workforce Development
3a. As needed, attend meetings, provide data and technical assistance to help strengthen planning for PDAs, PCAs and PPAs and to provide assistance to communities in economic transition.
3b. Develop and maintain website tools to share regional best practices in economic and workforce development
Plan for Major Future Tasks
Develop draft criteria for designating an area a PPA
With input from jurisdictions with representative types of industrial land, develop sample language for PPA programs in different types of communities
Explore incentive programs that could be applied in PPAs to encourage development that preserves critical industrial sectors and networks and is consistent with other goals of Plan Bay Area
Item 7, Work Plan Planning

DRAFT INTEGRATED REGIONAL PLANNING PROGRAM: 2017-18
4
RESILIENCE
KEY TASK TASK DETAILS
1. Safe, Smart Growth Framework and Pilot
1a. Develop short white papers describing the five phases of the Safe, Smart Growth Framework
1b. Develop revised, more detailed guidebooks for cities and regions to guide them through a resilience-building process
1c. Partner with EPA and FEMA to fund pilot to test a process and tools that could be used throughout the western US
2. Resilient Housing
2a. Update housing loss and temporary shelter numbers from 2003 for 16 new earthquake and flood scenarios
2b. Update 2003 housing quiz to help users easily identify if their housing is fragile
2c. Develop easy-to-use online and print tools to help users easily identify fragile housing types
2d. Develop policy tools such as model ordinances, guidance, and other policy tools to implement soft story and other safer housing policies
3. Resilient Infrastructure
3a. Identify and propose for joint adoption policies by cities and water and energy utilities to overcome infrastructure-related obstacles to PDA implementation
3b. Through RPC Infrastructure Subcommittee, develop partnerships with utilities and cities to pilot projects that develop, test, and expand the capacity of utilities to serve cities after major disasters
4. Mitigation and Adaptation Plan Assistance
4a. Conduct workshops focused on implementation of resilience-building strategies developed in previous years
4b. Assist jurisdictions one-on-one or in cohorts (like EBCI) to develop tailored policy and planning tools
5. Regional Resilience Assessment
5a. Identify/research resilience actions in 5-10 additional cities
5b. Develop online dashboard to display assessment outcomes, coordinated with other existing databases and dashboards created by ABAG, MTC and other partners
6. Rockefeller 100 Resilient Cities (100RC) Partnership
6a. Develop workshops that leverage the 100RC model as well as local investments to catalyze resilience implementation in all Bay Area jurisdictions
7. Statewide policy partnerships
7a. Develop statewide resilience policy platform white paper, aligned with key partners, to advocate policy at a state level
7b. Strengthen statewide partnerships with existing partners, and build new partnerships, to support and advance state policy adoption
8. USGS Partnership8a. Conduct regional briefings and/or workshops to tell the story of a major Hayward earthquake
and its impacts on several sectors, plus how cities can respond
9. Wildland Fire Study
9a. Develop report that identifies the region’s vulnerability to wildland fire and its capacity to reduce this vulnerability
9b. Develop targeted strategies for reducing wildland fire risk
Item 7, Work Plan Planning

DRAFT INTEGRATED REGIONAL PLANNING PROGRAM: 2017-18
5
REGIONAL TRAILS AND OPEN SPACE
KEY TASK TASK DETAILS
1. Manage Bay Trail Coastal Conservancy Block Grants
1a. Manage Coastal Conservancy block grants as pass-through funds through individual contracts to local agencies for planning, design, engineering and construction of Bay Trail segments
1b. Complete Block Grants totaling $7 million
1c. Enter into new Conservancy grant contracts as available
1d. Recommend new grant awards from Bay Trail Steering Committee
2. Engage Local Agencies to Close Bay Trail Gaps
2a. Coordinate completion of Bay Trail through 9 counties, 47 cities and across 7 toll bridges
2b. Raise awareness of trail gaps with elected officials and shoreline agency staff
2c. Ensure consistency with Bay Trail Plan and Design Guidelines & Toolkit
2d. Review local shoreline development proposals and participate in local planning, climate resiliency, BCDC, CEQA/NEPA processes
2e. Partner with stakeholders and advocates on gap closures
3. Secure Outside Funding Sources for Bay Trail Construction
3a. Secure funding sources beyond Coastal Conservancy grants to close gaps
3b. Serve on San Francisco Bay Restoration Authority Advisory Committee
3c. Engage in process to develop Regional Measure 3
3d. Track statewide park bond progress
3e. Seek corporate foundations and grants
4. Strengthen Bay Trail Partnerships
4a. Meet regularly with local and state elected officials and share custom packets for districts, expand coordination with CMAs, natural resource agencies, tourism boards, health providers and youth organizations
4b. Strengthen relationships with corporate shoreline land owners
4c. Participate in Bay Area Trails Collaborative and work with other trail organizations
5. Promote Awareness of Bay Trail
5a. Promote awareness of the Bay Trail to increase use and build support for its completion with a comprehensive marketing plan, updated Bay Trail maps, website, social media sites, brochures and merchandise
5b. Participate in public events and conferences
5c. Promote, expand and secure funding for Migrations public art program and Smart Phone Audio Tours
6. Maintain and Manage Bay Trail Organizational Capacity
6a. Increase the organizational capacity of the Bay Trail Project by enhancing the effectiveness of its staff and board of directors
6d. Develop advocacy and stewardship teams focused on local area projects
7. Manage Water Trail Coastal Conservancy Block Grants
7a. Manage Coastal Conservancy block grants as pass-through funds through individual contracts to local agencies for planning, design, engineering and construction of Water Trail sites
7b. Spend down block grant totaling $1.75 million
7c. Enter into new Conservancy grant contract in September 2017
7d. Seek other sources of funding to match Conservancy grants
Item 7, Work Plan Planning

DRAFT INTEGRATED REGIONAL PLANNING PROGRAM: 2017-18
6
REGIONAL TRAILS AND OPEN SPACE
KEY TASK TASK DETAILS
8. Facilitate Water Trail Site Designation & Local Engagement
8a. Obtain formal support from local jurisdictions and assist shoreline managers of potential Water Trail sites in preparation for official site designation, review local shoreline development proposals and participate in local planning processes
9. Advance Goals of Water Trail Education, Outreach & Stewardship Program
9a. Advance the goals by updating, maintaining and distributing existing outreach tools, developing new outreach strategies and promoting the Water Trail at events and conferences
9b. Collaborate with partners to complete implementation plans and identify priority Water Trail sites
9c. Increase social media presence as primary outlets for public information
9d. Participate in public events and conferences
10. Oversight of Water Trail EIR Mitigation, Monitoring & Reporting Program
10a. Provide oversight of the mitigation, monitoring and reporting program developed as part of the Water Trail Final EIR
10b. Ensure mitigation requirements of EIR are integrated into Water Trail advancement
10c. Develop and fabricate signs with required language and custom messages
10d. Maintain Water Trail GIS database and create maps to illustrate site details
11. Manage PCA Program
11a. Manage the Priority Conservation Area designation process and the PCA OBAG grant program in partnership with MTC and the Coastal Conservancy
11b. Inform regional trail and urban greening partners of OBAG 2 funding opportunities
11c. Work with cities and regional agencies to identify, prioritize, and seek funding for a network urban greening and natural infrastructure projects
Plan for Major Future Tasks
Release call for applications for new and modified PCAs
Process new PCA designation approvals through Regional Planning Committee and Executive Board
Develop OBAG3 Grant Guidelines
Item 7, Work Plan Planning

DRAFT INTEGRATED REGIONAL PLANNING PROGRAM: 2017-18
7
COMPLETE COMMUNITIES
KEY TASK TASK DETAILS
1. PDA Planning Grants and Technical Assistance
1a. Release Call for Projects: PDA Planning Grants, Technical Assistance and Staffing Assistance
1b. Issue Grant Awards (number subject to funding availability and amount requested)
1c. Manage and complete ongoing PDA planning grants (number subject to project timeline)
1d. Monitor grant progress and report out on adopted plans and environmental reports
2. Complete Communities Guidance & PDA Designations
2a. Release draft Complete Communities/PDA Planning Manual (update to 2007 Station Area Planning Manual including PDA guidelines)
2b. Perform outreach to cities in advance of 2018-19 PDA application period.
3. Convening & Coordination
3a. Convene cities along new or expanding transit corridors and the region’s three largest cities to discuss challenges to achieving PDA Plans and identify shared priorities
3b. Convene regional agencies, infrastructure providers, and special districts to identify collaborative actions to support development in PDAs
3c. Coordinate East Bay Corridors Initiative: convene steering committee and subcommittees; complete ongoing projects (safe housing model code, EPA Brownfields and Urban Greening Grants, priority project pipeline); identify actions to support housing-related priorities identified by steering committee
3d. Participate in established forums, including county and congestion management agency planning director meetings, Grand Boulevard Initiative and Bay Area TOD Implementation Table
3e. Pursue joint funding to implement priorities of transit corridor cities and regional centers; identify actions to increase pool of available funding for infrastructure and housing in PDAs
4. Implementation and Innovation
4a. Host three Planning Innovations forums on topic prioritized by local planning staff
4b. Transform Planning Innovations website into a repository of best practices, research, successful plans, and a forum for regional discussion
4c. Partner with a city, community organizations, and design professionals to host two Placemaking events in PDAs
4d. Expand Places of the Bay Area, a web and social media platform to gather input from PDA residents on community assets and aspirations
4e. Launch interactive online guide to streamlining infill development that supports adopted PDA plans
Plan for Major Future Tasks
Release Complete Communities/PDA Planning Manual
Issue request for PDA applications
Process new PDA designation approvals through Regional Planning Committee and Executive Board
Item 7, Work Plan Planning

DRAFT INTEGRATED REGIONAL PLANNING PROGRAM: 2017-18
8
REGIONAL RESEARCH AND ANALYSIS
KEY TASK TASK DETAILS
1. Regional Forecasts and Projections
1a. Regional Forecast
1a(i). Regional Economic Forecast: Maintain and update the REMI modeling system or the equivalent to forecast output, employment, income and population and for use for impact analysis.
1a(ii). Household and Income Distribution Forecasts: Continue development of the household and income distribution models. Explore alternative model approaches.
1b. Local Area Forecast Allocation
1b(i). Urban Sim Modifications: Convene a team of Integrated Planning and Research Department (IPRD) staff to prioritize relationships to recalibrate in the Urban Sim model.
1b(ii). Land Use Zoning Policy and Pipeline Updating Process: With IPRD staff from the research and modeling teams, identify information needed to keep Urban Sim assumptions and baseline up to date, design process (questionnaire, information gathering protocol) to obtain information, set priorities on data types
1b(iii). Projections 2017: Compile data developed in UrbanSim and used in the Plan Bay Area preferred scenario by jurisdiction and census tract. Prepare a published report explaining methodology and describing general projected trends, with tables at the jurisdiction and PDA levels. Prepare an electronic data base with data broken out to the census tract or TAZ level.
2. Regional Analysis
2a. Analysis of Bay Area Conditions and Trends
2a(i). State of the Region Analysis. Updated report of key trends and conditions in the region between Plan Bay Area years.
2a(ii). Special topic analyses and updates. Short term research on timely topics as data is released. (eg. Senior Housing Choices; housing vacancy components; cost of living trends; migration trends)
2b. Analytic expertise for other planning programs and agency products
2b(i). Expertise shared with regional partners (eg. retail sales tax revenue forecasts)
2b(ii). Analytic portions of planning program initiatives (eg. metrics for the CEDS and for Resilience measures)
3. Data Services
3a. Maintain data sources
3a(i). Quarterly update of Cost of Living Series on Website
3a(ii). Demographic and Economic Data through update of Vital Signs with more detailed series maintained as related to ongoing department reports.
3a(iii). Real Estate Data—rent series as available, permit data from CHF-CIRB, price series from FHFA
3b. Develop new strategic and locally relevant data sources
3b(i). State of California Employment Data by Jurisdiction—maintain proprietary data base of California Employment Development Department records for analysis growth and location patterns within the region.
Item 7, Work Plan Planning

DRAFT INTEGRATED REGIONAL PLANNING PROGRAM: 2017-18
9
REGIONAL RESEARCH AND ANALYSIS
KEY TASK TASK DETAILS
4. Mapping Services Note: These services are critical to continuing ABAG staff support of the COG. It is likely they will be provided ultimately by a broader data services program in the IPRD. The critical functions are listed here
4a. Maintain mapping software for the use of consolidated ABAG/MTC staff.
4b. Maintain related GIS databases of regional data for staff use.
4c. Maintain map apps that provide information to staff and outside users. Specific apps include:
4c(i). PDA Showcase
4c(ii). Natural Hazards mapping
5. Contract, Collaborative and pro bono Services
5a. USGS Haywired Consulting
5a(i). Work with client and consultants to expand economic analysis of the scenario
5a(ii). REMI methodology for analyzing scenario
5a(iii). REMI analysis and report
5a(iv). With client, draft report of consultant work (tentative)
5b. Tracking business impacts following an earthquake (Napa Survey project)
5b(i). Complete conference or journal article on survey development and implementation in Napa and Oklahoma
5b(ii). Work with EERI team to modify and apply instrument as events occur
5c. Peer reviews of projects, articles and analysis
5d. Partnerships with Local Jurisdictions and Stakeholder Organizations as requested by outside groups (BACEI, State of California, journals, TBD)
5d(i). Technical and convening support to BAPDA (Bay Area Planning Director’s Association).
5d(ii). Technical assistance to local jurisdictions (access to data, explaining economic and demographic trends)
5d(iii). Engagement, presentations and discussion with local elected officials, professionals, and the general public.
6. Rockefeller 100 Resilient Cities (100RC) Partnership
6a. Develop three workshops that leverage the 100RC model as well as local investments to catalyze resilience implementation in all Bay Area jurisdictions
7. Statewide policy partnerships
7a. Develop statewide resilience policy platform white paper, aligned with key partners, to advocate policy at a state level
7b. Strengthen statewide partnerships with existing partners, and build new partnerships, to support and advance state policy adoption
8. USGS Partnership8a. Conduct regional briefings and/or workshops to tell the story of a major Hayward earthquake
and its impacts on several sectors, plus how cities can respond
Item 7, Work Plan Planning

DRAFT INTEGRATED REGIONAL PLANNING PROGRAM: 2017-18
10
REGIONAL RESEARCH AND ANALYSIS
KEY TASK TASK DETAILS
9. Wildland Fire Study
9a. Develop report that identifies the region’s vulnerability to wildland fire and its capacity to reduce this vulnerability
9b. Develop targeted strategies for reducing wildland fire risk
Plan for Major Future Tasks
Population Forecast: Update and apply the 2014 Pitkin Myers population model to validate or modify the REMI population output.
Analysis of travel survey data to better understand role of TOD in reducing GHG.
Impact analysis—application of the REMI model: Impact of unexpected events (eg. an earthquake, a sharp change in national economic trends, changing migration); Impact of major proposals (eg. a regional housing trust fund, a PPA program); Impact of ongoing programs (eg. regional trails, PDAs)
Affordable Housing Database—update existing inventory
Update Community and Housing Vulnerability data from Safe Housing, Safe Communities
Building pipeline data. As system for data collection is established, build a system for recording pipeline data annually for the region
Local Policy Survey. Reestablish the local policy survey and systematically store the information in a geocoded data base.
Item 7, Work Plan Planning

DRAFT INTEGRATED REGIONAL PLANNING PROGRAM: 2017-18
11
LOCAL ENGAGEMENT
KEY TASK TASK DETAILS
1. ABAG Delegates and Committees
1a. Support development of General Assembly to adopt ABAG Workplan and Budget (annually)
1b. Participate in ABAG Delegate Meetings in each county (semi-annually)
1c. Staff the Regional Planning Committee and its subcommittees, currently Housing, Infrastructure Resilience, and Economic Development
1d. Prepare and present decision support briefings and recommendations to ABAG Executive Board, Administrative Committee, and Legislative & Governmental Organizations Committee.
2. Subregional Agency Staff
2a. Participate in Planning Director meetings in each county (monthly)
2b. Participate in Congestion Management Agency Planning Director meetings (monthly)
2c. Participate in city managers’ association meetings in each county (monthly)
2d. Staff the steering committee of the Bay Area Planning Directors Association (BAPDA), and produce symposiums semi-annually
3. Subregional Cohorts
3a. Participate in and support Grand Boulevard Initiative, East Bay Corridors Initiative and other multi-jurisdiction initiatives focused on land-use policy development and implementation
3b. Participate in regional and sub-regional business and economic development organizations
3c. Convene forums on topics of interest to local government officials related to land-use, such as hazard resilience, Green Infrastructure (in partnership with BASMAA), housing, placemaking and economic development
4. Information & Referral
4a. Respond to incoming requests from local elected officials and staff for information and referral (daily)
4b. Maintain web-based resources as requested by local government officials: FAQs, maps, data sets, articles, links to resources; and database of local government officials (elected), executives, Planning Directors, Public Works Directors, Community Development Directors) for all cities, counties and ABAG committees
5. Staff Consolidation Opportunity
5a. Engage local agencies and stakeholder organizations in ways that maximize opportunities arising from the ABAG/MTC staff consolidation, assuring transparency and local government collaboration in work processes.
Item 7, Work Plan Planning

Blank Page

DRAFT COMMUNICATIONS AND MEMBER SERVICES: 2017-18
1
WORK PLAN
KEY TASK TASK DETAILS
1. Outreach
1.1. Plan/write/produce and manage development and distribution of print and electronic communications, (e.g. monthly newsletters, ABAG website content management, major reports). Major reports include annual ABAG Budget and Work Program and reports authored by LCPs. Edit a range of agency documents for grammar, consistency, and layout.
1.2. As needed, manage and conduct ABAG annual awards program. Primary contact person for entrants, judges, videographer, and award winners.
1.3. Provide selected event planning and management services for variety of ABAG conferences/events.
1.4. Manage other outreach campaigns and events such as Bay Trail’s 25th Anniversary activities and the Local Government Health and Wellness Forum.
1.5. Work with ABAG president, senior consolidated staff, and other internal clients as needed.
2. Media Relations
2.1. Write and distribute ABAG press releases on variety of subjects. Contact reporters to follow-up.
2.2. Develop op-eds on a variety of key ABAG initiatives.
2.3. Serve as primary contact for various media, providing background info on various ABAG activities.
2.4. Coordinate between media and subject matter experts to arrange in-depth interviews.
2.5. Monitor media coverage and develop ABAG News Report.
3. General Assembly
3.1. Take lead in managing all aspects of ABAG General Assembly(ies) for Bay Area elected officials.
3.2. Write scripts for ABAG President.
3.3. Provide day-of event management.
3.4. Develop conference agenda.
3.5. Identify, confirm, and coordinate presentations from speakers – both elected officials and subject matter experts.
3.6. Create and manage attendee outreach effort, both on-line and hard copy.
3.7. Manage registration process
3.8. Provide venue research, AV, and catering selection
In recent years, ABAG’s communications and member services work has been done by Leah Zippert, Halimah Anderson, and Edna Yeh. Together they have informed and engaged ABAG’s membership, local elected officials, local government staff and the general public regarding ABAG’s programs and services related to land use, the environment, resilience, risk management, energy efficiency etc.
As we transition to a single consolidated staff, they will be under MTC’s Deputy Executive Director, Alix Bockelman, working within the Legislation and Public Affairs department directed by Randy Rentschler. They’ll continue doing the work necessary to keep the Bay Area’s cities, towns and counties engaged in ABAG’s work. Staff consolidation also gives ABAG access to MTC’s excellent graphics and legislative advocacy staff. Leah, Halimah, and Edna will continue to play a role in carrying out the following tasks:
Item 7, Work Plan Communications

DRAFT COMMUNICATIONS AND MEMBER SERVICES: 2017-18
2
WORK PLAN
KEY TASK TASK DETAILS
4. County Delegate Meetings
4.1. Set up series of meetings in each county for delegates and alternates to ABAG’s General Assembly. These smaller scale meetings create increase participation in ABAG activities.
4.2. Work with ABAG Board members/delegates by county to set logistics and issue invitations.
4.3. Develop agenda in coordination with participating ABAG Board members and planning staff.
4.4. Develop powerpoints targeted for each county.
4.5. Conduct meetings and follow up with answers to questions following delegate meetings.
5. Legislative Activities
5.1. Develop legislative priorities for committee review and examine ways to more effectively coordinate the ABAG and MTC legislative advocacy and legislative committee work
5.2. Research background information and analysis on bills of interest to ABAG committees
5.3. Develop and maintain legislation summary and status of bills tracked by ABAG
5.4. Produce Legislative Committee Meeting packet materials and agenda for ABAG
5.5. Develop letters of support or opposition following action by ABAG
5.6. Working with consolidated staff, present legislation to ABAG committee members
5.7. Develop meeting summary and maintain committee legislative information on ABAG website
5.8. Manage annual legislative workshop and reception in Sacramento
Item 7, Work Plan Communications

DRAFT COMMUNICATIONS AND MEMBER SERVICES: 2017-18
3
WORK PLAN
KEY TASK TASK DETAILS
6. Website
6.1. Design, program, and maintain a variety of websites for ABAG and affiliated organizations (see list below), using the skills listed below.
6.2. Front end development: User interface design, Responsive design, HTML, CSS, Javascript, jQuery, search engine optimization, WordPress, Photoshop
6.3. Back end development (LAMP stack plus others): Linux, Apache, Perl, CGI scripting, PHP, MySQL, Postgres
6.4. Update website content provided by various departments, LCPs and outside agencies including:
6.4.1. abag.ca.gov (daily to weekly maintenance/updates for: PLAN, FAN, Planning, POWER, web store)
6.4.2. bapda.net (designed and coded new site in 2016; periodic maintenance)
6.4.3. bayareaenergyupgrade.org (from previous version hosted by consultants; monthly maintenance)
6.4.4. bayarearegionalcollaborative.org (periodic maintenance)
6.4.5. bayren.org (from previous version hosted by outside consultants; monthly maintenance)
6.4.6. baytrail.org (periodic maintenance, provide support to WordPress users)
6.4.7. ecowisecertified.org (periodic maintenance)
6.4.8. sfbayrestore.org (weekly maintenance; 2018 budgeted for complete redesign)
6.4.9. sfbaywatertrail.org (2017 in process of migrating to our servers)
6.4.10. sewersmart.org (periodic maintenance).
6.5. Website Tasks
6.5.1. Design new web pages for various departments, making decisions on how to organize and display the provided content to maximize the user experience.
6.5.2. Design and maintain databases to provide content for web pages.
6.5.3. Create secure online registration forms for conferences and workshops, connecting the forms to both our database server and our secure online payment system.
6.5.4. Maintain and provide Google Analytics data to users as requested.
6.5.5. Troubleshoot server for outside clients and internal users, assist with server upgrades/ maintenance.
6.5.6. Maintain our online hosting account, keeping track of when domains and other services are in need of renewal, then communicate with the relevant departments to ensure that the services are renewed as needed, with the charges billed to the correct accounts.
6.5.7. Maintain certificates for our secure servers, ensure they’re renewed regularly and correctly installed.
6.5.8. Maintain ABAG’s online calendar.
6.5.9. Assist with troubleshooting software issues, including ABAG’s proprietary minutes & agendas posting program.
Item 7, Work Plan Communications

Blank Page

AS S O C I A T I O N O F B A Y AR E A GO V E R N M E N T S Representing City and County Governments of the San Francisco Bay Area
Date: May 12, 2017 To: ABAG Executive Board
Finance & Personnel Committee From: Courtney Ruby
Director of Finance and Administrative Services Subject: Budget and Work Plan and Financial considerations regarding the Staff
Consolidation This memo provides a brief budget overview and addresses questions raised at the April 20th Executive Board meeting related to the draft 2017-18 ABAG Budget and Work Plan (B&WP). The proposed budget includes an increase in both revenues and expenses of 22% over the 2016-17 Adopted Budget of $58.2 million to $71.1 million in the 2017-18 Proposed Budget. The overall percentage by funding source has remained relatively constant as the following table illustrates:
ADOPTED PROPOSED ADOPTED PROPOSED
FY 16-17 FY 17-18 FY 16-17 FY 17-18
Federal 6,387,059 8,732,955 10.97% 12.28%
State 42,729,572 53,446,623 73.39% 75.14%
Other Contracts 2,600,317 2,846,651 4.47% 4.00%
Service Programs 4,545,000 4,033,648 7.81% 5.67%
Membership Dues 1,957,767 2,065,639 3.36% 2.90%
Total Revenues 58,219,715 71,125,516
Percentage of Total Budget
Item 7, Memo Financial Considerations

Budget and Work Plan and Financial considerations regarding the Staff Consolidation May 12, 2017 Page 2 Revenues The $12.9 million budget increase from FY 2016-17 to FY 2017-18 is mainly attributed to the success of the SFEP and BayREN programs. In this years’ budget these programs are expected to receive approximately $12.6 million in increased funding from the EPA, CalTrans, CA Department of Water Resources and the CA Public Utilities Commission. The budget includes a corresponding increase in consultant services expenses, as illustrated in the table below, representing additional dollars that will flow directly through SFEP and BayREN to consultants who will perform various program and project tasks. In response to questions raised at the April 20th Executive Board meeting regarding consultant expenses, a list of consultant/contractor expenses by program are provided as an attachment to this memo. The budget includes funding from MTC of $4.8 million and is highlighted on page 42 of the B&WP. $3.3 million represents funding that MTC has historically provided to fund planning activities and $1.5 million represents costs directly attributed to the staff consolidation. Of the $1.5 million, $727,000 are additional costs related to the staff consolidation and $791,000 is a subsidy from MTC to cover SFEP’s overhead cost. In order for SFEP to be both competitive and comprehensive in its work, it must maintain a low administrative cost burden. Under ABAG’s model, SFEP was not charged an indirect overhead rate because the State Water Board provided SFEP with office space, equipment and IT support. Historically these costs were absorbed in the Agency’s indirect rate and charged to the remaining programs. With the consolidation, SFEP will be moving to San Francisco and charged overhead accordingly, however these overhead charges will then be subsidized by MTC as part of the consolidation. ABAG’s EPA approved indirect overhead rate is 46.15, for budget purposes MTC calculated a consolidated indirect rate of 45.8%.
Expenses Salary and benefits expenses as illustrated in the table above is almost equal to the previous year although this budget was developed with assumptions different than the prior year. This proposed budget assumes 60 current ABAG positions will transition to the consolidated staff (57
ADOPTED PROPOSED $ %
FY 16-17 FY 17-18 Variance Variance
Salaries & Benefits 11,828,400 11,840,899 12,499 0%
Consultant Services 28,249,460 41,950,448 13,700,988 48%
Passthrough 15,761,546 15,208,973 (552,573) -4%
Total other Direct/Indirect Costs 2,330,309 2,125,196 (205,113) -9%
Total Expenses 58,169,715 71,125,516
Item 7, Memo Financial Considerations

Budget and Work Plan and Financial considerations regarding the Staff Consolidation May 12, 2017 Page 3 filled, 3 vacant). The previous budget had approximately 71 positions (67 filled, 4 vacant). It assumes all represented staff transition and receive at least a 7% salary increase to compensate for benefit differences between ABAG and MTC (65% of the proposed offers exceed 7%). A salary reserve of $700,000 has been included to address the difference in budget methods between ABAG and MTC. ABAG budgets actual salaries and MTC budgets top of range salaries. The increased personnel cost were offset through reductions in executive and management staff and attrition (11 filled or vacant positions eliminated from prior budget). The budget assumes consolidated staff has the capacity and skills to meet the shared operational needs of ABAG and MTC. Unfunded Pension Liabilities ABAG employees will become MTC employees on July 1st and as such, MTC will become responsible for their pension costs going forward. ABAG, however, remains liable for ABAG’s current unfunded pension liabilities. This budget includes our required CalPERS payment of $1.3 million for unfunded liabilities. It should be noted that CalPERS discount rate will be dropped from 7.5% to 7% and this will increase ABAG’s unfunded pension above the 2018-19 projected payment of $1.4 million. Summary The 2017-18 budget represents the current level of service provided to our members and federal, state and local funding partners and stakeholders. Going forward I would anticipate ABAG to maintain this current budget level with the addition of one important revenue source –revenue from the proposed new conduit financing JPA. These funds will help to ensure security to our retirees and provide opportunities to expand the programs and services ABAG offers in the future. Balance Sheet Your board packet includes both the audited financial statements as of June 30, 2016 and the current financial statements as of March 31, 2017 as requested and the accompanying staff reports. The one item that you will not see in these reports is the current status of our condominium exchange. On May 10, 2017 we closed on the exchange transaction and successfully transferred ABAG’s condominium interest in 101 Eighth Street, Oakland for a condominium interest in 375 Beale Street, San Francisco. This exchange will be recorded on ABAG’s book at the exchange value of $5.8 million for accounting purposes. Other than the building, it is important to note that ABAG has approximately $1.5 million in unrestricted operating reserves and $1.6 million in restricted operating reserves.
Item 7, Memo Financial Considerations

Budget and Work Plan and Financial considerations regarding the Staff Consolidation May 12, 2017 Page 4 Additional information and attachments in response to EB’s April 20th Request The Executive Board asked for additional information on the amount budgeted to support committee activities in addition to staff time.
Attachments
1. ABAG’s audited financial statements and staff report; 2. ABAG’s current financial report as of March 2017 and staff report; 3. A list of consultant expenses by program; 4. A list of FTE’s by program; 5. A memo describing RPC’s concerns/comments and staff responses.
Description
SFEP 12,500 Per diem
SF Bay Restoration 5,000 Advisory Committee expenses
Financial Services 2,732 Per diem
PLAN 7,500 Board and Committee expenses
Agency Management 80,000 Per diem
Total 107,732
2017-18 Budgeted Committee Expenses
Item 7, Memo Financial Considerations

AS S O C I A T I O N O F B A Y AR E A GO V E R N M E N T S Representing City and County Governments of the San Francisco Bay Area
Date: May 11, 2017 To: ABAG Executive Board
ABAG Finance and Personnel Committee From: Courtney Ruby
Finance and Administrative Services Director Subject: Audited Financial Reports—June 2016 Audited Financial Reports – June 2016 Our independent auditors, Maze & Associates issued an unqualified opinion on the ABAG financial statements. ABAG’s financial statements present fairly, in all material respects, the financial position of ABAG at June 30, 2016 and the financial transactions for the fiscal year July 1, 2015 through June 30, 2016. Financial highlights of the year include the following: The Association’s Total Assets were $38.75 million at June 30, 2016. At June 30, 2015,
Total Assets were $18.25 million. Total Assets include Cash and Cash Equivalents of $7.67 million (down $822 thousand from the prior year), Federal, State and Local Grants Receivables of $29.69 million (up $21.26 million), Interest Receivables of $3 thousand (up $1 thousand), Prepaid Expenses and Other of $331 thousand (up $207 thousand) and Capital Assets net of Accumulated Depreciation of $1.06 million (down $145 thousand). Capital Assets include $800 thousand in tenant improvements to ABAG’s condominium at 375 Beale Street, funded by the Metropolitan Transportation Commission (MTC) as part of the exchange agreement between ABAG and Bay Area Headquarters Authority (BAHA). The increase of $20.50 million in Total Assets is due primarily to the increase in pass-through grants receivable for the BayREN energy conservation rebate program and the San Francisco Estuary Partnership’s integrated regional water management program.
The Association’s Total Liabilities were $47.1 million at June 30, 2016. At June 30, 2015,
Total Liabilities were $25.1 million. Total Liabilities include Accounts Payable of $26.5 million (up $20.4 million from the prior year), Unearned Revenue of $6.2 million (up $.2 million) and Net Pension Liability of $13 million (up $1.6 million). The increase of $22 million in Total Liabilities is due primarily to the increase in the pension liability and the pass-through grants for the BayREN energy conservation rebate program and the San Francisco Estuary Partnership’s integrated regional water management program.
Item 7, Attachment 1A

Audited Financial Reports—June 2016 May 11, 2017 Page 2
The Association’s total program revenues were $56.61 million in FY 2016, while total program expenses were $58.47 million. This imbalance ($1.86 million) is offset by $1.90 million in Membership Dues, $158 thousand in unrestricted donations, and $16 thousand in interest income, all recorded as General Revenues totaling to $2.07 million. This yielded an improvement in net position of $207 thousand. The Association’s total net position at June 30, 2016 was a deficit of $7.51 million. The Association’s total net position in the previous fiscal year ended June 30, 2015 was a deficit of $7.71 million.
In compliance with GASB 68, beginning with the June 30, 2015 audited financial
statements, we have recorded the ABAG accumulated unfunded pension obligation as a liability and reduction of fund equity. This Collective Net Pension Liability is $12,998,297 as of June 30, 2016. For internal financial statement purposes, we elect to separately track the fund equity for the pension obligation and operations. Thus, the fund equity for pension obligations is a negative $12.3 million ($11.36 million in 2015), and the accumulated fund equity from operations is a positive $2.8 million ($2.9 million in 2015) and restricted fund equity of $1.6 million consists of capital, self-insurance, building maintenance resulting in a net position of negative $7.86 million identified in the Association only column in the attached audited statement of net position.
ABAG program operating revenues for FY 2016 were $56.59 million, including $10.12
million pass-through funds for vendors and rebate recipients. There were no operating revenues for ABAG Finance Corporation, and BALANCE Foundation operating revenues were $17 thousand.
ABAG program operating expenses for FY 2016 were $58.36 million, including pass-
through expenditures of $10.12 million and consultant services of $35.54 million. ABAG Finance Corporation operating expenses were $4 thousand and BALANCE Foundation operating expenses were $105 thousand.
The San Francisco Bay Restoration Authority received a $38 thousand grant and spent
$46 thousand for consultant services. The Authority ended the year with a net position of $2 thousand.
Single Audit The auditors reported no findings of questioned costs or failures of ABAG to comply with federal regulations that might result in a disallowance of significant costs claimed on federal grants. Memorandum on Internal Controls The auditors did not identify any deficiencies in internal controls that they considered to be material weaknesses. However, material weaknesses could exist that have not been identified. A financial statement audit includes consideration of internal controls over financial reporting for the purpose of expressing an opinion on the financial statements but is not for the purpose of expressing an opinion on the effectiveness of an entity’s internal controls. I may be reached directly at (415) 820-7923 should you have any questions regarding the audited financial reports.
Item 7, Attachment 1A

ASSOCIATION OF BAY AREA GOVERNMENTS
BASIC FINANCIAL STATEMENTS FOR THE YEAR ENDED JUNE 30, 2016
Item 7, Attachment 1B

This Page Left Intentionally Blank
Item 7, Attachment 1B

ASSOCIATION OF BAY AREA GOVERNMENTS BASIC FINANCIAL STATEMENTS
For the Year Ended June 30, 2016
Table of Contents
. •' .
INTRODUCTORY SECTION:
Table of Contents .............................................................................................................................. i
FINANCIAL SECTION:
Independent Auditor's Report .............................. .................................................................. . .... 1
Management's Discussion and Analysis . . ...... .................. .................................. .......................... 3
Basic Financial Statements
Statement ofNet Position ............................ .................................................................... . . . 21
Statement of Activities .......................................................................... . . . ..................... ...... 22
Statement of Cash Flows ..................................................................................................... 23
Notes to Basic Financial Statements ................. ............................................... ................... 25
Required Supplemental Information
Cost-Sharing Defined Benefit Pension Plan - Schedule of Changes in the Net Pension Liability and Related Ratios ....................................................................... ......................... 49
Cost-Sharing Defined Benefit Pension Plan - Schedule of Contributions .. . . . . . . . . . . . . . . . .50
Other Post Employment Benefits - Schedule of Funding Contributions . . . . . ·: . . . . . . . . . . . . 51
Item 7, Attachment 1B

This Page Left Intentionally Blank
Item 7, Attachment 1B

INDEPENDENT AUDITOR'S REPORT
The Executive Board Association of Bay Area Governments San Francisco, California
Report on the Financial Statements
M MAZE &ASSOCIATES
We have audited the accompanying financial statements of the business-type activities, the aggregate discretely presented component unit and each major fund, of the Association of Bay Area Governments (Association), as of and for the year ended June 3 0, 20 16 and the related notes to the financial statements, which collectively comprise the Association's basic financial statements as listed in the Table of Contents .
Management's Responsibility for the Financial Statements
Management is responsible for the preparation and fair presentation of these financial statements in accordance with accounting principles generally accepted in the United States of America; this includes the design, implementation, and maintenance of internal control relevant to the preparation and fair presentation of the financial statements that are free from material misstatement, whether due to fraud or error.
Auditor's Responsibility
Our responsibility is to express opinions on these financial statements based on our audit. We conducted our audit in accordance with auditing standards generally accepted in the United States
. of America and the standards applicable to financial audits contained in Government Auditing Standards, issued by the Comptroller General of the United States. Those standards require that we plan and perform the audit to obtain reasonable assurance about whether the financial statements are free from material misstatement.
An audit involves performing procedures to obtain audit evidence about the amounts and disclosures in the financial statements. The procedures selected depend on the auditor' s judgment, including the assessment of the risks of material misstatement of the financial statements, whether due to fraud or error. In making those risk assessments, the auditor considers internal control relevant to the Association's preparation and fair presentation of the financial statements in order to design audit procedures that are appropriate in the circumstances, but not for the purpose of expressing an opinion on the effectiveness of the Association' s internal control. Accordingly, we express no such opinion. An audit also includes evaluating the appropriateness of accounting policies used and the reasonableness of significant accounting estimates made by management, as well as evaluating the overall presentation of the financial statements.
We believe that the audit evidence we have obtained is sufficient and appropriate to provide a basis for our audit opinions.
Accountancy Corporation 3478 Buskirk Avenue, Suite 215 Pleasant Hill, CA 94523
T 925.930.0902 F 925.930.0135 E [email protected] w mazeassociates.com
Item 7, Attachment 1B

Opinions
In our opinion, the financial statements referred to above present fairly, in all material respects, the respective financial position of the business-type activities, the aggregate discretely presented component unit and each major fund of the Association as of June 30, 2016 and the respective changes in financial position and, where applicable, cash flows thereof for the year then ended in accordance with accounting principles generally accepted in the United States of America.
Other Matters
Required Supplementary Information
Accounting principles generally accepted in the United States of America require that the Management's Discussion and Analysis and other required supplementary information as listed in the Table of Contents be presented to supplement the basic financial statements. Such information, although not a part of the basic financial statements, is required by the Governmental Accounting Standards Board, who considers it to be an essential part of financial reporting for placing the basic financial statements in an appropriate operational, economic or historical context. We have applied certain limited procedures to the required supplementary information in accordance with auditing standards generally accepted in the United States of America, which consisted of inquiries of management about the methods of preparing the information and comparing the information for consistency with management's responses to our inquiries, the basic financial statements, and other knowledge we obtained during our audit of the basic fmancial statements. We do not express an opinion or provide any assurance on the information because the limited procedures do not provide us with sufficient evidence to express an opinion or provide any assurance.
Other Reporting Required by Government Auditing Standards
In accordance with Government Auditing Standards, we have also issued our report dated February 1 0, 20 1 7, on our consideration of the Association's internal control over financial reporting and on our tests of its compliance with certain provisions of laws, regulations, contracts, and grant agreements and other matters. The purpose of that report is to describe the scope of our testing of internal control over fmancial reporting and compliance and the results of that testing, and not to provide an opinion on internal control over financial reporting or on compliance. That report is an integral part of an audit performed in accordance with Government Auditing Standards in considering the Association's internal control over fmancial reporting and compliance.
Pleasant Hill, California February 1 0, 2017
2
Item 7, Attachment 1B

MANAGEMENT'S DISCUSSION AND ANALYSIS
The Association of Bay Area Governments (Association) has issued the financial reports for fiscal year ending June 30, 201 6 based on the provisions of the Government Accounting Standards Board Statement 34, "Basic Financial Statement and Management's Discussion & Analysis-for State and Local Governments," (GASB 34).
The Association adopted Government Accounting Standards Board Statement 68 "Accounting and Reporting for Pensions" (GASB 68) beginning with the financial statements for the. year ended June 30, 201 5. GASB 68 requires recognition on the Statement of Net Position of the cumulative unfunded pension liability and recognition of related expense in the Statement of Activities. As a result, the Association carries deficit net position at June 30, 201 6.
This discussion and analysis provides an overview of financial activities in the fiscal year and it should be read in conjunction with the accompanying financial statements.
BASIC FINANCIAL STATEMENTS
The Basic Financial Statements include:
1 . Statement of Net Position-provides information about the financial position of the Association, including assets, liabilities and net position. The difference between this statement and the traditional Balance Sheet is that net position (fund equity) is shown as the difference between total assets and total liabilities. An addition to this statement in 201 5 is the presentation of deferred outflows and deferred inflows - "deferrals." Deferrals from the adoption of GASB 65 ("Items Previously Reported as Assets and Liabilities") are defined as outflows and inflows of resources that have already taken place but are not recognized as revenues and expenditures because they relate to a future period.
2. Statement of Activities-presents revenues, expenses and changes in net position for the fiscal year. It differs with the traditional Statement of Revenues and Expenses in that revenues and expenses directly attributable to operating programs are presented separately from investment income and financing costs.
3. Statement of Cash Flows-provides itemized categories of cash flows. This statement differs from the traditional Statement of Cash Flows in that it presents itemized categories of cash inflows and outflows instead of computing the net cash flows from operation by backing out non-cash revenues and expenses from net operating surplus/deficit. In addition, cash flows related to investments and financing activities are presented separately.
3
Item 7, Attachment 1B

The Basic Financial Statements above provide information about the financial activities of the Association's three programs-ABAG, ABAG Finance Corporation and BALANCE Foundation, each in a separate column. Also presented is the San Francisco Bay Restoration Authority as a "discretely presented component unit."
FISCAL YEAR 2016 FINANCIAL HIGHLIGHTS
Financial highlights of the year include the following:
• The Association's Total Assets were $38.75 million at June 3 0, 20 1 6. At June 30, 20 1 5, Total Assets were $1 8.25 million. Total Assets include Cash and Cash Equivalents of $7 .67 million (down $822 thousand from the prior year), Federal, State and Local Grants Receivables of $29.69 million (up $2 1 .26 million), Interest Receivables of $3 thousand (up $1 thousand), Prepaid Expenses and Other of $331 thousand (up $207 thousand) and Capital Assets net of Accumulated Depreciation of $1.06 million (down $145 thousand). Capital Assets include $800 thousand in tenant improvements to ABAG' s condominium at 375 Beale Street, funded by the Metropolitan Transportation Commission (MTC) as part of the exchange agreement between ABAG and Bay Area Headquarters Authority (BAHA). The increase of $20.50 million in Total Assets is due primarily to the increase in passthrough grants receivable for the BayREN energy conservation rebate program and the San Francisco Estuary Partnership's integrated regional water management program.
• The Association's total program revenues were $56.61 million in FY 2016, while total program expenses were $58.47 million. This imbalance ($1 .86 million) is offset by $1 .90 million in Membership Dues, $1 58 thousand in unrestricted donations, and $16 thousand in interest income, all recorded as General Revenues totaling to $2.07 million. This yielded an improvement in net position of $207 thousand. The Association's total net position at June 30, 201 6 was a deficit of $7.5 1 million.
• ABAG program operating revenues for FY 201 6 were $56.59 million, including $1 0 . 1 2 million pass-through funds for vendors and rebate recipients. There were no operating revenues for ABAG Finance Corporation, and BALANCE Foundation operating revenues were $1 7 thousand.
• ABAG program operating expenses for FY 20 1 6 were $58.36 million, including passthrough expenditures of $10.12 million and consultant services of $35.54 million. ABAG Finance Corporation operating expenses were $4 thousand and BALANCE Foundation operating expenses were $105 thousand.
• The San Francisco Bay Restoration Authority received a $38 thousand grant and spent $46 thousand for consultant services. The Authority ended the year with a net position of $2 thousand.
4
Item 7, Attachment 1B

NONCURRENT ASSETS
At June 30, 20 1 6, the Association had noncurrent asset of $1.06 million. Depreciable Capital Assets, net of accumulated depreciation were $262 thousand, a decrease of $145 thousand from the prior year. Additions to depreciable capital assets were $21 thousand and depreciation for the year was $ 1 66 thousand. Further details of the Association's capital assets are presented in Note 3 to the financial statements.
DEBT ADMINISTRATION
The Association's long term obligation was decreased by a payment of $73 thousand toward the $367 thousand owed for the office improvement project at the beginning of the year. This left a balance of $294 thousand for the office improvement project, of which $78 thousand is classified as the current portion, payable within the next fiscal year. There was no new debt incurred. Further detail of the Association's long term obligation is presented in Note 4 to the financial statements.
ORGANIZATIONAL CHANGES
On May 25, 20 1 6, the governing bodies of ABAG and MTC voted to support a full functional staff consolidation and the pursuit of new governance options. This resolution retains the independence and statutory responsibilities of both boards and calls for new governance options to be considered by ABAG and MTC over the longer term. In the near term, both ABAG and MTC are developing a Contract for Services to officially consolidate the two staffs under the MTC executive director and to continue funding ABAG's projects and activities. Under the Contract of Services the organization and the financial structure of ABAG will not significantly change and ABAG will continue to exist as a separate entity.
MAJOR PROGRAM INITIATIVES IN FY 2016 AND OUTLOOK FOR FY 2017
We are happy to report the following accomplishments in fiscal year 20 16 and goals for fiscal year 20 1 7:
PLANNING AND RESEARCH PROGRAMS
Over the last five decades, ABAG has steadily strengthened its practices as a leader of collaborative regional land use planning, by expanding our range of partners and extending the breadth and depth of topics that influence local and regional land use decisions, the Planning and Research Department continues to address sustainability, equity and resilience in the region. In 201 6 we continued the update of Plan Bay Area 2017, including the development of land use scenarios and an implementation action plan.
5
Item 7, Attachment 1B

ABAG continued to champion inclusion of two additional priorities for Plan Bay Area, resilience and economic development. On the resilience front, federal and foundation funding helped us to assist local jurisdictions develop local hazard mitigation plans. On the economic development front, we continued to consolidate a consensus about regional priorities in collaboration with economic development organizations.
Working closely with local jurisdictions, Congestion Management Agencies (CMAs), and MTC, ABAG provided planning assistance, research support, and institutional coordination for the implementation of Priority Development Area (PD As), enhancement of open space and regional trails, housing production, and economic development.
ABAG continued to support efforts to retain and enhance the qualities of our natural environment and agricultural lands through the Priority Conservation Areas (PC As), the San Francisco Bay Trail, the San Francisco Bay Area Water Trail, and the successful passage of Measure AA.
ABAG produced People, Places, Prosperity to provide context for the regional dialogue that is part of the development of Plan Bay Area 2040. This report highlights the activities ABAG has undertaken in partnership with local governments, regional agencies, business groups, community organizations and other stakeholders to advance implementation of a land use pattern in the Bay Area that will promote regional economic vitality, increase housing choices and affordability, build healthy and resilient communities, and protect and enhance the regional natural assets. People, Places, Prosperity provides a comprehensive look at the ways in which economic, housing and environmental issues relate to one another and how they are currently affecting local communities and the region as a whole.
Priority Development Area Implementation
ABAG staff will continue to work with Bay Area jurisdictions to develop and implement PDA plans, develop and distribute tools to increase feasibility of growth consistent with local visions, and integrate housing, resilience, economic development, and urban greening into the PDA program. PDAs are the organizing framework for Plan Bay Area 2040 implementation and are expected to accommodate most of the Bay Area's new homes and jobs. The Plan's major investments in planning assistance and transportation projects are focused in the PDAs, but significant obstacles remain to achieving planned growth. These obstacles include lower-thananticipated public and private investment, displacement pressure on current residents and businesses, declining middle-wage jobs, and the risk of natural hazards. Continuing the work of 201 6 into 20 1 7, ABAG staff will continue to:
• Provide technical assistance and administrative oversight for each PDA planning grant
made to a local jurisdiction. These grants support the development and adoption of
specific plans that create walkable, mixed-use communities close to transit.
• Obtain funding to support planning and capital projects that address specific PDA
implementation obstacles not addressed through existing programs.
6
Item 7, Attachment 1B

• Provide technical assistance to help local jurisdictions take advantage of State legislation
that increases the efficiency of the development entitlement process for projects within
PD As.
• Launch a website to help local staff and developers identify PDA projects eligible for
entitlement efficiency and utilize these provisions to create development consistent with
local plans.
• Build on its Placemaking in the Bay Area report to provide best practices and targeted
technical assistance to help member jurisdictions create successful places that are lively
and inclusive, economically vital, and capitalize on community assets.
• Work to address common challenges with corridor jurisdictions, CMAs, transit agencies,
and other partners, especially through the Grand Boulevard Initiative in the west bay and
the East Bay Corridors Initiative. Working groups will focus on implementing or
developing funding for green streets implementation, seis:rnic safety retrofits of older
apartment buildings, public placemaking, and the development of pipeline housing and
infrastructure projects.
Housing Production and Affordability
ABAG continued to support new funding source development for affordable housing and to remove obstacles to jurisdictions' implementation of local infill development objectives.
ABAG staff will continue to work with MTC to use existing resources to incentivize and support infill housing production, and continue to identify and publicize replicable local effective practices that address economic displacement due to new development.
Staff will also continue to collect and make publically available information about local jurisdictions' progress toward housing production targets, particularly affordably-priced housing; as well as adoption of local housing policies that affect production, preservation and residency protections.
Economic Development
Based on the regional economic development framework developed in 201 4-20 1 5, ABAG staff continued to work on establishing a regional Economic Development District (EDP) as well as an accompanying Comprehensive Economic Development Strategy (CEDS). The purpose of the EDD will be to strengthen the competitiveness of the regional economy, enhance local business districts in PDAs, support the vitality of industrial districts, preserve and increase the number of middle-wage jobs and expand access to job opportunities for all Bay Area residents. In addition to meeting these goals of economic vitality, the CEDS analysis also addresses interlinkages between environmental and equity goals of Plan Bay Area and economic vitality. The CEDS is produced under oversight of an Economic Strategy Committee with representation from local jurisdictions, and local and subregional economic and workforce development organizations.
7
Item 7, Attachment 1B

ABAG and MTC have sponsored an inventory of industrial land in the region, which has led to the recommendation of adding Priority Production Areas as a possible tool for considering the preservation of critical industrial space where in-fill development is occurring. Industrial land and goods movement is an economic development initiative that will continue in 20 1 7/20 1 8. MTC has sponsored a series of studies on goods movement, the most recent of which looked at goods movement needs beyond the 9-county bay area.
Resilience
ABAG's Resilience Program helps local jurisdictions build communities that can prosper and thrive in the face of ongoing natural stressors and unexpected shocks. The program's primary concerns are the vulnerability of the region's housing stock to earthquakes and flooding, the vulnerability of interconnected infrastructure systems which support the region's economy, and the importance of collaborative regional resilience planning. ABAG's work priorities are:
• Launching a Regional Lifelines Council to improve coordination and collaboration among local jurisdictions to address natural hazard threats to utility service continuitythreats to water, power, communications, and sanitation from earthquakes, fires, drought and sea level rise.
• Supporting member cities and counties in developing innovative local resilience plans that meet the requirements of a local hazard mitigation plan and are coordinated with other local plans.
• Introducing resilience perspectives, adaptive climate action, social justice measures, and disaster mitigation into the 20 1 7 Plan Bay Area.
• Fostering a resilience community in the Bay Area that identifies and develops local champions who have the opportunity to connect with and learn from one another, and have the tools to carry resilience work forward locally and regionally.
• Providing in-depth assistance to help member jurisdictions overcome the barriers of limited resources and technical expertise by developing resilience implementation tools and guidance and technical assistance. ABAG staff will continue to partner closely with the San Francisco Bay Conservation and Development Commission (BCDC) in developing mutually beneficial shoreline flooding and earthquake strategies.
• Continuing to support cities in the East Bay Corridor Initiative with technical and policy assistance on soft-story retrofit ordinances. Implementation programs to create safer housing for residents will serve as model practice in other Bay Area communities.
• Promoting the adoption of consensus regional resilience strategies emanating from ABAG's LP25 symposium in partnership with member cities and counties and key regional and state stakeholders.
8
Item 7, Attachment 1B

Bay Trail/Water Trail, Open Space and Farmland Preservation
Regional planning strategies can help protect and maintain our natural habitat, water resources, agricultural land, and open space.
San Francisco Bay Trail & San Francisco Bay Area Water Trail
The San Francisco Bay Trail, now in its 27th year, is based on a visionary plan for a shared-use bicycle and pedestrian path along the shoreline that will one day allow continuous travel around San Francisco Bay. The trail extends over 500 miles to link the shoreline of nine counties, passing through 47 cities and crossing seven toll bridges. Thus far 350 miles have been completed and are in use. ABAG administers the project and provides regional leadership for its completion.
The San Francisco Bay Area Water Trail is a network of landing and launch sites for nonmotorized small boats. Twenty nine sites have now been officially designated as part of the Water Trail system, with a potential for over 1 00 sites. ABAG plays a critical role in implementing this regional trail in partnership with BCDC, the California Division of Boating and Waterways and the primary funder, the State Coastal Conservancy.
Priorities for both the Bay Trail and the Water Trail include: • Managing planning and construction grants, and awarding new grants.
• Expanding partnerships with private corporations and other organizations for specific gap
closures.
• Participating in working groups addressing sea level rise such as Adapting to Rising
Tides.
• Designating and improving Water Trail sites.
• Publishing project updates and participating in trail dedications and other public events.
• Public outreach to promote trail usage and supporting environmental education, public
health and tourism.
Priority Conservation Areas -Priority Conservation Areas (PCAs) complement PDAs by identifying locations with high ecological, recreational, and economic value. To date, more than 1 65 locally-selected PCAs populate this useful coordination :framework. Adoption of Plan Bay Area set the stage for implementation activities, including:
·
• Through the One Bay Area Grant (OBAG) PCA Grant Pilot Program, ABAG and MTC are assisting local jurisdictions and CMAs in implementing a second round of funding through a $1 6.4 million program to support projects in PCAs. The agencies are also administering $8.2 million directly through four CMAs in North Bay counties and $8.2 million through the State Coastal Conservancy for the rest of the Bay Area.
9
Item 7, Attachment 1B
• ABAG, in partnership with key open space entities, updated the PCA framework to further define the role of different kinds of PCAs to support habitat, agriculture, urban greening, recreation, and various ecological functions, and has designated many new PCAs.
Regional Social, Economic, and Land Use Research
ABAG research staff completed the regional level forecast of household formation and employment growth, and will work with the Interagency Modeling Group to prepare the land use analysis and developed alternative scenarios for the Plan Bay Area 2040.
Modeling, Forecasting, and TrendAnalysis
ABAG research staff applied new tools acquired in FY 20 1 4/1 5 to update the forecast to be released in 20 17 . ABAG staff adapted the REMI (designed by Regional Economic Modeling Inc.) model to reflect current and expected future conditions of the region's economy and build on the model structure for the employment, income, and output forecasts for the region, accepted by the Executive Board in February 2016 . In-house analysis of household formation and income distribution are additional elements of the regional forecast. The ABAG model based on the REMI structure will be used in FY 20 17/20 1 8 to better understand likely short-term economic growth patterns in the region and to look at short- and long-term consequences of outside changes, such as shifts in Federal funding or a sudden event storm or earthquake.
Data Services
ABAG staff support local government through assisting in providing and updating data needed for planning. Research staff have worked with the regional planners to improve baseline data on recent construction and permits. As ABAG and MTC consolidate, ABAG staff will work with MTC analytic staff to incorporate unique data sets into a larger system and to improve public access to data.
Resources for Mapping
Research staff continues to enhance tools and resources that allow policy makers and the public to visualize important information about regional growth, for example, releasing an inventory of all housing sites identified in local Housing Elements for each jurisdiction's General Plan.
1 0
Item 7, Attachment 1B

Intergovernmental Coordination
In its core role as convener of inter-governmental and cross-sector collaborations to plan regionally and to coordinate implementation of regional plans, ABAG will continue to act as the administrative sponsor for the Joint Policy Committee, the Regional Planning Committee, Regional Airport Planning Committee, and the Environmental Information Clearinghouse. We will also continue to provide leadership and administrative support for the numerous collaboratives mentioned earlier in the Planning and Research work program, including San Francisco Bay Trail Board, San Francisco Water Trail Advisory Committee, East Bay Corridors working groups, and the Bay Area Planning Directors' Association.
SAN FRANCISCO ESTUARY PROGRAM (SFEP)
The San Francisco Estuary Partnership (SFEP) and its cooperating agencies and organizations both initiated and continued work on a wide array of projects and activities_ in support of the Partnership's mandate, to protect, enhance, and restore the San Francisco Bay-Delta Estuary by implementing actions called for in the Comprehensive Conservation and Management Plan.
The Partnership has: • Released the most comprehensive report for the Estuary, using the best available science
and the most recent data to assess the status of 33 indicators of health. The State of the Estuary 2015 Report was released in September.
• Managed $73 million in multi-benefit water quality and drought response projects across the region through the Integrated Regional Water Management Plan.
• Partnered with the Coastal Conservancy and ABAG Finance Department to staff the San Francisco Bay Restoration Authority. On June 7th, over 70% of voters approved a $12 parcel tax to fund wetland restoration in the San Francisco Bay. The measure will generate $25 million per year for the next 20 years and the Restoration Authority is responsible for distributing those funds through grants.
• Completed GreenPlan Bay Area, a collaborative effort between San Francisco Estuary Partnership, San Francisco Estuary Institute and Bay Area municipalities to develop and pilot the use of a watershed-based green infrastructure planning tool.
• Completed a 5-year program review by National Estuaries Program EPA staff. SFEP passed its evaluation and continues to be eligible for funding under the Clean Water Act Section 320. The evaluation letter pointed out that SFEP "catalyzes and builds on EPA's core programs, leverages significant resources, and builds collaborative partnerships in many areas that further the goals of its CCMP."
• Received funding from EPA for two new collaborative efforts: studying the impacts of ocean acidification on the Bay, and advancing mapping and implementation of transition zones.
• Planned and executed the highly successful State of the Estuary Conference. The Conference was held in Oakland in September 20 1 5 with over 800 attendees.
• Continued public outreach efforts with the 23rd year of publication of our award-winning ESTUARY News magazine.
11
Item 7, Attachment 1B

New and ongoing projects include: • Continuing our $5 million partnership with seven East Bay cities, having secured funds to
build green storm water treatment devices to improve water quality and quality of life along San Pablo A venue.
• Undertaking a major revision of the Comprehensive Conservation and Management Plan, the regional collaborative vision for the future of the San Francisco Estuary.
• Planning for the 20 1 6 Bay-Delta Science Conference in partnership with the Delta Science Program.
• Expanding the Clean Vessel Act Program with new funding and new initiatives. The Program focuses on reducing water quality impacts by undertaking outreach and education efforts with boaters to prevent sewage discharge.
• Providing technical support services to the Santa Clara Valley Water District, Alameda County Flood Control Program, Caltrans, Marin County, and the Sonoma County Water Agency.
• Providing technical assistance to the State Water Board managing fine money directed at environmental projects and supporting the Bay-Delta Science Program through contracts for experts to assist in the scientific research.
ABAG PUBLICLY-OWNED ENERGY RESOURCES (POWER)
ABAG Publicly Owned Energy Resources (ABAG POWER) is a joint powers agency (JP A) formed by ABAG in 1 997 to acquire energy on behalf of local governments, as well as provide energy management and telecommunication services.
ABAG POWER currently offers natural gas aggregation to 3 8 local governments and special districts in the Pacific Gas and Electric (PG&E) service territory. ABAG POWER provides a public sector approach to pooled purchasing, and each public agency is guaranteed a voice in program operations and decisions through its representative to the ABAG POWER Board of Directors and Executive Committee.
ABAG POWER purchases natural gas on behalf of nearly 800 member accounts and arranges for it to be delivered to the PG&E system for distribution. The primary goal of ABAG POWER's Natural Gas Program is to provide both cost savings and price stability. Additional objectives currently include:
• Continue to provide cost effective natural gas aggregation and delivery services for local governmental agencies. This will include active solicitations among natural gas marketers, and the addition of new gas suppliers, as necessary, to continue receiving the most competitive pricing.
• The ABAG POWER Executive Committee will continue to discuss and analyze refinements to the general gas purchasing strategy, including fixed-price product allocations, in order to meet program goals related to cost savings and price stability. In addition, the Committee will continue to investigate strategic opportunities related to environmentally friendly substitutes for natural gas such as biogas or biomethane.
1 2
Item 7, Attachment 1B
• Continue to encourage additional participants in both the core, and noncore programs that supply larger facilities. Qualified, noncore customers can take advantage of lower gas transportation rates that are not available to PG&E customers. ABAG POWER currently supplies gas to three noncore facilities (City of Santa Rosa, City of Watsonville, and County of San Mateo) .
Other ABAG Energy Initiatives:
The San Francisco Bay Area Regional Energy Network (BayREN)
The BayREN was initially approved as an energy-efficiency pilot for two years, with a one year extension. The California Public Utilities Commission (CPUC) recently moved to a 'Rolling Portfolio' process and the BayREN's funding was extended through 2025, subject to annual adjustments. The four main program elements are:
1. Single Family Energy Retrofit
The BayREN Single Family Home Upgrade program is designed to reduce energy use in existing single family homes and 2-4 unit residences in the Bay Area. Program goals include improving the environment, helping homeowners save money by saving energy, increasing public awareness of energy efficiency co-benefits like improved comfort and indoor air quality, and stimulating green job growth. Homeowners can be eligible for rebates from $1,000 to $6,500 based upon the scope of work performed and associated energy savings, plus a $300 home energy assessment rebate with an Advanced Home Upgrade. The BayREN has paid approximately $9 million in incentives to Bay Area homeowners, averaging roughly 200 project reservations per month throughout 20 16 .
2. Multi-family Energy Retrofit
The Bay Area Multifamily Building Enhancements ("BAMBE") program offers free technical consulting and rebates for energy efficiency in multifamily buildings with 5 or more attached dwelling units. Property owners may earn $75 0 per dwelling unit for installing energy upgrades. The program has far exceeded its targets and has repeatedly received millions of dollars in additional funding from PG&E to satisfy the high demand for the program.
13
Item 7, Attachment 1B

3. Energy Efficiency Codes and Standards
The BayREN Codes and Standards Program was established to address the role that local building policies, reviews, and inspections play in the energy use of buildings in the region. The Program provides resources and trainings for local planning and building departments to reduce energy consumption in buildings through improved enforcement of energy codes and greater adoption and implementation of green building ordinances. This includes collaboration with state and regional agencies to encourage local adoption of codes necessary to meet the state' s climate action goals. For example, BayREN expects to continue collaborative efforts with the California Energy Commission (CEC), the Bay Area Air Quality Management District (BAAQMD) and the Bay Area Regional Collaborative (BARC) to develop an ordinance requiring solar photovoltaic technologies on the construction of new properties in designated areas.
4. Financing for Energy Efficiency Projects
Commercial PACE: Property Assessed Clean Energy (PACE) financing allows property owners to 1 ) pay the costs of upgrades as a separate assessment on the building tax roll, and 2) carry the costs as annual maintenance - rather than debt - expense. The BayREN program works to educate contractors and building owners on this financing tool.
PAYS®
The BayREN Pay As You Save (PAYS®) pilots are helping municipal water utilities in the Bay Area use a tariff based on-bill repayment program to promote greater adoption of resource efficiency measures. PAYS allows water utility customers to receive water and energy saving measures (such as high efficiency toilets, shower heads, and drought-tolerant landscaping) at no up-front cost and pay for the measures over time through a surcharge on their water bill that is less than their utility cost savings.
Multi-Family Capital Advance Program
This financing program provides 50% of the financing at zero interest and is available for eligible owners of multifamily properties located within the Bay REN region with at least 5 units, who undertake energy efficiency upgrade projects with a scope defined by the BayREN Multifamily retrofit program or the PG&E's multifamily program. The property owner is obligated to repay the total principal, and BayREN receives a pro rata share of each payment. The repaid funds are recycled to provide capital for additional projects.
14
Item 7, Attachment 1B

Bay REN Integrated Commercial Retrofits (BRICR)
In the past year, ABAG was awarded a Department of Energy (DOE) grant to assist in the creation of an open-source database tool to efficiently identify buildings throughout the region that may be ideal for energy-efficient upgrades. ABAG will work with the San Francisco Department of Environment, Lawrence Berkeley National Laboratory (LBNL), the National Renewable Energy Laboratory (NREL ), and other local Bay REN agencies to design and test the tool.
INSURANCE POOL PROGRAMS
ABAG Pooled Liability Assurance Network (PLAN) Corporation provides property, liability and crime insurance coverage to 28 cities and towns in the greater Bay Area under a pooled risk sharing agreement. In addition to PLAN, the Shared Agency Risk Pool (SHARP) Program provides affordable Workers' Compensation coverage to its participating members.
In fiscal year 20 1 6, PLAN invested $1 .23 million in its Risk Management Best Practices Program, which focuses on loss control and safety. PLAN also provided its members Risk Management and Loss Control consulting services, as well as claims administration services that aligned with individualized strategic goals defined by each member. This year's focus was Playground Safety Best Practices as well as reducing loss frequency in the public works sector (e.g. sewer claim prevention, sidewalk safety) . In 20 1 5, PLAN also continued its ongoing training efforts on contractual risk transfer (contracting risk).
PLAN' s annual Sewer Summit continues to be a success, with record attendance this year and demand for the event continuing to grow. The Urban Forest Conference was also successful and well-attended, with specific focus on drought and severe weather implications to the urban forest environment.
PLAN also conducted a Risk Awareness Survey which provided members with valuable information on safety and risk management temperament, and behaviors and attitudes within member agencies.
PLAN' s financial performance continues to reflect ongoing efforts to reduce claim frequency and manage claim severity. In addition to maintaining focus on core competencies, PLAN is also focused on succession planning with the impending retirement of the Risk Manager.
15
Item 7, Attachment 1B

ABAG FINANCIAL SERVICES
ABAG Financial Services has been providing conduit financing to various public and private organizations throughout the state of California since 1 978. Its programs provide convenient, cost saving, and secure means to meet the capital financing needs of public agencies and their nonprofit and for profit partners serving the public interest. To date, the Authority has provided over $8 billion in low cost investment capital for projects in more than 240 local jurisdictions. The Authority helps its members to provide for construction of new hospitals and medical clinics, transit systems, affordable housing, schools, museums, water and wastewater systems, and other member-owned infrastructure. The Authority takes special focus on assisting in the construction and preservation of affordable housing, providing financing to date for nearly twelve-thousand units in nearly one-hundred affordable apartment communities.
In 20 1 6, a new management team was installed in the Authority, with a mandate to explore new avenues of service in the financing of municipal and special district projects. Under this new management, the Authority will continue to service its outstanding portfolio of conduit debt and continue the administration of existing community facilities and special assessment districts.
ABAG TRAINING CENTER
The ABAG Training Center program which was an ABAG service program from 1 979 was sold to our partner, Safety Compliance Management (SCM) during the year.
FISCAL MANAGEMENT SERVICES
ABAG provides fiscal management services to Bay Area public purpose entities and region-wide grant programs. Entities serviced are: ABAG PLAN Corporation, ABAG Workers' Compensation Shared Risk Pool, ABAG Finance Authority for Nonprofit Corporations, ABAG Publicly Owned Energy Resources, and the San Francisco Bay Area Water Emergency Transit Authority. These services include accounting, financial reporting, cash management, investment management, debt issuance, grants management, and other related financial support services. Over the past year, several grants furthering sustainability have been awarded, requiring substantial financial services. These included grants for promoting and incentivizing the energy efficiency of homes and the installation of enhancements such as insulation, double-paned windows and solar panels. Other grants focused on water quality enhancements of the San Francisco Bay and Delta through water recycling, creek cleanups, and stormwater capture.
LEGISLATIVE ACTIVITIES
The ABAG Legislation and Governmental Organization Committee (L&GO) is comprised of elected officials from the Bay Area's cities, towns, and counties. Through the Committee, ABAG actively serves members by providing a platform for them to work collaboratively to influence legislation that impacts local governments throughout the region. Approximately 30 state bills were reviewed by the Committee during the 20 1 6 Legislative Session.
16
Item 7, Attachment 1B

ABAG' s L&GO Committee actively supported legislation related to land use, housing, hazardous waste disposal, energy and water efficiency, and disaster resiliency. The Committee supported AB 2406 (Tony Thurmond) Housing: Junior Accessory Dwelling Units that was chaptered into law, as well as SB 1 03 0 (Mike McGuire) Sonoma County Regional Climate Protection Authority that became law. The Committee also pursued Water Efficiency Financing Legislation in 201 6 authored by ABAG POWER .
Committee activities throughout the year included policy briefings, a Legislative Workshop and Reception co-hosted by ABAG and California State Association of Counties (CSAC), and face-toface dialogues with legislators about Bay Area needs and challenges.
In fiscal year 20 1 7, it is anticipated that the L&GO Committee will:
• Continue to pursue legislation that provides resources and incentives for planning, infrastructure and services to assist local governments, as well as State and Federal legislation establishing innovative financing and project delivery mechanisms.
• Continue to focus on SB 375 and Plan Bay Area Implementation through legislative objectives such as affordable housing funding, housing element reform, and better California Environmental Quality Act (CEQA) entitlement efficiency.
• Continue to monitor implementation of the Cap and Trade Program.
• Increase focus on resiliency.
• Continue to seek voter threshold reduction for infrastructure taxes and bonds statewide and
locally.
COMMUNICATIONS
The ABAG Communications Department is instrumental in helping to promote ABAG programs and services through newsletters, website articles, twitter announcements, reports, conferences, and media outreach. In 20 1 5, the department worked with all internal programs to promote ABAG's mission and to inform and engage members in relevant programs and activities. Major efforts included regional conferences and workshops, publications, media relations, and web outreach centered on sustainable growth, economic and infrastructure resilience, and creating complete communities, as well as municipal insurance and energy programs.
Activities included: • Releasing of a comprehensively updated website with a major overhaul in appearance and
content. This extensive update increases access to all ABAG programs, projects, initiatives, and resources in a more attractive, user-friendly format.
• Working with the Planning and Research Department to release several publications, including the State of the Region and People, Places, and Prosperity; implementing Plan Bay Area outreach and public engagement strategies; expanding outreach to ABAG General Assembly delegates and member staffs to facilitate better use of ABAG programs and services.
1 7
Item 7, Attachment 1B

• Convening the Getting Ready for El Ni:fio Briefing in collaboration with the California Office of Emergency Services, helping inform cities and counties on how to be resilient in the face of an anticipated strong El Nifio event. Attendees learned about the actions each city needs to take to prepare for El Nino, available resources, preparations by utilities, and what the State can offer cities and counties. In support of these activities, the Communications Group provided conference planning and coordination for the workshop held in December 20 1 5 .
• Providing updates on ABAG initiatives, programs, and services through online and edistributed publications. ABAG Update is an online monthly e-newsletter, sent to both members and interested parties. The ABAG website news section featured the latest agency trends and events. Media coverage included articles and TV and radio interviews on agencywide subjects and other related regional perspectives.
In fiscal year 20 1 7, the Communications Group will continue to: • Expand the methods and tools used to communicate the full breadth of ABAG programs and
activities to our member cities, towns, and counties, key stakeholders and the public. • Conduct outreach to ABAG General Assembly' delegates and member staffs via the county
wide delegate meetings. • Examine ways to expand discussion of ABAG activities and programs at the General
Assembly and facilitate increased access to ABAG programs, projects, initiatives and resources, through comprehensive update of the website and use of social media.
1 8
Item 7, Attachment 1B

SAN FRANCISCO BAY RESTORATION AUTHORITY
San Francisco Bay Restorations Authority (Authority) is a regional agency with a governing board made up of local elected officials appointed by ABAG. Its purpose is to raise and allocate local resources for the restoration, enhancement, protection, and enjoyment of wetlands and wildlife habitat in San Francisco Bay and along its shoreline.
In June 20 1 6, the Authority placed a regional parcel tax, Measure AA, on the ballot and it passed. The passage of the Measure demonstrated public support for the restoration and preservation needs of the Bay and Delta and the role of the Authority in meeting those needs. The Authority will begin receiving the tax revenues in the fall of 20 1 7, fiscal year 20 1 8.
In fiscal year 2017 the Authority will begin grant making operations for the restoration and enhancement of San Francisco Bay and its shoreline. While the Authority has laid the groundwork for the eventual administration of the Measure, adopting grant program guidelines as well as procedures for the Advisory Committee and Independent Citizens Oversight Committee, much work remains to facilitate efficient and effective use of Measure AA funds. The following are the main activities in the development of the grant making functions, both in program and tax/fiscal operations:
• Develop a Joint Powers Agreement (JP A). • Develop and adopt a multi-year workplan and budget. • Develop internal control policies and procedures including financial tracking and oversight
mechanisms. • Develop Board Policies. • Develop Citizens Oversight Committee Policies. • Develop contract mechanisms (grant agreements, billing mechanisms/materials). • Develop Request for Proposals (RFP) process.
C ONTACTING THE ASSOCIATION' S FINANCIAL MANAGEMENT
This financial report is intended to provide citizens, taxpayers, creditors, and stakeholders with a general overview of the Association's finances. Questions about this report may be directed to Courtney Ruby, ABAG Finance Director, Association of Bay Area Governments, 375 Beale Street, Suite 700, San Francisco, California 941 05.
1 9
Item 7, Attachment 1B

This Page Left Intentionally Blank
Item 7, Attachment 1B

ASSOCIATION OF BAY AREA GOVERNMENTS STATEMENT OF NET POSITION
JUNE 3 0, 20 1 6
Association of ABAG SF Bay Bay Area Finance BALANCE Restoration
Governments Co!Eoration Foundation Total Authori� ASSETS
Current Assets
Cash and Investments (Note 2):
Cash and Cash Equivalents $7,299,589 $27,453 $338 ,0 9 1 $7,665,133 $2, 1 0 1
Receivables:
Federal, State and Local Grants 29,68 1 ,393 4,069 29,685,462 Interest 3 ,016 342 3,358
Prepaid Expenses and Other 325,570 5,000 330,570
Total Current Assets 37,309,568 27,453 347,502 3 7,684,523 2,1 0 1
Noncurrent Assets
Non-Depreciable Capital Assets (Note 3) 800,000 800,000 Capital Assets, Net of
Accumulated Depreciation (Note 3) 262,441 262,441
Total Assets 38,372,009 27,453 347,502 3 8,746,964 2, 1 0 1
DEFERRED OUTFLOWS
Deferred Outflows Related to Pension (Note 8) 2,078 ,247 2,078,247
Total Deferred Outflows 2,078,247 2,078,247
LIABILITIES
Current Liabilities
Accounts Payable 26,438,233 453 27,332 26,466,0 1 8 Compensated Absences (Note lE) 357,523 357,523 Other Accrued Liabilities 3 97,650 3 97,650 Current Portion of Long-Term Obligations (Note 4) 77,747 77,747 Unearned Revenue 6,173,403 6,173,403
Total Current Liabilities 33,444,556 453 27,332 33 ,472,341
Noncurrent Liabilities
Compensated Absences, Noncurrent (Note lE) 173,144 173, 144 Collective Net Pension Liability (Note 8) 12,998,297 1 2,998,297 Net OPEB Obligation (Note 9) 289,5 1 1 289,5 1 1 Long-Term Obligations, Net of Current Portion (Note 4) 2 1 6 ,000 2 16,000
Total Noncurrent Liabilities 13,676,952 1 3 ,676,952
TOtal Liabilities 47, 12 1 ,508 453 27,332 47, 149,293
DEFERRED INFLOWS
Deferred Inflows Related to Pension (Note 8) 1 , 188 ,223 1 , 1 88,223
Total Deferred Inflows 1 , 188 ,223 1 , 1 88,223
NET POSITION (Note 7)
Net Investment in Capital Assets 768,694 768,694 Restricted 249,657 249,657 2,1 0 1 Unrestricted {8,628,1691 27,000 70,5 1 3 {8,530,6561
Total Net Position ($7,859,4751 $27,000 $320 , 170 ($7,5 12,3051 $2, 10 1
See accompanying notes to basic financial statements
21
Item 7, Attachment 1B

PROGRAM REVENUES
Operating Grants and Contributions: Grants
Subtotal
Charges for Services Reimbursements Other
Subtotal
Total Program Revenues
PROGRAM EXPENSES
Salaries and Related Benefits Consultant Services Pass-through Awards Equipment, Maintenance and Supplies Outside Printing Costs Conference and Meeting Costs Depreciation (Note 3) Building Maintenance Postage Insurance Telephone Utilities Committee Other Interest Expense
Total Program Expenses
Net Program Loss
GENERAL REVENUES
Membership Dues Donations - Unrestricted Interest Income
Total General Revenues
Change in Net Position
Net Position-Beginning
Net Position-Ending
ASSOCIATION OF BAY AREA GOVERNMENTS STATEMENT OF ACTMTIES
FOR THE YEAR ENDED JUNE 30, 20 16
Association of ABAG Bay Area Finance BALANCE
Governments Corporation Foundation
$51 , 700, 177
5 1 ,700, 177
4,662,581 $ 1 62 $ 1 6,779 226,593
4,889, 174 1 62 1 6,779
56,589,35 1 1 62 1 6,779
10, 8 1 8,257 35,537,963 4, 132 85,485 10, 120,973
103 ,822 77,895 68
218,371 400 166,035 286,768
10,970 159,676 83 ,845
135,824 85,200
485,000 19,267 70,352 10
58,360,95 1 4, 142 1 05,220
(1 ,771 ,600) (3 ,980} {88,4412
1,896,480 95, 8 1 5 62,495 14, 8 1 5 24 1 ,214
2,007, 1 10 24 63,709
235,5 10 (3 ,956) (24,732)
(8,094,985) 3 0,956 344,902
($7,859,475) $27,000 $320, 170
See accompanying notes to basic financial statements
22
SF Bay Restoration
Total Authority
$5 1 ,700, 177
5 1 ,700, 177
4,679,522 226,593
4,906, 1 1 5
56,606,292
1 0, 8 1 8,257 35,627,580 $45,503 1 0, 120,973
103,822 77,963
2 1 8,771 1 66,035 286,768
10,970 159,676 83 ,845
135 ,824 85,200
504,267 70,362
58,470,3 13 45,503
{1 ,864,021 ) (45,503)
1 , 896,480 158 ,3 10 3 8,000 16,053 3
2,070,843 3 8,003
206,822 (7,500)
(7,719, 1 27) 9,601
($7 ,5 12,3 05) $2, 10 1
Item 7, Attachment 1B

ASSOCIATION OF BAY AREA GOVERNMENTS STATEMENT OF CASH FLOWS
FOR THE YEAR ENDED JUNE 30, 20 1 6
Association of ABAG SF Bay Bay Area Finance BALANCE Restoration
Governments Co�oration Foundation Total Authority
CASH FLOWS FROM OPERATING ACTIVITIES
Grant receipts $30,565, 1 13 $30,565, 1 1 3 Receipts from customers and members 6,654,876 $ 1 62 $ 100,825 6,755,863 $38 ,000 Payments to contractors and members (27,089, 1 0 1) (5,343) (90,320) (27, 1 84,764) (45,503) Payments to employees ( 1 0,949,7 1 9) (10,949,7 1 9) Payments to committees (85,200) (85,200) Other receipts (payments) 226,593 226,593
Net cash flows from operating activities (677,43 8) (5, 1 8 1) 1 0,505 (672, 1 14) (7,503)
CASH FLOWS FROM CAPITAL AND RELATED FINANCING ACTNITIES
Acquisition and construction of capital assets (2 1 , 122) (2 1, 122) Repayment of long-term obligations (73 ,23 1) (73 ,23 1 ) Interest paid (70,352) ( 10) (70,362)
Net cash flows from capital and related financing activities (164,705) ( 10) ( 164,7 15)
CASH FLOWS FROM INVESTING AND RELATED FINANCING ACTNITIES
Interest received 1 3 ,3 84 24 1 ,073 14,48 1 3
Net cash flows (828,759) (5, 167) 1 1 ,578 (822,348) (7,500)
Cash and cash equivalents at beginning of year 8 , 128,348 32,620 326,5 1 3 8,487,48 1 9,60 1
Cash and cash equivalents at end of year $7,299,589 $27,453 $338,09 1 $7,665, 133 $2, 1 0 1
Reconciliation o f operating income t o net cash provided by
operating activities:
Net Program Loss ($ 1 ,77 1 ,600) ($3 ,980) ($88,441) ($ 1 ,864,021 ) ($45,503)
Adjustments to reconcile net program loss to
cash flows from operating activities:
Depreciation 1 66,035 166,035 Membership dues 1 , 896,480 1 ,896,480 Donations - unrestricted 95,8 1 5 62,495 158,3 10 3 8,000 Interest 70,352 10 70,362
Change in assets and liabilities :
Receivables (2 1 ,277,296) 2 1 ,55 1 (2 1 ,255,745) Prepaid expenses and other assets (201 ,700) (5,000) (206,700) Accounts payable 20,343 ,767 ( 1 ,21 1) 1 9,900 20,362,456 Compensated absences ( 19, 196) (19, 196) Other accrued liabilities 1 35,639 135,639 Unearned revenue 142,232 142,232 Net OPEB obligation ( 1 1 2,266) (1 12,266) Decrease (increase) in due to retirement system (145,700) (145,700)
Net cash flows from operating activities ($677,43 8) ($5, 1 8 1) $ 10,505 ($672, 1 14) ($7,503)
See accompanying notes to basic financial statements
23
Item 7, Attachment 1B

This Page Left Intentionally Blank
Item 7, Attachment 1B

ASSOCIATION OF BAY AREA GOVERNMENTS NOTES TO BASIC FINANCIAL STATEMENTS
For the Year Ended June 30, 2016
I NOTE 1 - SUMMARY 'oF SIGNIFICANT ACCOUNTING POLICIES I
The Association of Bay Area Governments (the Association) was established in 196 1 by agreement among its members--counties and cities of the San Francisco Bay Area pursuant to the Joint Exercise of Powers Act, California Government Code Section 6500, et sq. The Association is a separate entity from its members and its purpose is to serve as a permanent forum to discuss and study matters of mutual interest and concern to member jurisdictions, develop policies and action plans, and provide services and undertake actions addressing such matters.
The Association is governed by a General Assembly comprised of elected officials from member cities and counties. The General Assembly appoints an Executive Board to carry out policy decisions, approve the annual budget, appoint an Executive Director, and report to the General Assembly.
A. Repordng Entity
The Association is a membership organization that provides a variety of planning and other service programs for its members.
The accompanying basic financial statements present the operations of the Association, which is the primary activity, along with the financial activities of its component units, which are entities for which the Association is financially accountable. Although they are separate legal entities, they are presented in the basic financial statements as either a blended component unit or discretely presented component unit.
Blended Component Units
Blended component units are in substance part of the Association's operations and are reported as an integral part of the Association's financial statements. The following component units are blended and are described below:
• ABAG Finance Corporation (Corporation) is a non-profit public benefit corporation created on June 24, 1985 that aids members in obtaining financing by acting as a conduit in the sponsorship of credit pooling arrangements. Participating members issue debt, leases or certificates of participation (COPs) that are pooled as a single issue by the Corporation. Members' payments are pooled to repay the debt and the assets leased become the property of the member when it has paid off its debt obligation.
The Corporation is governed by a sub-committee of the Association's Executive Board, which establishes financing policies and approves each credit pooling arrangement.
• BALANCE Foundation (BALANCE) is a non-profit, tax-exempt corporation created on September 22, 1987, established to assist Bay Area governments in obtaining funds to study, analyze and resolve regional issues. BALANCE is governed by a Board of Directors whose appointment is controlled by the Association.
25
Item 7, Attachment 1B

ASSOCIATION OF BAY AREA GOVERNMENTS NOTES TO BASIC FINANCIAL STATEMENTS
For the Year Ended June 30, 2016
I NOTE 1 - SUMMARY OF SIGNJFICANT ACCOUNTING POLICIES (Continued) I
Discretely Presented Component Unit
A component unit is a legally separate organization for which elected officials of the primary entity are financially accountable. It can also be an organization whose relationship with the primary entity is such that exclusion would cause the reporting entity's financial statement to be misleading or incomplete. The Association has one discretely presented component unit, San Francisco Bay Restoration Authority.
• The San Francisco Bay Restoration Authority (Restoration Authority) was created by State legislation on September 3 0, 2008 to raise and allocate resources for the restoration, enhancement, protection, and enjoyment of wetlands and wildlife habitat in the San Francisco Bay and along its shoreline. The Restoration Authority is governed by a board that is appointed by the Association, yet is composed of members that are different from the Association's board.
Additional financial information for each component unit can be obtained at the entity's administrative offices, 375 Beale Street, Suite 700, San Francisco, CA 94105, to the attention of Association of Bay Area Governments.
Other Afftliated Entities
Over the past two decades, the Association created a number of public purpose entities to offer various service programs. The fmancial activities of the entities are not included in these financial statements because these entities are not controlled by the Executive Board and the composition of their membership may be different than that of the Association. However, the Association has agreements with each of these entities to provide management, administrative and other support services. These entities and the service programs offered are described below:
• ABAG Pooled Liability Assurance Network (PLAN) Corporation provides risk management, liability coverage, claims management and loss prevention services for participating members of PLAN. The Association acts as PLAN's trustee, providing promotional, administrative and management support. On behalf of PLAN, the Association incurred $ 1 ,493 ,65 1 for these services and $781 ,63 1 for contract services in the fiscal year ended June 3 0, 20 16 .
• ABAG Finance Authority for Non-profit Corporations (FAN) assists non-profit corporations and local governments in obtaining financing. The Association assists FAN in issuing taxexempt debt. It also provides administrative and management support. On behalf of FAN, the Association incurred $655,043 for these services and $396,357 for contract services in the fiscal year ended June 30, 20 16.
• ABAG Comp Shared Risk Pool (SHARP) provides workers compensation coverage and claims management for participating members. The Association provides risk management, administrative and management support. On behalf of SHARP, the Association incurred $94,590 for these services and $27,555 for contract services in the fiscal year ended June 30, 2016 .
26
Item 7, Attachment 1B

ASSOCIATION OF BAY AREA GOVERNMENTS NOTES TO BASIC FINANCIAL STATEMENTS
For the Year Ended June 30, 2016
I NOTE 1 - SUMMARY OF SIGNIFICANT ACCOUNTING POLICIES (Continued) I
• ABAG Publicly Owned Energy Resources (POWER) provides gas energy aggregation services to participating members. The Association acts as POWER'S trustee, providing promotional, administrative and management support. On behalf of POWER, the Association incurred $335,3 8 1 for these services and $9,800 for contract services in the fiscal year ended June 30, 20 16 .
B. Basis of Presentation
The Association's Basic Financial Statements are prepared in conformity with accounting principles generally accepted in the United States of America. The Government Accounting Standards Board is the acknowledged standard setting body for establishing accounting and financial reporting standards followed by governmental entities in the U.S.A.
These Standards require that the financial statements described below be presented.
Government-wide Statements: The Statement of Net Position and the Statement of Activities display information about the primary reporting entity (the Association). These statements include the financial activities of the overall Association. Eliminations have been made to minimize the double counting of internal activities. These statements display the business-type activities of the Association. Businesstype activities are financed in whole or in part by fees charged to external parties.
The Statement of Activities presents a comparison between direct expenses and program revenues for each function of the Association's business-type activities. Direct expenses are those that are specifically associated with a program or function. Program revenues include (a) charges paid by the recipients of goods or services offered by the programs, (b) grants and contributions that are restricted to meeting the operational needs of a particular program, ( c) grants providing advances of funds that are passed through ABAG to contractors or end recipients as reimbursements or incentive payments for specified purposes and ( d) fees, grants and contributions that are restricted to financing the acquisition or construction of capital assets. Revenues that are not classified as program revenues are presented as general revenues.
C Major Funds
Major funds are defined as funds that have either assets, liabilities, revenues or expenses equal to ten percent of their fund-type total and five percent of the grand total. The Association's major funds are presented separately in the fund financial statements.
The Association reported all its enterprise funds as major funds in the accompanying financial statements:
Association of Bay Area Governments Fund - this fund accounts for revenues and expenses of the Association.
ABAG Finance Corporation Fund - this fund accounts for revenues and expenses of the ABAG Finance Corporation.
BALANCE Foundation Fund - this fund accounts for revenues and expenses of the Bay Area Leaders Addressing the Challenge of the Economy and Environment Foundation.
27
Item 7, Attachment 1B

ASSOCIATION OF BAY AREA GOVERNMENTS NOTES TO BASIC FINANCIAL STATEMENTS
For the Year Ended June 30, 2016
I NOTE 1 - SUMMARY OF SIGNIFICANT ACCOUNTING POLICIES (Continued) I
D. Basis of Accounting
The government-wide financial statements are reported using the economic resources measurement focus and the full accrual basis of accounting. Revenues are recorded when earned and expenses are recorded at the time liabilities are incurred, regardless of when the related cash flows take place.
Non-exchange transactions, in which the Association gives or receives value without directly receiving or giving equal value in exchange, include grants, entitlements, and donations. On the accrual basis, revenue from grants, entitlements, and donations is recognized in the fiscal year in which all performance requirements have been satisfied. Expenditures in excess of reimbursement are recorded as receivables, and advanced reimbursements are recorded as unearned revenues.
The Association offers a number of service programs that are funded on a cost-reimbursement or feefor-service basis. Discretionary funds, comprised primarily of membership dues, amount to about 3 .9% of total revenues, excluding pass-through awards. Discretionary funds are used to cover certain management and administrative expenses and may occasionally be allocated to meet local match requirements as stipulated in certain grant contracts. Thus, both restricted and unrestricted net position may be available to finance program expenditures. The Association' s policy is to first apply restricted grant resources to such programs, followed by unrestricted revenues if necessary.
Certain indirect costs are included in program expenses reported for individual functions and activities.
E. Compensated Absences
Compensated absences comprise vacations and are recorded as an expense when earned. The accrued liability for unused compensated absences is computed using current employee pay rates . Sick pay does not vest and is not accrued.
The changes in the compensated absences were as follows:
F. Estimates
Balance June 3 0, 20 15
Additions Payments
Balance June 3 0, 20 16
Due within one year
$549,863
5 1 1 , 1 63
(530,359)
$530,667
$3 57,523
The Association' s management has made a number of estimates and assumptions relating to the reporting of assets and liabilities and revenues and expenses and the disclosure of contingent liabilities to prepare these financial statements in conformity with Generally Accepted Accounting Principles (GAAP). Actual results could differ from those estimates .
28
Item 7, Attachment 1B

ASSOCIATION OF BAY AREA GOVERNMENTS NOTES TO BASIC FINANCIAL STATEMENTS
For the Year Ended June 30, 2016
I NOTE 1 - SUMMARY OF SIGNIFICANT ACCOUNTING POLICIES (Continued)
G. Deferred Inflows and Deferred Outflows of Resources
In addition to assets, the statement of financial position or balance sheet reports a separate section for deferred outflows of resources. This separate financial statement element, deferred outflows of resources, represents a consumption of net position or fund balance that applies to a future period(s) and so will not be recognized as an outflow of resources (expense/expenditure) until then.
In addition to liabilities, the statement of financial position or balance sheet reports a separate section for deferred inflows of resources. This separate financial statement element, deferred inflows of resources, represents an acquisition of net position or fund balance that applies to a future period(s) and so will not be recognized as an inflow of resources (revenue) until that time.
H. Fair Value Measurements
Fair value is defined as the price that would be received to sell an asset or paid to transfer a liability in an orderly transaction between market participants at the measurement date. The Association categorizes its fair value measurements within the fair value hierarchy established by generally accepted accounting principles. The fair value hierarchy categorizes the inputs to valuation techniques used to measure fair value into three levels based on the extent to which inputs used in measuring fair value are observable in the market.
Level 1 inputs are quoted prices (unadjusted) in active markets for identical assets or liabilities .
Level 2 inputs are inputs - other than quoted prices included within level 1 - that are observable for an asset or liability, either directly or indirectly.
Level 3 inputs are unobservable inputs for an asset or liability.
If the fair value of an asset or liability is measured using inputs from more than one level of the fair value hierarchy, the measurement is considered to be based on the lowest priority level input that is significant to the entire measurement.
29
Item 7, Attachment 1B

ASSOCIATION OF BAY AREA GOVERNMENTS NOTES TO BASIC FINANCIAL STATEMENTS
For the Year Ended June 30, 2016
I NOTE 2 - CASH AND INVESTMENTS I
Cash and investments comprised the following at June 30, 2016 :
Association and SF Bay other blended Restoration
component units Authority Total
Local Agency Investment Fund $2,44 1 ,583 $2,44 1 ,583
Cash: Cash in banks 5 ,223 ,230 $2, 1 0 1 5,225,33 1
Cash on hand 320 320
Total Cash and Investments $7,665 , 1 3 3 $2, 1 0 1 $7,667,234
The Association pools cash from all sources and all funds so that it can be invested at the maximum yield, consistent with the principles of safety and liquidity. Individual funds can make expenditures at any time. Investments are carried at fair value.
A. Investments Authorized by the Association
B.
The Association' s Investment Policy and the California Government Code allow the Association to invest in the following, within the stated guidelines:
Maximum Maximum Maximum Minimum Credit Percentage of Investment in
Authorized Investment Type Maturity Quality Portfolio One Issuer U.S. Treasury Obligations 1 year NIA None None U. S. Agency Securities 1 year NIA None None Bankers' Acceptances 1 80 days NIA 40% None Commercial Paper 1 80 days Al/P l 1 0% None Investment Agreements On Demand NIA None None Repurchase Agreements 15 days NIA 1 0% None Certificates of Deposit 3 years NIA 1 0% 1 0% Negotiable Certificates of Deposit 1 year NIA 1 0% None Money Market Mutual Funds On Demand Top rating category 20% 1 0% California Local Agency Investment Fund On Demand NIA None None Investment Trust of California (CalTRUST) On Demand NIA None None
Fair Value Hierarchy
The Association categorizes its fair value measurements within the fair value hierarchy established by generally accepted accounting principles. The hierarchy is based on the valuation inputs used to measure fair value of the assets . Level 1 inputs are quoted prices in an active market for identical assets; Level 2 inputs are significant other observable inputs; and Level 3 inputs are significant unobservable inputs.
The Association's only investment in the California Local Agency Investment Fund (LAIF) is classified as Level 2 of the fair value hierarchy, and is valued based on the fair value factor provided by the Treasurer of the State of California, which is calculated as the fair value divided by the amortized cost of the investment pool.
Item 7, Attachment 1B

ASSOCIATION OF BAY AREA GOVERNMENT S NOTES TO BASIC FINANCIAL STATEMENTS
For the Year Ended June 30, 2016
I NOTE 2 - CASH AND INVESTMENTS (Continued)
C Interest Rate Risk
Interest rate risk is the risk that changes in market interest rates may adversely affect the fair value of the Association' s investment. Generally, the longer the maturity of an investment, the greater is the sensitivity of its fair value to changes in market interest rates . The sensitivity of the fair values of the Association' s investments to market interest rate fluctuations is presented by the following maturity schedule of the Association' s cash and investments:
Local Agency Investment Fund
Cash in banks Cash on hand
Total Cash and Investments
12 Months or less
$2,441,583 5,225,33 1
320
$7,667,234
As of year-end, the weighted average maturity of the investments in the LAIF investment pool is approximately 1 67 days.
D. Custodial Credit Risk
Custodial credit risk for deposits is the risk that, in the event of the failure of a depository financial institution, the Association may not be able to recover its deposits or collateral securities that are in the possession of an outside party. Under California Government Code Section 5365 1 , depending on specific types of eligible securities, a bank must deposit eligible securities posted as collateral with its agent having a fair value of 1 10% to 1 50% of the Association' s cash on deposit. All of the Association' s deposits are either insured by the Federal Depository Insurance Corporation (FDIC) or collateralized with pledged securities held in the trust department of the financial institutions in the Association' s name.
E. Local Agency Investment Fund
The Association is a voluntary participant in the Local Agency Investment Fund (LAIF) that is regulated by California Government Code Section 1 6429 under the oversight of the Treasurer of the State of California. The Association reports its investment in LAIF at the fair value amount provided by LAIF. The balance available for withdrawal is based on the accounting records maintained by LAIF, which are maintained on an amortized cost basis . Included in LAIF's investment portfolio are collateralized mortgage obligations, mortgage-backed securities, other asset-backed securities, loans to certain state funds, and floating rate securities issued by federal agencies, government-sponsored enterprises, and corporations.
Under California Government Code, LAIF is allowed greater investment flexibility than the Association is permitted. As such, LAIF's investment portfolio may contain investments not otherwise permitted for the Association. For funds invested in LAIF, LAIF's investment policy overrides the Association' s investment policy.
3 1
Item 7, Attachment 1B

ASSOCIATION OF BAY AREA GOVERNMENTS NOTES TO BASIC FINANCIAL STATEMENTS
For the Year Ended June 30, 2016
I NOTE 2 - CASH AND INVESTMENTS (Continued)
F. Statement of Cash Flows
For purposes of the statement of cash flows, the Association considers all highly liquid investments, including restricted investments but excluding cash with fiscal agents, with a maturity of three months or less when purchased to be cash equivalents.
I NOTE 3 - CAPITAL ASSETS I All capital assets are valued at historical cost or estimated historical cost if actual historical cost is not available. Contributed capital assets are valued at their estimated acquisition value on the date contributed. The Association' s policy is to capitalize all assets with costs exceeding $5,000.
Capital assets with limited useful lives are depreciated over their estimated useful lives. The purpose of depreciation is to spread the cost of capital assets equitably among all users over the life of these assets. The amount charged to depreciation expense each year represents that year's pro rata share of the cost of capital assets.
Depreciation expense is calculated on the straight-line method over the estimated useful lives of assets, which are as follows:
Facilities and improvements Furniture and equipment Vehicles Capitalized software
32
5 to 30 years 3 to I O years 5 years 3 to 6 years
Item 7, Attachment 1B

ASSOCIATION OF BAY AREA GOVERNMENTS NOTES TO BASIC FINANCIAL STATEMENTS
For the Year Ended June 30, 2016
I NOTE 3 - CAPITAL ASSETS (Continued)
Capital asset balances and transactions as of June 30 are summarized below:
June 30, 20 15 Additions June 3 0, 20 1 6
Capital assets not being depreciated:
Construction in process $800,000 $800,000
Total capital assets not being depreciated 800,000 800,000
Capital assets being depreciated:
Facilities and improvements 3 ,604, 147 3 ,604, 1 47
Furniture and equipment 1 ,079, 155 $2 1 , 122 1 , 1 00,277
Vehicles 57,652 57,652
Capitalized software 697,974 697,974
Total capital assets being depreciated 5,43 8,928 2 1 , 122 5 ,460,05 0
Less accumulated depreciation for:
Facilities and improvements (3 ,477,00 1) (45,932) (3 ,522,933)
Furniture and equipment (805,6 12) ( 1 1 7,680) (923 ,292)
Vehicles (57,652) (57,652)
Capitalized software (69 1 ,309) (2,423) (693 ,732)
Total accumulated depreciation (5,03 1 ,574) ( 1 66,035) (5, 1 97,609)
Total depreciable assets 407,354 ( 1 44,9 13) 262,441
Total $ 1 ,207,354 ($ 1 44,9 13) $ 1 ,062,441
I NOTE 4 - LONG TERM OBLIGATION I
A. Additions and Retirements
The Association' s obligation issues and transactions are summarized below and discussed in detail thereafter:
Balance Balance Current
June 30, 2015 Retirements June 30, 2016 Portion
B US/NESS-TYPE ACTIVITY
Office Impro\ement Project
Variable rate + 1%, due 1/1/2020 $366,978 ($73,23 1) $293,747 $77,747
33
Item 7, Attachment 1B
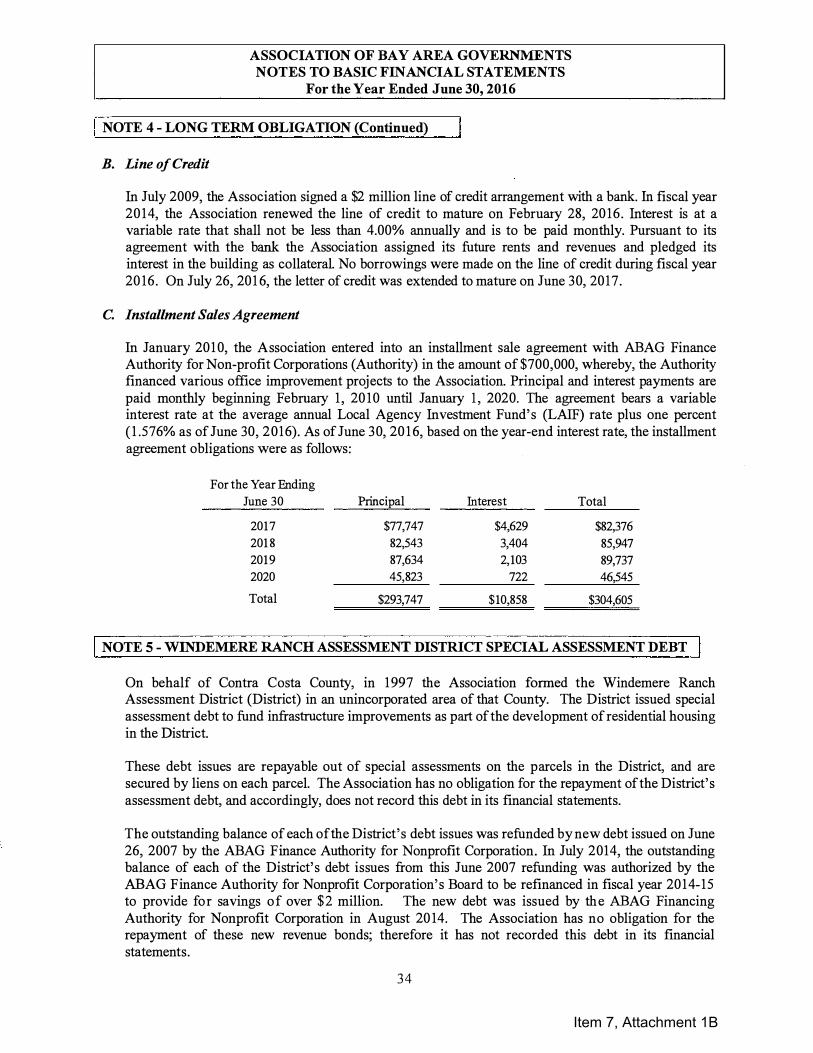
ASSOCIATION OF BAY AREA GOVERNMENTS NOTES TO BASIC FINANCIAL STATEMENTS
For the Year Ended June 30, 2016
I NOTE 4 - LONG TERM OBLIGATION (Continued)
B. Line of Credit
fu July 2009, the Association signed a $2 million line of credit arrangement with a bank. In fiscal year 20 14, the Association renewed the line of credit to mature on February 28, 20 16 . futerest is at a variable rate that shall not be less than 4.00% annually and is to be paid monthly. Pursuant to its agreement with the bank the Association assigned its future rents and revenues and pledged its interest in the building as collateral. No borrowings were made on the line of credit during fiscal year 20 16 . On July 26, 20 1 6, the letter of credit was extended to mature on June 30, 2017 .
C. Installment Sales Agreement
fu January 201 0, the Association entered into an installment sale agreement with ABAG Finance Authority for Non-profit Corporations (Authority) in the amount of $700,000, whereby, the Authority financed various office improvement projects to the Association. Principal and interest payments are paid monthly beginning February 1 , 20 10 until January 1 , 2020. The agreement bears a variable interest rate at the average annual Local Agency fuvestment Fund' s (LAIF) rate plus one percent ( 1 .576% as of June 30, 2016) . As of June 30, 20 1 6, based on the year-end interest rate, the installment agreement obligations were as follows:
For the Year Ending June 30 Principal Interest Total
2017 $77,747 $4,629 $82,376 201 8 82,543 3,404 85,947 2019 87,634 2, 103 89,737 2020 45,823 722 46,545
Total $293,747 $10,858 $304,605
I NOTE 5 - WINDEMERE RANCH ASSESSMENT DISTRICT SPECIAL ASSESSMENT DEBT
On behalf of Contra Costa County, in 1 997 the Association formed the Windemere Ranch Assessment District (District) in an unincorporated area of that County. The District issued special assessment debt to fund infrastructure improvements as part of the development of residential housing in the District.
These debt issues are repayable out of special assessments on the parcels in the District, and are secured by liens on each parcel. The Association has no obligation for the repayment of the District' s assessment debt, and accordingly, does not record this debt in its financial statements.
The outstanding balance of each of the District' s debt issues was refunded by new debt issued on June 26, 2007 by the ABAG Finance Authority for Nonprofit Corporation. fu July 2014, the outstanding balance of each of the District' s debt issues from this June 2007 refunding was authorized by the ABAG Finance Authority for Nonprofit Corporation' s Board to be refinanced in fiscal year 2014- 15 to provide for savings of over $2 million. The new debt was issued by the ABAG Financing Authority for Nonprofit Corporation in August 20 14. The Association has no obligation for the repayment of these new revenue bonds; therefore it has not recorded this debt in its financial statements.
34
Item 7, Attachment 1B

ASSOCIATION OF BAY AREA GOVERNMENTS NOTES TO BASIC FINANCIAL STATEMENTS
For the Year Ended June 30, 2016
I NOTE 6 - CONDUIT FINANCING PROGRAMS FOR MEMBERS
The Association assists members and other borrowers in obtaining fmancing through the issuance of revenue bonds, special assessment debt, certificates of participation in lease revenues and in straight leasing arrangements.
The underlying liability for the repayment of each of these issues rests with the borrower participating in that issue, and not with the Association, which acts only as a conduit in pooling each issue. For that reason, the Association has not recorded a liability for these issues . The Association sponsored the following outstanding conduit debt balances that were payable by their respective borrowers at June 30 :
Type ofFinancing
Revenue Bonds
Certificates of Participation
Total
I NOTE 7 - NET POSIDON
A. Entity-Wide Financial Statements - Net Position
Unpaid balance - June 30 2016 2015
$ 1 16,880,000 6,970,000
$123,850,000
$136,325,000 8,950,000
$145,275,000
Net Position is the excess of all the Association' s assets and deferred outflows of resources over all its liabilities and deferred inflows of resources, regardless of fund. The Association' s Net Position is divided into the three captions described below:
Net Investment in Capital Assets is the current net book value of the Association' s capital assets, less the outstanding balance of any debt issued to finance these assets.
Restricted describes the portion of Net Position which is restricted as to use by the terms and conditions of donations received by the Association. As of June 3 0, 20 16, the entire amount in Restricted Net Position is restricted for the support of the Tranter-Leong Internship Program.
Unrestricted describes the portion of the Net Position which may be used for any Association purpose.
B. Net Position Deficit
The Association has a deficit net position of $7,859,475 primarily due to the Association' s implementation of the Governmental Accounting Standards Board Statement 6 8 - Accounting and Financial Reporting for Pensions.
3 5
Item 7, Attachment 1B

ASSOCIATION OF BAY AREA GOVERNMENTS NOTES TO BASIC FINANCIAL STATEMENTS
For the Year Ended June 30, 2016
I NOTE 8 - PENSION PLAN
For purposes of measuring the net pension liability and deferred outflows/inflows of resources related to pensions, and pension expense, information about the fiduciary net position of the Plan and additions to/deductions from the Plan's fiduciary net position have been determined on the same basis as they are reported by the CalPERS Financial Office. For this purpose, benefit payments (including refunds of employee contributions) are recognized when currently due and payable in accordance with the benefit terms. Investments are reported at fair value.
A. General Information about the Pension Plan
Plan Description - All qualified permanent and probationary employees are eligible to participate in the Association' s Miscellaneous Employee Pension Rate Plan. The Association' s Miscellaneous Rate Plan are part of the public agency cost-sharing multiple-employer, which is administered by the California Public Employees' Retirement System (CalPERS). The employer participates in one costsharing multiple-employer defined benefit pension plan regardless of the number of rate plans the employer sponsors . Benefit provisions under the Plan are established by State statute and Board resolution. CalPERS issues publicly available reports that include a full description of the pension plan regarding benefit provisions, assumptions and membership information that can be found on the CalPERS website.
Benefits Provided - CalPERS provides service retirement and disability benefits, annual cost of living adjustments and death benefits to plan members, who must be public employees and beneficiaries. Benefits are based on years of credited service, equal to one year of full time employment. Members with five years of total service are eligible to retire at age 50 with statutorily reduced benefits. All members are eligible for non-duty disability benefits after 1 0 years of service. The death benefit is one of the following: the Basic Death Benefit, the 1957 Survivor Benefit, or the Optional Settlement 2W Death Benefit. The cost of living adjustments for each plan are applied as specified by the Public Employees' Retirement Law.
The Plan's provisions and benefits in effect at June 30, 20 1 6, are summarized as follows:
Hire date
Benefit formula
Benefit vesting schedule
Benefit payments
Retirement age Monthly b enefits , as a % of eligible compensation
Required employee contnbution rates
Required employer contnbution rates
Mis cellaneous
Tier I Prior to
January 1, 2013
2.5% @ 55
5 years s ervice
monthly for life
50 - 67+
2.0%-2.5%
8.00%
9.067%
Tier II On or after
January 1, 2013
2% @ 62
5 years service
monthly for life
52 - 67+
1.0%-2.5%
6.25%
6.237%
Beginning in fiscal year 2016, CalPERS collects employer contributions for the Plan as a percentage of payroll for the normal cost portion as noted in the rates above and as a dollar amount for contributions toward the unfunded liability and side fund. The dollar amounts are billed on a monthly basis . The Association's required contribution for the unfunded liability and side fund was $491 , 374 in fiscal year 20 1 6.
3 6
Item 7, Attachment 1B

ASSOCIATION OF BAY AREA GOVERNMENTS NOTES TO BASIC FINANCIAL STATEMENTS
For the Year Ended June 30, 2016
I NOTE 8 - PENSION PLAN (Continued)
Contributions - Section 208 14(c) of the California Public Employees' Retirement Law requires that the employer contribution rates for all public employers be determined on an annual basis by the actuary and shall be effective on the July 1 following notice of a change in the rate. Funding contributions for the Plan are determined annually on an actuarial basis as of June 30 by CalPERS. The actuarially determined rate is the estimated amount necessary to finance the costs of benefits earned by employees during the year, with an additional amount to finance any unfunded accrued liability. The Association is required to contribute the difference between the actuarially determined rate and the contribution rate of employees.
For the year ended June 3 0, 2016, the contributions to the Plan were as follows:
Contnbutions - employer
Miscellaneous
Tier I & II
Contnbutions - employee Gointly paid by employer and employee)
$491 ,374
436,643
B. Pension Liabilities, Pension Expenses and Deferred Outflows/Inflows of Resources Related to Pensions
For purposes of measuring the net pension liability and deferred outflows/inflows of resources related to pensions, and pension expense, information about the fiduciary net positon of the Plan and additions to/deductions from the Plan's fiduciary net position have been determined on the same basis as they are reported by the CalPERS Financial Office. For this purpose, benefit payments (including refunds of employee contributions) are recognized when currently due and payable in accordance with the benefit terms . Investments are reported at fair value.
As of June 3 0, 20 1 6, the Association reported a net pension liability for its proportionate share of the net pension liability of the Plan as follows:
Mis cellaneous Tier I & II
Total Net Pension Liability
3 7
Proportionate Share
ofNet Pens ion Liability
$12,998,297
$12,998,297
Item 7, Attachment 1B

ASSOCIATION OF BAY AREA GOVERNMENTS NOTES TO BASIC FINANCIAL STATEMENTS
For the Year Ended June 30, 2016
I NOTE 8 - PENSION PLAN (Continued)
The Association's net pension liability for the Plan is measured as the proportionate share of the net pension liability. The net pension liability of the Plan is measured as of June 30, 20 1 5, and the total pension liability for the Plan used to calculate the net pension liability was determined by an actuarial valuation as of June 30, 20 1 4 rolled forward to June 3 0, 20 1 5 using standard update procedures . The Association' s proportion of the net pension liability was based on a projection of the Association' s long-term share of contributions to the pension plan relative to the projected contributions of all participating employers, actuarially determined. The Association' s proportionate share of the net pension liability for the Plan as of June 3 0, 20 14 and 20 1 5 was as follows:
Proportion - June 30, 20 14
Proportion - June 30, 20 1 5
Change - Increase (Decrease)
Miscellaneous Tier I & II
0 .4744%
0 .473 8%
-0.0006%
For the year ended June 3 0, 20 1 6, the Association recognized pension expense of $345,674. At June 30, 20 1 6, the Association reported deferred outflows of resources and deferred inflows of resources related to pensions from the following sources:
Contnbutions made after the measurement date
Differences between actual and expected experience
Changes in ass umptions
Net differences in actual contnbutions and proportionate
contnbutions
Net differences between projected and actual earnings
on pens ion plan investments
Adjustments due to differences in proportion
Total
3 8
Miscellaneous Tier I & Tier Il
Deferred Outflows
of Resources
$491,374
83,655
216,775
1 ,286,443
$2,078,247
Deferred Inflows
ofResources
($791 ,456)
(396,767)
($1 , 188,223)
Item 7, Attachment 1B

ASSOCIATION OF BAY AREA GOVERNMENTS NOTES TO BASIC FINANCIAL STATEMENTS
For the Yea.r Ended June 30, 2016
I NOTE 8 - PENSION PLAN (Continued)
Deferred outflows of $491 ,374 related to contributions subsequent to the measurement date, will be recognized as a reduction of the net pension liability in the year ended June 30, 2016 . Other amounts reported as deferred inflows of resources related to pensions will be recognized as pension expense as follows:
Miscellaneous
Tier 1 & Tier 2
Year Ended Annual
June 3 0 Amortization
2017 ($38,965)
20 1 8 (26,796)
20 19 (42,752)
2020 507, 1 63
Thereafter
Actuarial Assumptions - For the measurement period ended June 3 0, 20 1 5, the total pension liability was determined by rolling forward the June 3 0, 20 14 total pension liability. The June 3 0, 20 14 and June 3 0, 20 1 5 total pension liability was based on the following actuarial methods and assumptions :
Valuation Date
Measurement Date
Actuarial Cost Method
Actuarial As sumptions :
Discount Rate
Inflation
Projected Salary Increase
Investment Rate of Return
Retirement Age
Mortality
Miscellaneous
Tier I and Tier II
June 30, 2014
June 30, 2015
Entry-Age Normal Cost Method
7.65%
2.75%
Depending on age, service and type of
employment
7.5% (1)
Based on CalPERS 2010 Experience Study for
period 1997 to 2007
Derived us ing CalPers Membership Data for
all Funds (2)
(I) Net of p ens ion p Ian investment and administrative exp ens es, including inflation.
(2) The mortality table used was develop ed based on Ca!PERS' sp ecific data The table
includes 20 years of mortality improvements using Society of Actuaries Scale AA. For
more details on this table, p lease refer to the Ca!PERS 20 I 0 exp erience study report
available on Ca!PERS' website.
3 9
Item 7, Attachment 1B
ASSOCIATION OF BAY AREA GOVERNMENTS NOTES TO BASIC FINANCIAL STATEMENTS
For the Year Ended June 30, 2016
I NOTE 8 - PENSION PLAN (Continued)
All other actuarial assumptions used in the June 3 0, 2014 valuation were based on the results of a January 2014 actuarial experience study for the period 1997 to 20 1 1 , including updates to salary increase, mortality and retirement rates. Further details of the Experience Study can be found on the CalPERS website under Forms and Publications.
Change of Assumptions - GASB 68, paragraph 68 states that the long-term expected rate of return should be determined net of pension plan investment expense, but without reduction for pension plan administrative expense. The discount rate of 7 .50 percent used for the June 3 0, 2014 measurement date was net of administrative expenses. The discount rate of 7 .65 percent used for the June 3 0, 20 1 5 measurement date i s without reduction of pension plan administrative expense. All other assumptions for the June 3 0, 20 14 measurement date were the same as those used for the June 30, 20 1 5 measurement date.
Discount Rate - The discount rate used to measure the total pension liability was 7 .65% for the Plan. To determine whether the municipal bond rate should be used in the calculation of a discount rate for each plan, CalPERS stress tested plans that would most likely result in a discount rate that would be different from the actuarially assumed discount rate. Based on the testing, none of the tested plans run out of assets . Therefore, the current 7 .65 discount rate is adequate and the use of the municipal bond rate calculation is not necessary. The long term expected discount rate of 7 .65 will be applied to all plans in the Public Employees Retirement Fund (PERF). The stress test results are presented in a detailed report that can be obtained from the CalPERS website.
The long-term expected rate of return on pension plan investments was determined using a buildingblock method in which best-estimate ranges of expected future real rates of return (expected returns, net of pension plan investment expense and inflation) are developed for each major asset class.
In determining the long-term expected rate of return, CalPERS took into account both short-term and long-term market return expectations as well as the expected pension fund cash flows. Using historical returns of all the funds' asset classes, expected compound (geometric) returns were calculated over the short-term (first 10 years) and the long-term ( 1 1 -60 years) using a building-block approach. Using the expected nominal returns for both short-term and long-term, the present value of benefits was calculated for each fund. The expecte9 rate of return was set by calculating the single equivalent expected return that arrived at the same present value of benefits for cash flows as the one calculated using both short-term and long-term returns. Such cash flows were developed assuming that both members and employers will make their required contributions on time and as scheduled in all future years. The expected rate of return was then set equivalent to the single equivalent rate calculated above and rounded down to the nearest one quarter of one percent.
In December 20 1 6, CalPERS' Board of Directors voted to lower the discount rate used in its actuarial valuations from 7 .5% to 7.0% over three fiscal years, beginning in fiscal year 2018 . The change in the discount rate will affect the contribution rates for employers beginning in fiscal year 2019, and result in increases to employers ' normal costs and unfunded actuarial liabilities .
40
Item 7, Attachment 1B

ASSOCIATION OF BAY AREA GOVERNMENTS NOTES TO BASIC FINANCIAL STATEMENTS
For the Year Ended June 30, 2016
I NOTE 8 - PENSION PLAN (Continued)
The table below reflects the long-term expected real rate of return by asset class. The rate of return was calculated using the capital market assumptions applied to determine the discount rate and asset allocation. These geometric rates of return are net of administrative expenses.
New Strategic Real Return Real Return
Asset Clas s Allocation Years 1 - lO(a) Years l H{b)
Global Equity 51% 5.25% 5.71%
Private Equity 19%1 0.99"/o 2.43%
Global Fixed Income 6% 0.45% 3 .36%
liquidity 10% 6.83% 6.95%
Real Assets 10% 4.50% 5. 13%
Inflation Sensitive Assets 2% 4.50% 5.09%
Absolute Return Strategy (ARS) 2% -0.55% -1 .05%
Total 100%
Sensitivity of the Proportionate Share of the Net Pension Liability to Changes in the Discount Rate The following presents the Association' s proportionate share of the net pension liability for the Plan, calculated using the discount rate for the Plan, as well as what the Association' s proportionate share of the net pension liability would be if it were calculated using a discount rate that is I -percentage point lower or I -percentage point higher than the current rate:
!% Decrease
Net Pension Liability
Current Discount Rate Net Pension Liability
1 % Increase
Net Pension Liability
Miscellaneous Tier I & II
6.65%
$ 1 8,75 1 ,0 1 3
7 .65%
$ 12,998,297
8 .65%
$8,248,76 1
Pension Plan Fiduciary Net Position - Detailed information about each pension plan ' s fiduciary net position is available in the separately issued CalPERS financial reports.
4 1
Item 7, Attachment 1B
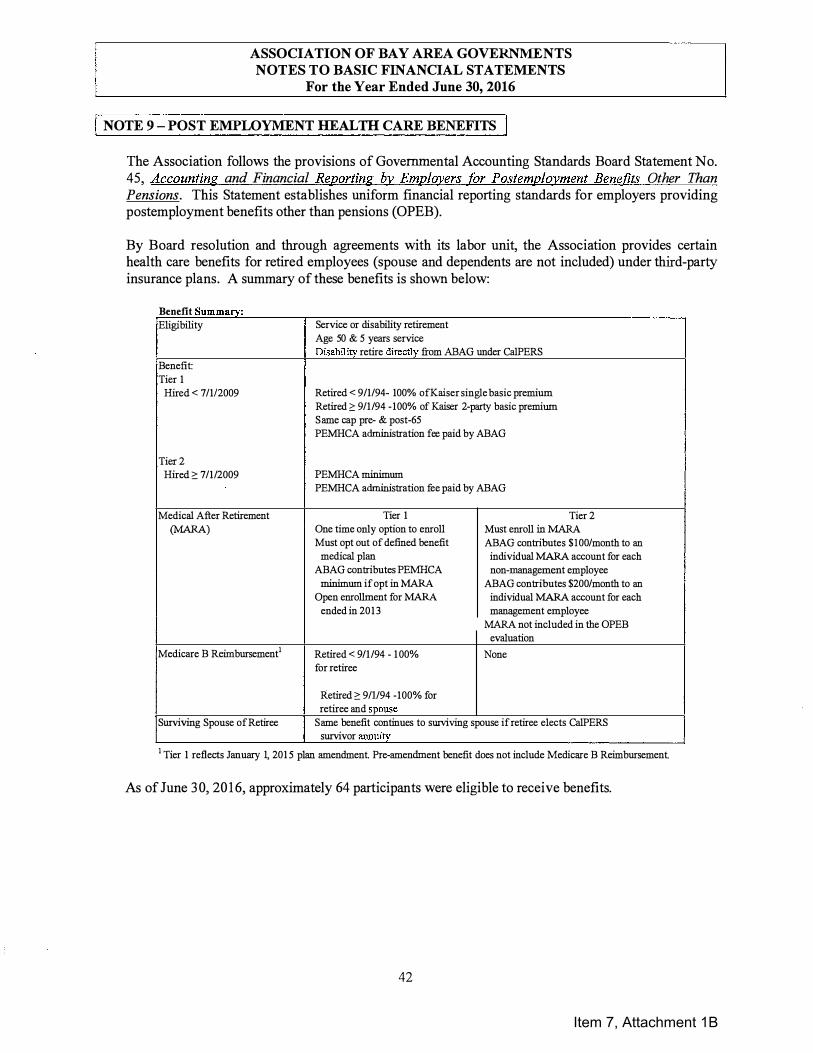
ASSOCIATION OF BAY AREA GOVERNMENTS NOTES TO BASIC FINANCIAL STATEMENTS
For the Year Ended June 30, 2016
I NOTE 9 - POST EMPLOYMENT HEALTH CARE BENEFITS I
The Association follows the provisions of Governmental Accounting Standards Board Statement No. 45, Accounting and Financial Reporting by Employers for Postemployment Benefits Other Than Pensions. This Statement establishes uniform financial reporting standards for employers providing postemployment benefits other than pensions (OPEB).
By Board resolution and through agreements with its labor unit, the Association provides certain health care benefits for retired employees (spouse and dependents are not included) under third-party insurance plans. A summary of these benefits is shown below:
Benefit Summarv:
Eligibility Service or disability retirement Age 50 & 5 years service Disability retire directly from ABAG under CalPERS
Benefit: Tier 1
Hired < 7/112009 Retired < 9/1/94- 100% of Kaiser single basic premium Retired 2'. 9/1/94 - 100% of Kaiser 2-party basic premium Same cap pre- & post-65 PEMHCA administration fee paid by ABAG
Tier 2 Hired 2'. 7 /1/2009 PEMHCA minimum
PEMHCA administration fee paid by ABAG
Medical After Retirement Tier 1 Tier 2 (MARA) One time only option to emoll Must emoll in MARA
Must opt out of defined benefit ABAG contributes $ 100/month to an medical plan individual MARA account for each
ABAG contributes PEMHCA non-management employee minimum if opt in MARA ABAG contributes $200/month to an
Open emollment for MARA individual MARA account for each ended in 20 13 management employee
MARA not included in the OPEB evaluation
Medicare B Reimbursement1 Retired < 9/1/94 - 1 00% None for retiree
Retired 2'. 9/1/94 - 100% for retiree and spouse
Surviving Spouse of Retiree Same benefit continues to surviving spouse if retiree elects CalPERS survivor annuity
1 Tier 1 reflects January 1, 201 5 plan amendment. Pre-amendment benefit does not include Medicare B Reimbursement.
As of June 3 0, 20 1 6, approximately 64 participants were eligible to receive benefits.
42
Item 7, Attachment 1B

ASSOCIATION OF BAY AREA GOVERNMENTS NOTES TO BASIC FINANCIAL STATEMENTS
For the Year Ended June 30, 2016
I NOTE 9 - POST EMPLOYMENT HEALTH CARE BENEFITS (Continued) I
Funding Policy and Actuarial Assumptions
The annual required contribution (ARC) was determined as part of a June 3 0, 20 13 actuarial valuation using the entry age normal actuarial cost method. This is a projected benefit cost method, which takes into account those benefits that are expected to be earned in the future as well as those already accrued. The actuarial assumptions included (a) 7.61 % investment rate of return, (b) 3 .25% projected annual salary increase, include inflation and (c) 5 .0 - 7.8% health inflation increase. The actuarial methods and assumptions used include techniques that smooth the effects of short-term volatility in actuarial accrued liabilities and the actuarial value of assets. Actuarial calculations reflect a long-term perspective and actuarial valuations involve estimates of the value of reported amounts and assumptions about the probability of events far into the future. Actuarially determined amounts are subject to revision at least biannually as results are compared to past expectations and new estimates are made about the future. The Association's OPEB unfunded actuarial accrued liability is being amortized as a level percentage of projected payroll using a 2 1 year closed amortization period.
In accordance with the Association' s budget, the annual required contribution (ARC) is to be funded throughout the year as a percentage of payroll. Concurrent with implementing Statement No. 45, the Association' s Board passed a resolution to participate in the California Employers Retirees Benefit Trust (CERBT), an irrevocable trust established to fund OPEB. CERBT is administered by CalPERS, and is managed by an appointed board not under the control of Association Board. This Trust is not considered a component unit by the Association and has been excluded from these financial statements. Separately issued financial statements for CERBT may be obtained from CALPERS at P.O. Box 942709, Sacramento, CA 94229-2709.
43
Item 7, Attachment 1B

ASSOCIATION OF BAY AREA GOVERNMENTS NOTES TO BASIC FINANCIAL STATEMENTS
For the Year Ended June 30, 2016
I NOTE 9 - POST EMPLOYMENT HEALTH CARE BENEFITS (Continued) I
Funding Progress and Funded Status
Generally accepted accounting principles permit contributions to be treated as OPEB assets and deducted from the Actuarial Accrued Liability when such contributions are placed in an irrevocable trust or equivalent arrangement. During the fiscal year ended June 30, 20 1 6, the Association contributed $786,756 which represented 1 1 .89% of the $6, 6 1 6,000 of covered payroll. As a result, the Association has recorded the Net OPEB Obligation, the difference between the ARC and actual contributions, as presented below:
Net OPEB Obligation June 30, 201 5
Annual required contribution (ARC)
Interest on net OPEB obligation
Implied subsidy
Adjustment to annual required contnbution
Annual OPEB cost
Contributions made : Contributions to CERBT
$401,777
761,000
33,000
(42,000)
(77,5 10)
674.490
Association's portion of current year premiums paid 401.777 384,979
Total contributions 786,756
Change in net OPEB Liability ( 1 12,266)
Net OPEB Obligation June 30, 2016 $289,5 1 1
The Plan's annual required contributions and actual contributions for the last three fiscal years are set forth below:
Percentage of
Annual OPEB Actual AOC Net OPEB
Fiscal Year Cost {AOC) Contnbutions Contributed Obligation
6/30/2014 $826,995 $893,739 108% $599,976
6/30/201 5 695,675 893,874 128% 401,777
6/30/2016 674,490 786,756 1 17% 289,5 1 1
44
Item 7, Attachment 1B

ASSOCIATION OF BAY AREA GOVERNMENTS NOTES TO BASIC FINANCIAL STATEMENTS
For the Year Ended June 30, 2016
I NOTE 10 - COMl\.flTMENTS AND CONTINGENT LIABILITIES
A. Federal and State Grant Programs
The Association participates in Federal and State grant programs. These programs have been audited by the Association's independent accountants through the fiscal year ended June 3 0, 20 16 in accordance with the provisions of the Federal Single Audit Act, as amended, and applicable State requirements. No cost disallowances were proposed as a result of these audits; however, these programs are still subject to further examination by the grantors and the amount, if any, of expenditures which may be disallowed by the granting agencies cannot be determined at this time. The Association expects such amounts, if any, to be immaterial.
B. Staff Consolidation
On May 25, 20 16, the governing bodies of ABAG and MTG voted to support a full :functional staff consolidation and the pursuit of new governance options . This resolution retains the independence and statutory responsibilities of both boards and calls for new governance options to be considered by ABAG and MTC over the longer term. In the near term, both ABAG and MTG are developing a Contract for Services to officially consolidate the two staffs under the MTC executive director and to continue funding ABAG's projects and activities. Under the Contract of Services the organization and the fmancial structure of ABAG will not significantly change and ABAG will continue to exist as a separate entity.
45
Item 7, Attachment 1B

This Page Left Intentionally Blank
Item 7, Attachment 1B

Required Supplemental Information
Item 7, Attachment 1B

This Page Left Intentionally Blank
Item 7, Attachment 1B

ASSOCIATION OF BAY AREA GOVERNMENTS REQUIRED SUPPLEMENTAL INFORMATION
For the Year Ended June 30, 2016
As s ociation of Bay Area Governments, a Cost-S haring Defined Pens ion Plan
As of fis cal year ending June 3 0 , 2 0 1 6 Last lO Years *
S CHEDULE OF CHANGES IN TBE NEf PENSION LIABil..JfY AND RELATID RATIOS
Mis cellaneous Miscellaneous
Tier I & II lier I & II
Meas urement Date 6/30/2 0 1 5 6/30/2 0 1 4
Plan's Proportion ofthe Net Pens ion liability/Asset 0.4738% 0.4744% Plan's Proportionate Share of the Net Pens ion
Llability/(Asset) $12,998,297 $ 1 1,357,673
Plan's Covered-Employee Payroll $6,038,648 $7,230,571 Plan's Proportionate Share of the Net Pension
Llability/(Asset) as a Percentage ofits Covered-Employee
Payroll 215 .25% 157.08"/o Plan's Proportionate Share of the Fiduciary Net Position
as a Percentage of the Plan's Total Pens ion Liability 0.2144% 0.2256%
* Fis cal year 2015 was the 1st year of implementation, therefore only two years are shown.
49
Item 7, Attachment 1B
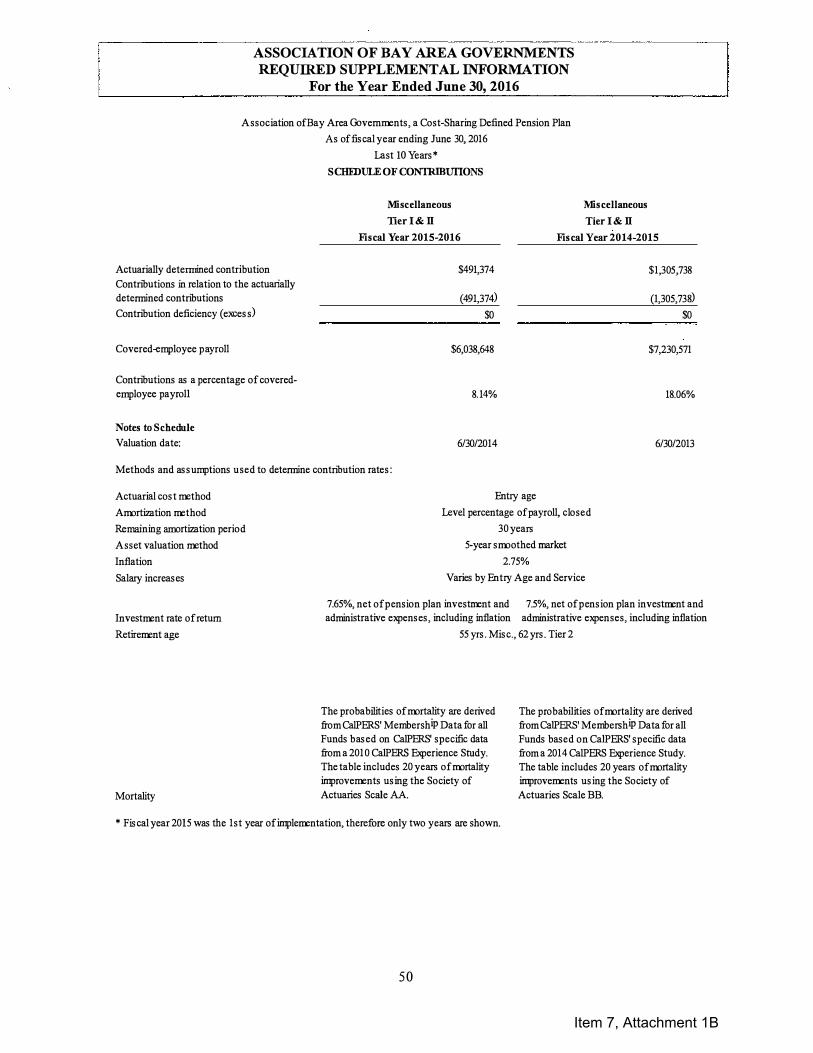
ASSOCIATION OF BAY AREA GOVERNMENTS REQUIRED SUPPLEMENTAL INFORMATION
For the Year Ended June 30, 2016
Association ofBay Area Governments , a Cost-Sharing Defined Pension Plan
As of fis cal year ending June 30, 2016
Actuarially detennined contribution
Contnbutions in relation to the actuarially
detennined contnbutions
Contnbution deficiency (exces s)
Covered-employee p ayroll
Contnbutions as a percentage of covered
employee payroll
Notes to S chedule
Valuation date:
Last IO Years *
S CHIDULE OF CONfRIBUTIONS
Miscellaneous
Tier I & II Fis cal Year 2015-2016
$491,374
(491,374)
$0
$6,038,648
8. 14%
6/30/2014
Mis cellaneous
Tier I & II Fis cal Year 2014-2015
$1,305,738
(l,305, 738)
$0
$7,230,571
18.06%
6/30/2013
Methods and as s umptions used to detennine contribution rates :
Actuarial cos t method
Amortization method
Remaining amortization period
Asset valuation method
Inflation
Salary increas es
Investment rate ofretum
Retirement age
Mortality
Enny age
Level percentage of payroll, closed
30 years
5-year smoothed market
2.75%
Varies by Entry Age and Service
7.65%, net of pension plan investment and 7.5%, net of pens ion plan investment and
administrative expens es , including inflation administrative expenses, including inflation
55 yrs . Mis c., 62 yrs . Tier 2
The probabilities of mortality are derived
from CalPERS' Membership Data for all
Funds bas ed on CalPERS' specific data
from a 201 0 CalPERS Experience Study.
The table includes 20 years of mortality
improvements us ing the Society of
Actuaries Scale AA.
The probabilities of mortality are derived
from CalPERS' Membership Data for all
Funds based on CalPERS' specific data
from a 2014 CalPERS Experience Study.
The table includes 20 years of mortality
improvements us ing the Society of
Actuaries Scale BB.
* Fis cal year 2015 was the 1st year of implementation, therefore only two years are shown.
50
Item 7, Attachment 1B

Valuation
Date
6/30/2009
6/30/201 1 .
6/30/2013
ASSOCIATION OF BAY AREA GOVERNMENTS REQUIRED SUPPLEMENTAL INFORMATION
For the Year Ended June 30, 2016
Association of Bay Area Governments, Otl).er Post Employment Benefits
As of fJScal year ending June 30, 2016
Last 3 Valuations
SCHEDULE OF FUNDING CONTRIBUTIONS
Actuarial
Unfunded Unfunded ( over:funded)
Value of Accrued Accrued Funded Covered Actual Liability as % of
Assets Liability Liability Ratio Payroll Covered Payroll
$0 $4,346,000 $4,346,000 0.00% $6,616,000 63 .6%
1,226,000 6,684,000 5,458,000 1 8.34% 6,684,000 8 1 . 7%
2,754,000 7,675,000 4,921 ,000 35 .88% 6,871 ,000 71 .6%
5 1
Item 7, Attachment 1B

This Page Left Intentionally Blank
Item 7, Attachment 1B

ASSOCIATION OF BAY AREA GOVERNMENTS MEMORANDUM ON INTERNAL CONTROL
AND
REQUJRED COMMUNICATIONS
FOR THE YEAR ENDED JUNE 30, 2016
Item 7, Attachment 1C

This Page Left Intentionally Blank
Item 7, Attachment 1C

ASSOCIATION OF BAY AREA GOVERNMENTS MEMORANDUM ON INTERNAL CONTROL
AND
REQUIRED COMMUNICATIONS
For The Year Ended June 30, 2016
Table of Contents
Memorandum on Internal Control ....................................................................................................... l
Schedule of Other Matters, .......................................................................................................... 3
Required Communications ............ . ..................................................................................................... 11
Significant Findings ..................................................................................................................... 11
Accounting Policies ........................................................................................................... . ...... 11
Unusual Transactions, Controversial or Emerging Areas ...................................................... 13
Accounting Estimates ............................................................................................................... 13
Disclosures ................................................................................................................................. 14
Difficulties Encountered in Performing the Audit .................................................................. 14
Corrected and Uncorrected Misstatements ........................................................................ ...... 14
Disagreements with Management ............................................................................................ 14
Management Representations .................................................................................................... 14
Management Consultations with Other Independent Accountants ........................................ 14
Other Audit Findings and Issues ............................................................. . ................... . ............. 14
Other Information Accompanying the Financial Statements ................................................ 15
Item 7, Attachment 1C

This Page Left Intentionally Blank
Item 7, Attachment 1C

MEMORANDUM ON INTERNAL CONTROL
To the Executive Board of the Association of Bay Area Governments San Francisco, California
In planning and performing our audit of the basic financial statements of the Association of Bay Area Governments (Association) as of and for the year ended June 30, 2016, in accordance with auditing standards generally accepted in the United States of America, we considered the Association's internal control over financial reporting (internal control) as a basis for designing our audit procedures that are appropriate in the circumstances for the purpose of expressing our opinions on the financial statements, but not for the purpose of expressing an opinion on the effectiveness of the Association's internal control. Accordingly, we do not express an opinion on the effectiveness of the Association's internal control.
A deficiency in internal control exists when the design or operation of a control does not allow management or employees, in the normal course of performing their assigned functions, to prevent, or detect and correct misstatements on a timely basis. A material weakness is a deficiency, or a combination of deficiencies, in internal control, such that there is a reasonable possibility that a material misstatement of the Association's financial statements will not be prevented, or detected and corrected, on a timely basis.
Our consideration of internal control was for the limited purpose described in the first paragraph and was not designed to identify all deficiencies in internal control that might be material weaknesses. In addition, because of inherent limitations in internal control, including the possibility of management override of controls, misstatements due to error or fraud may occur and not be detected by such controls. Given these limitations, during our audit we did not identify any deficiencies in internal control that we consider to be material weaknesses. However, material weaknesses may exist that have not been identified.
Included in the Schedule of Other Matters are recommendations not meeting the above definitions that we believe are opportunities for strengthening internal controls and operating efficiency.
Management's written responses included in this report have not been subjected to the audit procedures applied in the audit of the financial statements and, accordingly, we express no opinion on them.
This communication is intended solely for the information and use of management, Board of Directors, others within the organization, and is not intended to be and should not be used by anyone other than these specified parties.
Pleasant Hill, California February 10, 2017
Accountancy Corporation
3478 Buskirk Avenue, Suite 215
Pleasant Hill, CA 94523
1
T 925.930.0902
F 925.930.0135
w mazeassociates.com
Item 7, Attachment 1C

This Page Left Intentionally Blank
Item 7, Attachment 1C
MEMORANDUM ON INTERNAL CONTROL
SCHEDULE OF OTHER MATTERS
FS2016-01 Upcoming Governmental Accounting Standards Board Pronouncements
The following pronouncements are effective in fiscal year 2016/17:
GASB 73 -Accounting and Financial Reporting for Pensions and Related Assets That Are Not within the Scope of GASB Statement 68, and Amendments to Certain Provisions of GASB Statements 67 and 68
This Statement establishes requirements for defined benefit pensions that are not within the scope of Statement No. 68, Accounting and Financial Reporting for Pensions, as well as for the assets accumulated for purposes of providing those pensions. In addition, it establishes requirements for defined contribution pensions that are not within the scope of Statement 68. It also amends certain provisions of Statement No. 67, Financial Reporting for Pension Plans, and Statement 68 for pension plans and pensions that are within their respective scopes.
The requirements of this Statement extend the approach to accounting and financial reporting established in Statement 68 to all pensions, with modifications as necessary to reflect that for accounting and financial reporting purposes, any assets accumulated for pensions that are provided through pension plans that are not administered through trusts that meet the criteria specified in Statement 68 should not be considered pension plan assets. It also requires that information similar to that required by Statement 68 be included in notes to financial statements and required supplementary information by all similarly situated employers and nonemployer contributing entities.
This Statement also clarifies the application of certain provisions of Statements 67 and 68 with regard to the following issues:
1. Information that is required to be presented as notes to the 10-year schedules of required supplementary information about investment-related factors that significantly affect trends in the amounts reported
2. Accounting and financial reporting for separately financed specific liabilities of individual employers and nonemployer contributing entities for defined benefit pensions
3. Timing of employer recognition of revenue for the support of nonemployer contributing entities not in a special funding situation.
GASB 74 - Financial Reporting for Post-employment Benefit Plans Other Than Pension Plans
The objective of this Statement is to improve the usefulness of information about postemployment benefits other than pensions (other postemployment benefits or OPEB) included in the general purpose external financial reports of state and local governmental OPEB plans for making decisions and assessing accountability. This Statement results from a comprehensive review of the effectiveness of existing standards of accounting and financial reporting for all postemployment benefits (pensions and OPEB) with regard to providing decision-useful information, supporting assessments of accountability and interperiod equity, and creating additional transparency.
3
Item 7, Attachment 1C

MEMORANDUM ON INTERNAL CONTROL
SCHEDULE OF OTHER MATTERS
This Statement replaces Statements No. 43, Financial Reporting for Postemployment Benefit Plans Other Than Pension Plans, as amended, and No. 57, OPEB Measurements by Agent Employers and Agent Multiple-Employer Plans. It also includes requirements for defined contribution OPEB plans that replace the requirements for those OPEB plans in Statement No. 25, Financial Reporting for Defined Benefit Pension Plans and Note Disclosures for Defined Contribution Plans, as amended, Statement 43, and Statement No. 50, Pension Disclosures.
Statement No. 75, Accounting and Financial Reporting for Postemployment Benefits Other Than Pensions, establishes new accounting and financial reporting requirements for governments whose employees are provided with OPEB, as well as for certain nonemployer governments that have a legal obligation to provide financial support for OPEB provided to the employees of other entities.
The scope of this Statement includes OPEB plans--defined benefit and defined contributionadministered through trusts that meet the following criteria:
Contributions from employers and nonemployer contributing entities to the OPEB plan and earnings on those contributions are irrevocable.
OPEB plan assets are dedicated to providing OPEB to plan members in accordance with the benefit terms.
OPEB plan assets are legally protected from the creditors of employers, nonemployer contributing entities, and the OPEB plan administrator. If the plan is a defined benefit OPEB plan, plan assets also are legally protected from creditors of the plan members.
This Statement also includes requirements to address financial reporting for assets accumulated for purposes of providing defined benefit OPEB through OPEB plans that are not administered through trusts that meet the specified criteria.
GASB 77 - Tax Abatement Disclosures
This Statement establishes financial reporting standards for tax abatement agreements entered into by state and local governments. The disclosures required by this Statement encompass tax abatements resulting from both (a) agreements that are entered into by the reporting government and (b) agreements that are entered into by other governments and that reduce the reporting government's tax revenues.
4
Item 7, Attachment 1C

MEMORANDUM ON INTERNAL CONTROL
SCHEDULE OF OTHER MATTERS
This Statement requires governments that enter into tax abatement agreements to disclose the following information about the agreements:
• Brief descriptive information, such as the tax being abated, the authority under which tax abatements are provided, eligibility criteria, the mechanism by which taxes are abated, provisions for recapturing abated taxes, and the types of commitments made by tax abatement recipients
• The gross dollar amount of taxes abated during the period
• Commitments made by a government, other than to abate taxes, as part of a tax abatement agreement.
Governments should organize those disclosures by major tax abatement program and may disclose information for individual tax abatement agreements within those programs.
Tax abatement agreements of other governments should be organized by the government that entered into the tax abatement agreement and the specific tax being abated. Governments may disclose information for individual tax abatement agreements of other governments within the specific tax being abated. For those tax abatement agreements, a reporting government should disclose:
• The names of the governments that entered into the agreements
• The specific taxes being abated
• The gross dollar amount of taxes abated during the period
GASB 78 - Pensions Provided through Certain Multiple-Emolover Defined Benefit Pension Plans
The objective of this Statement is to address a practice issue regarding the scope and applicability of Statement No. 68, Accounting and Financial Reporting for Pensions. This issue is associated with pensions provided through certain multiple-employer defined benefit pension plans and to state or local governmental employers whose employees are provided with such pensions.
Prior to the issuance of this Statement, the requirements of Statement 68 applied to the financial statements of all state and local governmental employers whose employees are provided with pensions through pension plans that are administered through trusts that meet the criteria in paragraph 4 of that Statement.
This Statement amends the scope and applicability of Statement 68 to exclude pensions provided to employees of state or local governmental employers through a cost-sharing multiple-employer defined benefit pension plan that (1) is not a state or local governmental pension plan, (2) is used to provide defined benefit pensions both to employees of state or local governmental employers and to employees of employers that are not state or local governmental employers, and (3) has no predominant state or local governmental employer (either individually or collectively with other state or local governmental employers that provide pensions through the pension plan). This Statement establishes requirements for recognition and measurement of pension expense, expenditures, and liabilities; note disclosures; and required supplementary information for pensions that have the characteristics described above.
5
Item 7, Attachment 1C

MEMORANDUM ON INTERNAL CONTROL
SCHEDULE OF OTHER MATTERS
GASB 80 - Blending Requirements [Or Certain Component Units-an amendment of GASB Statement No.14
The objective of this Statement is to improve fmancial reporting by clarifying the fmancial statement presentation requirements for certain .component units. This Statement amends the blending requirements established in paragraph 53 of Statement No. 14, The Financial Reporting Entity, as amended.
This Statement amends the blending requirements for the financial statement presentation of component units of all state and local governments. The additional criterion requires blending of a component unit incorporated as a not-for-profit corporation in which the primary government is the sole corporate member. The additional criterion does not apply to component units included in the fmancial reporting entity pursuant to the provisions of Statement No. 39, Determining Whether Certain Organizations Are Component Units.
How the Changes in This Statement Improve Financial Reporting
The requirements of this Statement enhance the comparability of fmancial statements among governments. Greater comparability improves the decision-usefulness of information reported in fmancial statements and enhances its value for assessing government accountability.
GASB 82 - Pension Issues-an amendment of GASB Statements No. 67, No. 68, and No. 73
The objective of this Statement is to address certain issues that have been raised with respect to Statements No. 67, Financial Reporting for Pension Plans, No. 68, Accounting and Financial Reporting for Pensions, and No. 73, Accounting and Financial Reporting for Pensions and Related Assets That Are Not within the Scope of GASB Statement 68, and Amendments to Certain Provisions of GASB Statements 67 and 68. Specifically, this Statement addresses issues regarding (1) the presentation of payroll-related measures in required supplementary information, (2) the selection of assumptions and the treatment of deviations from the guidance in an Actuarial Standard of Practice for financial reporting purposes, and (3) the classification of payments made by employers to satisfy employee (plan member) contribution requirements.
Presentation of Payroll-Related Measures in Required Supplementary Information
Prior to the issuance of this Statement, Statements 67 and 68 required presentation of covered-employee payroll, which is the payroll of employees that are provided with pensions through the pension plan, and ratios that use that measure, in schedules of required supplementary information. This Statement amends Statements 67 and 68 to instead require the presentation of covered payroll, defined as the payroll on which contributions to a pension plan are based, and ratios that use that measure.
6
Item 7, Attachment 1C

MEMORANDUM ON INTERNAL CONTROL
SCHEDULE OF OTHER MATTERS
Selection of Assumptions
This Statement clarifies that a deviation, as the term is used in Actuarial Standards of Practice issued by the Actuarial Standards Board, from the guidance in an Actuarial Standard of Practice is not considered to be in conformity with the requirements of Statement 67, Statement 68, or Statement 73 for the selection of assumptions used in determining the total pension liability and related measures.
Classification of Employer-Paid Member Contributions
This Statement clarifies that payments that are made by an employer to satisfy contribution requirements that are identified by the pension plan terms as plan member contribution requirements should be classified as plan member contributions for purposes of Statement 67 and as employee contributions for purposes of Statement 68. It also requires that an employer's expense and expenditures for those amounts be recognized in the period for which the contribution is assessed and classified in the same manner as the employer classifies similar compensation other than pensions (for example, as salaries and wages or as fringe benefits).
7
Item 7, Attachment 1C

MEMORANDUM ON INTERNAL CONTROL
SCHEDULE OF OTHER MATTERS
The following pronouncements are effective in fiscal year 2017 /18:
GASB 75 -Accounting and Financial Reporting for Post-employment Benefits Other Than Pensions
The primary objective of this Statement is to improve accounting and financial reporting by state and local governments for post-employment benefits other than pensions (other post-employment benefits or OPEB). It also improves information provided by state and local governmental employers about financial support for OPEB that is provided by other entities. This Statement results from a comprehensive review of the effectiveness of existing standards of accounting and financial reporting for all post-employment benefits (pensions and OPEB) with regard to providing decision-useful information, supporting assessments of accountability and inter-period equity, and creating additional transparency.
This Statement replaces the requirements of Statements No. 45, Accounting and Financial Reporting by Employers for Postemployment Benefits Other Than Pensions, as amended, and No. 57, OPEB Measurements by Agent Employers and Agent Multiple-Employer Plans, for OPEB. Statement No. 74, Financial Reporting for Postemployment Benefit Plans Other Than Pension Plans, establishes new accounting and financial reporting requirements for OPEB plans.
The scope of this Statement addresses accounting and financial reporting for OPEB that is provided to the employees of state and local governmental employers. This Statement establishes standards for recognizing and measuring liabilities, deferred outflows of resources, deferred inflows of resources, and expense/expenditures. For defined benefit OPEB, this Statement identifies the methods and assumptions that are required to be used to project benefit payments, discount projected benefit payments to their actuarial present value, and attribute that present value to periods of employee service. Note disclosure and required supplementary information requirements about defined benefit OPEB also are addressed.
In addition, this Statement details the recognition and disclosure requirements for employers with payables to defined benefit OPEB plans that are administered through trusts that meet the specified criteria and for employers whose employees are provided with defined contribution OPEB. This Statement also addresses certain circumstances in which a nonemployer entity provides financial support for OPEB of employees of another entity.
In this Statement, distinctions are made regarding the particular requirements depending upon whether the OPEB plans through which the benefits are provided are administered through trusts that meet the following criteria:
Contributions from employers and nonemployer contributing entities to the OPEB plan and earnings on those contributions are irrevocable.
• OPEB plan assets are dedicated to providing OPEB to plan members in accordance with the benefit terms.
• OPEB plan assets are legally protected from the creditors of employers, nonemployer contributing entities, the OPEB plan administrator, and the plan members.
8
Item 7, Attachment 1C

MEMORANDUM ON INTERNAL CONTROL
SCHEDULE OF OTHER MATTERS
GASB 81 - Irrevocable Split-Interest Agreements
The objective of this Statement is to improve accounting and financial reporting for irrevocable splitinterest agreements by providing recognition and measurement guidance for situations in which a government is a beneficiary of the agreement.
Split-interest agreements are a type of giving agreement used by donors to provide resources to two or more beneficiaries, including governments. Split-interest agreements can be created through trusts-Qr other legally enforceable agreements with characteristics that are equivalent to split-interest agreementsin which a donor transfers resources to an intermediary to hold and administer for the benefit of a government and at least one other beneficiary. Examples of these types of agreements include charitable lead trusts, charitable remainder trusts, and life-interests in real estate.
This Statement requires that a government that receives resources pursuant to an irrevocable split-interest agreement recognize assets, liabilities, and deferred inflows of resources at the inception of the agreement. Furthermore, this Statement requires that a government recognize assets representing its beneficial interests in irrevocable split-interest agreements that are administered by a third party, if the government controls the present service capacity of the beneficial interests. This Statement requires that a government recognize revenue when the resources become applicable to the reporting period.
How the Changes in This Statement Improve Financial Reporting
This Statement enhances the comparability of financial statements by providing accounting and financial reporting guidance for irrevocable split-interest agreements in which a government is a beneficiary. This Statement also enhances the decision-usefulness of general purpose external financial reports, and their value for assessing accountability, by more clearly identifying the resources that are available for the government to carry out its mission.
9
Item 7, Attachment 1C
This Page Left Intentionally Blank
Item 7, Attachment 1C

REQUIRED COMMUNICATIONS
February 10, 2017
To the Executive Board of the Association of Bay Area Governments San Francisco, California
We have audited the basic financial statements of the Association of Bay Area Govei'nments for the year ended June 30, 2016. Professional standards require that we communicate to you the following information related to our audit under generally accepted auditing standards and, Government Auditing Standards and Uniform Guidance.
Significant Audit Findings
Accounting Policies
Management is responsible for the selection and use of appropriate accounting policies. The significant accounting policies used by the Association are described in Note 1 to the financial statements. No new accounting policies were adopted and the application of existing policies was not changed during the year, except as follows:
GASB Statement No. 72 -Fair Value Measurement and Application
The intention of this Statement is to enhance the comparability of financial statements among governments by requiring measurement of certain assets and liabilities at fair value using a consistent and more detailed definition of fair value and accepted valuation techniques. It also enhances fair value application guidance and related disclosures.
GASB 76 - The Hierarchy of Generally Accepted Accounting Principles for State and Local Governments
The objective of this Statement is to identify, in the context of the current governmental financial reporting environment, the hierarchy of generally accepted accounting principles (GAAP). The "GAAP hierarchy" consists of the sources of accounting principles used to prepare financial statements of state and local governmental entities in conformity with GAAP and the framework for selecting those principles. This Statement reduces the GAAP hierarchy to two categories of authoritative GAAP and addresses the use of authoritative and non-authoritative literature in the event that the accounting treatment for a transaction or other event is not specified within a source of authoritative GAAP. This Statement supersedes Statement No. 55, The Hierarchy of Generally Accepted Accounting Principles for State and Local Governments.
Accountancy Corporation
3478 Buskirk Avenue, Suite 215
Pleasant Hill, CA 94523
1 1
T 925.930.0902
F 925.930.0135
w mazeassociates.com
Item 7, Attachment 1C

The requirements in this Statement improve financial reporting by (1) raising the category of GASB Implementation Guides in the GAAP hierarchy, thus providing the opportunity for broader public input on implementation guidance; (2) emphasizing the importance of analogies to authoritative literature when the accounting treatment for an event is not specified in authoritative GAAP; and (3) requiring the consideration of consistency with the GASB Concepts Statements when evaluating accounting treatments specified in nonauthoritative literature. As a result, governments will apply financial reporting guidance with less variation, which will improve the usefulness of financial statement information for making decisions and assessing accountability and enhance the comparability of financial statement information among governments.
The pronouncement became effective, but did not have a material effect on the financial statements
GASB 79- Certain External Investment Pools and Pool Participants
The requirements of this Statement are effective for reporting periods beginning after June 15, 2015, except for certain provisions on portfolio quality, custodial credit risk, and shadow pricing. Those provisions are effective for reporting periods beginning after December 15, 2015.
This Statement addresses accounting and financial reporting for certain external investment pools and pool participants. Specifically, it establishes criteria for an external investment pool to qualify for making the election to measure all of its investments at amortized cost for financial reporting purposes. An external investment pool qualifies for that reporting if it meets all of the applicable criteria established in this Statement. The specific criteria address (1) how the external investment pool transacts with participants; (2) requirements for portfolio maturity, quality, diversification, and liquidity; and (3) calculation and requirements of a shadow price. Significant noncompliance prevents the external investment pool from measuring all of its investments at amortized cost for financial reporting purposes. Professional judgment is required to determine if instances of noncompliance with the criteria established by this Statement during the reporting period, individually or in the aggregate, were significant.
If an external investment pool does not meet the criteria established by this Statement, that pool should apply the provisions in paragraph 16 of Statement No. 31,Accounting and Financial Reporting for Certain Investments and for External Investment Pools, as amended. If an external investment pool meets the criteria in this Statement and measures all of its investments at amortized cost, the pool's participants also should measure their investments in that external investment pool at amortized cost for financial reporting purposes. If an external investment pool does not meet the criteria in this Statement, the pool's participants should measure their investments in that pool at fair value, as provided in paragraph 11 of Statement 31, as amended.
This Statement establishes additional note disclosure requirements for qualifying external investment pools that measure all of their investments at amortized cost for financial reporting purposes and for governments that participate in those pools. Those disclosures for both the qualifying external investment pools and their participants include information about any limitations or restrictions on participant withdrawals.
The pronouncement became effective, but did not have a material effect on the financial statements.
12
Item 7, Attachment 1C

Unusual Transactions, Controversial or Emerging Areas
We noted no transactions entered into by the Association during the year for which there is a lack of authoritative guidance or consensus. All significant transactions have been recognized in the financial statements in the proper period.
Accounting Estimates
Accounting estimates are an integral part of the financial statements prepared by management and are based on management's knowledge and experience about past and current events and assumptions about future events. Certain accounting estimates are particularly sensitive because of their significance to the financial statements and because of the possibility that future events affecting them may differ significantly from those expected. The most sensitive estimates affecting the Association's financial statements were:
Estimated Net Pension Liabilities and Pension-Related Deferred Outflows and Inflows of Resources: Management's estimate of the net pension liabilities and deferred outflows/inflows of resources are disclosed in Note 8 to the financial statements and are based on actuarial studies determined by a consultant, which are based on the experience of the Association. We evaluated the key factors and assumptions used to develop the estimate and determined that it is reasonable in relation to the basic financial statements taken as a whole.
Estimated Net OPEB Liability: Management's estimate of the net OPEB liability is disclosed in Note 9 to the financial statements and is based on actuarial study determined by a consultant, which is based on the experience of the Association. We evaluated the key factors and assumptions used to develop the estimate and determined that it is reasonable in relation to the basic financial statements taken as a whole.
Estimated Fair Value of Investments: As of June 30, 2016, the Association held approximately $7.7 million of cash and investments as measured by fair value as disclosed in Note 2 to the financial statements. Fair value is essentially market pricing in effect as of June 30, 2016. These fair values are not required to be adjusted for changes in general market conditions occurring subsequent to June 30, 2016.
Estimate of Depreciation: Management's estimate of the depreciation is based on useful lives determined by management. These lives have been determined by management based on the expected useful life of assets as disclosed in Note 3 to the financial statements. We evaluated the key factors and assumptions used to develop the depreciation estimate and determined that it is reasonable in relation to the basic financial statements taken as a whole.
Estimate of Compensated Absences: Accrued compensated absences which are comprised of accrued vacation, holiday, and certain other compensating time is estimated using accumulated unpaid leave hoaurs and hourly pay rates in effect at the end of the fiscal year as disclosed in Note IE to the financial statements. We evaluated the key factors and assumptions used to develop the accrued compensated absences and determined that it is reasonable in relation to the basic financial statements taken as a whole.
Unbilled Receivables: The Association has recorded unbilled receivables approximating $16.5 million. Actual billings and the ultimate collections may vary from this estimate.
13
Item 7, Attachment 1C

Disclosures
The financial statement disclosures are neutral, consistent, and clear.
Difficulties Encountered in Peeforming the Audit
We encountered no significant difficulties in dealing with management in performing and completing our audit.
Corrected and Uncorrected Misstatements
Professional standards require us to accumulate all known and likely misstatements identified during the audit, other than those that are clearly trivial, and communicate them to the appropriate level of management. Management has corrected all such misstatements. In addition, none of the misstatements detected as a result of audit procedures and corrected by management were material, either individually or in the aggregate, to each opinion unit's financial statements taken as a whole.
Disagreements with Management
For purposes of this letter, a disagreement with management is a financial accounting, reporting, or auditing matter, whether or not resolved to our satisfaction, that could be significant to the financial statements or the auditor's report. We are pleased to report that no such disagreements arose during the course of our audit.
Management Representations
We have requested certain representations from management that are included m a management representation letter dated February 10, 2017.
Management Consultations with Other Independent Accountants
In some cases, management may decide to consult with other accountants about auditing and accounting matters, similar to obtaining a "second opinion" on certain situations. If a consultation involves application of an accounting principle to the Association's fmancial statements or a determination of the type of auditor's opinion that may be expressed on those statements, our professional standards require the consulting accountant to check with us to determine that the consultant has all the relevant facts. To our knowledge, there were no such consultations with other accountants.
Other Audit Findings or Issues
We generally discuss a variety of matters, including the application of accounting principles and auditing standards, with management each year prior to retention as the Association auditors. However, these discussions occtirred in the normal course of our professional relationship and our responses were not a condition to our retention.
14
Item 7, Attachment 1C

Other Information Accompanying the Financial Statements
We applied certain limited procedures to the required supplementary information that accompanies and supplements the basic financial statements. Our procedures consisted of inquiries of management regarding the methods of preparing the information and comparing the information for consistency with management's responses to our inquiries, the basic fmancial statements, and other knowledge we obtained during our audit of the basic financial statements. We did not audit the required supplementary information and do not express an opinion or provide any assurance on the required supplementary information.
We were not engaged to report on the Introductory Section included as part of the Basic Financial Statements, but are not required supplementary information. We did not audit or perform other procedures on this other information and we do not express an opinion or provide any assurance on them.
******
This information is intended solely for the use of Board of Directors and management and is not intended to be, and should not be, used by anyone other than these specified parties.
Pleasant Hill, California February 10, 2017
15
Item 7, Attachment 1C

This Page Left Intentionally Blank
Item 7, Attachment 1C

ASSOCIATION OF BAY AREA GOVERNMENTS
SINGLE AUDIT REPORT FOR THE YEAR ENDED JUNE 30, 2016
Item 7, Attachment 1D

This Page Left Intentionally Blank
Item 7, Attachment 1D

ASSOCIATION OF BAY AREA GOVERNMENTS
SINGLE AUDIT REPORT For The Year Ended June 30, 2016
TABLE OF CONTENTS
Schedule of Findings and Questioned Costs ............................................................................. 1
Section I - Summary of Auditor's Results ..... .............................................................. . . ..... 1
Section II - Financial Statement Findings ...................... ......... . . ......................................... 2
Section III- Federal Award Findings and Questioned Costs ................................ ............ 2
Section IV - Status of Prior Year Findings and Questioned Costs ..................................... 2
Schedule of Expenditures of Federal Awards ............................... ........................................... . 3
Notes to Schedule ofExpenditures ofFederal Awards ............................................................ .5
Independent Auditor's Report on Internal Control over Financial Reporting and on Compliance and Other Matters Based on an Audit of Financial Statements Performed in Accordance with Government Auditing Standards ....................... 7
Independent Auditor's Report on Compliance for Each Major Federal Program; Report on Internal Control Over Compliance; and Report on the Schedule of Expenditures of Federal Awards Required by the Uniform Guidance ............ 9
Item 7, Attachment 1D

This Page Left Intentionally Blank
Item 7, Attachment 1D
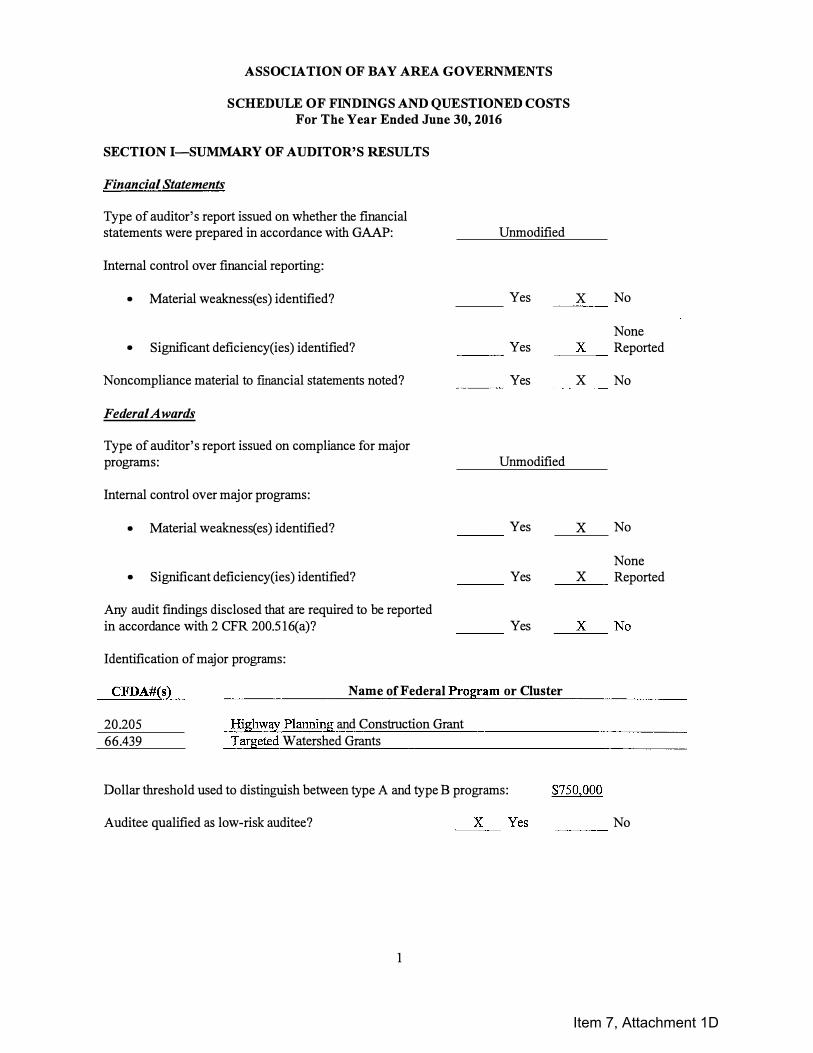
ASSOCIATION OF BAY AREA GOVERNMENTS
S CHEDULE OF FINDINGS AND QUESTIONED COSTS For The Year Ended June 30, 2016
SECTION I-SUMMARY OF AUDITOR'S RESULTS
Financial Statements
Type of auditor's report issued on whether the financial statements were prepared in accordance with GAAP: Unmodified
Internal control over financial reporting:
• Material weakness( es) identified?
• Significant deficiency(ies) identified?
Noncompliance material to financial statements noted?
Federal Awards
Yes
___ Yes
Yes ---
X No ----
None __ X_;___ Reported
X No ----
Type of auditor's report issued on compliance for major programs: Unmodified
Internal control over major programs:
• Material weakness( es) identified?
• Significant deficiency(ies) identified?
Any audit findings disclosed that are required to be reported in accordance with 2 CPR 200.516(a)?
Identification of major programs:
Yes ---
Yes ---
___ Yes
x No
None __ x __ Reported
__ x::..:;__No
CFDA#(s) Name of Federal Program or Cluster
20.205 66.439
Highway Planning and Construction Grant Targeted Watershed Grants
Dollar threshold used to distinguish between type A and type B programs:
Auditee qualified as low-risk auditee? __ X_ Yes
1
$750,000
___ No
Item 7, Attachment 1D

SECTION II- FINANCIAL STATEMENT FINDINGS
Our audit did not disclose any significant deficiencies, or material weaknesses or instances of noncompliance material to the basic financial statements. We have also issued a separate Memorandum on Internal Control dated February 10, 2017 which is an integral part of our audits and should be read in conjunction with this report.
SECTION III- FEDERAL A WARD FINDINGS AND QUESTIONED COSTS
Our audit did not disclose any findings or questioned costs required to be reported in accordance with Uniform Guidance.
SECTION IV - STATUS OF PRIOR YEAR FINDINGS AND QUESTIONED COSTS -
Prepared by Management
Financial Statement Prior Year Findings
There were no prior year Financial Statement Findings reported.
Federal Award Prior Year Findings and Questioned Costs
There were no prior year Federal Award Findings and Questioned Costs reported
2
Item 7, Attachment 1D
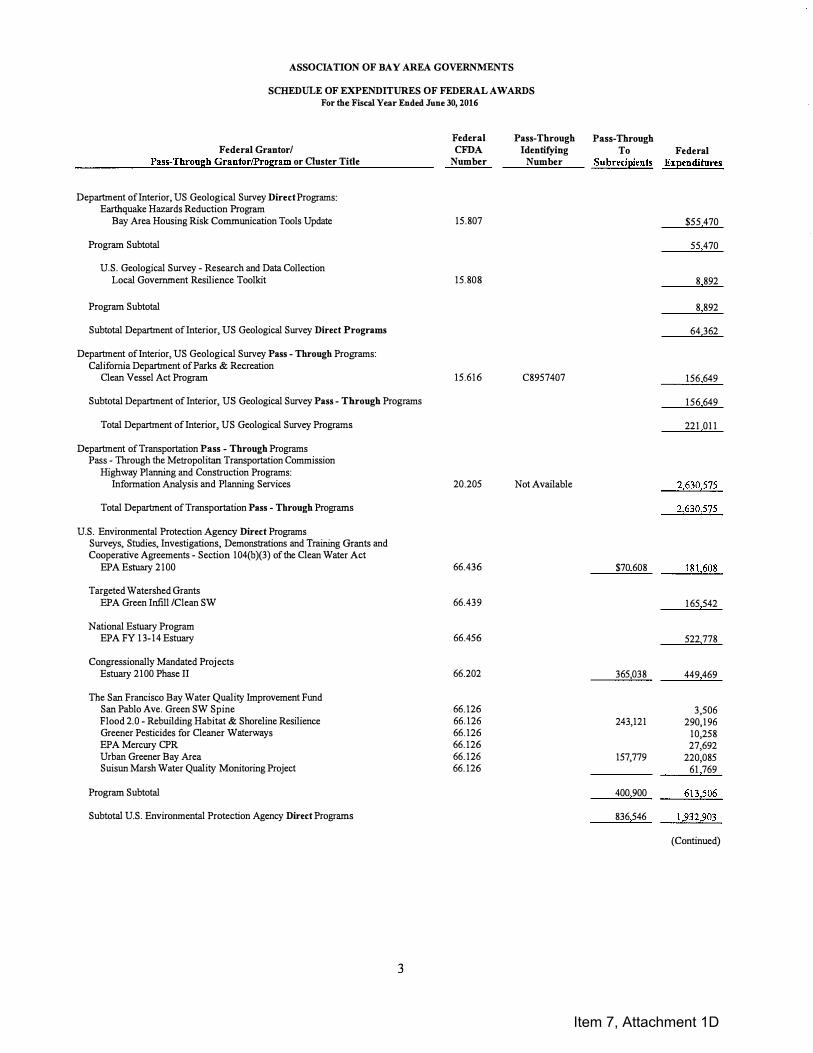
ASSOCIATION OF BAY AREA GOVERNMENTS
SCHEDULE OF EXPENDITURES OF FEDERAL AW ARDS For the Fiscal Year Ended June 30, 2016
Federal Grantor/ Pass-Through Grantor/Program or Ouster Title
Depar1ment of Interior, US Geological Survey Direct Programs: Earthquake Hazards Reduction Program
Bay Area Housing Risk Communication Tools Update
Program Subtotal
U.S. Geological Survey - Research and Data Collection Local Government Resilience Toolkit
Program Subtotal
Subtotal Depar1ment of Interior, US Geological Survey Direct Programs
Depar1ment of Interior, US Geological Survey Pass - Through Programs: California Depar1ment of Parks & Recreation
Clean Vessel Act Program
Subtotal Depar1ment of Interior, US Geological Survey Pass - Through Programs
Total Depar1ment of Interior, US Geological Survey Programs
Depar1ment of Transportation Pass - Through Programs Pass - Through the Metropolitan Transportation Commission
Highway Planning and Construction Programs: Information Analysis and Planning Services
Total Deparbnent of Transportation Pass - Through Programs
U.S. Environmental Protection Agency Direct Programs Surveys, Studies, Investigations, Demonstrations and Training Grants and Cooperative Agreements - Section 104(b)(3) of the Clean Water Act
EPA Estuary 2100
Targeted Watershed Grants EPA Green Infill /Clean SW
National Estuary Program EPA FY 13-14 Estuary
Congressionally Mandated Projects Estuary 2100 Phase II
The San Francisco Bay Water Qualify Improvement Fund San Pablo Ave. Green SW Spine Flood 2.0 - Rebuilding Habitat & Shoreline Resilience Greener Pesticides for Cleaner Waterways EPA Mercury CPR Urban Greener Bay Area Suisun Marsh Water Qualify Monitoring Project
Program Subtotal
Subtotal U.S. Environmental Protection Agency Direct Programs
3
Federal CFDA
Number
15.807
15.808
15.616
20.205
66.436
66.439
66.456
66.202
66.126 66.126 66.126 66.126 66.126 66.126
Pass-Through Identifying
Number
C8957407
Not Available
Pass-Through To Federal
Subrecipients Expenditures
$70 608
365,038
243,121
157,779
400 900
836 546
$55 470
55 470
8 892
8 892
64 362
156 649
156 649
221 011
2,630,575
2,630,575
181,608
165 542
522 778
449 469
3,506 290,196
10,258 27,692
220,085 61 769
613,506
1,932,903
(Continued)
Item 7, Attachment 1D

ASSOCIATION OF BAY AREA GOVERNMENTS
SCHEDULE OF EXPENDITURES OF FEDERAL AW ARDS For the Fiscal Year Ended June 30, 2016
Federal Grantor/ Pass-Through Grantor/Program or Cluster Title
U.S. Environmental Protection Agency Pass - Through Programs
Pass -1brough the California State Water Resources Board Capitalization Grants for Clean Water States Revolving Funds
SRF Unified Bay & Delta Reporting
Pass - 1brough the Aquatic Science Center Regional Wetland Program Development Grant
Aquatic Science Center Contract II
Subtotal U.S. Environmental Protection Agency Pass - Through Programs
Total U.S. Environmental Protection Agency Programs
Department of Homeland Security Direct Programs Cooperating Technical Partners
Regional Resilience Plan FY 2015 Community Engagement and Risk Communication
Total Department of Homeland Security Direct Programs
Total Expenditures of Federal Awards
Federal CFDA
Number
66.458
66.461
97.045 97.045
Pass-Through Identifying
Number
14-818-550
CD-99T34301-0
See Accompanying Notes to Schedule of Expenditures of Federal Awards
4
Pass-Through To
Subrecipients
$836,546
Federal Expenditures
307 556
22 427
329,983
2,262,886
77,234 671,863
749 097
$5,863,569
Item 7, Attachment 1D

ASSOCIATION OF BAY AREA GOVERNMENTS
NOTES TO THE SCHEDULE OF EXPENDITURES OF FEDERAL A WARDS For The Year Ended June 30, 2016
NOTE 1-REPORTING ENTITY
The Schedule of Expenditure of Federal Awards (the Schedule) includes expenditures of federal awards for the Association of Bay Area Governments (Association), California as disclosed in the notes to the Basic Financial Statements.
NOTE 2-SUMMARY OF SIGNIFICANT ACCOUNTING POLICIES
Basis of accounting refers to when revenues and expenditures or expenses are recognized in the accounts and reported in the financial statements, regardless of the measurement focus applied. All proprietary funds are accounted for using the accrual basis of accounting. Expenditures of Federal Awards reported on the Schedule are recognized when incurred.
NOTE 3 - INDIRECT COST ELECTION
The Association has elected not to use the 10% de minimis indirect cost rate allowed under the Uniform Guidance.
5
Item 7, Attachment 1D

This Page Left Intentionally Blank
Item 7, Attachment 1D

MAZE & ASSOCIATES
INDEPENDENT AUDITOR'S REPORT ON INTERNAL CONTROL OVER FINANCIAL REPORTING
AND ON COMPLIANCE AND OTHER MATTERS BASED ON AN
AUDIT OF FINANCIAL STATEMENTS PERFORMED IN ACCORDANCE WITH GOVERNMENT AUDITING STANDARDS
To the Honorable Members of the Executive Board of the Association of Bay Area Governments, California
We have audited, in accordance with the auditing standards generally accepted in the United States of America and the standards applicable to financial audits contained in Government Auditing Standards issued by the Comptroller General of the United States, the basic financial statements of the Association of Bay Area Governments (Association), as of and for the year ended June 30, 2016, and the related notes to the financial statements, and have issued our report thereon dated February 10, 2017. Our report included an emphasis of a matter paragraph disclosing the implementation of new accounting principles.
Internal Control Over Financial Reporting
In planning and performing our audit of the financial statements, we considered Association's internal control over financial reporting (internal control) to determine the audit procedures that are appropriate in the circumstances for the purpose of expressing our opinions on the financial statements, but not for the purpose of expressing an opinion on the effectiveness of Association's internal control. Accordingly, we do not express an opinion on the effectiveness of Association's internal control.
A deficiency in internal control exists when the design or operation of a control does not allow management or employees, in the normal course of performing their assigned functions, to prevent, or detect and correct, misstatements on a timely basis. A material weakness is a deficiency, or a combination of deficiencies, in internal control, such that there is a reasonable possibility that a material misstatement of the Association's financial statements will not be prevented, or detected and corrected on a timely basis. A significant deficiency is a deficiency, or a combination of deficiencies, in internal control that is less severe than a material weakness, yet important enough to merit attention by those charged with governance.
Our consideration of internal control was for the limited purpose described in the first paragraph of this section and was not designed to identify all deficiencies in internal control that might be material weaknesses or significant deficiencies. Given these limitations, during our audit we did not identify any deficiencies in internal control that we consider to be material weaknesses. However, material weaknesses may exist that have not been identified.
Accountancy Corporation
3478 Buskirk Avenue, Suite 215
Pleasant Hill, CA 94523
7 T 925.930.0902
F 925.930.0135
w mazeassociates.com
Item 7, Attachment 1D

Compliance and Other Matters
As part of obtaining reasonable assurance about whether the Association's financial statements are free from material misstatement, we performed tests of its compliance with certain provisions of laws, regulations, contracts, and grant agreements, noncompliance with which could have a direct and material effect on the determination of financial statement amounts. However, providing an opinion on compliance with those provisions was not an objective of our audit, and accordingly, we do not express such an opinion. The results of our tests disclosed no instances of noncompliance or other matters that are required to be reported under Government Auditing Standards.
Association's Response to Findings
We have also issued a separate Memorandum on Internal Control dated February 10, 2017 which is an integral part of our audit and should be read in conjunction with this report.
Purpose of this Report
The purpose of this report is solely to describe the scope of our testing of internal control and compliance ·
and the results of that testing, and not to provide an opinion on the effectiveness of the Association's internal control or on compliance. This report is an integral part of an audit performed in accordance with Government Auditing Standards in considering the Association's internal control and compliance. Accordingly, this communication is not suitable for any other purpose.
Pleasant Hill, California February 10, 2017
8
Item 7, Attachment 1D
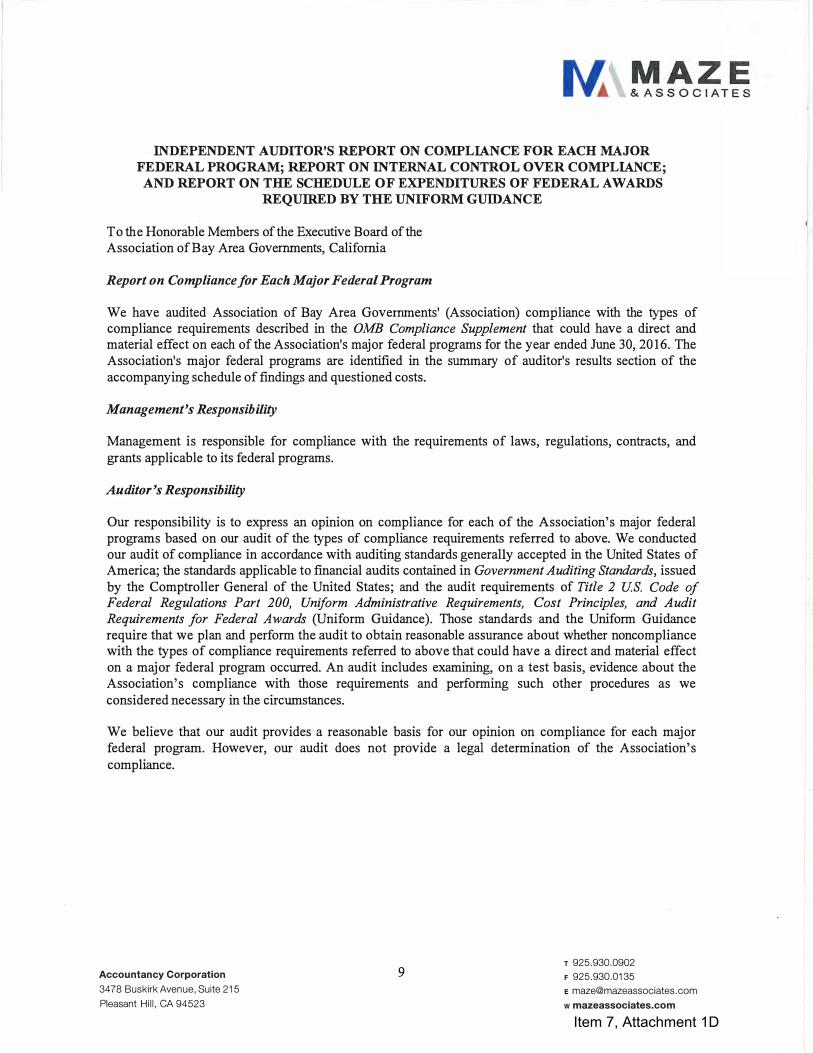
INDEPENDENT AUDITOR'S REPORT ON COMPLIANCE FOR EACH MAJOR FEDERAL PROGRAM; REPORT ON INTERNAL CONTROL OVER COMPLIANCE;
AND REPORT ON THE SCHEDULE OF EXPENDITURES OF FEDERAL A WARDS REQUIRED BY THE UNIFORM GUIDANCE
To the Honorable Members of the Executive Board of the Association of Bay Area Governments, California
Report on Compliance for Each Major Federal Program
We have audited Association of Bay Area Governments' (Association) compliance with the types of compliance requirements described in the OMB Compliance Supplement that could have a direct and material effect on each of the Association's major federal programs for the year ended June 30, 2016. The Association's major federal programs are identified in the summary of auditor's results section of the accompanying schedule of findings and questioned costs.
Management's Responsibility
Management is responsible for compliance with the requirements of laws, regulations, contracts, and grants applicable to its federal programs.
Auditor's Responsibility
Our responsibility is to express an opinion on compliance for each of the Association's major federal programs based on our audit of the types of compliance requirements referred to above. We conducted our audit of compliance in accordance with auditing standards generally accepted in the United States of America; the standards applicable to financial audits contained in Government Auditing Standards, issued by the Comptroller General of the United States; and the audit requirements of Title 2 U.S. Code of Federal Regulations Part 200, Uniform Administrative Requirements, Cost Principles, and Audit Requirements for Federal Awards (Uniform Guidance). Those standards and the Uniform Guidance require that we plan and perform the audit to obtain reasonable assurance about whether noncompliance with the types of compliance requirements referred to above that could have a direct and material effect on a major federal program occurred. An audit includes examining, on a test basis, evidence about the Association's compliance with those requirements and performing such other procedures as we considered necessary in the circumstances.
We believe that our audit provides a reasonable basis for our opinion on compliance for each major federal program. However, our audit does not provide a legal determination of the Association's compliance.
Accountancy Corporation
3478 Buskirk Avenue, Suite 215
Pleasant Hill, CA 94523
9 T 925.930.0902
F 925.930.0135
w mazeassociates.com
Item 7, Attachment 1D

Opinion on Each Major Federal Program
In our opinion, the Association complied, in all material respects, with the types of compliance requirements referred to above that could have a direct and material effect on each of its major federal programs for the year ended June 20, 2016.
Report on Internal Control Over Compliance
Management is responsible for establishing and maintaining effective internal control over compliance with the types of compliance requirements referred to above. In planning and performing our audit of compliance, we considered the Association's internal control over compliance with the types of requirements that could have a direct and material effect on each major federal program to determine the auditing procedures that are appropriate in the circumstances for the purpose of expressing an opinion on compliance for each major federal program and to test and report on internal control over compliance in
accordance with the Uniform Guidance, but not for the purpose of expressing an opinion on the effectiveness of internal control over compliance. Accordingly, we do not express an opinion on the effectiveness of the Association's internal control over compliance.
A deficiency in internal control over compliance exists when the design or operation of a control over compliance does not allow management or employees, in the normal course of performing their assigned functions, to prevent, or detect and correct, noncompliance with a type of compliance requirement of a federal program on a timely basis. A material weakness in internal control over compliance is a deficiency, or combination of deficiencies, in internal control over compliance, such that there is a reasonable possibility that material noncompliance with a type of compliance requirement of a federal program will not be prevented, or detected and corrected, on a timely basis. A significant deficiency in internal control over compliance is a deficiency, or a combination of deficiencies, in internal control over compliance with a type of compliance requirement of a federal program that is less severe than a material weakness in internal control over compliance, yet important enough to merit attention by those charged with governance.
Our consideration of internal control over compliance was for the limited purpose described in the first paragraph of this section and was not designed to identify all deficiencies in internal control over compliance that might be material weaknesses or significant deficiencies. We did not identify any deficiencies in internal control over compliance that we consider to be material weaknesses. However, material weaknesses may exist that have not been identified.
The purpose of this report on internal control over compliance is solely to describe the scope of our testing of internal control over compliance and the results of that testing based on the requirements of the Uniform Guidance. Accordingly, this :report is not suitable for any other purpose.
10
Item 7, Attachment 1D

Report on Schedule of Expenditures of Federal Awards Required by the Uniform Guidance
We have audited the basic financial statements of the business-type activities of the Association as of and for the year ended June 30, 2016, and the related notes to the financial statements, which collectively comprise the Association's basic financial statements. We issued our report thereon dated February 10, 2017 which contained unmodified opinions on those financial statements. Our audit was conducted for the purpose of forming an opinion on the financial statements as a whole. The accompanying schedule of expenditures of federal awards is presented for purposes of additional analysis as required by the Uniform Guidance and is not a required part of the financial statements. Such information is the responsibility of management and was derived from and relates directly to the underlying accounting and other records used to prepare the financial statements. The information has been subjected to the auditing procedures applied in the audit of the financial statements and certain additional procedures, including comparing and reconciling such information directly to the underlying accounting and other records used to prepare the financial statements or to the financial statements themselves, and other additional procedures in accordance with auditing standards generally accepted in the United States of America. In our opinion, the schedule of expenditures of federal awards is fairly stated in all material respects in relation to the basic :fmancial statements as a whole.
Pleasant Hill, California February 10, 2017
11
Item 7, Attachment 1D

This Page Left Intentionally Blank
Item 7, Attachment 1D

AS S O C I A T I O N O F B A Y AR E A GO V E R N M E N T S Representing City and County Governments of the San Francisco Bay Area
Date: May 12, 2017 To: ABAG Finance and Personnel Committee From: Courtney Ruby
Director of Finance and Administrative Services Subject: Financial Reports March 2017 The following are highlights of the March 2017 financial reports. Overall Summary Expenses exceeded Revenue by $8 thousand for the nine months ended March 31, 2017. A $50 thousand surplus is projected at year-end in the budget. Please refer to the Table of Financial Report Data Elements for fiscal year budget, year-to-date actual and projected fiscal year numbers. Budget Adjustments for FY 2016-17 The Budget for FY 2016-17 was adopted in January 2016. This report includes budget adjustments for SFEP and BayREN.
SFEP. Several budgeted SFEP projects were completed early in the previous fiscal year and several current projects are being extended into the next fiscal year. Therefore SFEP’s FY 2016-17 budget is being adjusted from $31 million to $19.6 million. Given the large size of these construction projects and their multi-year duration, such budget changes are to be expected and are consistent with prior years. BayREN. Due to the success of the BayREN program, PG&E increased their rebate funding significantly by almost $4 million. Therefore BayREN’s budget is being adjusted from $13.3 million to $17.1 million.
Cash on Hand The cash balance was $6.4 million at the end of March, including $2.2 million deposited in the Local Agency Investment Fund (LAIF). As shown in Figure 1 the actual monthly cash balances for the first nine months of fiscal year 2016-17, and the projected balance for the year end are within our normal range of $6.0 to $9.0 million. The cash balance is projected to be approximately $7 million at the end of the fiscal year.
Item 7, Attachment 2A

Financial Reports March 2017 May 12, 2017 Page 2 Receivables At the end of March, total receivables amounted to $9.7 million which included $3.7 million of unbilled receivables (mainly attributed (42%) to SFEP’s Integrated Regional Water Management Program (IRWMP) and $6 million (mainly attributed to IRWMP and BayREN) of grant and service program receivables. Receivables over 90 days past due were $3.6 million, including $3.4 million from the Department of Water Resources. All receivables are believed to be collectible. Figure 2 shows the comparison of receivables generated by grants and service programs over the current and prior fiscal year. Revenues and Expenses As of March 31, 2017, total revenue amounted to $26.1 million, which is 56 percent, of the projected revenue for the year of $50.5 million; Total expenses amounted to $26.1 million, which is 56 percent of the projected expenses for the year of $50.5 million; Figure 3 presents a graphic comparison of the current month of March, the nine month year-to-date actual, and fiscal year projected revenues and expenses. Figures 4 and 5 show year-to-date revenues and expenses by major categories. Grants revenue is 84% of total revenue, compared to 81% for the prior fiscal year. Pass-through and Consultant expense are 64% of total expenses, compared to 69% for the prior fiscal year. Net Position/Fund Equity Total fund equity was negative $7.9 million as of March 31, 2017. In compliance with GASB 68, beginning with the June 30, 2015 audited financial statements, we have recorded the ABAG accumulated unfunded pension obligation as a liability and reduction of fund equity. For internal financial statement purposes, we have elected to separately track the fund equity for the pension obligation and operations. Thus, the June 30, 2016 fund equity for pension obligations is presented as a negative $12.1 million, and the accumulated fund equity from operations is presented as a positive $2.6 million in the financial reports. The restricted fund equity of $1.6 million consists of capital, self-insurance, building maintenance and reserves. Figure 6 is a graphic presentation of actual and projected: unrestricted, restricted, and total net equity for the current fiscal year. Indirect Overhead Rate After careful analysis of our ABAG overhead accounts, we projected and obtained an approval from EPA for an increase to our project overhead rate by 1.2% to 46.15% in FY 2016-17 (up from 44.95% in FY 2015-16). The Agency’s actual indirect overhead cost rate through March 2017 was 46.58%, which was .43 percentage points above the current adopted budget of 46.15% approved by the EPA. Rate variances throughout the year are to be expected. Figure 7 shows a comparison between the actual indirect cost rate through March 31 and EPA approved rates for the year.
Item 7, Attachment 2A

Financial Reports March 2017 May 12, 2017 Page 3 Financial Information by Program The Report by Program of Net Surplus/(Deficit) is included after the charts. This report presents revenue and expense information by program. It provides an overview of budgeted and year-to-date revenue and expense data for major programs such as the Planning Services, San Francisco Estuary Partnership (SFEP), Bay Trail and POWER/Energy. It should be noted for SFEP and Bay Trail, the actual progress of their projects is below projection because we have not been billed by subrecipients as it takes several weeks to know the actual progress due to the complex nature and multi-year duration of the projects. Financial Outlook The projection for fiscal year 2016-17 is for a surplus of revenues over expenses of $50,000.
Item 7, Attachment 2A

Blank Page

DescriptionAdopted Budget
Projected Fiscal Year
Budget
Year-To-Date
Actual
% of Projected
Fiscal Year Budget
ASSETSCash 7,000 6,367 Receivables 14,000 9,739
REVENUESMembership Dues 1,958 1,958 1,473 75%Grants 51,717 44,067 21,859 50%Charges for Services and Other 4,545 4,545 2,800 62%Total Revenues 58,220 50,570 26,132 52%
EXPENSESSalaries and Benefits 11,828 11,828 7,880 67%Pass-through and Consultant Expenses 44,011 36,361 16,772 46%Other Expenses 2,331 2,331 1,488 64%Total Expenses 58,170 50,520 26,140 52%
Change in Net Position 50 50 (8) -16%
Beginning Net Position (7,728) (7,728) (7,859) 102%
Ending Net Position (7,678) (7,678) (7,867) 102%
NET POSITION BREAKDOWNSUnrestricted - Accumulated Operations Surplus 2,969 2,969 2,634 89%Unrestricted - Pension Adjustment - June 30, 2016 (12,254) (12,254) (12,108) 99%Restricted - Tenant Improvements 800 800 800 100%Restricted - Other 857 857 807 94%Total Net Position (7,628) (7,628) (7,867) 103%
INDIRECT OVERHEADOverhead Rate 44.95% 44.95% 46.58%Approved Rate 46.15%
Association of Bay Area GovernmentsTable of Financial Report Data Elements
(thousands of dollars)
for March 2017
Projected percentage of budget is 75%.
Item 7, Attachment 2B

Cash on Hand FY 16-17 ($'000)Jul Aug Sep Oct Nov Dec Jan Feb Mar Apr May Jun
FY 17 Actual 7,501 8,243 6,706 6,103 7,934 5,634 6,244 8,460 6,367FY 17 Projected 7,000 7,000 7,000FY 16 Actual 8,316 7,258 7,533 8,312 8,298 7,052 6,073 7,010 7,353 7,079 6,818 7,300
Year-To-Date Actual
Accounts Receivable FY 16-17 ($'000)Jul Aug Sep Oct Nov Dec Jan Feb Mar Apr May Jun
FY 17 Actual 29,781 20,360 14,161 13,526 11,711 12,461 12,690 9,225 9,739FY 17 Projected 14,000 14,000 29,000FY 16 Actual 8,163 8,471 7,515 8,974 8,299 9,710 7,593 5,885 13,973 14,576 14,708 29,687
ABAG Financial Indices
1,0002,0003,0004,0005,0006,0007,0008,0009,000
10,000
Figure 1--Cash on Hand--FY 16 and FY 17 ($'000)
FY 17 Actual
FY 17 Projected
FY 16 Actual
Represents the sum total of cash deposited at banks
or invested in money markets and the Local Agency Investment Fund. This chart shows fluctuation patterns of cash on hand for the current and the prior fiscal year.
0
5,000
10,000
15,000
20,000
25,000
30,000
Figure 2--Accounts Receivable--FY 16 and FY 17($'000)
FY 17 Actual
FY 17 Projected
FY 16 Actual
Accounts receivable include receivables generated by grants and service programs over two fiscal years. Due to accrual of unbilled receivables at year end on June 30, 2016, mainly attributed to IRWMP, receivables were higher in July and August and settles back to the expected level in September. Receivables up to February 2017 are expected to be higher than corresponding period in FY 16 due to increased activity attributable to IRWMP grants.
Item 7, Attachment 2B

Year-To-Date Actual
Surplus/(Deficit) ($8) $50
ABAG Financial Indices
$28
Membership Dues$1,473
5%
Grants$21,859
84%
Charges for Services and
Other$2,800 11%
Figure 4--Year-to-date Revenues by Category ($'000)
Membership Dues
Grants
Charges for Services and Other
Salaries and Benefits$7,880 30%
Pass-through and Consultant
Expenses$16,772
64%
Other Expenses
$1,488 6%
Figure 5--Year-to-date Expenses by Category ($'000)
Salaries and Benefits
Pass-through and Consultant Expenses
Other Expenses
Current Month Actual YTD Actual Projected
Revenues $2,929 $26,132 $50,570
Expenses $2,901 $26,140 $50,520
$0$10,000$20,000$30,000$40,000$50,000$60,000$70,000
Figure 3--Revenues and Expenses ($'000)
Presents a comparison of current month
actual, year‐to‐date actual, and adopted/projected revenues and expenses.
Shows year‐to‐date revenues by major category including
membership dues, grants, and charges for services and other.
Shows year‐to‐date expenses by major category including salaries
and benefits, pass‐through and consultant expenses, and other expenses.
Item 7, Attachment 2B

Year-To-Date ActualABAG Financial Indices
Presents actual and adopted/projected general,
restricted and total fund equities for the current fiscal year. General fund equity represents unrestricted equity. Restricted equities include building improvements, building maintenance, self‐insurance, capital and contingency reserve. These restricted equities represent the Association's equities set aside for specific purposes. Total equity is the sum total of general and restricted equities.
$(10,500)
$(8,500)
$(6,500)
$(4,500)
$(2,500)
$(500)
$1,500
$3,500
Unrestricted Restricted Total Net Position
$(9,474)
$1,607
$(7,867)$(9,285)
$1,657
$(7,628)
Figure 6--Net Position/Fund Equity ($'000)
YTD Actual Projected
46.58%46.15%
42.00%42.50%43.00%43.50%44.00%44.50%45.00%45.50%46.00%46.50%47.00%47.50%48.00%
Actual Rate Approved Rate
Figure 7--Indirect Overhead Rate
Shows a comparison between the actual indirect
cost rate and approved rate. The approved indirect cost rate is computed by dividing total estimated overhead expenses by total projected direct labor cost for a fiscal year. This rate is used as a standard overhead cost rate to allocate indirect costs to all projects. This process is performed in accordance with an indirect cost plan, which is prepared annually in accordance with federal guidelines.
Item 7, Attachment 2B

YTD % ofYear‐To‐Date Year‐To‐Date Surplus/ Expense Comments
Program Description Revenues Expenses (Deficit) Budget (for variances 10% > or < from 75%)
A B C D = B ‐ C E = C/APlanning Services 4,398,001 4,398,001 2,879,626 2,879,809 (183) 65%
San Francisco Estuary Partnership
31,023,411 (11,431,344) 19,592,067 4,621,896 4,600,944 20,952 23% Expenses are expected to increase at year‐end as subrecipients bill for the IRWMP project. Many are large construction projects with typical variations in timing and nonewill be completed in the current fiscal year. We expect some variation between budgeted and actual expenses given size of projecte and multi‐year duration. However, all expenses are expected to be incurred before grants expire.
Disaster Recovery 866,296 866,296 544,007 543,756 251 63% Work is proceeding more slowly then projected on some projects. Anticipate extending work into next fiscal year.
Bay Trail 1,998,340 1,998,340 1,123,451 1,125,121 (1,670) 56% Slower progress of projects at the beginning of the fiscal year for planning and construction grants due to weather, public process and delayed contracting. Expected to catch up in the later parts of the year.
Training Center, Web Hosting and Publications
280,000 280,000 12,987 5,735 7,252 2% The budget did not anticipate the sale of the training center late in the prior fiscal year but after 2016‐17 budget was approved.
POWER/Energy 13,277,000 3,781,138 17,058,138 13,225,812 13,258,592 (32,780) 78% BayRen Program runs on a calendar year basis. Larger amount of rebates were paid out in December 2016; and expect the budget amount increased.
FAN Finance Authority 1,050,000 1,050,000 650,590 643,260 7,330 61% Some FAN consultant expense were included in ABAG budget, however these expenses are being paid directly by FAN.
PLAN Corporation ‐ Property & Liability Insurance Pool
2,450,000 2,450,000 1,417,808 1,417,808 ‐ 58%
SHARP ‐ Worker's Comp Pool 150,000 150,000 76,119 76,119 ‐ 51% Expect expenses to increase towards year end as members claim reimbursements for loss prevention program expenditures.
Fiscal Agent Services 131,400 131,400 105,649 103,802 1,847 79%
Communications/Legislative 660,000 660,000 423,424 421,424 2,000 64% Expenses are underbudget due to staff reductions in Communications after 2016‐17 budget was approved and cost savings from producing GA in house.
Agency Administration 1,885,267 1,885,267 1,054,585 925,062 129,523 49% Due to reduction in excecutive staff. Decrease in expenses appears reasonable.
Payroll Clearing ‐ ‐ ‐ 114,086 (114,086) n/a Expect the payroll clearing account to be close to breakeven towards year end.
Central Overhead ‐ ‐ 2,259,727 2,287,727 (28,001) n/a The expense of $2,287,727 is 68% of indirect costs of the $3,346k projection reported to EPA, so amount is reasonable.
Totals 58,169,715 (7,650,206) 50,519,509 28,395,681 28,403,245 (7,564)
Association of Bay Area Governments
Report by Program of Net Surplus/(Deficit) Through March 2017 / 75% of Year Elapsed
Projected Fiscal Year Budget
Adopted Budget Adjustments
Item 7, Attachment 2B

2015/16 2016/17
Planning Services 3,844,000 4,398,001
San Francisco Estuary Partnership 5,380,000 31,023,411
Disaster Recovery 700,000 866,296
Bay Trail 1,028,000 1,998,340
Green Business 90,000 ‐
Training Center, Web Hosting and Publications 540,000 280,000
POWER/Energy 9,712,304 13,277,000
Finance Authority 1,104,696 1,050,000
Plan Corporation ‐ Property & Liability Insurance 2,200,000 2,450,000
SHARP ‐ Worker's Comp Pool 150,000 150,000
Fiscal Agent Services 106,200 131,400
Communications/Legislative 560,000 660,000
Agency Administration 1,241,622 1,885,267
Totals 26,656,822 58,169,715
‐
Item 7, Attachment 2B

SFEP%CONTRACTORS%FOR%PROPOSED%BUDGET%WORK%PLAN%
FY%2017818
Vendor%NameContractor%Budget%17818 Funding/Grant%Source Project%Description
Misc.,'small'$'totaling'about'$50K'each'year 32,000$'''''''''''' CA'Department'of'Fish'and'Wildlife Interagency'Ecological'Program'Annual'WorkshopWilsey'Ham 250,544$''''''''' CA'Strategic'Growth'Council Design'for'San'Pablo'Avenue'stormwater'siteHarris'&'Associates 49,456$'''''''''''' CA'Strategic'Growth'Council Construction'management'for'San'Pablo'Spine'project,'El'Cerrito'siteGhilotti'Brothers 900,000$''''''''' Caltrans San'Pablo'Spine'Construction'Bid'Package'AScience'Experts 41,829$'''''''''''' Delta'Stewardship'Council Provide'scientific'reviewScience'Communications'Estuary'News'2 25,000$'''''''''''' Delta'Stewardship'Council Editorial'services'for'Delta'Science'ProgramScience'Communications'Chris'Austin'2 11,306$'''''''''''' Delta'Stewardship'Council Write'up'proceedings'for'Delta'Science'Program'workshopsMiscellaneous'small'totaling'$37,800 37,800$'''''''''''' DOI'to'CA'Department'of'Boating'and'Waterways Clean'Vessel'Act'Outreach'2017Y18State'Coastal'Conservancy 1,014,745$'''''' DWR IRWM'4'Novato'Creek'Flood'&'HabitatState'Coastal'Conservancy 932,892$''''''''' DWR IRWM'4'Eden'Landing'SBSPState'Coastal'Conservancy 1,373,714$'''''' DWR IRWM'4'Mountain'View'Shoreline'SBSPState'Coastal'Conservancy 298,386$''''''''' DWR IRWM'4'San'Francisquito'RestorationSan'Mateo'County'Resource'Conservation'District 400,000$''''''''' DWR IRWM'4'Coastal'San'Mateo'Drought'IICity'of'East'Palo'Alto 430,300$''''''''' DWR IRWM'4'East'Palo'Alto'Groundwater'SplyMarin'Municipal'Water'District 223,304$''''''''' DWR IRWM'4'Marin'2020'Turf'ReplacementSanta'Clara'Valley'Water'District 1,168,571$'''''' DWR IRWM'4'Anderson'Dam'Seismic'RetrofitMarin'Municipal'Water'District 490,195$''''''''' DWR IRWMP'3'SMART'Irrigation'MMWDStopwaste.org 2,991,808$'''''' DWR IRWMP'3'Bay'Area'Conservation'ProjectStinson'Beach'County'Water'District 346,568$''''''''' DWR IRWMP'3'Stinson'Beach'Water'SupplySan'Mateo'County'Resource'Conservation'District 1,983,023$'''''' DWR IRWMP'3'San'Mateo'Co'Drought'ReliefCity'of'Calistoga 409,091$''''''''' DWR IRWMP'3'Calistoga'Recycled'WaterDSRSDYEBMUD'Recycled'Water'Authority'(DERWA) 2,181,818$'''''' DWR IRWMP'3'DERWA'Phase'3'Recycled'WaterSanta'Clara'Valley'Water'District 2,181,818$'''''' DWR IRWMP'3'Sunnyvale'Recycled'WaterNapa'Sanitation'District 2,181,818$'''''' DWR IRWMP'3'Napa'San'Recycled'WaterZone'7'Water'Agency 1,621,751$'''''' DWR IRWMP'3'Zone'7'Water'Supply'San'Francisco'Public'Utility'Commission 1,591,566$'''''' DWR IRWMP'3'SFPUC'Lower'Cherry'CreekHorizon'Water'&'Environment 61,538$'''''''''''' DWR Grant'Administration'AssistancePoint'Blue'Conservation'Science 19,484$'''''''''''' DWR IRWMP2'Students'and'Teachers'Restoring'a'WatershedCity'of'St.'Helena 600,000$''''''''' DWR IRWMP2'Upper'York'Creek'Dam'RemovalContra'Costa'Water'District 450,000$''''''''' DWR IRWMP2'Rheem'Creek'RestorationCity'of'San'Jose 1,445,526$'''''' DWR IRWMP2'San'Jose'Green'StreetSan'Francisco'International'Airport 562,500$''''''''' DWR IRWMP2'SFO'Reclaimed'Water'FacilityRoseview'Heights'Mutual'Water'Company 375,000$''''''''' DWR IRWMP2'Roseview'Heights'InfrastructureEast'Bay'Regional'Park'District 179,660$''''''''' DWR IRWMP2'Breuner'Marsh'RestorationCity'of'Redwood'City 851,250$''''''''' DWR IRWMP2'Bayfront'Canal'&'Atherton'ChannelCity'of'Petaluma 618,750$''''''''' DWR IRWMP2'Petaluma'Flood'ReductionSan'Mateo'County 494,850$''''''''' DWR IRWMP2'Pescadero'Water'SupplyCity'of'Oakland 375,000$''''''''' DWR IRWMP2'Sausal'Creek'RestorationSonoma'Valley'County'Sanitation'District 765,000$''''''''' DWR IRWMP2'North'Bay'Water'ReuseNapa'County 375,000$''''''''' DWR IRWMP2'Napa'Milliken'Creek'Marin'Resource'Conservation'District 221,365$''''''''' DWR IRWMP2'Marin/Sonoma'Conserving'Our'WatershedsMarin'Municipal'Water'District 182,637$''''''''' DWR IRWMP2'Lagunitas'Creek'Sediment'ReductionSolano'County'Water'Agency 618,714$''''''''' DWR IRWMP2'Bay'Area'Regional'Water'ConservationThe'Bay'Institute 10,208$'''''''''''' DWR Horizontal'levee'outreachHorizon'Water'&'Environment 61,538$'''''''''''' DWR Grant'administration'assistanceSan'Francisco'Estuary'Institute 168,337$''''''''' DWR Flood'Infrastructure'Mapping'Project'25Committee'for'Green'Foothills 54,801$'''''''''''' DWR Watershed'Guidance'and'San'Francisquito'Watershed'RestorationUrban'Tilth 39,500$'''''''''''' DWR Richmond'shoreline'flood'protection'projectSan'Mateo'Resource'Conservation'District 8,031$'''''''''''''' DWR Pescadero'flood'reduction'and'habitat'enhancementSan'Francisco'Estuary'Institute 245,362$''''''''' DWR Monitoring'for'green'infrastructure'construction'sites
Item 7, Attachment 3

SFEP%CONTRACTORS%FOR%PROPOSED%BUDGET%WORK%PLAN%
FY%2017818
Vendor%NameContractor%Budget%17818 Funding/Grant%Source Project%Description
Harris'&'Associates 205,092$''''''''' DWR Construction'Management'for'San'Pablo'Spine'project'sitesWilsey'Ham 37,903$'''''''''''' DWR Construction,'San'Pablo'Spine'project'sitesLabor'Consultants'of'California 23,810$'''''''''''' DWR Labor'Compliance,'San'Pablo'Spine'project'sitesGates'&'Associates 12,595$'''''''''''' DWR Bay'Friendly'Rater,'San'Pablo'Spine'project'sitesSeveral,'tbd 103,689$''''''''' EPA National'Estuaries'Program'Estuary'Blueprint'Implementation'FY'17Y18SFEI 988,335$''''''''' EPA Healthy'Watersheds,'Resilient'BaylandsSunnyvale 380,000$''''''''' EPA Healthy'Watersheds,'Resilient'BaylandsGrassroots'Ecology 52,250$'''''''''''' EPA Healthy'Watersheds,'Resilient'BaylandsCanopy 38,000$'''''''''''' EPA Healthy'Watersheds,'Resilient'BaylandsSFBay'Joint'Venture 19,200$'''''''''''' EPA Healthy'Watersheds,'Resilient'BaylandsTetra'Tech,'Inc 315,321$''''''''' EPA Suisun'Marsh'monitoringSuisun'Resource'Conservation'District 313,838$''''''''' EPA Suisun'Marsh'monitoringSan'Francisco'Estuary'Institute 373,811$''''''''' EPA Urban'Greening'science'partnerSan'Mateo 300,000$''''''''' EPA Urban'Greening'municipal'partnerSunnyvale 150,000$''''''''' EPA Urban'Greening'municipal'partnerBay'Area'Stormwater'Management'Agencies'Association 139,635$''''''''' EPA Urban'Greening'stormwater'partnerSan'Jose 100,000$''''''''' EPA Urban'Greening'municipal'partnerSanta'Clara'County'Parks'Department 652,605$''''''''' EPA South'Bay'mercury'remediation'(Calcine'Paved'Roads'project)State'Coastal'Conservancy 46,031$'''''''''''' EPA Blue'CarbonAriel'Rubissow'Okamoto 9,333$'''''''''''''' EPA Estuary'News'editorial'servicesSan'Francisco'Estuary'Institute 3,000$'''''''''''''' EPA Web'support'for'sfestuary.orgGigantic'Idea'Studio,'Inc. 44,253$'''''''''''' EPA Outreach'for'pesticide'reduction'campaignAriel'Rubissow'Okamoto 60,000$'''''''''''' Local'agencies Estuary'News,'donation'fundedMisc.,''small'totaling'about'$100K'each'year 115,259$''''''''' Local'agencies State'of'the'Estuary'ConferenceMiscellaneous'small,'about'$90K 55,000$'''''''''''' USGS USGS'science'conference'support
36,492,315$******
FederalStateOther
Item 7, Attachment 3

Planning/Bay%Trail%CONTRACTORS%FOR%
PROPOSED%BUDGET%WORK%PLAN%FY%2017818
Vendor%NameContractor%Budget%17818 Funding/Grant%Source Project%Description
Technical/Assistance/(TBD/#1) 39,400$''''''''''' MTC/Department/of/Transportation Planning'&'ResearchTechnical/Assistance/(TBD/#2) $35,000 MTC/Department/of/Transportation Planning'&'ResearchTechnical/Assistance/(TBD/#4) $400,000 EPA Brownfields/AssessmentTechnical/Assistance/(TBD/#3) $40,000 Rockefeller ABAG'10RC'Regional'Coordination'ProjectCommunications/development/(TBD/#4) $50,000 USGS Safe'Smart'HousingCommunications/development/(TBD/#4) $90,000 FEMA/Coop./Tech./Partners./#4 Resilience'Planning'Assistance'to'CitiesUrban/Resilience/Strategies/(Chakos) $15,000 FEMA/Coop./Tech./Partners./#4 Resilience'Planning'Assistance'to'CitiesUrban/Resilience/Strategies/(Chakos) $60,600 Rockefeller ABAG'10RC'Regional'Coordination'ProjectUrban/Resilience/Strategies/(Chakos) $27,000 USGS Safte'Smart'HousingUrban/Resilience/Strategies/(Chakos) $15,120 USGS/16U17 Earthquake'Awareness'OutreachUrban/Resilience/Strategies/(Chakos) $17,280 USGS/17U18 Seismic'Safety'Assistance'to'CitiesDavid/Bonowitz $5,000 USGS/17U18 Seismic'Safety'Assistance'to'CitiesLohnes/&/Wright $8,000 Bay/Trail/RDP Bay/Trail/Implementation
802,400$***********
FederalStateOther
Item 7, Attachment 3

PLAN%Corp.%/%SHARP%CONTRACTORS%FOR%
PROPOSED%BUDGET%WORK%PLAN%FY%2017818
Vendor%NameContractor%Budget%17818 Funding/Grant%Source Project%Description
York'Risk'Services'Group 645,839$''''''''' Plan/Corp/ Provide'claim'Administrative'ServicesBickmore 30,000$'''''''''''' Plan/Corp/ Provide'actuarial'servicesTechnical'Assistance'(TBD) 10,000$'''''''''''' Plan/Corp/ Provide'technical'assistanceYork'Risk'Services'Group 14,291$'''''''''''' Sharp Provide'claim'Administrative'ServicesBickmore 8,000$'''''''''''''' Sharp Provide'actuarial'servicesTechnical'Assistance'(TBD) 695$''''''''''''''''' Sharp Provide'technical'assistance
708,825$***********
FederalStateOther
Item 7, Attachment 3

POWER/BAYREN%CONTRACTORS%FOR%
PROPOSED%BUDGET%WORK%PLAN%FY%2017818
Vendor%NameContractor%Budget%17818 Funding/Grant%Source
Project%Description81 Project%Description82
CLEAResult 932,000$''''''''' PG&E/CPUC/U/MSA/4400007460///CO/2/CWA/2501322994 BayRENSingle'family'residential'energy'efficiency'contractor'training,'marketing,'reporting,'customer'support'and'rebate'processing.'
BKi'/'Frontier'Energy 694,500$''''''''' PG&E/CPUC/U/MSA/4400007460///CO/2/CWA/2501322994 BayRENProvide'administrative'and'technical'support'for'Codes'&'Standards'program'management'(training,'technical'pilots,'reports,'filings,'etc.)
Regulatory'Consultant 25,000$'''''''''''' PG&E/CPUC/U/MSA/4400007460///CO/2/CWA/2501322994 BayRENRegulatory'coordination'and'consultation'with'staff.''Drafting'of'comments,'advice'letters,'protests,'and'other'strategy'and'communication'involving'regulatory'affairs.
Codes'and'Standards'Project'Manager 85,310$'''''''''''' PG&E/CPUC/U/MSA/4400007460///CO/2/CWA/2501322994 BayRENProgram'management,'and'policy'and'program'design'issues'in'energy'efficiency'and'energy'building'code'compliance
Sustainable'Real'Estate'Solutions 128,975$''''''''' PG&E/CPUC/U/MSA/4400007460///CO/2/CWA/2501322994 BayRENConduct'energy'efficiency'and'renewable'energy''contractor'outreach'and'training'workshops'for'commercial'properties'
Concord'Servicing'Corporation 100,000$''''''''' PG&E/CPUC/U/MSA/4400007460///CO/2/CWA/2501322994 BayRENAdministration'and'customer'servicing'of'multifamily'loans'and'receivables'provided'to'finance'energy'efficiency'improvements
Blue'Point'Planning 50,000$'''''''''''' PG&E/CPUC/U/MSA/4400007460///CO/2/CWA/2501322994 BayREN Develop'and'implement'communication'strategies'to'relay'program'successes'to'significant'stakeholdersContingency'/'Unassigned'/'TBD 663,325$''''''''' PG&E/CPUC/U/MSA/4400007460///CO/2/CWA/2501322994 BayREN Supplement'existing'program'offerings,'alleviate'unexpected'program'expenses,'etc.BKi'/'Frontier'Energy 10,000$'''''''''''' EPCU15U065/(California/Energy/Commission) BEAT Protoype'Analysis'&'Case'Study:'Microgrids'in'Urban'Settings
2,689,110$********
FederalStateOther
Item 7, Attachment 3

Financial%Services%CONTRACTORS%FOR%
PROPOSED%BUDGET%WORK%PLAN%FY%2017818
Vendor%NameContractor%Budget%17818 Funding/Grant%Source Project%Description
Sheelaugh'Flanagan 150,000$''''''''' Financial/Services Provide'services'for'business'developments'and'marketingCharlie'Adams 63,000$'''''''''''' Financial/Services Provide'financial'and'accounting'services
NBS 60,000$'''''''''''' Financial/Services
Provide'administrative'services'for'Windemere'CFD'account,'and'assist'on'continue'disclosure'reporting'for'financing'projects.
Union'Bank 13,000$'''''''''''' Financial/Services Provide'Trustee'servicesFinancial'Audit'Consultants'(TBD) 18,000$'''''''''''' Financial/Services Provide'financial'Audit'servicesThimmig 6,000$'''''''''''''' Financial/Services Provide'legal'servicesGoodwin 9,000$'''''''''''''' Financial/Services Provide'administrative'services'for'San'Francisco'CFD'accounts
319,000$***********
FederalStateOther
Item 7, Attachment 3

SFBRA%CONTRACTORS%FOR%
PROPOSED%BUDGET%WORK%PLAN%FY%2017818
Vendor%NameContractor%Budget%17818 Funding/Grant%Source Project%Description
NBS 67,500$''''''''''' Measure/AA Tax'collectionFinanical'Audit'Consultant'(TBD) 5,000$'''''''''''''' Measure/AAConsultant's'reimb.'Expenses'(TBD) 5,000$'''''''''''''' Measure/AAFinancial'Consultant'(TBD) 5,000$'''''''''''''' Measure/AA
82,500$*************
FederalStateOther
Item 7, Attachment 3

ABAG%Management%CONTRACTORS%FOR%
PROPOSED%BUDGET%WORK%PLAN%FY%2017818
Vendor%NameContractor%Budget%17818 Funding/Grant%Source Project%Description
Management'Partners 137,500$''''''''' General'funds Organizational'assistanceFinancial'Audit'Consultant'(TBD) 76,400$'''''''''''' General'funds Provide'financial'audit'servicesOracle'America,'Inc. 10,232$'''''''''''' General'funds Software'License'&'SupportComworx'Inc 4,768$'''''''''''''' General'funds IT'Support'maintainence
228,900$***********
FederalStateOther
Item 7, Attachment 3

E X P E N S E S F U N D I N G R E V E N U E S O U R C E STOTAL
EXPENSESMTC
FUNDEDABAG
FUNDED FEDERAL STATE OTHER SERVICES MEMBERSHIP TOTALREVENUES
FTE 1 Planning2 Contract for Services3
ProgramExpenses
20 PLANNING & RESEARCH*
Land Use $3,306,374 $3,306,374
Bay Trail / Water Trail 1,900,077 $1,900,077 $418,848 $1,468,929 $12,300 $1,900,077
Resilience 1,113,708 1,113,708 566,319 547,389 1,113,708
Other Planning 608,876 608,876 608,876 608,876
Subtotal 6,929,035 3,306,374 3,622,661 1,175,195 418,848 2,016,318 12,300 3,622,661
LOCAL COLLABORATION PROGRAMS
11.2 San Francisco Estuary 39,255,509 $791,283 38,464,225 2,818,133 35,405,074 241,018 38,464,225
1.4 Power Purchasing Pool & Energy Programs 1,025,926 1,025,926 641,970 32,803 33,615 317,538 1,025,926
1.9 BayRen 16,862,131 16,862,131 16,862,131 16,862,131
1.3 Financial Services 995,004 995,004 995,004 995,004
5.9 ABAG PLAN Corp. 2,159,835 2,159,835 2,159,835 2,159,835
.2 Workers' Compensation 158,971 158,971 158,971 158,971
.5 SF Restoration Authority 555,700 555,700 555,700 555,700
Subtotal 61,013,076 791,283 60,221,792 3,460,103 52,300,008 830,333 3,631,348 60,221,792
EXTERNAL AFFAIRS
2.4 Communications 588,056 588,056 588,056 588,056
.4 Legislative Activity 97,027 97,027 97,027 97,027
Subtotal 685,083 685,083 685,083 685,083
.1 Management & Administration 2,498,322 727,765 1,770,557 390,000 1,380,556 1,770,556
TOTAL $71,125,516 $3,306,374 $1,519,048 $66,300,093 $4,635,298 $52,718,857 $2,846,651 $4,033,648 $2,065,639 $66,300,093
13.3 Overhead 4
58.6 GRAND TOTAL $71,125,516 $3,306,374 $1,519,048 $66,300,093 $4,635,298 $52,718,857 $2,846,651 $4,033,648 $2,065,639 $66,300,093
PROPOSED REVENUES AND EXPENSES BY PROGRAM
Note: The proposed FY 17-18 budget assumes that the local collaboration programs will continue to receive the same level of management and administrative support services as provided in the past.
42 ABAG BUDGET & WORK PROGRAM
* After integration, Planning and Research Department will be the Integrated Regional Planning Program (Integrated Planning Program).
Item 7, Attachment 4
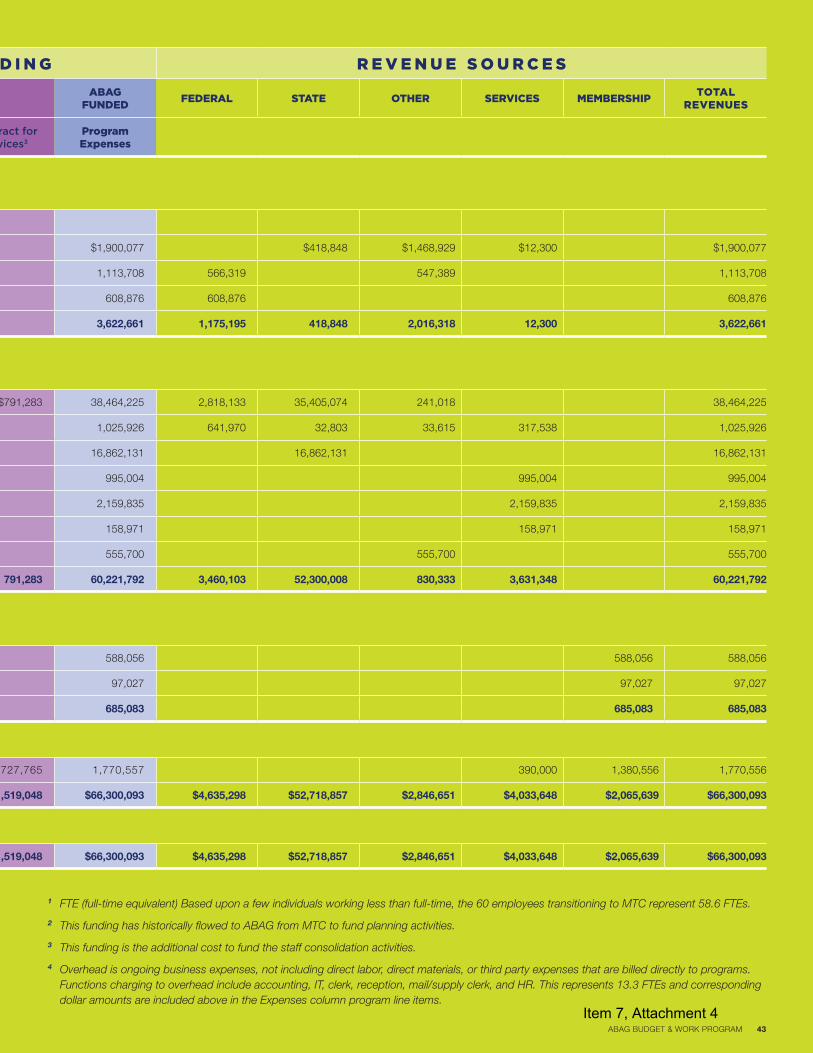
E X P E N S E S F U N D I N G R E V E N U E S O U R C E STOTAL
EXPENSESMTC
FUNDEDABAG
FUNDED FEDERAL STATE OTHER SERVICES MEMBERSHIP TOTALREVENUES
FTE 1 Planning2 Contract for Services3
ProgramExpenses
20 PLANNING & RESEARCH*
Land Use $3,306,374 $3,306,374
Bay Trail / Water Trail 1,900,077 $1,900,077 $418,848 $1,468,929 $12,300 $1,900,077
Resilience 1,113,708 1,113,708 566,319 547,389 1,113,708
Other Planning 608,876 608,876 608,876 608,876
Subtotal 6,929,035 3,306,374 3,622,661 1,175,195 418,848 2,016,318 12,300 3,622,661
LOCAL COLLABORATION PROGRAMS
11.2 San Francisco Estuary 39,255,509 $791,283 38,464,225 2,818,133 35,405,074 241,018 38,464,225
1.4 Power Purchasing Pool & Energy Programs 1,025,926 1,025,926 641,970 32,803 33,615 317,538 1,025,926
1.9 BayRen 16,862,131 16,862,131 16,862,131 16,862,131
1.3 Financial Services 995,004 995,004 995,004 995,004
5.9 ABAG PLAN Corp. 2,159,835 2,159,835 2,159,835 2,159,835
.2 Workers' Compensation 158,971 158,971 158,971 158,971
.5 SF Restoration Authority 555,700 555,700 555,700 555,700
Subtotal 61,013,076 791,283 60,221,792 3,460,103 52,300,008 830,333 3,631,348 60,221,792
EXTERNAL AFFAIRS
2.4 Communications 588,056 588,056 588,056 588,056
.4 Legislative Activity 97,027 97,027 97,027 97,027
Subtotal 685,083 685,083 685,083 685,083
.1 Management & Administration 2,498,322 727,765 1,770,557 390,000 1,380,556 1,770,556
TOTAL $71,125,516 $3,306,374 $1,519,048 $66,300,093 $4,635,298 $52,718,857 $2,846,651 $4,033,648 $2,065,639 $66,300,093
13.3 Overhead 4
58.6 GRAND TOTAL $71,125,516 $3,306,374 $1,519,048 $66,300,093 $4,635,298 $52,718,857 $2,846,651 $4,033,648 $2,065,639 $66,300,093
ABAG BUDGET & WORK PROGRAM 43
1 FTE (full-time equivalent) Based upon a few individuals working less than full-time, the 60 employees transitioning to MTC represent 58.6 FTEs.
2 This funding has historically flowed to ABAG from MTC to fund planning activities.
3 This funding is the additional cost to fund the staff consolidation activities.
4 Overhead is ongoing business expenses, not including direct labor, direct materials, or third party expenses that are billed directly to programs. Functions charging to overhead include accounting, IT, clerk, reception, mail/supply clerk, and HR. This represents 13.3 FTEs and corresponding dollar amounts are included above in the Expenses column program line items.
Item 7, Attachment 4

AS S O C I A T I O N O F B A Y AR E A GO V E R N M E N T S Representing City and County Governments of the San Francisco Bay Area
May 10, 2017 To: Regional Planning Committee
From: Miriam Chion, ABAG Planning and Research Director
Re: Regional Planning Committee Review of ABAG Budget and Work Program, May 3, 2017
cc: ABAG Executive Board, ABAG General Assembly
At its May 3, 2017 meeting, the Regional Planning Committee (RPC) reviewed the 2017-2018 ABAG Budget and Work Program. This Budget and Work Program is essential for the ABAG-MTC Staff Consolidation. It defines the tasks that support the Council of Governments and is a requirement for the implementation of the Contract for Services between ABAG and MTC. This document will be submitted for approval by the ABAG General Assembly on June 5, 2017.
This is a summary of the comments, questions, and answers from the RPC for consideration by the ABAG Executive Board and General Assembly. The RPC requested that this information be sent to all bodies before the May 18, 2017 Executive Board meeting.
1. How will the housing program change as a result of the staff consolidation? Can we get a briefing on CASA? Can we insert equity and housing protection in the work program?
ABAG and MTC have been collaborating on regional housing strategies. Our approach has been to address production, preservation, and protection of existing residents. We have leveraged each agency’s resources to support housing strategies. An example was to condition One Bay Area Grant (OBAG) funding on the completion of Housing Elements, which allowed us to go from 60 to 100 percent of all cities being in compliance with State requirements. Now we are working together on the CASA initiative, which is an effort to bring stakeholders together to take bold actions to address the region’s housing crisis. Its purpose is to identify and carry out specific actions; to develop regional strategies such as supporting a suite of local ballot measures, or building a regional housing trust fund with a dedicated source of revenue that could also attract contributions from the tech community, then going to Sacramento together to get necessary legislative support. The CASA Initiative will be informed by the work of the RPC housing committee, which has already started building consensus across sectors. Staff will coordinate a presentation of CASA at an RPC meeting in the Fall. Equity and housing protection has been included in the work program but they will be made more explicit in the Tasks List (light blue document) under Housing, section 6a.
Item 7, Attachment 5

Page 2 of 4
2. The Bay Area Council sponsored legislation to make Accessory Dwelling Units (ADUs) easier and less expensive to permit. The Bay Area Council would like to offer technical and financial assistance on ADUs at the regional agencies. It would be helpful for ABAG to help local governments and home owners to get assistance on planning, contractors, and best practices related to the production of ADUs. Can you identify this effort in the list of tasks?
Yes, ADUs are part of the housing program. It will be inserted in the Tasks List (light blue document) under Housing, section 6a. We have also included references to the Bay Area Council reports in our housing material. ABAG staff appreciates the ongoing collaboration.
3. We want to acknowledge the work of the economic and workforce team convening, informing, and driving the discussion of key regional issues. This has supported multiple initiatives including those of the community colleges that are increasingly organizing themselves as a region to offer programs that align with the needs of industry. The completion of the Comprehensive Economic Development Strategy is a major milestone for the region. Moving forward, it is important that specific budget resources are identified to establish the Economic Development District and the Priority Production Areas. The integration of housing, jobs, transportation, land use, and shared prosperity is very important to the region, in particular to the poorest people in our communities.
As indicated below, the Tasks List includes two Full-Time Equivalent Employees (FTEs) for Jobs and Workforce, which is a preliminary figure. Cynthia Kroll will be preparing a work program for the Day 1 Organization Chart to identify the level of resources available.
4. The Finance Authority for Non-Profits (FAN) is vital and important to us. The fees from transactions and issuance of bonds are critical to the Council of Governments’ success. We want to make sure FAN continues to exist and gets off the ground to provide valuable services soon. Could you explain the status of FAN?
We are currently working with the FAN Executive Committee and MTC to create a new Finance Authority, a new Joint Powers Authority, which would basically take the place of the existing FAN. FAN will not take on any new business, but needs to persist as a legal entity to carry out its fiduciary responsibilities for its current portfolio. We hope we will be able to launch the new Finance Authority in early fall 2017.
5. It is important to understand what are and what would be the ABAG assets and liabilities as we move into a consolidated staff under MTC? When can we get a report?
The assets and liabilities are part of ABAG’s audited financial statements. They will continue to remain ABAG’s assets and liabilities after staff consolidation. The audited financial statements will be sent to the ABAG Regional Planning Committee, Executive Board and General Assembly before the next Executive Board meeting on May 18, 2017.
Item 7, Attachment 5

Page 3 of 4
6. What are the proposed full-time equivalent staff (FTEs) assigned to ABAG planning tasks?
The ABAG Planning Department has 22 FTEs that were considered for the Draft Integrated Regional Planning Program (Tasks List in light blue pages at the end of Budget and Work Program) to serve the Council of Governments. This is a partial component of the ABAG-MTC Integrated Planning Department and does not include current MTC staff that support or will be assigned to support the activities identified in the ABAG Budget and Work Program. This proposed total is subdivided as follows:
Housing 3.5 FTEs Jobs and Workforce 2.5 FTEs Resilience 2.0 FTEs Trails and Open Space 4.0 FTEs Complete Communities 4.0 FTEs Research and Analysis 4.0 FTEs Local Engagement 2.0 FTEs Total 22.0 FTEs
7. How would ABAG tasks be retained or modified in the integrated planning department under MTC? How would the ABAG tasks relate to the Day 1 Organizational Chart?
The budget for fiscal year 2017-2018 carries 20 FTEs, which excludes the current ABAG planning director and a junior planner. It includes all other current ABAG planners and one vacancy. The 20 FTEs will be integrated with 25 FTEs at the MTC Planning Department into a single department that is described in the Day 1 Organization Chart. This Chart is the basis for the integration of ABAG and MTC planning staff. They are currently meeting by teams to develop specific work programs that will serve both agencies. It is essential that staff from both agencies take the time to learn from each other’s tasks and explore the possibilities of forming a productive integrated department. This is an important coordination and collaboration effort that will take several more weeks. The ABAG Tasks List will inform the development of the new integrated work program.
8. Several committee members and planning directors indicated that local engagement is a critical component of regional planning efforts. How many FTEs are allocated to local engagement? Where is local engagement in the proposed Day 1 Integrated Planning Department Organizational Chart?
As indicated above, the current ABAG Local Engagement effort on committees, assemblies and coordination with local staff is two FTEs. Local engagement efforts related to specific projects are included in each of the teams. In particular, the Complete Communities team of
Item 7, Attachment 5

Page 4 of 4
four FTEs has the highest share of local engagement since the central focus is coordination with local staff and stakeholders around PDAs, Corridors, and place-making. This level of effort is likely to be distributed across the five units proposed in the Day 1 organizational chart. More information will be provided as the new work program is developed.
9. Planning directors have identified some key concerns and made specific requests: (1) A comparison of the last year’s budget and the proposed consolidated budget by
tasks. (2) Request to retain same level of effort on local engagement, housing, and trails. (3) Identify FTEs that will be allocated specifically to housing tasks in the
housing/neighborhoods section shown in the planning team organization chart, compared to current FTEs performing this work at ABAG;
(4) Identify FTEs allocated to engaging cities in the RHNA process—both in designing the next round and developing the allocation;
(5) Identify FTEs allocated to work on the refinement of the land use process in Plan Bay Area, based on local plans;
(6) Identify FTEs allocated to the work done by the Bay Area Planning Directors Association (BAPDA)
This is very helpful input. As indicated above, the allocation of FTEs and specific work programs for the ABAG-MTC Integrated Planning Department are under development. The location of BAPDA support within the organization chart is one of the tasks in this process.
10. How will the RPC and other ABAG committees be retained and supported through the staff consolidation and future merger process? What are the risks of losing these committees?
As a Council of Governments and a Joint Powers Authority, ABAG has final authority over its governance structure, its committees and assignments, and the charges given to those committees. Any change to the current number and structure of ABAG committees will be made solely at the discretion of the ABAG Executive Board. The functionality and support to the committees depends on the resources available. We are not expecting any changes to the RPC during the initial phase of staff consolidation. Changes to the ABAG and MTC committees might be considered in the future if committee members find excessive overlap on content and discussions across committees. For the RPC, Duane Bay will provide continuity in the transition as he understands the composition and expectations of the committee.
11. What is the work plan for the Regional Planning Committee for fiscal year 2017-2018?
The work of the Committee this year has focused on the ABAG-MTC Staff Consolidation, Plan Bay Area, and implementation strategies. Staff will discuss with the chair and vice-chairs a more specific program for the six meetings of the 2017-2018 fiscal year.
Item 7, Attachment 5

General Assembly
County Delegates
Scott Haggerty, Supervisor, County of Alameda
Karen Mitchoff, Supervisor, County of Contra Costa
Damon Connolly, Supervisor, County of Marin
Ryan Gregory, Supervisor, County of Napa
Sandra Lee Fewer, Supervisor, City and County of San Francisco
Warren Slocum, Supervisor, County of San Mateo
David D. Cortese, Supervisor, County of Santa Clara
Erin Hannigan, Supervisor, County of Solano
David Rabbitt, Supervisor, County of Sonoma
County Alternates
Richard Valle, Supervisor, County of Alameda
Diane Burgis, Supervisor, County of Contra Costa
Katie Rice, Supervisor, County of Marin
Alfredo Pedroza, Supervisor, County of Napa
Jane Kim, Supervisor, City and County of San Francisco
Dave Pine, Supervisor, County of San Mateo
Cindy Chavez, Supervisor, County of Santa Clara
Monica Brown, Supervisor, County of Solano
Susan Gorin, Supervisor, County of Sonoma
City Delegates
Cities in Alameda County
Marilyn Ezzy Ashcraft, Councilmember, City of Alameda
Rochelle Nason, Councilmember, City of Albany
Lori Droste, Councilmember, City of Berkeley
Don Biddle, Vice Mayor, City of Dublin
John J. Bauters, Vice Mayor, City of Emeryville
Roster

Francisco Zermeno, Councilmember, City of Hayward
John Marchand, Mayor, City of Livermore
Mike Bucci, Councilmember, City of Newark
Lynette Gibson-McElhaney, Councilmember, City of Oakland
Teddy Gray King, Councilmember, City of Piedmont
Arne Olson, Councilmember, City of Pleasanton
Deborah Cox, Councilmember, City of San Leandro
Emily Duncan, Councilmember, City of Union City
Cities in Contra Costa County
Sean Wright, Mayor, City of Antioch
Robert (Bob) Taylor, Mayor, City of Brentwood
Julie Pierce, Councilmember, City of Clayton
Carlyn Obringer, Councilmember, City of Concord
Lisa Blackwell, Councilmember, Town of Danville
Gabriel Quinto, Mayor Pro Tem, City of El Cerrito
Gerard Boulanger, Councilmember, City of Hercules
Ivor Samson, Councilmember, City of Lafayette
Mark Ross, Councilmember, City of Martinez
Jeanette C. Fritzky, Councilmember, Town of Moraga
Sue Higgins, Mayor, City of Oakley
Eve Phillips, Mayor, City of Orinda
Maureen Toms, Councilmember, City of Pinole
Marilyn 'Merl' Craft, Mayor, City of Pittsburg
Timothy M. Flaherty, Vice Mayor, City of Pleasant Hill
Thomas K. Butt, Mayor, City of Richmond
Rich Kinney, Councilmember, City of San Pablo
Bill Clarkson, Mayor, City of San Ramon
Rich Carlston, Councilmember, City of Walnut Creek
Cindy Silva, Councilmember, City of Walnut Creek
Cities in Marin County
Marty Winter, Vice Mayor, City of Belvedere
Renee Goddard, Councilmember, Town of Fairfax
Kevin Haroff, Vice Mayor, City of Larkspur
Roster

Jessica Sloan, Mayor, City of Mill Valley
Pam Drew, Councilmember, City of Novato
Elizabeth Brekhus, Councilmember, Town of Ross
Matt Brown, Councilmember, Town of San Anselmo
Maribeth Bushey, Vice Mayor, City of San Rafael
Joan Cox, Vice Mayor, City of Sausalito
Jim Fraser, Mayor, Town of Tiburon
Cities in Napa County
David Oro, Councilmember, City of American Canyon
Chris Canning, Mayor, City of Calistoga
Jill Techel, Mayor, City of Napa
Alan Galbraith, Mayor, City of St. Helena
John F. Dunbar, Mayor, Town of Yountville
City and County of San Francisco
Nicole Elliott, Director of Legislative and Govt Affairs, City and County of San Francisco
Cities in San Mateo County
Elizabeth Lewis, Councilmember, Town of Atherton
Eric Reed, Councilmember, City of Belmont
Lori S. Liu, Mayor, City of Brisbane
Michael Brownrigg, Vice Mayor, City of Burlingame
Joanne F. del Rosario, Councilmember, Town of Colma
Donna Rutherford, Councilmember, City of East Palo Alto
Charlie Bronitsky, Mayor, City of Foster City
Debbie Ruddock, Mayor, City of Half Moon Bay
Alvin L. Royse, Councilmember, Town of Hillsborough
Kirsten Keith, Mayor, City of Menlo Park
Ann Schneider, Councilmember, City of Millbrae
Sue Vaterlaus, Councilmember, City of Pacifica
Craig Hughes, Mayor, Town of Portola Valley
Shelly Masur, Councilmember, City of Redwood City
Mark Olbert, Councilmember, City of San Carlos
Rick Bonilla, Deputy Mayor, City of San Mateo
Roster

Pradeep Gupta, Mayor, City of South San Francisco
Deborah C. Gordon, Councilmember, Town of Woodside
Cities in Santa Clara County
Liz Gibbons, Mayor, City of Campbell
Steven Scharf, Councilmember, City of Cupertino
Daniel Harney, Councilmember, City of Gilroy
Mary Prochnow, Mayor, City of Los Altos
John Radford, Vice Mayor, Town of Los Altos Hills
Marcia Jensen, Councilmember, Town of Los Gatos
Anthony Phan, Councilmember, City of Milpitas
Marshall Anstandig, Mayor, City of Monte Sereno
Caitlin Robinett Jachimowicz, Councilmember, City of Morgan Hill
Margaret Abe-Koga, Councilmember, City of Mountain View
Greg Scharff, Mayor, City of Palo Alto
Sergio Jimenez, Councilmember, City of San Jose
Teresa O'Neill, Vice Mayor, City of Santa Clara
Mary-Lynne Bernald, Vice Mayor, City of Saratoga
Larry Klein, Councilmember, City of Sunnyvale
Cities in Solano County
Steve Young, Vice Mayor, City of Benicia
Steven Bird, Councilmember, City of Dixon
Harry T. Price, Mayor, City of Fairfield
Ronald Kott, Vice Mayor, City of Rio Vista
Michael A. Segala, Councilmember, City of Suisun City
Len Augustine, Mayor, City of Vacaville
Katy Miessner, Councilmember, City of Vallejo
Cities in Sonoma County
Augustine 'Gus' Wolter, Mayor, City of Cloverdale
Susan Harvey, Mayor, City of Cotati
Brigette Mansell, Vice Mayor, City of Healdsburg
David Glass, Mayor, City of Petaluma
Jake Mackenzie, Mayor, City of Rohnert Park
Roster

John J. Sawyer, Councilmember, City of Santa Rosa
Patrick Slayter, Vice Mayor, City of Sebastopol
David Cook, Councilmember, City of Sonoma
Mark Millan, Councilmember, Town of Windsor
Alternates
Cities in Alameda County
Frank Matarrese, Vice Mayor, City of Alameda
Nick Pilch, Vice Mayor, City of Albany
Kriss Worthington, Councilmember, City of Berkeley
Melissa Hernandez, Councilmember, City of Dublin
Christian R. Patz, Councilmember, City of Emeryville
Elisa Marquez, Councilmember, City of Hayward
Bob Carling, Councilmember, City of Livermore
Alan L. Nagy, Mayor, City of Newark
Dan Kalb, Councilmember, City of Oakland
Paul Benoit, City Administrator, City of Piedmont
Karla Brown, Councilmember, City of Pleasanton
Corina Lopez, Councilmember, City of San Leandro
Pat Gacoscos, Vice Mayor, City of Union City
Cities in Contra Costa County
Lori Ogorchock, Councilmember, City of Antioch
Joel Bryant, Councilmember, City of Brentwood
David Shuey, Councilmember, City of Clayton
Tim McGallian, Councilmember, City of Concord
Paul Fadelli, Councilmember, City of El Cerrito
Myrna deVera, Mayor, City of Hercules
Mark Mitchell, Councilmember, City of Lafayette
Roger Wykle, Vice Mayor, Town of Moraga
Randy Pope, Vice Mayor, City of Oakley
Timothy Banuelos, Mayor Pro Tem, City of Pinole
D. Pete Longmire, Vice Mayor, City of Pittsburg
Roster

Susan A. Noack, Councilmember, City of Pleasant Hill
Eduardo Martinez, Councilmember, City of Richmond
Genoveva Garcia Calloway, Vice Mayor, City of San Pablo
Dave Hudson, Vice Mayor, City of San Ramon
Loella Haskew, Councilmember, City of Walnut Creek
Cities in Marin County
Claire McAuliffe, Councilmember, City of Belvedere
Peter Lacques, Vice Mayor, Town of Fairfax
Catherine Way, Mayor, City of Larkspur
Sashi McEntee, Councilmember, City of Mill Valley
Pat Eklund, Councilmember, City of Novato
Ford Greene, Councilmember, Town of San Anselmo
Joe Burns, Councilmember, City of Sausalito
Emmett O'Donnell, Vice Mayor, Town of Tiburon
Cities in Napa County
Mariam Aboudamous, Councilmember, City of American Canyon
Michael Dunsford, Vice Mayor, City of Calistoga
Scott Sedgley, Councilmember, City of Napa
Peter White, Vice Mayor, City of St. Helena
Marita Dorenbecher, Vice Mayor, Town of Yountville
City and County of San Francisco
Vacant
Cities in San Mateo County
Cary Wiest, Vice Mayor, Town of Atherton
Charles Stone, Mayor, City of Belmont
W. Clarke Conway, Mayor Pro Tem, City of Brisbane
Ricardo Ortiz, Mayor, City of Burlingame
Raquel (Rae) Gonzalez, Vice Mayor, Town of Colma
Raymond A. Buenaventura, Councilmember, City of Daly City
Larry Moody, Mayor, City of East Palo Alto
Sam Hindi, Vice Mayor, City of Foster City
Roster

Adam Eisen, Councilmember, City of Half Moon Bay
Shawn Christianson, Vice Mayor, Town of Hillsborough
Peter Ohtaki, Mayor Pro Tem, City of Menlo Park
Wayne J. Lee, Councilmember, City of Millbrae
Sue Digre, Councilmember, City of Pacifica
Ann Wengert, Councilmember, Town of Portola Valley
Jim Ruane, Mayor, City of San Bruno
Ron Collins, Councilmember, City of San Carlos
Diane Papan, Councilmember, City of San Mateo
Liza Normandy, Vice Mayor, City of South San Francisco
Cities in Santa Clara County
Rich Waterman, Councilmember, City of Campbell
Barry Chang, Councilmember, City of Cupertino
Peter Leroe-Munoz, Councilmember, City of Gilroy
Lynette Lee Eng, Councilmember, City of Los Altos
Gary Waldeck, Mayor, Town of Los Altos Hills
Marico Sayoc, Mayor, Town of Los Gatos
Garry Barbadillo, Councilmember, City of Milpitas
Curtis Rogers, Councilmember, City of Monte Sereno
Steve Tate, Mayor, City of Morgan Hill
Patricia Showalter, Councilmember, City of Mountain View
Patricia Mahan, Councilmember, City of Santa Clara
Rishi Kumar, Councilmember, City of Saratoga
Cities in Solano County
Alan Schwartzman, Councilmember, City of Benicia
Devon Minnema, Councilmember, City of Dixon
Hope Cohn, Councilmember, City of Rio Vista
Michael J. Hudson, Councilmember, City of Suisun City
Curtis Hunt, Councilmember, City of Vacaville
Bob Sampayan, Mayor, City of Vallejo
Cities in Sonoma County
Mark Landman, Vice Mayor, City of Cotati
Roster

Gina Belforte, Councilmember, City of Rohnert Park
Gary Edwards, Mayor Pro Tem, City of Sonoma
Debora Fudge, Mayor, Town of Windsor
Linda Kelly, Town Manager, Town of Windsor
4/28/17
Roster