Embed Size (px)
Citation preview

CA Def & Meas 1
CHILD ABUSE:DEFINITION AND RATES
Soc 695 Family Violence In Research World Perspective Murray A. Straus
HOW MUCH CHILD ABUSE IS THERE?DEPENDS ON SOURCE OF DATA
CASES KNOWN TO CHILD PROTECTIVE SERVICES* About a million cases per year (2000 rates)
* A fraction of the real total
* Percent of these million cases (not percent of all children)•Neglect 63%•Physical abuse 19%•Sexual abuse 10%
•The million cases known to CPS are a fraction of the real number
The most frequent
CA Def & Meas 2
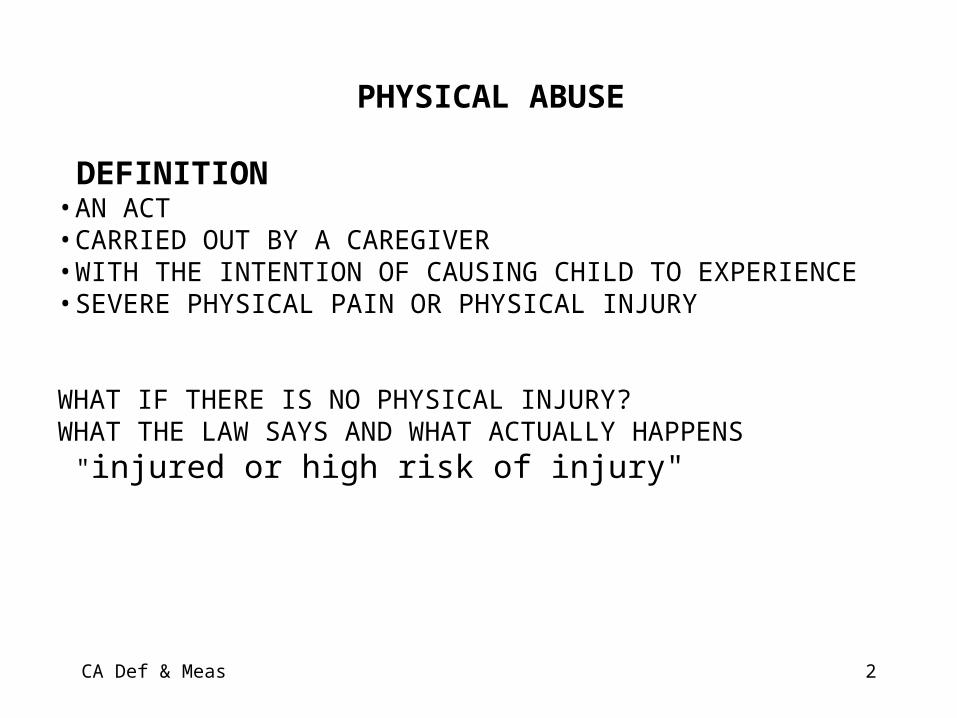
PHYSICAL ABUSE
DEFINITION• AN ACT• CARRIED OUT BY A CAREGIVER• WITH THE INTENTION OF CAUSING CHILD TO EXPERIENCE• SEVERE PHYSICAL PAIN OR PHYSICAL INJURY
WHAT IF THERE IS NO PHYSICAL INJURY?WHAT THE LAW SAYS AND WHAT ACTUALLY HAPPENS
"injured or high risk of injury"

CA Def & Meas 3
TWO WAYS OF DRAWING THE LINE BETWEENCORPORAL PUNISHMENT AND PHYSICAL ABUSE
CULTURAL NORMS DEFINE WHAT IS ABUSEINJURY TO THE CHILD DEFINES WHAT IS ABUSE
EXAMPLE OF HITTING WITH A BELT OR HAIR BRUSH• New Hampshire Supreme Court Decision• Sweden
OTHER POINTS• Hitting or attempting to hit another adult is a crime even `when it does not cause injury• Regardless of physical injury, both physical abuse and
corporal punishment cause psychological injury.

CA Def & Meas 4
CHILD ABUSE DEATHS IN THE USACHILD ABUSE DEATHS IN THE USA
About 1,500 a year in recent years= About 4 children every day
STUDIES OF DEATH RECORDS & AUTOPSY REPORTS: MANY CASES MISSED IN OFFICIAL RECORDS – ACTUAL RATE COULD BE MUCH HIGHER
% of Child Deaths Due to Maltreatment
but Not Coded as SuchMcClain et al. (1993) Missouri 85% Crume et al. (2002) Colorado 1990 through 1998 50%Giddens et al. (1999) North Carolina 985 to 1994 60%

CA Def & Meas 5
USA: 1,500 PER YEAR;
4 PER DAY
HOW DOES THE USA COMPARE WITH OTHER NATIONS?

CA Def & Meas 6
OF NON-FATAL PHYSICAL ABUSE
0.1%
2.3 or 11%
ILLUSTRATES THE DIFFERENCE THAT THE MEASURE CAN MAKE
WHAT BEHAVIORS ARE INCLUDED
0.9%
23 TO 100 TIMES GREATER

CA Def & Meas 7
CTSPC
PARENT-CHILD CTS QUESTIONS ON PHYSICAL ABUSE

CA Def & Meas 8
ARAB ADOLESCENTS
FATHER MOTHER SIBLING

CA Def & Meas 9

CA Def & Meas 10
How often did your caregivers push, grab, shove, or slap you?
Never 46Rarely 25Sometimes 18Often 3Most of the time 3Always 2
How often did your caregivers threaten you with a weapon?
Never 84Rarely 7Sometimes 3Often <1Most of the time <1Always <1
51%
13%
Koenig, A. L., Ialongo, N., Wagner, B. M., Poduska, J., & Kellam, S. (2002). Negative caregiver strategies and psychopathology in urban, African-American young adults. Child Abuse & Neglect, 26, 1211-1233.
ARE THESE EXAMPLES OF PHYSICAL ABUSE? WHY OR WHY NOT?

CA Def & Meas 11
How often did your caregivers hit you hard enough to cause bruising?
Never 74Rarely 13Sometimes 7Often 1Most of the time <1Always <1
How often did your caregivers hit you hard enough to cause bleeding?
Never 91Rarely 4Sometimes 1Often <1Most of the time <1Always <1
24%
8%

CA Def & Meas 12
0%
5%
10%
15%
20%
25%
30%
35%
40%
45%
SPANK, SLAP SHOVE, KICK PULL EAR, HAIR BELT, BRUSH PUNCH, SOCK
LOW HUMAN DEVELOPMENT INDEXAREA
HIGH HUMAN DEVELOPMENT INDEXAREA
MARIA AMELIA AZEVEDO AND VIVIANNE NORGUIRA DE AZEVEDO GUERRA, 2001 HITTING MANIA. SAO PAULO: IGLU EDITORIA
CHILDREN AGE 7-9, SAO PAULO, BRAZIL, 1999 (N=271)
AVEZEDO1

CA Def & Meas 13
IN MOST CONFIRMED CASES OF CHILD ABUSE THE CHILD IS NOT INJURED ENOUGH TO NEED MEDICAL
ATTENTION
Garbarino -- 85% did not need medical attention
Canadian Incidence Study (2005) -- 90%

CA Def & Meas 14
WHAT CAUSES THE HUGE DIFFERFENCES IN RATES?
Severity of the attacks studied – slapping to stabbingWhether the criterion is the attack or injuryHow many types of attacks are listed - example, soap in
mouthAge of the children studiedWho provides the data: parent, child, human service
professional, policeDifferences in social setting – cultural and social structural
factors that are related to child abuse The context of the survey – “family problems” versus
“crime”Random sample versus sample of families with a problem

CA Def & Meas 15
TYPICAL CASE OF PHYSICAL ABUSE VERSUS MEDIA CASE
PHYSICAL ABUSE OF CHILDTYPICAL MEDIACASE CASE
VIOLENT Corporal Cruel & ACTS Punishment often bizarre
Escalates .. Attacks
INJURY Child Child needsbruised medical care
or dies COVERAGE Ignored by Front page
Mediaunless acelebrity

CA Def & Meas 16
END FOR SOC 695

CA Def & Meas 17
SOME CRITERIA FOR EVALUATING HOW IMPORTANT A SOCIAL PROBLEM IS
PREVALENCE RATEDEGREE OF HARM CAUSED
Percentage harmed (“effect size”)Severity of harm
CULTURAL NORMS
EACH OF THE ABOVE INFLUENCES THE OTHER
THE MOST HARMFUL PROBLEM FOR INDIVIDUALS MAY NOT BE THE BIGGEST PROBLEM FOR SOCIETY
Example spanking versus physical abuse as risk factors for depression

CA Def & Meas 18
THREE KEY THINGS TO KNOW ABOUT ANY ASPECT OF FAMILY VIOLENCE
• PREVALENCE• CAUSES• EFFECTS

CA Def & Meas 19
CTSPC

CA Def & Meas 20

CA Def & Meas 21
Rates for “Any Physical Maltreatment” are similar to those found in 4 Eastern European Countries by Sebre et al

CA Def & Meas 22
ARABADOLESCENTS

CA Def & Meas 23
AUSTRALIAN BIRTH COHORT STUDY
ALL CHILDREN BORN IN QUEENSLAND IN 1983: 41,700, RATES FOR CASES KNOWN TO CHILD PROTECTIVE SERVICES 10% WERE ABUSED BY AGE 17 Rate
Neglect 4.1%Physical abuse 3.8%Emotional abuse 2.4%Sexual Abuse 2.3%
US RATES FOR CASES KNOWN TO CHILD PROTECTIVE SERVICES ARE MUCH LOWER, BUT THEY ARE FOR ONE-YEAR US DISTRIBUTION OF CASES IS SIMILAR:
Neglect half of all casesPhysical abuseEmotional abuseSexual Abuse
US RATES FOR SELF-REPORTED ABUSE???

CA Def & Meas 24
Rank12345678910111213141516171819202122
Hit by Parents when Under the Age of 12 (vs01)Site % USA-LOUISIAN 68.6MEX-JUAREZ 66.0CAN-WINNIPEG 64.4USA-MISSISSP 64.0USA-CINCINN 63.4HONGKONG 62.7USA-TX-N MEX 62.5KOR-PUSAN 58.8CAN-HAMILTON 58.4USA-UTAH 58.4CAN-LONDON 57.2NZL-CHRISTCH 55.2USA-TX-MEX 54.4CHE-FRENCH 51.9USA-NH 2 49.3USA-NH 1 44.0CHE-GERMAN 35.2CAN-MONTREAL 27.3PRT-BRAGA 23.5ISR-EMEKZYRL 22.8BRA-SAOPAULO 19.6NDL-AMSTRDAM 19.5
Hit by Parents When a Teenager
(vs02)Site % HONGKONG 56.4KOR-PUSAN 52.2PRT-BRAGA 45.5BRA-SAOPALO 40.0USA-MISSISSP 37.8USA-LOUISIAN 37.4USA-TX-MEX 34.5MEX-JUAREZ 30.1CAN-HAMILTON 26.5CAN-LONDON 26.4USA-CINCINN 26.2CAN-WINNIPEG 24.1USA-TX-N MEX 23.4CHE-FRENCH 20.4CAN-MONTREAL 19.2ISR-EMEKZYRL 19.2NZL-CHRISTCH 17.2USA-NH 1 16.8USA-UTAH 16.8CHE-GERMAN 16.8USA-NH 2 16.1NDL-AMSTRDAM 12.6
Hit by Non-Family Adults & Children as a Child (vs10)Site % HONGKONG 72.3KOR-PUSAN 62.8CHE-FRENCH 57.0NDL-AMSTRDAM 46.6MEX-JUAREZ 45.7CAN-LONDON 42.1PRT-BRAGA 39.5NZL-CHRISTCH 38.1USA-UTAH 37.2USA-CINCINN 36.2CAN-WINNIPEG 36.1CAN-HAMILTON 35.8USA-TX-MEX 35.4USA-LOUISIAN 35.2USA-NH 1 33.4USA-TX-N MEX 32.2USA-MISSISSP 30.6BRA-SAOPAULO 30.4USA-NH 2 29.0CAN-MONTREAL 28.0ISR-EMEKZYRL 27.1CHE-GERMAN 21.5
TABLE 1: CHILDHOOD PHYSICAL VIOLENCE VICTIMIZATION