Embed Size (px)
Citation preview


1
C.6 Stack Testing
This module will provide an overview of various aspects relating to stack testing.

2
2
Presentation Outline
• Basic test program organization and design concepts
• Characterizing organic compounds• Characterizing inorganic compounds• Measuring particulate matter• Analytical concepts
Basic program organization and design aspects will be reviewed along with how various analytes of interest are sampled for and measured analytically.

3
3
Why Do We Monitor ?
• R&D purposes• Evaluate the impact of
process changes• Establish operating
envelope• Establish performance• Meet regulatory
requirements
First, stack testing can be performed for a number of different reasons as shown on this slide. Some programs are designed to be understand emissions for engineering design and operational purposes, while other programs of course are performed to establish compliance with regulatory requirements.

4
4
Regulatory Programs With Testing Requirements• Resource Conservation & Recovery Act (RCRA)
– Treatment, storage and disposal facility regulations• Clean Air Act (CAA)
– NSR – New Source Review– NSPS - New Source Performance Standards– NESHAPs - National Emission Standard for HAPs– Title V Permitting Program
• State hazardous waste and air programs• Toxic Substances Control Act (TSCA)
– PCB incineration and treatment• Air permit specific requirements
There are a number of applicable laws and regulations that can require stack testing to be performed and these are summarized on this slide. They are:
Resource Conservation & Recovery Act (RCRA);Clean Air Act (CAA) including New Source Review, New Source Performance Standards, National Emission Standards for Hazardous Air Pollutants, and Title V Permits;State hazardous waste and air programs;Toxic Substances Control Act (TSCA); andAir permit specific requirements.
In addition, there can be state and/or local air regulatory requirements that also can impose stack testing programs as well.

5
5
Getting Started
So let’s get started

6
6
How Test Programs are Organized• Essential to include a well balanced Team!• Facility/corporate environmental• Operations for source(s) to be tested• Safety• Stack testing firm• Specialty contractors
– Spiking– Field portable measurements – GC, GC/MS, FTIR
• Analytical Laboratory• Regulatory agency
In the early stages of planning a stack testing program, it is essential to identify the stakeholder who need to be part of the project team in some capacity or another. This slide includes a listing of the potential personnel or organizations who might need to be involved.
7
7
Safety• Must Plan for it – every team member’s
responsibility!!• Required training
– HAZWOPER, local industry council (e.g., “Basic+”)• Specific physical and chemical issues
– Basic plant access, emergencies, medical support– Working at heights (roofs, scaffolding, need to tie off)– Lifting heavy equipment (rope and pulley)– Thermal concerns (probe, stack gas temperature, steam)– Chemical exposure concerns (stack gas, adjacent
operations)– Working conditions (hours, heat/cold, sun, insects)
Safety is an essential aspect of a successful stack testing project as there are a number of issues that can impact any participant in the field program. In working at hazardous waste combustion facilities, HAZWOPER training is a must and generally a minimum requirement for all participants who will be onsite for any duration. In addition, certain states and regions require local industry council training as well. For example, industries in the Gulf Coast require “Basic+” training which can be obtained from several different area training organizations, such as the Houston Area Safety Council. Some of the specific safety issues that personnel participating in the field program should be prepared for are listed on this slide and should be reviewed by all participants prior to arriving on site so that proper personal protective equipment can be identified to perform the work safely.

8
8
Need to Understand the Process to be Tested
Products•CO2•H2O•Acid Gases•Particulate Matter•Heavy metals•Products of
Incomplete Combustion•NOx, CO, SO2
Reactants•Liquid, solid and gaseous fuels
•O2•Heat
“Black Box” Reactor
Test program design involves understanding what is to be tested for both going into a process and exiting the process. It is also essential to understand the purpose and use any such data collection serves. Collection of unnecessary data can overly complicate the field program and add unneeded cost.

9
9
Upfront Planning is Critical!• Define test objectives thoroughly, long before testing• Understand implications of data you are collecting• Understand agency notification requirements, if
applicable• Is a test protocol and/or agency approval needed?• What are critical QA/QC procedures?
– i.e., pre-spikes or agency audit samples
Some programs are designed for evaluating compliance while others are not. But irrespective, thorough upfront planning is essential to conducting a successful stack test program. First, the objectives must be thoroughly identified. If the program is a CPT, then this will be done through the process of preparation, review and agency approval of the CPT Plan. It is also essential to assess what involvement the agency should[ have in a program. In some cases, programs may be performed strictly for internal knowledge and unless permit requirements mandate agency involvement on any stack test, the facility may not involve the agency. Also, thought must be given as to whether the data, if even generated by a strictly internal test program, is envisioned being used for agency submittal in the future.

10
10
Upfront Planning - continued• Confirm availability of
– Operations equipment to be tested– testing firm– specialty contractor(s) – Laboratories– Agency oversight staff
• All instrumentation used for measurement must be functional and in calibration!– Process – flow meters, thermocouples, etc. – CEMs - typically by a RATA– Stack sampling equipment – includes pre-test and sometime
post-test calibrations
Once the test plan has been designed and the parameters and operating conditions to be tested for have been determined, the logistics of actually conducting the test must be firmed up with operations, the stack testing firm and any specialty subcontractors (like spiking firms), laboratories and the regulatory agency. And finally, all process instrumentation, CEMS and testing equipment to be used on the project must be functional and within their current calibration frequency.

11
11
Team Roles
The next several slides will summarize the roles of various team members who will be involved with the program.

12
12
Facility/Corporate EHS staff• Understand regulatory/permit
requirements• Review test plan to assure that conducting
the testing will comply with applicable regulations and permits
• Assess need for agency notifications• If agency sends observer(s), address
needs to facilitate their access and safety
Generally, each stack project has someone involved who is in either a facility or corporate environmental, health and/or safety role. Generally, their duties involve understanding the regulatory and permit requirements applicable to the project and making sure the test plan will enable the source to comply with applicable permits and regulations. In addition, it is typically the role of the EHS staff to coordinate any agency notifications and arrangements for onsite observers.

13
13
Operations Staff• Understand limits to be set during
testing• Verify plant can achieve operating
scenarios• Schedule any upfront
maintenance work– Instrument calibrations– Scaffolding
• Arrange for feeds• Review test with operations staff• Assure plant is ready to be tested
– i.e., access to sample ports
Operating staff have the crucial role of preparing their unit for testing in accordance with what the test plan dictates. This means they need to understand how the plan envisions their unit will operate during testing and to verify that they can actually deliver the operating rates and conditions the test plan calls for. In addition, they will need to assure that the unit to be tested is thoroughly ready, all instrumentation is properly calibrated and that any maintenance work that needs to be done beforehand is scheduled.

14
14
Stack Testers
•Gas–Temperature, flow rates, moisture
–Volatile and semivolatile organics
–CO2, CO, Chlorine, SO2, NOx (calibration gas ranges)
–Mercury vapor•Liquid
–Acid aerosols
–High molecular weight organics
–Metals
•Solid–Flyash
–Carbon
–Metals
Need to know What is Expected in Flue Gas –how to obtain a representative sample/accurate results
The stack testing firm need to thoroughly understand each matrix to be tested, how representative samples are to be collected and what the anticipated levels of the various parameters might be. This is typically defined through the test plan itself, but also typically involves looking at previous stack test results to understand some of the basic stack sampling parameters, like stack diameter, flow rates, moisture, etc. are in order to bring the correct equipment to the site.

15
15
Analytical Laboratories• Coordinate with testing firm and facility to
make sure– Pre-testing materials supplied – filters, pre-
spiked traps– Samples can be timely processed – Turnaround times meet facility needs
• Assure proper and adequate QA/QC is followed
Analytical laboratories must be coordinated with early in the process to make arrangements for sampling media to be properly prepared (e.g., pre-spiked) as needed and shipped to the site before the test team arrives. In addition, the QAPP will specify such things as sample holding times, what methods are to be used and what, if any, special QA/QC requirements may need to be performed as part of the analytical work.

16
16
Test Program Design
“The Devil is in the details!”
Now let’s take a look at actual test program design.

17
17
Test Program Approach• What parameters do I need to measure?
– In the feeds– In the process– In the stack
• Why do I need to know it?• What level of accuracy and precision is needed? • What is the optimal methodology for sampling and
analysis? • How does the process need to operate?
– Normal or typical– Worst case
• How much does it cost?
Test program design starts with making a list of all the parameters that need to be tested, in waste streams, process streams (like scrubber blowdown) and emissions. For a typical CPT, the methods and process operating conditions will then be established.

18
18
Typical Test Parameters for Combustion Systems• Performance/Emissions Standards
– RCRA : PM, HCl/Cl2, DRE/CO, RCRA metals, maybe risk parameters
– MACT : PM, HCl/Cl2, DRE/CO/THC, MACT metals, D/Fs,
• Risk Assessment Parameters– Volatile PICs– Semivolatile PICs (PAHs, PCBs, D/Fs)– Hexavalent chromium– Total Organics– Particle-size distribution
Typical test parameters for HWC units generally fall into one of two categories. Generally, they are parameters that must be evaluated for to show a unit meets the required performance/emissions standards or they are parameters that are used as input information to conduct the multi-pathway risk assessment.

19
19
What are the Test Methods• EPA approved test methods
– 40 CFR § 60 Appendix A– 40 CFR § 61 Appendix B– SW-846– Performance Specifications for CEMs (40 CFR § 60 Appendix B)– Alternative Test Methods– Conditional Test Methods
Website: http://www.epa.gov/ttnemc01/• Various ASTM Methods• State Specific Test Methods
– NJ DEP – Website: http://www.nj.gov/dep/bts/constack.html– CARB - Website: http://www.arb.ca.gov/testmeth/testmeth.htm
• Others – NCASI, NIOSH
This slide summaries the references for the various test methods that can be used. It is important to understand what is required in certain states as some have their own preferred methods.
20
20
Types of Sampling• Continuous – (near) real time, shows how
concentration changes with time– CEMs, field portable GC, GC/MS or FTIR
• “Grab” – single point in time/instantaneous, provides concentration at a given moment– Small volume tedlar bag, glass sample bulbWill you need concentration only, or mass/time results? Wet or dry? Corrected to ___% oxygen?
There are several types of stack sampling techniques that can be used in stack testing. For some situations, there are real time or near real time approaches that provide direct readouts onsite and can show how concentration changes with time. There are also grab type approaches, where samples are collected for a very short time from, such as minutes. In any case, it is always important to understand whether only concentration data is needed or if mass per time results are as this affects what other data needs to be collected. If mass/time data is needed, then stack flow rate, stack gas molecular weight and moisture content is needed. Molecular weight will be determined determining the oxygen and nitrogen content of the flue gas.

21
21
Types of Sampling - Continued• Integrated –averaging over time of concentration
– Isokinetic Sampling – used when analyte is present in particulate or droplet form
– Multiple point sampling across stack – Particulates, metals, acid, semi-volatile organics– Non-isokinetic Sampling – used for measuring gases or
vapors– Single point sampling near center or point of average
velocity– Volatile organics, CO, CO2, NOx, SO2
Will you need concentration only, or mass/time results? Wet or dry? Corrected to ___% oxygen?
In addition the techniques mentioned in the previous slide, the most common type of stack sampling performed is collecting an integrated sample, which means sampling the source over a period of time ranging from 20 to 30 minutes to several hours. This type of sampling can be either isokinetic or non-isokinetic. Isokinetic sampling is used when the parameter of interest is expected to be present as a particulate or droplet where the actual concentration may various across the stack gas as it flows out the stack. Non-isokinetic sampling is used when measuring gases or vapors whose concentrations are not expected to vary across the flow of the stack gas.

22
22
SpecificityOften it is important to differentiate between related species with differing environmental or toxicological properties.
Examples:Hg0 versus HgCl2, vapor phase or particulateTotal Cr (Cr (III) + Cr (VI)) versus just Cr(VI)
Total PCBs versus Coplanar PCBsVOCs - total or speciatedPCDD/PCDFs – total, just 2,3,7,8-TCDD, TEQ
Another factor affecting test program design is whether or not certain parameters can be tested just for their total amount or whether individual species of a given parameter need to be delineated. This is important as this can affect what test method is selected for both sampling and analysis. Some examples are shown on this slide.

23
23
Isokinetic vsNon Isokinetic
Sampling
12 Point Traverse
As mentioned in a previous slide, isokinetic sampling is used when the parameter of interest is expected to be present as a particulate or droplet. In this situation, the stack tester uses sampling equipment that is capable of “traversing” the stack so that selected points across the diameter of the stack are sampled at for pre-determined amounts of time, based on the overall sampling time. In this sampling technique, the velocity at each point along the traverse is measured as a pressure drop and the sampling rate of the sample train is adjusted so that the gas velocity of the sample nozzle equals the gas velocity immediately around the probe. As can be seen in the diagram on this slide, this is essential to assure that a representative sample of stack gas is collected.

24
24
Traverse Point Selection
Part of determining how to perform isokinetic sampling is first to assess how many traverse points are needed. This is done following EPA Method 1 at the back of 40 CFR 60 Appendix A and knowing the information regarding the stack diameter and sampling port location(s) as shown on the figure in this slide. Once the number of traverse points is determined, Method 1 provides a table indicating at what percent of the stack diameter each point is to be located and the probe can then be marked to make sure that sampling is done at each of the required points along each traverse. Isokinetic sampling requires two complete traverses to be done at 90 degrees to each other in the same plane. The length of time sampling at each traverse point is performed for is determined by the total sampling time required for that method divided by the total number of traverse points used.

25
25
Where do I sample?• Feed or waste streams
– Representative (purge sample leg!!)– Before any spiking
• Flue gas– Before/after control devices – Avoid flow perturbations (e.g., duct turns, restrictions,
convergences/divergences, other sampling probes, etc.)
– Avoid cyclonic flow – check as part of preliminary traverses
Sampling locations are important to evaluate to make sure they will assure a representative sample is collected. For liquid waste sampling, this usually means avoiding a sample location where the waste might lie dormant or make sure that leg of piping is purged with fresh waste before sampling. Solid feed sample locations are typically pretty obvious. For either case, collecting a sample before any spiking is done is essential to getting a representative sample of the waste as generated. On the flue gas or stack sampling side, it is important to identify sample locations so that flow disturbances are minimized and in particular, cyclonic flow is not present. Ideally, the sample location should be located 8 stack diameters downstream from a flow disturbance and a minimum of two stack diameters upstream of a flow disturbance, like the top of the stack. These distances can be as little as 2 diameters downstream and ½ diameters upstream, but the acceptable still needs to be determine by conducting a preliminary traverse at the intended sampling location at the flow rate testing will be conducted at to assure that cyclonic flow does not exceed the maximum allowable in Method 1.
26
26
BlanksBlank: A QA/QC sample used to monitor the introduction of contamination into a process
• Field Blanks – trip, equipment• Reagent Blanks• Laboratory Blanks – glassware, media• Method Blanks
While the inclusion of blanks in the CPT has been discussed in the QAPP Module, this slide summarizes what the typical types of blanks are that are used in a typical CPT.

27
27
Dynamic Spiking
Non-native markers can be added in known quantities to allow assessment of sampling/analysis efficiency. Isotopically labeled materials, such as C13-compounds, are most frequently used.
Another aspect of test program design is the incorporation of pre-spiked compounds particularly in the dioxin and furan train, but also in the event the a semi-volatile POHC would be used.

28
28
Some Key Methods
The next segment in this module discusses the more common test methods used for evaluating HWC emissions.

29
29
EPA Methods Basic to Most Programs• EPA Method 1 – sampling and velocity
traverses• EPA Method 2 – determining stack gas
velocity and volumetric flow rate• EPA Method 3 – Determining fixed gases
– O2, CO2 and N2• EPA Method 4 – Determining moisture
content of stack gases
Virtually all stack test programs rely on the four EPA test methods included on this slide and found in 40 CFR § 60 Appendix A. Each of these methods have several options or alternatives to address the different testing environments and flue gas compositions that may exist. As discussed earlier, Method 1 focuses on assuring a proper sampling location is chosen and the proper sampling is conducted. Methods 2 through 4 deal with obtaining flue gas parameters that are essential to determining flue gas flow rate, molecular weight and moisture, the basic properties that are needed to determine mass flow rates, convert data to dry (0 % moisture) and standard conditions (1 atmosphere of pressure and 68 degrees F), and correct results to either the appropriate oxygen content or in some cases carbon dioxide content.

30
30
Isokinetic Sampling System
This slide includes a picture of a typical EPA Method 5 isokinetic sampling train. On the left is the meter box which includes a manometer in red on the right, thermocouple readouts on he left, gas volume readings, sampling pump is on the bottom and inside is a dry gas meter that measures the total volume of sample gas collected. On the very right of the picture is the impinger bucket with the glass impingers used in the train. To the left of that is the hot box that is heated and contains the filter assembly. Extending from the left side of the hot box horizontally behind the meter box is the probe, equipped with a type S pitot tube, actual sampling probe and thermocouple which is above the pitot tube and probe. Probes are different lengths depending on the stack diameter and are heated with a mantle to maintain the method required temperature. The probe has a liner that runs the entire length of the probe, connecting on one end to the actual sample nozzle and on the other to the front half of the filter housing. Liners are commonly glass, quartz or teflon. Probes can also be water cooled when dealing with extremely high temperatures.

31
31
Particulate Matter
• EPA Method 5• Isokinetic Sampling Approach• Gravimetric Determination of Filter Media• Back-Half Considerations• PM10 (EPA Method 201A/202)
Particulate matter is typically measured following Method 5 and is an isokinetic method. Filters are pre-weighed and then after sampling the filter is dried and re-weighed. In addition, the nozzle, probe liner and front half ofthe filter housing are rinsed with acetone, which is collected and also sent back to the lab. The acetone rinse is dried down in a pre-weighed beaker and the weight of the residue as added to the weight of the PM on the filter to determine the total catch of PM. Some states also require the collection and weighing of the back half and impingers so that a “condensable” PM is determined in addition. A special PM10 sampling head can also be added for the determination of PM that is less than 10 microns in size. One-hour sampling times for this method are typical.
EPA Method 5 also includes the procedure to calculation whether or not each sampling run was performed isokinetically. This check must be done and must within the range of 90 to 110% isokinetic.

32
32
Inorganic Compounds
• Process gases• Criteria pollutants• Metals
The next methods that will be discussed will include sampling for inorganic compounds.

33
33
HCl/Cl2 and Hydrogen Halides
• EPA Methods 26 and 26A
• EPA Method 0050• Differentiates between
HCl and Cl2
EPA has a couple of published methods for the collection of HCl and chorine. EPA Method 26 is a non-isokinetic method that can be used if these analytes are present strictly as a gas or vapor and Methods 26A and 0050 (an SW846 method). The use of two different reagent solutions in the impingers allows for differentiation of the acid and the halide. The different sample fractions are sent to an offsite lab and analyzed via ionchromatography to determine the total halide in the fraction. This method can also be used to analyze for other halogens and can be combined with the PM method (if condensable PM is not required) to determine PM in he filter and front half and halogen acid and halide in the back half and impingers.

34
34
Metals
Next is metals testing.

35
35
Multi-Metals Train• EPA Method 29• EPA Method 0060• Pros
– Wide range of metals– Touted as able to
differentiate PM-bound metals from vapor phase
• Cons– Complex recovery steps– Fragile– Non-specific for metal
oxidation state
5% HNO3/10% H2SO2 Empty 4% KMnO4/10% H2SO4 Silica Gel
EPA Method 29 or SW 846 Method 0060, which are essentially the same are isokinetic sampling methods used for the determination of a number of metals. There are two basic adaptations for this method – one for metals except mercury and the other for metals including mercury. The difference between the two methods is that if mercury is to be measured, two impingerseach containing 100 mls of a 4% potassium permanganate/10% sulfuric acid solution are included as the last two impingers in the train and these are recovered separately. All metal sample fractions are analyzed by inductively coupled argon plasma spectroscopy (ICP) via EPA Method 6010 or ICP/mass spectroscopy (ICP/MS) via EPA Method 6020. Method 6020generally has lower detection limits. Mercury sample are measured by graphite furnace atomic absorption spectroscopy (GFAA). Two hour sampling runs are typical for this method.

36
36
Hg SpeciationPros:
– Speciates mercury (Hg0
versus Hg2+)
Cons:– Complex– Fragile– Not promulgated
Ontario Hydro Method
While the sampling train depicted in this slide is not typically used for mercury determinations under Subpart EEE, the Ontario Hydro Method is a useful method in determining speciated mercury in stack emissions. Although this is not an approved EPA method, ASTM has issued it as ASTM D6784-02. This method can speciate particulate vs vapor phase mercury and also the valence state.

37
37
Organics
• Semivolatile compounds• “Specialty” compounds • Total hydrocarbons• Volatile compounds• Extremely volatile compounds
Discuss or show graphically how BP influences methodology of choice. There are several different categories of organics and therefore methods that are used to characterize organic emissions. The different classifications are generally based on the boiling points of each group. SVOCs are generally considered to have boiling points higher than 100 degrees C, VOCs have boiling points of generally between 25 and 100 degrees C and extremely volatile organic compounds have boiling points under 25 degrees C. These will be discussed on the next several slides

38
38
Semivolatile species• Generally, compounds
with boiling points between 100 and 300°C– Phenol, chlorophenols– Chlorobenzenes (above 2
Cls)– PAHs– PCBs– PCDD/PCDF0 °C
25
50
75
100
150
200
250
300 °C
Semi-Volatile
Semi-volatile compounds or SVOCs are organic compounds that, due to their boiling points can be present in both a solid and a vapor phase depending on the stack gas temperature. As a result, isokinetic sampling methods are typically chosen.

39
39
Method 0010 / 0023
• Also known as EPA Modified Method 5 (MM5)
• Pros– Extremely versatile– Integrated, time averaged
sample (low DL)• Cons
– Wide range of recovery values for various compounds
– Extraction solvent choice may limit use with lower boiling compounds
EPA Method 0010, 0023A and 23 are all isokinetic methods that are based on an EPA Method 5 train and then subsequently modified to capture the analyte(s) of interest. Three hour sampling runs or longer are used for these methods depending on expected levels in stack emissions.

40
40
Specialty Semivols
• PCDD/PCDFs• PCBs• PAHs
• Method 0010 / Method 0023
• Sample spiking, extraction, preparation, and/or analysis is varied to enhance ability to detect specific analytes
The methods referred to on the previous slide are used to sample for dioxins and furans, PCBs and PAHs in addition to a broad range of other SVOCs. In some cases, these trains can be used for combined analysis of these analyte groups so long as the necessary train preparation, pre-spiking and train recovery procedures are incorporated into the sampling program. As long as the necessary QA/QC criteria can be met for combining the analytes, the only major affect of combining analytes is to increase the detection limits of the results. Typically, this is only an issue in risk assessments where use of higher non-detects as inputs to the risk assessment may affect subsequent risk calculations.
41
41
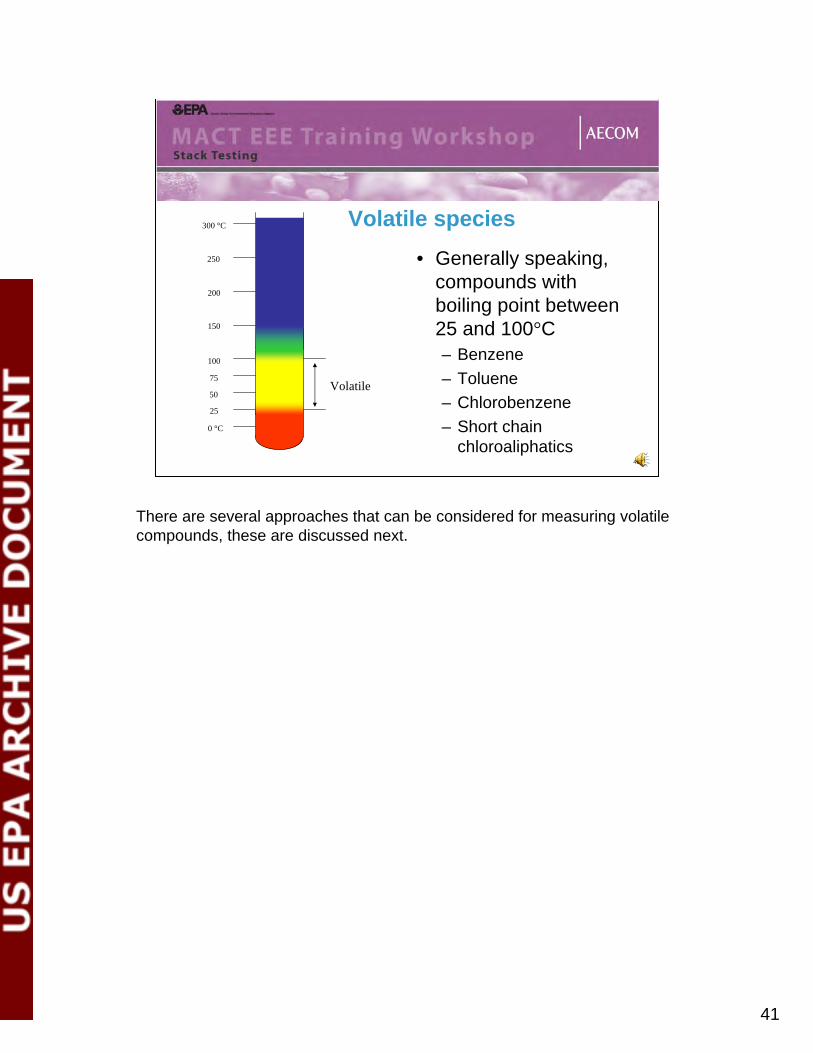
Volatile species• Generally speaking,
compounds with boiling point between 25 and 100°C– Benzene– Toluene– Chlorobenzene– Short chain
chloroaliphatics0 °C
25
50
75
100
150
200
250
300 °C
Volatile
There are several approaches that can be considered for measuring volatile compounds, these are discussed next.

42
42
Continuous Monitoring of Total Hydrocarbons
• Flame ionization detector
• Non-selective• ppm to percent levels• Modestly accurate;
varying impact of number of carbons in molecule
A number of different regulatory programs establish performance standards, emission rates or maximum stack emissions concentrations that are defined as “total VOCs”. In addition, Subpart EEE also sets a total hydrocarbon standard that must be met as part of meeting the DRE requirements. The EPA method that is used for this is typically EPA Method 25A and uses a continuous analyzer equipped with a flame ionization detector (FID). This is a non-selective technique that basically measures hydrocarbon content of the stack gas that is typically calibrated against a standard of either propane or methane. One disadvantage of this method is that it is non-specific, although this is not an issue for compliance under Subpart EEE. The other more significant disadvantage is that the method requires the sample be measured in a heated line with drying the sample and in high moisture samples, the FID produces steam as the sample burns and this can have a significant negative affect on instrument accuracy and reliability (i.e., results in increased downtime of the CEMs system).

43
43
On-line GC Methods
Computer Data Ac quis ition Sy stem
Purge and Trap Conc entrator Gas Chromatograph
Prec is ion Gas Blending Sys tem
Stac k
Valve Valve
H eated Pump
To Vent
Mas sFlow
Contro l lerVacuum
SwitchingValve
HeatedFi lter
Impingerfor Ac id
GasRemov al
HeatedLine
Probe
FID ECD
Pros•Near real time•Fairly sensitive
Cons•Not official method•Modestly complex•May lose water-soluble compounds
Another method that can be used is shown on this slide and is on-line gas chromatography (GC) or GC combined with Mass Spectrometry or GC/MS. On-line GC and GC/MS have yet to see broad application for CPTs under Subpart EEE, but they are used and can provide very useful near real-time analysis with good sensitivity, particularly with GC/MS. This is a non-isokinetic method that uses a heated line to bring the sample to the analyzer. Calibration standards are made up for each analyte and concentration range using QA/QC that generally follows EPA M 18, direct interface requirements. Test run length for this method can vary from one hour to longer runs.

44
44
On-Line GC
This slide shows and example of an older portable GC. Newer models are smaller and more compact.

45
45
Chromatography• Mixture is introduced onto a column
• Mobile phase (carrier) moves the mixture down the column
• Based on various factors (molecular size, polarity, solubility in column coating, etc.), components are held up on the column to varying degrees
• Components (hopefully) exit the column in discrete, resolved plugs that show up as peaks on the detector
The analytical methodology is the same as what is used for VOC analysis if the samples were to be shipped offsite.

46
46
GC detectors
• Non-selective detectors (TCD, FID, ECD)
• Mass Spectrometry• High Resolution MS
40 60 80 100 120 140 160 180 200 220 240 260 280 300 3200
10000
20000
30000
40000
50000
60000
70000
80000
90000
100000
110000
120000
130000
140000
150000
160000
170000
m/z-->
Abundance
Scan 2342 (26.617 min): S371800A.D (-)284
142
249107
71 214177
47 12088190155 235 330270
Hexachlorobenzene
There are several detectors that can be used and the GC can also be used with a MS or high resolution MS.

47
47
Volatile Organic Sampling Train (VOST) • EPA Method 0030
• Pros– Operates non-isokinetically– Some
concentration/integration of sample giving lower detection limit
• Cons– Breakthrough– Fragile nature of tubes– One-shot analysis– Upper QL
The most common VOC method used in CPTs is EPA Method 0030 which is called VOST. This is a non isokinetic sampling train where the stack gas sample is pulled through a series of condensers and glass tubes filled with a Tenax or Tenax and charcoal mix. Usually 3 to 4 pairs of tubes are collected per run and these are then sent off to the laboratory to either be analyzed for single or multiple analytes. Run lengths can vary from approximately 80 minutes to 2 hours depending on sampling rates.

48
48
Extremely volatile species • Generally speaking,
compounds with boiling point below ~25°C– Methane– Propane– Chloromethane– Vinyl chloride
0 °C
25
50
75
100
150
200
250
300 °C
Extremely Volatile
There are a number of organic analytes that have very low boiling points and may need to be during CPTs. Some examples are provided on this slide.

49
49
Bag or Canister Sampling• EPA Methods 0040, 18; CARB
Method 422• Pros
– Operates non-isokinetically– Decent dynamic range– Multiple analyses
• Cons– Short hold times– Transport issues– Roughly 2 ppm detection limit– May have trouble with very
polar compounds
The main sampling methods used for extremely volatile compounds are summarized on this slide and typically involve non isokinetic sampling using vacuum canisters or tedlar bags. These are collects and either analyzed onsite by GC or FID or sent to an offsite lab for GC analysis.

50
50
Continuous Emission Monitors
• CEMs use various detection methods to provide real time data on conditioned gas streams
• Analytes are typically in ppm to percent levels
– O2– CO2– CO– SO2– NOX– HCl
• Typically calibrated over concentration range; response is usually linear
Now, turning to other instrumental analysis methods, there are a number of different instruments available to measure fixed gases, criteria air pollutants and some HAPs. These methods can involve either permanently installed units that continuously sample the source they are installed on or they can be portable systems, typically installed in wheeled trailers that are towed from project to project. Permanently installed systems are typically operated under a CEMs specific QA/QC Plan that must conform with the applicable EPA Performance Specification found in 40 CFR 60 Appendix B. Portable units, including those that are used to evaluate the performance during annual performance tests called “RATA’s” are operated in conformance with specific EPA Reference Methods found in 40 CFR 60 Appendix A.

51
51
Some Miscellaneous Methods
There are some additional methods that are worth covering and these are summarized next.

52
52
Metals CEMs
• Laser Induced Breakdown Spectroscopy –Atomic Emission Spectroscopy (LIBS)
• Inductively Coupled Argon Plasma Atomic Emissions Spectroscopy – AES (ICP-AES)
• Extractive X-Ray Fluorescence
One are that has been of interest is the development of a CEMs for the continuous measurement metals in HWC emissions. Several different analyzer types have been incorporated into CEMs systems. A key issue that metals CEMs systems have to overcome, however, is collecting a representative sample of the stack gas, due in large part to the fact that metals are present as both particulate and as a vapor, making extractive sampling systems a challenge.

53
53
Size Fractionation• “Size does matter”• Fine PM constitutes the range of respirability,
influencing potential risk• Metals and or heavy organics may tend to
condense preferentially on certain size ranges
• Very fine PM may escape capture by control devices
• Dispersion modeling considerations
Another area of measurement that is of interest for HWCs is that of understanding the particle size distribution of PM emissions from HWCs. This is of importance in design aspects for selecting appropriate control technologies. In addition, HWC risk assessment results are influenced by what values are selected for PM size ranges from a transport and dispersion perspective.

54
54
Cyclones
This slide shows a picture of cyclones and PM10 sampling heads used to measure fine PM??? Is this correct

55
55
Impactors
This slide depicts a cascade impactor sampling system that is designed for direct measurement of particle size. Each of the circular plates has different size holes in it allowing particles smaller to pass through to the next plate, until they are distributed by size on all plates. These are directly weighed. The disadvantage for use in measuring PM from HWCs is that the Cascade impactor does not work well when the total PM catch is in the small milligram weights. Another primary alternative is often used employing a Method 5 PM train fitted with a polycarbonate filter instead of a glass fiber (the polycarbonate filter traps PM on its surface, whereas, the glass fiber allows PM to penetrate into the fiber, making it difficult to see). Selective electron microscopy is then used to count the fraction of different PM size ranges. A difficult issue remains no matter what technique is employed where the PM is predominantly water soluble salts as these will deposit on whatever collection surface is used and the moisture present will cause the initial PM to agglomerate, thus forming particles that can be different from the original PM.

56
56
The Chemistry of Quantitation
Now, switching to another topic of stack testing, the next several slides will deal with issues surrounding non-detect results.

57
57
Detection Limits• Use of detection limits vary• In some cases, a zero can be used for
non-detects• When using MTEC to document
compliance, must use full detection limit• For risk assessments, non-detects are
often used at ½ detection limits– This can be a problem in some cases
The use of detection limits in data reporting can vary in several different situations that involve HWCs. For example for reporting dioxin and furan results under Subpart EEE, non-detects are allowed to be reported as zero. However, if an HWC is using MTEC to establish compliance, any non-detects must be used at their full detection limit in performing the calculation. And finally, when conducting risk assessments for HWCs, non-detects must be reported at ½ the detection limit, which depending on the analytical method and the sample matrix being analyzed, may be itself result in risk calculations being at concern levels.

58
58
Detection LimitsBottom line minimum number of atoms or molecules
that instrumentation can accurately measure…
Dilution or concentration steps involved in analytical process…
Efficiency of removal from sampling medium (recovery)…
Sampling time, rate, volume
Detection limits used in CPT tests are generally based on establishing first a “Method Detection Limit” or MDL for each analyte in accordance with accepted protocols found in each applicable SW-846 analytical method. A MDL is a statistically derived limit that is determined by replicate analysis of 7 to 10 matrix specific samples of each analyte. Labs generally perform these MDL studies on an annual basis. Using the raw data, an MDL is derived by applying a statistical analysis, such as student’s T test and multiplying the mean of the data by a standard deviation. This results in MDLs being typically several times the raw data results. Beyond that, labs also typically apply an additional factor in developing the final “Reporting Limit” or RL, that is often used as the non-detect value in CPT analyses. These limits can also be affected by whether or not samples had to be diluted to enable measurement within the dynamic range of an instrument and also by actual spiked recovery results.

59
59
Recovery
The process by which the analytes are removed from the sampling medium:
e.g.,•Solvent extraction•Thermal desorption•Acid digestion
Often spikes are used to evaluate the success of the recovery process.
Analyte recovery can be an important aspect of understanding the final results from different types of sampling. Both field and lab recovery studies are routine components of inorganic and metals analysis procedures that quantify how well the sampling, analytical preparation and actual analyses performs in accurately quantifying the analyte of interest.

60
60
SeparationMost organic analysis methods require that the “soup” of compounds recovered from the sampling medium be separated into individual components prior to analysis.
This is often not the case for inorganic analyses where various atomic emission spectroscopic methods are used in quantifying analytes.
Another aspect of analytical quantification is how samples are processed in order to determine the amount of each compound that is actually present in the sample. Organic analysis requires that individual compounds be separated (i.e., by a GC column for example) prior to being able to quantitatethem. In contrast, inorganic analyses techniques do not require this physical separation as the technology used in analysis can different individual species without needing to do that.

61
61
InterferencesWhen one component of the sampled flue gas actively changes or effects the measurement of the component of interest
High HCl or HF levels in flue gas can attack the sample collection material, destroying its integrity; or conversely actually destroy the analytes on the material
Example:
Another issue that can affect analytical results are different types of interferences. These can be caused by compounds other than the analyte of interest that have similar analytical response in the instrument and therefore mask the true value of what is actually being analyzed for. An example of this in organic analysis can occur when two different compounds “elute” out on the GC column at the same point and make individual identification of each organic difficult or impossible. Another example of interference can occur where something in the sample actually breaks down the analyte of interest, causing results to be biased low.

62
62
Matrix Effects
When the medium you sample affects how well you can recover specific analytes in the medium
Carbon in flyash can influence how well PCDD/PCDF can be recovered from the flyash
itself
Example:
And one final aspect of analytical quantification that should be understood whether or not the “matrix” being analyzed – i.e., an organic waste, or a stack gas sample, has some characteristics that affects the analytical method’s ability to produce representative results. One example of this is in performing ion chromatography analysis for chlorides in a waste feed sample. If the waste is high in organic content, the result may not truly reflect total chloride content in the overall sample, this may in fact actually damage the IC column used in the analysis. In this case, the sample must be “bombed”, or combusted in a bomb calorimeter first to convert the organics to CO2 and water and then the sample is injected into the IC column. Another example of matrix affects in an HWC situation is if the stack gas PM is high in carbon content, this can bind up dioxin and furan molecules to a degree that can bias results low.

63
63
Summary• Cooperation among stakeholders essential• Upfront planning is essential• Regulatory considerations• Sampling & analysis
– Organics-VOCs, SVOCs, specialty– Inorganics-Metals, PM– CEM-NOx, SO2, CO, O2
In summary, successful stack test projects involve making sure all necessary stakeholder are involved, they require typically several months of upfront planning one a test plan is agreed to and all details of the sampling and analysis methods must be fully understood prior to setting foot on site for testing.