Embed Size (px)
Citation preview
C51BR Applications of SpreadsheetsC51BR Applications of Spreadsheets 11
Chapter 16Chapter 16
Getting Started Making ChartsGetting Started Making Charts
C51BR Applications of Spreadsheets 2
Creating an Embedded ChartCreating an Embedded Chart
► After you create a worksheet, you may want to After you create a worksheet, you may want to show the information to someone else. show the information to someone else. print the worksheet if you need only numerical detail. print the worksheet if you need only numerical detail. transform information in the worksheet into a charttransform information in the worksheet into a chart a graphical representation of data that makes it easy a graphical representation of data that makes it easy
for users to see trends and make comparisonsfor users to see trends and make comparisons
► An An embedded chartembedded chart is a graphical representation is a graphical representation of data created within the worksheet instead of of data created within the worksheet instead of as a separate worksheet.as a separate worksheet.
Identifying Common Chart Identifying Common Chart Types and FeaturesTypes and Features
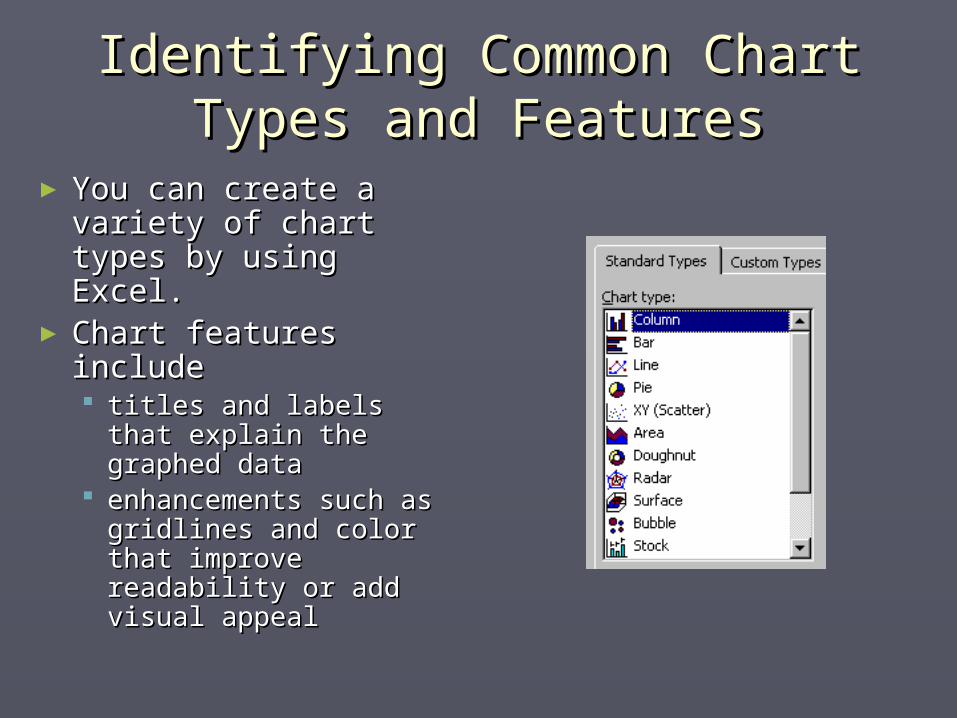
► You can create a You can create a variety of chart types variety of chart types by using Excel.by using Excel.
► Chart features include Chart features include titles and labels that titles and labels that
explain the graphed explain the graphed datadata
enhancements such as enhancements such as gridlines and color that gridlines and color that improve readability or improve readability or add visual appealadd visual appeal
Identifying Common Chart Identifying Common Chart Types and FeaturesTypes and Features
►Pie chart:Pie chart: a circular chart in which a circular chart in which each piece (wedge) shows a data each piece (wedge) shows a data segment and its relationship to the segment and its relationship to the wholewhole A pie chart is limited to one data series – a A pie chart is limited to one data series – a
set of related values that are entered in a set of related values that are entered in a row or column of the worksheet.row or column of the worksheet.
Identifying Common Chart Identifying Common Chart Types and FeaturesTypes and Features
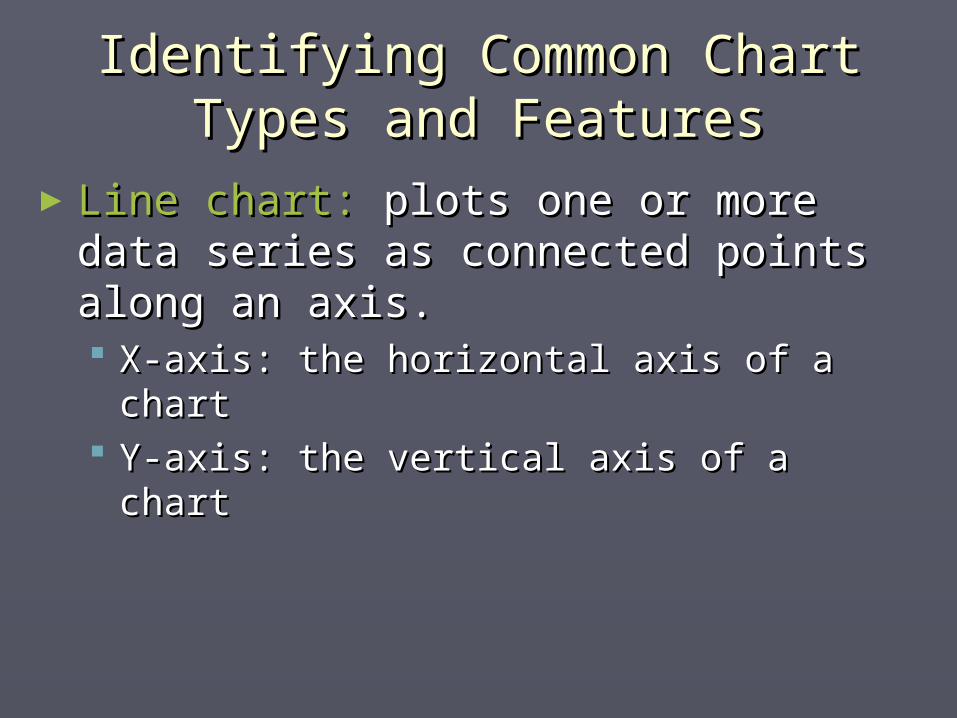
►Line chart:Line chart: plots one or more data plots one or more data series as connected points along an series as connected points along an axis.axis. X-axis: the horizontal axis of a chartX-axis: the horizontal axis of a chart Y-axis: the vertical axis of a chartY-axis: the vertical axis of a chart
Identifying Common Chart Identifying Common Chart Types and FeaturesTypes and Features
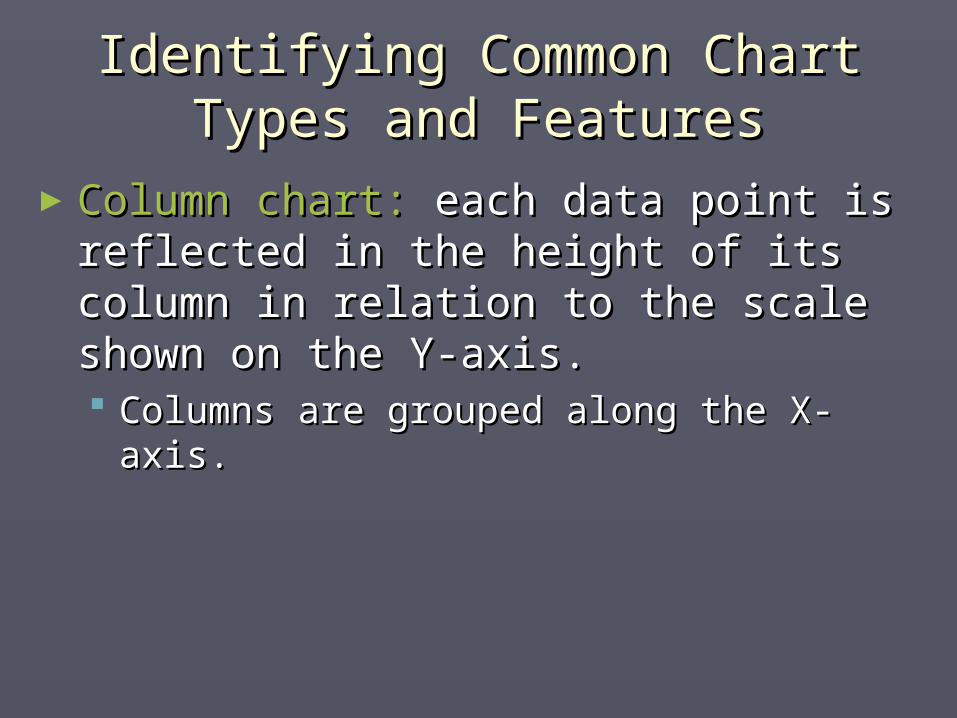
►Column chart:Column chart: each data point is each data point is reflected in the height of its column in reflected in the height of its column in relation to the scale shown on the Y-relation to the scale shown on the Y-axis.axis. Columns are grouped along the X-axis.Columns are grouped along the X-axis.
Printing a ChartPrinting a Chart
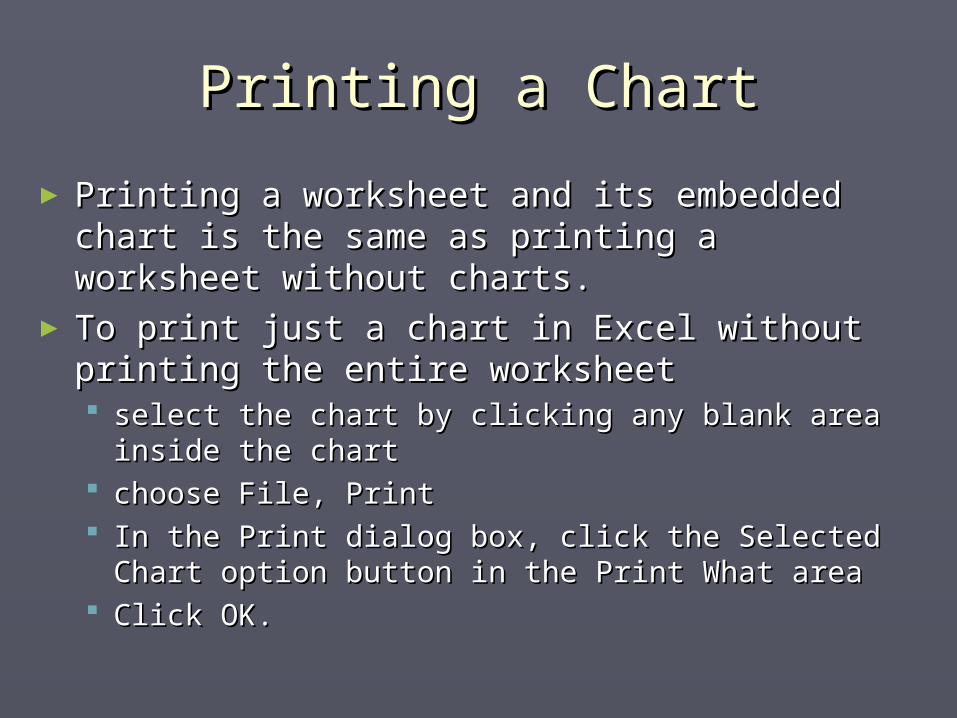
► Printing a worksheet and its embedded chart Printing a worksheet and its embedded chart is the same as printing a worksheet without is the same as printing a worksheet without charts.charts.
► To print just a chart in Excel without printing To print just a chart in Excel without printing the entire worksheetthe entire worksheet select the chart by clicking any blank area inside select the chart by clicking any blank area inside
the chart the chart choose File, Printchoose File, Print In the Print dialog box, click the Selected Chart In the Print dialog box, click the Selected Chart
option button in the Print What areaoption button in the Print What area Click OK.Click OK.
Using Chart Wizard to Create an Using Chart Wizard to Create an Embedded Pie ChartEmbedded Pie Chart
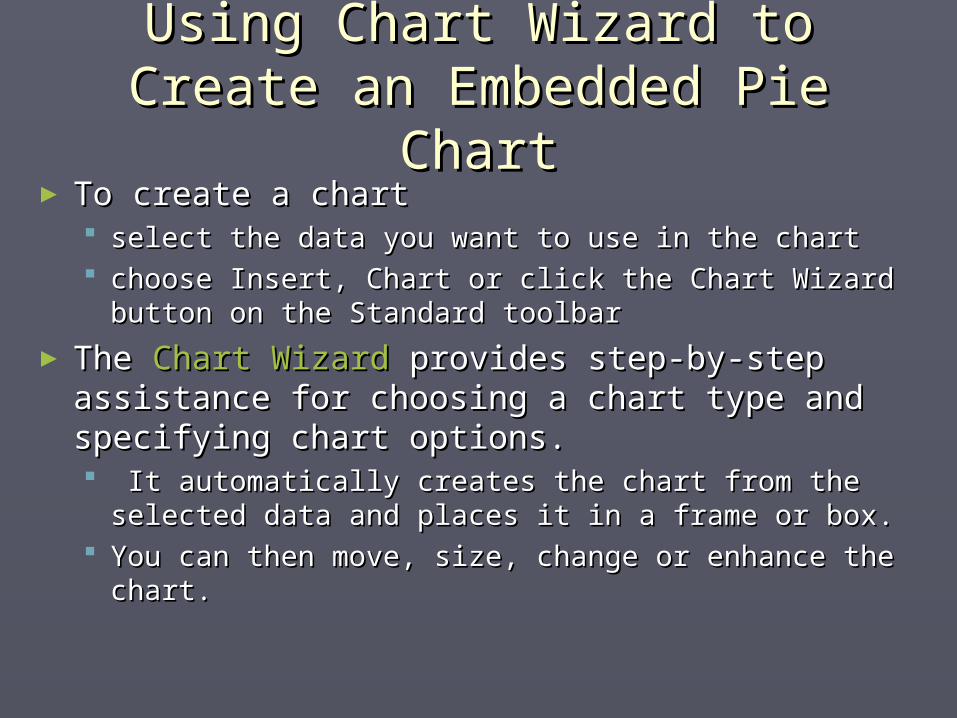
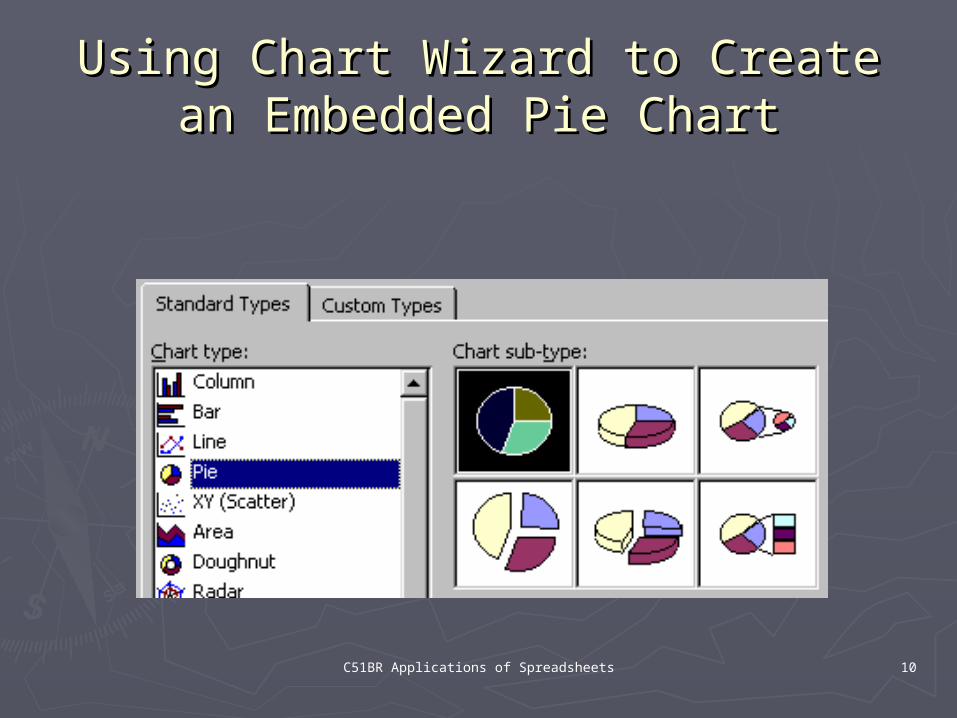
► To create a chartTo create a chart select the data you want to use in the chartselect the data you want to use in the chart choose Insert, Chart or click the Chart Wizard choose Insert, Chart or click the Chart Wizard
button on the Standard toolbarbutton on the Standard toolbar
► The The Chart WizardChart Wizard provides step-by-step provides step-by-step assistance for choosing a chart type and assistance for choosing a chart type and specifying chart options.specifying chart options. It automatically creates the chart from the It automatically creates the chart from the
selected data and places it in a frame or box. selected data and places it in a frame or box. You can then move, size, change or enhance the You can then move, size, change or enhance the
chart.chart.
Using the Chart WizardUsing the Chart Wizard
►Chart Wizard does a satisfactory job of Chart Wizard does a satisfactory job of creating a chart, butcreating a chart, but Use Excel’s customizing and formatting Use Excel’s customizing and formatting
options for more demanding jobsoptions for more demanding jobs update a chart by adding and deleting update a chart by adding and deleting
data series in its plot areadata series in its plot area
C51BR Applications of Spreadsheets 10
Using Chart Wizard to Create an Using Chart Wizard to Create an Embedded Pie ChartEmbedded Pie Chart
Deleting and Resizing a ChartDeleting and Resizing a Chart
►To move and resize a chart, use the sizing To move and resize a chart, use the sizing handles at the corners and midpoints of handles at the corners and midpoints of the border surrounding the box.the border surrounding the box. Drag a handle on the middle of one side of Drag a handle on the middle of one side of
the box to change the size horizontally or the box to change the size horizontally or verticallyvertically
Drag a corner handle to change the vertical Drag a corner handle to change the vertical and horizontal dimensions at the same time.and horizontal dimensions at the same time.
If you hold down the shift key while dragging If you hold down the shift key while dragging a corner handle, you can maintain the original a corner handle, you can maintain the original proportions of the chart.proportions of the chart.
Comparing Clustered and Comparing Clustered and Stacked Column ChartsStacked Column Charts
► A A clustered column chartclustered column chart subtype presents subtype presents multiple data series as side-by-side columns multiple data series as side-by-side columns (figure 6.11 in your book)(figure 6.11 in your book)
► If you select a If you select a stacked columnstacked column as the chart’s as the chart’s subtype, multiple data series appear as subtype, multiple data series appear as stacked components of a single column stacked components of a single column instead of side-by-side columns.instead of side-by-side columns. Use if multiple data series total a meaningful Use if multiple data series total a meaningful
numbernumber► i.e. showing the contribution of each revenue source to i.e. showing the contribution of each revenue source to
the total revenue.the total revenue.
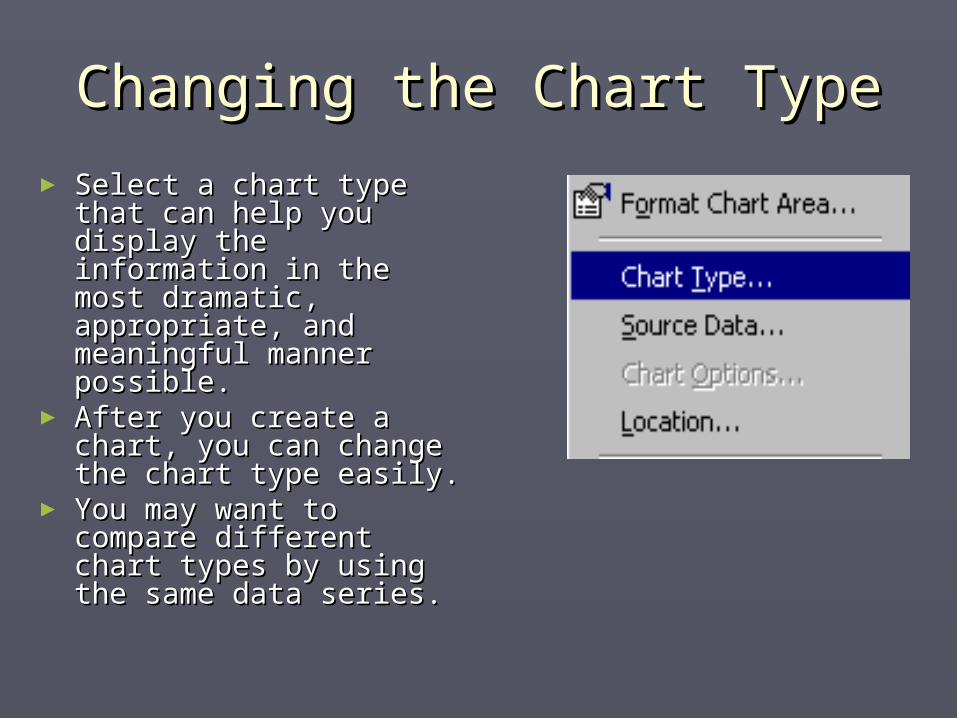
Changing the Chart TypeChanging the Chart Type
► Select a chart type that Select a chart type that can help you display can help you display the information in the the information in the most dramatic, most dramatic, appropriate, and appropriate, and meaningful manner meaningful manner possible.possible.
► After you create a After you create a chart, you can change chart, you can change the chart type easily. the chart type easily.
► You may want to You may want to compare different chart compare different chart types by using the types by using the same data series.same data series.
Choosing an Appropriate Chart Choosing an Appropriate Chart TypeType
►You need to know which chart types to You need to know which chart types to select, given the nature of the data.select, given the nature of the data. To learn more about the purpose of one or To learn more about the purpose of one or
more chart typesmore chart types►display the Office Assistantdisplay the Office Assistant►search the phrase chart typessearch the phrase chart types►select the topic Examples of chart typesselect the topic Examples of chart types
Provides an illustration and description of Provides an illustration and description of the standard chart types.the standard chart types.
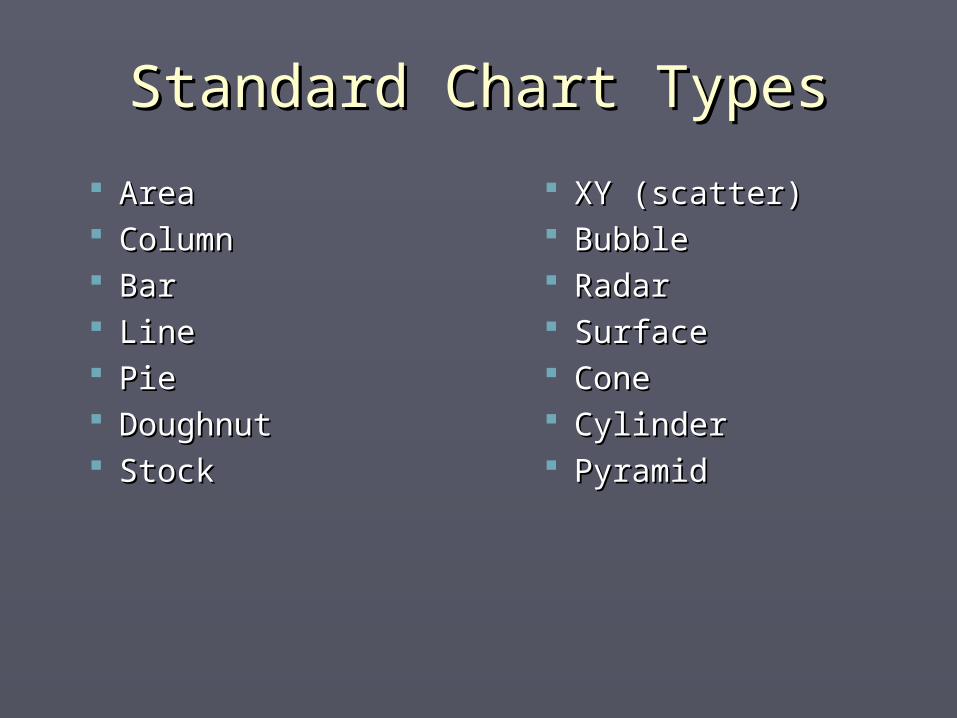
Standard Chart TypesStandard Chart Types
AreaArea ColumnColumn BarBar LineLine PiePie DoughnutDoughnut StockStock
XY (scatter)XY (scatter) BubbleBubble RadarRadar SurfaceSurface ConeCone CylinderCylinder PyramidPyramid
Other Ways to Change Chart Other Ways to Change Chart TypesTypes
►You can display the Chart Type dialog You can display the Chart Type dialog box after you select the chart you box after you select the chart you want to change bywant to change by Choose Chart, Chart TypeChoose Chart, Chart Type Click the Chart Wizard buttonClick the Chart Wizard button
Other Ways to Change Chart Other Ways to Change Chart TypesTypes
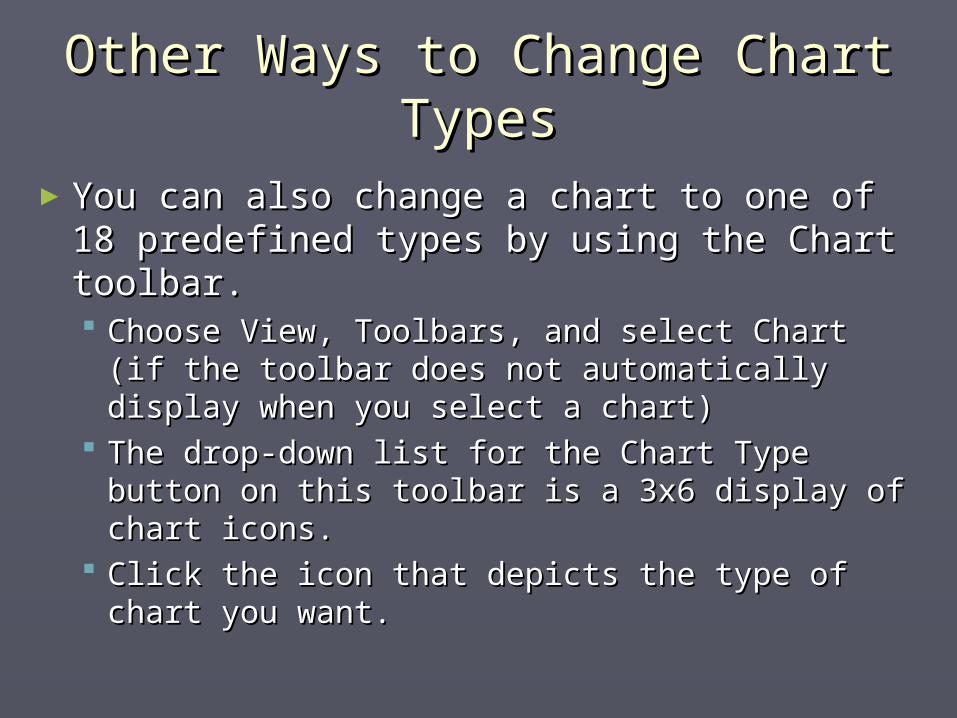
►You can also change a chart to one of 18 You can also change a chart to one of 18 predefined types by using the Chart predefined types by using the Chart toolbar.toolbar. Choose View, Toolbars, and select Chart (if Choose View, Toolbars, and select Chart (if
the toolbar does not automatically display the toolbar does not automatically display when you select a chart)when you select a chart)
The drop-down list for the Chart Type button The drop-down list for the Chart Type button on this toolbar is a 3x6 display of chart icons.on this toolbar is a 3x6 display of chart icons.
Click the icon that depicts the type of chart Click the icon that depicts the type of chart you want.you want.
Charting Nonadjacent Data Charting Nonadjacent Data SeriesSeries
►You can select nonadjacent sets of You can select nonadjacent sets of numbers to be charted by holding numbers to be charted by holding down ‘Ctrl’ while dragging over down ‘Ctrl’ while dragging over numbers in the various areas of the numbers in the various areas of the worksheet. worksheet.
►Make sure that the sets of numbers Make sure that the sets of numbers selected represent the same data selected represent the same data series.series.
Modifying Chart FormatsModifying Chart Formats
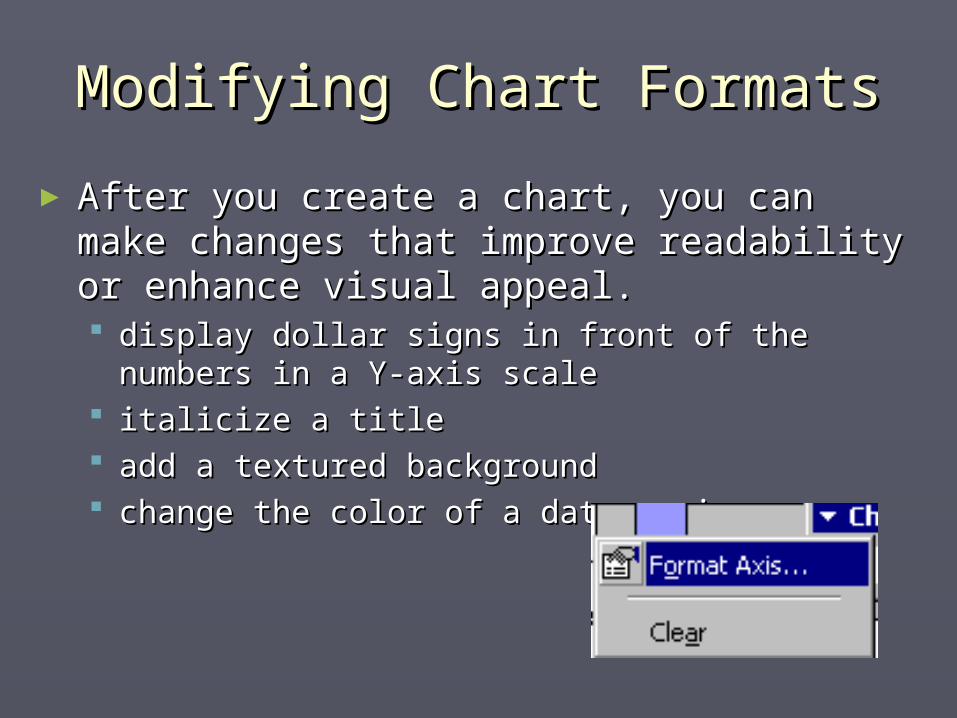
► After you create a chart, you can make After you create a chart, you can make changes that improve readability or changes that improve readability or enhance visual appeal. enhance visual appeal. display dollar signs in front of the numbers in a display dollar signs in front of the numbers in a
Y-axis scaleY-axis scale italicize a titleitalicize a title add a textured backgroundadd a textured background change the color of a data serieschange the color of a data series
Changing Other Chart Changing Other Chart ElementsElements
► Practice making changes to four areas in a Practice making changes to four areas in a chart:chart: Y-axisY-axis the chart titlethe chart title the chart backgroundthe chart background a data seriesa data series
► Start the change process by positioning the Start the change process by positioning the pointer on the area and right-clicking. pointer on the area and right-clicking.
► Right-clicking on a chart area displays a Right-clicking on a chart area displays a context-sensitive shortcut menu that enables context-sensitive shortcut menu that enables you to clear or modify the selected area.you to clear or modify the selected area.
Alternatives to Shortcut Alternatives to Shortcut MenusMenus
►Other ways to access chart dialog Other ways to access chart dialog boxes and modify settings:boxes and modify settings: Double-clicking a chart area bypasses the Double-clicking a chart area bypasses the
Clear option and opens the dialog box for Clear option and opens the dialog box for formatting that area.formatting that area.
You can also access Chart options from You can also access Chart options from the menu bar after you select the entire the menu bar after you select the entire chart.chart.
Ways to View a ChartWays to View a Chart
► If you scroll through the worksheet to view a If you scroll through the worksheet to view a chart, you can view the cart in its own window:chart, you can view the cart in its own window: Select the chartSelect the chart Choose View, Chart WindowChoose View, Chart Window You can edit the chart while it is open in the You can edit the chart while it is open in the
window.window.► If you select a chart and then click the Print If you select a chart and then click the Print
Preview button, Excel displays only the chart Preview button, Excel displays only the chart instead of the worksheet data and the chart.instead of the worksheet data and the chart.
► You can view but not change a chart displayed You can view but not change a chart displayed in Print Preview mode.in Print Preview mode.
Adding, Reordering and Deleting Adding, Reordering and Deleting a Data Seriesa Data Series
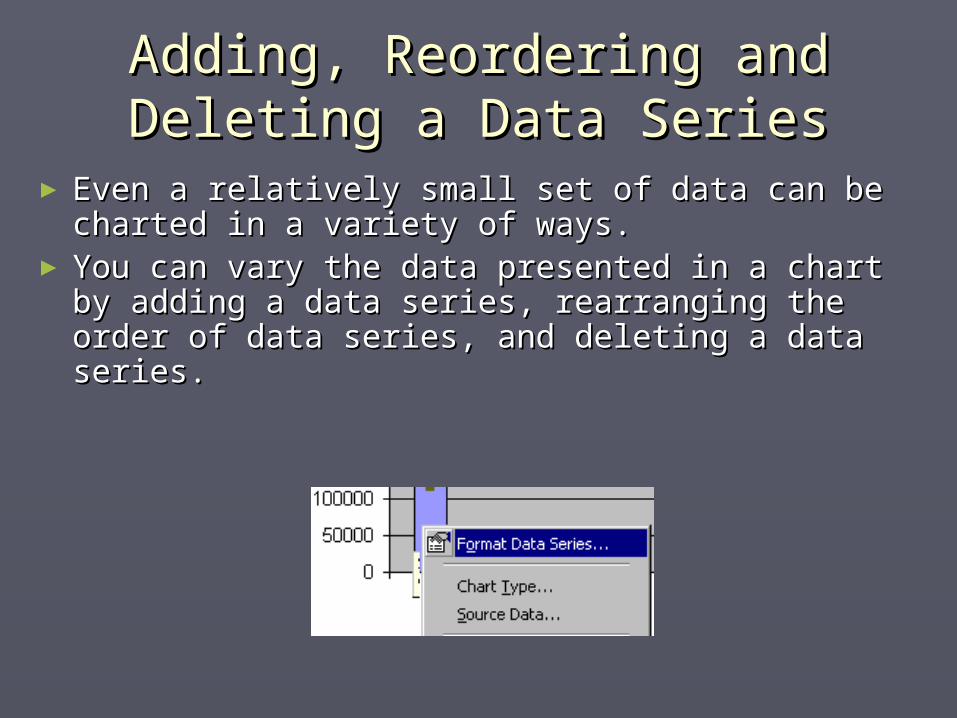
► Even a relatively small set of data can be Even a relatively small set of data can be charted in a variety of ways. charted in a variety of ways.
► You can vary the data presented in a chart by You can vary the data presented in a chart by adding a data series, rearranging the order of adding a data series, rearranging the order of data series, and deleting a data series.data series, and deleting a data series.
Alternative Ways to Add or Alternative Ways to Add or Delete Data SeriesDelete Data Series
►The simplest methods to add and The simplest methods to add and delete data series from an existing delete data series from an existing chart:chart: Add by dragging a selected series and Add by dragging a selected series and
dropping it into the chartdropping it into the chart Remove by selecting the charted data Remove by selecting the charted data
series and pressing the Delete key.series and pressing the Delete key.
Alternative Ways to Add or Alternative Ways to Add or Delete Data SeriesDelete Data Series
►You can also add or delete data series You can also add or delete data series from the Series tab of the Source Data from the Series tab of the Source Data dialog box.dialog box. Select the chartSelect the chart Choose Chart, Source Data and select the Choose Chart, Source Data and select the
Series tabSeries tab To add a data series, click the Add button To add a data series, click the Add button
and specify the location of the series.and specify the location of the series. To delete a data series, select its name in To delete a data series, select its name in
the Series list and click the Remove button.the Series list and click the Remove button.
Creating and Printing a Creating and Printing a Combination ChartCombination Chart
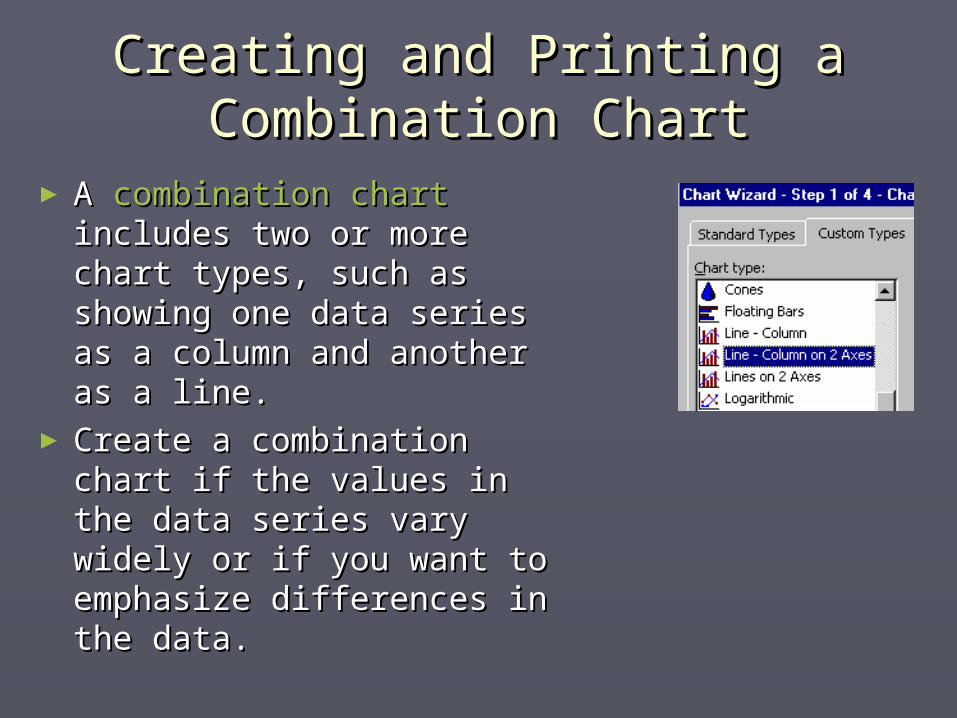
► A A combination chartcombination chart includes two or more includes two or more chart types, such as chart types, such as showing one data series showing one data series as a column and another as a column and another as a line. as a line.
► Create a combination Create a combination chart if the values in the chart if the values in the data series vary widely or data series vary widely or if you want to emphasize if you want to emphasize differences in the data.differences in the data.
Customizing ChartsCustomizing Charts
►Can add titles, legends and Can add titles, legends and annotationsannotations
►Can use arrows and AutoShapes to Can use arrows and AutoShapes to emphasize certain aspects of the emphasize certain aspects of the chart. chart.
►Formatting a chart = setting the Formatting a chart = setting the display options for each chart element. display options for each chart element.
Customizing ChartsCustomizing Charts
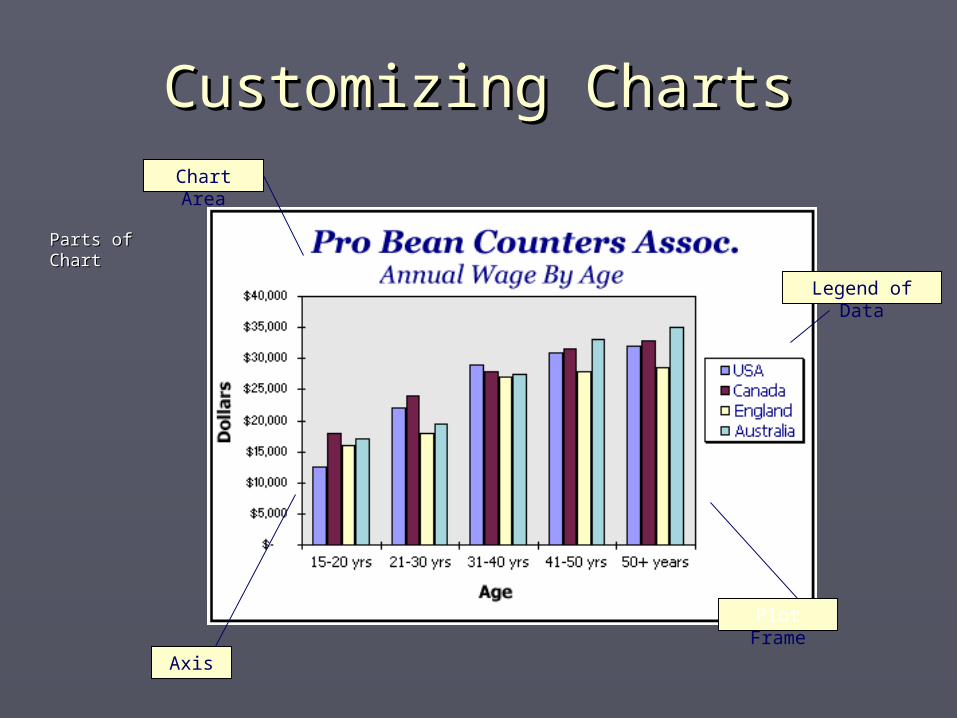
Parts of Parts of ChartChart
Chart Area
Plot Frame
Legend of Data
Axis
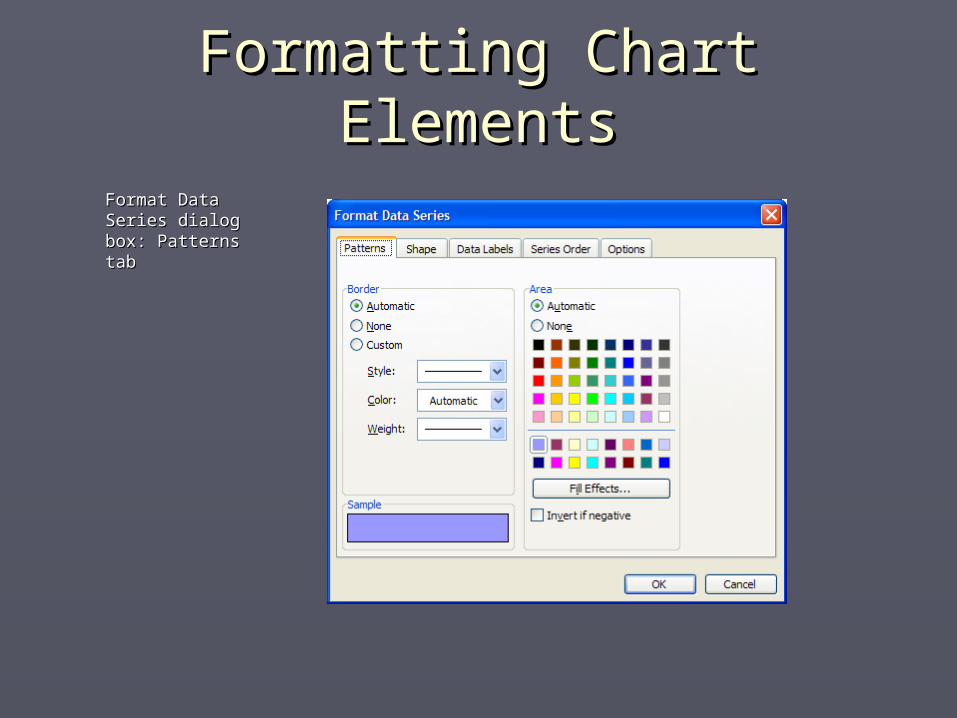
Formatting Chart ElementsFormatting Chart Elements
Format Data Format Data Series dialog Series dialog box: Patterns box: Patterns tabtab
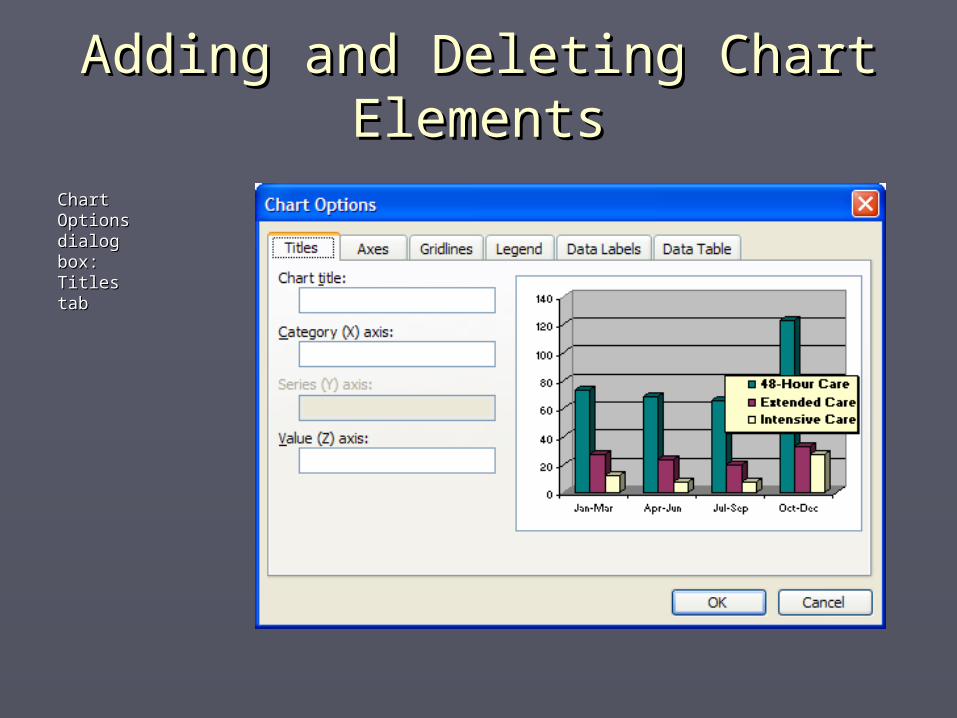
Adding and Deleting Chart Adding and Deleting Chart ElementsElements
Chart Chart Options Options dialog box: dialog box: Titles tabTitles tab
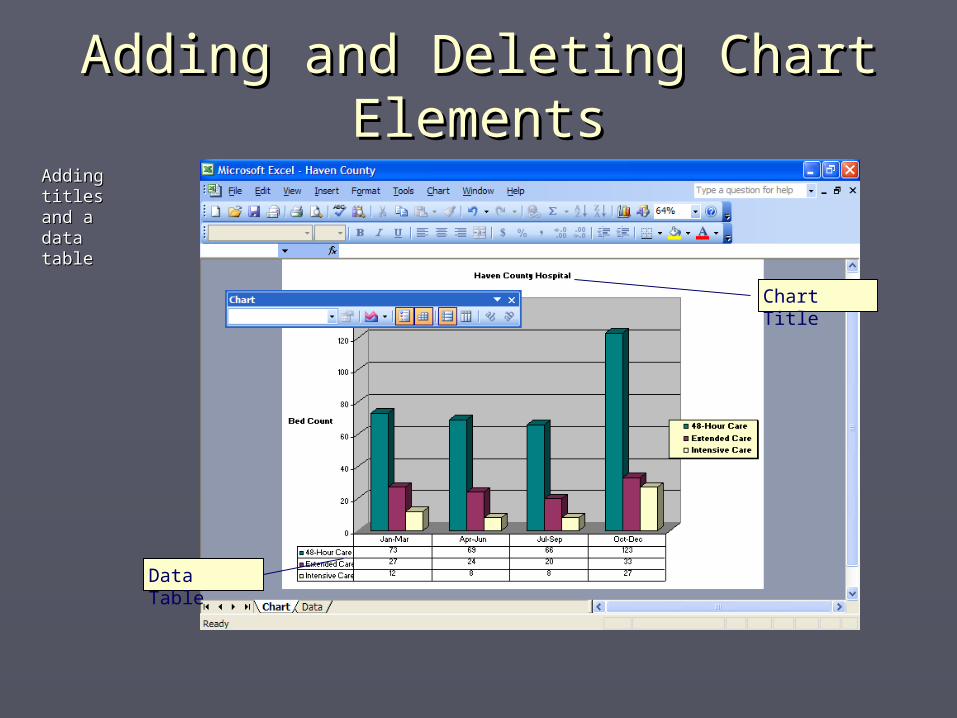
Adding and Deleting Chart Adding and Deleting Chart ElementsElements
Adding Adding titles and a titles and a data tabledata table
Chart Title
Data Table
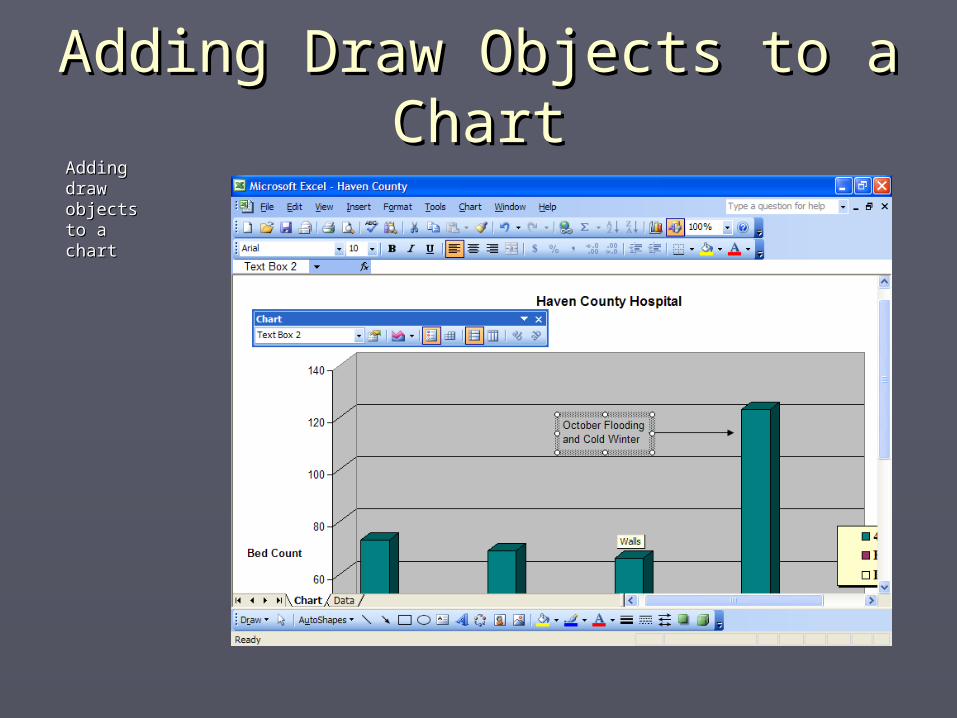
Adding Draw Objects to a Adding Draw Objects to a ChartChart
Adding Adding draw draw objects to objects to a charta chart
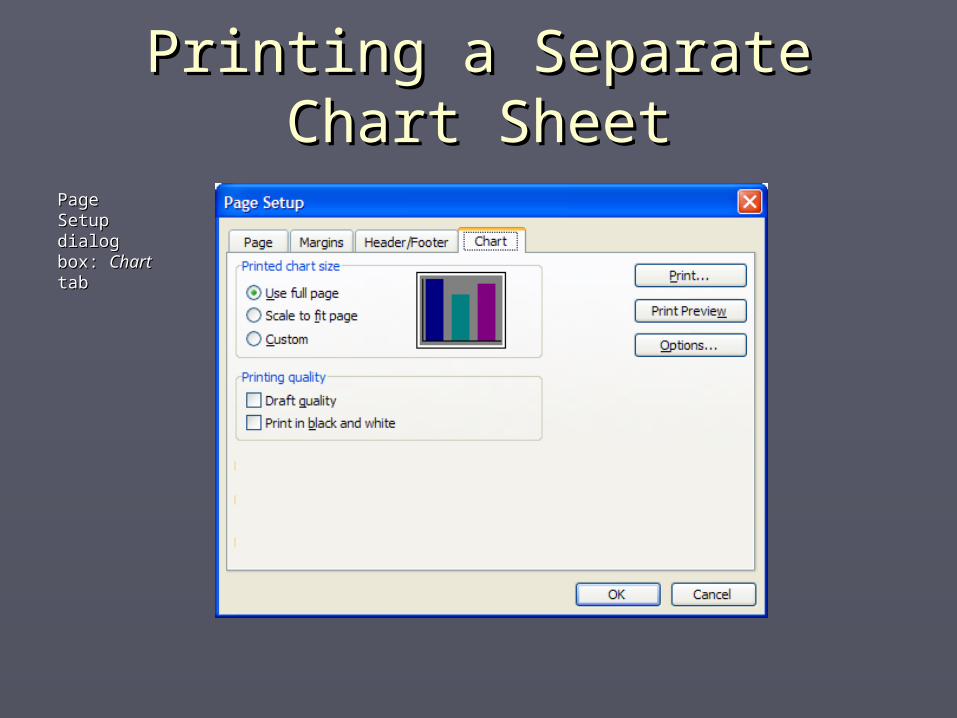
Printing a Separate Chart Printing a Separate Chart SheetSheet
Page Setup Page Setup dialog box: dialog box: ChartChart tab tab
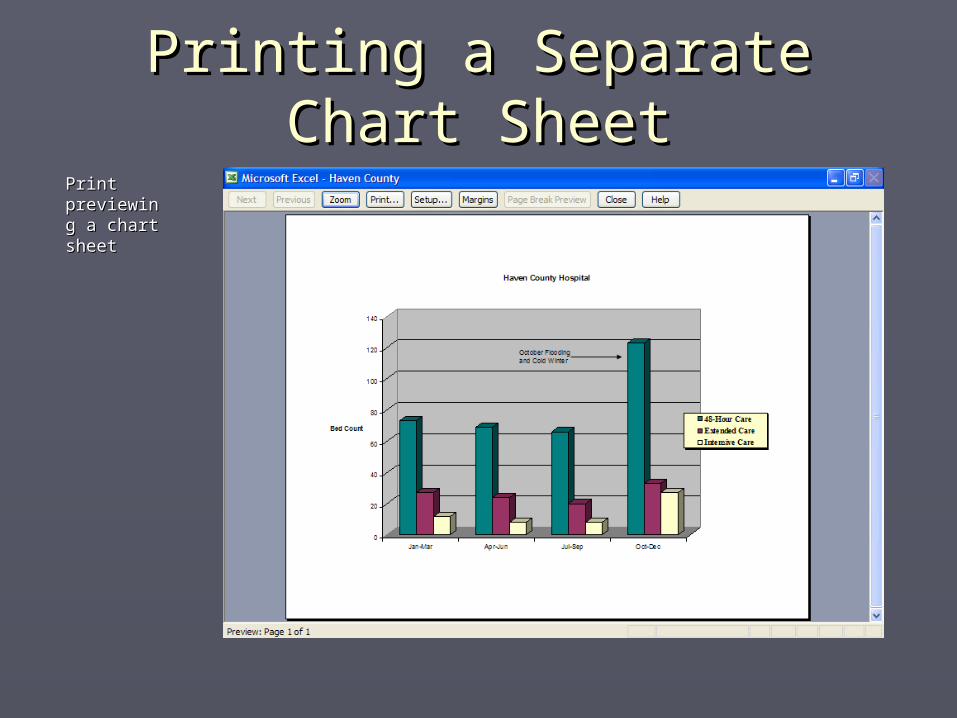
Printing a Separate Chart Printing a Separate Chart SheetSheet
Print Print previewing previewing a chart a chart sheetsheet