Embed Size (px)
Citation preview

NASA SP-3092
ARVIDSON and BRENNAN
C48CL La COP,,
L. S. \.
https://ntrs.nasa.gov/search.jsp?R=19750019998 2018-07-15T04:22:58+00:00Z

NASA SP-3092
By John Ni Arvidson and James A. Brennan
Cryogenics Division, Institute for Basic Standards National Bureau of Standards, Boulder, Colorado
Prepared for the Aerospace Safety Research and Data Institute
NASA Lewis Research Center
AND
Scientific and Technical Information Office 1975 NATIONAL AERONAUTICS AND SPACE ADMINISTRATION
Washington, D.C.
PREFACE
This publication is part of an oxygen safety review in prog-ress by the NASA Aerospace Safety Research and Data Institute (ASRDI). The objectives of the review include:
1. Recommendations to improve NASA oxygen handling practices by comparing NASA and contractor oxygen systems includinq the design, inspection, operation, maintenance, and emer-gency procedures.
2. Assessment of the vulnerability to failure of oxygen equipment from a variety of sources so that hazards may be defined and remedial measures formulated.
3. Contributions to safe oxygen handling techniques through research.
4. Formulation of criteria and standards on all aspects of oxygen handling, storage, and disposal.
The special publication summarizes the current state-of-the-art in pressure measurement in the region of 50 to 150 K (the liquid state of oxygen). The report is not limited to oxygen-proved systems alone as this would have severely limited the re-port. The published literature available in the cryogenic region generally is quite restricted. The survey includes information on cleaning and materials compatibility, calibration methods and descriptions of representative transducers. A summary of rec-ommendations is presented as well as an extensive bibliography arranged by transducer type.
This work was initiated by Frank E. Belles, former Director of ASRDI.
Soloman Weiss, Acting Director Aerospace Safety Research and Data Institute National Aeronautics and Space Administration
lii

Page intentionally left blank
Page intentionally left blank
'V

FOREWORD
It is hoped that this report will provide an up-to-date viewpoint of pressure transducers and their current uses with gaseous or liquid oxygen. Very little data are available in the literature on pressure transducers with respect to gaseous and liquid oxygen. Therefore, all transducer types such as strain gage, capacitance, potentiometric, piezoelectric, etc., are in-cluded in this survey.
Some of the topics covered include cryogenic pressure meas-urement, material compatibility with gaseous and liquid oxygen, cleaning procedures, pressure tap connections, transducer types and description, and calibration techniques.
Since much is known about a relatively few pressure trans-ducer types (relating to gaseous and liquid oxygen service), rec-ommendations by the authors were made when other information was unavailable. Where possible, range, performance, and endurance comparisons have been made between transducer types.
We wish to thank Michael C. Jones of the NBS Cryogenics Division and ASRDI Project Manager Paul Ordin of the NASA-Lewis Research Center for their review and constructive comments during the course of thisproject. Harlan S. Harman, Chief of the Pres-sure and Thrust Section at George C. Marshall Space Flight Center, also provided several unpublished NASA reports on pressure trans-ducer performance and for these we wish to thank him. Finally, we are indebted to Shirley A. Alldredge and staff of the NBS Boulder Library for their help in acquiring the numerous refer-ences, without which this report could not have been written.
John M. Arvidson
James A. Brennan
V

Page intentionally left blank
Page intentionally left blank
Vi

CONTENTS
1. INTRODUCTION ......................... 1
2. CRYOGENIC PRESSURE MEASUREMENT ................ 12
3. MATERIAL COMPATIBILITY WITH GASEOUS AND LIQUID OXYGEN • • 22
4. TRANSDUCER CLEANING PROCEDURES ................ 24
5. PRESSURE TAP CONNECTIONS ................... 27
6. TRANSDUCER TYPES AND DESCRIPTION ............... 33
Force-summing elements
6.1 Manometer ........................ 33
6.2 Bourdon Tube ...................... 41
6.3 Diaphragm ........................ 51
6.4 Bellows ........................ 57
Pressure transducers with force-summing element
6.5 Strain .......................... 65
6.6 Capacitance ...................... 74
6.7 Piezoelectric ..................... 81
6.8 Potentiometric ..................... 88
6.9 Inductance ...................... 95
6.10 Reluctance ...................... 99
6.11 Micromanometers .................... 105
6.12 Vibrating Wire .................... 107
6.13 Optical ........................ 111
6.14 Diode .......................... 115
6.15 Electrokinetic ..................... 119
6.16 Magnetostrictive ...................... 122
6.17 Ohmstrictive ...................... 124
6.18 Force Balance ..................... 126
6.19 Oscillating ...................... 128
6.20 Photoelectric ..................... 130
7. LOW-TEMPERATURE CALIBRATION METHODS ............. 132
vii

Page intentionally left blank
Page intentionally left blank
•1
11

LIST OF FIGURES
Page
Figure 1.1 Ranges of some commercially available gages ..... 5
Figure 1.2 The comparison of some force-summing elements and vacuum pressure transducers .............
7
Figure 2.1 Effect of thermal cycling on bonded strain gage pressure transducers ................ 14
Figure 2.2 Temperature compensation and the effect on pressure transducer sensitivity ............... 16
Figure 2.3 The effect of temperature on pressure transducer performance for two similar transducers (same type, mfgr., etc.) Transducer type: strain gage ..... 18
Figure 2.4 The effect of temperature on pressure transducer performance for two similar transducers (same type, mfgr., etc.) Transducer type: linear variable differential transformer ............... 19
Figure 2.5 The effect of temperature on pressure transducer performance for two similar transducers (same type, mfgr., etc.) Transducer type: variable reluctance. . 20
Figure 5.1 Transducer locations ................ 27
Figure 5.2 Pressure taps and the effect of hole size ...... 32
Figure 5.3 Pressure taps and the effect of hole geometry . . . 32
Figure 6.11 U-tube ....................... 34
Figure 6.12 Differential .................... 35
Figure 6.13 Cistern .......................
Figure 6.14 Inclined ...................... 36
Figure 6.21 Bourdon tube configurations ............. 41
Figure 6.22 C-type bourdon tube geometry ............ 42
Figure 6.23 Optical pressure transducer utilizing a helical bourdon tube .................... 47
Figure 6.31 Basic diaphragm types ................ 51
Figure 6.32 Slack diaphragm pressure gage ............ 52
Figure u.41 Common types of bellows and fitting attachment methods....................... 57
Figure 6.42 Bellows gage for measuring differential pressure . . 58
Figure 6.43 Temperature compensated differential pressure bellows gage .................... 59
Figure 6.44 Cyclic life of bellows ............... 63
ix

LIST OF FIGURES (continued)
Page
Figure 6.51 Bonded and unbonded strain gages and associated circuitry..................... 66
Figure 6.52 Typical unbonded strain gage installation ...... 68
Figure 6.53 Electrical circuitry necessary for bonded or unbonded strain gage pressure transducer ...... 69
Figure 6.61 Parallel-plate capacitive pressure transducer . . . . 74
Figure 6.62 Concentric overlapping cylinder capacitive pressure transducer ................ 75
Figure 6.63 Transducer output vs displacement for dielectrics of various thickness ................ 75
Figure 6.64 Electrical circuitry for capacitance pressure transducers ..................... 78
Figure 6.71 Schematic of piezoelectric pressure transducer and related circuitry ................ 80
Figure 6.72 The response characteristics of a piezoelectric pressure transducer ................ 82
Figure 6.73 Piezoelectric crystal sensitivity .......... 83
Figure 6.74 Piezoelectric crystals stacked in parallel ..... 84
Figure 6.75 Block diagram for piezoelectric pressure transducers ...................... 85
Figure 6.81 Potentiometric pressure transducer using a capsule element ................... 89
Figure 6.82 Circuitry for potentiometric devices ........ 89
Figure 6.83 Potentiometric pressure transducer using a - bourdon tube element ................ 89
Figure 6.84 Error contribution in a pressure transducer ..... 90
Figure 6.85 Pressure transducer component isolation for use with reactive liquids or gases ........... 91
Figure 6.91 Inductance technique commonly used in pressure transducers . .. . . . . . . . . . . . . . . . . . . . 95
Figure 6.92 Inductance-ratio circuitry ............. 96
Figure 6.93 Output vs armature displacement for LVDT pressure transducers ..................... 97
Figure 6.94 Inductance pressure transducer circuitry ...... 97
Figure 6.101 Basic principle of reluctance technique ....... 100
Figure 6.102 Circuitry for reluctance pressure transducers . . . . 101
Figure 6.103 Block diagram of reluctance pressure transducer circuit ....................... 102
x

LIST OF FIGURES (continued)
Page
Figure 6.121 Vibrating wire pressure transducer ......... 107
Figure 6.122 Sensitivity dependence on the thermal history of the vibrating wire element ........... 108
Figure 6.131 Schematic of a basic optical pressure sensing device ....................... 112
Figure 6.141 Tunnel diode oscillator ............... 116
Figure 6.142 Diode output (my) vs pressure (psi) at various temperatures .................... 117
Figure 6.143 Diode frequency vs pressure ............. 117
Figure 6.151 Electrokinetic pressure transducer .......... 119
Figure 6.161 Magnetostrictive pressure transducer ........ 123
Figure 6.171 Ohmstrictive pressure transducer .......... 124
Figure 6.181 Force-balance pressure transducer .......... 126
Figure 6.191 Oscillating pressure transducer ........... 128
Figure 6.201 Photoelectric pressure transducer .......... 130
Figure 7.1 Cryogenic pressure transducer calibration system ....................... 133
Figure 8.11 Low-pressure deadweight tester ........... 134
Figure 8.12 High-pressure deadweight tester ........... 135
Figure 8.13 Typical deadweight tester system .......... 144
Figure 8.21 Shock tube calibration system ........... 147
Figure 8.31 Siren-tuned-cavity generator ............ 149
Figure 8.41 Rotating-valve pulse-function generator ....... 151
Figure 8.42 Rotating-valve step-function wave form ....... 152
Figure 8.51 Low-frequency pneumatic sinusoid generator (piston-in-cylinder model) ............. 153
Figure 8.61 Arrangement for calibration using the electromagnetic technique .............. 154
Figure 9.1 Static and dynamic cryogenic pressure sensor test facility ..................... 158
Figure 9.2 Static and dynamic pressure cell assembly ...... 159
xi

LIST OF TABLES
Page
Table 1.1 Specifications of some commercially available pressure gages ................... 3
Table 1.2 Pressure transducers ................. 4
Table 4.1 cleaning and inspection procedures for ballistic missilesystems ................... 24
Table 4.2 cleaning of oxygen pressure gage components, naval boiler, and turbine laboratory ........ 25
Table 4.3 cleaning and testing of oxygen and nitrogen gas piping systems ................... 25
Table 4.4 cleaning methods and processes ............ 26
Table 5.1 Summary of formulas ................. 29
Table 6.11 Manometer fluid densities .............. 33
Table 6.12 Boiling point and vapor pressure of some manometer fluids .................. 38
Table 6.31 E and K values for commonly used materials ..... 56
Table 6.41 characteristics of single-ply brass bellows ..... 61
Table 6.51 Gage factor and temperature coefficient for some strain gage materials ................ 66
Table 6.52 characteristics of pressure transducers using strain gages .................... 72
Table 8.11 Gravity vs latitude ................. 142
Table 8.12 Effective diameter .................. 143
Table 8.13 weight tolerance .................. 143
xii
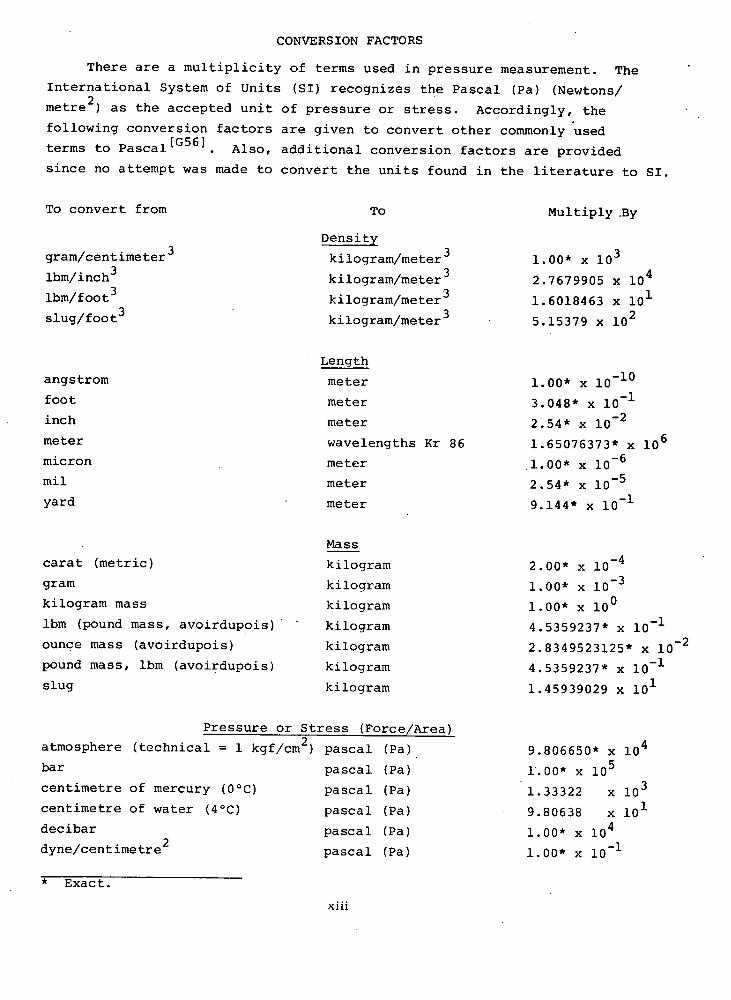
CONVERSION FACTORS
There are a multiplicity of terms used in pressure measurement. The
International System of Units (SI) recognizes the Pascal (Pa) (Newtons/
metre 2 ) as the accepted unit of pressure or stress. Accordingly, the
following conversion factors are given to convert other commonly used
terms to PascalEG561. Also, additional conversion factors are provided
since no attempt was made to convert the units found in the literature to SI.
To convert from To
Density
gram/centimeter 3 kilogram/meter3
ibm/inch3 kilogram/meter3
ibm/foot 3 kilogram/meter3
slug/foot 3 kilogram/meter3
Multiply .By
1.00* x 10
2.7679905 x
1.6018463 x 101
5.15379 x 10
Length
angstrom meter 1.00* x 10-10 foot meter 3.048* x 10- 1 inch meter 2.54* x 10-2 meter wavelengths Kr 86 1.65076373* x 10 micron meter 1.00* x 10- 6 mil meter 2.54* x 10
yard meter 9.144* x 10_1
Mass
carat (metric) kilogram 2.00* x 10
gram kilogram 1.00* x 10- 3 kilogram mass kilogram 1.00* x 100
lbm (pound mass, avoirdupois) kilogram 4.5359237* x 10_1
ounce mass (avoirdupois) kilogram 2.8349523125* x 10- 2 pound mass, ibm (avoirdupois) kilogram 4.5359237* x 10_1 slug kilogram 1.45939029 x 101
Pressure or Stress (Force/Area)
atmosphere (technical = 1 kgf/cm) pascal (Pa) 9.806650* x 1O4
bar pascal (Pa) 1'.00* x centimetre of mercury (0°C) pascal (Pa) 1.33322 x 10³ centimetre of water (4°C) pascal (Pa) 9.80638 x 101
decibar pascal (Pa) 1.00* x 1O4 dyne/centimetre 2 pascal (Pa) 1.00* x 10-1
Exact.
xiii

To convert from
To
Pressure or Stress (Force/Area
foot of water (39.2°F) pascal (Pa)
gram-force/centimetre 2 pascal (Pa)
inch of mercury (32°F) pascal (Pa)
inch of mercury (60°F) pascal (Pa)
inch of water (39.2°F) pascal (Pa)
inch of water (60°F) pascal (Pa)
kilogram-force/centimetre 2 pascal (Pa)
kilogram-force/metre 2 pascal (Pa)
kilogram-force/millimetre 2 pascal (Pa)
kip/inch 2 (ksi) pascal (Pa)
millibar pascal (Pa)
millimetre of mercury (0°C) pascal (Pa)
poundal/foot2 pascal (Pa)
pound-force/foot 2 pascal (Pa)
pound-force/inch2 (psi) pascal (Pa)
psi pascal (Pa)
torr (mm Hg, 0°C) pascal (Pa)
Newton/metre 2 pascal (Pa)
Multiply By
(continued)
2.98898 x 10
9.801650* x 101
3.386389 x 1O3
3.37685 x
2.49082 x 102
2.4884 x 10²
9.806650* x 10
9.806650* x 100
9.806650* x 106
6.894757 x 10 1.00* x 102
1.333224 x 10²
1.488164 x 100
4.788026 x 101
6.894757 x
6.894757 x 10
1.33322 x 10²
1.00*
Temperature
Celsius (temperature) Kelvin
Fahrenheit (temperature) Kelvin
Rankine (temperature) Kelvin
Fahrenheit (temperature) Celsius
Kelvin (temperature) Celsius
Viscosity
lbm/foot second newton second/meter 2
lbf second/foot 2 newton second/meter2
K=C+273 .15
K=(5/9) (F+459.67)
K=(5/9)R
C= (5/9) (F-32)
C=K-273 .15
1.4881639 x 100
4.7880258 x 101
SI Symbol
G
M
k
m
n
Multiplication Factors Prefix
1 000 000 000 = 1o 9 giga
1 000 000 = 106 mega
1 000 = 1O 3 kilo
0.001 = 10 milli
0.000 001 = 10_ 6 micro
0.000 000 001 = nano
* Exact.
xiv

1. INTRODUCTION
Of all the measurements made on systems, one of the most common must
surely be that of pressure measurement. Pressure measurements are made not
only to determine the force per unit area in a system, but also to determine
flow rate-.(-bead type meters), quantity (differential pressure liquid level
gages), and temperature (vapor pressure or gas thermometers) . There are,
understandably, a wide variety of pressure measuring devices in existence.
The devices and methods described in this report were selected after an ex-
tensive review of the available literature. A comprehensive reference and
bibliography list is provided at the end of this publication which was com-
piled from several sources including a search of the NBS Cryogenic Data
Center and the NASA Scientific and Technical Information Facility. Very few
references in the literature deal with the problem of pressure transducers
and their performance in cryogenic environments, and in particular, when used
with liquid oxygen (LOX). Therefore, an accurate evaluation is not available.
This report, however, is not limited to those references which were only con-
cerned with oxygen (gaseous and liquid) . Where the information was not avail-
able, a quantitative discussion was made.
As many considerations as possible (i.e., calibration, error, oscil-
lations, hysteresis, etc.) for pressure transduce e al- genic tem-
peratures will be covered in this report and whereve the dis-
cussion will be quantitative. Problem areas connect' th a particular
pressure transducer and the considerations mentionE sill be discussed in
the appropriate section (i.e., diaphragm, bellows, etc.) followed by des-
criptions, performance (mostly at ambient conditions), and other pertinent
data. The above approach is felt to be the most practical since very few
data are available in the literature on pressure transducers with respect to
gaseous and liquid oxygen. Recommendations by the authors wi e made when
other information is unavailable.
1

Instruments for making both static and dynamic pressure measurements
are described. Even in nominally static pressure systems dynamic pressure
fluctuations may be present, as in a flowing stream or a differential liquid
level gage. Thermal oscillations in lines containing cryogenic fluids pre-
sent special problems which can be quite detrimental in obtaining a "true"
pressure reading (see "Cryogenic Pressure Measurement"). Therefore, it is
very important that the system characteristics be properly considered when
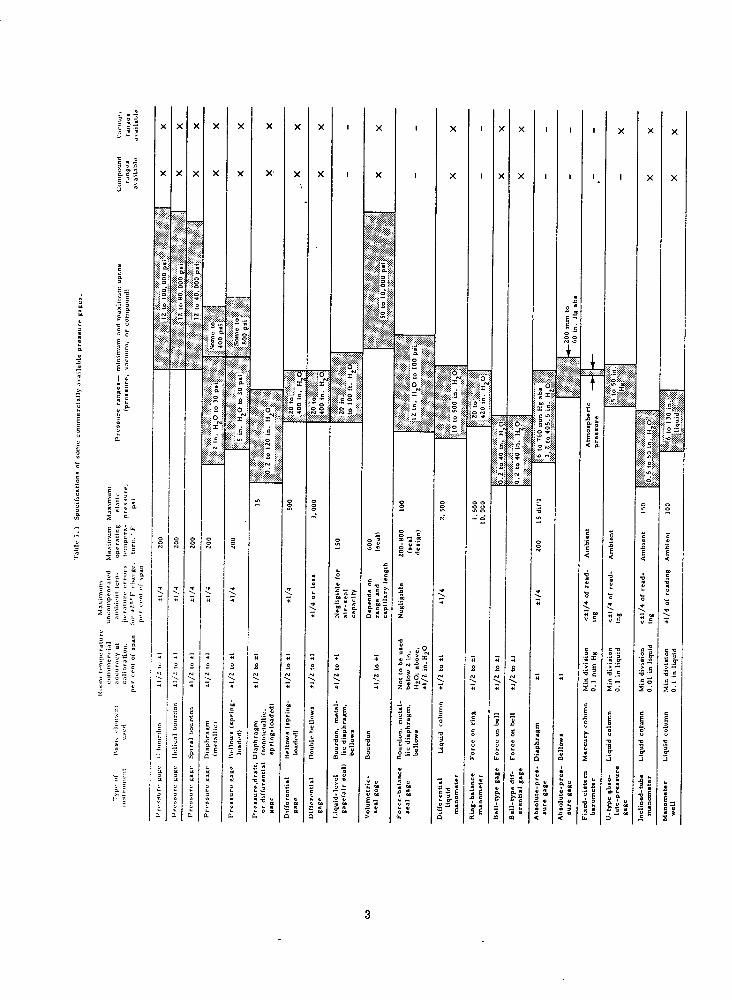
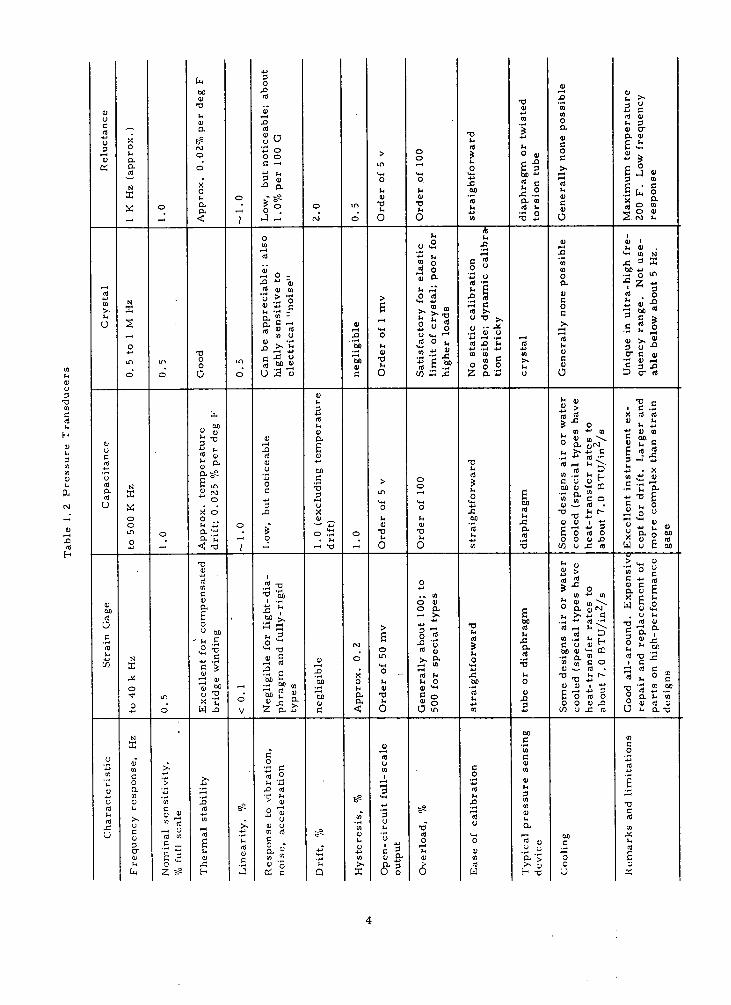
choosing pressure measuring instrumentation. General information on elastic
gages and manometers commonly used in pressure measurement are shown in
[Gl]* table 1.1 . Also, information on electrical transducers (quite often
used in conjunction with a diaphragm, Bourdon tube, or bellows) used to
measure pressure is shown in table 12[Gll]
Some of the more commonly found pressure measuring devices used for
measuring vacuum or low pressures are listed in Figure 1.1. The approxi-
mate pressure range, for a particular gage, is also indicated in the
figure. Through common usage the term vacuum refers to any pressure below
atmospheric. This pressure region has been divided into five generally
accepted degrees 281:
Low vacuum 760 torr to 25 torr (101.3 kPa to 3.33 kPa)
Medium vacuum 25 torr to 1003 torr (3.33 kPa to 0.13 Pa)
High vacuum torr to 10- 6 torr (0.13 Pa to 0.13 mPa)
Very high vacuum 10_6 torr to io torr (0.13 mPa to 0.13 p.Pa)
Ultrahigh vacuum lO torr and beyond (0.13 tPa and beyond)
Under normal conditions vacuum measuring devices are not actually exposed
to oxygen (gas or liquid), therefore, they are not covered in this report.
For additional information on vacuum measurement the reader is referred to
a review paper by Santeler, et. al.291.
* References throughout the text are prefixed by a symbol (e.g., G,C,B, etc.) to denote the category in which they are listed (see list of designations under .'References and Bibliography") . An "Author-Designation Cross Reference Index is also included with authors listed alphabetically.
2
E E
7 Z o d
I!
H
ii L p
t
: :
HT
I!1
j
44 44 ZXi 41 14 41 44
o
h E
E
JIIJ iH I lo
J i
xi 'l x i I xIiIxxiJiIiIx Xix
3
.0 Cd .0
4)
4)4
(4 - 0. (4 0.
V
-0 c..j
0 > 04)0
2 2 0
0 04)1) 0
.0(
- ( 0 0) 1) cJ
2 .- 0
0 0 -2 0 - - - C') 0
0 I
000-
4)0.
00
to 0
Ob
- .04)) cd
c4 0-0
U) .U0 > oc U(•(
.0(4
..(V 0
1
.0
ri)S> . 2 tv
o - 2o - 4) 0 .0 0 o '.- - 0
,
0 ..O U
u•1.
'0
24) rno 4)
20.04)
C; o 0 o 0.04) 0 0 o Zo.. o 0
0 2> 'V0 co
4)0 U Il U 4)
0.0)4)
U o
0 - .0
I.. c'.I0 co
0 (4
(44) Q.
(4 U
4)'tO ".. _
O0 OD
0 0(4
E-U 4)
0 . . 0 0 0 'E 4)..._(4 (40 .0 (4 .0 '0 (N
0 o
0 (
U4) '0
I 4) '0
00 ., .0 4) 4) I ) 0)
0 00 0 O(40
x 0 -0.., . .
- 0 0 10•, '0
000.o CIDO.0c4
o) 0000
4)>>, U
2 0
4)
0'
.4) 04)
4)24) V4)..
00 0. E
Op. -
0 O•
O0.Ur') IU>'•-0 •o 03
L) 0 o
O.O.._
'
00 (44) 0.
0 k 0 014.0
4 4)''E-1 Q4) .0
(d 0C
0
4.0 . , o
00 0 I..I4 .I 0
.0 4)0 0
'0 (N '0
0 I. 0
o
-b0
o:9-
U0 .,.
0.4)
'tO4)U 00 .,
4)UI 0c40
'V•U100 00-1.4)
0
flU.0,
000-
0_ .0
004).0 04)4 • 0 .0 V Zo.. 0 0u ao .., 0o.04 01.0.'0
0 0 (40 2
• 1.0 0 >
(40-
0
U -.0. (4
.014 •. , 0 co
0 '-I 0 0 0) .0
2
4) o' . 0)
.0 4)'0 0
14 .0
>' 0
(4 (4 -
- 3'-.
''o 4) 0 2
(4o 1.
- '0 0.
cc (4
r It Cd on
0. 4)
'-' ( It 0 0.0 (44)
-•
U .,2-
- I)
U (0
LI
0.> 0 > co >.1) C
Z4) U r Q X Co 0 w U

1'-
-4-4
0
H i
•' 0.. --4
Cfl U) I
a) 0---4
In
0 —4
'C
o -4
-
co
I C -
-4 0-
•1-4 +4
a) a)
a) a' ED
0 —4 +4a)
a)U
0
41 a)(a0 .-4 - a)
•,-4a, a)
• '-4 -4-' ( +4 '-
a) (a a, 41 0 a)a)
o 0 --ooE
.J-41-4-4 a) '- 0
0 -4
0 -4
(a
—
a)
• --I- •
1;
I bfi I Cd I • I a,
—4 0
ji
I I I0
I I II -: o-. I : —-- ;—
I N I 0 I I I
4+4
0_0_cn_ -
"-4 I-I
Q) I
4-'
I I— a)---- U-4 -- - H Cd-4
II 0
II II cd
- -
IIcd
-
I-a- To 0 —--—--1
a)Z t40 0 '
Cd
0 Cd 0
' k: -- —g - - —a)—
b00 a) a)
--4— -'
0 0
+4
cd 0
--
-4b I-i Cdb1a)
to
N
0
Ca 00
z --4-
H --,)
I14c +4-' Cd
a)
H
a, —4 .0
Cd —4 --4
cd
Cd
-I -I
Cd
U
E 00
go to
0
a)
bID
Cd
-4
a, s-I
Ca "4
5

Included in this report are some possible sources for error in making
pressure measurements, which would include those at low temperature. Error
analysis is only briefly touched upon in this publication since a complete
treatment of the subject is beyond the scope of this report. However, the
References and Bibliography section lists several good publications dealing
with the subject.
Figure 1.2 helps to compare the characteristics of some pressure
transducer types
6

10
11
12
13
o-7--;---
0 e
Key to Answer Symbolsbe .-
0S
0
0 Definite Yes - v
Qualified Yes QD .- .
ea Qualified No o oe U
— N — N 0 c
I
'
10 Definite No 0 V I)-. U) < -1 <
Composition Independent? U U 1111 N EVA BOOM U U U N 111-1 U N N U U U U U N N U N N N N U N N U U N 0 N N U U 0 U U N E2 N N N N U U E2 N N N N N U U U U U 0 N N N N N U U U U U U U 0 U U U U U U N N U N IN U 9 U U U U U U U U U U E2 U N
N U N U E2 0 0 U
U U U N N N N
Leaves Gas Uncontaminated?
Uncontaminated by Gas?
Free from Mercury Attack?
Independent of Gage Temp.?
Usable at Low Temperature-,
Usable at High Temperature?
Continuous Indicating?
Remote Indication Easy?
Accuracy 10% or Better?
Wide Range Without Switching?
Usable in GO2?
Usable inLO?
InV
44JI V
.
.. S
>',CV (5
V C)
•V S U
to
oa
V C)
_ •.I C')
V
Cl)
e C)
0 .I TZdS I
C) C)
5V
_ •
C)
•;.I S
5 V b0 5 Q - V — V
l)_
IO V > ,
0 ••I V
0 •
VV 0S f-4z()
0bo M
U U)ZU)0
0 o
Figure 1. 2 The comparison of some force-summing elements and vacuum
pressure transducers.

Notes for Figure 1.2
1. Composition independent?
"Qualified Yes" for McLeod gage where gas must obey Boyle's law
and for Knudsen gage which can be made nearly composition independent,
but which is not always so constructed.
"Qualified No" for hot-filament and alpha-source ionization gages.
These gages are composition dependent, but the relative sensitivity
to different gases is 'not a function of pressure and consequently can
be expressed simply as a calibration factor or sensitivity ratio.
"Definite No" for Pirani and thermocouple, viscometer molecular
gage, Philips cold-cathode ionization gage. The composition dependence
here is complex and cannot be expressed by a simple ratio valid for
the entire pressure range.
"2. 'Leaves gas uncontaminated?
"Qualified , Yes" is assigned to those gages which involve mercury
vapor, components heated to incandescence, or high-voltage electrical
discharges.
3. Uncontaminated by gas? -
"Qualified Yes" is assigned for the following reasons: (1) Mercury
manometer and McLeod gage: accuracy of indication will eventually
suffer when the mercury and tubing walls become dirty. (2) Hot-
filament ionization and Philips cold-cathode ionization gages:
appreciable gettering and sorption occur and are troublesome 'in the
lowest part of the pressure range. (3) Alpha-source gages: excessive
' condensation of moisture or other liquids can affect reading.
"Qualified No" is assigned for the following reason (1) Pirani and
thermocouple gages (particularly the latter) : low-pressure errors
due to change of emissivity.
8

4. Free from mercury attack?
"Definite Yes" is assigned only to those gages where usual materials
and construction are such as to resist attack even by liquid mercury.
"Qualified Yes" indicates that gages probably are capable of resisting
mercury vapor for extended periods of time, but not necessarily able
to withstand action of mercury droplets.
"Qualified No" indicates that precautions are desirable to keep
mercury vapor and droplets from gage when operation covers more than
a few tens of hours.
5. Independent of gage temperature?
"Definite Yes" signifies that gage indicates pressure rather than
molecular density; indication is relatively unaffected by variations
in gas temperature or ambient temperature.
"Qualified Yes" is assigned for the following reasons: (1) Knudsen,
Pirani, and thermocouple gages operate on the basis of heat transfer
through the gas; hence ambient temperature affects indication some-
what. (2) Hot-filament, Philips cold-cathode, and alpha-source gages
indicate molecular density rather than pressure.
"Qualified No" signifies: (1) Sensitive diaphragm gages require
careful thermostatting. (2) Viscometer molecular gage has somewhat
severe temperature errors near mid-range.
6. Usable at low temperature?
As rough basis of comparison, "low temperature" here means below
the freezing point of water.
"Definite Yes" is assigned only when operating principle is indepen-
dent of temperature and when generation or conduction of heat is not
essential to gage function.
"Qualified Yes" signifies: (1) Mercury manometer and McLeod gage
are limited only by low-temperature properties of fluid. (2) Knudsen,
Pirani, and thermocouple gages depend on heat conduction--hence must
be recalibrated for operating temperature. (3) Viscometer molecular
gage has severe temperature dependence at mid-scale. (4) Hot-filament
ionization gage contains an intense heat source.
9
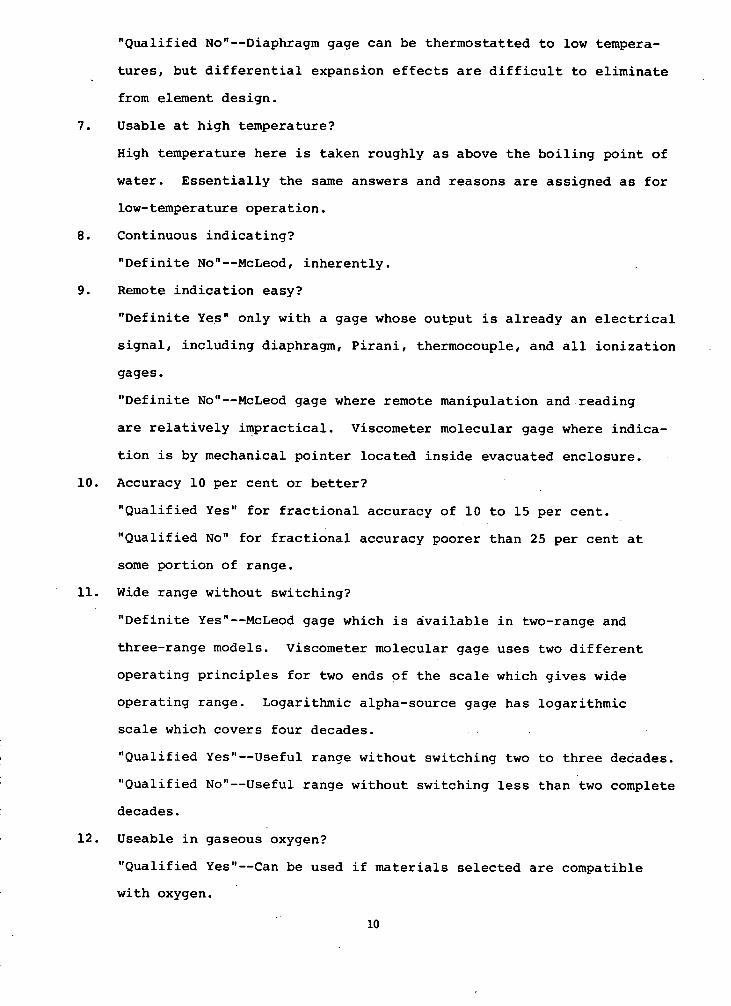
"Qualified No"--Diaphragm gage can be thermostatted to low tempera-
tures, but differential expansion effects are difficult to eliminate
from element design.
7. Usable at high temperature?
High temperature here is taken roughly as above the boiling point of
water. Essentially the same answers and reasons are assigned as for
low-temperature operation.
8. Continuous indicating?
"Definite No"--McLeod, inherently.
9. Remote indication easy?
"Definite Yes" only with a gage whose output is already an electrical
signal, including diaphragm, Pirani, thermocouple, and all ionization
gages.
"Definite No"--McLeod gage where remote manipulation and reading
are relatively impractical. Viscometer molecular gage where indica-
tion is by mechanical pointer located inside evacuated enclosure.
10. Accuracy 10 per cent or better?
"Qualified Yes" for fractional accuracy of 10 to 15 per cent.
"Qualified No" for fractional accuracy poorer than 25 per cent at
some portion of range.
11. Wide range without switching?
"Definite Yes"--McLeod gage which is available in two-range and
three-range models. Viscometer molecular gage uses two different
operating principles for two ends of the scale which gives wide
operating range. Logarithmic alpha-source gage has logarithmic
scale which covers four decades.
"Qualified Yes"-.-Useful range without switching two to three decades.
"Qualified No"--Useful range without switching less than two complete
decades.
12. Useable in gaseous oxygen?
"Qualified Yes"--Can be used if materials selected are compatible
with oxygen.
10

13. Usable in liquid oxygen?
"Qualified Yes"--Through proper design the bellows and diaphragm
pressure transducer can be used with liquid oxygen.
11

2. CRYOGENIC PRESSURE MEASUREMENT
Much is known about the cryogenic performance of a relatively few
pressure transducer types; however, the information available is either
in the form of manufacturing specifications or unpublished reports.
Hayakawa 591 made a study of cryogenic pressure measurement technology
and concluded that accuracies of 2 per cent full scale were unattainable.
The transducer types studied in this report were strain gage (bonded and
unbonded), piezoelectric, and potentiometric. Hayakawa states that in-
quiries "to approximately 50 manufacturers resulted in seven favorable
responses from suppliers indicating the availability of transducers
operable with cryogenic systems of liquid oxygen or liquid hydrogen".
Transducers, at low temperature, usually experience a change in sensitivity,
a zero shift, or erratic performance.
For many years pressure measurement in cryogenic systems l5,G57,G58,C71
has 'been made by simply running gage lines from the desired point of mea-
surement to a convenient location at ambient temperature and attaching a
suitable pressure-measuring device. In many systems this straightforward
method for pressure measurement (excluding vacuum) will work quite well
without difficulty; however, there are disadvantages which can create
serious problems in a system 571 . Three very important items to con-
sider for pressure measurement in a cryogenic medium are: (1) reduced
frequency response (if long gage lines are used), (2) pressure oscilla-
tions, and (3) heat leak.
• A lengthy run of gage line from cryogenic to ambient environments
will, most likely, introduce all three conditions mentioned above. In
addition, oscillations in a system can fatigue the piping and ' result in
premature failure. Smelser t57 conunents about this problem by indicating:
"Gauge lines that run from some relatively high-temperature locations into
a cryogenic liquid can give rise to pulsations unless care is taken to
fix the liquid-vapor interface in the line. This phenomenon is caused when
liquid is suddenly forced into a gauge line to a point where the tempera-
ture is above the saturation temperature of the liquid. The resultant
12
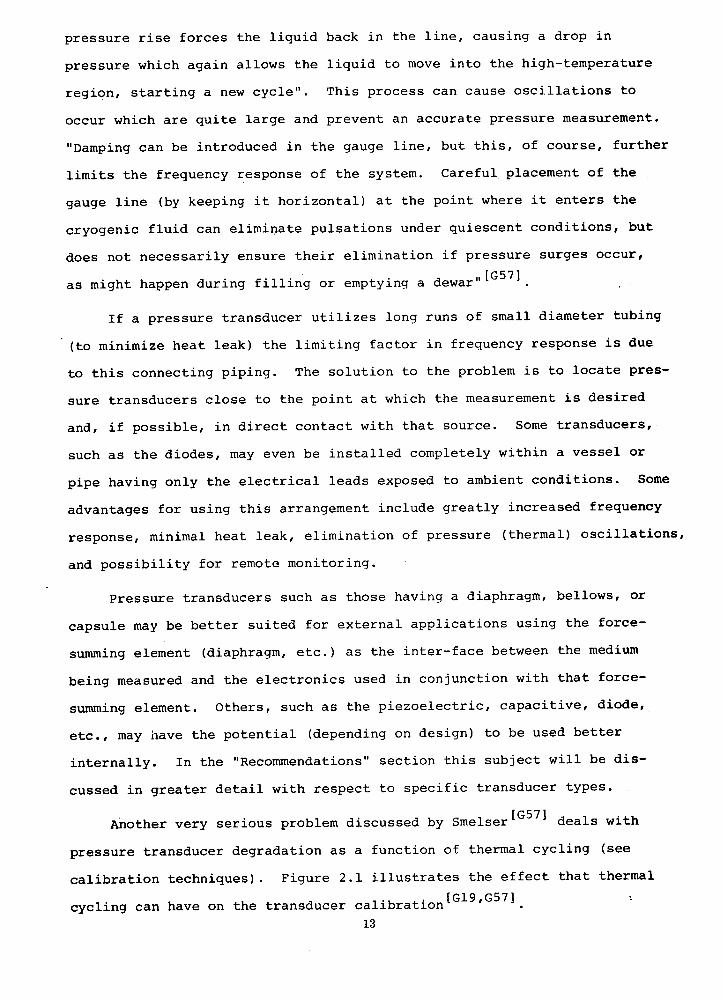
pressure rise forces the liquid back in the line, causing a drop in
pressure which again allows the liquid to move into the high-temperature
region, starting a new cycle". This process can cause oscillations to
occur which are quite large and prevent an accurate pressure measurement.
"Damping can be introduced in the gauge line, but this, of course, further
limits the frequency response of the system. Careful placement of the
gauge line (by keeping it horizontal) at the point where it enters the
cryogenic fluid can eliminate pulsations under quiescent conditions, but
does not necessarily ensure their elimination if pressure surges occur,
as might happen during filling or emptying a dewar"571.
If a pressure transducer utilizes long runs of small diameter tubing
(to minimize heat leak) the limiting factor in frequency response is due
to this connecting piping. The solution to the problem is to locate pres-
sure transducers close to the point at which the measurement is desired
and, if possible, in direct contact with that source. Some transducers,
such as the diodes, may even be installed completely within a vessel or
pipe having only the electrical leads exposed to ambient conditions. Some
advantages for using this arrangement include greatly increased frequency
response, minimal heat leak, elimination of pressure (thermal) oscillations,
and possibility for remote monitoring.
Pressure transducers such as those having a diaphragm, bellows, or
capsule may be better suited for external applications using the force-
summing element (diaphragm, etc.) as the inter-face between the medium
being measured and the electronics used in conjunction with that force-
summing element. Others, such as the piezoelectric, capacitive, diode,
etc., may have the potential (depending on design) to be used better
internally. In the "Recommendations" section this subject will be dis-
cussed in greater detail with respect to specific transducer types.
Another very serious problem discussed by Smelser 571 deals with
pressure transducer degradation as a function of thermal cycling (see
calibration techniques). Figure 2.1 illustrates the effect that thermal
cycling can have on the transducer calibration9GS7l.
13

0 0 In
cm
C/) OC/) ow — ir
a-
0 0 In
F-N Z
z
In
'2 I I
'C 0 0 0 0
0 - 'Li
0 0 0 0 N - 3/°] 'OIJNd 39VU0A
U)
fI
Lii
Cl)
LL. a-
In0 'C 0
IL)
bO
Cd bb
Cd k
(DO' <.-U) (Do. •
Z —o I
L_.
U) U c-J
La.I 0' c)c .4
Z Ok 0 co.-I k
1z1
-4
k
bO
14

Figure 2.1a shows the calibration of a bonded* strain gage in the
if received" condition [G571 . The pressure transducers were initially
installed into the calibration system, cooled down to the desired tempera-
ture (298, 77, or 20 K) and then pressurized while the output was monitored.
Figure 2.1a illustrates that for this particular type of pressure transducer
a calibration change does not occur (for one-time tests) at low tempera-
tures; however, after the same strain gage pressure transducer has been
thermal cycled from ambient down to test temperature fifty times prior to
testing the effect is significant and shown in Figure 2.1b. Note that the
zero-shift at 20 K not only changed appreciably, but that the calibration
also changed. Another effect caused by thermal cycling not apparent from
the figure was a very erratic zero-pressure output after rewarming to
ambient temperature. Some transducers may be completely unacceptable for
use at low temperature due to large errors resulting from hysteresis.
Figure 2.2 gives a second example of both temperature compensated
and uncompensated devices. The unbonded** strain gage pressure transducer
with compensation responds in quite the same manner as that shown in
Figure 2.1-for the bonded type. The unbonded strain gage transducer
(Figure 2.2) experienced a zero-shift like that of the bonded strain gage
in Figure 2.1a before thermal cycling. This minor effect, however, can
also be compensated for electronically (see section on "Strain" gage
pressure transducers).
Finally as shown by the capacitive, uncompensated transducer in
Figure 2.2, a severe calibration change occurs at low temperature.
* Bonded strain gage elements are generally wire in a flat grid or a thin metal foil printed and etched to produce a grid-type pattern. These gages must be cemented to the surface of a material whose strain is to be mea-sured. Effectively, the gage then becomes a part of that surface and con-sequently undergoes essentially the same strain (see Figure 6.111).
** Unbonded strain gages operate basically the same as bonded ones; how-ever, the wires are not adhered to the material as in the bonded case. Instead, the wire itself provides the mechanical link between the sensing element (diaphragm, bellows, etc.) and ground (see Figure 6.112).
15

LL 0
I—z40 LU C-) cr LU a-
CAPACITANCE PRESSURE I
TRANSDUCER TEMPERATURE UNCOMPENSATED
-
140
120
F—
a-I-
0 Lii
80
0 Cl) —I —j
60 L
/
/ UNBONDED STRAIN GAGE PRESSURE TRANSDUCER TEMPERATURE COMPENSATED
77 K
/
298 K
20L 0
100 200 300 400 500
PRESSURE. psia Figure 2. 2 Temperature compensation and the effect on pressure
transducer sensitivity.
16

NASA's Marshall Space Flight Center (MSFC) in Huntsville, Alabama,
has routinely tested a number of pressure transducers over the last few
years. The types of transducers tested include variable reluctance, capaci-
tance, piezoelectric, potentiometric, strain gage, and linear variable
differential transformer. Results of this on going program are only avail-
able in unpublished reports some of which have been made available for review.
The test program at MSFC did not always include cryogenic testing but
when it did only one thermal cycle to liquid nitrogen temperature was included.
Therefore, the effect of cycling can not be determined. Dean et al., [G141
have shown that in some cases after thermal cycling (approximately 50 cycles
from ambient to -320°F to ambient) a more stabilized, reproducible output
signal may be achieved. Therefore, when a transducer does perform satisfac-
torily after one thermal cycle its chance for long-term stability is greatly
increased.
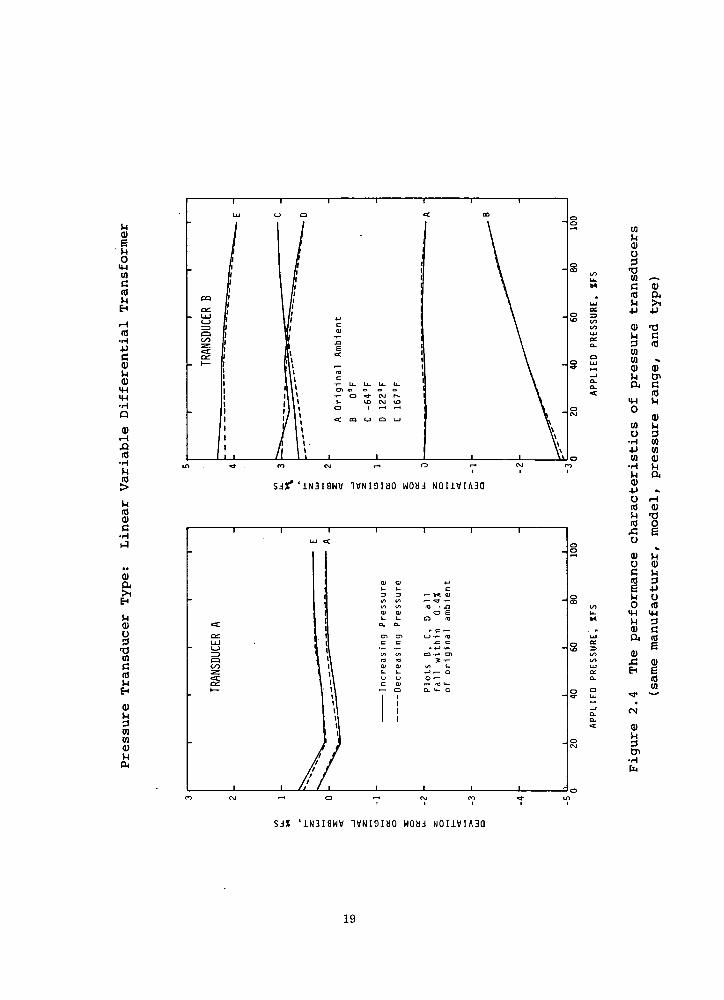
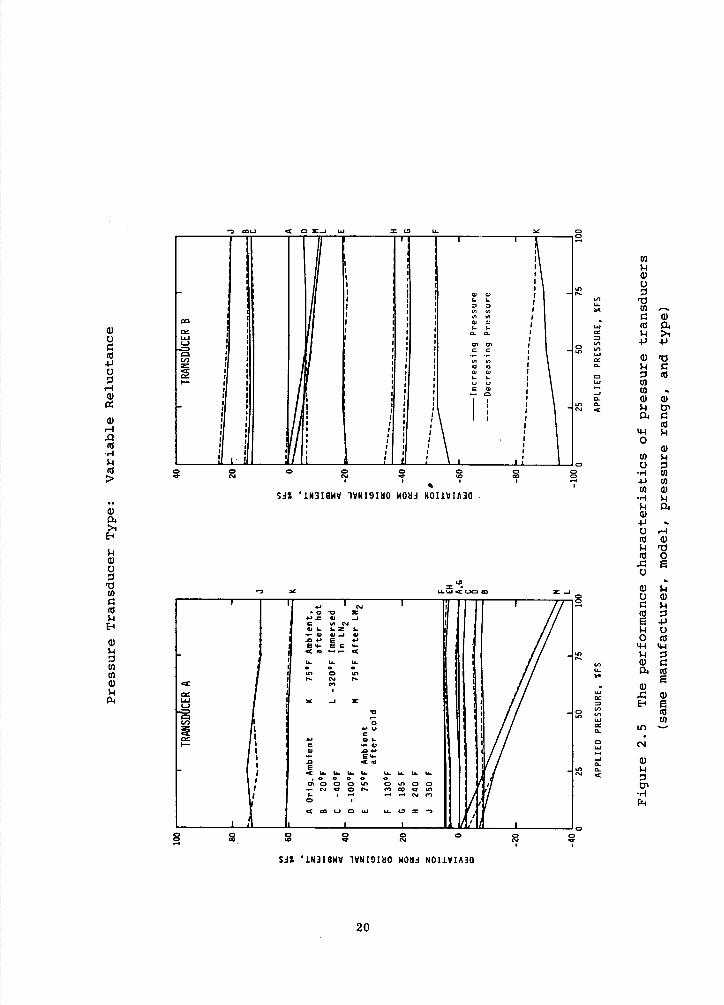
Unfortunately, test runs conducted at MSFC illustrate the effect of
only one complete thermal cycle. For example, several transducer tests
were performed at 75°F, -120°F, -320°F, and 75°F and none were re-cycled
to low temperature and tested again. The summarized results of these tests
are shown in Figures 2.3 to 2.5. Two pressure transducers (A&B) of the same
type (model, range, etc) and from the same manufacturer are compared in the
figures. The plots shown in Figures 2.3 and 2.4 show the unpredictable behavior
when a transducer is subjected to low temperature. Not only does transducer
output change but as shown in Figure 2.5 the device's room temperature sensi-
tivity can be sharply altered after being exposed to cryogenic environments.
Although no tests were conducted at MSFC using ambient or cold oxygen,
the effect of thermal cycling on transducers is expected to be the same as
experienced in liquid nitrogen. More research and testing is necessary for
a better understanding of pressure transducer behavior under adverse environ-
mental conditions. The results shown in the figures clearly show that indivi-
dual transducers even from the same manufacturer can have quite different
characteristics. This fact suggests that for reasonable accuracy each
17

a)
4) Cl)
04 >1
I-I a) 0
U)
a)
U) Cl) a)
04
I
I I I
I/I
II UI II
I I I I w I S L) I S
II
II I I I— It
CD I I
I' I II I
I II I I
0 ('4
ii I
I I I
U U U U C 05
O 0 .-.' I.
tfl (#5
vs
44. 4.3 c
I I U U U U 4..
L. ..- vs 4..
8. .0 I.0 (J0 E U.- ..-
05
0
r E .-E0<0
U) ..- ..-—— Lj (5 Sn 55 ..J
3535 0. C
U U •.-5 U 1/) 1.4. 050
U 4.1 . (SJ .0
C U '.1 U 0 0
I— I ii
i
I It I I I
0 — Si% LN3I9WY 1VNIflfO WOH N0I1VIA3Q
I S U S
SiS 'IN3I9WV 1VNI9I0 WONJ N0I1VIA3O
(I)
a)
LI
La *a)
vs 14.3 0. 0
CL 0. U) • U)
a) a) -i bs
4-4 .4 0
a) U)
•5.4 U) .J U) Cl) a)
•5.I 1.4 1404 a)
- 0—I
a)
0
oW
E4 1.i 0 0 c 4-44-I
:
v U
a)
cc EE 0.
0 U)
0 144 (5) ... — -.3
C'4
,a) 1-i
-I-I
18
'-I
a) E
0 4-1
CO
.r.I 4.)
a)
a) 4-4
4-4
a)
.-I
a)
a) 04 >1 El
C-1
a) 0
CO
El
CO
CO a)
04
I
U
I
L) 0
I I
. 0
/0
I CO
I: I I
I U.) L)
S I
.0 10
= IC aj
E
S •0
ID
Cu_ u U- U
I Q C1 N.
I1.. ID N ID
II I --
I o C.) 0 CUCIII
I,
I I Iii I I I I C0
I I I I
0
- 0
ID ID
D vs
,D(U 0 .—e.- - 0 C, U) ID fl
ID ID DID S.. 0.0..
S.. a to C.-
01 01 01—ID U.) C C . 0 = LI)
IDCI ID
0.1-01 '-
(1) II IDOl CI 5-I.. S.. LU.0
I
CD
I I I I
Cr5 CIII rD — C'4
SJ%'J.N3IBWV 1VNI9JHO WOIJ N0IIVIA30
CIII —. 0 ('II CI)
SJ% 'J.N3I9WV 1VN191NO WOdi NOIIVIA30
U)
ci) C)
. CO ..—.
ci)
C
CU
4.) 4.)
ID.(0
0-
a)a) —J a-a-
"S 4-1 C-i
0
a) U) C-i 0
• rI (1) 4.) (0 U) a)
• .-I C-i C-i 04 a)
.4.)
0-4 ('S a) C-1 050
0
o a) 114
1-4 0 005
U 9-1 44 b
a) 0405
E U a)
0 CU
(.4
0. . a)
C-i
-I 114
19
a) 0
0
a)
a) r1
(U
ci)
>1
ci)
0
U)
(U I-1
ci)
U) U) ci)
-
C ri Iii = CD LL
Q CC
IC-'-
D D
U, UI WCC I-I-
LU
I= =
I UI I I I
II I CC
I I - I— I I I I I '-''-'
I I I I= '
I I I I I
—
•II
II
(' I! I I
I I • -
I I I I
I I I I
I
I I
I\
I
II I I I I I
( •___•••••••••••••_I 1I I I I -
0 0 0 0 0 (D 0 CJ CO
SO 'IN3I8WV 1VNI9IdO WO1IJ NOIIVIA3O
I{•i 'I... .O Z
.•_c W .0
4CC- C-Z I.. •.-4C 4I-C W OU E * E4-ECI-
P1
LJ tj
C -, Z
V) 0
CII. I.-. I —CC
CC .0.1.0
.0
C IA. IS. LU. IS. LA.. LL_ LA_ IJ_
.— PC 0N. P1 Lfl C- I — —4 — C-4 P1 o
C C-) CLAd U-CD = -1
I I I I
0 0 0 0 Pd CA
Si% 4 J.N3I8WV 1VNI9IIIO WOMA N0I1V1A30
j
LCfl U. CC
U)
= 0
Ui =
0
0-In 0_ Pd C
-4,
Cd,
CC
U) I-i ci) 0
U)-ci)
(UO L.I > 4)4J
s-I C i(U
U) to - ci) 11) s-i b PC
(U 41 $-i 0
a) U) $-I o -H U) .1.) CO U) ci)
$-I 04 11)
.4J -
0-I (U (1)
(U 0 .CE 0
0 ci) C s-i (1
s-I 0 o (U
4. q. 5-i ci) C
E ci) .0 11)
(U U)
tn —
c-Il
Ii) I-i
•1-1 r.x.
20

transducer should be individually calibrated and the calibration should be
done under the environmental conditions in which the transducer will be used.
In response to the needs of the National Aeronautics and Space Admin-
istration (Marshall Space Flight Center, Huntsville, Alabama) the authors are
currently developing a low temperature calibration facility for static pres-
sures to 10,000 psi with superimposed pressure fluctuations. It is hoped,
this facility will allow testing and documentation of the performance of
pressure transducers at cryogenic temperatures (See Recommendation Section).
21
3. MATERIAL COMPATIBILITY WITH GASEOUS AND LIQUID OXYGEN
When selecting instruments for pressure measurements in oxygen
systems, material compatibility is extremely important, especial-ly for
high pressure measurements. A reaction can take place whenever there is
a fuel, an oxidizer, and an ignition source present in a system. In a
high pressure oxygen system, the oxygen is the oxidizer and the high
pressure can be the source of ignition through rapid adiabatic compression.
It is of paramount importance that the transducer or gage material not
become the fuel in such a system.
Hust and Clark 491 have reviewed the literature on liquid and
gaseous oxygen compatibility and have recommended the following selection
procedure:
"1. Eliminate ignition -- select a material which is
least likely to ignite under operational conditions.
2. Prevent continued reaction -- select a material
which tends to quench the reaction after ignition.
3. Reduce the rate of reaction -- select materials
which react as slowly as possible after ignition
to permit the control of the reaction."
Each system must be considered on the basis of its own unique re-
quirements and materials selected accordingly. If only slowly varying or
static pressure measurements are required, a restriction can be included
at the inlet of the pressure gage to reduce the possibility of rapid
compression and/or impact. In such a system high ignition temperature
is probably the best criterion to use in selecting between possible
materials.
If there is a possibility of impact occurring either by design or
accident, then material selection must also take into account this addi-
tional source of ignition. Systems in which there is the possibility for
impact include flowing streams that contain solid particles, quick opening
valves, component failure, etc.22
At low pressures and moderate temperatures the isentropic compression
of oxygen can result in a temperature rise of over 8°R/psi. At low tem-
perature or higher pressures the temperature rise is smaller.
There have been many tests made on the impact sensitivity df materials
exposed to oxygen. Unfortunately, there is a lack of agreement about the
information available from the tests. Generally speaking; the tests show
that metals are more oxygen compatible than non-metals and that fluro-
carbon non-metals are generally better than the other non-metals. Of
the metals, nickel alloys and copper alloys are probably slightly better
than stainless steel, but all three metals are pretty good.
It is possible to obtain pressure gages and electrical pressure
transducers manufactured using what appears at this time to be the most
compatible materials. It is necessary to specify them, however, to ensure
obtaining the proper materials. Perhaps the potentially most dangerous
application involves some differential pressure transducers. Some of
these devices allow at least one of the pressurant fluids to come in
contact with a variety of materials within the transducer. It is necessary
that all components in such a situation be of compatible material.
Hust and Clark EG501 have prepared an unpublished report to sponsor
which contains oxygen compatibility data too numerous to include in their
published report 491 . Information from the unpublished report can be
made available by Hust and Clark upon request.
23
4. TRANSDUCER CLEANING PROCEDURES
Even if compatible materials are used in transducers, it is necessary
to have all elements in contact with liquid or gaseous oxygen free from
contaminants. Probably the most common contaminant in a transducer is
oil. Oil is sometimes used in manufacturing and sometimes in calibration
work. Glycerol (glycerin) is also used in the testing and calibration of
transducers. The physical properties of glycerol make its use as a pressure
calibration fluid a distinct advantage. Before being placed in oxygen ser-
vice, the transducer should be thoroughly cleaned. Volume II of this ASRDI
Oxygen Technology Survey [G51] covers cleaning requirements, procedures, and
verification techniques.
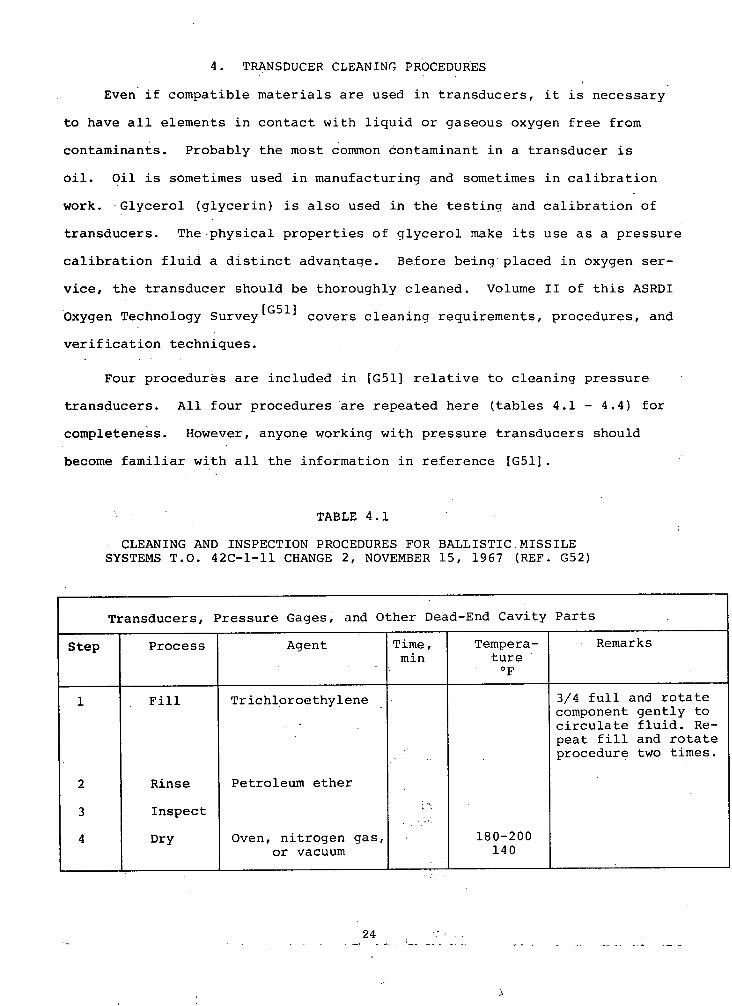
Four procedures are included in [G51] relative to cleaning pressure
transducers. All four procedures are repeated here (tables 4.1 - 4.4) for
completeness. However, anyone working with pressure transducers should
become familiar with all the information in reference [G51].
TABLE 4.1
CLEANING AND INSPECTION PROCEDURES FOR BALLISTIC.MISSILE SYSTEMS T.O. 42C-1-11 CHANGE 2, NOVEMBER 15, 1967 (REF. G52)
Transducers, Pressure Gages, and Other Dead-End Cavity Parts
Step Process Agent Time, Tempera- Remarks min ture
OF
1 Fill Trichloroethylerie 3/4 full and rotate -component gently to circulate fluid. Re-peat fill and rotate procedure two times.
2 Rinse Petroleum ether
3 Inspect
4 Dry Oven, nitrogen gas, 180-200 or vacuum 140
24

TABLE 4.2
CLEANING OF OXYGEN PRESSURE GAGE COMPONENTS, NAVAL -BOILER,-AND TURBINE LABORATORY, MARCH 26, 1965 (REF. G53)
Step Process Agent Time, min
Tempera- ture
°F
Remarks
Disassemble Disconnect from piping system, remove back of gage, elongate coil of capillary tubing, and open capillary tubing filing off tip.
2 Clean Freon PCA Forced by air pressure (5 psig) flow 150 ml of Freon PCA at approx-imately 50 ml/min.
Repeat with two addi-tional 124 ml portions and reverse flush with 100 ml of solvent.
3 Rinse Freon PCA Introduce 50 ml of sol-vent through connec-tion end of gage, col-lect effluent in white porcelain dish, and evaporate to dryness.
4 Inspect Ultraviolet lighl White dish from step 3 (3600-3900 A) checked for fluores-
cence. If fluores-cence observed, con-tinue flushing.
5 Assemble
TABLE 4.3
CLEANING AND TESTING OF OXYGEN AND NITROGEN GAS PIPING SYSTEMS MIL-STD-1330 (SHIPS), MAY 10, 1968 (REF. G54)
Bourdon C Tube Pressure Gages
Step Process Agent Time, Tempera- Remarks min ture,
OF
1 Disassemble
2 Clean Trichlorotri- MIL-C-81302 type I fluoroethane ultra-clean at flow
rate of 50 mu/mm.
3 Check Ultraviolet Continue flushing if light (3600- fluorescence is 3900A) evident.
4 Dry Dry, oil-free nitrogen
25

TABLE 4.4
CLEANING METHODS AND PROCESSES, NASA FRC PROCESS SPECIFICATION 20-1, NOVEMBER 1, 1970 (REF. G55)
Specific Cleaning Process for Pressure Transducers and Bourdon Tubes
Step Process Agent Time, Tempera- Remarks inin ture,
OF
Preclean Trichioro- Hot solvent. ethylene
2 Clean Trichloro-ethylene 1 180±5 Soak in hot solvent.
1 Ambient Place in ambient sol-vent. Repeat cycle 10 times. Ambient solvent not to ex-ceed 85°F.
3 Dry Oven 150 250±10 For Bourdon tubes. 150 180±10 For pressure trans-
ducers.
The cleaning procedure in practice at NASA Lewis Research Center involves
exposure of the pressure cavity to a cleaning solution to remove any hydro-
carbon, removal of the cleaning solution with a more volatile solvent and
drying with inert nitrogen gas.
A typical programmed cycle is as follows:
1. Transducers evacuated for 5 minutes to about 50 microns.
2. Trichloroethane (NA500) is sprayed into transducer.
3. Trichloroethane is released and transducers evacuated for 5. minutes.
4. Spray and evacuation is performed 5 times ending with a 6-minute evacuation to 50 microns.
5. Trichlorotriflouroethane (FREON, NASA Spec. No. 237A) is sprayed into transducer, released and evacuated for 5 minutes to 50 microns.
6. Rinse sequence (No. 5) repeated ,, 5 times ending with 6-minute evacuation.
7. Evacuation broken with dry nitrogen gas.
8. Transducers:capped and sealed in plastic bag.
26
5. PRESSURE TAP CONNECTIONS
Making accurate pressure measurements depends not only on instrument
selection, but also on properly designed tap geometry, interconnecting line
size, and location.
When making measurements where a liquid-gas interface will occur, as in
a liquid oxygen differential pressure liquid-level gage, the location of the
pressure tap line is very important. The problem of pulsations in pressure
• tap lines where a vapor-liquid interface can occur has been discused in
section 2.
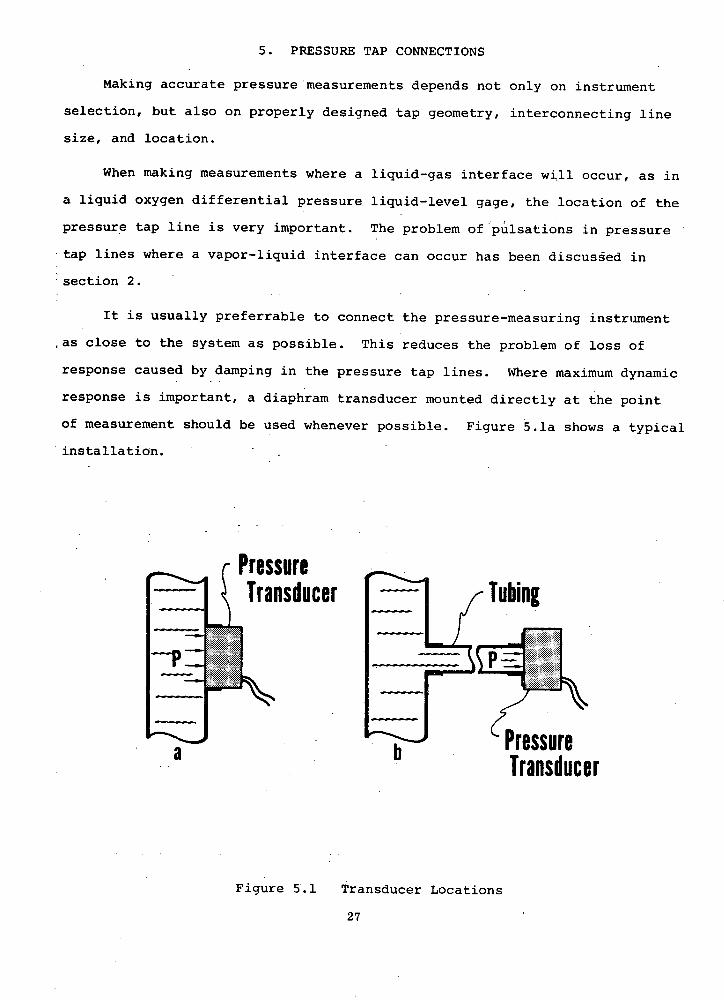
It is usually preferrable to connect the pressure-measuring instrument
,as close to the system as possible. This reduces the problem of loss of
response caused by damping in the pressure tap lines. Where maximum dynamic
response is important, a diaphram transducer mounted directly at the point
of measurement should be used whenever possible. Figure 5.1a shows a typical
installation. -
::::Zj- • Pressure • Transducer
Figure 5.1 Transducer Locations
27
There are many applications where the instrument must be located some
distance from the system; therefore, the interconnecting line becomes an
important part of the measuring instrumentation. In dynamic systems where
frequency response is important and the transducer cannot be mounted at the
system, the interconnecting line should be large. ASME 2 ' recommends 1/2 in.
pipe for these installations and 1/4 in. O.D. tubing where dynamic affects
are not important. Figure 5.1b shows a typicai.installation. In either
case the length of the line should be as short as possible. In most appli-
cations a compromise must be made on the line size, particularly when cryo-
genic oxygen is in the system in which the pressure is being measured.
Large line sizes may introduce intolerably high heat leak into the system
and may even change the local pressure being measured. The requirement to
keep the instruments in a warm environment may require long pressure tap
lines also. Hord [G481 has developed some simplified equations for pre-
dicting the response to step inputs in pneumatic systems. His analysis
covers the three, flow regimes of free molecular, transition, and continuum.
Hord defines the flow regimes as:
Free molecular flow: (K > 0.5)
Continuum (viscous) flow (K< 0.005).
The mean free path (in cm) is given by -
= 8.6 ([2/P) (T/M)1"2
where it is in poise, P is in torr, and T is in Kelvins. A summary of the
applications of Hord's equations is given in table 5.1 and the equations
follow the table. These equations can be used to calculate the time
required for 66-2/3% of a step change in pressure to be measured at the
transducer.
28
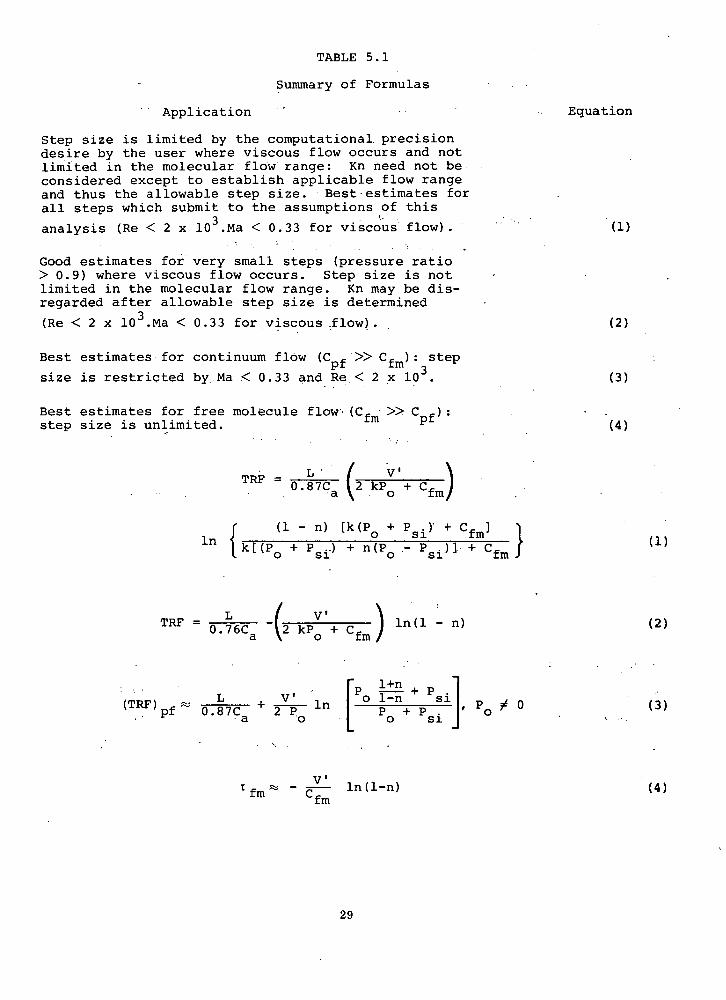
TABLE 5.1
Summary of Formulas
Application Equation
Step size is limited by the computational. precision desire by the user where viscous flow occurs and not limited in the molecular flow range: Kn need not be. considered except to establish applicable flow range and thus the allowable step size. Best-estimates for all steps which submit to the assumptions of this
analysis (Re < 2 x 10 3 .Ma < 0.33 for viscous flow). (1)
Good estimates for very small steps (pressure ratio > 0.9) where viscous flow occurs. Step size is not - limited in the molecular flow range. Kn may be dis-regarded after allowable step size is determined
(Re < 2 x 10 3 .Ma < 0.33 for viscous ilow). (2)
Best estimates for continuum flOw (C f >> C f ): step
size is restricted by . Ma <0.33 and Re . < 2 x 10 . (3)
Best estimates for free molecule flow-,(C f m •>> C step size is unlimited. (4)
• L fv - ' TRF -' 0.87Ca k2 kP0 + Cf
S ln {
(1 - [k (P 0 + P i ) + Cf]
k[(P + P .) + n(P •- P )] + C (1) 0 51 0 Si fmi
TRF = 0.76C -(2 kP+ C ) ln(l - n) (2) a o fm
IP l+fl +p 1 (TRF)pf 0•7Ca + 2v;0 ln L_° P0 0 • (3)
t fm
- Y VI __ ln(l-n) (4) fm
29

Where:
Kn = Knudsen number (aX/D)
X = Mean free path of gas
= viscosity
P = absolute pressure
T = absolute temperature
M = molecular weight
D = Inside diameter of transmitting tube
Re = Reynolds number
Ma = Mach number (a gas velocity/acoustic velocity)
C = Tube conductance in the viscous (Poiseuille) flow p
regime [ a4
(,t/128) CD L) (/t)]
P = Arithmetic mean pressure in the transmitting tube
h = Viscosity defined in terms of force [typical units
are lbf.5/ft2]
TRF = A time-response function which predicts the time required for a physical system to attain a fraction of the applied step input.
L = Effective length of transmitting tubing
Ca = Adiabatic acoustic velocity in gas in free space
= Apparent volume of pressure-measuring system (a transducer volume + 0.5 tubing volume)
k .= Term in flow equation, treated as constant
[ a (7/128) ( D 4 /2611) J
= Absolute pressure of fluid at open end of tubing
Cfm = Tube conductance in the free molecule flow regime
a (D 3/6L) (2itRT'2]
n = A fraction of the applied pressure step, commonly taken as 1-1/e=0.632
= Absolute pressure of fluid at the sensor when time zero
T fm= Time constant [the time constant is defined as the
amplitude-invariant parameter of a physical system which predicts the time required for the system to attain (1-1/e) of an applied step perturbation; the time-dependent behavior of the system must be describable by a first order, linear, ordinary differential equation with constant coefficients]
30
Each installation will require a critical analysis and decisions made on the
best overall combination taking into account the required frequency response,
heat leak, instrument environmental requirements, etc.
In a dynamic system the pressure tap hole must be made with a great
deal of care. ASMEIG21 recommends that the diameter of the pressure tap hole
be as small as practicable but not exceed 1/16 in. The length of the hole
should be 2-1/2 times the tap hole diameter. The edge of the hole must be
free of burrs and be square. Rayle 471 has experimentally determined the
effect of hole size and configuration on pressure measurement errors. Figure
5.2 shows the effect of hole diameter, and figure 5.3 shows the effect of
several different possible hole configurations. The errors shown are percent
of dynamic head. It can be readily seen from these figures that in high -
velocity flow, poor pressure tap fabrication can lead to very large errors.
Rayle also determined that a burr on the edge of the hole can cause errors
of 15 to 20 percent of the dynamic head. Rayle suggests that "sharp edge
holes can best be produced by removing the burr in three or four steps,
alternately working at the tap wall and the main bore wall, finishing with
a final smoothing of the main bore."
31

L2 0 4 LLJ Io
C,
4. Z
cr Ui. Ui ir
C/). U, Ui Cr a.
0
HOLE SIZE, in
Figure 5. 2 Pressure taps and the
effect of hole size.
Reference Form
+0.2%+03%'
—T) I
FR D+0.9% S4
+.I% +0.4%'
4 1I*D*O -0.5%
5o
Figure 5. 3 Pressure taps and the effect of hole geometry.
32
6. TRANSDUCER TYPES AND DESCRIPTION
6.1 MANOMETERS
Manometers measure pressure by the balance of a column of liquid. Since
the density and height of the liquid column can be determined very accurately,
the manometer has become known as a primary standard pressure gage. This
type of instrument can be used to measure gage (including vacuum), differential,
atmospheric, or absolute pressure.
The most commonly used liquids for manometers are mercury and water
since they are readily available and their physical properties are known.
Other liquids are also used such as carbon tetrachloride and tetrabromo-
ethane. They all have in common low vapor pressures, insolubility, and other
favorable properties.
The densities (at 20°C) for manometer fluids are listed below'321.
Table 6.11 Manometer Fluid Densities
_3* g cm
Water 1.000
Carbon tetrachloride 1.594
Tetrabromo-ethane 2.953
Mercury 13.543
Four popular manometer systems and governing equations are schematically
shown in Figures 6.11 - 6.14. Others such as the ring-balance, liquid-sealed
bell (absolute and differential type), and the double-bell differential
manometer, etc., are not shown but are in limited use.
* g cm-3 = 0.03613 lb in-3 .
33
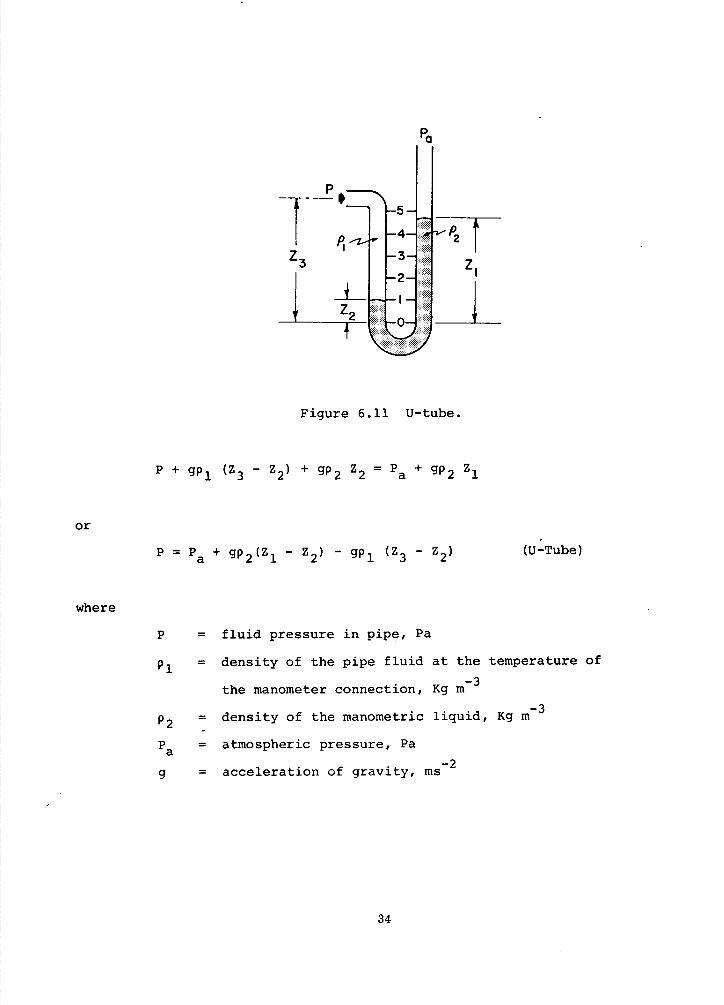
ZI
Pa
Figure 6.11 U-tube.
P + 9p 1 (Z 3 - Z 2 ) + 9p2 Z 2 = Pa + 9p2 z1
P = Pa + gp 2 (Z 1 - Z 2 ) - gp 1 (Z 3 - Z 2 ) (U-Tube)
or
where
P = fluid pressure in pipe, Pa
P1 = density of the pipe fluid at the temperature of
the manometer connection, Kg m- 3
= density of the manometric liquid, Kg
= atmospheric pressure, Pa
g = acceleration of gravity, ms- 2
34

r
FLOW F; \..L-...__ P I
Figure 6.12 Differential.
+ (Z 3 - Z 2 ) gp 1 + Z 2 gp3
= P2 + (Z 3 - Z1 ) gp 2 + z 1 gp3
or
P1 - P2 = (Z 1 - Z 2 ) gp 3 + (Z 3 - Z 1 ) gp 2 - (Z 3 - Z 2 ) gp1
If (p 2 - p 1 ) (Z 3 - Z 1 ) is small compared with (P3'- p 1 ) (Z 2 - Z 1 ), then
= P - P2 g(Z1 - Z 2 ) ( p 3 - p 1 ) (Differential Manometer)
35
\

pa
Figure 6.13 Cistern.
P = P a + Z 1 gp - Z 3 gp 1 (Cistern Manometer)
Figure 6.14 Inclined.
or for an inclined manometer
P = P a + Z 1 9p 2 Z 3 gp1
36
since
Z1 = L sin 0
P = P a + 9p 2 L sin 0 - Z 3 gp , (Inclined Manometer)
To obtain reproducible results it is necessary that the manometer fluid
be precision clean. If precautionary measures such as those described in
references Ma8, Mall, ardMal3 are followed,, the initial calibration will
remain essentially unchanged for months. The meniscus with its problem of
adhesion to the manometer tube is accentuated as the ratio of liquid sur-
face to volume increases[Ma9 , Mall] is therefore desirable to minimize
the total effect by using large-bore manometer tubes 21 . For example,
the capillary error for a 4 mm tube using mercury is approximately 2 mm
and is reduced by a factor of 'ten if the bore is increased from 4 to 12 mm.
For tubes of approximately 1.27 cm or larger effects of capillarity are
insignificant.Before making a reading from any liquid manometer, it is
always advisable to tap the column first. This will allow the meniscus
to reach a position of least distortion 'in the column. It is therefore
quite often that vibration ,in a manometer system if helpful.
Correction for deviation from standard temperature and gravity must
be made in a system since' these quantities are directly proportional to the
height of the fluid column. Also, if the uncertainty in pressure measure-
ment for a mercury manometer should be held to 0.01 percent, the mercury
temperature must be known within ±0.60c[M31.
Table 6.12 lists the boiling point (C) and vapor pressure (mm Hg @ 20C)
for some fluids commonly found in liquid manometers.
37
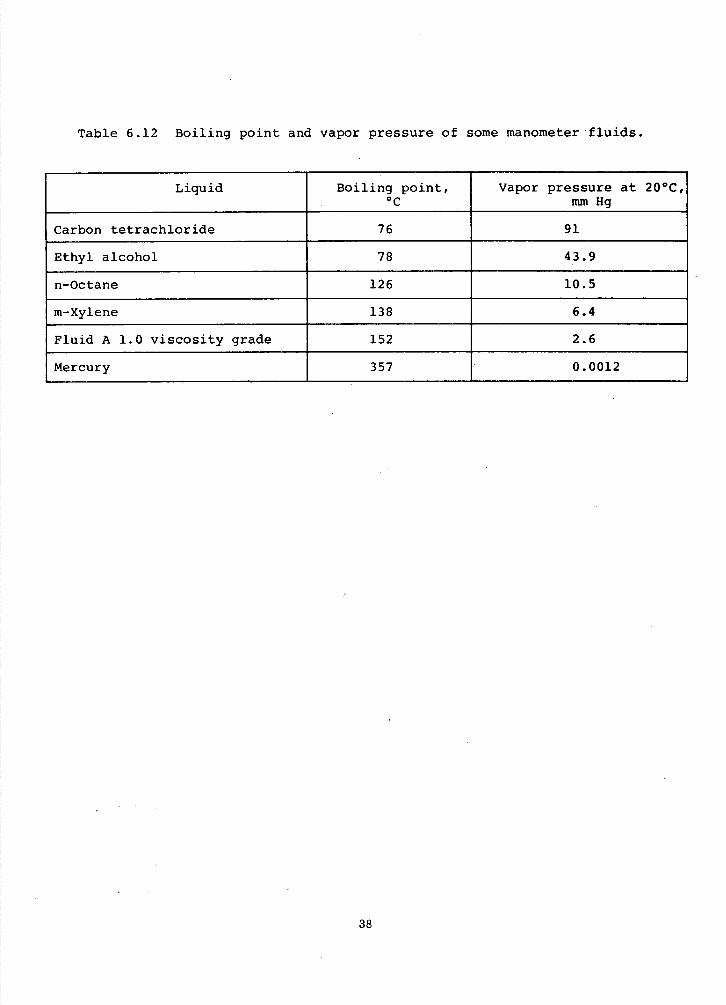
Table 6.12 Boiling point and vapor pressure of some manometer fluids.
Liquid Boiling point, Vapor pressure at 20°C, mmHg
Carbon tetrachloride 76 91
Ethyl alcohol 78 43.9
n-Octane 126 10.5
m-Xylene 138 6.4
Fluid A 1.0 viscosity grade 152 2.6
Mercury 357 0.0012
38
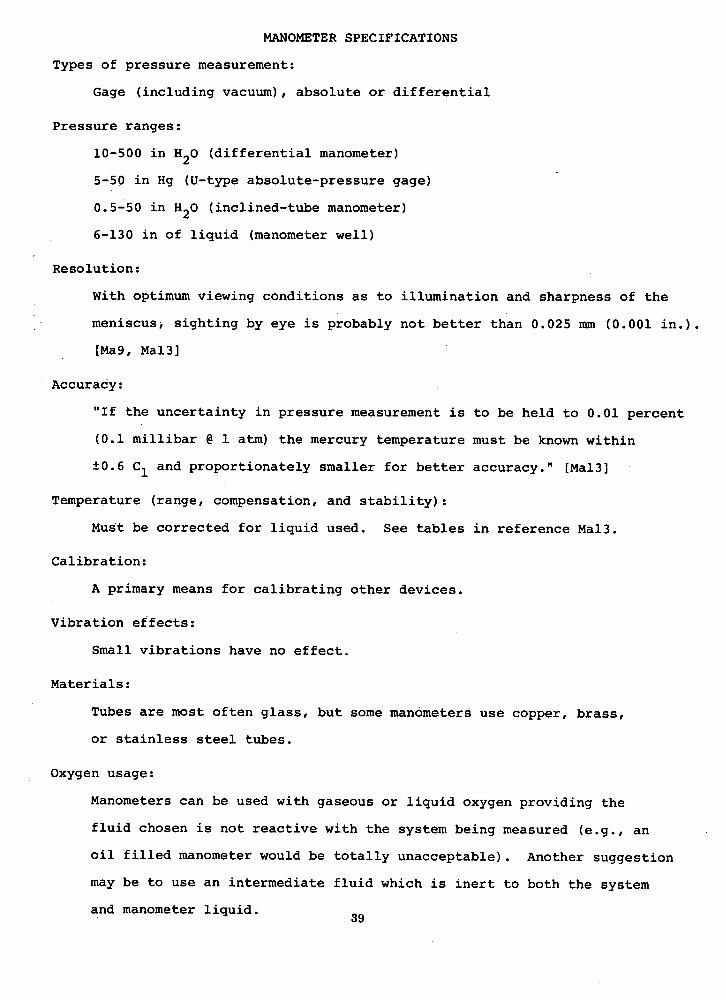
MANOMETER SPECIFICATIONS
Types of pressure measurement:
Gage (including vacuum), absolute or differential
Pressure ranges:
10-500 in H 20 (differential manometer)
5-50 in Hg (U-type absolute-pressure gage)
0.5-50 in H20 (inclined-tube manometer)
6-130 in of liquid (manometer well)
Resolution:
With optimum viewing conditions as to illumination and sharpness of the
meniscus, sighting by eye is probably not better than 0.025 mm (0.001 in.).
[Ma9, Ma13]
Accuracy:
"If the uncertainty in pressure measurement is to be held to 0.01 percent
(0.1 millibar @ 1 atm) the mercury temperature must be known within
±0.6 C1 and proportionately smaller for better accuracy." [Mal3]
Temperature (range, compensation, and stability):
Must be corrected for liquid used. See tables in reference Mal3.
Calibration:
A primary means for calibrating other devices.
Vibration effects:
Small vibrations have no effect.
Materials:
Tubes are most often glass, but some manometers use copper, brass,
or stainless steel tubes.
Oxygen usage:
Manometers can be used with gaseous or liquid oxygen providing the
fluid chosen is not reactive with the system being measured (e.g., an
oil filled manometer would be totally unacceptable). Another suggestion
may be to use an intermediate fluid which is inert to both the system
and manometer liquid.39
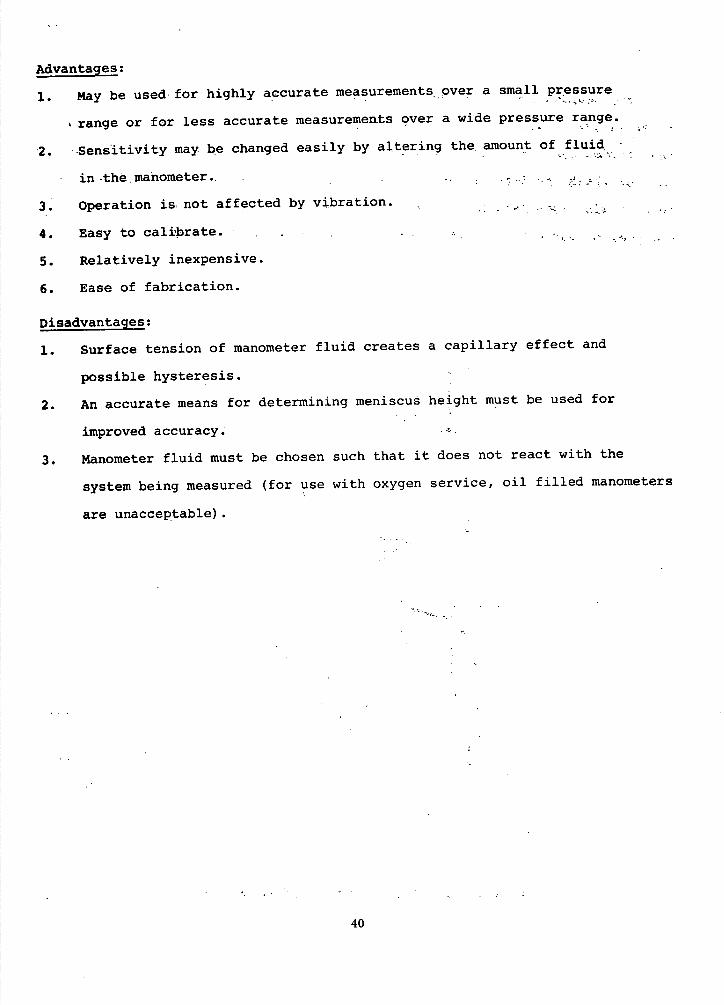
Advantages:
1. May be used for highly accurate measurements, over a small pressure
range or for less accurate measuremerLtS over a wide pressure range.
2. Sensitivity may be changed easily by altering the amount of fluid,
in-the.manoxneter..
3. Operation is not affected by vibration.
4. Easy to calibrate. S '55
5. Relatively inexpensive.
6. Ease of fabrication.
Disadvantages:
1. Surface tension of manometer fluid creates a capillary effect and
possible hysteresis.
2. An accurate means for determining meniscus height must be used for
improved accuracy. S
3. Manometer fluid must be chosen such that it does not react with the
system being measured (for use with oxygen service, oil filled manometers
are unacceptable).
40

TWISTED TUBE
6.2 BOURDON TUBE
The Bourdon tube gage and manometer are the two most prevalent gage
types in use today. The design and fabrication of such a device,, utilizing
the Bourdon tube principle, involve a relatively small number of considerations,
most of which are familiar to designers. The mathematical relationships be-
tween design considerations, however, can be extremely complex. Typical
examples of basic Bourdon tube design are shown below in Figure 6.21.
(L • _
TUBE CROSS-SECTION
Fiud Pivot Paint
I).)
• P
Figure 6.21 Bourdon tube configurations.
41
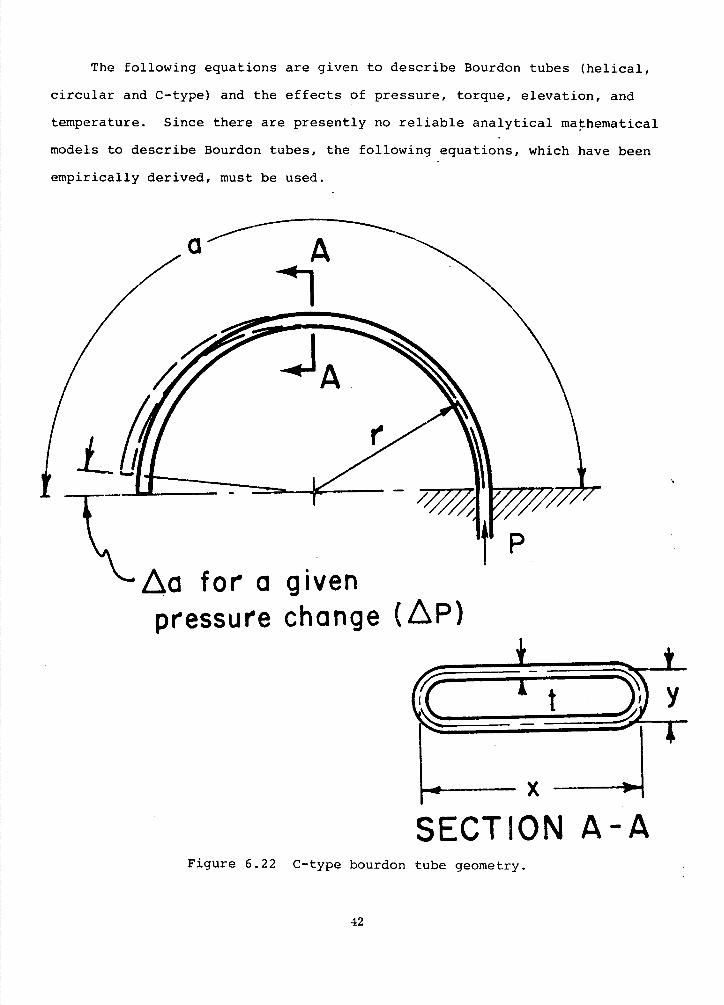
The following equations are given to describe Bourdon tubes (helical,
circular and C-type) and the effects of pressure, torque, elevation, and
temperature. Since there are presently no reliable analytical mathematical
models to describe Bourdon tubes, the following equations, which have been
empirically derived, must be used.
LU lvi U 'IVII pressure change (LP)
x—SECTION A-A
Figure 6.22 C-type bourdon tube geometry.
42

The deflection of a Bourdon tube is given by [Gl]
b c1
a=Kf[() () (./)j
where
Aa = Deflection of element tip, deg
K = Empirical constant
a = Total angle subtended by Bourdon tube before pressurization, deg.
P = Pressure difference between inside and outside of tube, psi
E = Modulus of elasticity
x,y = Cross-sectional length and width of tube, in.
t = Thickness of tube, in.
r = Element radius of curvature (C-type elements r = const.
Spiral type elements r = variable).
By conducting tests on a number of Bourdon tubes it was found that
AaI 'a \b(xy
= K(
The constants K, a, b, and c are found by laboratory tests on elements.
For a flat cross-sectional tube (as shown in Fig. 6.22) the following
equation was determined. -
.20 0.33 3.00 1a=0.O5()0
() ()
The power rating of a Bourdon element (which is useful for mechanism
design) is given by
WFD
where F Force acting on element tip, parallel to direction of motion.
D = Displacement of tip, parallel to motion, in.
W = Power factor of element.
43
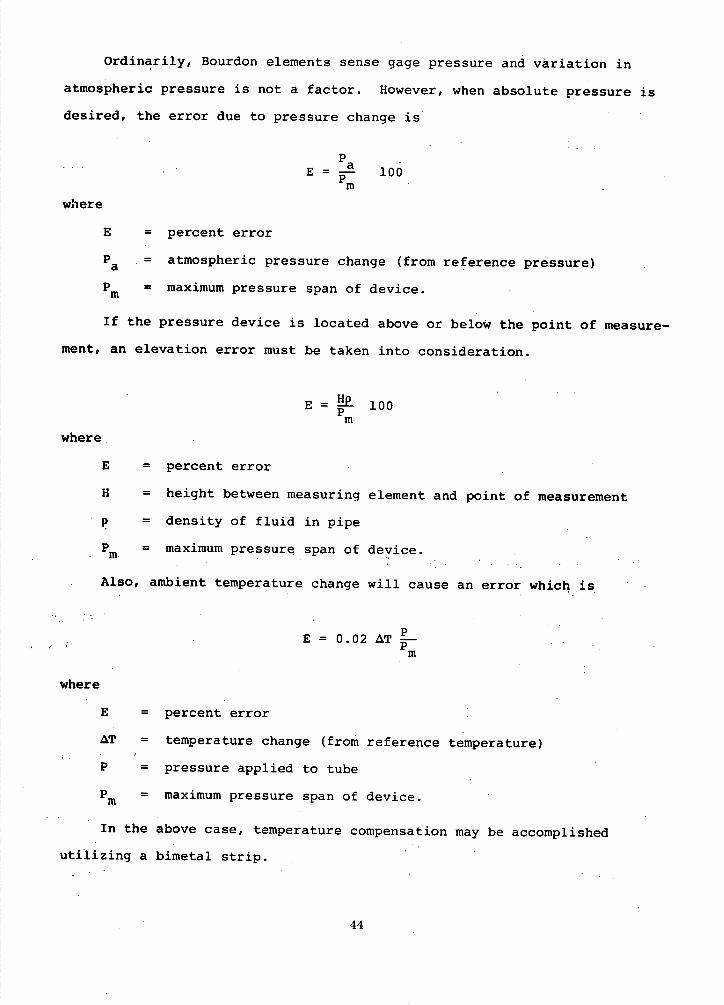
Ordinarily, Bourdon elements sense gage pressure and variation in
atmospheric pressure is not a factor. However, when absolute pressure is
desired, the error due to pressure change is
P E j - lOó
where
E = percent error
= atmospheric pressure change (from reference pressure)
P = maximum pressure span of device.
If the pressure device is located above or below the point of measure-
ment, an elevation error must be taken into consideration.
E = 100
where
E = percent error
H = height between measuring element and point of measurement
P = density of fluid in pipe
= maximum pressure span of device.
Also, ambient temperature change will cause an error which is
E = 0.02T_-m
where
E = percent error
AT = temperature change (from reference temperature)
P = pressure applied to tube
= maximum pressure span of device.
In the above case, temperature compensation may be accomplished
utilizing a bimetal strip.
44

The material chosen to fabricate a Bourdon tube will relate to the
instrument's sensitivity, range, accuracy and precision. Some of those
used are [Gl]
Group I (strain-hardened alloys)
1) cartridge brass (70 Cu - 30 Zn)
2) Trumpet brass (80 Cu - 20 Zn)
3) Phosphor bronze
4) Silicon bronze
5) Austenitic stainless steel
(AISI Types 304 and 316) -
Group II' (Precipitation-hardened alloys)
1) Beryllium copper
Group III (Heat-treated alloys-quenched and drawn)
1) Low-alloy steels
2) Martensitic stainless steel (AISI Type 403).
The C-type Bourdon tube (shown in Figure 6.22) is oval and curved
through anarc of approximately 200-300 degrees [03] . Fuséd quartz is also
being used for helical Bourdon tubes. Fabricated from this material the,
instrument has less hysteresis, creep, and'relaxation than ny other material
known. - .. ..
Bourdon gages are used in making pressure (including vacuum), compound,
and differential-pressure measurements. If the case of the gage is pressuriz-
ed (for differential measurements) a clean transparent gas or fluid must be
used to permit readability of the dial and prevent deterioration of gears
and bearings. An alternate form of differential-pressure gage uses two
Bourdon tubes arranged such that the motion of one subtracts from the other.
The Bourdon tube is a special type of cantilever spring and the , path
of the tip deflection is also similar. Mathematical models for cantilevered
springs have also been used for Bourdon tubes with . good agreement. A,
typical mechanical arrangement most commonly used for Bourdon tube devices
is shown in Figure 6.21.
45

Another more complicated and versatile system illustrated in Figure
6.23, is used primarily in conjunction with a recorder and may be in the
form of a spinal or helix. The optical transducer shown uses a helical
Bourdon tube providing high sensitivity, resolution, and repeatability. In
operation, the deflection of the pressurized (P) tube goes through an angle
e and is followed by the photocell until the microammeter is nulled. In
this zero position the digital counter reading is multiplied by a scale factor
to determine the pressure. In some instances, for the gages mentioned, an
absolute pressure measurement can be made by evacuation of the capsule
external to the Bourdon tube.
Another application of the Bourdon tube to detect pressure utilizes a
potentiometric transducer. A device of this type is coupled to a Bourdon
tube via mechanical linkage, and as the system is stressed, the tip deflects
causing the potentiometer to change position. This produces a change in
resistance which varies as a function of the applied pressure. The advantage
of this arrangement allows for remote pressure monitoring.
Bourdon gages can be used at high pressures (to approx. 100,000 psi) and
with flammable gases or liquids. Therefore, gage safety should be considered
in the event of rupture EBo4] Gage types from several manufacturers range
from those with no safety features to those with hinged blowout backs and
specific mounting instructions.
46

P
Helical Bourdon Tube
Photocell and Mirror ci Light Source
Null Meter
'il-ill
elf"% :11
Counter (
Figure 6.23 Optical pressure transducer utilizing a helical bourdon tube.
47
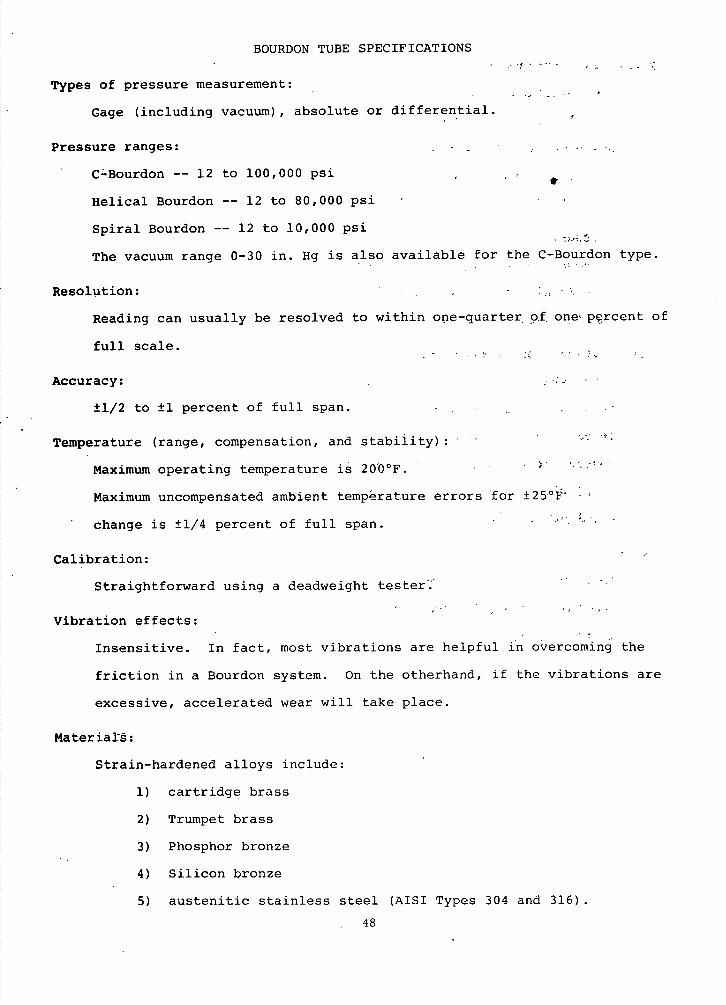
BOURDON TUBE SPECIFICATIONS
Types of pressure measurement:
Gage (including vacuum), absolute or differential.
Pressure ranges: V V -
, V
C-Bourdon -- 12 to 100,000 psi V
V
Helical Bourdon -- 12 to 80,000 psi V
Spiral Bourdon -- 12 to 10,000 psi
The vacuum range 0-30 in. Hg is also available for the C-Bourdon type.
Resolution: V
Reading can usually be resolved to within one-quarter , of. oneS percent of
full scale.V
Accuracy: V V
V V
±1/2 to ±1 percent of full span.V
V
V
Temperature (range, compensation, and stability): VV
Maximum operating temperature is 20VOOF . V
Maximum uncompensated ambient temprature errors 'for ±25°
change is ±1/4 percent of full span. V
V V
Calibration:
Straightforward using a deadweight tester.'
Vibration effects:-
Insensitive. In fact, most vibrations are helpful in overcoming the
friction in a Bourdon system. On the otherhand, if the vibrations are
excessive, accelerated wear will take place.
MateriaTh:
Strain-hardened alloys include:V
1) cartridge brass
2) Trumpet brass
3) Phosphor bronze
4) Silicon bronze
5) austenitic stainless steel (AISI Types 304 and 316)
V 48

Materials (continued):
Precipitation hardened alloys include:
1) Beryllium copper
Heat-treated alloys - quenched and drawn include:
1) Low-alloy steels
2) Martensitic stainless steels (AISI Type 403).
Oxygen usage:
Gaseous 0 2-yes; liquid 02 -no (for the case where the liquid would
come in direct contact with the gage). The Bourdon tube and-linkages-
should always be at room temperature.
Installation requirements and limitations:
Gages should be installed vertically in a position where the
temperature is, as nearly as possible, 68°F.
In case of gages with pipes filled with liquid, it is often more
convenient to have the gage pipe connection installed at a definite
level with respect to apparatus in test, in order to simplify or
eliminate the correction for liquid in pipes for pressure measurement.
Remarks:.
This type of gage is generally not used for pressure monitoring
remotely. Also, the gage is bulky which puts limitations on the
installation.
49
Advantages:
1. Simple mechanism.
2. Several pressure ranges available.
3. Costly electronics are not required.
4. Can be used to make or break electrical contacts, tip toggle switches,
or drive self-synchronous meters for remote-reading indicators.
5. Also used with strain, capacitance, magnetic, and other electrical
systems.
Disadvantages:
1. Space limitations.
2. Limited pressure range.
3. Power or energy to operate related mechanism must be supplied by
the tube.
4. Friction (rolling or sliding friction results in a system lag).
5. Slow response to pressure changes.
6. Inherent hysteresis.
50

P
6.3 DIAPHRAGM
Diaphragm-type gages are most often used to measure low-pressure
(including vacuum) from ranges of 0 to 0.2 in water and 0 to 30 psi. Dia-
phragm gages are used to measure low-pressure absolute, draft, liquid-level,
and differential. Some applications require that the diaphragm element be
able to withstand high pressures and remain within its elastic limit. Such
a diaphragm mightbe fabricated from a full hard, cold-rolled nickel,
chromium, or iron alloy, which can have an elastic limit above 80,000 psi and
be used to 8000FE'
The three most common types of diaphragms are shown in Figure 6.31.
FLAT CORRUGATED CAPSULE
P
Figure 6.31 Basic diaphragm types.
51

Many gages use diaphragms in conjunction with other methods for mea-
suring pressure. That is, a diaphragm may be used as a force-summing device
and coupled to a resistance strain gage, capacitive system, or LVDT (linear
variable differential transformer). Devices such as these will be covered
in other sections. Only diaphragm gages which are mechanically coupled to
an indicator for pressure measurement will be covered. The pressure gage
shown in Figure 6.32 is a typical example of how most diaphragms operate.
/
//\ SCALE
FIXED POINT
SEAL-.... I - SLACK DIAPHRAGM
PRESSURE CONNECTIONS
SPRING
Figure 6.32 Slack diaphragm pressure gage.
52
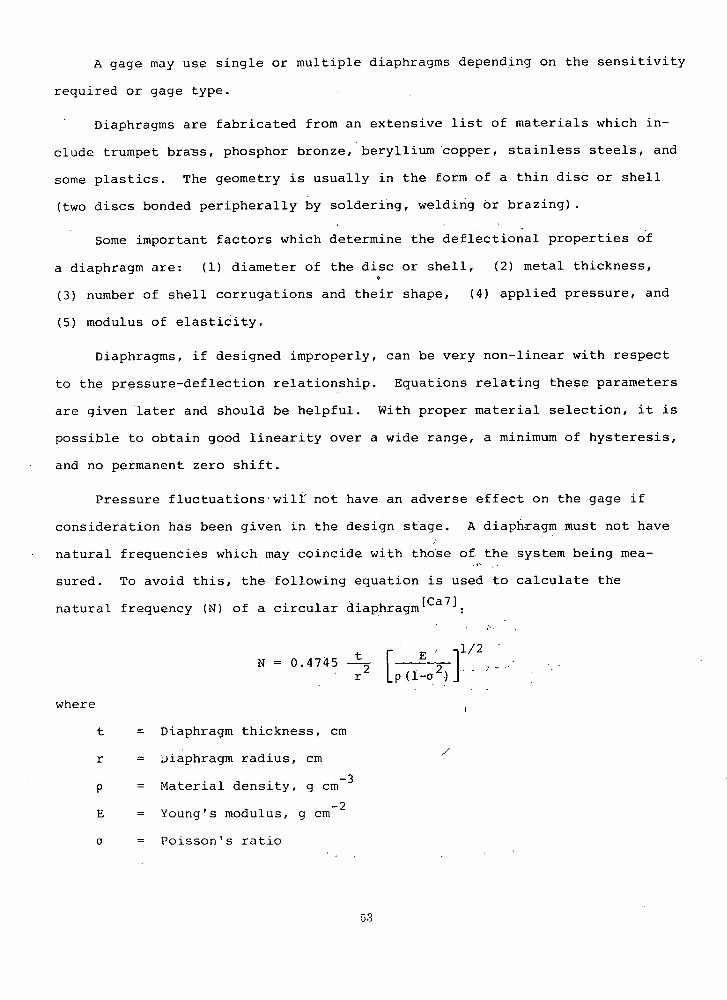
A gage may use single or multiple diaphragms depending on the sensitivity
required or gage type.
Diaphragms are fabricated from an extensive list of materials which in-
dude trumpet brass, phosphor bronze, beryllium copper, stainless steels, and
some plastics. The geometry is usually in the form of a thin disc or shell
(two discs bonded peripherally by soldering, welding or brazing)
Some important factors which determine the deflectional properties of
a diaphragm are: (1) diameter of the disc or shell, (2) metal thickness,
(3) number of shell corrugations and their shape, (4) applied pressure, and
(5) modulus of elasticity.
Diaphragms, if designed improperly, can be very non-linear with respect
to the pressure-deflection relationship. Equations relating these parameters
are given later and should be helpful. With proper material selection, it is
possible to obtain good linearity over a wide range, a minimum of hysteresis,
and no permanent zero shift.
Pressure fluctuations wilr not have an adverse effect on the gage if
consideration has been given in the design stage. A diaphragm must not have
natural frequencies which may coincide with those of the system being mea-
sured. To avoid this, the following equation is used to calculate the
natural frequency (N) of a circular diaphragmt71:
Ip E l/2
N=O.4745— 2
r (I-o)
where
t = Diaphragm thickness, cm
r = Diaphragm radius, cm
P = Material density, g cm -3
E = Young's modulus, g crn2
U = Poisson's ratio
53

Example:
For mild steel, E = 2.0 x 10 12, p = 7.8, and a = 0.28. For a diaphragm
of 2.54 cm diameter and 0.0635 cm thicknes the natural frequency is
N = 0.4745 0.0635 r 2.0 10 12
(1.27)2 L7.8 (l_0.282)
1/2
N - 9.853 x 10 Hz
with higher harmonics occurring at 2N, 4N, etc.
A diaphragm gage may be fabricated using either a single disc or pair
of discs peripherally joined to form a capsule. Multiple capsules may also
be combined in a single gage for greater displacements. Factors governing
the choice are gage sensitivity and total displacement needed (range). The
following two formulae give the relationship between pressure and deflection
of diaphragms (disc and corrugated capsule). For most materials the full-
scale deflection of a diaphragm must be less than one-third the diaphragm
thickness to insure a non-linearity of less than 5 percent.
The pressure-deflection equation for a flat diaphragm (with edges
clamped)
16Et4 + 0. 488d 31
= 3r4(1-i2) IE ( ) j
where
P = Pressure difference across diaphragm, psi
E = Young's modulus, psi
t = Diaphragm thickness, in
= Poisson's ratio
r = Active diaphragm radius, in
d = Deflection at center of diaphragm, in
54
If one designs to maintain linearity at less than 5 percent the term
is negligible compared with ( ). The pressure deflection equation
then reduces to
= l6Et'd
3r4t(1-F12)
or
d = 0.1875 Pr (1-t2) Et
The pressure-deflection relationship for a corrugated capsule diaphragm
is given by the following equation
d = KN(P-P 0 )DXtY
where
P = Applied pressure, psig
P = Initial pressure, psig
K = Capsule constant including Young's modulus of
elasticity and corrugation design (see Table 6.31)
t = Diaphragm shell thickness, in
D = Active diameter of diaphragm shell, in
d = Deflection at center of capsule, in
N = Number of capsules
x,y = exponent constants
A formula which has been found satisfactory for a capsule of common
design is
d = KN(P-P 0 )t"5D4
It must be noted from the above equation that the diaphragm deflection
is dependent on the diameter to the fourth power. Or, for the same pressure
55

change and doubling the diameter, an increased diaphragm deflection of
sixteen times may be obtained.
The values of E and K are listed below for some commonly used diaphragm
materials. -.
Table 6.31 E and K values for commonly used materials.
Material E,psi Capsule Constant K
Phosphor bronze 16 x 10 0.2,4 x 10- 6
Beryllium copper 20 x 106 0.19.x 10- 6
Type 316 stainless steel •28 x 106 0.14 x 10⁶
56
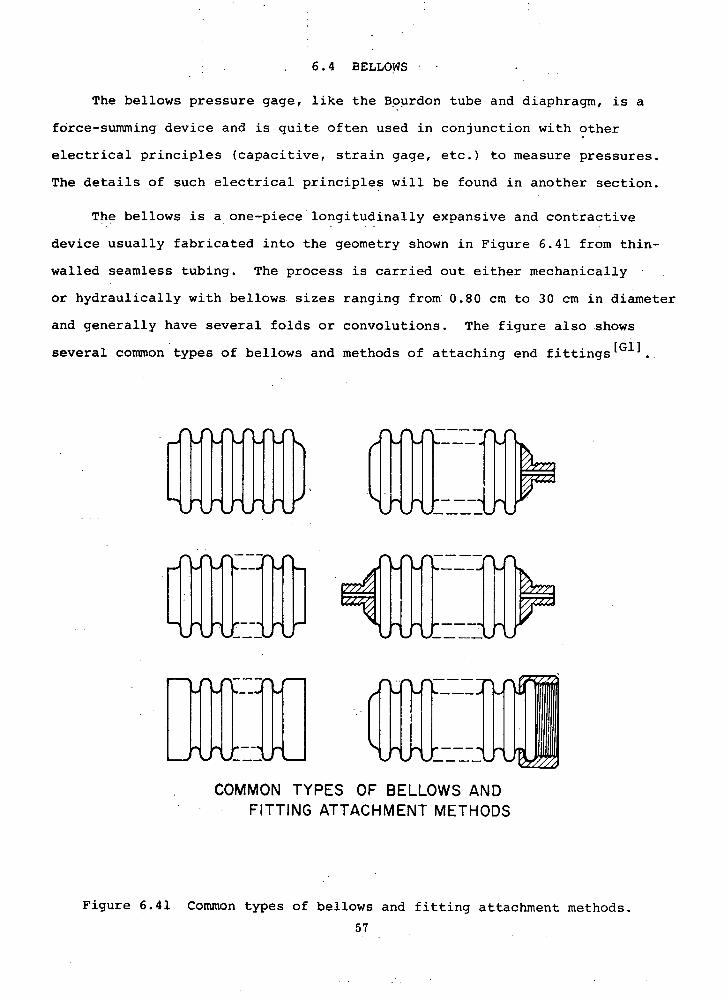
6.4 BELLOWS
The bellows pressure gage, like the Bourdori tube and diaphragm, is a
force-summing device and is quite often used in conjunction with other
electrical principles (capacitive, strain gage, etc.) to measure pressures.
The details of such electrical principles will be found in another section.
The bellows is a one-piece longitudinally expansive and contractive
device usually fabricated into the geometry shown in Figure 6.41 from thin-
walled seamless tubing. The process is carried out either mechanically
or hydraulically with bellows sizes ranging from 0.80 cm to 30 cm in diameter
and generally have several folds or convolutions. The figure also shows
several common types of bellows and methods of attaching end fittings.
mi
El COMMON TYPES OF BELLOWS AND
FITTING ATTACHMENT METHODS
Figure 6.41 Common types of bellows and fitting attachment methods.
57

Trumpet brass, stainless steels, phosphor bronze, and beryllium copper
are among the most popular materials chosen for bellows fabrication. Material
selection is generally based on the corrosiveness of the bellows environment
and, secondly, the sensitivity required.
Bellows gages are low pressure measuring devices such as the diaphragm
gages. They can measure gage pressure (including vacuum), differential,
absolute, and compound. The arrangement shown in Figure 6.42 illustrates
how the bellows can be installed in a gage for differential pressure mea-
surement. P 2 may also be vented to the atmosphere for gage pressure mea-
surements.
INDICATORSCALE
0
0
p tCONNECTING LINK 2
SEAL
CASE-44 --I-BELLOWS
" SPRING P1
Figure 6.42 Bellows gage for measuring differential pressure.
58

LOW HIGH
Pp
TEMPERATURE COMPENSATION BELLOWS
a-LOW PRESSURE
BELLOWS
PULSATION DAMPENER
As with other elastic member elements (Bourdon tube and diaphragm)
the bellows follow Hook's law which states, within the elastic limit, that
stress is proportional to strain; or in other words, the displacement of
the bellows is proportional to the applied pressure. A volumetric change
can arise as the bellows temperature changes, and therefore, a second bellows
is sometimes used to compensate for this effect (see Figure 6.43).
LIQUID FILLED
HIGH PRESSURE BELLOWS—
DISPLACEMENT
I ,-TORQUETUBE
SPRING
Figure 6.43 Temperature compensated differential pressure bellows gage.
59

Figure 6.43 not only shows how temperature compensation is made,
but also how bellows can be used in pairs for differential.measurement.
The one illustrated is designed for low-differential-pressure measurement
of high static pressure. Both bellows, including the one for temperature
compensation, are liquid filled. As- high pressure enters the: unit (P2),
the bellows contract and the-liquid is transmitted to the low-pressure
bellows via the connecting passage (with its rate controlled by a pulsation
dampener). The resulting motion to an indicator is made through the use
of a pressure-tight torque tube. A liquid with a low coefficient of thermal
expansion such as a solution of ethylene glycol and water shouldbe used.
Other features such as overrange and over-pressure protection may be in-
corporated into this design.
The following table will be helpful in determining the characteristics
of a single-ply brass bellows 1 . This table covers only a few of the
many sizes available. Also, the maximum stroke stated should not be used
in combination with the maximum pressure stated.
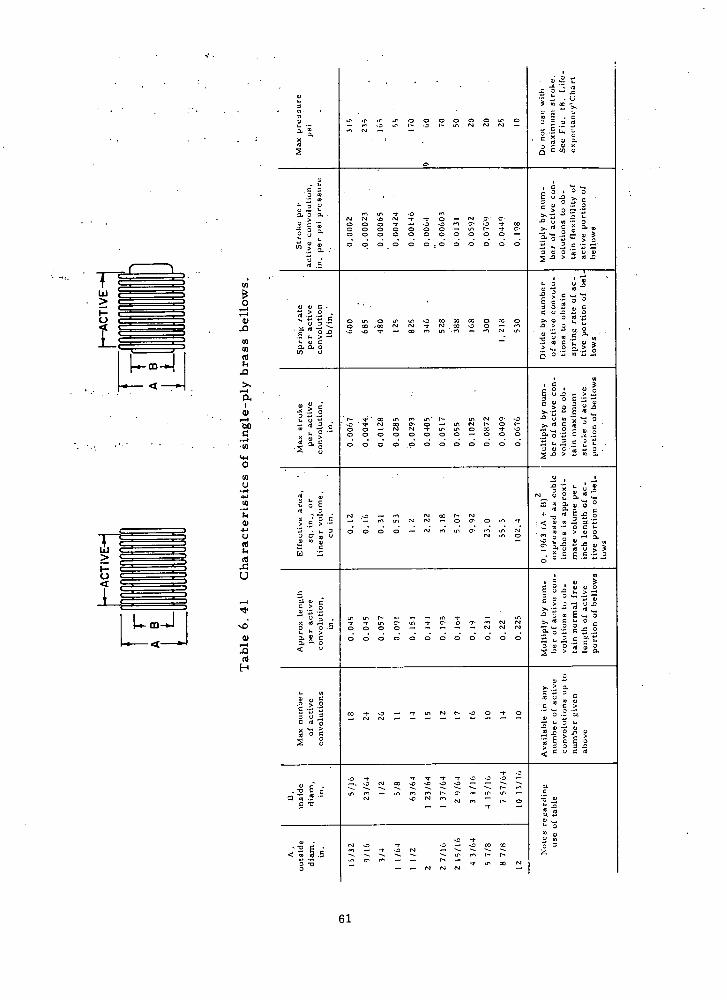
- II
.010.0
.0 3 ,Q 0.0'..0
3. 0 3. . 11 10 '0 0. - ... U > 11
I'J 0
N 0
.3 N 0 10
10 1 - .0
0 - .3 10
N C'. C' .0
0'. ••1 u 0 0
.0 0 0 0 0 0 0 0 0 - Ifl N -t C'. >. 0. Li U
0 0 0 0 0 0 0 0 . 0'. >3 0 000 0 '.0 00000
000gUV
U0I0
U . 0 in 0 it in .0 10 10 10 0 10 0 >'. c, 0U
-0 m.. U
0 10 '0
.10 N 1010100.0-10 N 10 N 10 -.0 0 -In
.0 >
0
0.3.0 > 09> U)U .
I.; 0
0 0 '•".-0 0'. 00 0
1 N 10' 10 ifl CtIn' N In "1 ' . .0 U 0 ". 0 U cc Cd z '. Ct N 10 3 0 - ti N N 0 N 0
.0 0 0 0
0000 N N -I U' In
0000 000 0 10 10 .0 _. .0
IZ 000000000000 - 00C-.0. V .0> .00.
.9.
N
0 0 - N .3 - CC N 10 N NidO. o + 0 .0 o
CCI tI . 0 0 n -t 0 0 0 0 - N 100 3' C In N
0.
-0
.0
003'.
- C) * Id '10 '10
00N 0 III 0' In 1'
'10 0' '.0
- 0" CC N
11 N
U .0 0 0 0. 0 .0 U 3
0 I 0 '. 000 0 N N N
V 300.o0 0.
U CO
a
0..01.0
.0>0dcl .0
E-Z .113.1
0100.0 •.1>
00
<CU Old
InCC-inr10NC'.-0In- C CCI .0 N CC N C
0- .0 -r.0
SIC
• -o - 3
<IC 05
o
CCI CC
.3 -
0'.
'.1' -t .3 CC -
N - - N
.3 -
N - tI N
.0 10
N 10 in
10
N In N
-
3
1• U)
W0 -.
-4 () r' II)
.0
a, a,
.0
-I
00
0
a) 0
-4 a,
ci)
U w
I-.--.WA
L -4
-1 0
61

The deflection equation for a spring-opposed bellows is given by
e K +K b S
where
d = Deflection of bellows, in.
P = Applied pressure, psi.
A = Effective area of bellows,
K: = Force constant of bellows lb in.
-1 K5 = Force constant of restraining spring lb in
Solving the equation for P,
d(Kb + K) Ae
Now, if the bellows assembly must operate an electric switch or some
other mechanism, the equation must reflect this additional force required.
The equation now becomes
F + d (K + K
sb s A
where
F = Force required to actuate the switch or mechanism, lb.
= Deflection required to operate the switch or mechanism, in.
* The effective area of bellows is calculated by
3 - 4c (1 + log 16c2 C + eC) + 2 (log
C)
A7tb2 1+2
c-i
(c 2_1)+ 16c (log c)2 2 e c -1 where
c = A/B (see Table 6.41).
62

100
\
'S'S
'S'S
'S
V V
V
25
C a)
a) 0.
w 0 a: I-C')
X
50
Bellows, if properly designed for, can be cycled for long periods of
time without failure. The graph given in Figure 6.44 will help the designer
to attain maximum life from a set of bellows; as shown if displacement and
pressure can be kept minimal, the expectant bellows life can be well over
1.0 x 10⁸ cycles. It is advantageous to restrict the bellows displacement
is a linear function of pressure and is not for displacements greater than
[G12] 10 percent
V V
V V
5,000
V 10,000
15,000 20,000
• 50,000 - • 100,000 .500,000-- -1,000,000
- l0,000,000\ 100,000,000 \\
• -•---- 'S •••-•••• \
-•-••-- \ '-- '•
503 a: a-
>( 25
X.
ES
0
Figure 6.44 Cyclic life of bellows.
63
Beryllium copper is an excellent material for the construction of
its properties approach those of
bhout damage to the material. After
275°C produced an overall effect
in a tensile strength of 150,000
properties of beryllium copper
are quite superior to those of
bellows, since in the annealed condition
copper. This allowed for fabrication wi
forming, a heat-treatment for 3 hours at
for every point on the bellows resulting
to 180,000 psi. In general, the elastic
bellows, fabricated in the above manner,
other nonferrous materials.
A bellows, especially one which is long in proportion to its diameter,
becomes unstable and tends to buckle when pressure is applied internally
and a load is applied to one end, since each convolution tries to increase
in length. For applications where a long bellows is necessary, a better
design is to apply the pressure externally so that each convolution tends
to shorten and exert a pull upon adjacent convolutions, thus keeping the
bellows straight.
64

6.5 STRAIN
Strain gages of two basic types, either bonded or unbonded, are used
in devices to measure pressure. In both cases however, the principle is the
same. As a wire is elastically stretched, its 'length and diameter are
altered, resulting in a change in its electrical resistance. By using this
basic principle and a force-summing device such as a diaphragm, bellows, or
bourdon tube, the displacement of an elastically strained wire will be pro-
portional to the change in electrical resistance and, thereby, the pressure.
Poisson's ratio is a characteristic of every metal and is given by
= (dr/r)/(dL/L). The volume of a wire is given by the formula V = ' it rL
where
r = Radius of wire.
L = Length of segment.
If we let dv = 0 and differentiate the volume equation, we find that Poisson's
Ratio = -0.5. Actually, Poisson's Ratio for most metals is between -0.25
and -0.30 indicating that dv is not equal to zero and that a decrease of
density occurs with tensile stress.
The gage factor (GF) relates the strain to which a wire has been
subjected, to a change of resistance.
GF - AR/R - __
where
AR = Change in gage resistance.
R = Original gage resistance.
AL = Change in gage length.
L = Original gage length.
Gage factors vary from one type of resistance wire to the next, but the
factor of a given wire is the same whether the gage is used in tension or
compression. For most commonly used strain gage materials, gage factors
range from 2.0 to 5.0. High gage factor materials tend to be more sensitive
65

to temperature and less stable than low gage factor materials (see Table
6.51) [G141
Table 6.51 Gage factor and temperature coefficient for some strain gage materials.
Strain wire Composition
Gage factor (iR/R)/(L/L)
Temperature coefficient of
resistance
80 Ni, 20 Cr 2.0 high
4 Ni, 12 Mn, 84 Cu 0.47 very low
45 Ni, 55 Cu 2.0 negligible
36 Ni, 8 Cr, 0.5 Mo 3.5 high
Ni -12.1 unstable
The most popular strain wire used is 4 Ni, 12 Mn, 84 Cu, but its poor
temperature coefficient limits its use.
Figure 6.51 shows both types of strain gages, bonded and unbonded, and
a simplified schematic of the bridge circuit used in both cases. One or
more legs in the Wheatstone bridge circuit may be active depending on sen-
sitivity or compensation required.
METAL
FF / MEMBER
At
At
fi F /vtKR
T LI N
STRAIN STRAIN WIRE GAGE
UNBONDED BONDED BRIDGE CIRCUIT
eONL1R V 4 R
N = NUMBER OF ACTIVE LEGS
GF LR/R
Figure 6.51 Bonded and unbonded strain gages and assocated circuitry.
66

The bonded strain gage is usually cemented to a metal beam, tube,
diaphragm or other strain sensing element. The adhesion process must be
done carefully and steps taken to insure that all parts of the thin film el
gage are bonded to the sensing element.
The active strain wire (approximately 1 to 1-1/2 mils) is doped to a
sheet of ceramic, paper, or plastic for ease in handling and is removed once
the wire is cemented to the sensing element. There are also strain gages
which have been embedded in thin films of plastic and are epoxied to the
sensing element as a unit. Many different types of strain gages are avail-
able with resistance values ranging from 60 to 5,000 ohms and effective gage
lengths from 1/16 to 6 in. The basic standard gage is approximately 120 ohms
and passes 25 ma of current in a 6-volt bridge circuit.
To select the proper gage for a specific application, several factors
must first be considered. The following is a list of these considerations:
1) Gage factor, maximum.
2) Resistance per unit length, maximum.
3) Temperature coefficient of resistance, minimum.
4) Coefficient of linear expansion, minimum*.
5) Melting point, maximum.
6) Thermoelectric tendency at connection, minimum.
7) Optimum flexibility, ease of soldering, and negligible
hysteresis for complete cycle.
As stated above, it is very important to bond the strain gage to the
sensing member permanently. For use in long-duration applications to 300°F,
a phenolic resin bonded and baked in place is recommended. Commercial strain
gages are generally guaranteed to within ± 1 percent of the stated gage-factor
value and have a resistance tolerance of ± 0.25 percent of the nominal value.
* For cryogenic applications it is advisable to select a gage with an expansivity close to that of the sensing element to maintain the bond during cooling.
67

Unbonded strain gages operate basically the same as bonded ones; how-
ever, the wires do not adhere to any sensing element as such. The resistance
wire itself provides the mechanical link between the sensing element and
ground. Then, as the diaphragm (or whatever sensing element used) is de-
flected, the strain wires are stretched. The general arrangement for an
unbonded strain sensing system incorporates a stationary frame that supports
a moveable armature. Between the moveable armature and frame are wraps of
tensioned strain gage wire which change resistance as the armature is
displaced (see Figure 6.52).
4
DI SPLACEME
Figure 6.52 Typical unbonded strain gage installation.
68

When all four arms of the Wheatstone bridge circuit are active, special
mounting for inactive gages is not necessary. The advantages of using four
active strain gages in the bridge circuit are increased output, high sensi-
tivity and reading accuracy. It is extremely important, however, to com-
pensate the circuit for temperature changes since small changes produce
spurious readings if all four arms of the bridge are not effected alike.
Figure 6.53 illustrates the total circuitry including elements necessary for
calibration and temperature compensation.
Input Rheostat
R
R1
Zero Adjustment Potentiometer
Pad der
R
R
r
L_ I 4 To Indicator
Transducer Or Recorder
Power Supply
Figure 6.53 Electrical circuitry necessary for bonded or unbonded strain gage pressure transducer.
69

A voltage may be held constant across the input to the pressure transducer
with the addition of a positive resistor (r)*. This will cause the calibra-
tion factor (F) to remain constant by decreasing input current for an in-
creased operating temperature. "The voltage on the transducer at
T = 0 is VR/(R + r0 ) and at temperature T is VR/(R + r).
The ratio by which it changes if (R + r0 )/(R + r).
This fraction must correct for the variation of F, or
F0 (l + CT) (R + r)/[R + r0 (1 + aT) = Const.
or
(1 + cT)/(R + r 0 0 + r aT) = Constant =
(1 + cT)/ 1( R + r 0 0 0 )[1 x r aT/(r + r)]}.
For this fraction to be constant,
C = (ra)/(R + r), or r = (cR)/(a-c)
where
F = Calibration factor (iV/V/psig or g)
r = r 0 (l+aT)
a = Temperature difference from reference
c = Temperature coefficient of the calibration factor F,
so that F = F 0 (1 + cT)
V g = Actual voltage on transducer
R = Bridge resistance
Note that the compensating resistor must be at the same temperature
[G15] as the transducer and preferably should be inside it
The compensating resistor should also remain, with minimal heat loss,
thermally stable and at equilibrium with the transducer.
* "The series input resistance may be split into two equal portions, one on each side of the bridge. With this arrangement, temperature errors are reduced in the calibrating resistor method of circuit standardiza-
tion" [G15]
70

Resistor R c shown in Figure 6.53 is for the purpose of calibration (G101
The behavior of an unbonded, temperature compensated, strain gage
pressure transducer is shown in Figure 2.2 ("Cryogenic Pressure Masure-
ment") (G19,G57]• For direct comparison, an uncompensated capacitance
pressure transducer is shown on the same plot. In each case the capacitive
pressure transducer was rezeroed prior to testing at another temperature
and the result was a severe change in sensitivity, indicating the need for
compensation. The zero-shift exhibited by the compensated strain gage
pressure transducer can be simply taken care of by the addition of a resistor
into the zero adjustment circuit (see Ref. GlO,G15).
Table 6.52 will also be helpful in making the decision as to which
method of strain measurement should be used (Bourdon, bellows, etc.).
71

4) bfj Cd
s-I +0 cc ba
$4
4) U
5.' 4-'
4) s-I
4)
'44
0
co
U 4-,
$4 4)
4-, U 5.4
0
In
Cd
'-0
4) 0
0
0 0 0 0 C) 0
0- 0 In 0
— U cd — —0 0
0 4-0
0 +0 L
Z 0 00 0
44N
4) $4 0 0 1ti
In N N — 0-'-' —4
$40 0 + + Q 41 0 0 -'-' p1 4-' 4-'
In 0 00 bO+0 cd sO In cn0"'
U -
tx —4 —4
-H -H -H -H -H
0
00 +00
0 2o 0 0 0
go .20 LflQ 00 4-0In
2o 00 0
IdCd
00 -0 0'.1
InC ('.1 - I In In -4 In
I I
0 4 I I .-4 I I I I 0 0, 00 0 0 00 I
p. Cd bf 4) 4) 4) 4) 0 'C)
0 0 0 0-
0 $4
+0
4)bacd
4)
4)
' ' a)
'C) -
cd .,., 'C) U
bOED
.1.0 cd Cd
,0 0 r-4 bo
(d 0 4) -i-I
V. 0 "4
4-0
cd 5-4
4)
0
U
5-4
0
U
I3
5-I 0
44
4) -4
I
72

Advantages:
1. High accuracy.
2. Minimal change due to temperature differences. System may also
be temperature compensated.
3. Can measure both static and dynamic pressures. For static measure-
ments a stable high gain direct coupled amplifier is needed.
4. May be energized by ac or dc.
5. Low sensitivity to shock and vibration. -
6. Continuous and practically infinite resolution. -
7. Gage and circuitry may be of relatively simple design.
8. Frequency response good (however, piezoelectric or capacitance gages
are better).
Disadvantages:
1. Under severe conditions calibration does not remain stable...-
2. Responds to large vibrations.
3. Low output (higher output may be attained with silicon strain gages,
but with some loss of thermal and stability characteristics).
4. Bonded type limited to low range.
5. Installation of bonded or wrapped-type pickups is a critical
operation.
73

6.6 CAPACITANCE
Capacitive pressure transducers Ecal 161 are widely used in many
systems to monitor static or dynamic pressure fluctuations. Two basic types
of capacitive transducers are available for pressure applications: the
parallel-plate type (most popular) and the concentric overlapping cylinder
type as shown in Figures 6.61 [G101 and 6.62. Most often a diaphragm element
is used in conjunction with the capacitor (parallel-plate or concentric
cylinder type) to provide the displacement necessary for a capacitance
change. Devices such as these can operate at high frequencies (approx.
5 x lO Hz) and are very responsive to rapid pressure fluctuations. Some
of the advantages for using capacitive pressure transducers (not considering
expense for electronics) are that fabrication can be easy, cost is low, and
they are relatively maintenance-free. The more costly items necessary are
the electronics; and, depending on the requirements with respect to sensiti-
vity and resolution, this type of pressure monitoring system may be prohi-
bitive for certain applications. The more practical application for such a
system would be to incorporate several capaäitive transducers into the total
system and monitor with one set of electronics.
Capacitance transducers can detect displacements as small as
2.5 x 10 6 cm and produce a measurable electrical signal a3J
DEFLECTEDSTATIC PLATE
DIAPHRAGM INSULATING
MATERIAL DIAPHRAGM STATIC POSITION -
PRESSURE %llllnfl
DIELECTRIC-i
REAR CAVITY TERMINATIONS - etc.
Figure 6.61 Parallel-plate capacitive pressure transducer.
- - 74
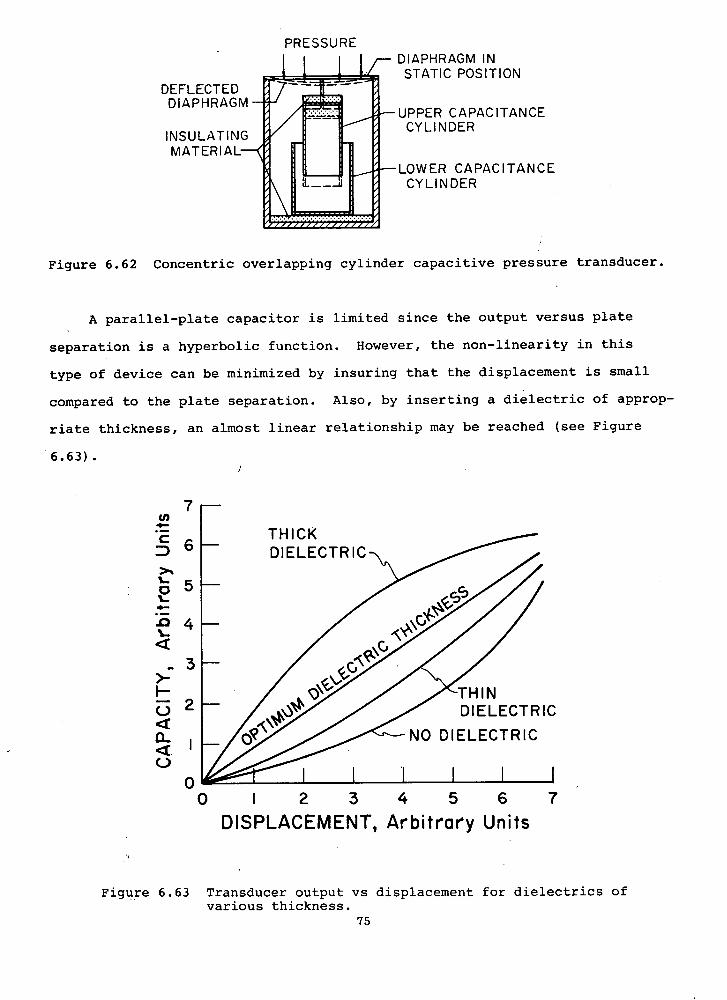
PRESSURE DIAPHRAGM IN STATIC POSITION
UPPER CAPACITANCE CYLINDER
LOWER CAPACITANCE CYLINDER
DEFLECTED DIAPH RAG I
INSULATIN MATERIAL
Figure 6.62 Concentric overlapping cylinder capacitive pressure transducer.
A parallel-plate capacitor is limited since the output versus plate
separation is a hyperbolic function. However, the non-linearity in this
type of device can be minimized by insuring that the displacement is small
compared to the plate separation. Also, by inserting a dielectric of approp-
riate thickness, an almost linear relationship may be reached (see Figure
6.63).
7-U) 4-
THICK 6 - DIELECTRIC
>..
5 - 4-
.04— 'a-
-- >
3 -
I- THIN 2 -
\3 DIELECTRIC
o NO DIELECTRIC < I-
- C-)
I .1 00 I 2 3 4 5 6 7
DISPLACEMENT, Arbitrary Units
Figure 6.63 Transducer output vs displacement for dielectrics of various thickness.
75
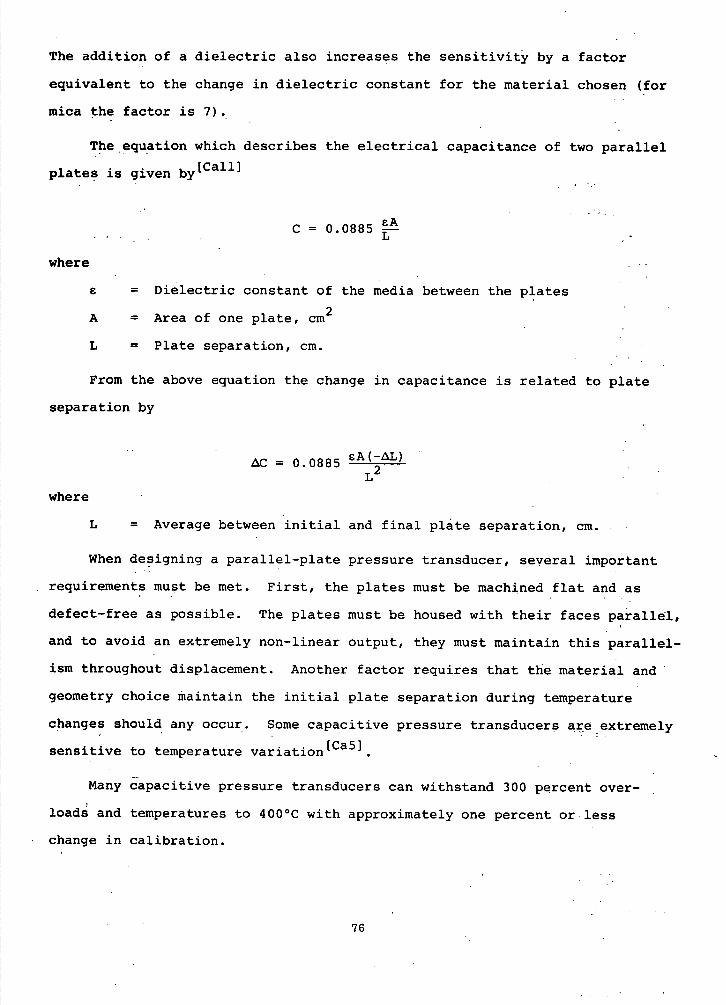
The addition of a dielectric also increases the sensitivity by a factor
equivalent to the change in dielectric constant for the material chosen (for
mica the factor is 7).
The equation which describes the electrical capacitance of two parallel
plates is given
C = 0.0885
where
= Dielectric constant of the media between the plates
A = Area of one plate, cm
L = Plate separation, cm.
From the above equation the change in capacitance is related to plate
separation by
AC = 0.0885 CA (-AL) L2
where
L = Average between initial and final plate separation, cm.
When designing a parallel-plate pressure transducer, several important
requirements must be met. First, the plates must be machined flat and as
defect-free as possible. The plates must be housed with their faces parallel,
and to avoid an extremely non-linear output, they must maintain this parallel-
ism throughout displacement. Another factor requires that the material and
geometry choice maintain the initial plate separation during temperature
changes should any occur. Some capacitive pressure transducers are extremely
sensitive to temperature varia tion a5].
Many capacitive pressure transducers can withstand 300 percent over-
loads and temperatures to 400°C with approximately one percent or less
change in calibration.
76

If a diaphragm is used, as with most capacitive transducers, it must
not have a natural frequency or an appreciable harmonic in the range of
pressure oscillations likely to be encountered (see "Diaphragms" for the
natural frequency equation).
A second type of capacitive pressure transducer uses two cohceñtric,
overlapping, cylinders. This device is basically the same as the parallel-
plate type with one important exception: the output of the transducer is a
linear function of its displacement.
For concentric, overlapping cylinders the equation which describes the
electrical capacitance (C) is given by [Call]
_O.242cL
log10(D)
where
c = Dielectric constant of the media between the cylinders
L = Length of cylinder overlap, cm
D = Inner diameter of the outer cylinder
d = Outer diameter of the inner cylinder.
If the cylinder overlap is not large, end effects will not produce a non-
linearity. The change in capacitance (AC) of concentric cylinders is related
to displacement (AL) by -
- O.242c AL
iog10 () - -. -
The advantage of this system is - that a proportional relationship exist
between capacitance and displacement, and the calibration is independent of
L. This allows for easier calibration since the exact reproduction of L is
not necessary each time. - -
77

Calibration techniques for both types of capacitance pressure transducers
are essentially the same. A calibrated variable air condenser is placed
in parallel with the measuring capacitor, and a pressure is applied to the
system. While held at pressure, the variable condenser is adjusted to "null"
the output, and the capacitance reading is noted. This "null" calibration
technique is good because it is independent of the circuit characteristics.
A simplified block-diagram of the circuitry necessary for parallel-plate or
concentric cylinder type transducers is shown in Figure 6.64.
FREQUENCY
FILTER
J J
A C INPUT
RECORDER CONVERTER OR CAPACITANCE
OSCILLOSCOPE I BRIDGE
I__I GENERATOR DC OUTPUT INPUT
AUDIO
OSCILLATOR
PRESSURE
TRANSDUCER
Figure 6.64 Electrical circuitry for capacitance pressure transducers.
78
All other design considerations outlined for the parallel-plate
capacitor are also applicable for a concentric cylinder device.
During operation with either type of capacitance transducer it is
imperative that misalignment (plate or cylinder cocking) does not occur
since when this happens all linearity is destroyed.
Advantages:
1. Lightness and stiffness of the moving parts give rise to a short
natural period and, therefore, very responsive to high frequencies.
2. The elastic member can be chosen for consistancy and freedom
from hysteresis.
3. Sensitivity can be varied over a wide range.
4. Ease of fabrication.
5. Pickup can be made small (particularly the parallel-plate type).
6. Transducer may be mounted directly adjacent to stream.
7. Linear output (for concentric, overlapping cylinder design).
8. Ability to measure a static quantity (i.e., when pressure is increased
and held constant, the capacitor will produce a steady signal).
9. Adaptable to widely different forms of construction.
10. Relatively insensitive to shock and vibration.
11. Mechanical linkage not always required between pressure diaphragm
and electrically sensitive element.
12. High frequency response.
13. High-temperature resistance (not to imply temperature insensitive).
14. Excellent resolution.
Disadvantages:
1. Temperature sensitive (excessive drift for nonequilibrium temperature
conditions).
2. Comparative complexity of associated electronic equipment.
3. Relationship between displacement and output is hyperbolic (for
parallel-plate transducers).
4. High overall cost.
5. Shielded cable must be used.79
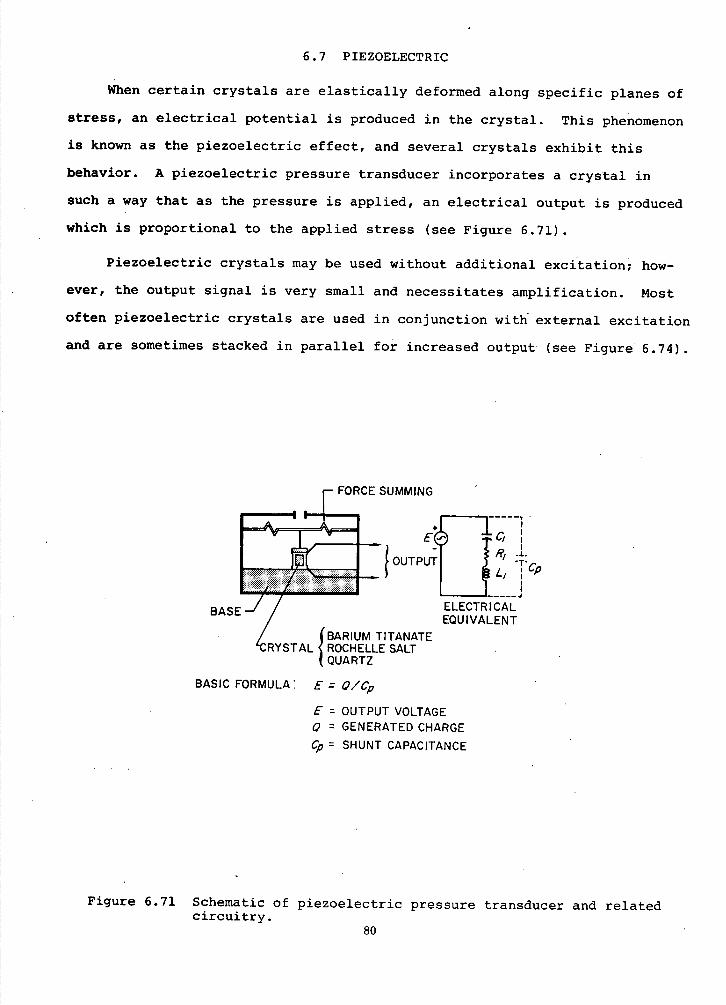
6.7 PIEZOELECTRIC
When certain crystals are elastically deformed along specific planes of
stress, an electrical potential is produced in the crystal. This phenomenon
is known as the piezoelectric effect, and several crystals exhibit this
behavior. A piezoelectric pressure transducer incorporates a crystal in
such a way that as the pressure is applied, an electrical output is produced
which is proportional to the applied stress (see Figure 6.71).
Piezoelectric crystals may be used without additional excitation; how-
ever, the output signal is very small and necessitates amplification. Most
often piezoelectric crystals are used in conjunction with external excitation
and are sometimes stacked in parallel for increased output (see Figure 6.74).
FORCE SUMMING
Figure 6.71 Schematic of piezoelectric pressure transducer and related circuitry.
80
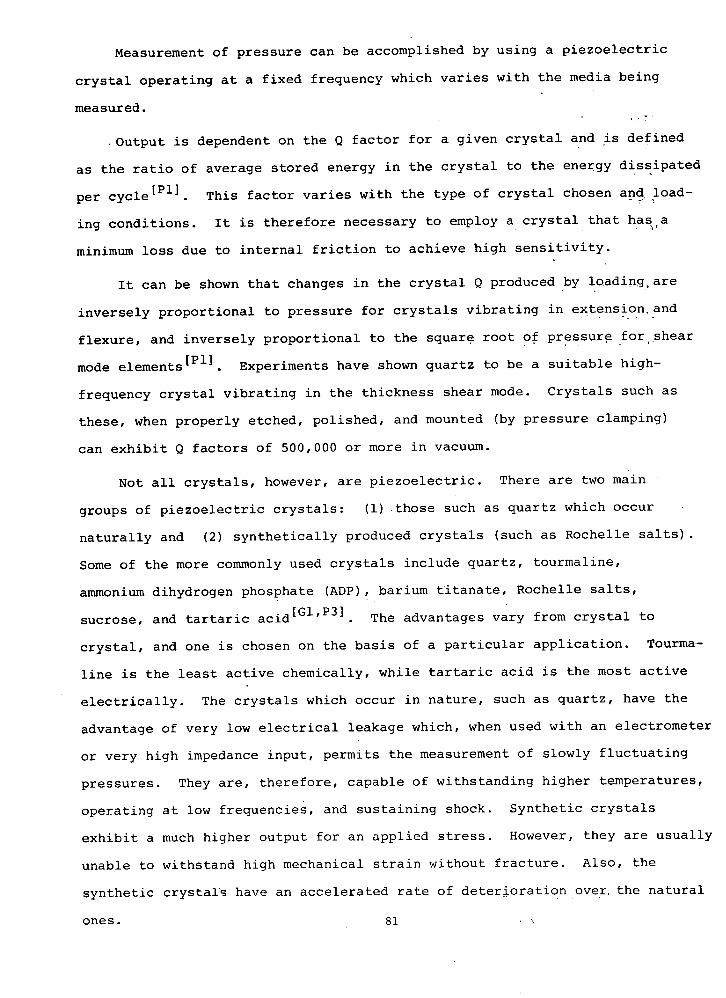
Measurement of pressure can be accomplished by using a piezoelectric
crystal operating at a fixed frequency which varies with the media being
measured.
Output is dependent on the Q factor for a given crystal and is defined
as the ratio of average stored energy in the crystal to the energy dissipated
per cycle 1 . This factor varies with the type of crystal chosen and load-
ing conditions. It is therefore necessary to employ a crystal that has ,a
minimum loss due to internal friction to achieve high sensitivity.
It can be shown that changes in the crystal Q produced by lo,adirig are
inversely proportional to pressure for crystals vibrating in extension, and
flexure, and inversely proportional to the square root of pressure for shear
mode elements 1 . Experiments have shown quartz to be a suitable high
frequency crystal vibrating in the thickness shear mode. Crystals such as
these, when properly etched, polished, and mounted (by pressure clamping)
can exhibit Q factors of 500,000 or more in vacuum.
Not all crystals, however, are piezoelectric. There are two main
groups of piezoelectric crystals: (1) those such as quartz which occur
naturally and (2) synthetically produced crystals (such as Rochelle salts).
Some of the more commonly used crystals include quartz, tourmaline,
ammonium dihydrogen phosphate (ADP), barium titanate, Rochelle salts,
sucrose, and tartaric acid.P3J The advantages vary from crystal to
crystal, and one is chosen on the basis of a particular application. Tourma-
line is the least active chemically, while tartaric acid is the most active
electrically. The crystals which occur in nature, such as quartz, have the
advantage of very low electrical leakage which, when used with an electrometer
or very high impedance input, permits the measurement of slowly fluctuating
pressures. They are, therefore, capable of withstanding higher temperatures,
operating at low frequencies, and sustaining shock. Synthetic crystals
exhibit a much higher output for an applied stress. However, they are usually
unable to withstand high mechanical strain without fracture. Also, the
synthetic crystals have an accelerated rate of deterioration over, the natural
ones. 81

The piezoelectric device is generally used as a dynamic pressure sensor
due to the device's high electric impedance at low frequecies. Figure 6.72
for illustration purposes, is an exaggerated example of how piezoelectric
crystals respond to a step pressure 1.
I I
A
/ /
Step Pressure I -1
PiezoelectricA' Transducer
Output
TIME
Figure 6.72 The response characteristics of a piezoelectric pressure transducer.
U Cr
U) U) U Cr a-
82
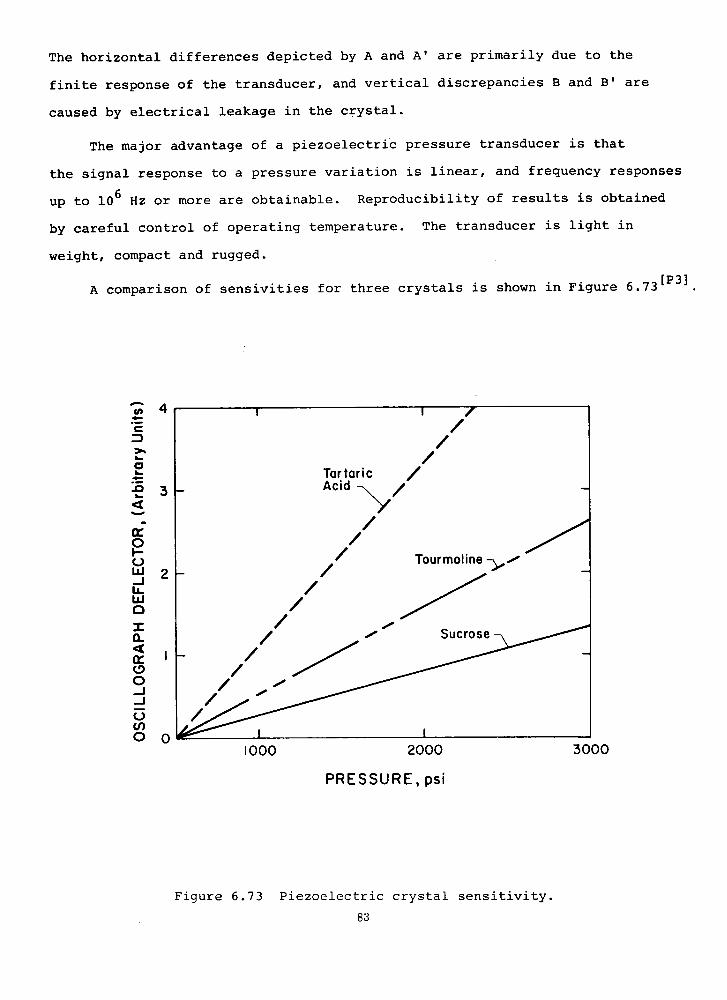
The horizontal differences depicted by A and A' are primarily due to the
finite response of the transducer, and vertical discrepancies B and B' are
caused by electrical leakage in the crystal.
The major advantage of a piezoelectric pressure transducer is that
the signal response to a pressure variation is linear, and frequency responses
up to 10 Hz or more are obtainable. Reproducibility of results is obtained
by careful control of operating temperature. The transducer is light in
weight, compact and rugged.
A comparison of sensivities for three crystals is shown in Figure 6.73'
/
/
/
Tartaric Acid
/ /
/
/Tourmaline
/
/
/Sucrose
1000 2000
PRESSURE, psi
Figure 6.73 Piezoelectric crystal sensitivity.
83
a U)
C
0
3
CkE
4
0 uJ 2 -J LL W
I a-4 Cr
0 -j -J 0 U,
3000

-4.
burma Crystal
Silver Elect
Quite often in the design of piezoelectric transducers, quartz or
other natural crystals are chosen over the high-output synthetic ones, and
the output is increased by "stacking". Stacking, as shown in F-igure 6.74,
is an effective way to increase high-frequency response and sensitivity. The
output of this type of transducer is significantly greater than that of a
single element, but the signal generated is still low, and consideration
must be given to electric and magnetic shielding and short cable lengths.
CeI DI,.4
V C3UJ
Figure 6.74 Piezoelectric crystals stacked in parallel.
84
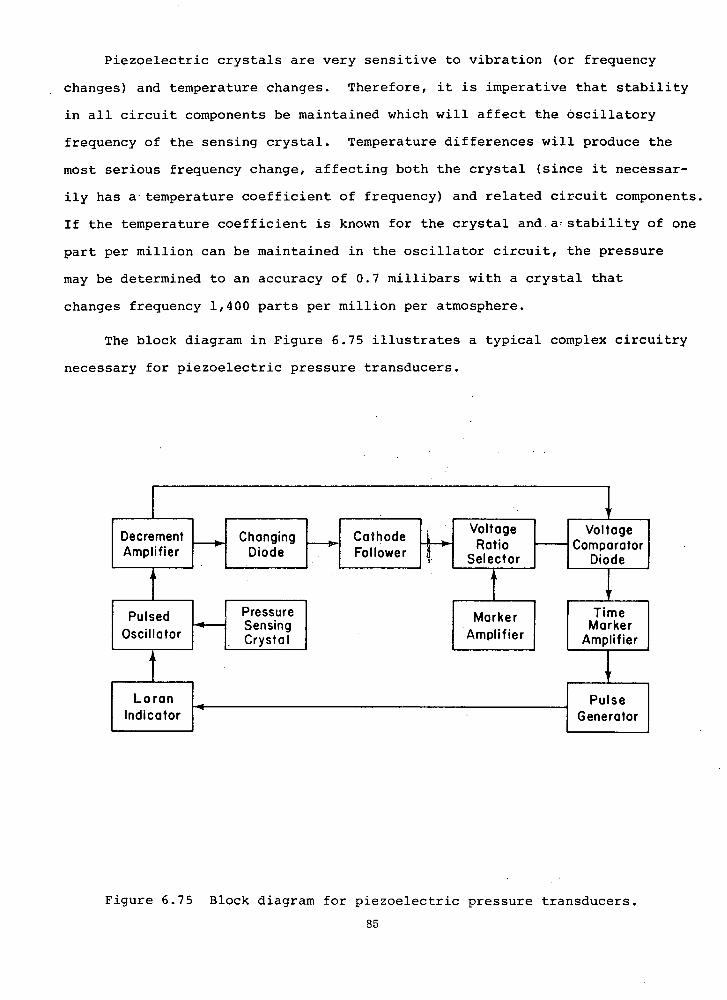
Piezoelectric crystals are very sensitive to vibration (or frequency
changes) and temperature changes. Therefore, it is imperative that stability
in all circuit components be maintained which will affect the oscillatory
frequency of the sensing crystal. Temperature differences will produce the
most serious frequency change, affecting both the crystal (since it necessar-
ily has a temperature coefficient of frequency) and related circuit components.
If the temperature coefficient is known for the crystal and a- stability of one
part per million can be maintained in the oscillator circuit, the pressure
may be determined to an accuracy of 0.7 millibars with a crystal that
changes frequency 1,400 parts per million per atmosphere.
The block diagram in Figure 6.75 illustrates a typical complex circuitry
necessary for piezoelectric pressure transducers.
Decrement I I Changing _____
I ___
Cathode- F Voltage I Voltage
FollowerRatio
I0mP0.0t0r Amplifier Diode I I
Selector I Diode
Pulsed I Pressure IJ
Marker I I Time 14 1 Sensing I I Marker
Oscillator Crystal I Amplifier I Amplifier
Loran Pulse Indicator Generator
Figure 6.75 Block diagram for piezoelectric pressure transducers.
85

PIEZOELECTRIC SPECIFICATIONS
Types of pressure measurement (including base limitation for differential):
Ballistic pressure transient, air blasts, underwater blasts, rocket
blasts, shock tube measurements, internal-combustion engines,
and many others.
Pressure ranges:
Dependent on elastic limit of crystal chosen; typically, piezoelectric
crystals range from 10- 6 psi to 10,000 psi. Frequency response:
up to 1.0 x 10 Hz.
Accuracy:
Assuming the temperature coefficient of the crystal is known and a
stability of one part per million can be maintained in the oscillator
circuit, it should be possible to determine pressure to an accuracy
of 0.7 millibars with a crystal that changes frequency 1,400 parts
per million per atmosphere.
Temperature (range, compensation, and stability):
Temperature stability is good when device has been compensated.
Calibration:
No static calibration possible. Dynamic calibration tricky.
Vibration effects:
Appreciable (unless compensated): also highly sensitive to electrical
noise.
Materials:
Crystal materials include: quartz, tourmaline, ammonium dihydrogen
phosphate (ADP), barium titanate, Rochelle salts, sucrose, tartaric
acid, and others.
Oxygen usage:
When pressure transients are to be measured, piezoelectric pressure
transducers are probably the choice of any type for use with gaseous or
liquid O2 When used with cold gaseous or liquid 02 proper crystal
selection is important, since synthetic types are usually unable to
withstand high mechanical strain without fracture.
86

Installation requirements and limitations:
Crystal mounting becomes critical where vibration in the holder
may affect the oscillating frequency.
Remarks:
Unique in ultra-high frequency range. Poor in very low frequency
range.
Advantages:
1. Highly linear response.
2. Calibration remains constant.
3. High frequency response.
4. High output (1.0 to 30 mV/g).
5. Negligible phase shift.
6. Small size.
7. Rugged construction.
Disadvantages:
1. Piezoelectric crystals used in parallel (as shown in Figure
6.74) require an extremely high-gain amplifier.
2. Responds to severe vibration.
3. Extreme care must be taken to minimize leakage in the input
circuit of the high-gain amplifier.
4. Unsuitable for static pressure measurements.
5. Unsuitable for measurements of extremely low pressures.
6. Very sensitive to temperature changes.
7. Very sensitive to cross-accelerations..
8. Long cables generate spurious response or noise.
9. After extreme shock does not return readily to original
calibrated zero.
87

6.8 POTENTIOMETRIC
Potentiometric pressure transducers employ electro-mechanical devices
which use a force-summing element (e.g., Bourdon tube, belloJs,or diaphragm)
to drive a variable resistor. In the , low pressure ranges ,a capsule, multi-
capsule, or bellows may be used, and for high pressures (to approximately
100,000 psi) a Bourdon tube is necessary. In all cases the electro-mechanical
element is a variable resistor in which the motion of the movable contact or
slider is powered by a diaphragm capsule, bellows, or Bourdon tube. The
output voltage from the variable resistor is altered by displacement of the
force-summing element due to a mechanical coupling between the resistor and
force-summing element. A properly designed potentiometric pressure transducer
will incorporate a diaphragm, bellows, or Bourdon tube having deflectional
properties which are proportional to the applied pressure (see appropriate
section Bellows, Diaphragm, etc
Schematic diagrams are shown in Figures 6.81-6.83 for' both low and high
pressure range transducers with each having comparable circuit diagrams.
Resistor elements for a potentiometric pressure transducer can be
of the finite or continuous resolution type. The former is a wire-wound
element with the output voltage changing in discrete steps proportional to
the wire and core diameter, while the continuous resolution device is fabri-
cated from conductive plastic with the output voltage changing in a
continually smooth fashion.
For the circuitry necessary to operate a potentiometer (shown in
Figure 6.82), it.is imperative that 'the applied potential be maintained
constant for stability. A single pointer-type instrument is used, and a
two-position switch is connected in order to makeit possible at any time
to check the applied potential. By operating the checking switch, the
potential across the entire length of the siadewire may be measured and
adjusted by means of the variable resistance R. The applied potential is
88

Figure 6.81 Potentiometric pressure transducer using a capsule element.
Capsule
F
P a.
L.luIucal Lead Throughs
Slide Figure 6.82 Circuitry for Wire potentiometric devices.
R
Figure 6.83 Potentiometric • pressure transducer using a bourdon tube element.
!able i stor

adjusted until the indicating instrument shows a full-scale deflection;
then, with the switch in the test position, the deflection of the instrument
indicates the position of the sliding contact. The above circuit requires
a calibration to correlate contact movement and position with applied
pressure1.
Recently, the "error band" concept (DEB -- dynamic error band, SEB --
static error band, etc.) has been used by designers for specifying or describ-
ing pressure transducer performance. A static error band (SEB), for example,
would include prime errors of linearity, hysteresis, resolution, repeatability
and fraction with respect to how much each contributes to the total error
(for a complete discussion of this concept see Reference P02). The graph
in Figure 6.84 shows relatively how much error is introduced for a given
pressure range.
5
U)
4
I-
Total Error
r Friction
Linearity, Resolution
7 /— Hysteresis
150 300 450 600
TRANSDUCER RANGE, psi
Figure 6.84 Error contribution in a pressure transducer.
90

lack iaphragm
I Lead —
Throughs I
Capsule
It is obvious that the major contributing error at very low pressure ranges
is friction and at very high ranges, hysteresis[P05]Therefore, for low
pressure ranges it is advantageous to provide larger effective cross-
sectional area sensors and with high pressure sensors less deflection must
be considered (force-summing element displacement must be multiplied to
restore desired wiper displacement). Intermediate pressure ranges involve
the optimization of all parameters to minimize total transducer error 03l.
Potentiometric transducers are often called upon to measure corrosive
or electrically conductive media. This presents no problem when the fluid
enters the device at P 1 (see Figure 6.85). However, if such a liquid or
fluid (oxygen is possible) is also introduced atP 2 , a modification of the
transducer is necessary to insure against-unwanted reactions. The figure
illustrates one possible solution which isolates all electrical components from
the fluid being measured by installing a slack diaphragm as shown.
The electro-mechanical compartment is then filled with a neutral
fluid, thereby isolating those elements from the measuring stream.
Neutral
Figure 6.85 Pressure transducer component isolation for use with reactive liquids or gases.
91

POTENTIOMETRIC SPECIFICATIONS
Types of pressure measurement (including base limitation for differential):
Gage, vacuum, differential, and absolute. Base pressure is limited
by the type of force-summing elemëntchosën(Bourdon tube, bellows,
etc.).
Pressure ranges: -
Dependentonforce-sunmting element chosen (see proper section
for description).
Resolution:
0.2 percent of full scale.
Accuracy:
±0.25 percent terminal end-point accuracy.
Temperature (range, compensation, and stability):
High and low (cryogenic) temperature transducers available.
Some devices are temperature-compensated bymechanical methods
(see "Force-Summing Devices) and others use electrical compeflsa-
tion.
Stability is good if input potential is maintained constant.
Calibration:
Transducer output and input is measured at incremental values of
increasing and decreasing pressure from 0-100 percent of-full range.
Vibration effects;
Very insensitive.
Materials:
Electrical wiring, resistors, and force-summing device (see section
on Bourdon tube, bellows, or diaphragm).
Oxygen usage:
Yes, with properly designed transduder (see paragraph describing
the "isolated" transducer). Corrosion resistant; explosion-proof, and
cryogenic potentiometric pressure transducers are currently available.
92

Installation requirements and limitations:
Generally, the transducers arelarge; however, miniaturization has
been accomplished with some sacrifice In performance. - Also, for
less' demanding installations (where space is not a' problem) ervô-
power is used to reduce friction.
Advantages:
1. Inexpensive
2. High output
3. AC or DC excitation
4. No amplification or impedance matching (sometimes)
5. Very wide range of function (characteristic)
6. Can be ruggedly constructed
7. Vibration and temperature insensitive
Disadvantages:
1. Resolution is finite (wirewound type).
2. High mechanical friction (a very important factor for low
pressure transducers).
3. Limited life (wire wear) .
4. Transducer becomes noisy with wear
5. Large displacements required
6. Generally low frequency response -
93

MAGNETIC PRESSURE TRANSDUCERS
Magnetic pressure transducers comprise two groups: (1) those which
operate through a change in inductance and (2) those which utilize the
change in reluctance of a part of a magnetic circuit. There is no clear
line of distinction between the different types.
The magnetic type pressure transducers must always be supplied with
energy, the variable-inductance types being activated by electromotive forces
and the variable-reluctance units by magnetomotive forces. The circuitry
for either the inductance or reluctance pressure-measuring devices is usually
of low impedance and capable of carrying relatively large currents, many-of
which need no amplification.
Magnetic pressure transducers are coupled with either a Bourdon
tube, bellows, diaphragm, or U-tube. The displacement of the element is
converted to an electrical signal (output) which is proportional to the applied
pressure. The following two sections describe the basic operation of vari-
able-inductance and variable-reluctance pressure transducers.
94
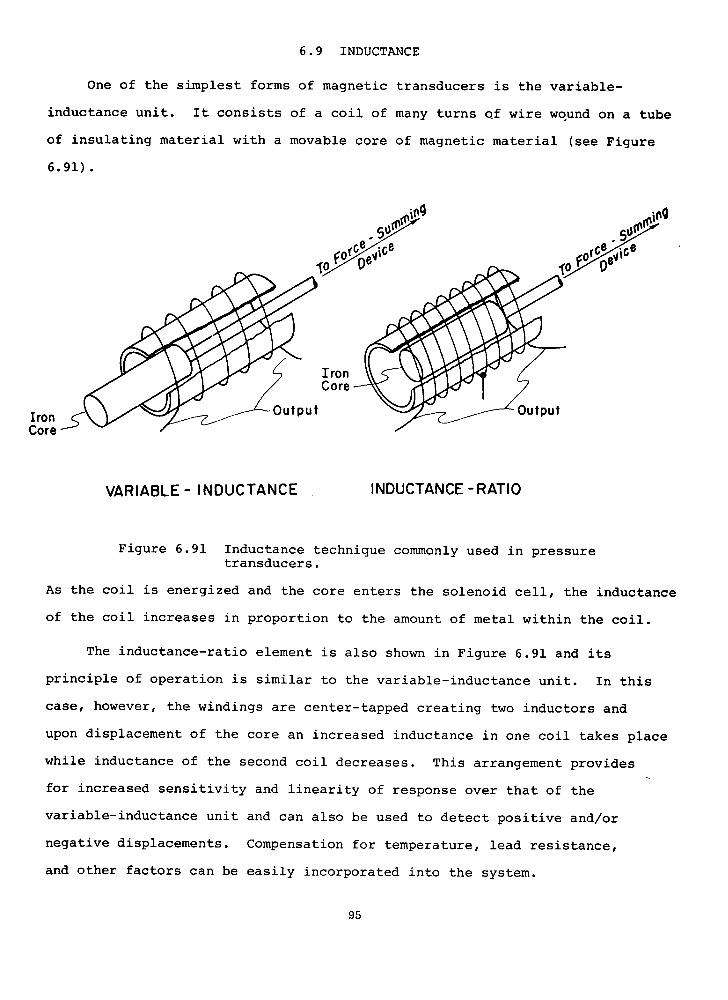
fO'
Iron Core
Iron Core
6.9 INDUCTANCE
One of the simplest forms of magnetic transducers is the variable-
inductance unit. It consists of a coil of many turns of wire wound on a tube
of insulating material with a movable core of magnetic material (see Figure
6.91).
VARIABLE- INDUCTANCE INDUCTANCE-RATIO
Figure 6.91 Inductance technique commonly used in pressure transducers.
As the coil is energized and the core enters the solenoid cell, the inductance
of the coil increases in proportion to the amount of metal within the coil.
The inductance-ratio element is also shown in Figure 6.91 and its
principle of operation is similar to the variable-inductance unit. In this
case, however, the windings are center-tapped creating two inductors and
upon displacement of the core an increased inductance in one coil takes place
while inductance of the second coil decreases. This arrangement provides
for increased sensitivity and linearity of response over that of the
variable-inductance unit and can also be used to detect positive and/or
negative displacements. Compensation for temperature, lead resistance,
and other factors can be easily incorporated into the system.
95

The mutual-inductance unit for displacement measurements is shown
in Figure 6.92 and is sometimes called a linear, variable, differential,
transformer (LVDT).
FORCE SUMMING
LINKAGE
ii AC OUTPUT - REF.Sec. I
AC EXCITATION PRIMA]
CjSec.2
CORE MASS
BASIC FORMULA: C=(N°'ø/dt)Sec./ -(N°'0/d/)Sec.2
C OUTPUT VOLTAGE
N NUMBEROFTURNS
dØ/dl RATE OF CHANGE IN WEBERS
Figure 6.92 Inductance-ratio circuitry.
In this device the effective impedance of a coil is altered by changing the
mutual inductance between it and another circuit. As shown, the device has
one primary and two secondary windings with the core mass centered on the
primary winding. When ac current is supplied to the primary winding (with
the armature centered), the magnetic flux generated by this coil is distri-
buted by the armature so that equal voltage is induced in each of the
secondary coils. Then, upon displacement of the armature, either positive
or negative, the resultant will be a voltage rise in one secondary and a
decrease in the other. Figure 6.93 illustrates this principle for a typical
LVDT.
96

I,
.075
ru
LV DT
Lfl]-------J 0 - +
C,
0C.
Armature Cente,ed "Null" Position
>
I-.050
I-D 0
.025
0 .025 .050 .075 0.10
ARMATURE DISPLACEMENT, in
Figure 6.93 Output vs armature displacement for LVDT pressure transducers.
The electronic circuits used in combination with variable-inductance
transducers can be one of three types: (1) simple series circuits, (2)
series-opposition circuits, or (3) bridge-type circuits and any one of
these may also include amplification. A commonly used circuit for variable-
inductance systems is shown in Figure 6.94.
Figure 6.94 Inductance pressure transducer circuitry.
97

Advantages:
1. Responsive to static or dynamic conditions.
2. Construction can be extremely simple.
3. Continuous resolution.
4. Low hysteresis. -
5. signal-to-noise ratio is high.
6. High output.
7. No frictional load on system.
8. Exerts little or no reaction forces on the measuring device.
9. Results in linear electrical response when actuated by linear
mechanical motion.
10. Operates from 60 Hz current and does not require special power supplies.
11. voltage required is only 3 volts per unit for most applications.
12. Small, rugged, and dependable.
13. Can operate underwater.
Disadvantages:
1. Not particularly sensitive.
2. Requires shielded cable.
3. Must be excited with ac only.
4. Sensitive to vibration.
5. Frequency response is limited to the force summing device
(diaphragm, bellows, etc.) used.
6. The units are large and have a low frequency response.
7. Instrumentation must be selected to operate on ac signals, or
rectifier must be used for dc output.
98

6.10 RELUCTANCE
The reluctance type pressure transducer thus consists of a device for
converting pressure into the proper type of displacement, i.e., a diaphragm
for the single-active-arm bridge circuit or a torsion tube for the others,
a suitable magnetic core to complete the magnetic circuit, and the required
number of inductive coils. Additional electronics (for the electromagnetic
type) include a carrier oscillator supply, a demodulator, and a recording
device. The later is usually a galvanometer type oscillograph, although
the transducer can be used quite readily to drive an oscilloscope or magnetic
tape recorder.
Variable-reluctance pressure transducers are distinguished primarily
by how the exciting energy enters the system. The energy is introduced as a
magnetomotive force which may be produced by an electromagnet assembly or
permanent magnet.
Electromagnetic induction is the means by which the variable-reluctance
system operates. This can be accomplished by two or more methods. First,
a magnetic field is created, either electrically or with a permanent magnet,
and a moveable iron core is placed near this field. Then, as the iron core
is displaced, a resultant change in flux occurs which can be proportional to
the rate of pressure change. The second method also uses a magnetic field
with a conductor in it; however, it remains stationary and the field strength
changes producing current flow. In either case it is the interaction of a
magnetic field and an electric conductor which produces a current; a change
of armature position or flux is always involved. The following schematic
in Figure 6.101 is a simplified illustration of the variable-reluctance
[Gl] principle
This type of pressure transducer does not measure pressure, but instead
the rate of change of pressure and hence presents a number of difficulties.
The major problem is not being able to perform a static calibration or
measurement with this system. This problem also exists for piezoelectric
99

Deflected Position (Pressure Applied)
Static . -. Position c
Permanent Magnet Electromagnet
Figure 6.101 Basic principle of reluctance technique.
transducers, but the reluctance type does not possess the redeeming features
of extremely high frequency response which is characteristic of the crystal.
Hence, it is limited to a small number of specialized uses.
Figure 6.102shows three arrangements for variable-reluctance bridge
transducers. The first utilizes a flat diaphragm in conjunction with three
fixed inductance arms and one active. Next, a rotating armature is used
(actuated by a torque-tube) with two active and two fixed inductances. In
this case sensitivity and frequency-response is enhanced over the first
example. The last variable-reluctance pressure transducer maximizes sensiti-
vity and frequency-response by incorporating four active inductance arms
into the. circuit.
The odtput.:of the two- or four-active arm bridge transducers is suffi-
ciently high that amplification is generally not necessary. Frequency re-
sponse of the transducer is limited either by the mechanical characteristics
of the armature or the carrier frequency, which in turn depends on the power
absorbed and heat generated by the magnetic circuit. A typical carrier
100

L1
Oscillator Transformer
Fixed Inductances
W"11M
Armature
L1
L2
nature
E CORE
t LlDiaphragm
t t t
-/
PRESSURE
E CORE
Figure 6.102 Circuitry for reluctance pressure transducers.
101

frequency for the rotating-armature type pickup is 3 x 1O 3 Hz, which limits
the frequency response of these types to the order of 1 x lO Hz 6 . The
following block diagram shown in Figure 6.103 is typical of a variable-
reluctance pressure transducer measuring system.
Transducer
Inductance
Oscillator
Bridge
Power Supply
Demodulator
Recording
Instrument
Figure 6.103 Block diagram of variable-reluctance pressure transducer circuit.
102

Advantages:
1. Responsive to static or dynamic conditions.
2. Continuous resolution.
3. High output (Z 40 mV/V). The high output (up to 10 ma for a 0-ohm
load) is sufficient to actuate a high-frequency galvanometer or may
be used to operate a recording galvanometer, a millivolt recorder
or indicator, or a milliaxneter.
4. signal-to-noise ratio is high.
5. One type gives rate of pressure change directly.
6. No mechanical linkages necessary between diaphragm and electrically
sensitive element.
7. This type of pressure transducer may be used with telemetering systems
of the frequency-modulated or pulse modulated types and with servo
systems.
Disadvantages:
1. System does not function well in close proximity to magnetic objects,
or fields.
2. Large size and low-frequency response.
3. Reactive and resistive balancing required.
4. Must be excited by ac only.
5. Frequency response limited to force-summing device chosen
(diaphragm, bellows,. etc.).
6. For some types a complicated high-gain amplifier is required to
integrate accurately the rate of pressure-change response into
pressure-time response over the required frequency range.
7. Other types which require ac impedance electrical circuits do not
give accurate reproduction of high-frequency components unless a
very high-frequency current is used.
8. Static calibration not possible.
9. Cannot measure low-frequency variations.
103

OTHER PRESSURE TRANSDUCER TYPES
• The following section introduces in limited detail some other pressure
transducers. These units are found in specialized applications, or their:.
operational principle may be used in a custom fabrication. A brief descrip-
tion of the unit, its method of operation, a schematic drawing and related
circuitry will be given for each type of transducer, followed by references
and bibliography.
104

6.11 MICROMANOMETERS
Micromanometers are defined as "...instrumentation used to measure pres-
sure, either absolute or differential, in the range-from about 0.001- to. 50mm
of Hg (0.13 to 6650 Nm 2 ) tM1S] . Some of the types of devices classified as
micromanometers include U-tube; diaphragm-capacitance; elastic element
(optical); inductance; resistance wire; gas column; vacuum tube; piston_
gages; and centrifugal transducers.
Since micromanometers are similar in operational principle to those
described in this report, the discussion here will be limited to types and
general description. NBS Monograph 114 is given as an excellent reference
(MiS) on micromanometers. It furnishes detailed information on types,
methods of measurement, pressure oscillations, and calibration techniques.
As with other transducers, the unit of pressure commonly used for
micromanometers is either millimeter of mercury (mmHg), millimeter of water
(mmH2O), or inches of water (in. H 20). The unit quite often used for
vacuum or low pressure measurements is the torr (see Preface).
Brombacher [M15] indicates "A gas pressure in the micromanometer range.
maybe measured in four fundamental ways. These are: (a) by means of a
balancing liquid or gas column; (b) by the strain produced in an.elastic
element; (c) by a balancing gravitational force; and (d)by a balancing
centrifugal force. Other methods of measuring pressure in the micromanometer
range, such as thermal conductivity, viscosity, radiation, and ionization,
are more applicable to the higher vacuum ranges."
Generally all pressure transducers in the micromanometer range which
use the four primary methods for sensing pressure involve the amplification
or conversion of the primary signal.
Often in a system, particularly containing reactive gases, the pressure
gradually decreases on standing. A great advantage of the micromanometér
is that continuous monitoring of the pressure in a reservoir is possible
and any changes can be immediately detected.
105

According to Brombacher, "the principal laboratory applications for
micromanometers have been in investigating gas reactions, in making chemical
analyses, in measuring low vapor pressures, atmospheric pressure fluctuations,
low gas velocity by impact pressures, and low differential pressures at high
pressures. Their principal industrial application appears to be in petroleum
refining."
106
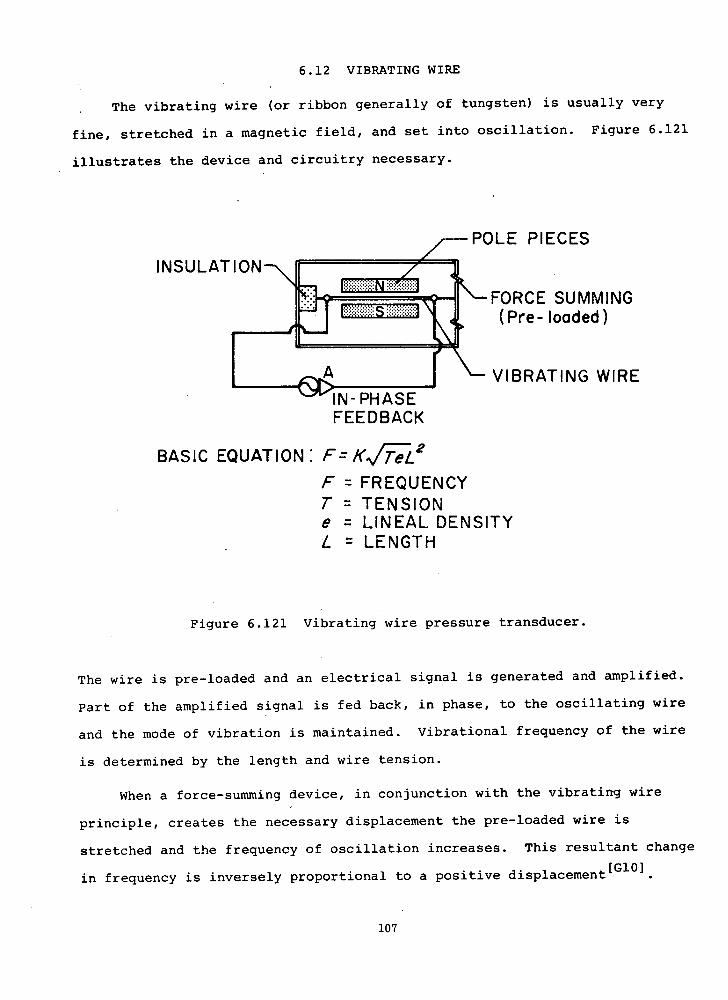
6.12 VIBRATING WIRE
The vibrating wire (or ribbon generally of tungsten) is usually very
fine, stretched in a magnetic field, and set into oscillation. Figure 6.121
illustrates the device and circuitry necessary.
POLE PIECES
INSULATION
'—FORCE SUMMING (Pre-loaded)
VIBRATING WIRE IN-PHASE FEEDBACK
BASIC EQUATION: F=6L2
FREQUENCY I TENSION e LINEAL DENSITY L LENGTH
Figure 6.121 Vibrating wire pressure transducer.
The wire is pre-loaded and an electrical signal is generated and amplified.
Part of the amplified signal is fed back, in phase, to the oscillating wire
and the mode of vibration is maintained. Vibrational frequency of the wire
is determined by the length and wire tension.
When a force-summing device, in conjunction with the vibrating wire
principle, creates the necessary displacement the pre-loaded wire is
stretched and the frequency of oscillation increases. This resultant change
in frequency is inversely proportional to a positive displacement°'.
107
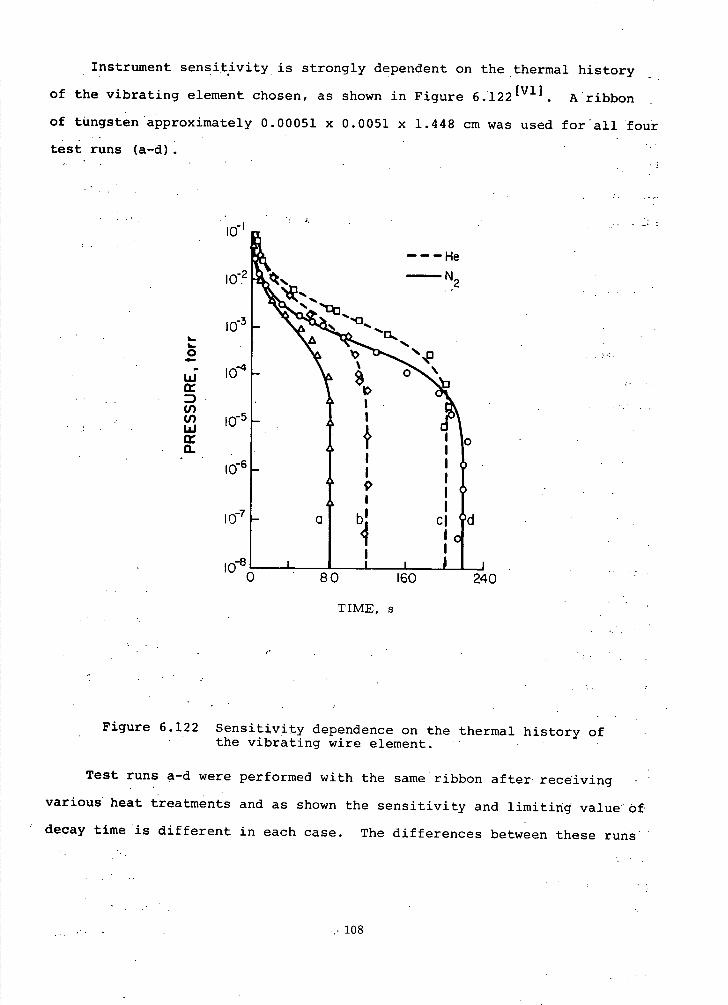
Instrument sensitivity is strongly dependent on the thermal history -
of the vibrating element chosen, as shown in Figure 6•.122[Vl] Aribbon
of tungsten approximately 0.00051 x 0.0051 x 1.448 cm was used for all four
test runs (a-d).
I0_I
---He
i0 N2
Cr 1010 CL
a b1 ci d
4 Ic
10_B I I I _j 0 80 160 240
TIME,s
Figure 6.122 Sensitivity dependence on the thermal history of the vibrating wire element.
Test runs a-d were performed with the same ribbon after-receiving
various heat treatments and as shown the sensitivity and limiting value of
decay time is different in each case. The differences between these runs
108

may suggest that the metallurgical state of the material has changed due
to the heat treatment.
The over-all conclusion is that the vibrating wire (or ribbon) gauge
is not significantly more sensitive than other gages of the same principle,
but that it is rugged, easy to use, consistant with high vacuum, and pre-
sumably could be arranged to yield a continuous reading of pressure.
VIBRATING WIRE SPECIFICATIONS
Types of pressure measurement:
Gage (including vacuum), differential, or absolute.
Resolution:
Gage not significantly more sensitive than other gages of same
principle, but is rugged, easy to use, and consistant with ultra-high
vacuum. It can also be arranged to yield a continuous reading
of pressure.
Vibratin effects:
Very sensitive
Materials:
Wire generally used is tungsten.
Oxygen usage:
It is conceivable that vibrating wire pressure transducers can be
used in gaseous or liquid 02 environments. This is possible since
only the force-summing element is exposed to the system being mea-
sured while the remaining parts are isolated.
Remarks:
As shown the sensitivity is questionable and transducer is very
sensitive to shock and vibration.
109

Advantages:
1. High output.
2. Accuracy of receiving instrument may be high.
3. Carrier oscillator in FM/FM telemetering eliminated.
4. Output is frequency modulated.
5. Transmission of output frequency may be made over long
distances with no loss in accuracy.
6. Rugged.
7. Easy to use.
8. Consistent with ultra-high vacuum.
9. Can be arranged to yield a continuous reading of pressure.
Disadvantages:
1. Largely non-linear.
2. Hysteresis errors high.
3. Stability is questionable.
4. Very sensitive to temperature change.
5. Shock sensitive.
6. Vibration sensitive.
110

6.13 OPTICAL
Optical pressure devices may employ either the "lever arm" or "fringe
pattern" principle of operation. The former may incorporate a mirror acting
as the diaphragm, or pressure sensing element, in conjunction with an indicent
light beam 0 . Some distance from the mirror (which will determine the
sensitivity) the light falls on a scale, and as pressure is applied to the
system the light is deflected through an angle e. It is this deflected
angle which is then proportional to the applied pressure.
The "fringe pattern" method (an optical interferometric technique) is
used for detecting rapidly varying pressures. In Figure 6.131 is shown
the basic element which has been developed for pressure measurements°2.
It consists of two basic parts, a diaphragm unit, having an optically flat
face when unstressed, and an adjacent stator unit. The stator is generally
made from fused quartz. The interior face of the stator is polished and
slightly concave, having a large radius of curvature. The adjacent diaphragm
is then polished optically flat and made totally reflecting.
When both thestator and diaphragm are then assembled it is evident
from this construction that conditions are suitable for the formation of
interference fringes when monochromatic light falls on the unit from the
stator side. The resulting fringes are circular, however, only a narrow
diametral strip of the fringe pattern is considered (by placing a mask
containing a slit over the pattern).
The above technique can be monitored visually (after calibration)
or a photographic method 02 , using a high-speed 35 mm camera, may
permanently record the pressure changes on film to be analyzed later.
111

•1
QUARTZ a I -.STEEL
PRESSURE
Figure 6.131 Schematic of a basic optical pressure sensing device.
112
OPTICAL SPECIFICATIONS
Types of pressure measurement (including base limitation for differential):
Gage (including vacuum).
Pressure ranges:
Approximately 0 to 5,000 psi.
Temperature (range, compensation, and stability):
Choice of materials will determine the thermal stability of the
device. Fused quartz as the stator unit and proper mounting (to
minimize the effect of thermal differences) will resultin a tem-
perature insensitive device. If the above is not followed the
temperature coefficient of Young's modulus may affect the cali-
bration by about 0.01 percent per degree centigrade. Also, a zero
shift of approximately 0.025 percent of full scale per degree
centigrade will be observed.
Calibration:0 -
Straightforward. See "Calibration Techniques" (deadweight testers).
Vibration effects:
Very sensitive.
Materials.
The optical element may be quartz, glass, or other refractive material
and for the choice of diaphragm material see the section on "Diaphragms."
Oxygen usage:
The optical pressure transducer should operate with gaseous 02 at -
ambient temperature and not present any problem, but steps should
be taken to prevent condensation on optical surfaces when cold
gaseous or liquid °2 are used.
Installation requirements and limitations:
The system is bulky which may severely limit installation.
113

Advantages:
1. Linear response.
2. Flat response from zero to very high frequencies (using a high-
speed photographic technique ref. 0p2).
3. Rugged.
4. Accuracy and pressure range can be high.
5. Using the photographic technique (ref. 0p2) a continuous record
for long time intervals may be made.
Disadvantages:
1. Very bulky.
2. Remote monitoring not possible.
3. Best for low and moderate frequency levels.
4. Installation can be difficult.
114

6.14 DIODE
It is well known that the tunneling current in Esahi diodes is sensi-
tive to hydrostatic pressure changes i2,Di3], and pressure gauges making
[Di4] use of this principle have been reported . The negative resistance
region associated with the tunneling diode is undesirable for pressure
transducer application. However, this can be formerly eliminated after the
diode and its associated circuitry have satisfied the strict stability con-
ditions of the amplifier mode of operation 12].
Tunneling junction diodes, designed specifically for use as miniature
pressure gages, have been fabricated from arsenic-doped germanium. These
diodes have resistivities of - 0.001 ohm-cm and were tested under hydro-
static pressures of up to 10,000 This type of diode pressure
transducer is more desirable than the usual type since a negative region
appears only at low temperatures. It also has the advantage that the
strict stability requirements of the amplifier mode need not be met; further-
more, bulky low inductance mounting is not needed. With the above type
(arsenic-doped) tunneling diode pressure transducer it is possible to
fabricate the sensing element as small as 0.0076 cm in diameter.
Figures 6.141, 6.142, and 6.143 are typical of the circuitry and pressure
vs frequency for a tunneling junction diode pressure .transducer21.
Change in sensitivity when operating diode pressure transducers still re-
mains a problem as Figure 6.202 illustrates. It shows the sensitivity to
changes in temperature of an arsenic-doped germanium diode pressure trans-
ducer. The problem is characteristic of all semiconducting devices and
must be corrected before the diode principle can be used for pressure
transducers.
115

250
f20 12
OUTPUT
I
,% •p to
Figure 6.141 Tunnel diode oscillator.

> E
I-88
0 I.-
0
86
I 2 3 4 5 6 7 8 9 10
PRESSURE, psi x 1
Figure 6.143 Diode frequency vs pressure.
117
Figure 6.142
x 2.46
2.420
92
90
84250 500 750 1000
PRESSURE, psi Diode output (my) vs pressure (psi) at various temperatures.
N 2.45 I
>-0
2.44
CY w LL
2.43

DIODE SPECIFICATIONS
Types of pressure measurement (including base limitation for differential):
Gage
Pressure ranges:
- 3.0 to 10,000 psi
Resolution:
Sensitivity greatest at lower pressures, - 4.4 my psi at 1,000
psi. and - 1.7 I.LV psi at 10,000 psi.
Temperature (range, compensation, and stability):
Temperature sensitive (characteristic of all semiconductors).
Materials:
Arsenic-doped germanium, GaSb, InSb
Advantages:
(1) Can be extremely small (approximately 0.0076 cm in diameter).
(2) Inherent temperature sensitivity (characteristic of all semi-
conductors).
Disadvantages:
(1) Some types require extremely stable amplifier modes. This
factor could be costly.
(2) The problem of sensitivity change caused by temperature
differences is characteristic of all diode devices.
118

6 .15 ELECTROKINETIC
The electrokinetic or streaming potential phenomenon is used as the
basis for converting sonic to electrical energy. Williams states that
"...it was contemplated that the transducer would consist of a porous solid
containing a fluid which, by oscillatory movement through the solid under
sonic impulse, would generate an alternating current having the same frequency
as the sonic impulse." Figure 6.151 illustrates a simplified version of the
electrokinetic pressure transducer.
Leads, one on each side of the porous disc, are connected to a high-gain
amplifier and then to an oscilloscope. "A small tuning fork having a fre-
quency of about 300 Hz, held close to the diaphragm, yield a barely discernible
signal on the oscilloscope at full gain of the amplifier..." [the amplifier
used had a maximum gain of approximately 2000]". "When the handle of the fork
was held against the diaphragm, a fairly large signal was observed on the oscil-
loscope. This signal, as well as that transmitted to the device through air,
had the frequency of the vibrating fork and exhibited a sinusoidal wave
form. [El]
This type of pressure transducer, originally designed by an oil company,
was used to measure the pressure fluctuations in a pipeline.
IF POROUS DISK
.—POLAR FLUID
0 _
DIAPHRAGM STATIC
DIAPHRAGM DEFLECTED
Figure 6.151 Electrokinetic pressure transducer.
119

ELECTROKINETIC SPECIFICATIONS
Types of pressure measuremènt (includingbase limitation for differential):
Dynamic gage (including vacuum)
Pressure ranges:
Limited only by diaphragm design (see "Diaphragm" section).
Temperature (range, compensation, and stability):
Operation not effected by small temperature changes and is stable.
••' Calibration: -
Dynamic calibration must be made.
Vibration effects: ••-. -
Very sensitive to vibration. Depending on if themode of-vibration-
is-in or out-of phase with the stream-being-measured will-determine
whether the effect is additive or substractive.
Materials:
Stainless steel, glass, and lucite, polar fluid (often a volatile
poisonous cyanide compound), fritted glass, and platinum leads.
Oxygen usage:
The electrokinetic pressure transducer may be suitable for use
with ambient or cool oxygen. Oxygen near the liquid temperature
will freeze the polar fluid and make its use impractical.
Installation requirements and limitations:
Unit is bulky.

Advantages:
1. High damping exhibited and no ringing frequency.
2. Frequency response high.
3. High output (- 350 my
4. self-generating
5. Transducer is quite rugged.
Disadvantages:
1. Static pressure measurement not. possible.
2. Accuracy of calibration limited because unit cannot be calibrated
statically.
3. Zero-restoration poor.
4. Diaphragm distortion occurs with electrical bias.
5. Generally, the polar fluid used is a volatile, poisonous cyanide
compound. .

6.16 MAGNETOSTRICTIVE
The magnetic properties of a ferromagnetic material change whén
stress is applied to the material. This phenomenon is known ap magnetostric-
tion. It can be used to convert mechanical effects into magnetic effects and
vice versa. Figure 6.161 gives an example of how the basic principle of
magnetostriction is used in a pressure measuring device.
Smith and LuxfordEMfl state that "...the magnetostriction effect varies
greatly with the composition and heat treatment of the magnetic material.
It is large in some nickel-iron alloys, some cobalt-iron alloys, and
especially in pure nickel in the annealed condition". For pure nickel the
magnetic properties change appreciably upon an application of moderate
mechanical stress.
When the magnetostrictive pressure transducer is used in conjunction
with a milliamxneter, the device can only measure slowly varying pressures.
To increase the frequency response, an indicating instrument capable of
following a rapidly varying system must be used - e.g., a cathode ray
oscillograph.
Hysteresis effects are common to all magnetic materials in varying
degrees. Generally speaking, hysteresis is a minimum when the metal is in
fully annealed gas-free condition, produced by vacuum annealing or annealing
in hydrogen[M1i. Hysteresis is undesirable in any measuring device and
some method of minimizing its effects is essential to success.
Smith and Luxford go on to say .the method used is to bring the metal
to a standard magnetic condition by saturating it, that is, by the applica-
tion of a magnetic field sufficiently strong to orient substantially all , the
magnetic elements in one direction. By use of an alternating magnetizing
field, the metal may be brought to this standard condition as often as
may be desired".
The heating effect of eddy currents induced in the metal by the alternat-
ing field must be minimized by the use of thin material, for example, thin
walled tube, wire, or stampings.122
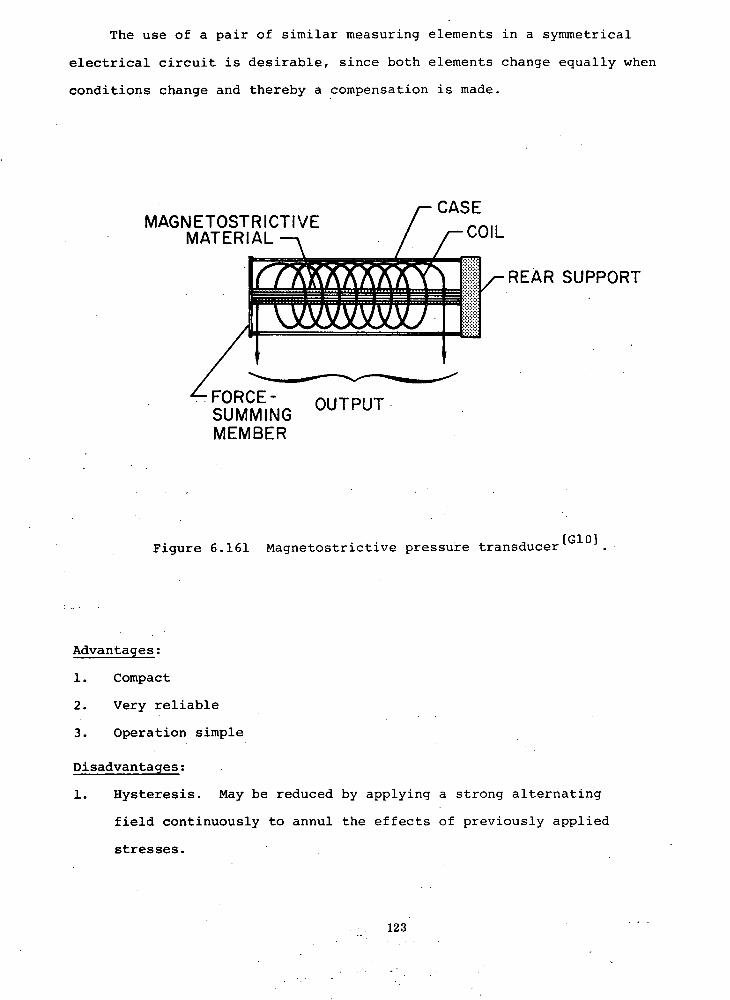
MACN
REAR SUPPORT
The use of a pair of similar measuring elements in a symmetrical
electrical circuit is desirable, since both elements change equally when
conditions change and thereby a compensation is made.
f A (' r
• I OUTPUT SUMMING MEMBER
[Gb] Figure 6.161 Magnetostrictive pressure transducer
Advantages:
1. Compact
2. Very reliable
3. Operation simple
Disadvantages:
1. Hysteresis. May be reduced by applying a strong alternating
field continuously to annul the effects of previously applied
stresses.
123
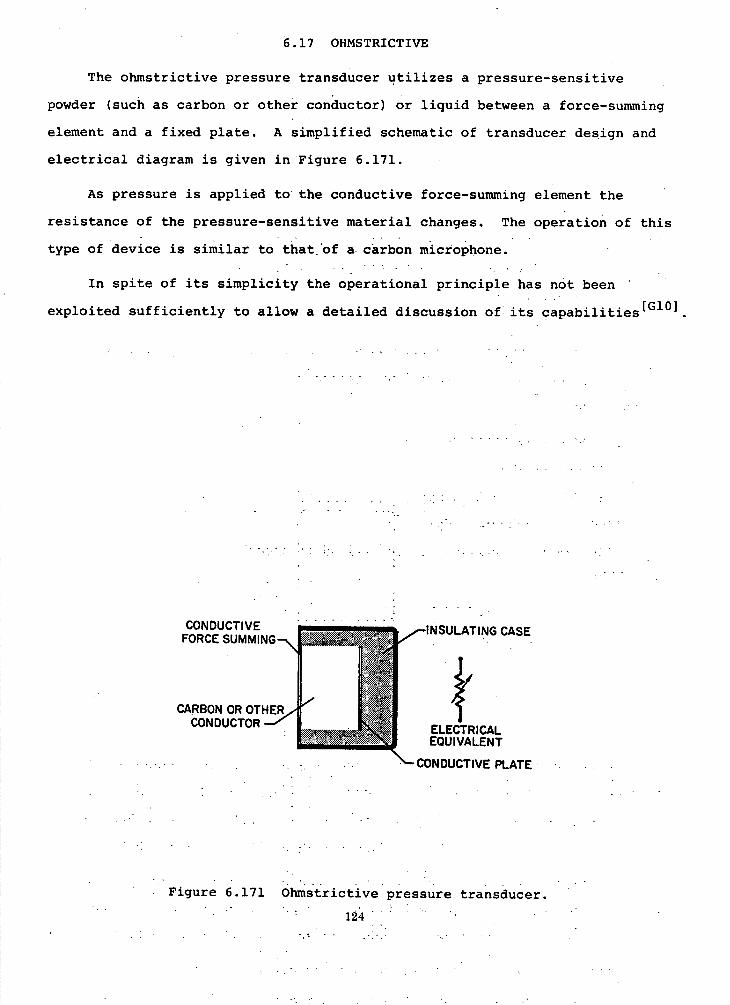
6.17 OHMSTRICTIVE
The ohmstrictive pressure transducer utilizes a pressure-sensitive
powder (such as carbon or other conductor) or liquid between a force-summing
element and a fixed plate. A simplified schematic of transducer design and
electrical diagram is given in Figure 6.171.
As pressure is applied to the conductive force-summing element the
resistance of the pressure-sensitive material changes. The operation of this
type of device is similar to that'of a carbon microphone.
In spite of its simplicity the operational principle has not been
exploited sufficiently to allow a detailed discussion of its capabilities
CONDUCTIVE INSULATING FORCE SUM
CASE
CARBON OR OTHER LI CONDUCTOR—'
ELECTRICAL EQUIVALENT
CONDUCTIVE PLATE . .
Figure 6.171 Ohmstrictive pressure transducer.
124
Advantages:•V V
1. Can be used statically or dynaniical-iy.
2. Rugged:
3. Inexpensive. V
VV
4. High reliability. V
V
5. High output. V V V
6. Will operate at high frequencies.. V
7. Easy to manufacture an& may be made small.. V V
Disadvantages: V V
'
V V
V V
'
1. Without compensation may be, thermally unstable.
2. Some inherent electrical noise.
3. Questionable repeatability.
4. Vibration sensitive.
125

6.18 FORCE-BALANCE
Although other basic principles may be used with this device, most
- applications employ either a capacitive or linear variable differential
transformer element to sense the applied pressure. Figure 6.181 illustrates
the electrical arrangement of the self-restoring force balance transducer.
The output of the sensing element is fed to an amplifier, which in
turn feeds back a restoring force equal to the applied pressure. The
sensing mechanism is then returned to its original position (by a servo)
before the force was applied.
FORCE SUMMING QUENCH FREQUENCY
MECHANICAL LINK—. iIIIIIII !(" OSCILLATOR
AMPLIFIER
RESTORING COIL
BASIC FORMULA: /
I = OUTPUT CURRENT ThRU RESTORING COIL a ACCELERATION
UNIT OF TORQUE FORCE
b2 = DIMENSIONAL CONSTANT
B = MAGNETIC FLUX DENSITY
M = UNBALANCE MOMENT
Figure 6.181 Force-balance pressure transducer.
126

Advantages:
1. Measurements may be made statically or dynamically.
2. Accuracy good.
3. Stable.
4. Excellent resolution.
5. Output high.
Disadvantages:
1. Expensive.
2. Frequency response low.
3. Installation limited by its large size and weight.
4. Very sensitive to acceleration or shock.
5. Electrically complex.
127

6.19 OSCILLATING
"The frequency of a transistor oscillator is varied as a function of
inductance or capacitance change in the force-suxnxning member and.associated
transduction eiement" 1 . The stability of the oscillator circuit in
this type of pressure transducer is of prime consideration. Also, the tem-
perature range of operation is currently restricted to the operating range
of silicon transistors. Figure 6.191 illustrates the basic principle for
oscillating transducers.
/--CAPACITOR
VARIABLE COIL
FM OUTPUT
COUPLING
OSCILLATOR
FORCE SUMMING
PRESSURE PORT
BASIC FORMULA: 1f z f-f0
Of FREQUENCY DEVIATIONS
f OPERATING FREQUENCY
fo RESONANT FREQUENCY (No Force)
Figure 6.191 Oscillating pressure transducer.
128
Advantages:
1. Small.
2. Dynamic or static measurements.
3. May be used for telemetering purposes.
4. High output.
5. Output may be shown as actual decimal unit counts representing
applied pressure.
Disadvantages:
1. Temperature range limited.
2. Accuracy low.
3. High cost.
4. Special electronics required to provide analog information.
5. Low thermal stability.
6. Poor thermal zero shift.
129
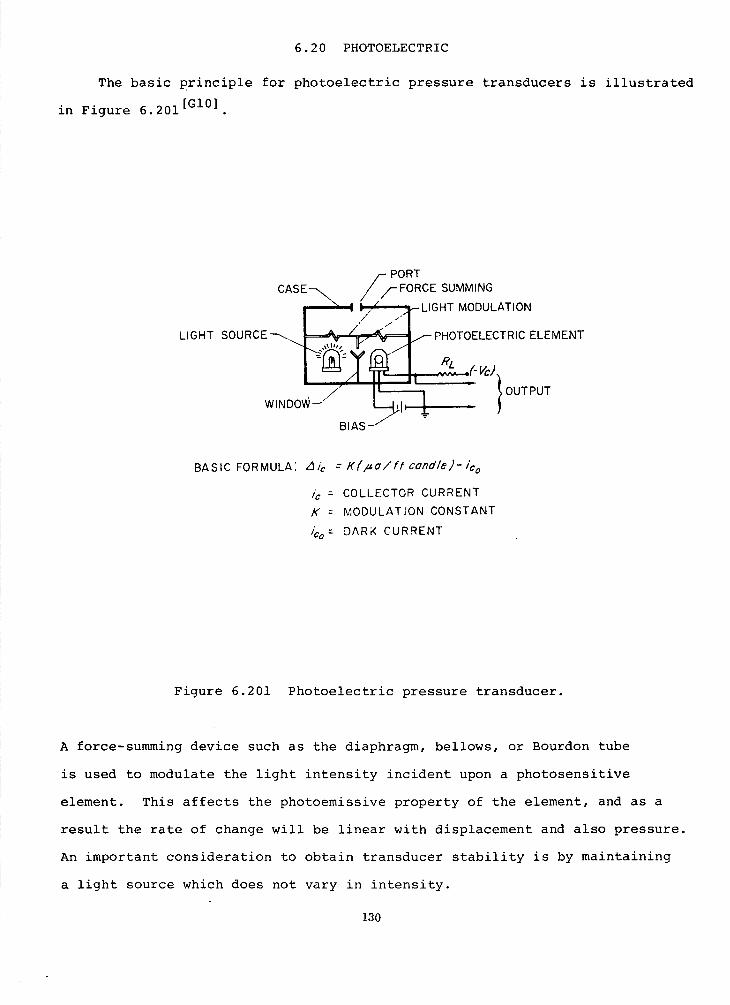
6.20 PHOTOELECTRIC
The basic principle for photoelectric pressure transducers is illustrated
[Gb] in Figure 6.201
,- PORT CASE-N,,,,// ,/-FORCE SUMMING
I I' ,-LIGHT MODULATION
LIGHT SOURCE — .. ELEMENT
LRL( I jjt= WINDOW
II
• I
}OUTPUT
BIAS
BASIC FORMULA: i/ K(#a/ft candle) -1c0
COLLECTOR CURRENT
K MODULATION CONSTANT
DARK CURRENT
Figure 6.201 Photoelectric pressure transducer.
A force-summing device such as the diaphragm, bellows, or Bourdon tube
is used to modulate the light intensity incident upon a photosensitive
element. This affects the photoemissive property of the element, and as a
result the rate of change will be linear with displacement and also pressure.
An important consideration to obtain transducer stability is by maintaining
a light source which does not vary in intensity.
130
Advantages:
1. High output.
2. Construction can be simple.
3. Static and dynamic measurements may be made.
Disadvantages:
1. Large displacements are required.
2. Low frequency response.
3. Long-term stability can be poor.
4. Limited temperature range.
131
7. LOW-TEMPERATURE CALIBRATION METHODS
Pressure transducer calibration at cryogenic temperatures present
special problems some of which depend on transducer typeliC2iC5C61.
Transducers such as strain gage, potentiometric, capacitance, inductance,
reluctance, and piezoelectrics may be fabricated as sealed units for total
immersion into the cryogenic medium for a more direct measurement of
pressure. In this case, only the electrical leads are taken from the
transducer to ambient conditions and therefore, heat leak is significantly
reduced. 'All types mentioned above have their own operational characteristics
when operated at low-temperature.
Other pressure transducer types (e.g., manometer, transport property,
electrokinetic, etc.)' may be difficult to calibrate or totally unsuitable for
use at low temperature.
McLellan [C71 indicates a method for calibrating pressure transducers
down to 7,K with static pressures up to 2,000 psi. A schematic drawing' of
the system is shown in Figure 7.1. Unfortunately, no test data were given
in the report; however, ,,five transducers were said to have been calibrated
successfully at 7 K withut any problem. -.
132

. w.. (.9 (1)-
w a:—J Iii
UJ
Z.
cli
a.
w
UJ CCI I rh IzI
cry.,
WO Q.
cn
rRl
UJcr
A4 J
0 £c_)
q)
010 cr
Cl) E w
. (r o
133

ELI JAR
IT CARRIER
WEIGHTS
ATING
INDER
VACUUM NN ECT ION
BELT DRIV
B. CALIBRATION TECHNIQUES (OTHER)
8.1 DEADWEIGHT TESTERS
The deadweight tester, as the manometer, is also considered aprimary
standard for pressure measurement and is used for the calibration of less
accurate gages or transducers. Depending on calibration pressure range,
there are two basic types of deadweight testers. The first, schematically
shown in Figure 8.11, is a low-range (0.3-1.5 to 1.5-500 psi) device which
can measure gage or absolute pressure (by evacuation of the bell jar).
LEVCLLII'1J
Figure 8.11 Low-pressure deadweight tester.
134

Where low pressures are used no special method is necessary to control
the clearance between the piston and cylinder (with high-pressure deadweight
testers this becomes an important factor).
The low-range device (shown in Figure 8.11) uses air as the working
fluid. A source of clean, filtered, compressed air must be provided. The
use of air is desirable, as it minimizes the head and buoyancy errors which
require calculation of corrections if a liquid were used.
The high-pressure deadweight tester is shown in Figure 8.12 and differs
from the low-pressure device in that a method for controlling the clearance
between the cylinder and piston is used. Deadweight testers for use over
10,000 psi employ some special method to control the clearance between the
piston and cylinder, to improve accuracy and prevent excessive leakage.
GAGE UNDER WEIGHT [- TEST WEIGHTS iY HANDLER _______________
CYLINDER- 1 OIL RESERVOIR
PISTON PUMP
PISTON 1-CHECK VALVE
HIGH-PRESSURE DEADWEIGHT TESTER
Figure 8.12 High-pressure Deadweight Tester.
135
A high pressure oil chamber surrounds the cylinder and the oil pressure
within is controlled by a secondary source of fluid pressure. When very -
;high pressures are measured, fluid is pumped to the exterior chamber to
compress it slightly and counteract the natural tendency of the cylinder to
enlarge under the internal pressure being measured.
The piston in a deadweight tester is accurately machined and has a
definite area such as 1/8, 1/6, 1/40, or 1/80 in 2 . A platform is attached
to the top of the piston and serves to hold the weights. The total pressure
in the system (when balanced) i the combination of the weights, piston, and
platform assembly divided by the cross-sectional area of the piston. To
calibrate a gage, using the deadweight tester, the appropriate amount of
weight is placed on the platform assembly and the-system pressure is in-
creased until it offsets the platform assembly weight. When this occurs,
the platform, piston, and weights begin to "float". Friction in the system
is minimized by slowly rotating the weight handler during calibration.
The deadweight tester may be operated using water instead of oil for
the calibration of oxygen gages. However, the minimum pressures which may
be measured are higher due to the poor lubricating quality of water. When
water must be used, a small amount of soap added will improve the lubrica-
tion of the piston and cylinder assembly.
Oxygen and other gages which must be kept free from oil may be checked
on a normal deadweight tester using oil if a water filled "U" tube (or other
sealing device) is inserted between the gage and tester.
Cross [C171 indicates that error in measurement results from failure
to account for the parameters or from the uncertainty of the measured values
of them. It is obvious that error results from the uncertainty of the mass
of the loading weights and the measurement of the effective area of-the
piston and cylinder. Other sources of error may not be so. easily recognized.
Such sources include the air buoyancy on the weights, the fluid buoyancy on
the piston, the value of local gravity, the force on the piston due to the
136

surface tension of the fluid, the thermal expansion and elastic deformation
of the piston and cylinder, and the fluid heads involved. These effects can
be evaluated and corrections applied to reduce the magnitude of overall error
of measurement.
"Air buoyancy corrections amount to about 0.015 percent of the load.
The corrections for the buoyancy of the pressure fluid on the piston have
been found to range from zero to nearly 0.5 psi, and could be larger. The
values of local gravity differ by over 0.3 percent at different places in the
United States. The pressure correction due to surface tension is usually
negligible, but may amount to more than 0.003 psi. Thermal expansion of
the effective piston area is usually about 0.003 percent per °C and elastic.
distortion may amount to 0.05 percent at 10,000 psi. Fluid head amounts to..
,,[G2,C17] about 0.03 psi per inch for lubricating oils
For a deadweight gage tester connected to a tight system, with the
piston falling slowly because of the leakage of liquid past it, the effective
area is the average of the cross-section of the piston and the area of the
bore. This effective area is somewhat changed by temperature and the .
applied internal pressure (an important factor for high pressure measure-
ment). The following table will help to illustrate temperature effect.
Material
Effective area increase PPM/°F
Carbon steel (piston and cyl.) 13 Stainless steel (piston and cyl.) 18 Carbon steel (piston) and brass (cyl.) 17
The distortion of piston and cylinder under pressure is greatly
dependent on design and may either increase or decrease the effective
area by as much as a part in ten thousand at 10,000 Wear and
aging over a period of years will also change the dimensions of the piston
and cylinder which generally results in irregular errors.
137
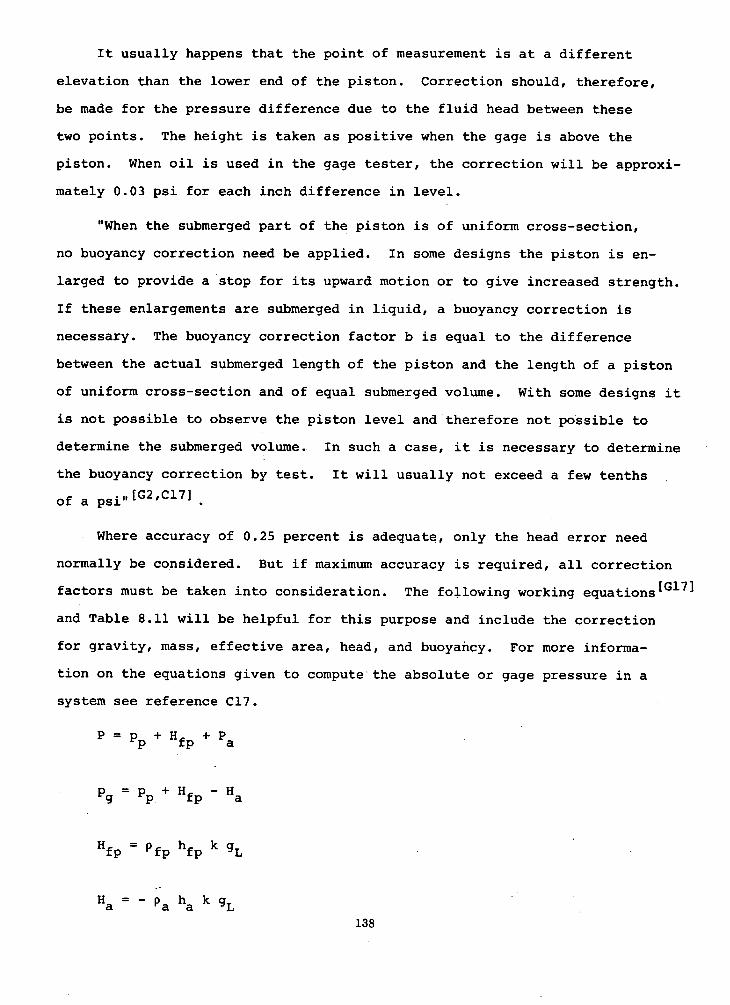
It usually happens that the point of measurement is at a different
elevation than the lower end of the piston. Correction should, therefore,
be made for the pressure difference due to the fluid head between these
two points. The height is taken as positive when the gage is above the
piston. When oil is used in the gage tester, the correction will be approxi-
mately 0.03 psi for each inch difference in level.
"When the submerged part of the piston is of uniform cross-section,
no buoyancy correction need be applied. In some designs the piston is en-
larged to provide a stop for its upward motion or to give increased strength.
If these enlargements are submerged in liquid, a buoyancy correction is
necessary. The buoyancy correction factor b is equal to the difference
between the actual submerged length of the piston and the length of a piston
of uniform cross-section and of equal submerged volume. With some designs it
is not possible to observe the piston level and therefore not possible to
determine the submerged volume. In such a case, it is necessary to determine
the buoyancy correction by test. It will usually not exceed a few tenths
of a psi1[G21Cl7]
Where accuracy of 0.25 percent is adequate, only the head error need
normally be considered. But if maximum accuracy is required, all correction
factors must be taken into consideration. The following working equations
and Table 8.11 will be helpful for this purpose and include the correction
for gravity, mass, effective area, head, and buoyancy. For more informa-
tion on the equations given to compute the absolute or gage pressure in a
system see reference C17.
P=p +H +P p fp a
Pg = P, + Hf - Ha
Hf = P f hf k
Ha = - a ha k
138
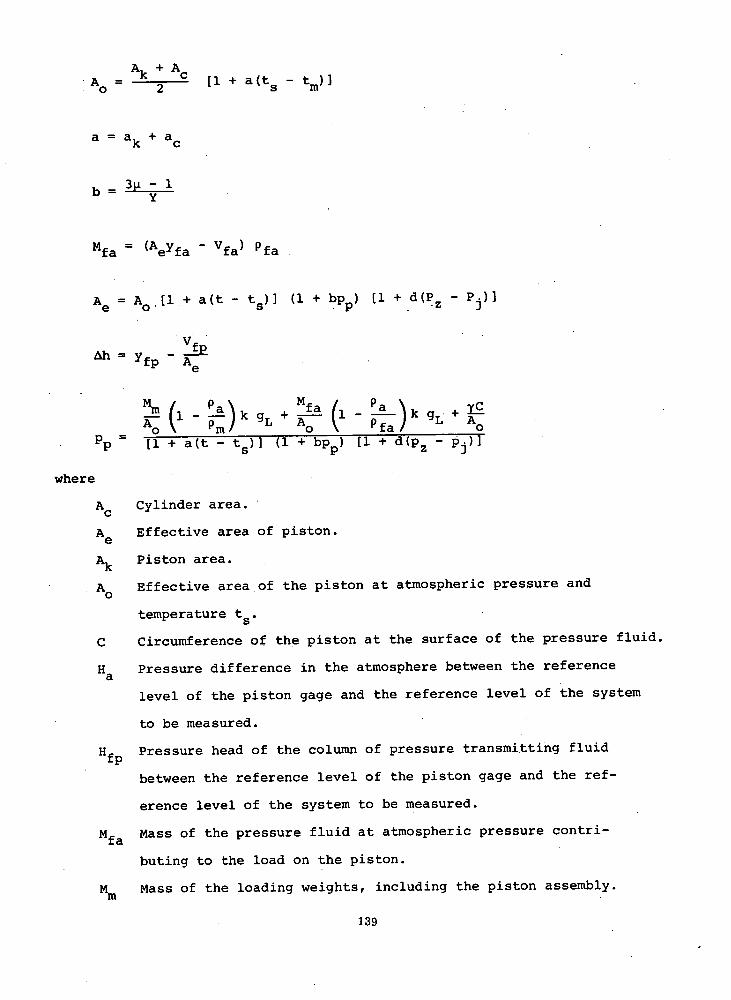
+AC [l+a(tS -tm)]
a = a + a
b - 31.t - 1 Y
Mfa = (AYf a - Vf a Pfa
Ae = A0 [l . + a(t - t 5)] (1 + bp) [1 +d(P P)1
fp
Mm I pa)k+ Mfa ( - L .---\k PM 0 fa/ A0
pp = 11 + a(t - t5)] (1 + bp p ) [1 + d(p- P) where
Ac Cylinder area.
Ae Effective area of piston.
A Piston area.
A0 Effective area of the piston at atmospheric pressure and
temperature t5.
C Circumference of the piston at the surface of the pressure fluid.
Ha Pressure difference in the atmosphere between the reference
level of the piston gage and the reference level of the system
to be measured.
Hf Pressure head of the column of pressure transmitting fluid
between the reference level of the piston gage and the ref-
erence level of the system to be measured.
Mfa Mass of the pressure fluid at atmospheric pressure contri-
buting to the load on the piston.
Mm Mass of the loading weights, including the piston assembly.
139

P Absolute (total) pressure.
a Atmospheric pressure at the reference level of the piston gage.
Vfa Volume of the submerged part of the piston above the cylinder.
Vfp Volume of the part of the piston below the cylinder.
Y Young's modulus.
a Fraátional change in effective area with unit change in
temperature.
b Fractional change in effective area with unit change in
pressure.
d Fractional change in area with unit change in jacket pressure.
Local acceleration due to gravity.
ha Height of the air column measured from the reference level
of the piston gage to the reference level of the system. Mea-
surements up from the piston gage reference level are positive.
hf Height of the column of pressure fluid measured from the ref-
erence level of the piston gage to the reference level of the
system. Measurements up from the piston gage reference level
are positive.
.h Height of the reference level of the piston gage with respect
to the bottom of the piston. Measurements up from the bottom
of the piston are positive.
k Proportionality factor relating force, mass and gravity.
p Gage pressure.
p Jacket pressure.
p Pressure measured by piston gage at the reference level of
the piston gage.
Pz Jacket pressure required to reduce the piston-cylinder
clearance to zero.
t Temperature of the piston gage.
t Temperature at which piston and cylinder are measured.
t Reference temperature (usually the nominal room temperature).
140
'fa Length of the submerged part of the piston above the cylinder.
Yfp Length of the part of the piston below the cylinder.
ac Temperature coefficient of linear expansion of the cylinder.
a Temperature coefficient of linear expansion of the piston.
Y Surface tension of the pressure fluid.
t Poisson's ratio for the piston.
Pa Mean density of the air displaced by the load.
fa Density of the pressure fluid at atmospheric pressure.
Pfp Density of the pressure fluid at pressure P.
Pm Density of the weights.
141

TABLE 8.11
GRAVITY VS LATITUDE
(Based on Standard Gravity & Interntional Gravity Formula)
gs = 980.665 cm/sec2
z(p = 978.0490 (1 + .0052884 sin 2(p - .0000059 sin 2p)
gp cm/sec2
0 978.0490 5 978.0881
10 978.2043 15 978.3941 20 978.6517 21 978.7107 22 978.7721 23 978.8356 24 978.9015 25 978.9693 26 979.0394 27 979.1113 28 979.1850 29 979.2606 30 979.3378 31 979.4165 32 979.4968 33 979.5785 34 979.6614 35 979.7455 36 979.8308 37 979.9170 38 980.0041 39 980.0919 40 980.1805 41 980.2696 42 980.3592 43 980.4489 44 980.5391 45 980.6294
45 0 23.670' 980.66500 46 980.7197 47 980.8097 48 980.8998 49 980.9894 50 981.0787 55 981.5146 60 981.9239 65 982.2941 70 982.6139 75 982.8733 80 983.0646 85 983.1818 90 983.2213
142

Tolerances on the weights and effective diameter must be maintained to
minimize error in the total tester. The following two tables set the toler-
ances to insure a total error of 0.10 percent or less for the system2.
Table 8.12 Effective diameter.
Area, in Effective diameter, in Tolerance, in
1/8 0.398942 ± 0.000100
1/16 0.282095 ± 0.000070
1/40 0.178412 ± 0.000040
1/80 0.126157 ± 0.000031
Table 8.13 weight tolerance.
Weight, oz 5 10 20 40 100
Tolerance, oz ± 0.0025 ± 0.005 ± 0.010 ± 0.020 ± 0.050
Pressure value in psi when used with an area of:
1/8 in 2.5 5 10 20 50
1/16 5.0 10 20 40 100
1/40 12.5 25 50 100 250
1/80 25.0 50 100 200 500
In Figure 8.13 is a simplified block diagram which typifies the components
necessary for a low-pressure deadweight calibration system.
143
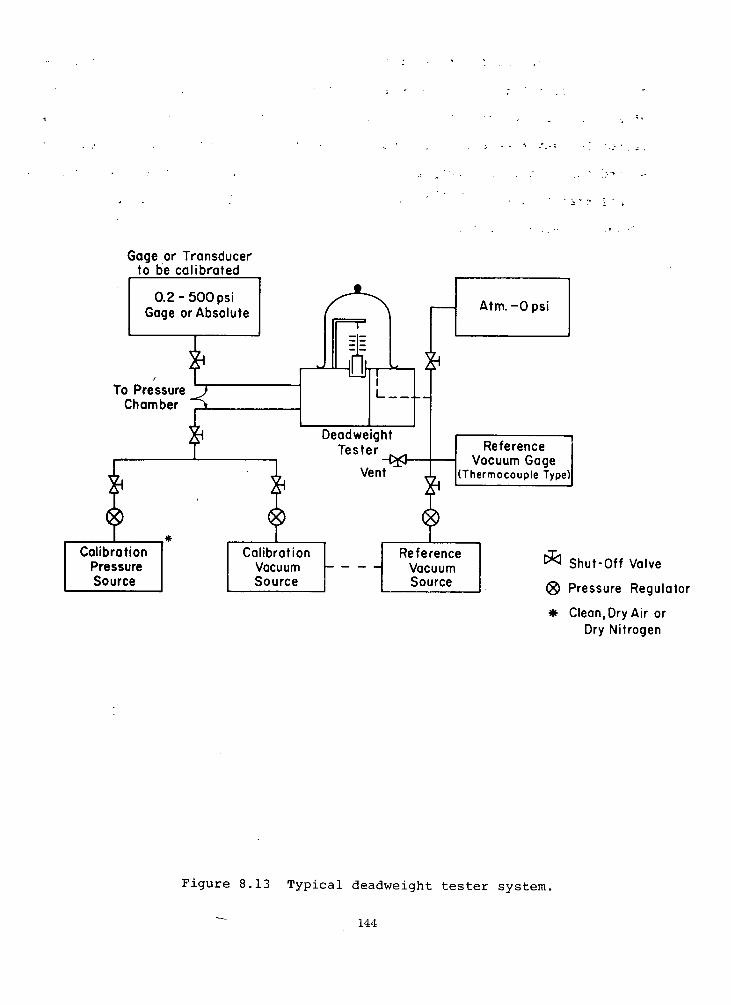
Gage or Transducer to be calibrated
0.2- 500 psi Gage or Absolute Atm. -0 psi
To Pressure
ChamberJI Tester
Vent
Reference Vacuum Gage
(Thermocouple Type)
I * I
Calibration Calibration Pressure Vacuum - - Source Source
Reference Vacuum Shut-Off Valve
Source ® Pressure Regulator
*
Clean, Dry Air or Dry Nitrogen
Figure 8.13 Typical deadweight tester system.
144

Each of the following sections, on the dynamic calibration of pressure
transducers, 8.2 to 8.7, are covered briefly in this report due to the lack
of information in the literature with respect to oxygen service. Their basic
principle, nevertheless, for pressure transducer calibration may be ideally
suited for a given low-temperature system. References furnished in section 9
on calibration methods 81 will be very helpful for anyone wishing to
pursue the subject further.
145

8.2 SHOCK TUBE
"A Shock tube, in its simplest form, consists of two sections of tubing
separated by a thin diaphragm. When these two sections are pressurized to
different pressure levels and the diaphragn is suddenly ruptured, the higher
pressure gas will immediately begin to flow into and compress the gas at
lower pressure" 9 . Figure 8.21 illustrates a typical shock tube arrange-
ment for calibrating pressure transducers.
The shock wave, as it continues to move downstream through the tube,
is well-formed after a distance of approximately 10 to 15 tube diameters,
after which, the wave continues to progress at a constant velocity. Behind
the shock wave the pressure suddenly rises resulting in a positive pressure
step. The shock tube's rise time between pressure levels is typically on
the order of 10 9 s. The shock tube is commonly referred to as a step-function
generator and should be able to change the pressure from one level to another
in short enough time to shock excite high-frequency pressure transducers.
High mach numbers may be obtained by using properly selected gases in the
shock tube chambers. Also, by heating the compression chamber and cooling
the expansion chamber an increased mach number may be realized.
"When a shock tube is utilized for pressure transducer calibration,
several parameters must be measured before the amplitude of the pressure
step can be ascertained. These parameters include the shock wave velocity,
V, and theinitia1 absolute pressure, P 1 , and temperature, T1 , of the gas
in the low pressure section" [C91
146

LOAD SOLENOID
PUNCTURE T LOAD SOLENOID SOLENOID
(7
COMPRESSION PRESSURE
(7)
VENT
/
FROM I
SUPPLY CYLINDER
COMPRESSION SUPPLY
--(7).
PUNCTURE EXPANSION SUPPLY SUPPLY
-(7) /
VENT
VENT I VENT
VENTS
VENTS
GAS SUPPLY and CONTROL
SYSTEM
STATIC PRESSURE and TEMPERATURE
MEASURING SYSTEM
' I I TRANSDUCER 1 Y ELECTRONIC SHOCK SYSTEM
VELOCITY MEASURING
SYSTEM OSCILLOSCOPE
INDICATOR
Figure 8.21 Shock tube calibration system.
147

8.3 SIREN
The siren technique for calibrating low and medium pressure trans-
ducers utilizes a siren-tuned-cavity oscillator for generating periodic (but
not necessarily sinusoidal) pressure wavesEC]. Figure 8.31 shows the
basic components of the system. The essential elements of the siren-tuned-
cavity generator are a cylindrical chamber with an axial orifice in one end
and a revolving disc having a number of equally spaced holes arranged around
its periphery. The wheel is positioned as shown in Figure 8.31 and rotated
to interrupt the flow of air from an axial hole in the tuned-cavity. As a
result, periodic pressure waves are generated with a waveform which is typical
to that shown in Figure 8.31.
Two adjustments are necessary in order to operate the generator effecti-
vely. For each rotational speed of the siren (perforated disc) and the number
of holes in that disc a pressure wave frequency will be produced. When the
length of the cylinder is adjusted such that it acts as a half-wave resonator
the pressure wave is reinforced and the amplitude at the transducer is deter-
mined.
"For purposes of calibration, the value of pressure at the cavity-
transducer interface is measured with a previously calibrated transducer, or
it is computed using methods described by Oberst When measured
pressures are used as a standard, the calibrated gage must be an instrument
with a uniform frequency response up to frequencies several times higher
than the 'test frequency" [ClO]
Using this device peak pressures of up to 30 psi are possible with
pulsation rates of from 50 to 1000 Hz.
148

HIGH PRESSURE AIR
lei
Q 000
oc 0
• I I ,-PRESSURE I TRANSDUCER
TUNED CAVITY
PERFORATED ROTATING DISC
Ui
,- TYPICAL WAVEFORM PRODUCED 6 1
,/ BY ABOVE DEVICE (1)1 WI
N N a.
TIME
Figure 8.31 Siren-tuned-cavity generator.
149
8.4 ROTATING-VALVE GENERATORS
A forcing function with precisely controlled repetitive pressure pulses
is sometimes necessary for the calibration of certain pressure transducers.
A schematic representation of the mechanical device which generates such a
pressure pulse is shown in Figure 8.41. Also, in the same figure, a typical
wave form is shown with the average time between pulses on the order of 10-1
seconds. The device generates pulses at relatively low frequencies and levels
of pressure may be precisely preset by means of pressure gages. By adjusting CO
the speed of the driving motor, and consequently that of the rotation valve,
a desired pulse repetition rate may be obtained. At higher repetition rates
pressure steps may become distorted due a resonant effect created by the
inertia of the gas column in the system. Therefore, this device is limited
to operational frequencies below which the resonant effect is observed.
Schweppe[ClOI says that "Normally, the square pressure pulses generated
by the rotating-valve device are not truly shock waves. Unlike the short-
term, high intensity pulses generated by the acoustical-shock generator, the
pulses from the rotating-valve generator are of longer duration (say, about
100 msec as compared to 250 tsec) and lesser intensity (say, about 10 to 15
psi per step as compared to 200 psi).
"A major disadvantage of the rotating-valve generator is the presence
of the relatively long tube between the transducer under test and the rotat-
ing-valve mechanism. In effect, it introduces a half-wave resonator into the
calibration system which limits the effectiveness of the generator at high
frequencies".
Another version of the rotating-valve generator produces a step-function
pressure wave form as shown in Figure 8.42. This may be accomplished by
proper design of the rotating valve such that several ports (both inlet and
outlet) provide various individual inlet pressures with each having a unique
axial orientation (each corresponding to a step in pressure) [ClO]
150

VALVE HOUSING
TRANSDUCER PRESSURE- SENSING ELEMENT
PRESSURE TRANSDUCER
ROTATING VALVE
10 INLET—
HIGH PRESSUREOUTLET— I
LOWW PRESSURE
w Cr
(,) U) Lu cr
TYPICAL WAVEFORM PROVIDED BY ABOVE GENERATOR
TIME
Figure 8.41 Rotating-valve pulse-function generator.
151
A-1
48
Figure 8.42 Rotating-valve step-function wave form.
152

8.5 LOW-FREQUENCY PNEUMATIC SINUSOIDAL GENERATOR
The pneumatic sinusoidal generator schematically shown in Figure
8.51 and was primarily designed for low-frequency, low-amplitude calibra-
tion. The obvious way to produce a sinusoidal pressure variation is by using
a piston-in-cylinder device. A piston-in-cylinder generator when operated
at high frequency and high amplitude produce pressure waves which are
characterized by nonlinear effects [ClO]
The motion of the piston is sinusoidal with a frequency of w (where
w = 2itf) and the gas in the tube is assumed to behave ideally (where
P = pRT).
Nominally, the output of a low-frequency pneumatic sinusoidal generator
is in the range from 5 to 25 psi, but different ranges may be obtained by
adjusting the operating stroke of the piston.
X X0 Cos wtII
Gas (or Liquid) I I d
x=o NOTE: >> ' ,t ; P pRT
Firure 8.51 Low-frequency pneumatic sinusoid generator (piston-in-cylinder model).
153

Electrical insulation
Lead
Iron core
8.6 ELECTROMAGNETIC METHODS
Electromagnetic methods for pressure transducer calibration may be
used on devices which have diaphragms of magnetic material. The simplified
schematic shown i n Figure -8.61 iTIustrates the way in which a direct-excita-
tion technique displaces the diaphragm (using a solenoid). Diaphragm assembly
damping can be sensed and measured accurately to determine decay-rates and
from these decay-rate measurements, the logarithmic decrement can be -.
computed directly.
Schweppe indicates that "By exposing the pressure-sensitive
diaphragm to the atmosphere, the oscillatory motion of the transducer po-
duces a corresponding pressure variation on the sensing element. The ab-
solute movement of the diaphragm can be sensed and measured optically (at
low frequencies) or by a capacitance pickup (shown in Figure 8.61). The
frequency range over which this method has been used is reported to be 3,000
Hz under normal conditions and, with special equipment, 8,000 Hz6.
Pressure levels are low (usually no more than 50 to 60 psi).
Diaphragm (Magnetic material)
.1upuciiun..e
pickup
'- Pressure transducer housing
Figure 8.61 Arrangement for caliration using the electromagnetic technique.
154

8.7 HYDRAULIC SINUSOIDAL
The hydraulic sinusoidal generator is similar to the low-frequency
pneumatic sinusoidal generator discussed in section 8.5; the only difference
being a liquid is used as the active medium instead of gas The
apparatus used is basically the same as the pneumatic sinusoidal generator
shown in Figure 8.51. Principally, the differences between gas-and-liquid-
piston-in-cylinder devices are associated with the incompressibility of liquids.
155
9. RECOMMENDATIONS
Data in the literature covering pressure transducer behavior at cryo-
genic temperatures are extremely limited, and in many cases not well docu-
mented. Therefore, an accurate evaluation is not possible.
Many pressure measurements are currently being made in low temperature
systems; however, these are generally performed with the transducer at room
temperature and connected to the system via piping. Using this method for
pressure measurement, as one might expect, can greatly affect the accuracy
and frequency response of the device, particularly if long lines with small
diameters are used. In addition, where several transducers-at various locations
in a system are necessary the total heat leak due to the instrumentation lines
may be large. For problems of this type refer to the sections on "Cryogenic
Pressure Measurement and Pressure Tap Connections'.
Transducers, at low temperature, usually experience one or more of the
following; a change in sensitivity, a zero shift, an erratic performance
(including non-linear behavior), or a complete failure. Smelser 57 per-
formed tests on capacitance, potentiometric, and strain gage (both bonded and
unbonded) pressure transducers at ambient conditions (298 K), at IN (77 K),
and at LH 2 (20 K). It was his conclusion that "...judging among the samples
included in this series of tests, it appears that the unbonded strain gage
will give the most satisfactory results at cryogenic temperatures. With the
unbonded strain gage, measurements with an accuracy comparable to that ob-
tainable at room temperature appear possible, if the instrument is used over
a reasonable temperature span, and if the calibration is checked each time the
instrument is cooled down. However,, in a situation where large transient tem-
perature excursions are experienced, as in the cooldown of a transfer line,
their use would be questionable because of the possibility of large transient
errors.
"The potentiometer type also appears to be quite useful. The best of the
two tested showed more thermal cycling effects than the unbonded strain gage,
156
but no tendency to produce transient errors during rapid cooling was observed.
A calibration check each time the instrument is cooled down would assure the
best results".
Hayakawa 359 in a similar study found no transducer capable of perfor-
mance predictable within 2 percent. Therefore, it is highly recommended that
additional work be done on evaluating other transducer types, other methods
of construction as well as retesting of transducers tested in the earlier
programs. Once a firm, well documented, state of the art base has been estab-
lished experimentally then any additional work necessary would be more clear.
Without a firm base there is a high probability of wasted effort in future
work in this area.
A cryogenic calibration system with varied capabilities is essential for
the successful completion of such a program described above. In response to
a request from the National Aeronautics and Space Administration (Marshall
Space Flight Center, Huntsville, Alabama) a pressure transducer calibration
facility has been constructed to statically and dynamically calibrate pressure
transducers at cryogenic temperatures. Static calibrations will be made at
pressures up to 10,000 psi. In addition, a dynamic calibration can be per-
formed by superimposing cyclic fluctuations (from 0-10 psi and 1-100 Hz)
upon any pre-selected base pressure to 10,000 psi. The versatility of such a
system will lend itself to document more fully the performance of pressure
transducers at low temperature.
The following is a brief description of the facility and Figure 9.1 shows
the basic principle of operation. The temperature range for calibrating
pressure transducers will be from 298 to 77 K initially but can be extended
to 4 K if necessary. Electromagnets were designed to fit within the upper
chamber of the apparatus and the volumetric change in each cell is created
by the displacement of a bellows (see Figure 9.2). The two pressure cells,
each having nominally the same dimensions, are joined with an intermediate
157
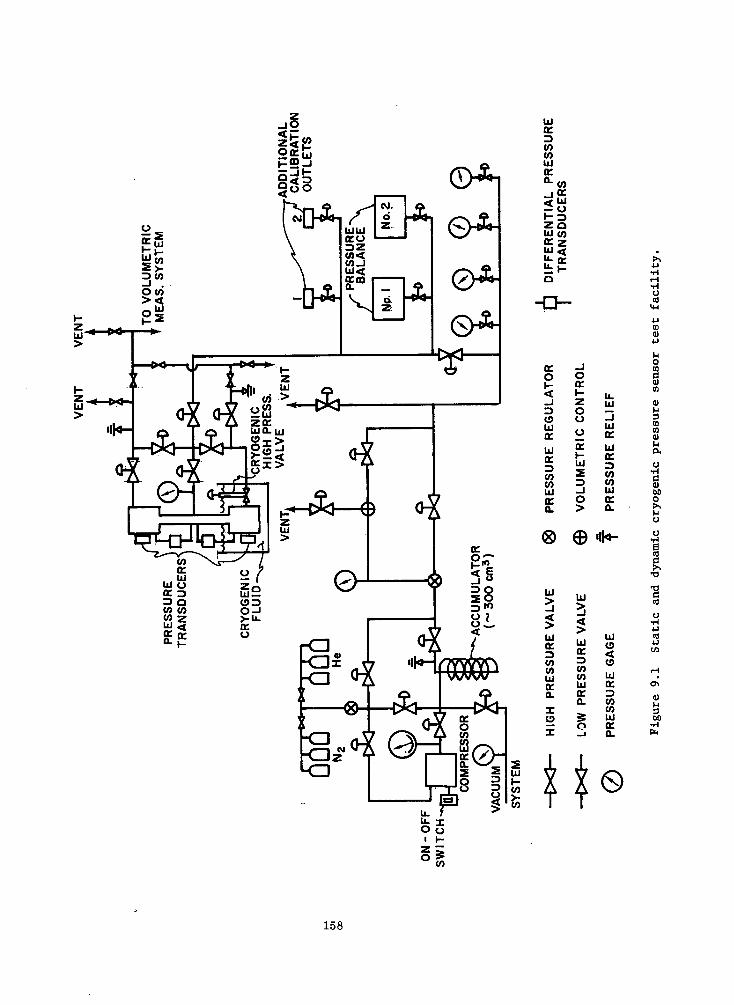
MOM
z 0
ir in w.
Ui
U) Cl) Ui ir
a-U)
4w
zc UJU)
W Cr
I-z Ui >
Ui
Ui
Cl) Cl) Ui
CL
X C, x
Ir 0
4 -J D (, Ui ir
Ui
U) Cl) Ui
IL
L&_7 U-I O
o
1-I -4 -4 -4 U
u-I
U) U U 1.1 0 to
U U)
U
U) to U II
U -4
U ba 0
U U
U co
U -4 U U U
(I
-4
C.'
U I-I U
-4
-J 0
U.
0 .J Ui
Ui Ui
U) U)
_J Ui 0 > a.
Ui
4 >
Ui Ui4 C,
Cl) U) UI Lii
D 0.. U)
Cl) UI
o —J 0_
158

- - -Teazas Mjtu
&idaid Coo Insist 11'
.1Iaiij & IiUq late
bs Cwctiu £.but L J_TtlI1w MiuI
=1r
Bellows - AmU1
)
J - ; ; ei
Spaces- --
Arma ture
Call C1LthM itsrmtdjats\\ ri r
_ - -- Iou Motor
wNewk T Sail
- ji DflU Rod
51 ci 124 i.I
Ambint S Ujotedc Cell Canictwi PIP
Ca Caa*CbCLOiCCodII L
ac:u- cqwm
Cqugcic
Translator Moo
Usual Miul Nags - Umiak Call
Figure 9.2 Static and dynamic pressure cell assembly.
159

volume and have in common a single actuating mechanism. The two pressure
cells, one at ambient temperature and the other submersed in the cryogen,
allow for the simultaneous calibration of a pair of similar pressure trans-
ducers (actually, provisions have been made to connect three pressure trans-
ducers at each cell making six the total number which can be tested simul-
taneously).
The static calibration will be made using pressure balances (similar to
a dead-weight tester) capable of measuring up to 10,000 psi. As shown in
Figure 9.1 two balances will be used; one for low pressure calibration from
0-500 psi and the other for pressures to 10,000 psi. For the 0-10,000 psi
balance the sensitivity is better than 0.05 percent of the reading and
accuracy is approximately one psi over the entire range. The 0-500 psi
pressure balance has comparable sensitivity (0.05 percent of the reading)
and an accuracy of 0.1 psi for lower pressures.
The system will monitor pressure transducer performance by the accumula-
tion of output on magnetic tape for complete analysis on the computer. In
addition, a small on-line computer will be connected to the system for real-
time reduction of data and to provide an immediate indication of transducer
performance.
160

10. REFERENCES AND BIBLIOGRAPHY
REFERENCE DESIGNATION
Category Symbol
General --------------------------G
Calibration-----------------------
Pressure Transducers
Bellows---------------------- B Bourdon tube ----------------- Bo Capacitance ------------------ Ca Diaphragm -------------------- D Diode ------------------------ Di Electrokinetic --------------- E Inductance ------ ------------- I Magnetostrictive ------------- M Manometer -------------------- Ma Micromanometers -------------- Mi Optical ---------------------- Op Piezoelectric ---------------- P Potentiometric --------------- P0 Reluctance ------------------- Re Strain ----------------------- S Vibrating Wire--------------- V
S
Page
185
190
192 193 194 196 197 198 199 200 201 203 204 205 206 207 208 209
161

GENERAL REFERENCES
Gi. D. M. Considine, Process Instruments and Controls Handbook
(McGraw-Hill Book Co. 1957) p. 3-1.
G2. ASME, "Pressure Measurement-Part 2", pp. 1-58 (1964).
G3. E. 0. Doebelin, Measurement Systems: Application and Design
(McGraw-Hill Book Co. 1966).
G4. G. A. Boutry, "Some Aspects of Instrumental Physics in France
(1939-1946), J. Sci. Instr., 24, No. 11, p. 281 (Nov. 1947).
G5. B. C. Moore, "Advantages of a Spherical Geometry in Vacuum Mea-
surements," J. Vac. Sci. Tech., 1-2, p. 211 (1964-65).
G6. C. G. Hylkema and R. B. Bowersox, "Experimental and Mathematical
Techniques for Determining the Dynamic Response of Pressure Gages,"
ISA Proc., 8, p. 115-120 (1953).
G7. P. G. Exline, "Pressure-Responsive Elements," ASME Trans.,
p. 625-632 (Nov. 1938)
G8. C. S. Draper and G. P. Bentley, "Design Factors Controlling the
Dynamic Performance of Instruments," ASME Trans., p. 421-432
(July 1940).
G9. R. T. Eckenrode and H. A. Kirshner, "Measurements of Pressure
Transients," Rev. Sci. Instr., 25, No. 1, p. 33-40 (Jan. 1954).
Gb. Anon., "Introduction to Transducers for Instrumentation," Statham
Instruments, Inc. (1966)
Gil. J. Grey, "Pressure Transducers," Prod. Eng., p. 174-179 (Jan. 1954).
G12. F. J. Woodcock, "Some Electrical Methods of Measuring Mechanical
Quantities," Inst. Elec. Engr., 97, p. 136-149 (1950).
G13. D. L. Johnston and D. W. Hobbs, "Electronics in Strain Measurement,"
Inst. Practice, p. 191-199 (Jan. 1953).
G14. J. W. Dean and T. M. Flynn, "Temperature Effects on Pressure
Transducers," ISA Trans., 5, p. 223-232 (1966).
G15. J. Johansson, "Cryogenic Measurements," Inst. & Cont. Sys., 38,
p. 107-111 (May 1965) .
162
G16. W. G. Brombacher, "Some Problems in the Precise Measurement
of Pressure," Inst., 22, p. 355-358 (April 1949).
G17. L. B. Hunt, "The History of Pressure Responsive Elements," J.
Sci. Instr., p. 37-42 (Mar. 1944).
G18. R. E. Clarridge, "Selecting Pressure Transducers," Automation,
9, No. 10, p. 82-87 (Oct. 1962)
G19. T. Dickson, "Selecting Strain Transducers," Automation, 9, No. 11,
p. 85-89 (Nov. 1962) . -
G20. J. H. Leck, "Pressure Measurements in Vacuum Systems," Reinhold
Publishing Corporation, New York, 1957.
G21. H. S. Harman, "Pressure Transducers for Environmental Extremes,"
ITS Res. Achievements Rev., 11, p. 11-17 (1968).
G22. F. Nagao and M. Ikegami, "Errors of an Indicator Due to a Connecting
Passage," Bull. JSME, 8, No. 29 (1965).
G23. A. L. Ducoffe and F. M. White, "The Problem of Pneumatic Pressure
Lag," ASME Trans., p. 234 (Jun. 1964).
G24. A. F. D'Souza and R. Oldenburger, "Dynamic Response of Fluid Lines,"
ASME Paper 63-WA-73 (1963).
G25. Anon., "High Pressure Measurement," Mech. Eng., p. 76 (Feb. 1963).
G26. H. K. P. Neubert, "Instrument Transducers," p. 50 (Clarendon Press
Ltd., Oxford, 1963).
G27. G. C. Ortman, "Photoelectric Pressure Sensing," ISA J., 9, No. 12,
p. 63-64 (Dec. 1962)
G28. R. E. Robinson and C. Y. Liu, "Dynamic Pressure Generation for
TransduceL Evaluation," Int £ (nnt. Svs., 42, p. 87 (Nov. 1969).
G29. D. J. Santeler, D. W. Jones, D. H. Holkeboer and F. Pagano,
"Vacuum Technology and Space Simulation," NASA SP-105 (1966).
G30. S. Dushman, "Scientific Foundation of Vacuum Techniques," Second
ed., p. 201-352 (J. M. Lafferty, ed., John Wiley & Sons, Inc., 1962).
G31. H. A. Steinhertz, "Handbook of High Vacuum Engineering," p. 80-109
(Reinhold Pub. Corp., New York, 1963).
G32. A. Guthrie, "Vacuum Technology," p. 142-197 (John Wiley & Sons, Inc.,
1963)163

033. M. Pirani and J. Yarwood, "Principles of Vacuum Engineering,"
p. 81-129 (Reinhold Pub. Corp., New York, 1961).
G34. D. M. Considine, Handbook of Applied Instrumentation (McGraw-Hill
Book Co., 1964).
G35. D. I. Gaf fee and A. Monroe, "Measurement of Small Differential
Pressures at Low Absolute Pressures," Nature, 174, No. 4433,
p. 756 (Oct. 16, 1954)
G36. H. McLeod, "Apparatus for Measurement of Low Pressures of a
Gas," Phil. Mag., 48, p. 110-112 (1874).
G37. C. Meinke and G. Reich, "Vermedung von Fehlmessungen mit dem
System McLeod-Kuhlfalle," yak. Technik, Bd. 12, Heft 3, p. 79-82,
(1963)
G38. J. R. Roehrig and G. F. Vanderschmidt, "Advances in the Design
of Vacuum Gauges Using Radioactive Materials," Trans. of the
Sixth National Symposium on Vacuum Technology, p. 82-84 (C. R. -
Meissner, ed., Pergamon Press, 1960).
G39. F. M. Penning, "High Vacuum Gauges," Philips Tech. Rev.,'2,
p. 201-208 (1937)
G40. P. A. Redhead, "Pressure Measurements at Ultra High Vacuum," 1.
Trans. of the Fifth National Symposium on Vacuum Technology,
p. 410-413 (W. G. Matheson, ed., Pergamon Press, 1959).
G41. W. S. Kreisman, "Attainment and Measurement of Pressures
Ranging From 10 6-10 2 mm Hg," Bull. Amer. Phys. Soc., ser. II,
8, No. 2, p. 143 (1963).
G42. D. J. Santeler, "Pressure Measurement in Non-Baked Ultra-High
Vacuum Systems," Trans. of the Eighth National Vacuum Symposium
and the Second International Congress on Vacuum Science and
Technology, p. 549-554 (L. E. Preuss, ed., Pergamon Press, 1962).
G43. G. Reich, "The Influence of Adsorption and Desorption on Measurements
of Low Pressures," Trans. of the Seventh National Symposium on
Vacuum Technology, p. 112-116 (C. R. Meissner, ed., Pergamon
Press, 1961)164

G44. R. W. Roberts and T. A. Vanderslice, "Ultra High Vacuum and Its
Applications," Prentice-Hall, Inc.., 1963.
G45. J. Blears, "Measurement of the Ultimate Pressures of Oil Diffusion:
Pumps," Proc. Roy. Soc. (London). Ser. A, 188, No. 1012,
p. 62-76 (Dec. 31, 1946)
G46. R. A. Haefer and J. Hengevoss, "Studies on the Blears Effect at
Pressure Measurements in the Ultra-High Vacuum Range," Trans.
of the Seventh National Symposium on Vacuum Technology, p. 67-74
(C. R. Meissner, ed., Pergamon Press, 1961).
G47. R. E. Rayle, "Influence of Orifice Geometry on Static Pressure
Measurements," ASME paper 59-A-234, presented at ASME annual
meeting Atlantic City, N.J. (1959).
G48. J. Hord, "Response of Pneumatic Pressure-Measurement Systems
to a Step Input in the Free Molecule, Transition, and Continuum
Flow Regimes," ISA Transactions 6, No. 3, 252-260 (1967).
G49. J. G. Hust and A. F. Clark, "A Survey of Compatibility of Materials
With High Pressure Oxygen Service," Cryogenics 13, No. 6, 325-336
(June 1973)
G50. J. G. Hust and A. F. Clark, Unpublished report (1973). Data available
from the authors at the National Bureau of Standards, Boulder, Cob.,
80302.
G51. H. Bankaitis and C. F. Schueller, "ASRDI Oxygen Technology Survey
Volume II: Cleaning Requirements, Procedures, and Verification
Techniques," NASA Special Publication SP-3072 76 pp (1972).
G52. Anon,"cleaning and Inspection Prcccdures for Ballistic Missile
Systems, Change 2," USAF T.O. 42C-1-11 (Nov. 15, 1967).
G53. M. Anmuth, "Cleaning of Oxygen Pressure Gage Components," Naval
Boiler and Turbine Lab., (Mar. 26, 1965).
G54. Anon, "Cleaning and Testing of Oxygen and Nitrogen Gas Piping
Systems," MIL-STD-1330 (SHIPS) (May 10, 1968)
G55. Anon, "Cleaning Methods," Process Specification 20-1, NASA Flight
Research Center (Nov. 1, 1970).'
165
G56. Anon. Metric Practice Guide, ASTM E380-72, American National
Standard Z210.1.
G57. P. Smelser, "Pressure Measurements in Cryogenic System,"
Advances in Cryogenic Engineering, 8, p. 378-386 (1963)
G58. R. B. Scott, Cryogenic Engineering (D. Van Nostrand Company,
Inc., New York, New York, 1959).
G59. K. K. Hayakawa, "Cryogenic Pressure Measurement Technology and
Subjects Applied to Pressure Transducers," Vol. 1 of Measurement
Component Technology, Final Report, Space Division, North American
Rockwell, Document No. SD72-SA-0156-1 (Oct. 13, 1972).
CALIBRATION REFERENCES
Cl. P. H. Carr, "Problems in Establishing Standards for Vacuum
Measurements and in Calibrating Vacuum Gauges," Vacuum, 14,
No. 2, p. 37-45 (Feb. 1964)
C2. W. B. Nottingham and F. L. Torney, "A Detailed Examination of the
Principles of Ion Gauge Calibration," Trans. of the Seventh National
Symposium on Vacuum Technology, p. 117-122 (C. R. Meissner
ed., Pergamon Press, 1961).
C3. H. Norville, "A Dead Weight Pressure Balance with Extended Range
to 5,000 psig, " NASA, N-64-33684 (1964)
C4. E. Eisele, "Calibration of Indicators II," Dynamic Calibration,
Archiv. Tech. Messen, J-137-3 (May 1951)
C5. J. E. Field, "100,000 psi Pulse Pressure Source for Transducer
Evaluation," status report (California Univ., Livermore. Lawrence
Radiation Lab. Contract W-7405-eng-48) p. 1-6 (Oct. 1966).
C6. M. Goto, "On the Standards of Vacuum Installed in the Electrotech-
nical Laboratory. The Standard McLeod Gauge and the Calibration of
Ionization Gauges Against It," Advances in Vacuum Science and
Technology, I, p. 266-270; Discussion, p. 270 (E. Thomas, ed.,
Pergamon Press, 1959).
166 -
C7. W. H. McLellan, "How to Calibrate Pressure Transducers at 71K,"
ISA Trans., 7, No. 1, P. 59-66 (1968).
C8. R. L. Bloss and M. C. Orloski (editors), Precision Measurement
and Calibration-Mechanics, NBS special publication 300 - volume 8
Bureau of Standards, including selected abstracts by NBS and non-
NBS authors.), p. 1-590 (Jan. 1972).
C9. Anon., A Guide for the Dynamic Calibration of Pressure Transducers,
ASME publication ANSI B88.1, p. 1-29 (1972).
ClO. J. L. Schweppe, L. C. Eichberger, D. F. Muster, E. L. Michaels,
and C. F. Paskusz, "Methods for the Dynamic Calibration of Pres-
sure Transducers," NBS Monograph 67, p. 1-104 (Dec. 1963).
Cll. P. S. Lederer, "Methods for Performance-Testing of Electro-
mechanical Pressure Transducers," NBS Technical Note 411
(Feb. 1967).
C12. J. P. Simpson and W. L. Gatley, "Dynamic Calibration of Pressure
Measuring Systems," 16th Aerospace Instrumentation Symposium of
the ISA (May 1970).
C13. D. W. Rockwell, "Dynamic Calibration of Pressure Transducers,"
Metrology Engineering Center, Navy, Engineering Circular 15 (1967).
C14. T. S. Rathke, "A System for the Dynamic Calibration of Pressure
Transducer," paper presented at the Instrument Society of America
22nd Annual ISA Conference and Exhibit, Preprint number P19-2-PHY
MMID-67 (September 11-14, 1967 Chicago, Illinois).
C15. Oberst H., "A Method for Producing Extremely Strong Standing Sound
in ir (in arman), Akust. Z., 5, p.27-38 (1940). English
translation by L. L. Beranek, J. ASA, 12, p. 308-309 (1940).
C16. W. Erler, "Measurement Methods for the Calibration of Structure-
borne Vibration and Sound-Measuring Instruments" (in German),
Hochfrequency Technik und Elektroakustik, 68, p. 18 (May 1959).
C17. J. L. Cross, "Reduction of Data for Piston Gage Pressure Measure-
ments," NBS Monograph 65, p. 1-9 (Jun. 1963) (This monograph is
also included in NBS special publication 300 - Volume 8 given as
reference C8).
167

BELLOWS REFERENCES
Bi. L. C. Roess, Rev. Sci. Instr., 16, p. 172 (1945).
B2. J. W. Townsend, Jr., Phys. Rev., 76, p. 465 (1949).
B3. H. G. East and H. Kuhn, "An Accurate Bellows Manometer," J.
Sci. Inst., 23, p. 185 (1946)
84. M. DeCrescente and G. J. Janz, "Brass Bellows Gauge for Null-
Reading Manometers," Rev. Sci. Instr., 28, No. 6, p. 468 (Jun. 1957).
BOURDON REFERENCES
Bol. J.L. Fruit, "Fused Quartz Bourdon Sensors," Inst. Cont. Sys.,
41, 97, (Sept. 1968)
8o2. M. L. Mitnyan, "New Profile for Tube Manometer," Inst. Cont. Sys.,
41, 93 (Sept. 1968).
Bo3. White, M. P., "The Application of Bourdon Tubes to Pressure Indicating
Devices," Instr., 23, 1068-1070 (October 1950).
Bo4. Voth, R. 0., "Safety of Hydrogen Pressure Gages," Advances in
Cryogenic Engineering, Vol. 17, Plenum Press, New York (1972).
8o5. ASME, Pressure Measurement--Supplement to ASME Power Test
Codes, 1964.
Bo6. J. B. Giacobbe and A. M. Bounds, "Selecting and Working Bourdon-tube
Materials," Instr. Mfg. (Jul-Aug 1952).
Bo7. W. L. Buffenmyer, "Selecting Bourdon-tube Gauges," Instr. Cont.
Sys., 34, No. 2, p. 238-242 (Feb. 1961).
168

CAPACITANCE REFERENCES
Cal. C. H. W. Brookes-Smith, J. A. Coils, "The Measurement of Pressure,
Movement, Acceleration and Other Mechanical Quantities, by Electro-
static Systems," J. Sci. Instr. 16, No. 12, 361 (1939).
Ca2. S. E. Goodall, R. B. Smith, "Instantaneous Fluid-Pressure Recording
Equipment," Eng., 127 (Aug. 4, 1939).
Ca3. H. H. Schwartz, "Capacitor Gages for Measuring Small Motions,"
Prod. Eng., 163 (Aug. 1951).
Ca4. C. E. Grinstead, R. N. Frawley, F. W. Chapman, and H. F. Schultz,
"An Improved Indicator for Measuring Static and Dynamic Pressures,"
SAE Journ. Trans. 52, No. 11, 534 (Nov. 1944)
Ca5. D. C. Pressey, "Temperature-Stable, Capacitance Pressure Gages,"
J. Sci. Instr. 30, p. 20-24 (Jan. 1953)
Ca6. J. C. Frommer, "Detecting small Mechanical Movements," Electronics
16, 104 (July 1943).
Ca7. E. J. B. Willey, "The Electrical Measurement of Pressures and
Indicator Diagrams," J. Sci. Instr. 23, 264 (1946).
Ca8. J. C. Lilly, V. Legallais, and R. Cherry, "A Variable Capacitor for
Measurements of Pressure and Mechanical Displacements; A Theoretical
Analysis and Its Experimental Evaluation," J. Appi. Phys. 18, 613
(July 1947)
Ca9. E. Bradshaw, "A Change in Capacitance Method for the Measurement
of Mechanical Displacements,' J. Sci. Instr. 22, 112 (1945).
Ca10 J. C. Lilly, "The Electrical Capacitance Diaphragm Manometer,"
Rey. Sci. Iristr. 13, 34 (Jan. 1942)
Call. C. D. Hodgman, Handbook of Chemistry and Physics (The Chemical
Rubber Publishing Co., Cleveland, Ohio 1962) p. 3391.
Cal2. F. R. G. Mitchell, "A Capacitance Pressure Transducer," J. Sci.
Instr., 2, 372 (1969).
Ca13. I. G. Baxter, "A Differential Capacitance Manometer,"J. Sci.
Instr., 30, No. 10, p. 358-360 (Oct. 1953).
169
Ca14. A. F. Welch, et al., "Auxiliary Equipment for the Capacitor-type
Transducer," ISA J., p. 548 (Dec. 1955).
Ca15. Anon., "Capacitive Pressure Sensors," Inst. Cont. Sys., p. 119
(May 1962)
Ca16. H. W. Drawin, "Electrical Capacity-Diaphragm Vacuum Gage,"
Vakuum Technik, Bd. 7, Heft 8, p. 177-185 (Dez. 1958).
DIAPHRAGM REFERENCES
Dl. A. F. Robertson, "An Electro-Optic Pressure Indicator," Rev. Sci.
Instr., 12, 142 (Mar. 1941)
D2. Anon., "Electronic Pressure and Displacement Instruments," Diesel
Power and Diesel Transportation, 28, 49 . (Feb. 1950).
D3. W. G. Brombacher, V. H. Goerke, and F. Cordero, "Sensitive
Aneroid Diaphragm Capsule with No Deflection Above a Selected'
Pressure," J. Res. NBS, 24, 31 (Jan. 1940).
D4. P. M. Higgs, "A Recording Mechanical Pressure Gauge of High
Range," Rev. Sci. Instr., 20, No. 1,23 (Jan. 1949).
D5. A. Pfeiffer, "A Note on the Theory of Corrugated Diaphragms for
Pressure-Measuring Instruments," Rev. Sci. Instr.' 18, No. 9,
660 (Sept. 1947)
DIODE REFERENCES
Dil. A. J. Yerman, "The Tunnel Diode as an FM Hydrostatic Pressure
Sensor," ASME Paper 63-WA-264 (1963).
Di2. M. M. Cohen and L. Horn, "Tunneling Junction Diode Pressure
Gauge," Harry Diamond Laboratories Report No. TR-1282 (Mar. 1965).
DO. S. L. Miller,-M. Nathan, and A. Smith, Phys. Rev. Letters, 4,
60 (1960) .
Di4. M. E. Sikoraki and P. Andreatch, Rev. Sci. Instr., 33, 155 (1962).
170
INDUCTANCE REFERENCES
Il. L. 011ivier and D. J. Tricebock, "Precise Pressure Measurement,"
Elec. Mfg., 52, p. 114-121 (Aug. 1953).
12. A. G. Boggis, "Design of Differential Transformer Displacement
Gauges," Proc. Soc. Exper. Stress Analysis, 9, p. 171-184 (1952).
13. F. E. Towsley and C. E. Beyer, "Pressure Gage for Injection
Molding," Modern Plastics, 30, p. 109-114 (Apr. 1953).
14. Anon., "Sensitive Transducer," Electronics, 21, p. 136-142
(Sept. 1948)
MAGNETOSTRICTIVE REFERENCES
Ml. F. D.. Smith and C. A. Luxford, "Stress Measurement by Magneto-
striction," Inst. Mech. Engrs. London Proc., 143, p. 56-59 (1940).
MANOMETERS REFERENCES
Mal. C. H. Meyers and R. S. Jessup, "A Multiple Manometer and Piston
Gage for , Precision Measurements," Bureau of Standards Journal
of Research, 6, 1061-98.
Ma2. P. B. Smith, "A Recording Optical Manometer for Thansient Pressures,"
J. Sci. Instr., 24, p. 134 (May 1947).
W. H. J. Svec and D. S. Gibbs, "A Recording Mercurial Manometer for
the Pressure Range 0-760 mm Mercury," Rev. Sci. Instr., 24, No. 3,
p. 202 (March 1953).
Ma4. J. M. Los and J. A. Morrison, "A Sensitive Differential Manometer,"
Rev. Sci. Instr., 22, No. 11, p. 805 (Nov. 1951).
Ma5. J. R. Roebuck and H. W. Ibser, "A Precision Multiple-Mercury-Column
Manometer," Rev. Sci. Instr., 25, No. 1, p. 46 (Jan 1954).
Ma6. T. F. W. Embleton, "A Semi-Automatic Electrical Manometer Designed
to Calibrate a Mach-Zehnder Interferometer System for the Recording
of Transient Pressure Changes, Rev. Sci. Instr. 25, No. 3, p. 246
(March 1954).
171
Ma7. R. Meakin, "Determination of Mercury Level in a Steel-Tube Manometer,"
J. Sci. Inst., 28, p. 372 (1951).
Ma8. F. P. Price and P. D. Zemany, "A Simple Recording Manometer,"
Rev. Sci. Inst., 21, No. 7, p. 261 (July 1950).
Ma9L K. C. D. Hickman, "The Mercury Meniscus," J. Opt. Soc., 19,
P. 190 (1929)
MalO. H. R. Hindley, "A Direct-Reading Differential Micromanometer,"
J. Sci. Instr., 24, p. 295 (1947).
Mall. J. Kistemaker, "The Capillary Depression of Mercury and High
Precision Manometry," Physica, XI, No. 4, p. 277 (Dec. 1945).
Ma12. J. R. Roebuck and W. Cram, "A Multiple Column Mercury Manometer
for Pressures to 200 Atmospheres," Rev. Sci. Instr., 8, p. 215
(June 1937).
Ma13. W. G. Brombacher, D. P. Johnson, and J. L. Cross, "Mercury
Barometers and Manometers," NBS Monograph 8, PB186237 (May 1960).
Ma14. V. J. Tekippe and K. G. Ramanathan, "Outgassing of Manometric
Liquids in Vacuum," Rev. Sci. Instr., 38, No. 9, p. 1339 (Sept.
1967)
Ma15. D. J. LeRoy, "An Automatic Differential Manometer," Iñd. Eng.
Chem., 17, No. 10, p. 652 (Oct. 1945).
Ma16. A. M. Thomas, D. P. Johnson, and J. W. Little, "Design of an
Interferometric Oil Manometer for Vacuum Measurement," Trans.
Ninth National Vacuum Symposium, G. H. Bancroft, ed., The
Macmillan Co., p. 468-473 (1962)
Mall. L. R. Taylor, "A Tilting Micromanometer with Continuous Sensitivity
Control," J. Sci. Instr., 32, No. 5, p. 173-177 (May 1955).
Ma18. G. J. Maslach, "A Precision Differential Manometer," Rev. Sci.
Instr., 23, No. 7, p. 367-369 (July 1952).
Ma19. A. G. Kramer and P. M. Platzman, "Microwave Manometer," Rev.
Sci. Instr., 29, No. 10, p. 897-898 (Oct. 1958).
Ma20. J. F. Kemp, "Liquid Manometer with Electromagnetic Balance
Indicator," J. Sci. Instr., 36, No. 2, p. 77-81 (Feb. 1959).
172

Ma21. I. G. Baxter, "A Differential Capacitance Manometer," J. Sd.
Instr., 30, No. 10, p. 358-360 (Oct. 1953).
Ma22. E. W. Becker and 0. Stehl, "An Electrostatic Differential Manometer
of a Sensitivity of 2 x 10_ 6 mm Hg per Scale Division," Z. Angew.
Phys., Bd. 4, Heft 1, p. 20-22 (Jan. 1952).
Ma23. M. De Crescente and G. J. Janz, "Brass Bellows Gauge for Null-
Reading Manometers," Rev. Sci. Instr., 28, No. 6, p. 468 (June
1957).
Ma24. C. G. J. Jansen and A. Venema, "A McLeod Manometer with Prescribed
Volumes for Use as a Standard Instrument," Vacuum, 9, No. 3/4,
p. 219-229 (July/Sept. 1959).
MICROMANOMETER REFERENCES
Mil. S. Lynn, W. H. Corcoran and B. H. Sage, "Micromanometer of
High Sensitivity," Rev. Sci. Instr., 27, No. 6, p. 368-369
(June 1956) .
Mi2. T. A. Pens, W. H. Kaechle and D. S. Goalwin, "A Diaphragm-
Type Capacitance-Type Micromanometer for Very Low Differential
Pressures," NBS Report 2165, U.S. Dept. Corn., (Jan. 1953).
MA. Anon, "Diaphragm Micromanometer With Electrical Pick-up,"
Instruments, 23, p. 1136 (Nov. 1950).
Mi4. D. B. Cook and C. J. Danby, "A Simple Diaphragm Micrornanorneter,"
J. Sci. Instr., 30, No. 7, p. 238-240 (July 1953).
MiS. W. G. Brombacher, "Survey of Micromanometers," NBS Monograph
114, U.S. Dept. of Corn. (Jun. 1970).
OPTICAL REFERENCES
Opl. W. Hurst, "A Recording Sensitive Differential Manometer,"
Rev. Sci. Instr., 12, p. 265-268 (May 1941).
0p2. W. E. Buck and W. H. Barkas, "Dynamic Pressure Measure-
ment by Optical Interference," Rev. Sci. Instr., 19, No. 10,
p. 678-684 (Oct. 1948) .
173
PIEZOELECTRIC REFERENCES
P1. E. A. Roberts and P. Goldsmith, "Piezoelectric Crystals as Sensing
Elements of Pressure, Temperature, and Humidity,' Elec. Eng.
70, p. 776-780 (Sept. 1951)
P2. J. C. Karcher, "A Piezo-Electric Method for the Instantaneous
Measurement of High Pressures," Sci. Papers of NBS, 18, p. 257-264
(1926-27)
P3. A. W. Lawson and P. H. Miller, Jr., "Piezometer for Transient
Pressures," Rev. Sci. Instr., 13, p. 297-298 (1942).
P4. A. R. Olson and L. L. Hirst, "A New Differential Pressure Gage,"
J. Am. Chem. Soc., 51, p. 2378-2379 (Aug. 1929).
P5. E. Jones, "Piezoelectric and Piezoresjstjve Strain Gages," Cont.
Eng., 8, No. 9, p. 134-137 (Sept. 1961).
P6. H. N. Norton, "Piezoelectric Pressure Transducers," Instr. Cont.
Sys., 36, No. 2, p. 83-85 (Feb. 1963).
P7. D. S. Johnson, "Design and Application of Piezoceramic Transducers
to Transient Pressure Measurements," NASA, N-63-18139 (1962).
P8. D. D. Keough et al., "Piezoresistive Pressure Transducer," ASME
Paper 64-WA/PT-5 (1964)
P9. A. B. Arons and R. H. Cole, "Design and Use of Piezoelectric
Gages for Measurement of Large Transient Pressures," Rev.
Sci. Instr., p. 31-38 (Jan. 1950).
PlO. Anon. Standard S37.3, "Specifications and Tests for Piezoelectric
Pressure and Sound-Pressure Transducers," Instrument Society
of America (1969)
174

POTENIOMETRIC REFERENCES
Pol. H. N. Norton, "Potentiometric Pressure Transducers," Instr.
Cont. Sys., 34, No. 2, P. 244-247 (Feb. 1961).
Po2. A. Z. Zuehlke, Bourns, Inc., "Instrument Error Band Concepts,"
presented at Aero-Space Symposium, San Diego (May 1960).
Po3. L. Welsh, E. A. Marks, Bourns, Inc., "Optimization of Potentio-
metric Type Pressure Transducers," presented at International
Telemetering Conference, Washington, D.C., (1965).
Po4. S. A. Hluchan, S. Herman, Bourns, Inc., Altimeter-Airspeed and
Mach Number Transducers, Instrument Society of America Aero-
space Instrumentation Symposium, Las Vegas (May 1971).
P05. S. Herman, S. Hiuchan, "Potentiometric Pressure Transducers
and Transmitters," Measurements and Data, p. 86-88 (Jan-Feb 1972).
Po6. L. Chapman, "Potentiometer Pressure Transducers," Measurements
and Data, p. 80-85 (Jan-Feb 1972).
Po7. J. Hendrie, "Development of a Potentiometric High Pressure,
Cryogenic Pressure Transducer," Technical Report (Bourns, Inc.)
PR-2285-13, p. 1-14 (Apr. 1968)
RELUCTANCE REFERENCES
Rel. G. E. Reis, "Theoretical Examination of Variable Reluctance
Diaphragm Gage," Sandia Corp., Albuquerque, N. Mex., SCR-162
(1960)
Re2. Anon., impruvtd Varibl-Pe!uc'tflCe Transducer Measures Transient
Pressure," NASA Brief 63-10321 (1963).
Re3. Anon., "Reluctive Pressure Transducers," Measurements and Data,
p. 103 (Jan-Feb 1972).
175

STRAIN REFERENCES
Si. R. Havens, R. Koll, and H. LaGow, "A New Vacuum Gage," Rev.
Sci. Inst., 21, No. 7, P. 596-598 (July 1950).
S2 J. Delmonte, "A Versatile Miniature Flush-Diaphragm Pressure
Transducer," ISA Proc., 7, p. 174-177 (1952).
S3. N. Gross and P. H. R. Lane, "An Accurate Wire Resistance Method
for the Measurement of Pulsating Pressures," J. Sci. Inst., 30,
p. 1-2 (Jan. 1953). -
S4. A. Michels and M. Lenssen, "An Electric Manometer for Pressures
up to 3000 Atmospheres," J. Sci. Inst., 11, p. 345-3-4-7 (1934).
$5. E. C. Blom, "A New Method of Measuring Pressure Electrically,"
Inst., p. 903 (Sept. 1950).
S6. J. W. Dean and T. M. Flynn, "Temperature Effects on Pressure
Transducers," ISA Trans., 5, p. 223-232 (1966).
S7. J. H. Jupe, "Electronic Pressure Measuring Instrument," Eng.
- p. 451-452 (Apr. 1950).
S8. Y. T. Li, "Design of Strain Gage Pressure Indicators," ISA Proc.,
7, p. 216-221 (1952)
$9. R. D. Meyer, "Applications of Unbonded-Type Resistance Gages,"
Inst., 19, p. 136-139 (Mar. 1946)
Sb. E. Wenk Jr., "A Diaphragm-Type Gage for Measuring Low Pressures
in Fluids," Proc. Exper. Stress Analysis, 8, p. 90-96 (1951).
Sib. W. M. Murray, "What are Strain Gages-What Can They Do?," ISA J.
9, No. 1, p. 30-36 (Jan. 1962).
S12. W. M. Murray, "Strain Gage Types and Basic Circuits," ISA J.,
9, No. 2, p. 47-51 (Feb. 1962).
S13. R. J. Fyffe and A. Arobone, "Strain Gage Transducers for Measure-
ment and Control," Prod. Eng., p. 122-148 (Nov. 1952).'
VIBRATING WIRE REFERENCES
Vi. J. P. Hobson, "Vibrating Ribbon Pressure Gauge," Communications,
p. 557-558 (1971) . --
176

11. AUTHOR-DESIGNATION CROSS REFERENCE INDEX
G53. Anmuth, M., "Cleaning of Oxygen Pressure Gage Components," Naval
Boiler and Turbine Lab., (Mar. 26, 1965).
GlO. Anon., "Introduction to Transducers for Instrumentation," Statham
Instruments, Inc. (1966).
C9. Anon., "A Guide for Dynamic Calibration of Pressure Transducers,"
ASME publication ANSI B88.1, p. 1-29 (1972).
G56. Anon., Metric Practice Guide, ASTM E380-72.
G52. Anon., "Cleaning and Inspection Procedures for Ballistic Missi1e.
Systems, Change 2," USAF T.O. 42C-1-11 (Nov. 15, 1967).
CalS. Anon., "Capacitance Pressure Sensors," Inst. Cont. Sys., P. 119.
(May 196).
G25. Anon., "High Pressure Measurement," Mech. Eng., p. 76 (Feb. 1963.).
G54. Anon., "Cleaning and Testing of Oxygen and Nitrogen Gas Piping
Systems," MIL-STD-1330 (SHIPS), (May 10, 1968)
G55. Anon., "Cleaning Methods," Process Specification 20-1, NASA Flight
Research Center, (Nov. 1, 1970).
D2. Anon., "Electronic Pressure and Displacement Instruments," Diesel
Power and Diesel Transportation, 28, 49 (Feb. 1950).
PlO. Anon., Standard S37.3 "Specifications and Tests for Piezoelectric
Pressure and Sound-Pressure Transducers," Instrument Society of;
America (1969).
Re3. Anon., "Reluctive Pressure Transducers," Measurements and Data,
p. 103 (Jan-Feb 1972).
14. Anon., "Sensitive Transducer," Electronics, 21, p. 136-142 (Sept.-1948)
Mi3. Anon., "Diaphragm Micromanometer for Very Low Differential Pressures,"
Rev. Sci. Instr., p. 31-38 (Jan. 1950).
Re2. Anon., "Improved Variable-Reluctance Transducer Measures Transient
Pressure," NASA Brief 63-10321 (1963).
P9. Arons, A. B., Cole, R. H., "Design and Use of Piezoelectric Gages
for Measurement of Large Transient Pressures," Rev. Sci. Instr.
p. 31-38 (Jan. 1950)
177

G2. ASME, "Pressure Measurement- part 2," PP . 1-58 (1964).
Bo5. ASME, "Pressure Measurement--Supplement to ASME Power Test Codes,"
1964.
G51. Bankaitis, H., Schveller, C. F., "ASRDI Oxygen Technological
Survey Volume II: Cleaning Requirements, Procedures, and Verifica-
tion Techniques," NASA Publication SP-3072, 76 pp. (1972).
Ca13. Baxter, I. G., "A Differential Capacitance Manometer," J. Sci. Instr., Ma21.
30, No. 10, p. 358-360 (Oct. 1953).
Ma22. Becker, E. W., Stehi, 0., "An Electrostatic Differential Manometer
of a Sensitivity of 2 x 10- 6 nun Hg per Scale Division," Z. Angew.
Phys., Bd. 4, Heft 1, p. 20-22 (Jan. 1952).
G45. Blears, J., "Measurements of the Ultimate Pressures of Oil Diffusion
Pumps," Proc. Roy. Soc. (London) Ser. A, 188, No. 1012, p. 62-76
(Dec. 31, 1946).
S5. Blom, E. C., "A New Method of Measuring Pressure Electrically," Inst.,
p. 905 (Sept. 1950) .
C8. Bloss, R. L., Orloski, M. C. (Editors)., Precision Measurement and
Calibration-Mechanics, NBS special publication 300-Vol. 8, (A com-
pilation of previously published papers by the staff of National
Bureau of Standards, including selected abstracts by NBS and
non-NBS authors) p. 1-590 (Jan. 1972).
12. Boggis, A. G., "Design of Differential Transformer Displacement
Gauges," Proc. Soc. Exper. Stress Analysis, 9 P . 171-184 (1952).
G4. Boutry, G. A., "Some Aspects of Instrumental Physics in France
(1939-1946)," J. Sci. Instr., 24, No. 11, P . 281 (Nov. 1947).
Ca9. Bradshaw, E., "A Change in Capacitance Method for the Measurement
of Mechanical Displacements," J. Sci. Instr., 22, 112 (1945).
G16. Brombacher, W. G., "Some Problems in the Precise Measurement of
Pressure," Inst., 22, p. 355-358 (Apr. 1949).
Mi5. Brombacher, W. G., "Survey of Manometers," NBS Monograph 114, U.S.
Dept. of Corn. (June 1970).
178

D3. Brombacher, W. G., Goerke, Cordero, F., "Sensitive Aneroid Diaphragm
Capsule with No Deflection Above a Selected Pressure," J. Res.
NBS, 24, 31 (Jan. 1940).
Ma13. Brombacher, W. G., Johnson, D. P., Cross, J. L., "Mercury Barometers
and Manometers," NAB Monograph 8, PB186237 (May 1960).
Cal. Brooks-Smith, C. H. W., Lolls, J. A., "The Measurement of Pressure,
Movement, Acceleration and Other Mechanical Quantities by Electro-
static Systems," J. Sci. Instr., 16, No. 12, p. 361 (1939).
0p2. Buck, W. E., Barkas, W. H., "Dynamic Pressure Measurement by Optical
Interference," Rev. Sci. Instr., 19, No. 10, p. 678-684 (Oct. 1948).
Bo7. Buffenmyer, W. L., "Selecting Bourdon-tube Gauges," Sys. 34, No. 2,
p. 238-242 (Feb. 1961)
Cl. Carr, P. H., "Problems in Establishing Standards for Vacuum Mea-
surements and in Calibrating Vacuum Gauges," Vacuum, 14, No. 2,
p. 37-45 (Feb. 1964)
P06. Chapman, L., "Potentiometer Pressure Transducers," Measurements
and Data, p. 80-85 (Jan-Feb 1972).
G18. Clairridge, R. E., "Selecting Pressure Transducers," Automation,
9, No. 10, p. 82-87 (Oct. 1962)
Di2. Cohen, M. M., Horn, L., "Tunneling Junction Diode Pressure Gauge,"
Harry Diamond Laboratories Report No. TR-1282 (Mar. 1965).
Gi. Considine, D. M., Process Instruments and Controls Handbook (McGraw-
Hill Book Co., 1966).
G34. Considine, D. M., Handbook of Applied Instrumentation (McGraw-Hill
Book Co., 1964).
Mi4. Cook, D. B., Danby, C. J., "A Simple Diaphragm Micromanometer,"
J. Sci. Instr., 30, No. 7, p. 238-240 (July 1953).
Cu. Cross, J. L., "Reduction of Data for Piston Gauge Pressure Measure-
ments," NBS Monograph 65, p. 1-9 (Jun. 1963). This Monograph is also
included in NBS Special Publication 300, Vol. 8 given as reference
C8.
179
G14. Dean, J. W., Flynn, T. M., "Temperature Effects on Pressure Trans-S6.
ducers," ISA Trans., 5, p. 223-232 (1966).
Ma23. De Crescente, M., Janz, G. J., "Brass Bellows Gauge for Null-Reading B4.
Manometers," Rev. Sci. Instr., 28, No. 6, P. 468 (June 1957).
S2. Delmonte, J., "A Versatile Miniature Flush-Diaphragm Pressure
Transducer," ISA Proc., 7, p. 174-177 (1952).
G19. Dickson, T., "Selecting Strain Transducers," Automation, 9, No. 11,
p. 85-89 (Nov. 1962)
G3. Doebelin, E. 0., Measurement Systems: Application and Design
(McGraw-Hill Book Co. 1966).
G8. Draper, C. S., Bently, G. P., "Design Factors Controlling the
Dynamic Performance of Instruments," ASME Trans., p. 421-423
(July 1940).
Cal6. Drawin, H. W., "Electrical Capacity-Diaphragm Vacuum Gage,"
Vacuum Technik, Bd. 7, Heft 8, p. 177-185 (Dez. 1958).
G24. D'Souza, A. F., Oldenburger, R., "Dynamic Response of Fluid
Lines," ASME Paper 63-WA-73 (1963).
G23. Ducoffe, A. L., White, F. M., "The Problem of Pneumatic
Pressure Lag," ASME Trans., p. 234 (Jun. 1964).
G30. Dushman, S., "Scientific Foundation of Vacuum Techniques," Second
ed., p. 201-352 (J. M. Lafferty, ed., John Wiley & Sons, Inc. 1962).
B3. East, H. G., Kuhn, H., "An Accurate Bellows Manometer," J. Sci.
Instr., 23, p. 185 (1946).
G9. Eckenrode, R. T., Kirshner, H. A., "Measurements of Pressure
Transients," Rev. Sci. Instr., 25, No. I., p. 33-40 (Jan. 1954).
C4. Eisele, E., "Calibration of Indicators II," Dynamic Calibration,
Archiv. Tech. Messen J-137-3 (May 1951).
Ma6. Embleton, T. F. W., "A Semi-Automatic Electrical Manometer Designed
to Calibrate a Mach-Zender Interferrometer System for the Recording
of Transient Pressure Changes," Rev. Sci. Instr., 25, No. 3, p. 246
(March 1954).
180

C16. Erler., W., "Measurement Methods for the Calibration of Structure
borne Vibration and Sound-Measuring Instruments," (in German),
Hochfrequency Technik und Elektroakustik, 68, p. 18 (May 1959).
G7. Exline, P. G., "Pressure-Responsive Elements," ASME Trans., p.
625-632 (Nov. 1938)
Field, J. E., "100,000 psi Pulse Pressure Source for Transducer
- Evaluation," Status Report (California Univ., Livermore. Liver-
more Radiation Lab., Contract W-7405-eng-48) p. 1-6 (Oct. 1966).
Ca6. Frommer, J. C., "Detecting Small Mechanical Movements," Electronics,
16, p. 104 (July 1943)
Bol. Fruit, J. L., "Fused Quartz Bourdon Sensors," Instr. Cont. Sys.,
41, p. 97, (Sept. 1968).
S13. Fyffe, R. J., Arobone, P., "Strain Gage Transducers for Measure-
ments and Control," Prod. Eng., p. 122-148 (Nov. 1952).
G35. Gaffee, D. I.,'Monroe, A., "Measurement of Small Differential
Pressures at Low Absolute Pressures;" Nature, 174, No. 4433, p. 756
(Oct. 16, 1954).
Bo6. Giacobbe, J. B., Bounds, A. M., "Selecting and Working Bourdon-
tube Materials," Instr. Mfg. (July-Aug. 1952).
Ca2. Goodall, S. •E., Smith, R. B., "Instantaneous Fluid-Pressure Re-
cording Equipment," Eng., p. 127 (Aug. 4, 1939).
C6. Goto, M., "On the Standards of Vacuum Installed in the Electro-
technical Laboratory. The Standard McLeod Gauge and the Calibra-
tion of Ionization Gauges Against It," Advances in Vacuum Science
and Technology, I, p. 2667270; Discussion, p. 270 (E. Thomas, ed.,
• . •. ..Pergmon Press, 1959).
Gll. 2rey, J., "Pressure Transducers," Prod. Eng., p. 174-179 (Jan. 1954).
C.a4. Grinstead, C. E., Frawley, R. N., Chapman, F.. W., Shultz, H. F.,
"An Improved Indicator for Measuring Static and Dynamic Pressures,"
SAE J. Trans., 52, No. 11, p. 534 (Nov. 1944).
181
S3. Gross, N., Laive, P. H. R., "An Accurate Wire Resistance Method
for the Measurement of Pulsating Pressures," J. Sci. Instr., 30,
p. 1-2 (Jan. 1953).
G32. Guthrie, A., "Vacuum Technology," p. 142-197 (John Wiley & Sons,
Inc., 1963).
G46. Haefer, R. A., Hengevoss, 3., "Studies on the Blears Effect at
Pressure Measurements in the Ultra-High Vacuum Range," Trans. of the
Seventh National Symposium on Vacuum Technology, p. 67-74 (C. R.
Meissner, ed., Pergamon Press, 1961).
G21. Harman, H. S., "Pressure Transducers for Environmental Extremes,"
ITS Res. Achievements Rev., 11, p. 11-17 (1968).
Sl. Havens, R., Koll, R., LaGow, H., "A New Vacuum Gage," Rev. Sci.
Instr., 21, No. 7, p. 596-598 (July 1950).
G59. Hayakawa, K. K., "Cryogenic Pressure Measurement Technology and
Subjects Allied to Pressure Transducers," Vol. 1 of Measurement
Component Technology, Final Report, Space Division, North American
Rockwell, Document No. SD72-SA-0156-1 (Oct. 31, 1972).
Po7. Hendrie, 3., "Development of a Potentiometric High Pressure,
Cryogenic Pressure Transducer," Technical Report (Bourns, Inc.)
PR-2285-.13, p. 1-14 (Apr. 1968).
P05. Herman, S., Hluchan, S., "Potentiometric Pressure Transducers
and Transmitters," Measurements and Data, p. 86-88 (Jan-Feb 1972).
Ma9. Hickman, K. C. D., "The Mecury Meniscus," J. Opt. Sci., 19, p. 190
(1929)
D4. Higgs, P. M., "A Recording Mechanical Pressure Gauge of High Range,"
Rev. Sci. Instr., 20, No. 1, 23, (Jan. 1949).
MalO. Hindley, H. R., "A Direct-Reading Differential Micromanometer,"
J. Sci. Instr., 24, p. 295 (1947).
Po4. Hluchan, S. A. Herman, S., Bourns, Inc., "Altimeter-Airspeed and
Mach Number Transducers," Instrument Society of America Aerospace
Instrumentation Symposium, Las Vegas, Nevada (May 1971).
182

Vi. Hobson, J. P., "Vibrating Ribbon Pressure Gauge," Communications,
p. 557-558 (1971)
Call. Hodgman, C. D., Handbook of Chemistry and Physics, p. 3391
(The Chemical Rubber Publishing Co., Cleveland, Ohio 1962).
G48. Hord, J., "Response of Pneumatic Pressure-Measurement Systems to a
Step Input in the Free Molecule, Transition, and Continuum Flow
Regimes," ISA Trans. 6, No. 3, p. 252-260 (1967).
G17. Hunt, L. B., "The History of Pressure Responsive Elements," J. Sci.
Instr., p. 37-42 (Mar. 1944).
Op1. Hurst, W., "A Recording Sensitive Differential Manometer," Rev.
Sci. Instr., 12, p. 265-268 (May 1941).
G49. Hust, J. G., Clark, A. F., "A Survey of Compat 1ibility of Materials
with High Pressure Oxygen Service," Cryogenics, 13, No. 6, p. 325-336
(June 1973)
G50. Hust, J. G., Clark, A. F., Unpublished Report (1973), Data Available
from Authors at the National Bureau of Standards, Boulder, Cob. 80302.
G6. Hylkema, C. G., Bowersox, R. B., "Experimental and Mathematical
Techniques for Determining the Dynamic Response of Pressure Gages,"
ISA Proc., 8, p. 115-120 (1953).
Ma24. Jansen, C. G. J., Venema, R., "A McLeod Manometer with Prescribed
Volumes for Use as a Standard Instrument," Vacuum, 9, No. 3/4,
p. 219-229 (July/Sept. 1959)
G15. Johansson, J., "Cryogenic Measurements," Instr. & Cont. Sys., 38,
p. 107-111 (May 1965)
P7. Johnson, D. S., "Design and Application of Piezoceramic Transducers
to Transient Pressure Measurements," NASA, N-63-18129 (1962).
G13. Johnston, D. L., Hobbs, D. W., "Electronics is Strain Measurement,"
Inst. Practice, p. 191-199 (Jan. 1953)
P5. Jones, E., "Piezoelectric and Piezoresistive Strain Gages," Cont.
Eng., 8, No. 9, p. 134-137 (Sept. 1961).
S7. Jupe, J. H., "Electronic Pressure Indicators," ISA Proc., 7, p.
216-221 (1952) . 183
P2. Karcher, J. C., "A Piezo-Electfic Method for the Instantaneous
Measurement of High Pressures," Sci. Papers of NBS, 18, p. 257-264,
(1926-27)
Ma20. Kemp, J. F., "Liquid Manometer with Electromagnetic Balance
Indicator," J. Sci. Instr., 36, No. 2, p. 77-81 (Feb. 1959).
P8. Keough et. al., "Piezoresistive Pressure Transducer," ASME Paper
64-WA/PT-5 (1964)
Mall. Kistemaker, J., "The Capillary Depression of Mercury and High
Precision Manometry," Physica, XI, No. 4, p. 277 (Dec. 1945).
Ma19. Kramer, A. G., Platzman, P. M., "Microwave Manometer," Rev. Sci.
Instr., 29, No. 10, p. 897-898 (Oct. 1958).
G41. Kreisman, W. S., "Attainment and Measurement of Pressures Ranging
from 10 6 - lo- 12 mm Hg," Bull. Amer. Phys. Soc., Ser. II, 8, No. 2,
p. 143 (1963)
P3. Lawson, A. W., Miller, P. H., Jr., "Piezometer for Transient Pres-
sures," Rev. Sci. Instr., 13, p. 297-298 (1942).
G20. Leck, J. H., "Pressure Measurement in Vacuum Systems," (Reinhold
Publishing Corp., New York, 1957); Second ed., (Chapman & Hall.,
London, 1964).
Cll., Lederer, P. S., "Methods for Performance-Testing of Electromechanical
Pressure Transducers," NBS Tech. Note 411 (Feb. 1967).
Ma15. LeRoy, D. J., "An Automatic Differential Manometer," Ind. Eng.
Chem., 17, No. 10, p. 652 (Oct. 1945).
S8. Li, Y. T., "Design of Strain Gage Pressure Indicators," ISA Proc.,
7, p. 216-221 (1952) .
CalO. Lilly, J. C., "The Electrical Capacitance Diaphragm Manometer,"
Rev. Sci. Instr., 13, 34 (Jan. 1942).
Ca8. Lilly, J. C., Legallais, V., Cherey, R., "A Variable Capacitor for
Measurements of Pressure and Mechanical Displacements; A Theoretical
Analysis and its Experimental Evaluation," J. Appi. Phys., 18, p.
613 (July 1947)
Ma4. Los, J. M., Morrison, J. A., "A Sensitive Differential Manometer,"
J. Sci. Instr., 28, p. 372 (1951).
184

Mu. Lynn, S., Corcoran, W. H., Sage, B. H., "Micromanometer of High
Sensitivity," Rev. Sci. Instr., 27, No. 6, P. 368-369 (June 1956).
Ma18. Maslach, G. J., "A Precision Differential Manometer," Rev. Sci.
Instr., 23, No. 7, p. 367-369 (July 1952).
C7. McLellan, "How to Calibrate Pressure Transducers at 7 0 K," ISA
Trans., 7, No. 1 p. 59-66 (1968).
G36. McLeod, H., "Apparatus for Measurement of Low Pressures of a Gas,"
Phil. Mag., 48, p. 110-112 (1874).
Ma7. Meakin, R., "Determination of Mercury Level in a Steel-Tube Mano-
meter," J. Sci. Instr., 21, No. 7, p. 261 (July 1950).
G37. Meinke, C., Reich, G., "Vermeidung von Fehlmessungen mit dem
System McLeod-Kuhlfalle," yak. Technik, Bd12, Heft 3, p. 79-82 (1963).
S9. Meyer, R. D., "Applications of Unbonded-Type Resistance Gages,"
Inst., 19, p. 136-139 (Mar. 1946).
Mal. Meyers, C. H., Jessup, R. S., "A Multiple Manometer and Piston
Gage for Precision Measurements," Bureau of Standards Journal
of Research, 6, P. 1061-98.
S4. Michels, A., Lenssen, M., "An Electric Manometer for Pressures
up to 3000 Atmospheres," J. Sci. Inst., 11, p. 345-347 (1934).
Di3. Miller, S. L., Nathan, M., Smith, A., Phys. Rev. Letters, 4, p. 60
(1960)
Ca12. Mitchell, F. R. G., "A Capacitance Pressure Transducer," J. Sci.
Instr., 2, p. 372 (1969).
Bo2. Mitnyan, M. L., "New Profile for Tube Manometer," Inst. Cont. Sys.,
41, p. 93 (Sept. 1968).
G5. Moore, B. C., "Advantages of a Spherical Geometry in Vacuum Mea-
surements," J. Vac. Sci. Tech., 1-2, p. 211 (1964-65).
S12. Murray, W. M., "Strain Gage Types and Basic Circuits," ISA J., 9,
No. 2, p. 47-51 (Feb. 1962).
Sil. Murray, W. M., "What are Strain Gages -- What Can They Do?," ISA J.,
9, No. 2, p. 47-51 (Jan. 1962)
G22. Nagro, F., Ikegami, M., "Errors of an Indicator Due to a Connecting
Passage," Bull. ASME, 8, No. 29 (1965).
185
G20. Neubert, H. K. P., "Instrument Transducers," p. 50 (Clarendon Press
Ltd, Oxford, 1963).
P6. Norton, H. N., "Piezoelectric Pressure Transducers," Instr. Cont.
Sys., 36, No. 2, p. 83-85 (Feb. 1963).
Pol. Norton, H. N., "Potentiometrjc Pressure Transducers," Instr. Cont.
Sys., 34, No. 2, p. 244-247 (Feb. 1961).
C3. Norville, H., "A Dead Weight Pressure Balance with Extended Range
to 5,000 psig," N-64-33684 (1964);
C2. Nottingham, W. B., Torney, F. L., "A Detailed Examination of the
Principles of Ion Gauge Calibration," Trans. of the Seventh National
Symposium on Vacuum Technology, p. 117-122 (C. R. Meissner, ed.,
Pergamon Press, 1961).
C15. Oberst, H., "A Method for Producing Extremely Strong Standing Sound
Waves in Air," (In German), Akust. Z., 5, p. 27-28 (1940). English
translation by L. L. Beranek, J. ASA, 12, p. 308-309 (1940).
Il. 011ivier, L., Tricebock, D. J., "Precise Pressure Measurement,"
Elec. Mfg., 52, p. 114-121 (Aug. 1953).
P4. Olson, A. R., Hirst, L. L., "A New Differential Piessure Gage,"
J. Am. Chem. Soc., 51,p. 2378-2379(Aug. 1929).
G27. Ortman, G. C., "Photoelectric Pressure Sensing," ISA J., 9, No. 12,
p. 63-64 (Dec. 1962) .
Mi2. Perls, T. A., Kaechle, W. H., Goalwin, D. S., "A Diaphragm-Type
Capacitance-Type Micromanometer for Very Low Differential Pressures,"
NBS Report 2165, U.S. Dept. Commerce (Jan. 1953).
G39. Penning, F. M., "High Vacuum Gages," Philips Tech. Rev., 2, p.
201-208 (1937)
D5. Pfeiffer, A., "A Note on the Theory of Corrugated Diaphragms for
Pressure-Measuring Instruments," Rev. Sci. Instr., 18, No. 9, p.
660 (Sept. 1947)
G33. Pirani, M., Yarwood, 3., Principles of Vacuum Engineering, p.
81-129 (Reinhold Pub. Corp., New York, 1961).
Ca5. Pressey, D. C., "Temperature-Stable, Capacitance Pressure Gages,"
J. Sci. Instr., 30, p. 20-24 (Jan. 1953).
186

Ma8. Price, F. P., Zemany, P. D., "A Simple Recording Manometer,"
Rev. Sci. Instr., 21, No. 7, p. 261 (July 1950).
C14. Rathke, T. S., "A System for the Dynamic Calibration of Pressure
Transducer," Paper presented at the Instrument Society of America
22nd Annual ISA Conference and Exhibit, Preprint Number P19-2-PHY
MI4ID-67 (Sept. 11-14, 1967 Chicago, Ill.).
G47. Rayle, R. E., "Influence of Orifice Geometry on Static Pressure
Measurements," ASME paper 59-A-234, presented at ASME Annual
Meeting Atlantic City, N.J. (1959).
G40. Redhead, P. A., "Pressure Measurements at Ultra-High Vacuum," Trans.
of the Fifth National Symposium on Vacuum Technology, p. 410-413
(W. G. Matheson, ed., Pergamon Press, 1959).
G43. Reich, G., "The Influence of Adsorption and Desorption on Measure-
ments of Low Pressures," Trans. of the Seventh National Symposium
on Vacuum Technology, p. 112-116 (C. R. Meissner, ed., Pergamon
Press, 1961).
Rel.- Reis, G. E., "Theoretical Examination of Variable Reluctance
Diaphragm Gage," Sandia Corp., Albuquerque, N. Mex., SCR-162 (1960).
P1. Roberts, E. A., Goldsmith, P., "Piezoelectric Crystals as Sensing
Elements of Pressure, Temperature, and Humidity," Elec. Eng., 70,
p. 776-780 (Sept. 1951)
G44. Roberts, R. W., Vanderslice, T. A., "Ultra High Vacuum and Its Appli-
cations," (Prentice-Hall, Inc., 1963).
Dl. Robertson, A. F., "An Electro-Optic Pressure Indicator," Rev. Sci.
Instr., 12, p. 142 , (Mar. 1941).
G286 Robinson, R. E., Liu, L. Y., "Dynamic Pressure Generation for
Transducer Evaluation," Inst. and Cont. Sys., 42, p. 87 (Nov. 1969).
C13. Rockwell, D. W., "Dynamic Calibration of Pressure Transducers,"
Metrology Engineering Center, Navy, Engineering Circular 15 (1967).
Ma12. Roebuck, J. R., Cram, W., "A Multiple Column Mercury Manometer for
Pressures to 200 Atmospheres," Rev. Sci. Instr., 8, p. 215 (June 1937).
187

Ma5. Roebuck, J. R., Ibser, H. W., "A Precision Multiple-Mercury-Column
Manometer," Rev. Sci. Instr., 25, No. 1, p. 46 (Jan. 1954).
G38. Roehrig, J. R., Vanderschmidt, "Advances in the Design of Vacuum
Gauges Using Radioactive Materials," Trans. of the Sixth National
Symposium on Vacuum Technology, p. 82-84 (C. R. Meissner, ed.,
Pergamon Press, 1960).
Bl. Roess, L. C., Rev. Sci.. Instr., 16, p. 172 (1945).
G42. Santeler, D. J., "Pressure Measurement in Non-Baked Ultra-High
Vacuum. Systems," Trans. of the Eighth National Vacuum Symposium
and the Second International Congress on Vacuum Science and
Technology, p. 549-554 (L. E. Preuss, ed., Pergamon Press, 1962).
G29. Santeler, D. J., Jones, D. W. Holkeboer, D. H., Pagano, F., "Vacuum
Technology, and Space Simulation,".NASA SP-105 (1966).
Ca3. Schwartz, H. H., "Capacitor Gages for Measuring Small Motions,"
Prod. Eng., p. 163 (Aug. 1951).
ClO. Schweppe, J. L., Eichberger, L. C., Muster, D. F., Michaels, E. L.,
Paskusz, G. F., "Methods for the Dynamic Calibration of Pressure
Transducers," NBS Monograph 67, p. 1-104 (Dec. 1963).
G58. Scott, R. B., Cryogenic.Engifleering (D. Van Nostrand Company, Inc.
New York, New York, 1959).
Di4. Sikoraki, M. E., Andreatch, p ., Rev. Sci. Instr., 33, p. 155 (1962).
C12. Simpson, J. P., Gatley, W. L., "Dynamic Calibration of Pressure
Measuring Systems," 16th Aerospace Instrumentation Symposium of
the ISA (May 1970).
G57. Smelser, P., "Pressure Measurements in Cryogenic Systems," Advances
in Cryogenic Engineering, 8,.p. 378-386 (1963).
Ml. Smith, F. D., Luxford, C. A., "Stress Measurement by Magnetostriction,"
Instr. Mech. Engrs. London Proc., 143, p. 56-59 (1940).
Ma2. Smith, P. B., "A Recording Optical Manometer for Transient Pressures,"
J. Sci. Instr., 24, p. 134 (May 1947).
188
0

G31. Steinhertz, H. A., "Handbook of High Vacuum Engineering," p. 80-109
(Reinhold Pub. Corp., New York, 1963).
Ma3. Svec, H. J., Gibbs, D. S., "A Recording Mercurial Manometer for the
Pressure Range 0-760 mm Mercury," Rev. Sci. Instr., 24,No. 3, p.
202 (March 1953)
Ma17. Taylor, L. R., "A Tilting Micromanometer with Continuous Sensitivity
Control," J. Sci. Instr., 32, No. 5, p. 173-177 (May 1955).
Mal4. Tekippe, V. J., Ramanathan, K. G., "Outgassing of Manometric Liquids
in Vacuum," Rev. Sci. Instr., 38, No. 9, p. 1339 (Sept. 1967).
Ma16. Thomas, A. M., Johnson, D. P., Little, J. W., "Design of an Intero-
metric Oil Manometer for Vacuum Measurement," Trans. Ninth National
Vacuum Symposium (G. H. Bancroft, ed., The Macmillan Co.) p. 468-473
(1962)
B2. Townsend, J. W., Jr., Phys. Rev., 76, p. 465 (1949).
13. Towsley, F. E., Beyer, C. E., "Pressure Gage for Injection Molding,"
Modern Plastics, 30, p. 109-114 (Apr. 1953).
Bo4. Voth, R. 0., "Safety of Hydrogen Pressure Gages," Advances in
Cryogenic Engineering, 17 (Plenum Press, New York, 1972).
Cal4. Welch, A. F., et al., "Auxiliary Equipment for the Capacitator-type
Transducer," ISA J., p. 548 (Dec. 1955).
Po3. Welsh, L., Marks, E. A., Bourns, Inc., "Optimization of Potentio-
metric Type Pressure Transducers," presented at International
Telemetering Conference, Washington, D.C. (1965).
Sb. Wenk, E., Jr., "A Diaphragm-Type Gage for Measuring Low Pressures
in Fluids," Proc. Exper. Analysis, 8, p. 90-96 (1951).
Bo3. White, M. P., "The Application of Bourdon Tubes to Pressure Indicat-
ing Devices," Instr., 23, 1068-1070 (Oct. 1950).
El. Williams, M., "An Electrokinetic Transducer," Rev. Sci. Instr., 19,
No. 10, p. 640-646 (Oct. 1948) .
Ca7. Willey, E. J. B., "The Electrical Measurement of Pressures and
Indicator Diagrams," J. Sci. Instr., 23, p. 264 (1946).
189

G12. Woodcock, F. J., "Some Electrical Methods of—Measuring Mechanical
Quantities," Inst. EIèc. Engr., 97, p. 136-149 (1950).
Dil. Yerman, A. J., "The Tunnel Diode as an FM Hydrostatic Pressure
Sensor," ASME Paper 63-WA-264 (1963).
Po2. Zuehlke, A. Z., Borns, Inc., "Instrument Error Band Concepts,"
presented at Aero-Space Symposium, San Diego, Calif. (May 1960).
GOVERNMENT PRINTING OFFICE: 1975 - 635-052(87
190
NATIONAL AERONAUTICS AND SPACE ADMINISTRATION
r*
WASHINGTON. D.C. 20546 POSTAGE AND FEES PAW NATIONAL AERONAUTICS AND
OFFICIAL BUSINESS SPACE ADMINISTRATION
PENALTY FOR PRIVATE USE $300 SPECIAL FOURTH-CLASS RATE
BOOK
If Undeliverable (Section 154 POSTMASTER PotaI Manual ) Do Not Return
'The aeronautical and space activities of the United States shall be conducted so as to contribute . . . to the expansion of human know!-edge of phenomena in the atmosphere and space. The Administration shall provide for the widest practicable and appropriate dissemination of information concerning its activities and the results thereof."
—NATIONAL AERONAUTICS AND SPACE ACT OF 1958
NASA SCIENTIFIC AND TECHNICAL PUBLICATIONS TECHNICAL REPORTS: Scientific and technical information considered important, complete, and a lasting contribution to existing knowledge.
TECHNICAL NOTES: Information less broad in scope but nevertheless of importance as a contribution to existing knowledge.
TECHNICAL MEMORANDUMS: Information receiving limited distribution because of preliminary data, security classifica-tion, or other reasons. Also includes conference proceedings with either limited or unlimited distribution.
CONTRACTOR REPORTS: Scientific and technical information generated under a NASA contract or grant and considered an important contribution to existing knowledge.
TECHNICAL TRANSLATIONS: Information published in a foreign language considered to merit NASA distribution in English.
SPECIAL PUBLICATIONS: Information derived from or of value to NASA activities. Publications include final reports of major projects, monographs, data compilations, handbooks, sourcebooks, and special bibliographies.
TECHNOLOGY UTILIZATION PUBLICATIONS: Information on technology used by NASA that may be of particular interest in commercial and other non-aerospace applications. Publications include Tech Briefs, Technology Utilization Reports and Technology Surveys.
Details on the availability of these publications may be obtained from:
SCIENTIFIC AND TECHNICAL INFORMATION OFFICE
NATIONAL AERONAUTICS AND SPACE ADMINISTRATION
Washington, D.C. 20546