Embed Size (px)
Citation preview
C-reactive protein as an outcome predictor for maintenancehemodialysis patients
WILLIAM F. OWEN and EDMUND G. LOWRIE
Department of Medicine, Renal Division, Brigham and Women’s Hospital, Harvard Medical School, Boston, and Fresenius MedicalCare, North America, Lexington, Massachusetts, USA
C-reactive protein as an outcome predictor for maintenancehemodialysis patients.
Background. The possible association between inflammatoryprocesses and other outcome measures in ESRD patients led us tomeasure the blood C-reactive protein (CRP) concentration in alarge sample of hemodialysis patients, and to evaluate its statisti-cal relationship with other common laboratory measures andpatient survival. This was performed in a prospective, observa-tional analysis with mortality as the principal outcome measure.
Methods. One thousand fifty-four routine blood samples, col-lected from as many patients during June and July 1995 (onesample per patient), were randomly selected for measurement ofCRP, prealbumin, and other routine laboratory measures. Sixmonths after the initial blood tests, patient survival was deter-mined. Logistic regression analysis was the primary statistical toolused to evaluate laboratory associations with odds of death.Bivariate regression and correlation analyses were performedusing all available data.
Results. The distribution of CRP values was skewed; approxi-mately 35% of the values exceeded the upper limit of thelaboratory’s reference range. Serum albumin and prealbuminconcentrations both correlated with the serum creatinine concen-tration (r 5 0.378 and r 5 0.347, respectively; P’s , 0.001), andwere inversely associated with the CRP (r 5 20.254 and r 520.354, respectively; P’s ,0.001). CRP was also inversely associ-ated with blood hemoglobin concentrations (r 5 20.235; P ,0.001). Using multiple regression analysis to further explore theserelationships, the serum creatinine concentration was inverselyassociated with CRP (r 5 20.140; P , 0.001). However, afteradjustment for the linkage of the serum creatinine with the serumalbumin concentration (r 5 20.378; P , 0.001), no relationshipwith creatinine was observed. Before and after adjustment forserum albumin and prealbumin concentration, the ferritin con-centration correlated directly with CRP (r 5 0.148; P , 0.001).Ferritin was inversely and highly correlated with total iron bindingcapacity (r 5 20.516; P , 0.001). Independent associations ofhemoglobin with albumin (t 5 7.16; P , 0.001), prealbumin (t 52.39; P 5 0.017), and CRP (t 5 24.27; P , 0.001) were observed.Also, the dose of erythropoietin was directly associated with the
CRP concentration, before (r 5 0.081, P 5 0.009) and after (t 52.03, P 5 0.042) adjustment for the serum albumin and ironconcentrations. CRP correlated directly with neutrophil (r 50.318; P , 0.001) and platelet counts (r 5 0.180; P , 0.001), butwas weakly and inversely correlated with the lymphocyte count(r 5 20.071; P 5 0.04). A logistic regression analysis performedusing the laboratory variables revealed a strong, independent, andinverse relationships between the serum albumin and creatinineconcentrations, total lymphocyte count, and the odds risk ofdeath. In this model, no significant relationship was observedbetween the odds risk of death and CRP.
Conclusions. The data presented herein suggest that: (1) strongpredictable associations exist among laboratory proxies for mal-nutrition, anemia, and the acute phase reaction, and (2) thepathobiology implied by these laboratory abnormalities influencepatients’ mortal risk primarily through depletion of vital bodyproteins, not inflammation.
The processes of patient care that effect clinical out-comes for patients with end-stage renal disease (ESRD)have undergone increased scrutiny [1]. Because of itsstatistical power as a predictor of mortality for peritonealand hemodialysis patients, particular attention has beenplaced in the area of nutrition, where the serum albuminconcentration is routinely used as a proxy of visceralprotein nutrition [1–13]. Malnutrition is a common findingamong patients with ESRD [1, 2, 6, 7]. Malnutrition ofvisceral proteins often occurs during the course of manychronic diseases, such as chronic renal failure [14], pro-tracted infections [15], and cancer [16]. The depletion ofvital proteins in such conditions typically exceeds thatobserved in protein/caloric starvation alone [17]. There-fore, it has been suggested that the malnutrition of chronicdiseases is mediated in part by the release of one or morecatabolic and/or anti-anabolic cytokines that are usuallypart of the normal effector limb of adaptive immunity. Suchproinflammatory pathways also promote the enhancedsynthesis of acute phase proteins, described as part of theacute phase reaction [18–21].
The possible inflammatory association between outcomeprocesses in ESRD patients led us to quantitate theC-reactive protein concentration (CRP) and obtain other
Key words: C-reactive protein, anemia, malnutrition, albumin, end-stagerenal disease, survival.
Received for publication December 4, 1997and in revised form March 13, 1998Accepted for publication March 13, 1998
© 1998 by the International Society of Nephrology
Kidney International, Vol. 54 (1998), pp. 627–636
627
common laboratory measures in a large sample of hemo-dialysis patients. The serum concentration of CRP reflectsthe activity of cytokine-mediated acute phase processes[22–25] and is roughly proportional to the extent of tissueinjury [26]. Furthermore, selected cytokines stimulate thehepatic production of CRP and apo-ferritin, while inhibit-ing synthesis of albumin and prealbumin. The data pre-sented herein suggest that in patients with ESRD: (1)strong predictable associations exist among laboratoryproxies for malnutrition and the acute phase processes, and(2) the pathobiology implied by these laboratory abnormal-ities influences mortal risk in patients primarily throughdepletion of vital body proteins.
METHODS
Blood samples from 1,054 patients, that were routinelysent to LifeChem clinical laboratory (Rockleigh, NJ, USA)for processing during June and July 1995 (one bloodsample per patient), were randomly selected for measure-ment of the CRP and prealbumin concentrations. Otherroutinely measured laboratory tests were performed only asordered by the nephrologists. Because neither the patientsnor their nephrologists were aware of their participation inthe observational analysis, routine laboratory tests wereordered based on physician preference and clinical indica-tions alone. Because of variability in nephrologists’ practicestyles and patients’ case mix, the individual tests performed
differed from patient to patient. The routine laboratorytests were categorized as “primary” or “extended.” Primarylaboratory tests were those that had been performed on thelargest number of patients; extended laboratory tests wereperformed on a smaller number of subjects, but providedthe greatest number of tests for statistical analysis (Table1). Both categories of tests composed the initial data set.
Six months after the initial blood sampling (January andFebruary 1996), the patients were classified as alive ondialysis or dead. A total of 988 patients lived for six monthsafter blood sampling or died during that interval. Theremaining 66 patients were censored from further analysisbecause of renal transplantation (N 5 26), transfer to otherfacilities (N 5 31), or miscellaneous reasons (N 5 9), suchas recovery of renal function or loss to follow up. Eighthundred forty-five of these 988 patients had completeprimary laboratory data; 570 of these 988 patients hadcomplete primary and extended laboratory data.
The patients’ survival status, and their individual demo-graphic characteristics extracted from Fresenius MedicalCare’s Patient Statistical Profile System (PSP), weremerged with the initial data set to create the final data set.The PSP contains information for the individual patient’sdate of birth, gender, etiology of renal disease, and censordate, if applicable [2, 4, 6]. The final data set was used toevaluate the statistical association of the laboratory test
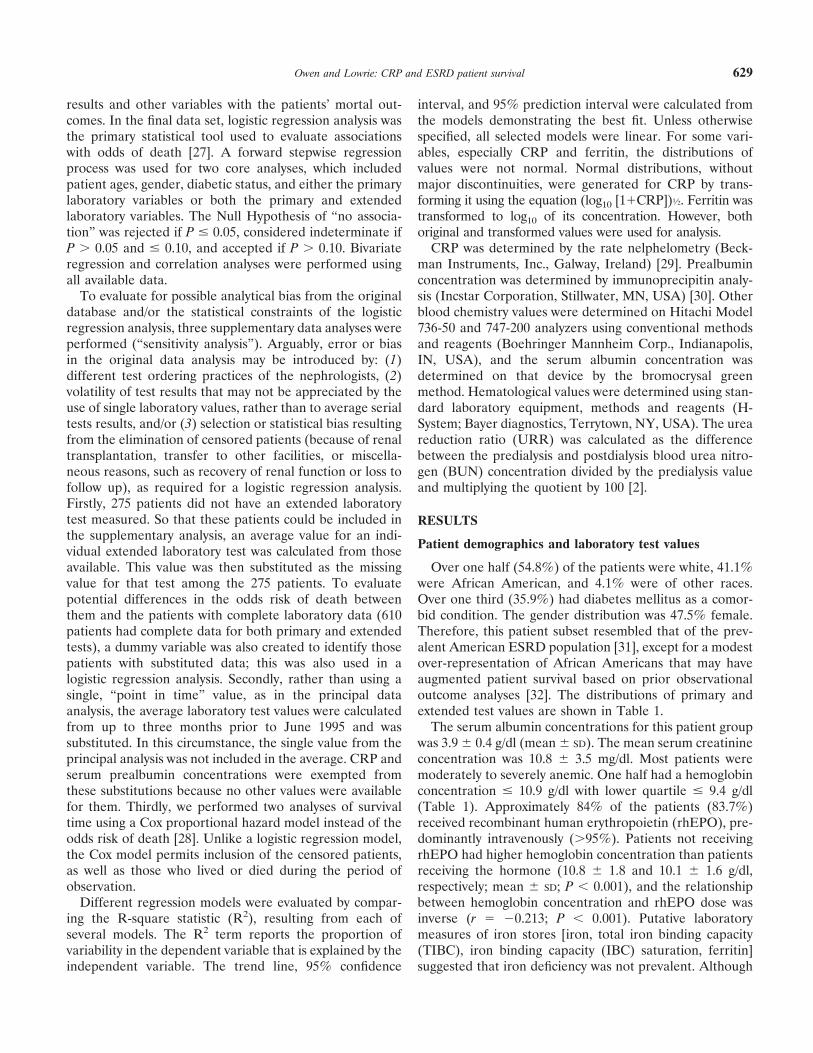
Table 1. Distribution of data elementsa
Variable Units N Mean SDReference
Range
Primary laboratory testsAlbumin gm/dl 1051 3.89 0.43 3.5–5.2Alkaline phosphatase U/liter 1051 140.53 194.46 39–117CO2 mEq/liter 1051 20.47 3.30 23–29Creatinine mg/dl 1051 10.80 3.50 0.6–1.6C-reactive protein mg/dl 1054 1.29 2.10 ,0.8Ferritin ng/ml 1042 322.84 430.05 5–179Hemoglobin gm/dl 946 10.16 1.38 11.4–17.0Iron mcg/dl 1045 53.51 30.57 37–145Lactate dehydrogenase U/liter 1051 210.35 59.04 118–273Phosphorus mg/dl 1051 6.00 1.90 2.7–4.5Potassium mEq/liter 1051 4.84 0.81 3.5–5.3Pre-albumin mg/dl 1053 29.16 7.04 18.0–33.8Total iron binding capacity mcg/dl 1015 216.29 49.98 259–388Iron binding capacity saturation % 1015 25.22 13.60 20–55
Extended laboratory testsBUN mg/dl 1051 67.26 18.84 6–19ALT U/liter 1051 18.26 14.21 0–37AST U/liter 869 16.47 21.4 0–40Lymphocyte count 103/ml 870 1.37 0.62 0.9–5.2Neutrophil count 103/ml 870 4.90 2.32 1.9–8.0Platelet count 103/ml 869 221.94 84.66 150–450Reticulocyte count % 968 1.72 0.87 0.3–2.1
Other laboratory variablesAge years 1054 59.33 15.49 NAMCHC g/dl 945 30.91 1.32 33–37MCV mcm3 945 95.24 7.87 80–99URR % 973 67.37 8.52 $65a N is number of patients on whom the test was performed; SD is standard deviation. Nine hundred four patients had complete primary laboratory
tests. Six hundred ten patients had complete primary and extended tests.
Owen and Lowrie: CRP and ESRD patient survival628
results and other variables with the patients’ mortal out-comes. In the final data set, logistic regression analysis wasthe primary statistical tool used to evaluate associationswith odds of death [27]. A forward stepwise regressionprocess was used for two core analyses, which includedpatient ages, gender, diabetic status, and either the primarylaboratory variables or both the primary and extendedlaboratory variables. The Null Hypothesis of “no associa-tion” was rejected if P # 0.05, considered indeterminate ifP . 0.05 and # 0.10, and accepted if P . 0.10. Bivariateregression and correlation analyses were performed usingall available data.
To evaluate for possible analytical bias from the originaldatabase and/or the statistical constraints of the logisticregression analysis, three supplementary data analyses wereperformed (“sensitivity analysis”). Arguably, error or biasin the original data analysis may be introduced by: (1)different test ordering practices of the nephrologists, (2)volatility of test results that may not be appreciated by theuse of single laboratory values, rather than to average serialtests results, and/or (3) selection or statistical bias resultingfrom the elimination of censored patients (because of renaltransplantation, transfer to other facilities, or miscella-neous reasons, such as recovery of renal function or loss tofollow up), as required for a logistic regression analysis.Firstly, 275 patients did not have an extended laboratorytest measured. So that these patients could be included inthe supplementary analysis, an average value for an indi-vidual extended laboratory test was calculated from thoseavailable. This value was then substituted as the missingvalue for that test among the 275 patients. To evaluatepotential differences in the odds risk of death betweenthem and the patients with complete laboratory data (610patients had complete data for both primary and extendedtests), a dummy variable was also created to identify thosepatients with substituted data; this was also used in alogistic regression analysis. Secondly, rather than using asingle, “point in time” value, as in the principal dataanalysis, the average laboratory test values were calculatedfrom up to three months prior to June 1995 and wassubstituted. In this circumstance, the single value from theprincipal analysis was not included in the average. CRP andserum prealbumin concentrations were exempted fromthese substitutions because no other values were availablefor them. Thirdly, we performed two analyses of survivaltime using a Cox proportional hazard model instead of theodds risk of death [28]. Unlike a logistic regression model,the Cox model permits inclusion of the censored patients,as well as those who lived or died during the period ofobservation.
Different regression models were evaluated by compar-ing the R-square statistic (R2), resulting from each ofseveral models. The R2 term reports the proportion ofvariability in the dependent variable that is explained by theindependent variable. The trend line, 95% confidence
interval, and 95% prediction interval were calculated fromthe models demonstrating the best fit. Unless otherwisespecified, all selected models were linear. For some vari-ables, especially CRP and ferritin, the distributions ofvalues were not normal. Normal distributions, withoutmajor discontinuities, were generated for CRP by trans-forming it using the equation (log10 [11CRP])1⁄2. Ferritin wastransformed to log10 of its concentration. However, bothoriginal and transformed values were used for analysis.
CRP was determined by the rate nelphelometry (Beck-man Instruments, Inc., Galway, Ireland) [29]. Prealbuminconcentration was determined by immunoprecipitin analy-sis (Incstar Corporation, Stillwater, MN, USA) [30]. Otherblood chemistry values were determined on Hitachi Model736-50 and 747-200 analyzers using conventional methodsand reagents (Boehringer Mannheim Corp., Indianapolis,IN, USA), and the serum albumin concentration wasdetermined on that device by the bromocrysal greenmethod. Hematological values were determined using stan-dard laboratory equipment, methods and reagents (H-System; Bayer diagnostics, Terrytown, NY, USA). The ureareduction ratio (URR) was calculated as the differencebetween the predialysis and postdialysis blood urea nitro-gen (BUN) concentration divided by the predialysis valueand multiplying the quotient by 100 [2].
RESULTS
Patient demographics and laboratory test values
Over one half (54.8%) of the patients were white, 41.1%were African American, and 4.1% were of other races.Over one third (35.9%) had diabetes mellitus as a comor-bid condition. The gender distribution was 47.5% female.Therefore, this patient subset resembled that of the prev-alent American ESRD population [31], except for a modestover-representation of African Americans that may haveaugmented patient survival based on prior observationaloutcome analyses [32]. The distributions of primary andextended test values are shown in Table 1.
The serum albumin concentrations for this patient groupwas 3.9 6 0.4 g/dl (mean 6 SD). The mean serum creatinineconcentration was 10.8 6 3.5 mg/dl. Most patients weremoderately to severely anemic. One half had a hemoglobinconcentration # 10.9 g/dl with lower quartile # 9.4 g/dl(Table 1). Approximately 84% of the patients (83.7%)received recombinant human erythropoietin (rhEPO), pre-dominantly intravenously (.95%). Patients not receivingrhEPO had higher hemoglobin concentration than patientsreceiving the hormone (10.8 6 1.8 and 10.1 6 1.6 g/dl,respectively; mean 6 SD; P , 0.001), and the relationshipbetween hemoglobin concentration and rhEPO dose wasinverse (r 5 20.213; P , 0.001). Putative laboratorymeasures of iron stores [iron, total iron binding capacity(TIBC), iron binding capacity (IBC) saturation, ferritin]suggested that iron deficiency was not prevalent. Although
Owen and Lowrie: CRP and ESRD patient survival 629
the total iron binding capacity was low, mean iron concen-tration was normal. IBC saturation was low normal and theferritin concentration was elevated.
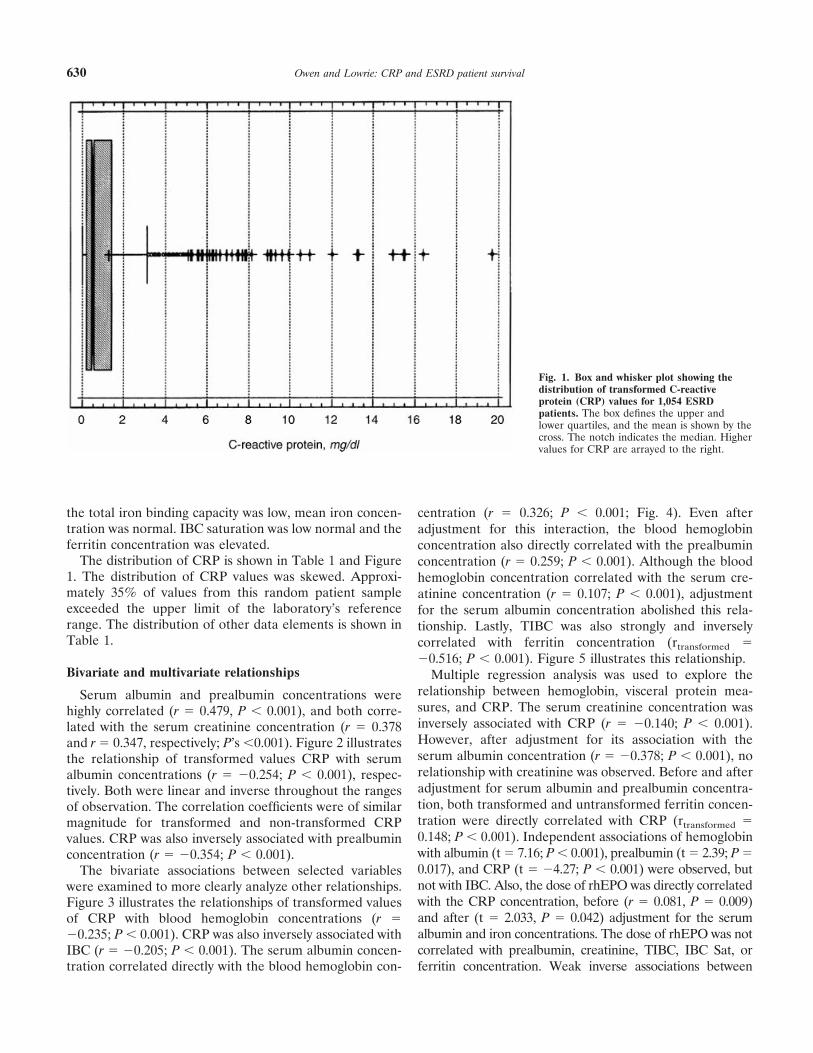
The distribution of CRP is shown in Table 1 and Figure1. The distribution of CRP values was skewed. Approxi-mately 35% of values from this random patient sampleexceeded the upper limit of the laboratory’s referencerange. The distribution of other data elements is shown inTable 1.
Bivariate and multivariate relationships
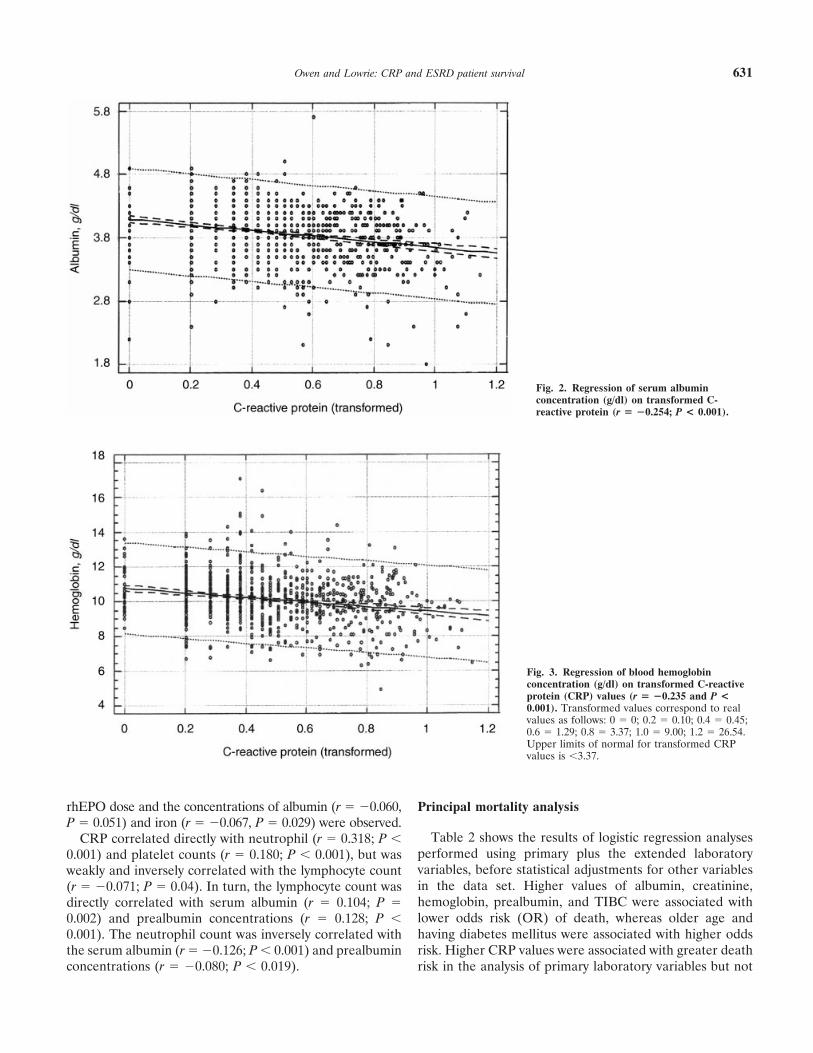
Serum albumin and prealbumin concentrations werehighly correlated (r 5 0.479, P , 0.001), and both corre-lated with the serum creatinine concentration (r 5 0.378and r 5 0.347, respectively; P’s ,0.001). Figure 2 illustratesthe relationship of transformed values CRP with serumalbumin concentrations (r 5 20.254; P , 0.001), respec-tively. Both were linear and inverse throughout the rangesof observation. The correlation coefficients were of similarmagnitude for transformed and non-transformed CRPvalues. CRP was also inversely associated with prealbuminconcentration (r 5 20.354; P , 0.001).
The bivariate associations between selected variableswere examined to more clearly analyze other relationships.Figure 3 illustrates the relationships of transformed valuesof CRP with blood hemoglobin concentrations (r 520.235; P , 0.001). CRP was also inversely associated withIBC (r 5 20.205; P , 0.001). The serum albumin concen-tration correlated directly with the blood hemoglobin con-
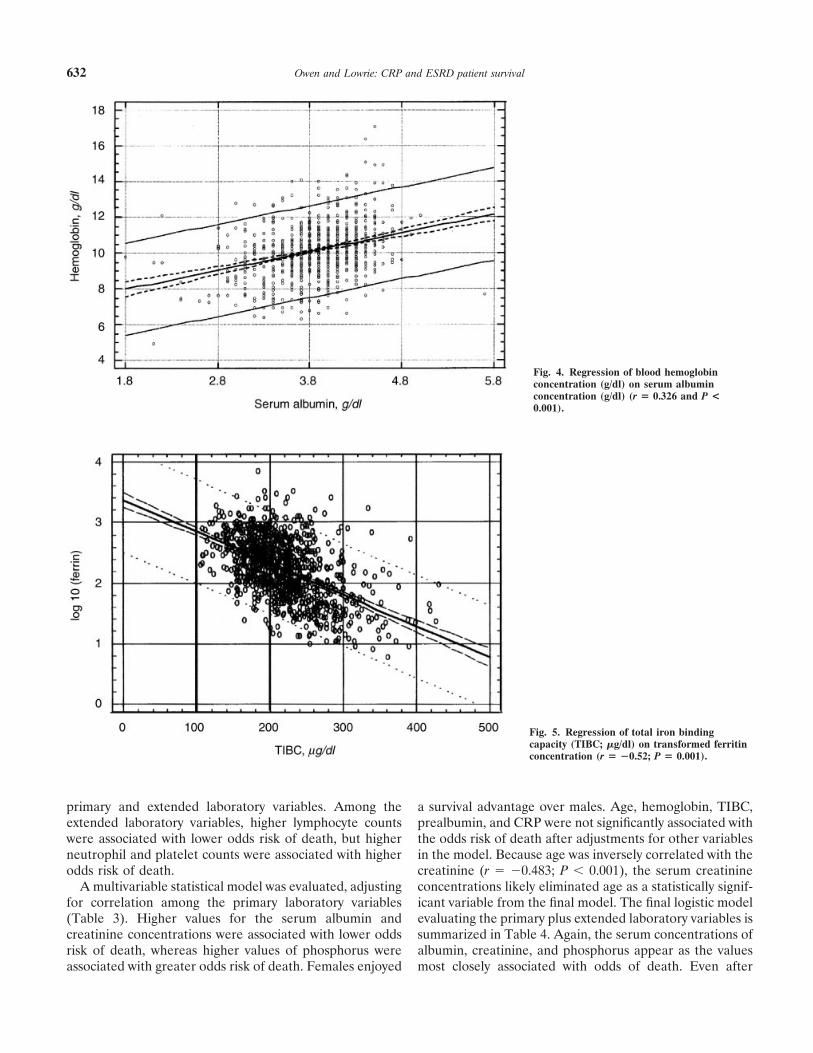
centration (r 5 0.326; P , 0.001; Fig. 4). Even afteradjustment for this interaction, the blood hemoglobinconcentration also directly correlated with the prealbuminconcentration (r 5 0.259; P , 0.001). Although the bloodhemoglobin concentration correlated with the serum cre-atinine concentration (r 5 0.107; P , 0.001), adjustmentfor the serum albumin concentration abolished this rela-tionship. Lastly, TIBC was also strongly and inverselycorrelated with ferritin concentration (rtransformed 520.516; P , 0.001). Figure 5 illustrates this relationship.
Multiple regression analysis was used to explore therelationship between hemoglobin, visceral protein mea-sures, and CRP. The serum creatinine concentration wasinversely associated with CRP (r 5 20.140; P , 0.001).However, after adjustment for its association with theserum albumin concentration (r 5 20.378; P , 0.001), norelationship with creatinine was observed. Before and afteradjustment for serum albumin and prealbumin concentra-tion, both transformed and untransformed ferritin concen-tration were directly correlated with CRP (rtransformed 50.148; P , 0.001). Independent associations of hemoglobinwith albumin (t 5 7.16; P , 0.001), prealbumin (t 5 2.39; P 50.017), and CRP (t 5 24.27; P , 0.001) were observed, butnot with IBC. Also, the dose of rhEPO was directly correlatedwith the CRP concentration, before (r 5 0.081, P 5 0.009)and after (t 5 2.033, P 5 0.042) adjustment for the serumalbumin and iron concentrations. The dose of rhEPO was notcorrelated with prealbumin, creatinine, TIBC, IBC Sat, orferritin concentration. Weak inverse associations between
Fig. 1. Box and whisker plot showing thedistribution of transformed C-reactiveprotein (CRP) values for 1,054 ESRDpatients. The box defines the upper andlower quartiles, and the mean is shown by thecross. The notch indicates the median. Highervalues for CRP are arrayed to the right.
Owen and Lowrie: CRP and ESRD patient survival630
rhEPO dose and the concentrations of albumin (r 5 20.060,P 5 0.051) and iron (r 5 20.067, P 5 0.029) were observed.
CRP correlated directly with neutrophil (r 5 0.318; P ,0.001) and platelet counts (r 5 0.180; P , 0.001), but wasweakly and inversely correlated with the lymphocyte count(r 5 20.071; P 5 0.04). In turn, the lymphocyte count wasdirectly correlated with serum albumin (r 5 0.104; P 50.002) and prealbumin concentrations (r 5 0.128; P ,0.001). The neutrophil count was inversely correlated withthe serum albumin (r 5 20.126; P , 0.001) and prealbuminconcentrations (r 5 20.080; P , 0.019).
Principal mortality analysis
Table 2 shows the results of logistic regression analysesperformed using primary plus the extended laboratoryvariables, before statistical adjustments for other variablesin the data set. Higher values of albumin, creatinine,hemoglobin, prealbumin, and TIBC were associated withlower odds risk (OR) of death, whereas older age andhaving diabetes mellitus were associated with higher oddsrisk. Higher CRP values were associated with greater deathrisk in the analysis of primary laboratory variables but not
Fig. 2. Regression of serum albuminconcentration (g/dl) on transformed C-reactive protein (r 5 20.254; P < 0.001).
Fig. 3. Regression of blood hemoglobinconcentration (g/dl) on transformed C-reactiveprotein (CRP) values (r 5 20.235 and P <0.001). Transformed values correspond to realvalues as follows: 0 5 0; 0.2 5 0.10; 0.4 5 0.45;0.6 5 1.29; 0.8 5 3.37; 1.0 5 9.00; 1.2 5 26.54.Upper limits of normal for transformed CRPvalues is ,3.37.
Owen and Lowrie: CRP and ESRD patient survival 631
primary and extended laboratory variables. Among theextended laboratory variables, higher lymphocyte countswere associated with lower odds risk of death, but higherneutrophil and platelet counts were associated with higherodds risk of death.
A multivariable statistical model was evaluated, adjustingfor correlation among the primary laboratory variables(Table 3). Higher values for the serum albumin andcreatinine concentrations were associated with lower oddsrisk of death, whereas higher values of phosphorus wereassociated with greater odds risk of death. Females enjoyed
a survival advantage over males. Age, hemoglobin, TIBC,prealbumin, and CRP were not significantly associated withthe odds risk of death after adjustments for other variablesin the model. Because age was inversely correlated with thecreatinine (r 5 20.483; P , 0.001), the serum creatinineconcentrations likely eliminated age as a statistically signif-icant variable from the final model. The final logistic modelevaluating the primary plus extended laboratory variables issummarized in Table 4. Again, the serum concentrations ofalbumin, creatinine, and phosphorus appear as the valuesmost closely associated with odds of death. Even after
Fig. 4. Regression of blood hemoglobinconcentration (g/dl) on serum albuminconcentration (g/dl) (r 5 0.326 and P <0.001).
Fig. 5. Regression of total iron bindingcapacity (TIBC; mg/dl) on transformed ferritinconcentration (r 5 20.52; P 5 0.001).
Owen and Lowrie: CRP and ESRD patient survival632
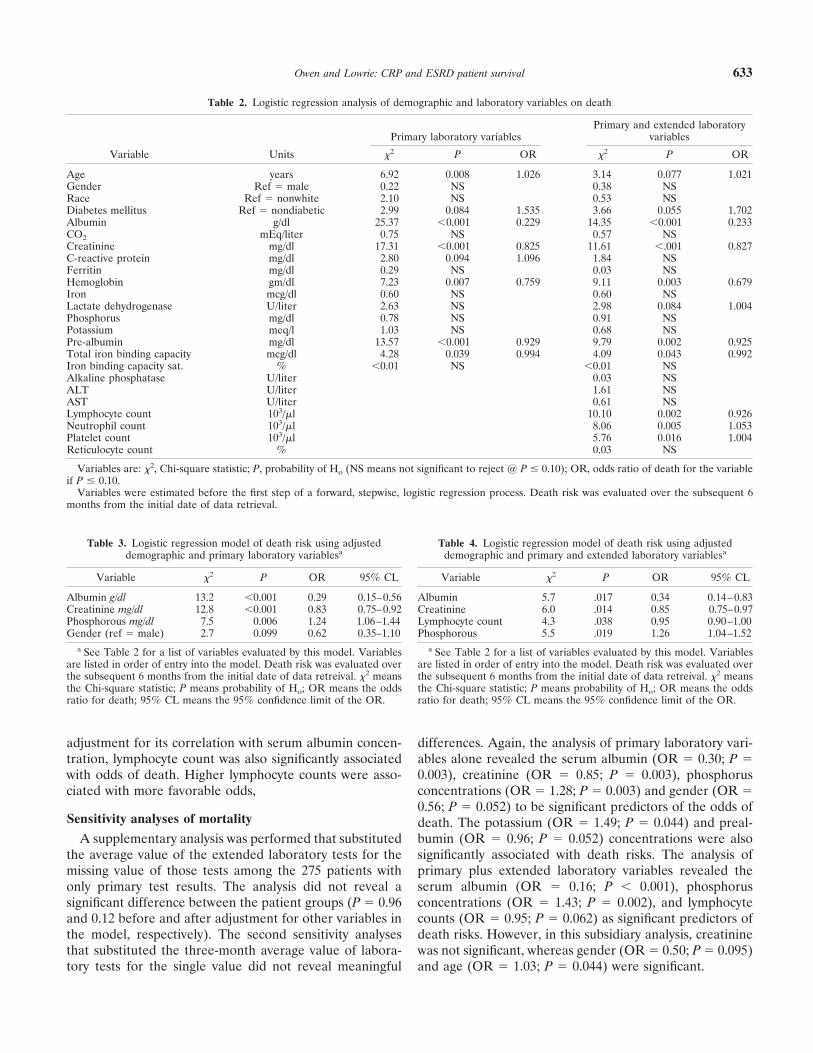
adjustment for its correlation with serum albumin concen-tration, lymphocyte count was also significantly associatedwith odds of death. Higher lymphocyte counts were asso-ciated with more favorable odds,
Sensitivity analyses of mortality
A supplementary analysis was performed that substitutedthe average value of the extended laboratory tests for themissing value of those tests among the 275 patients withonly primary test results. The analysis did not reveal asignificant difference between the patient groups (P 5 0.96and 0.12 before and after adjustment for other variables inthe model, respectively). The second sensitivity analysesthat substituted the three-month average value of labora-tory tests for the single value did not reveal meaningful
differences. Again, the analysis of primary laboratory vari-ables alone revealed the serum albumin (OR 5 0.30; P 50.003), creatinine (OR 5 0.85; P 5 0.003), phosphorusconcentrations (OR 5 1.28; P 5 0.003) and gender (OR 50.56; P 5 0.052) to be significant predictors of the odds ofdeath. The potassium (OR 5 1.49; P 5 0.044) and preal-bumin (OR 5 0.96; P 5 0.052) concentrations were alsosignificantly associated with death risks. The analysis ofprimary plus extended laboratory variables revealed theserum albumin (OR 5 0.16; P , 0.001), phosphorusconcentrations (OR 5 1.43; P 5 0.002), and lymphocytecounts (OR 5 0.95; P 5 0.062) as significant predictors ofdeath risks. However, in this subsidiary analysis, creatininewas not significant, whereas gender (OR 5 0.50; P 5 0.095)and age (OR 5 1.03; P 5 0.044) were significant.
Table 2. Logistic regression analysis of demographic and laboratory variables on death
Variable Units
Primary laboratory variablesPrimary and extended laboratory
variables
x2 P OR x2 P OR
Age years 6.92 0.008 1.026 3.14 0.077 1.021Gender Ref 5 male 0.22 NS 0.38 NSRace Ref 5 nonwhite 2.10 NS 0.53 NSDiabetes mellitus Ref 5 nondiabetic 2.99 0.084 1.535 3.66 0.055 1.702Albumin g/dl 25.37 ,0.001 0.229 14.35 ,0.001 0.233CO2 mEq/liter 0.75 NS 0.57 NSCreatinine mg/dl 17.31 ,0.001 0.825 11.61 ,.001 0.827C-reactive protein mg/dl 2.80 0.094 1.096 1.84 NSFerritin mg/dl 0.29 NS 0.03 NSHemoglobin gm/dl 7.23 0.007 0.759 9.11 0.003 0.679Iron mcg/dl 0.60 NS 0.60 NSLactate dehydrogenase U/liter 2.63 NS 2.98 0.084 1.004Phosphorus mg/dl 0.78 NS 0.91 NSPotassium meq/l 1.03 NS 0.68 NSPre-albumin mg/dl 13.57 ,0.001 0.929 9.79 0.002 0.925Total iron binding capacity mcg/dl 4.28 0.039 0.994 4.09 0.043 0.992Iron binding capacity sat. % ,0.01 NS ,0.01 NSAlkaline phosphatase U/liter 0.03 NSALT U/liter 1.61 NSAST U/liter 0.61 NSLymphocyte count 103/ml 10.10 0.002 0.926Neutrophil count 103/ml 8.06 0.005 1.053Platelet count 103/ml 5.76 0.016 1.004Reticulocyte count % 0.03 NS
Variables are: x2, Chi-square statistic; P, probability of Ho (NS means not significant to reject @ P # 0.10); OR, odds ratio of death for the variableif P # 0.10.
Variables were estimated before the first step of a forward, stepwise, logistic regression process. Death risk was evaluated over the subsequent 6months from the initial date of data retrieval.
Table 3. Logistic regression model of death risk using adjusteddemographic and primary laboratory variablesa
Variable x2 P OR 95% CL
Albumin g/dl 13.2 ,0.001 0.29 0.15–0.56Creatinine mg/dl 12.8 ,0.001 0.83 0.75–0.92Phosphorous mg/dl 7.5 0.006 1.24 1.06–1.44Gender (ref 5 male) 2.7 0.099 0.62 0.35–1.10
a See Table 2 for a list of variables evaluated by this model. Variablesare listed in order of entry into the model. Death risk was evaluated overthe subsequent 6 months from the initial date of data retreival. x2 meansthe Chi-square statistic; P means probability of Ho; OR means the oddsratio for death; 95% CL means the 95% confidence limit of the OR.
Table 4. Logistic regression model of death risk using adjusteddemographic and primary and extended laboratory variablesa
Variable x2 P OR 95% CL
Albumin 5.7 .017 0.34 0.14–0.83Creatinine 6.0 .014 0.85 0.75–0.97Lymphocyte count 4.3 .038 0.95 0.90–1.00Phosphorous 5.5 .019 1.26 1.04–1.52
a See Table 2 for a list of variables evaluated by this model. Variablesare listed in order of entry into the model. Death risk was evaluated overthe subsequent 6 months from the initial date of data retreival. x2 meansthe Chi-square statistic; P means probability of Ho; OR means the oddsratio for death; 95% CL means the 95% confidence limit of the OR.
Owen and Lowrie: CRP and ESRD patient survival 633
Substituting a Cox model analysis of the primary vari-ables, which included censored patients, yielded resultssimilar to the logistic analysis that did not include censoredpatients. The concentrations of serum albumin, creatinine,and phosphorus were identified as significantly associatedwith death risk, but gender was not. A similar analysis ofprimary plus extended laboratory variables revealed creat-inine, hemoglobin, lymphocyte count, phosphorus, andgender to be associated with death risk in the final model.Because the serum albumin concentration strongly corre-lated with death risk alone, it was selected for inclusion atthe first step. However, the combined and direct correla-tion of death risk with creatinine, lymphocyte count, andhemoglobin contributed to the elimination of the albuminconcentration.
DISCUSSION
Detecting the associations that link complicated dataelements and then translating the links into meaningfulpathobiological dimensions can be a difficult task. Thisdilemma is particularly true when there is a network ofassociations between the data elements. The ultimate in-tent of such analyses is to discover how the clinical andlaboratory variables are associated with important outcomemeasures of clinical care. A fundamental outcome measurethat is influenced by the processes of patient care is theodds of survival on hemodialysis. Because it is impossible tointernally or externally monitor the processes of clinicalcare in a direct manner, clinicians and regulators must relyupon laboratory surrogates of these operations. Using alarge and representative, national database of hemodialysispatients, we examined the statistical interactions betweenlaboratory variables and dialysis patient mortality. Al-though some of the r values reported herein are relativelylow, suggesting that some of the variability in the test beingscrutinized was accounted for by factors other than thosebeing analyzed, the very low P values make it mathemati-cally unlikely that the associations are random interactions.Considering that this was an uncontrolled, observationalanalysis of hemodialysis patients, in which uniformity ofdisease processes and their management was absent, theclinical relationships described by these r values are ofintellectual significance and clinically relevant.
The logistic regression analysis described a strong, inde-pendent, inverse relationships between the serum albuminand creatinine concentrations and the odds risk of death,but no such relationship for CRP. These observations aresimilar to earlier findings and suggest an inverse associationbetween the body’s content of both visceral and somaticproteins and odds of death [2, 5–8, 13, 33]. These labora-tory measures are highly correlated, and their independentassociations with odds of death suggests that the adequacyof the body’s content of protein is strongly associated withthe patient’s likelihood of long-term survival [6, 7]. Theproinflammatory and catabolic cytokines that stimulate the
production of CRP also cause muscle catabolism with theliberation of amino acids and inhibition of muscle proteinsynthesis [22–26]. Furthermore, these cytokines may induceanorexia, so further compromise protein stores throughdiminished protein/caloric intake. Hence, one nexus be-tween inflammation and visceral/somatic protein contentamong dialysis patients includes the cytokine-mediatedacute phase processes.
In contrast to a previous report [34], the current analysisdid not find CRP to be an independent predictor of survivalfor ESRD patients. Critical differences include the inclu-sion of a far greater number of subjects, the use of a moreextensive laboratory profile, and the analysis of outcomesamong ambulatory ESRD patients instead of hospitalizedsubjects for the present analysis. The current database doesnot permit extrapolation of these results to patients whoare more ill and hospitalized, and vice versa. Because of itsmore rapid induction and shorter half-life, CRP may be amore dynamic marker of short-term inflammation/injurythan the serum albumin or creatinine concentration. Analternative explanation for the observed difference in thepredictive power of CRP is that proximate mortality may bebetter reflected by CRP, whereas longer term patientsurvival may be predicted by the alternative laboratorysurrogates of nutrition. Circumspect extrapolation of CRPas an independent outcome predictor for the hemodialysispatient population is urged.
Similarly, the data presented herein support and extendthe hypothesis that a low serum albumin concentration maynot simply reflect inadequate intake of dietary proteinand/or calories. Depleted stores of vital proteins may resultin part from down-regulation of protein synthetic processesand up-regulation of catabolic processes. For example, thein vitro treatment of hepatocytes with IL-1b rapidly inhibitsalbumin synthesis [35]. Furthermore, a dietary and kineticobservational analysis of hypoalbuminemic ESRD patientsrevealed that some subjects had appropriate protein/caloricintakes, normalized protein catabolic rates, low dialysatealbumin losses, and diminished albumin turnover rates [36].For these patients, the degree of hypoalbuminemia corre-lated with the elevation of serum levels of laboratorysurrogates of inflammation, such as the CRP, a2-macro-globulin, ferritin, and serum amyloid A concentration [36,37]. These studies suggest that in some hypoalbuminemicESRD patients, cytokine-mediated inflammation induceshypoalbuminemia.
Multiple regression analyses revealed independent asso-ciations of visceral protein measures and CRP with bloodhemoglobin concentration. These findings suggests thatanemia is also associated with both cytokine-dependentinflammation and nutritional status. The direct associationof CRP with rhEPO dose, and its inverse association withalbumin, support this linkage. Further independent supportfor this hypothesis is provided by the observation thatESRD patients with elevated blood levels of interleukin
Owen and Lowrie: CRP and ESRD patient survival634
(IL)-6 are more anemic, and this anemia is corrected byreducing the cytokine levels [38]. Similarly, nude micetransfected with tumor necrosis factor (TNF) developsevere anemia [39]. The observed iron indices in thispatient base also supports the provocative role of proin-flammatory cytokines linking erythropoiesis and nutrition.We observed that the serum iron, TIBC, and Sat-IBCtended to be normal to low, but the ferritin was high. Thislaboratory pattern has been observed for other ESRDpatient bases [40, 41]. In a recent analysis, .50% of thepatients had IBC saturation ,20%, and 44% of the pa-tients had serum ferritin concentration .200 mg/liter [42].This pattern of alteration for iron indices is commonly seenin the anemia accompanying chronic disease (ACD) [43,44]. Hematologic indices of ACD have been observedduring states of elevated cytokine activity [44].
We also observed an inverse statistical relationship be-tween seemingly disparate processes, like nutritional statusand anemia. Similar findings have been reported by others[41, 45]. In those earlier analyses, the serum albuminconcentration was the most powerful predictor of anemiaamong the laboratory measures evaluated. Clinical supportfor this statistical link is provided by the longitudinalobservation of the serum albumin and hemoglobin concen-trations in malnourished ESRD patients receiving intradia-lytic parenteral nutrition (IDPN) [13, 46]. During the sixmonths of observation prior to receiving IDPN, the declinein serum albumin concentration was accompanied by aparallel decrease in hemoglobin concentration, despiteincreasing rhEPO doses. After the initiation of IDPN, thepatients’ albumin and hemoglobin concentrations in-creased, and their odds risk of death declined [13]. Furthersupport for this linkage is provided by the observation thatseverely malnourished patients without renal disease de-velop anemia that is reversed by correction of protein/caloric malnutrition alone [47, 48]. Arguably, a cytokine-dependent decline in nutritional status may further impairerythropoiesis in some malnourished patients [19].
In the current analysis, C-reactive protein was inverselyassociated with laboratory measures of protein stores (al-bumin, creatinine, prealbumin). CRP is an archetypal acutephase reactant, so called because of increased blood levelswith acute inflammatory processes [20, 22–26]. Like fer-ritin, the hepatic synthesis of CRP is augmented by proin-flammatory cytokines, such as IL-1b and TNF-a. Thehepatic synthesis of albumin, prealbumin, and transferrin,are reciprocally inhibited by those cytokines [22–24].Hence, a biochemical explanation exists for the observedpattern of statistical associations and that provides a com-mon pathobiology shared for anorexia, depletion of vitalbody proteins, laboratory signs of inflammation, and dial-ysis-associated anemia. The common pathobiologic featureis the presence of proinflammatory cytokines, either aloneor in combination with a diminished protein-caloric intake,
effecting deleterious changes in multiple physiologic sys-tems.
Lastly, death risk was higher in patients with a lowlymphocyte count, an observation also made in otherpatients during the course of malnutrition [49, 50]. Thefundamental role of lymphocytes in the effector limb ofadaptive immunity suggests that lymphopenia may increaseinfectious risk in this population. The observation of alymphocyte effect on death risk, that is independent ofnutritional surrogates like albumin, suggests that deleteri-ous immunologic dysfunction can also occur in this popu-lation in the absence of overt laboratory signs of malnutri-tion. A fundamental unanswered question is what is theproximate cause of the death in these situations: is it theinciting process(es) resulting in the excesses of proinflam-matory cytokine(s), and/or is mortality a consequence ofthe deleterious pathobiologic effects of the cytokines onnutrition, hematopoiesis, etc.? If a particular pathobiologicprocess links seemingly disparate processes, such as anemiaand the depletion of visceral body proteins, the question israised whether it is the process, its provocateur, or theconsequences of the depletion that is most closely associ-ated with mortal risk. Both albumin and creatinine concen-trations are closely associated with the odds of death inthese and other studies [2, 5, 7, 8, 33,], whereas CRP is not.
Differences in statistical linkages between the logisticregression model and Cox proportional hazard model wereobserved and are unsurprising. There is no a priori reasonthat identical results should be achieved with the twomodels. Although both models examine the statisticalimpact of clinical variables on mortality, their conceptualconstruct of death risk is quite different. A logistic regres-sion model determines the odds risk of survival, whereasthe Cox model assesses variables that effect the length ofsurvival. Because these two models conceptually view pa-tient mortality in different, but complimentary ways, theywere used to support the observation about CRP, not toachieve statistical uniformity. Thus, the data presentedherein offer additional support for the hypothesis that amajor contributor to mortal risk in ESRD is the depletionof body proteins, not inflammation.
Because laboratory surrogates of nutrition, such as thealbumin and creatinine concentration are influenced tovarying degrees by processes other than protein/caloricintake and nutrient utilization, the statistical linkages de-scribed herein should be extended by correlation with moredirect measures of patients’ nutritional status, such asbioelectrical impedance and dual energy x-ray absorptiom-etry [51].
Reprint requests to William F. Owen, Jr., M.D., Brigham and Women’sHospital, Dialysis Unit Administrative Office, 75 Francis Street, Boston,Massachusetts 02115, USA.E-mail: [email protected]
Owen and Lowrie: CRP and ESRD patient survival 635
REFERENCES1. DEPARTMENT OF HEALTH AND HUMAN SERVICES: ESRD Core Indi-
cators Project, Health Care Financing Administration. Health Stan-dards and Quality Bureau, April 1996, 1996
2. OWEN WF, LEW NL, LIU Y, LOWRIE EG, LAZARUS JM: The ureareduction ratio and serum albumin concentration as predictors ofmortality in patients undergoing hemodialysis. N Engl J Med 329:1001–1006, 1993
3. LOWRIE EG, HUANG WH, LEW NL, LIU Y: The relative contributionof measured variables to death risk among hemodialysis patients, inDeath on Hemodialysis: Preventable or Inevitable, edited by FRIEDMANE, Hingham, Kluwer Academic Publishers, 1994, pp 121–141
4. LOWRIE EG: Chronic dialysis treatment: Clinical outcome and relatedprocesses of care. Am J Kidney Dis 24:255–266, 1994
5. ISEKI K, KAWAZOE N, FUKIYAMA K: Serum albumin is a strongpredictor of death in chronic dialysis patients. Kidney Int 44:115–119,1993
6. LOWRIE EG, LEW NL: Death risk in hemodialysis patients: The predictivevalue of commonly measured variables and an evaluation of death ratedifferences between facilities. Am J Kidney Dis 15:458–482, 1990
7. LOWRIE EG, LEW NL: Commonly measured laboratory variables inhemodialysis patients. Relationships among them and to death risk.Semin Nephrol 12:276–283, 1992
8. AVRAM MM, MITTMAN N, BONOMINI L, CHATTOPADHYAY J, FEIN P:Markers for survival in dialysis: A seven-year prospective study. Am JKidney Dis 26:209–219, 1995
9. BERGSTROM J: Why are dialysis patients malnourished? Am J KidneyDis 26: 229–241, 1995
10. CHERTOW G, BULLARD A, LAZARUS JM: Malnutrition in dialysispatients. Am J Nephrol 16:79–89, 1996
11. IKIZLER TA, HAKIM RM: Nutrition in end-stage renal disease. KidneyInt 50:343–357, 1996
12. AVRAM MM, FEIN PA, ANTIGANI A, MITTMAN N, MUSHNICK RA,LUSTIG AR, LAPUZ MH, GOLDWASSER P: Cholesterol and lipiddisturbances in renal disease: The natural history of uremic dyslipi-demia and the impact of hemodialysis and continuous ambulatoryperitoneal dialysis. Am J Med 87:55N–60N, 1989
13. LOWRIE EG: Conceptual model for a core pathobiology of uremiawith special reference to anemia, malnourishment, and mortalityamong dialysis patients. Semin Dial (in press)
14. KOPPLE J, BERG R, HOUSER H, STEINMAN TI, TESCHAN P: Nutritionalstatus of patients with different levels of chronic renal insufficiencyModification of Diet in Renal Disease Study Group (MDRD). KidneyInt 36(Suppl 27):S184–S194, 1989
15. BEISEL WR: Herman Award Lecture, 1995: Infection-induced malnu-trition-from cholera to cytokines. Am J Clin Nutr 62:813–819, 1995
16. LANGSTEIN HN, NORTON JA: Mechanisms of cancer cachexia. Hema-tol/Oncol Clinics N Am 5:103–122, 1991
17. ESPAT NJ, COPELAND EM, MOLDAWER LL: Tumor necrosis factor andcachexia: A current perspective. Surg Oncol 3:255–262, 1994
18. KLASING KC: Nutritional aspects of leukocytic cytokines. J Nutr118:1436–1446, 1988
19. GRIMBLE RF: Cytokines: Their relevance to nutrition. Eur J Clin Nutr43:217–230, 1989
20. JANEWAY CA, TRAVERS P: Immunobiology, in The Immune System inHealth and Disease, London/New York, Current Biology Ltd andGarland Publishing, 1994
21. HENRY BJ: Clinical Diagnosis and Management by Laboratory Methods.Philadelphia, W.B. Saunders, 1991
22. STEEL DM, WHITEHEAD AS: The major acute phase reactants:C-reactive protein, serum amyloid P component and serum amyloid Aprotein. Immunol Today 15:81–88, 1994
23. DOWTON SB, COLTON HR: Acute phase reactants in inflammation andinfection. Semin Hematol 25:84–90, 1988
24. DINARELLO CA: Mechanisms of disease: Interleukin-1 and the pathogen-esis of the acute phase response. N Engl J Med 311:1413–1418, 1984
25. HART WH: C-reactive protein: The best laboratory indicator availablefor monitoring disease activity. Cleveland Clin J Med 56:126–130, 1989
26. STAHL WM: Acute phase protein response to tissue injury. Crit CareMed 15:545–550, 1987
27. Applied Logistic Regression. Edited by HOSMER DW, LEMESHOW S,New York, John Wiley and Sons, 1989
28. LEE ET: Statistical Methods for Survival Data Analysis. Belmont,Lifetime Learning, 1980
29. STERNBERG JC: A rate nelphelometer for measuring specific proteinsby immunoprecipitin reactions. Clin Chem 23:1456–1464, 1977
30. PETERSON PA Studies on interaction between prealbumin, retinol-binding protein and vitamin A. J Biol Chem 246:44–49, 1971
31. US RENAL DATA SYSTEM: USRDS 1996 Annual Data Report, Be-thesda, National Institutes of Health, National Institute of Diabetesand Digestive and Kidney Diseases, 1996
32. BLOEMBERGEN W, HELD P, PORT FK, MAUGER RA, WOLFE RA:Causes of death in dialysis patients: Racial and gender differences.J Am Soc Nephrol 5:1231–1242, 1994
33. UNITED STATES RENAL DATA SYSTEM: Excerpts from the 1992 AnnualReport: Comorbid conditions and correlations with mortality riskamong 3399 incident hemodialysis patients. Am J Kidney Dis 20:32–38,1992
34. BERGSTROM J, HEIMBURGER O, LINDHOLM B, QURESHI AR: Elevatedserum C-reactive protein is a strong predictor of increased mortalityand low serum albumin in hemodialysis patients. (abstract) J Am SocNephrol 6:573, 1995
35. BALLMER PE, MCNURLAN MA, GRANT I, GARLICK PJ: Down-regula-tion of albumin synthesis in the rat by human recombinant interleu-kin-1 beta or turpentine and the response to nutrients. J ParenteralEnteral Nutr 19:266–271, 1995
36. KAYSEN G, RATHORE V, SHEARER GC, DEPNER TA: Mechanism ofhypoalbuminemia in hemodialysis patients. Kidney Int 48:510–516, 1995
37. KAYSEN G, STEVENSON FT, DEPNER TA: Determinants of albuminconcentration in hemodialysis patients. Am J Kidney Dis 29:658–668,1996
38. MACDOUGALL IC, ALLEN DA, TUCKER B, BAKER LRI, RAINE AEG:Serum interleukin-6 levels are useful indicators of marrow suppres-sion in patients with resistance to erythropoietin due to inflammatorydisease. (abstract) J Am Soc Nephrol 4:428, 1993
39. ROODMAN GD, JOHNSON RA, CLIBON U: Tumor necrosis factor-181and the anemia of chronic disease: Effects of chronic exposure to TNFon erythropoiesis in vivo. Adv Exp Med Biol 271:185–196, 1989
40. MUIRHEAD N, BARGMAN J, BURGESS E, JINDAL KK, LEVIN N, NOLANL, PARFREY P: Evidence-based recommendations for the clinical useof recombinant human erythropoietin. Am J Kidney Dis 26(Suppl1):S1–S24, 1995
41. MADORE F, BRIDGES K, BRUGNARA C, LEW NL, LOWRIE EG, LAZA-RUS JM, OWEN WF: Anemia in hemodialysis patients: Variablesimpacting this novel outcome predictor. J Am Soc Nephrol 8:1921–1929, 1997
42. YOUNG EW, BLOEMBERGEN WE, WOODS JD, EMMERT G, PORT FK,WOLFE RA, JONES CA, HELD PJ: Iron use among erythropoietintreated U. S. hemodialysis patients. (abstract) Kidney Int (in press)
43. CASH JM, SEARS DA: The anemia of chronic disease: Spectrum ofassociated diseases in a series of unselected hospitalized patients.Am J Med 87:638–644, 1989
44. MEANS RT, DRANTZ SB: Progress in understanding the pathogenesisof the anemia of chronic disease. Blood 80:1639–1647, 1992
45. IFUDU O, FELDMAN J, FRIEDMAN EA: The intensity of hemodialysisand the response to erythropoietin in patients with end-stage renaldisease. N Engl J Med 334:420–425, 1996
46. CHERTOW GM, LING J, LEW NL, LAZARUS JM, LOWRIE EG: Theassociation of intradialytic parenteral nutrition administration withsurvival in hemodialysis patients. Am J Kidney Dis 24:912–920, 1994
47. EDOZIEN JC, RAHIM-KHAN MA: Anemia in protein malnutrition. ClinSci 34:315–326, 1968
48. MACDOUGALL LG, MOODLEY G, EYBERG C, QUIRK M: Mechanismsof anemia in protein-energy malnutrition in Johannesburg. Am J ClinNutr 35:229–235, 1982
49. WOLFSON M, STRONG CJ, MINTURN D, GRAY DK, KOPPLE JD:Nutritional status and lymphocyte function in maintenance hemodi-alysis patients. Am J Clin Nutr 39:547–555, 1984
50. BANSAL VK, POPLI S, PICKERING J, ING TS, VERTUNO LL, HANO JE:Protein-calorie malnutrition and cutaneous anergy in hemodialysismaintained patients. Am J Clin Nutr 33:1608–1611, 1980
51. OWEN WF: Nutritional status and survival in ESRD patients, inMineral and Electrolyte Metabolism (vol 23), edited by MASSRY S,Basel, Karger AG, 1997, pp 196–205
Owen and Lowrie: CRP and ESRD patient survival636