Embed Size (px)
Citation preview

COURSE SEMESTER PRETEST
Today you will take the semester course pretest. This is what you will be tested on at the end of semester test (midterm) in January.
Again, this is for my instructional purposes to decipher what you are already proficient in. It will be entered in eSembler but with a 0% weight so it will NOT count against you.
Don’t forget to turn in your signed syllabus Duplicate questions - #4 & 15 and #14 and
20
OPENING ASSIGNMENT
1. How is science different from other fields of study like history, art, and philosophy?
2. List the steps of the scientific method.

UNIT 1 NATURE AND PROCESS OF SCIENTIFIC INVESTIGATIONSBy Mrs. Shaw
UNIT 1 - PART 1 LEARNING GOALS
Students will be able to Differentiate the study of
science from other fields of study like history, math, and english.
Explain the process of scientific investigations.

WHAT IS SCIENCE?At it's most fundamental level we can define science as two different activities: 1. the methodical collection of facts about the
universe2. the attempt to create explanations of how
those facts relate to each other
The "collection of data" part of science is pretty easy to understand, but the "tie it all together" part is widely misunderstood.

SCIENCE VS. OTHER FIELDS OF STUDY
Science is evidence based explanations of the physical and natural world!!
Science is a dynamic (always changing), self-correcting process. What was true once, becomes false or modified with more study and testing.
In the field of science, there are three words in rising order of importance: conjecture, hypothesis and theory.
CONJECTURE, HYPOTHESIS, AND THEORY
A conjecture is an interesting idea about the universe, but it's little more than speculation; comes from a persons memory, no research has been done.
A hypothesis is a prediction of what you expect to happen and why; it means that someone has thoroughly researched the topic and hasn't found any contradictions.
A theory is backed by dozens or hundreds of people, who have examined every possible aspect of the theory they can, and have accumulated a very large body of evidence to back it up. A theory is as close to scientific fact as you can get.

CHECK FOR UNDERSTANDING #1
Our current ideas on how tectonic plates move and have moved over time is based on a significant amount of empirical (verifiable) evidence by qualified scientists who have studied this idea.
Is this a conjecture, hypothesis, or a theory?
CHECK FOR UNDERSTANDING #2
Mark noticed that all the plants in his house were angled toward the windows as they grew.
He made a statement that “Plants must be attracted to sunlight”.
Is this a conjecture, hypothesis, or a theory?

CHECK FOR UNDERSTANDING #3 Mark decided to do some research and he found 10
different valid sources where scientists did studies that showed that plants will grow towards sunlight as a survival characteristic known as phototropism.
Mark made a prediction based on his research:“If a plant is placed in a box with a hole cut into the corner of the top, then the plant will grow towards that opening because plants have survival characteristics known as phototropism where they will seek sunlight to help them create their own food.”
Is this a conjecture, hypothesis, or a theory?
SCIENTIFIC METHOD
There is not one standard scientific method, however there is a generally agreed upon model that describes how science operates.
1. State the problem/question/observation 2. Research the problem 3. Form a hypothesis 4. Test the hypothesis (experiment) 5. Record and analyze data 6. State the conclusion (publish) 7. Repeat the work to validate
SCIENTIFIC METHOD: STEP 1 State the problem: •What is the problem? (ask yourself) •The problem is a scientific question that can be answered by experimentation. •Should be stated in very clear, precise terms. •Should not be too broad. •This is typically stated in a question format
•EXAMPLE: Will taking one aspirin per day for 60 days decrease blood pressure in females ages 12-14?

SCIENTIFIC METHOD: STEP 2
Research the problem: Has anyone ever tested this question before . . .if yes, what were their results?
•The researcher will typically gather information on the problem. They may read accounts and journals on the subject, or be involved in communications with other scientists
•Scientists build on the work of previous researchers. The first step is to do a literature review to find out what previous research has already been done in the field.
•EXAMPLE: Some people relate stories to doctors that they feel relief from high blood pressure after taking one aspirin per day. The idea is not scientific if it is untested or if one person reports this (called anecdotal evidence).
SCIENTIFIC METHOD: STEP 3
Form a hypothesis, or probable solution, to your problem:
•Hypothesis - a testable explanation about how a change in the independent variable will affect the dependent variable stated in a way that is testable.
•An explanation of a cause and effect relationship •Ideally this should be written in an if-then format. •EXAMPLE: If a female aged 12-14 takes one aspirin per day for 60 days, then her blood pressure will decrease.
STEP 3 CONTINUED
A statement is testable if evidence can be collected that does/does not support it.
•Must be falsifiable •A hypothesis cannot be proven true beyond all doubt because new data may be introduced. •It is impossible to test all given conditions, and someone with more knowledge, sometime in the future, may find a condition under which the hypothesis does not hold true.
CHECK FOR UNDERSTANDING #1
Mom and I were baking a cake for my sister’s birthday. We didn’t have any baking powder. The recipe said to add one teaspoon of baking powder to the cake batter. Since it was such a small amount we baked the cake anyway without the baking powder. We were very disappointed when the cake came out of the oven flat instead of fluffy.
Problem question: Research: Hypothesis:
CHECK FOR UNDERSTANDING #1
Mom and I were baking a cake for my sister’s birthday. We didn’t have any baking powder. The recipe said to add one teaspoon of baking powder to the cake batter. Since it was such a small amount we baked the cake anyway without the baking powder. We were very disappointed when the cake came out of the oven flat instead of fluffy.
Problem question: Does baking powder in cakes cause it to rise?
Research: the effect of baking powder in cakes Hypothesis: If baking powder is added to cake batter
then it will rise because baking powder in cakes cause a chemical reaction to occur that releases gas that push the cake up..
CHECK FOR UNDERSTANDING #2
Mr. Krabbs wants to make Bikini Bottoms a nicer place to live. He has created a new sauce that he thinks will reduce the production of body gas associated with eating crabby patties from the Krusty Krab.
Problem question: Research: Hypothesis:
CHECK FOR UNDERSTANDING #2
Mr. Krabbs wants to make Bikini Bottoms a nicer place to live. He has created a new sauce that he
thinks will reduce the production of body gas associated with eating crabby patties from the Krusty Krab.
Problem question: Does Mr. Krabbs sauce work to decrease gas?
Research: Did the new sauce help reduce Mr. Krabbs gas? What is the active ingredient?
Hypothesis: If 20 people at the Krusty Krab are given Mr. Krabbs new sauce, then they will experience less gas because . . . .
CHECK FOR UNDERSTANDING #3
Indian River Lagoon has seen an overgrowth of toxic algae blooms over the past few years. During this same time period, there have been increases in the amount of water being discharged from Lake Okeechobee into the Indian River Lagoon.
Problem question: Research: Hypothesis:

SCIENTIFIC METHOD: STEP 4
Test your hypothesis: •Perform a controlled experiment: an organized series
of steps used to test a hypothesis by comparing a control group to the experimental group.
•All variables are controlled (kept constant) except the one factor (the independent variable) that is being changed. •Should be detailed, clear and planned step by step so the experiment can be replicated by other scientists in the future •Investigation of a cause and effect relationship between the independent variable and the dependent variable. •EXAMPLE: Test 100 females, ages 12-14, to see if taking one aspirin a day for 60 days lowers blood pressure in those females.
STEP 4 CONTINUED Variable: Any factor in an experiment that changes
or could be changed. •Only one variable is isolated and tested while all other variables are held constant. •Independent Variable (I.V.): The variable changed, on purpose, in the experiment by the researcher. •EXAMPLE: Taking an aspirin or not. This is what the experimenter changes between this groups in the experiment. •Dependent Variable (D.V.): The variable that may respond to the I.V. and is being measured in the experiment. •EXAMPLE: The blood pressure of the individuals in the experiment, which may change from the administration of aspirin.
STEP 4 CONTINUED
Constants (controlled variables): conditions that remain the same in the experiment
•A factor in an experiment that is kept the same in all trials
•EXAMPLE: Some probable constants would include: only females were used, only females between ages 12-14, the same dosage of aspirin was given to all the individuals in the experimental group for the same defined time interval –60 days, the same brand of aspirin was given, the same type of diet was ideally given to the members of both groups as well as the same activity level prescribed.

STEP 4 CONTINUED
Control or Control Group: The group, or experimental subject, which does not receive the Independent Variable or a change in the Independent Variable
•The standard for comparison in an experiment; the independent variable is not applied to the control group, or is not changed in the control group. •EXAMPLE: the group of females that does not get the dose of aspirin. •Experimental Group: The group, or experimental subject, which does receive the Independent Variable, or a change in the Independent Variable. •The test group

OPENING ASSIGNMENT
1. Get your homework out and ready to review. Then work on question below.
2. Differentiate between the following A dependent and an independent variable A control group and an experimental group
Fire drill procedure review
STEP 4 CONTINUED
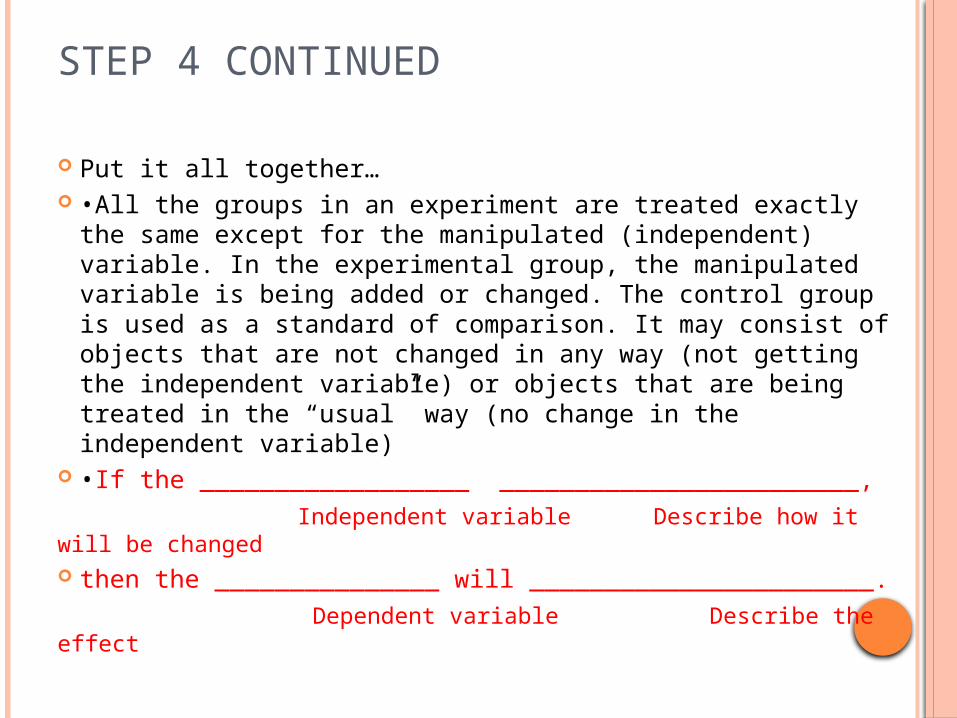
Put it all together… •All the groups in an experiment are treated exactly the
same except for the manipulated (independent) variable. In the experimental group, the manipulated variable is being added or changed. The control group is used as a standard of comparison. It may consist of objects that are not changed in any way (not getting the independent variable) or objects that are being treated in the “usual” way (no change in the independent variable)
•If the __________________ ________________________, Independent variable Describe how it will be changed then the _______________ will _______________________. Dependent variable Describe the effect

STEP 4 CONTINUED
By controlling the variables and only changing one at a time (I.V.) researchers are able to conclude that the changes in the dependent variable are due exclusively to changes in the independent variable.
•If the expected results are obtained, then the hypothesis is supported (not proven).
•If the expected results are not obtained, then the hypothesis is rejected or refuted
•No matter the outcome, a tested hypothesis has value in science because it helps researchers advance scientific knowledge.
SCIENTIFIC METHOD: STEP 5
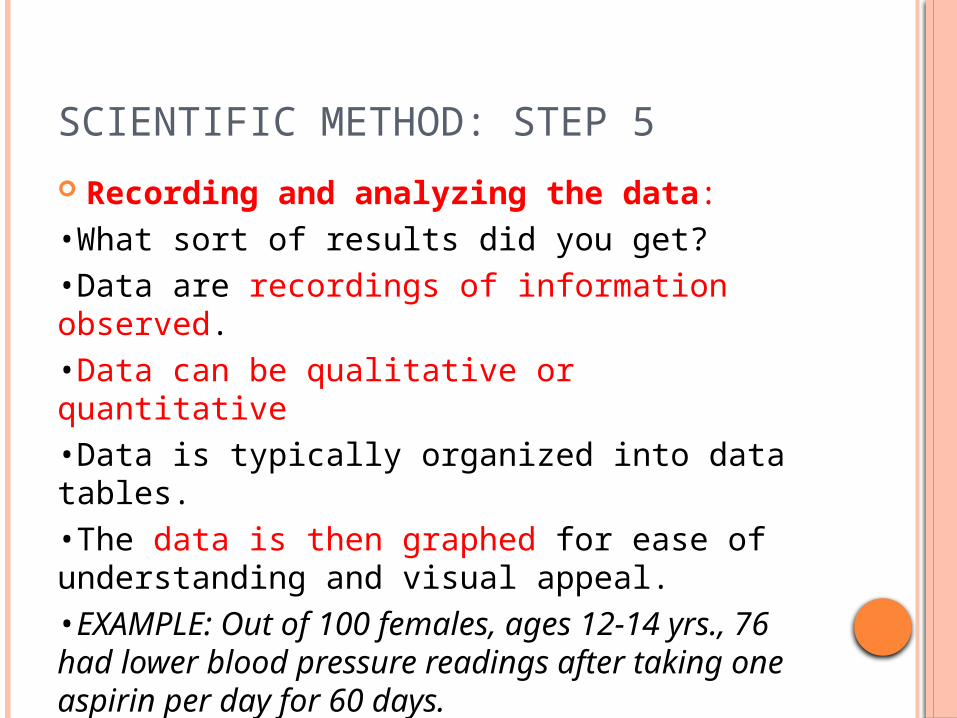
Recording and analyzing the data: •What sort of results did you get? •Data are recordings of information observed. •Data can be qualitative or quantitative •Data is typically organized into data tables. •The data is then graphed for ease of understanding and visual appeal. •EXAMPLE: Out of 100 females, ages 12-14 yrs., 76 had lower blood pressure readings after taking one aspirin per day for 60 days.
REVIEW OF QUALITATIVE VS. QUANTITATIVE OBSERVATIONS AND DATA
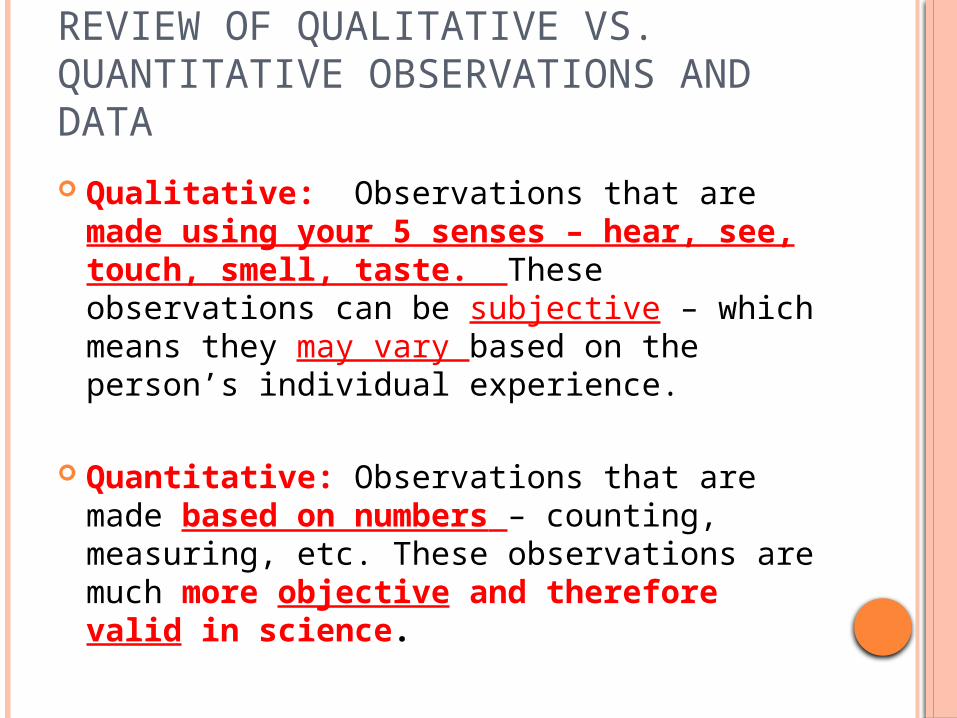
Qualitative: Observations that are made using your 5 senses – hear, see, touch, smell, taste. These observations can be subjective – which means they may vary based on the person’s individual experience.
Quantitative: Observations that are made based on numbers – counting, measuring, etc. These observations are much more objective and therefore valid in science.
STEP 5 CONTINUED
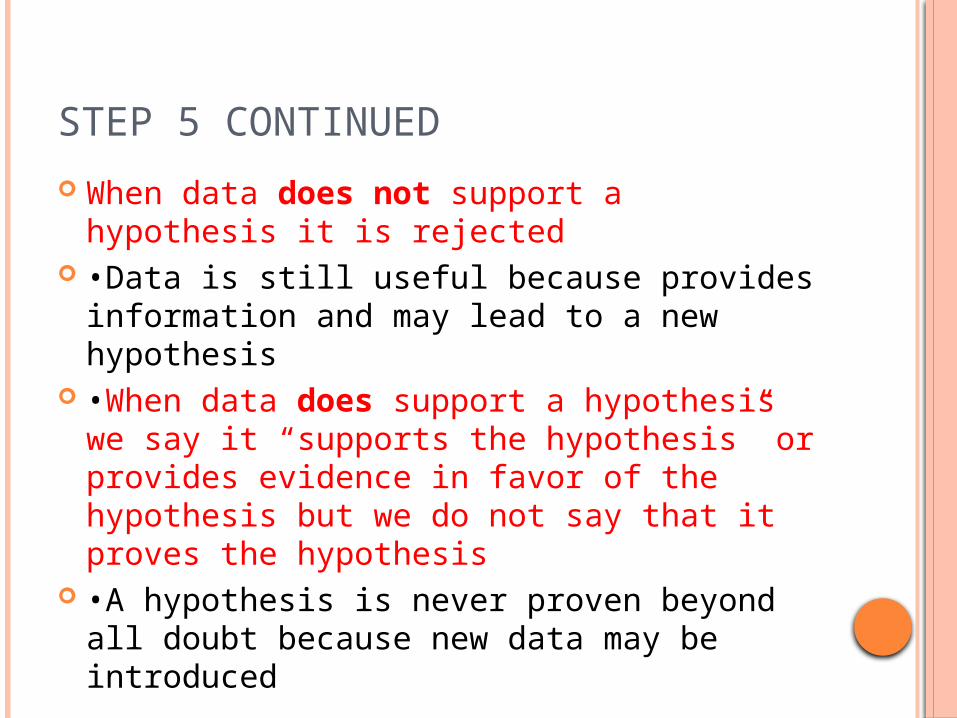
When data does not support a hypothesis it is rejected
•Data is still useful because provides information and may lead to a new hypothesis
•When data does support a hypothesis we say it “supports the hypothesis” or provides evidence in favor of the hypothesis but we do not say that it proves the hypothesis
•A hypothesis is never proven beyond all doubt because new data may be introduced

SCIENTIFIC METHOD: STEP 6 Stating the conclusion: •What does all the data mean? •Based on whether the results support or refute the hypothesis, researchers review the relationships among the data and make a final statement summing up the results of the experiment. •Does the data support your hypothesis? •EXAMPLE: The data shows that taking one aspirin per day for 60 days decreases blood pressure in 76% of the tested females ages 12-14 compared to a decrease in blood pressure in 11% of the control group. Therefore, the original hypothesis has been supported, that taking one aspirin per day can decrease blood pressure. 9
CHECK FOR UNDERSTANDING #1
During a scientific investigation, which step will a scientist perform first?
A. Collect and organize data.
B. Plan the experimental procedure.
C. Make observations and then define the problem for investigation.
D. Defend conclusions drawn from data.

CHECK FOR UNDERSTANDING #2
Ellis’s class is studying tide pools and starfish. Which of the following is an example of a hypothesis she might make?
A. The starfish population of tide pools varies.B. Atlantic tide pools have more starfish than Pacific tide pools do.C. The water temperature of tide pools is increasing.D. If the water temperature in the tide pool increases, then the starfish population will decrease because starfish require a specific water temperature of 67-80 degrees to maintain homeostasis.
CHECK FOR UNDERSTANDING #3
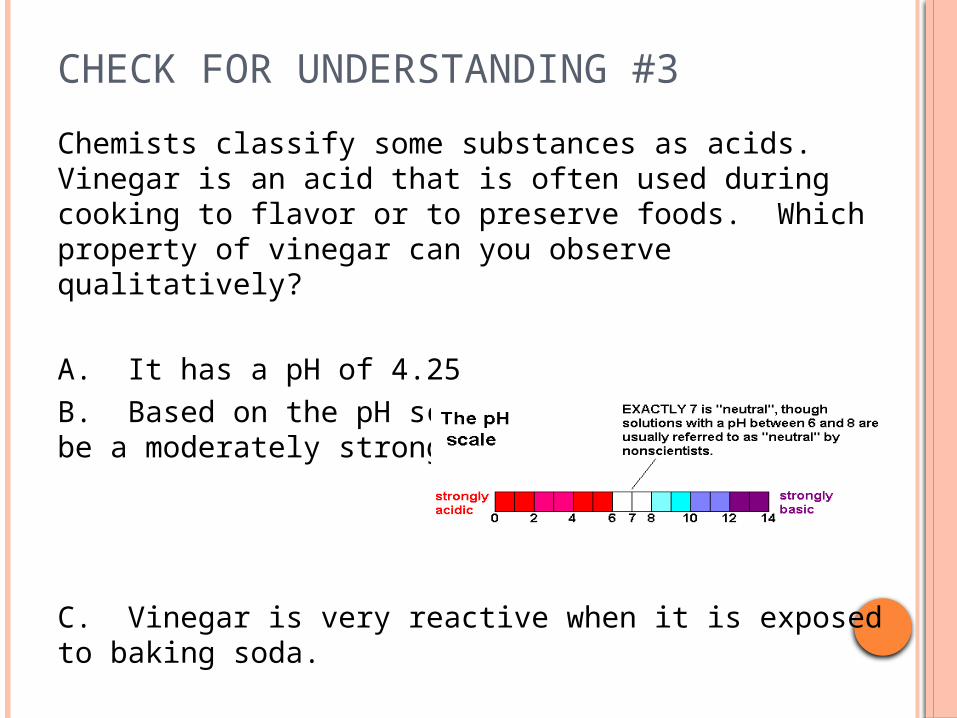
Chemists classify some substances as acids. Vinegar is an acid that is often used during cooking to flavor or to preserve foods. Which property of vinegar can you observe qualitatively?
A. It has a pH of 4.25B. Based on the pH scale it is considered to be a moderately strong acid.
C. Vinegar is very reactive when it is exposed to baking soda.

PRACTICE SCENARIOHomer notices that his shower is covered in a
strange green slime. His friend Barney tells him that coconut juice will get rid of the green slime. Homer decides to check this this out by spraying half of the shower with coconut juice. He sprays the other half of the shower with water. After 3 days of "treatment" there is no change in the appearance of the green slime on either side of the shower.
What is Homer’s question?
What would his hypothesis be? If . . . .then . . .because
What should Homer write for his conclusion?
REVIEW OF THE SCIENTIFIC METHOD
http://www.youtube.com/watch?v=gMLHW1wU8dI
Now: List 3 qualitative and 3 quantitative observations you can make about IRCHS. Make 3 questions that you would like to see tested.
WHAT ARE VARIABLES?
A variable is any factor that can be controlled or changed in an experiment. There are 3 types of variables:
Dependent: the variable that is measured or observed for a response
Independent: the variable that you change in the experiment – remember there can only be one!
Controlled or constant: the variable that does not change during the experiment
CHECK FOR UNDERSTANDING #1 VARIABLES
Smithers thinks that a special juice will increase the productivity of workers. He creates two groups of 50 workers each and assigns each group the same task (in this case, they're supposed to staple a set of papers). Group A is given the special juice to drink while they work. Group B is not given the special juice. After an hour, Smithers counts how many stacks of papers each group has made. Group A made 1,587 stacks, Group B made 2,113 stacks.
Identify the:
1. Control Group
2. Independent Variable
3. Dependent Variable
4. What should Smithers' conclusion be?
CHECK FOR UNDERSTANDING #1 VARIABLES
Smithers thinks that a special juice will increase the productivity of workers. He creates two groups of 50 workers each and assigns each group the same task (in this case, they're supposed to staple a set of papers). Group A is given the special juice to drink while they work. Group B is not given the special juice. After an hour, Smithers counts how many stacks of papers each group has made. Group A made 1,587 stacks, Group B made 2,113 stacks.
Identify the:
1. Control Group – Group B because it is not given juice
2. Independent Variable – amount of juice given
3. Dependent Variable – amount of stacks stapled
4. What should Smithers' conclusion be? Group B made more stacks and they did not receive the juice so his
hyopthesis is not supported.

CONTROLS AND VARIABLES PRACTICE WORKSHEET
Work together with your table partner to analyze the scenarios and determine the variables. Please raise your hand if you have any questions.

OPENING ASSIGNMENT Get your homework out so I can check it and we can go over
it. . . Then read the scenario below and answer the following questions.
Sponge Bob notices that his pal Gary is suffering from slimotosis, which occurs when the shell develops a nasty slime and gives off a horrible odor. His friend Patrick tells him that rubbing seaweedon the shell is the perfect cure, while Sandy says that drinking Dr. Kelp will be a better cure. Sponge Bob decides to test this cure by rubbing Gary with seaweed for 1 week and having him drink Dr. Kelp.After a week of treatment, the slime is gone and Gary’s shell smells better.
1. What was the initial observation?2. What is Sponge Bob’s hypothesis? (a cause / effect relationship
stated in an “If. . .then, because” format)3. What is the independent variable?4. What is the dependent variable?5. What should Sponge Bob’s conclusion be?
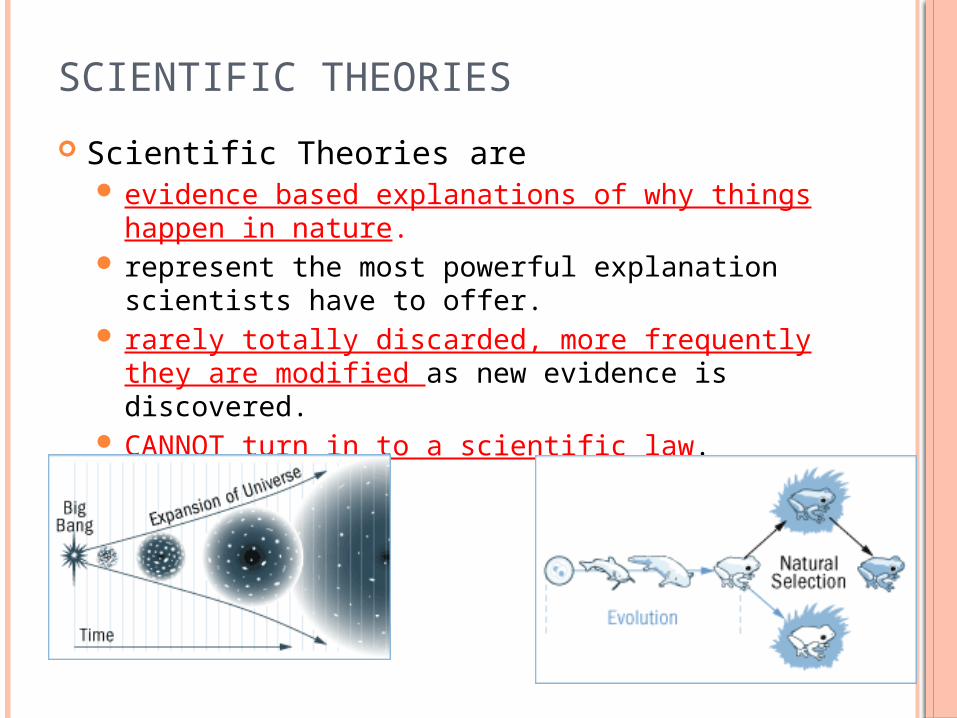
SCIENTIFIC THEORIES
Scientific Theories are evidence based explanations of why things
happen in nature. represent the most powerful explanation
scientists have to offer. rarely totally discarded, more frequently they are
modified as new evidence is discovered. CANNOT turn in to a scientific law.
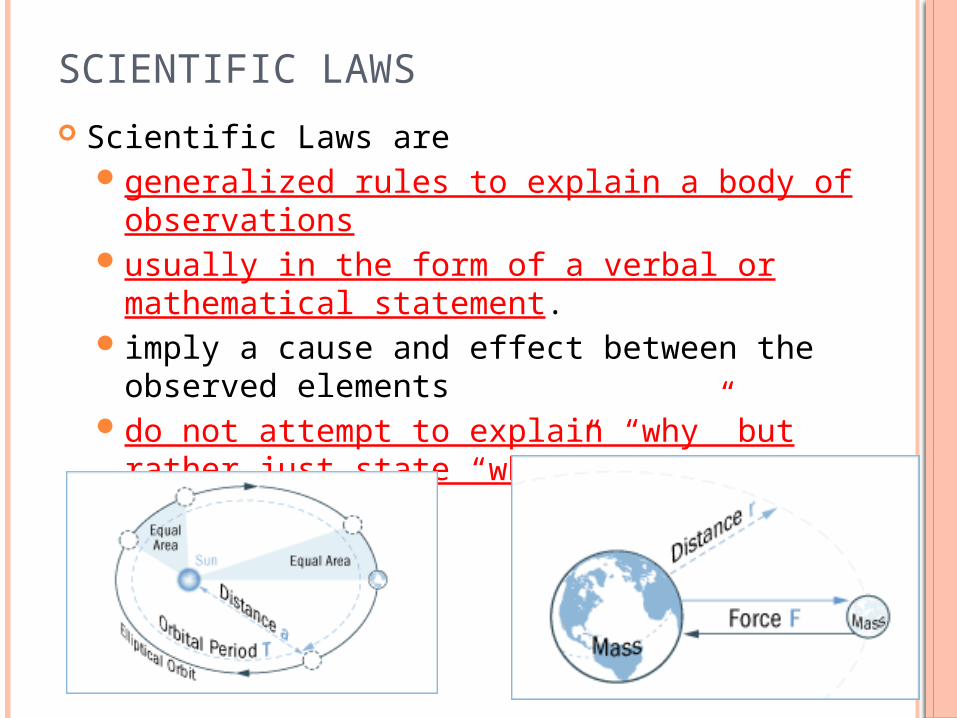
SCIENTIFIC LAWS Scientific Laws are
generalized rules to explain a body of observations
usually in the form of a verbal or mathematical statement.
imply a cause and effect between the observed elements
do not attempt to explain “why” but rather just state “what” will happen.

Commonalities between a scientific law and theory: •Both are based on tested hypotheses •Both are supported by a large body of empirical data (verifiable evidence!!)•Both help unify a particular field •Both are widely accepted by the vast majority of scientists within a discipline •Both could be shown wrong at some time if there are data to suggest so
UNIT 1 – PART 3 DATA ANALYSIS AND GRAPHING LEARNING GOALS
Students will be able to:
Identify the mean, median, mode, and range in a specific set of data
Create an appropriate graph to document and analyze a set of data
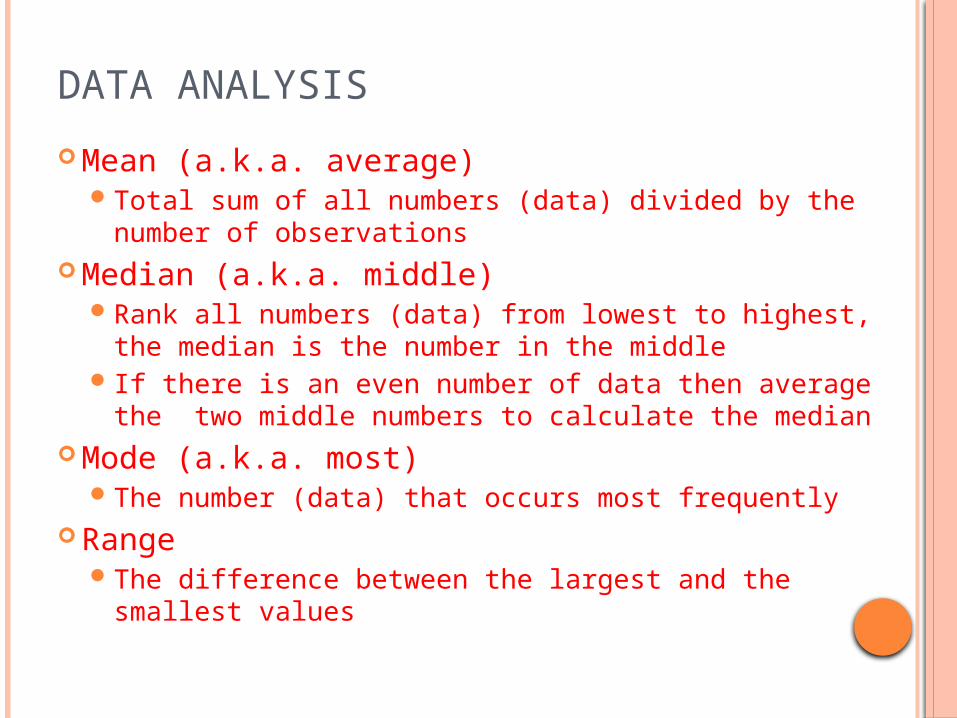
DATA ANALYSIS
Mean (a.k.a. average) Total sum of all numbers (data) divided by the number
of observations Median (a.k.a. middle)
Rank all numbers (data) from lowest to highest, the median is the number in the middle
If there is an even number of data then average the two middle numbers to calculate the median
Mode (a.k.a. most) The number (data) that occurs most frequently
Range The difference between the largest and the smallest
values
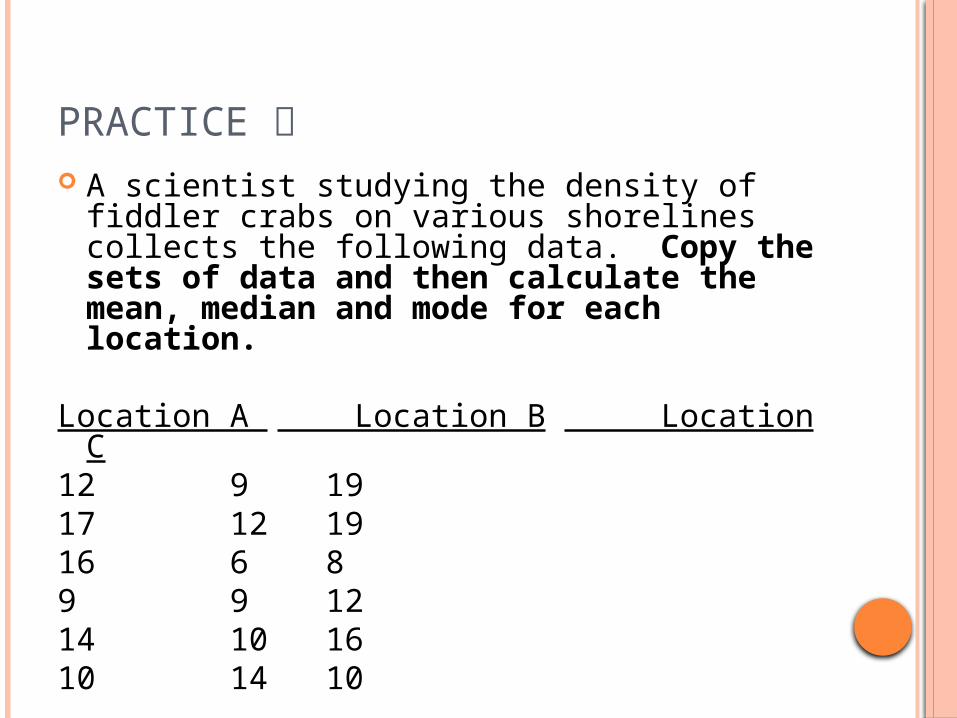
PRACTICE A scientist studying the density of fiddler
crabs on various shorelines collects the following data. Copy the sets of data and then calculate the mean, median and mode for each location.
Location A Location B Location C12 9 1917 12 1916 6 89 9 1214 10 1610 14 10
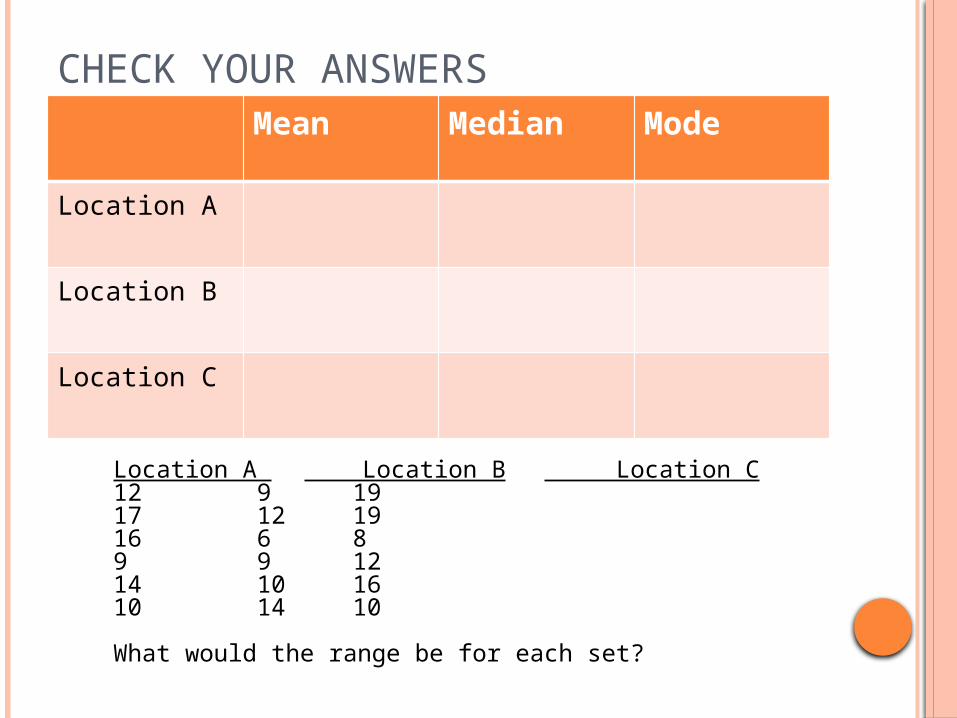
CHECK YOUR ANSWERSMean Median Mode
Location A
Location B
Location C
Location A Location B Location C12 9 1917 12 1916 6 89 9 1214 10 1610 14 10
What would the range be for each set?
WHY DO WE GRAPH DATA IN SCIENCE?
We graph data in science to show patterns and trends.
A picture is worth a thousand words!
2005-2006
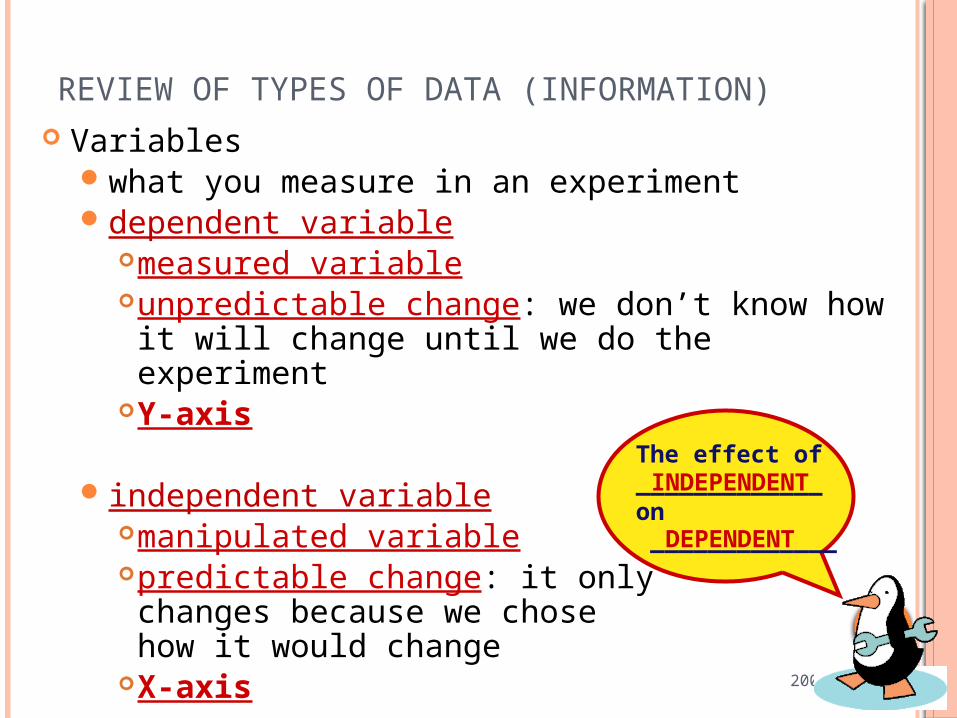
REVIEW OF TYPES OF DATA (INFORMATION) Variables
what you measure in an experimentdependent variable
measured variableunpredictable change: we don’t know how it will change until we do the experiment
Y-axis
independent variablemanipulated variablepredictable change: it only changes because we chose how it would change
X-axis
The effect of _____________on _____________
INDEPENDENT
DEPENDENT
2005-2006
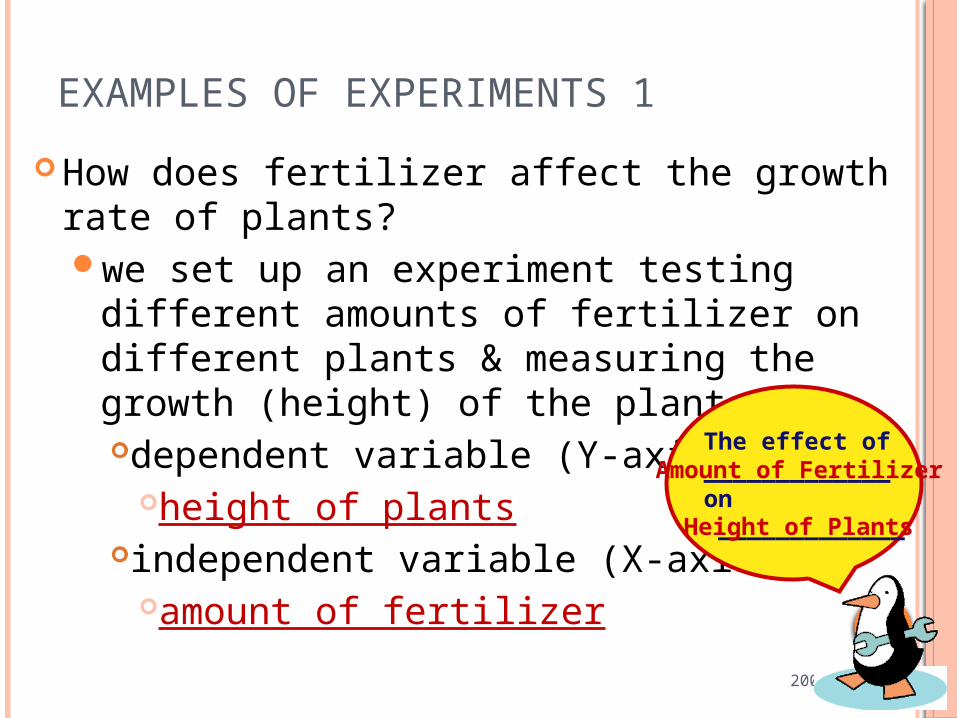
EXAMPLES OF EXPERIMENTS 1
How does fertilizer affect the growth rate of plants?we set up an experiment testing different
amounts of fertilizer on different plants & measuring the growth (height) of the plants:dependent variable (Y-axis)?
height of plantsindependent variable (X-axis)?
amount of fertilizer
The effect of _____________on _____________
Amount of Fertilizer
Height of Plants
2005-2006
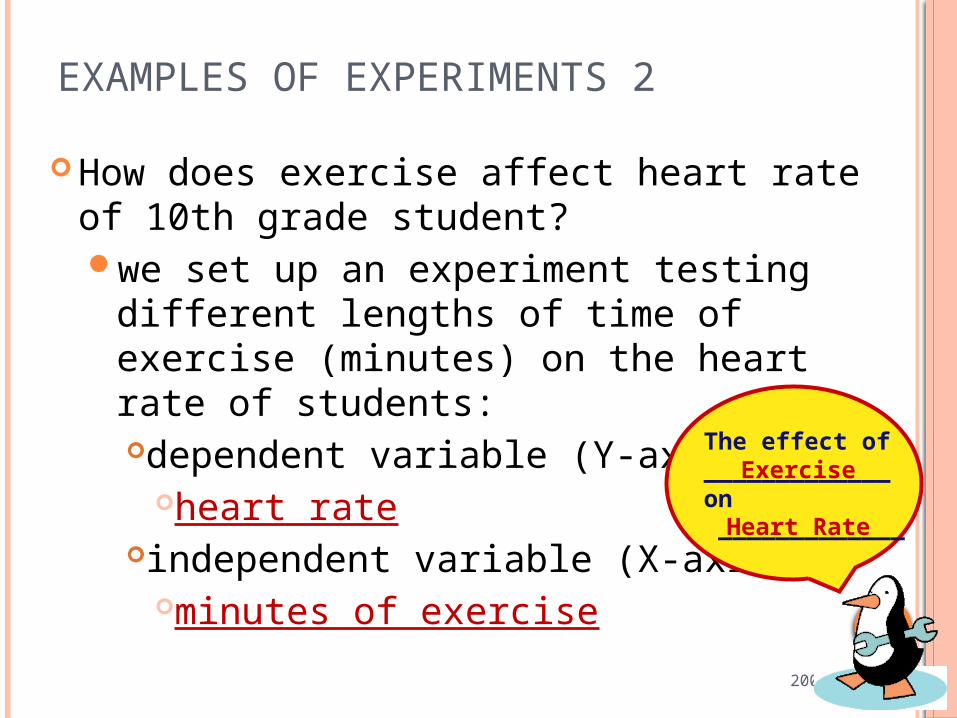
EXAMPLES OF EXPERIMENTS 2
How does exercise affect heart rate of 10th grade student?we set up an experiment testing
different lengths of time of exercise (minutes) on the heart rate of students:dependent variable (Y-axis)?
heart rateindependent variable (X-axis)?
minutes of exercise
The effect of _____________on _____________
Exercise
Heart Rate

2005-2006
EXAMPLES OF EXPERIMENTS 3
What’s the favorite drink of students?we set up an experiment surveying
students and asking which is their favorite drink :
dependent variable (Y-axis)?number of students
independent variable (X-axis)?type of drink
The effect of _____________on _____________
Type of Drink
How many students chose it
2005-2006
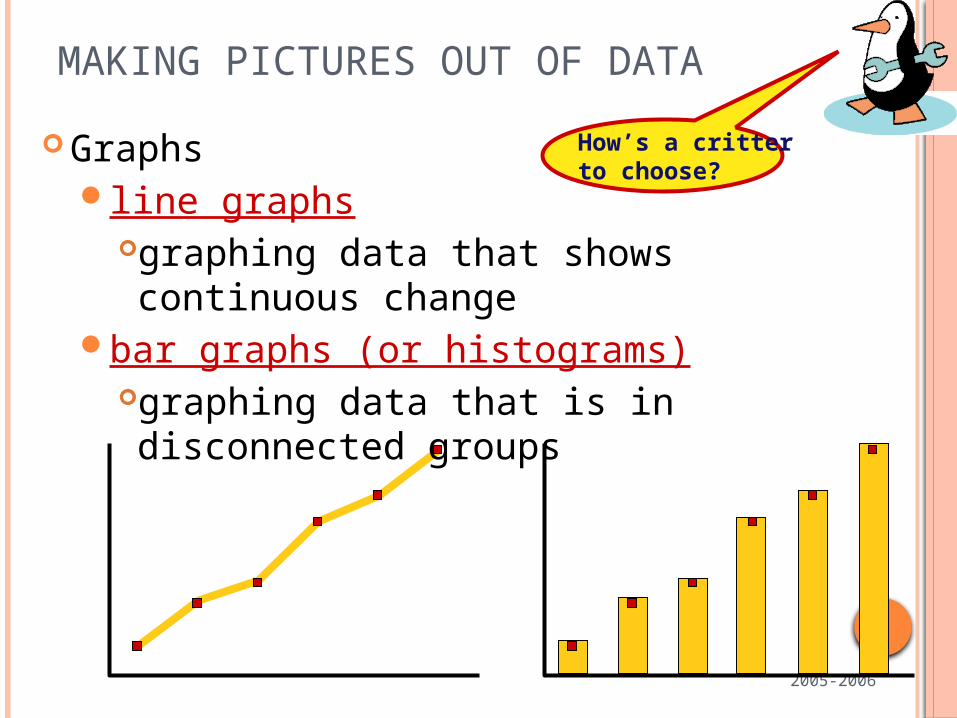
MAKING PICTURES OUT OF DATA
Graphsline graphs
graphing data that shows continuous change
bar graphs (or histograms)graphing data that is in disconnected groups
How’s a critterto choose?

20
05
-20
06
How does elevation affect temperature?
elevation
tem
pera
ture
5
10
15
20
25
30
0 500 1000 1500 2000 25000
elevation (feet above sea level)
temp.(°C)
0 30
500 25
1000 20
1500 15
2000 10
2500 5
1200 ft?
18
Line graph!
1200
20
05
-20
06
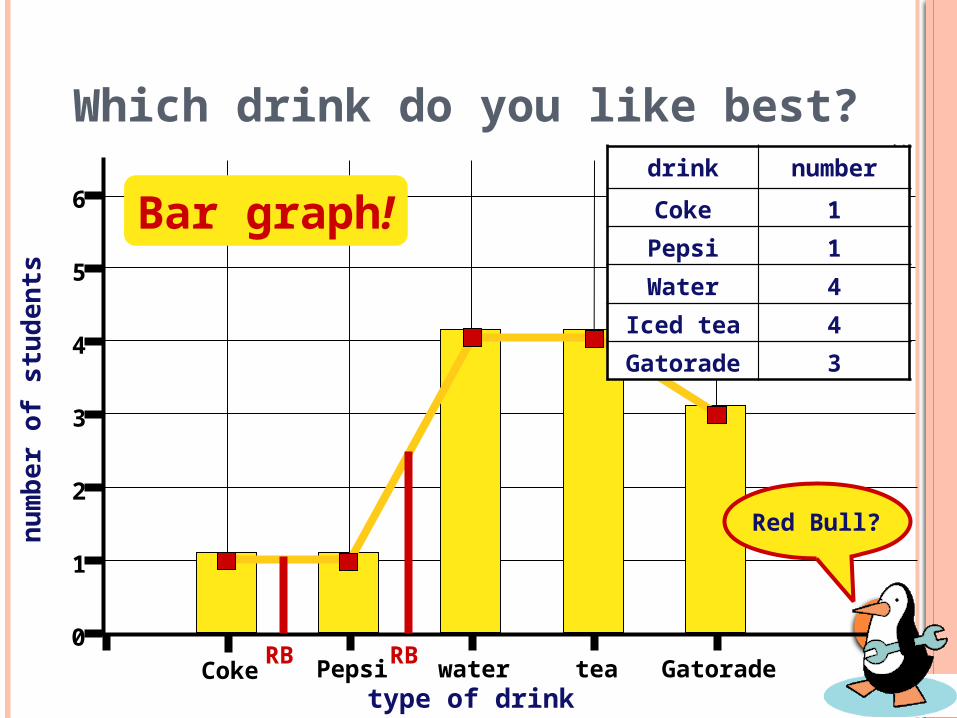
Which drink do you like best?
type of drink
nu
mb
er
of
stu
den
ts
1
2
3
4
5
6
Coke Pepsi water tea Gatorade0
drink number
Coke 1
Pepsi 1
Water 4
Iced tea 4
Gatorade 3
Red Bull?
RBRB
Bar graph!

Create an appropriate graph using the data that you copied earlier. Don’t forget you want to graph the mean only.
Practice with Graphing

UNIT 1: PART 4 DESIGN AND CONDUCTING A GROUP EXPERIMENT - LEARNING GOALS
Students will be able to design and conduct a group experiment.
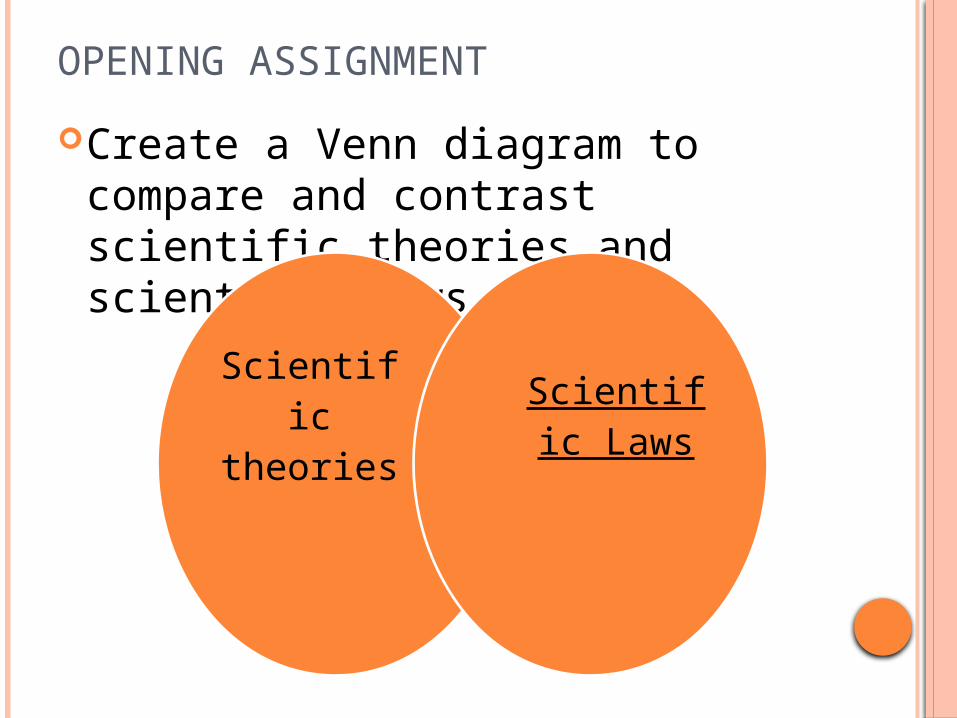
OPENING ASSIGNMENT
Create a Venn diagram to compare and contrast scientific theories and scientific laws.
Scientific theories
Scientific Laws

MARSHMELLOW FLIGHT EXPERIMENT
Read the directions to perform the “Marshmallow Flight” experiment.
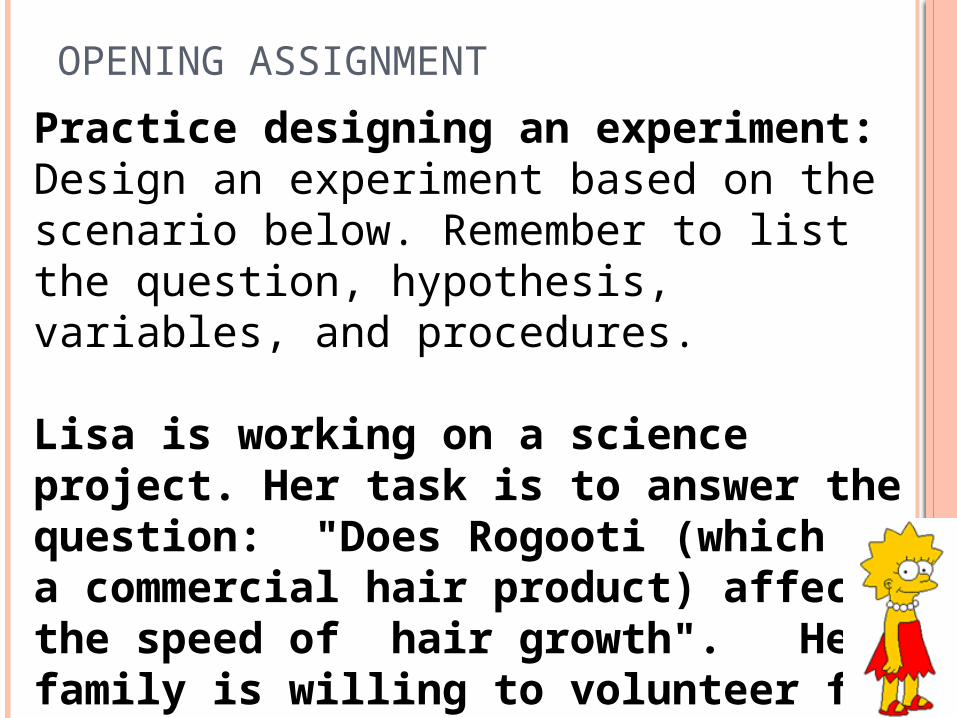
Practice designing an experiment: Design an experiment based on the scenario below. Remember to list the question, hypothesis, variables, and procedures.
Lisa is working on a science project. Her task is to answer the question: "Does Rogooti (which is a commercial hair product) affect the speed of hair growth". Her family is willing to volunteer for the experiment.
OPENING ASSIGNMENT

HEART RATE AND EXERCISE CHALLENGE
Design an experiment to test a question relating to these two variables; heart rate and exercise.
Perform the experiment Collect your data, analyze it, graph it Form a conclusion.
List 3 “problems” with the experiment you designed yesterday.
Create an experiment to test the question“Does Coke or Diet Coke produce a higher geyser when Mentos are added?
Hypothesis:Variables:Procedure:
OPENING ASSIGNMENT
THE MENTOS AND COKE CHALLENGECOKE VS. DIET COKE
Question: “Does Coke or Diet Coke produce a higher geyser when Mentos are added?
Hypothesis: If regular Coke and Diet Coke are combined with mint Mentos, then the Diet Coke will produce a higher geyser because . . . .
Variables: Dependent: the height of the geyser Independent: the type of Coke (regular or diet) Constants: same amount and type of Mentos, same
environmental conditions, same temperature of the soda, same amount of the soda

THE SCIENTIFIC METHOD IN ACTION
Copy the questions below in your notebook.
1. What warnings do they give to viewers at the beginning of the show?2. What myth or legend are they investigating? Pick one if there are more than one in the clip you are viewing.3. What did they know before they began investigating?4. What did they do to investigate the myth/legend?
5.What did they learn from their investigation - confirmed or busted? Why?6. Identify any controls and variables involved in the investigation.7. Identify the safety measures they used to prevent accidents and/or injuries.
8. Are their results reliable? Explain.
OPENING ASSIGNMENT PRACTICE GRAPHING
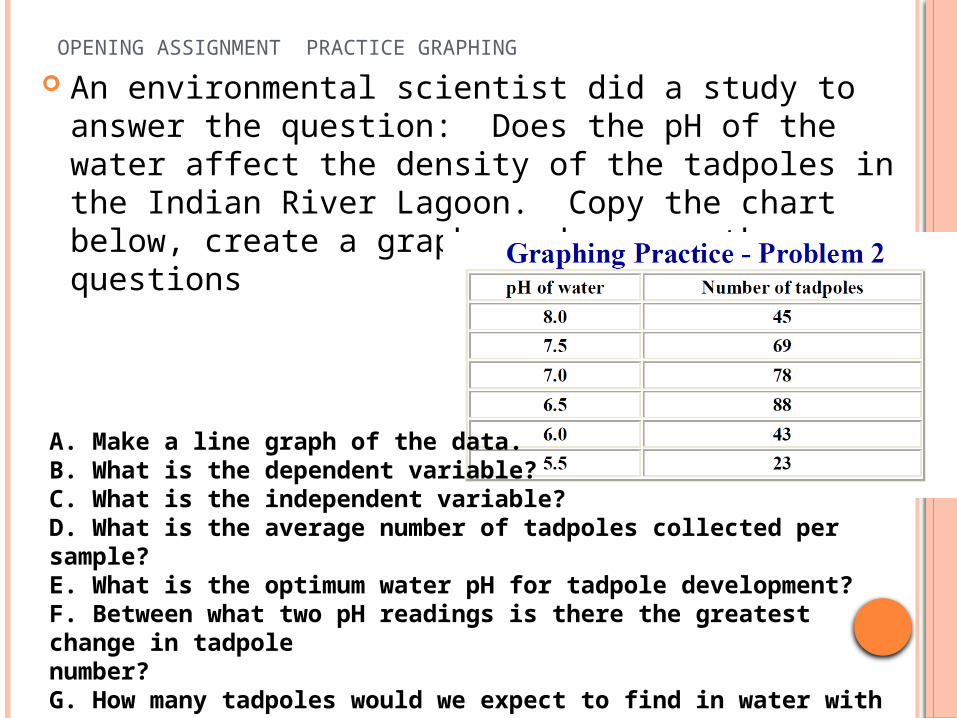
An environmental scientist did a study to answer the question: Does the pH of the water affect the density of the tadpoles in the Indian River Lagoon. Copy the chart below, create a graph, and answer the questions
A. Make a line graph of the data.B. What is the dependent variable?C. What is the independent variable?D. What is the average number of tadpoles collected per sample?E. What is the optimum water pH for tadpole development?F. Between what two pH readings is there the greatest change in tadpolenumber?G. How many tadpoles would we expect to find in water with a pH reading of 5.0?
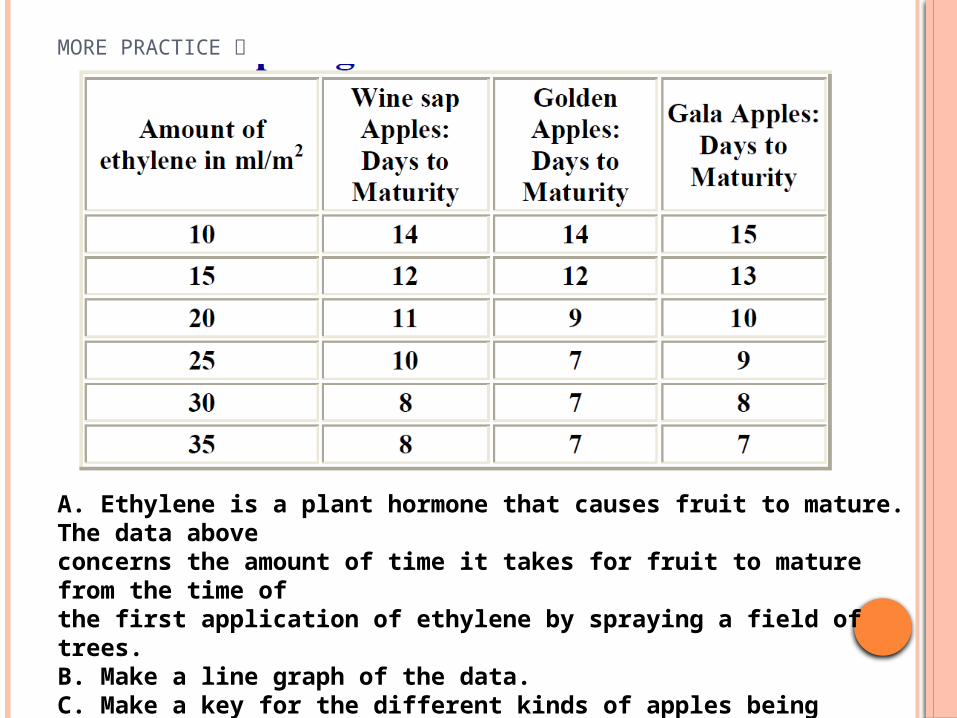
MORE PRACTICE
A. Ethylene is a plant hormone that causes fruit to mature. The data aboveconcerns the amount of time it takes for fruit to mature from the time ofthe first application of ethylene by spraying a field of trees.B. Make a line graph of the data.C. Make a key for the different kinds of apples being graphed.D. What is the dependent variable?E. What is the independent variable?