Embed Size (px)
Citation preview
Correction of eye-motion artifacts in AO-OCT data sets
Arlie G. Capps1,2, Robert J. Zawadzki*2, Qiang Yang3, David W. Arathorn3, Curtis R. Vogel3, Bernd Hamann1 and John S. Werner2
1 Institute for Data Analysis and Visualization (IDAV), Department of Computer Science, UC Davis,
One Shields Avenue, Davis, CA 95616
2 Vision Science and Advanced Retinal Imaging Laboratory (VSRI) and UC Davis Eye Center, University of California Davis, 4860 Y Street, Suite 2400, Sacramento, CA 95817
3 Montana State University, Bozeman, MT 59717
ABSTRACT
Eye movements present during acquisition of a retinal image with optical coherence tomography (OCT) introduce motion artifacts into the image, complicating analysis and registration. This effect is especially pronounced in high-resolution data sets acquired with adaptive optics (AO)-OCT instruments. Several retinal tracking systems have been introduced to correct retinal motion during data acquisition. We present a method for correcting motion artifacts in AO-OCT volume data after acquisition using simultaneously captured adaptive optics-scanning laser ophthalmoscope (AO-SLO) images. We extract transverse eye motion data from the AO-SLO images, assign a motion adjustment vector to each AO-OCT A-scan, and re-sample from the scattered data back onto a regular grid. The corrected volume data improve the accuracy of quantitative analyses of microscopic structures.
Keywords: Adaptive optics; Optical coherence tomography; Scanning laser ophthalmoscopy; Ophthalmology; Imaging system; Motion artifact correction; Aberration compensation
1. INTRODUCTION Involuntary eye movement is one of the main problems inherent in the use of ophthalmic instruments that capture images by scanning. Good fixation of the subject is particularly important for obtaining high-quality optical coherence tomography (OCT) images of the retina. This is due to OCT’s slow transverse scanning speed relative to SLO and other imaging modalities. Eye motion introduces motion artifacts that prevent measurement and complicate registration. This effect is magnified in high-resolution data sets acquired by adaptive optics (AO)-OCT instruments [1]. Recent advances in high-speed Fd-OCT acquisition [2] allow for reduction of volume acquisition time and therefore reduce eye motion artifacts; however, this speed is still too low to limit the effect of eye motion. Moreover, increased imaging speed is connected with reduction of system sensitivity that may become critical when imaging older patients with subtle structural abnormalities, resulting in insufficient image quality. Several retinal tracking systems, including some built into commercial ophthalmic OCT instruments, have been introduced to correct for retina motion during data acquisition.
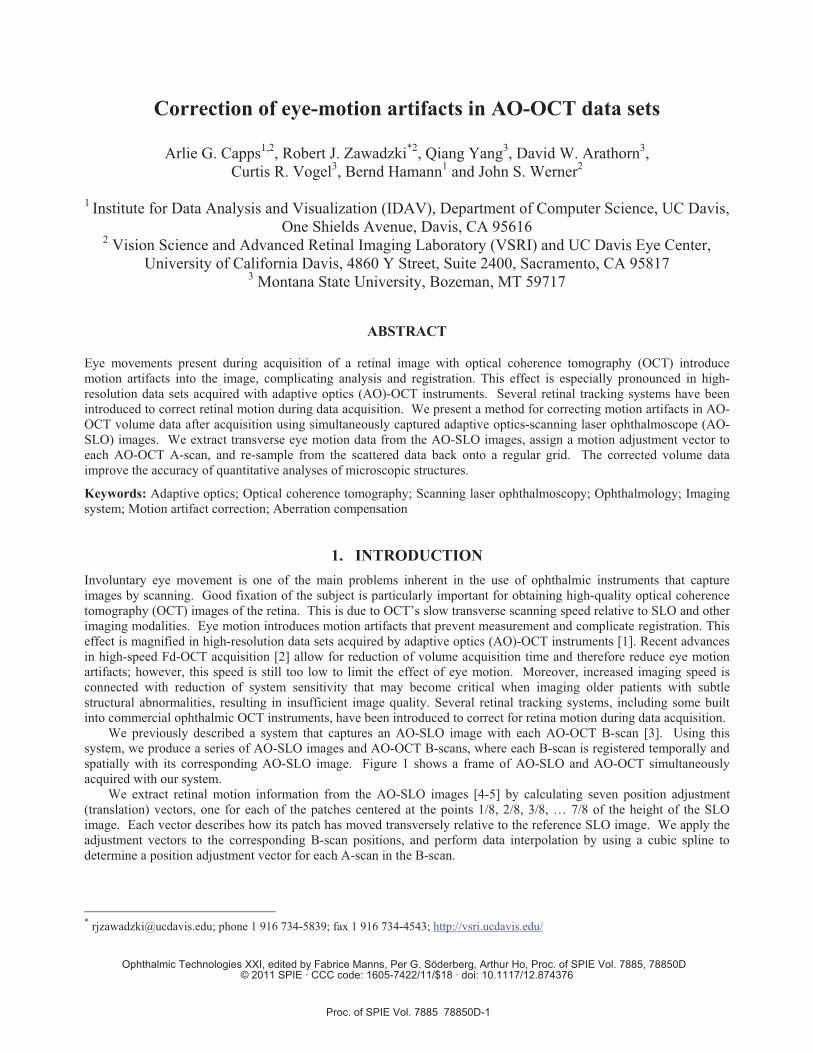
We previously described a system that captures an AO-SLO image with each AO-OCT B-scan [3]. Using this system, we produce a series of AO-SLO images and AO-OCT B-scans, where each B-scan is registered temporally and spatially with its corresponding AO-SLO image. Figure 1 shows a frame of AO-SLO and AO-OCT simultaneously acquired with our system.
We extract retinal motion information from the AO-SLO images [4-5] by calculating seven position adjustment (translation) vectors, one for each of the patches centered at the points 1/8, 2/8, 3/8, … 7/8 of the height of the SLO image. Each vector describes how its patch has moved transversely relative to the reference SLO image. We apply the adjustment vectors to the corresponding B-scan positions, and perform data interpolation by using a cubic spline to determine a position adjustment vector for each A-scan in the B-scan.
* [email protected]; phone 1 916 734-5839; fax 1 916 734-4543; http://vsri.ucdavis.edu/
Ophthalmic Technologies XXI, edited by Fabrice Manns, Per G. Söderberg, Arthur Ho, Proc. of SPIE Vol. 7885, 78850D © 2011 SPIE · CCC code: 1605-7422/11/$18 · doi: 10.1117/12.874376
Proc. of SPIE Vol. 7885 78850D-1
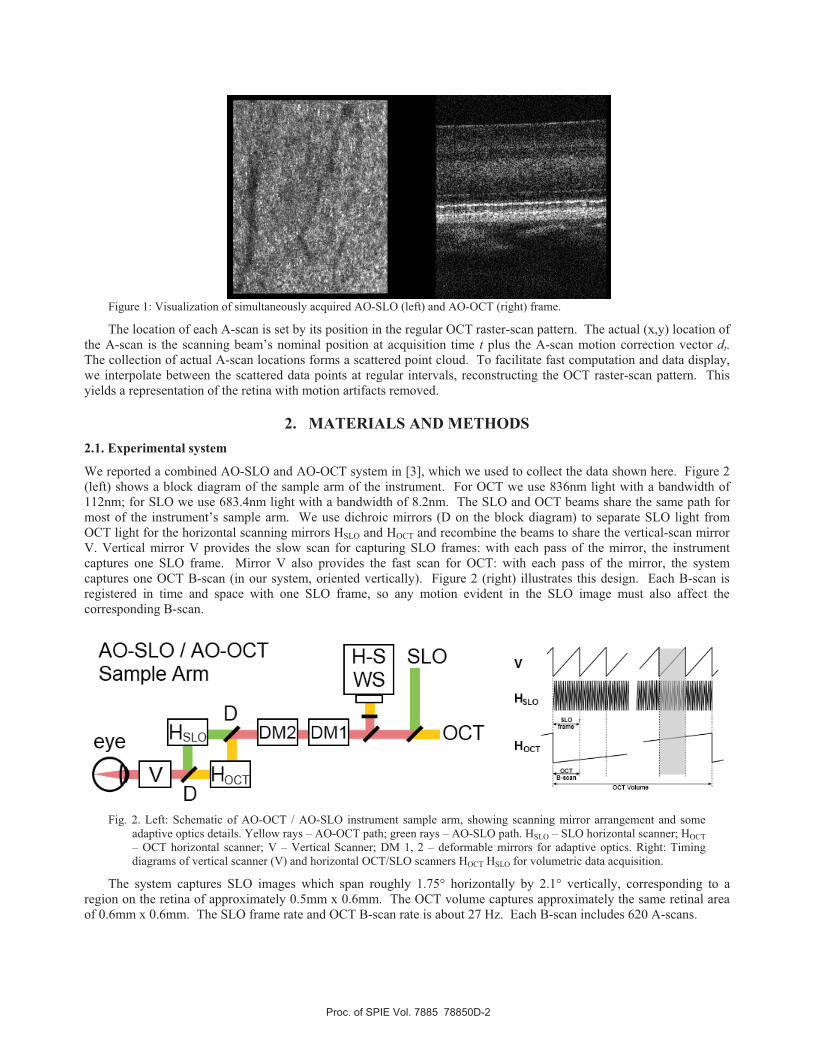
Figure 1: Visualization of simultaneously acquired AO-SLO (left) and AO-OCT (right) frame.
The location of each A-scan is set by its position in the regular OCT raster-scan pattern. The actual (x,y) location of the A-scan is the scanning beam’s nominal position at acquisition time t plus the A-scan motion correction vector dt. The collection of actual A-scan locations forms a scattered point cloud. To facilitate fast computation and data display, we interpolate between the scattered data points at regular intervals, reconstructing the OCT raster-scan pattern. This yields a representation of the retina with motion artifacts removed.
2. MATERIALS AND METHODS 2.1. Experimental system We reported a combined AO-SLO and AO-OCT system in [3], which we used to collect the data shown here. Figure 2 (left) shows a block diagram of the sample arm of the instrument. For OCT we use 836nm light with a bandwidth of 112nm; for SLO we use 683.4nm light with a bandwidth of 8.2nm. The SLO and OCT beams share the same path for most of the instrument’s sample arm. We use dichroic mirrors (D on the block diagram) to separate SLO light from OCT light for the horizontal scanning mirrors HSLO and HOCT and recombine the beams to share the vertical-scan mirror V. Vertical mirror V provides the slow scan for capturing SLO frames: with each pass of the mirror, the instrument captures one SLO frame. Mirror V also provides the fast scan for OCT: with each pass of the mirror, the system captures one OCT B-scan (in our system, oriented vertically). Figure 2 (right) illustrates this design. Each B-scan is registered in time and space with one SLO frame, so any motion evident in the SLO image must also affect the corresponding B-scan.
Fig. 2. Left: Schematic of AO-OCT / AO-SLO instrument sample arm, showing scanning mirror arrangement and some
adaptive optics details. Yellow rays – AO-OCT path; green rays – AO-SLO path. HSLO – SLO horizontal scanner; HOCT – OCT horizontal scanner; V – Vertical Scanner; DM 1, 2 – deformable mirrors for adaptive optics. Right: Timing diagrams of vertical scanner (V) and horizontal OCT/SLO scanners HOCT HSLO for volumetric data acquisition.
The system captures SLO images which span roughly 1.75° horizontally by 2.1° vertically, corresponding to a region on the retina of approximately 0.5mm x 0.6mm. The OCT volume captures approximately the same retinal area of 0.6mm x 0.6mm. The SLO frame rate and OCT B-scan rate is about 27 Hz. Each B-scan includes 620 A-scans.
Proc. of SPIE Vol. 7885 78850D-2
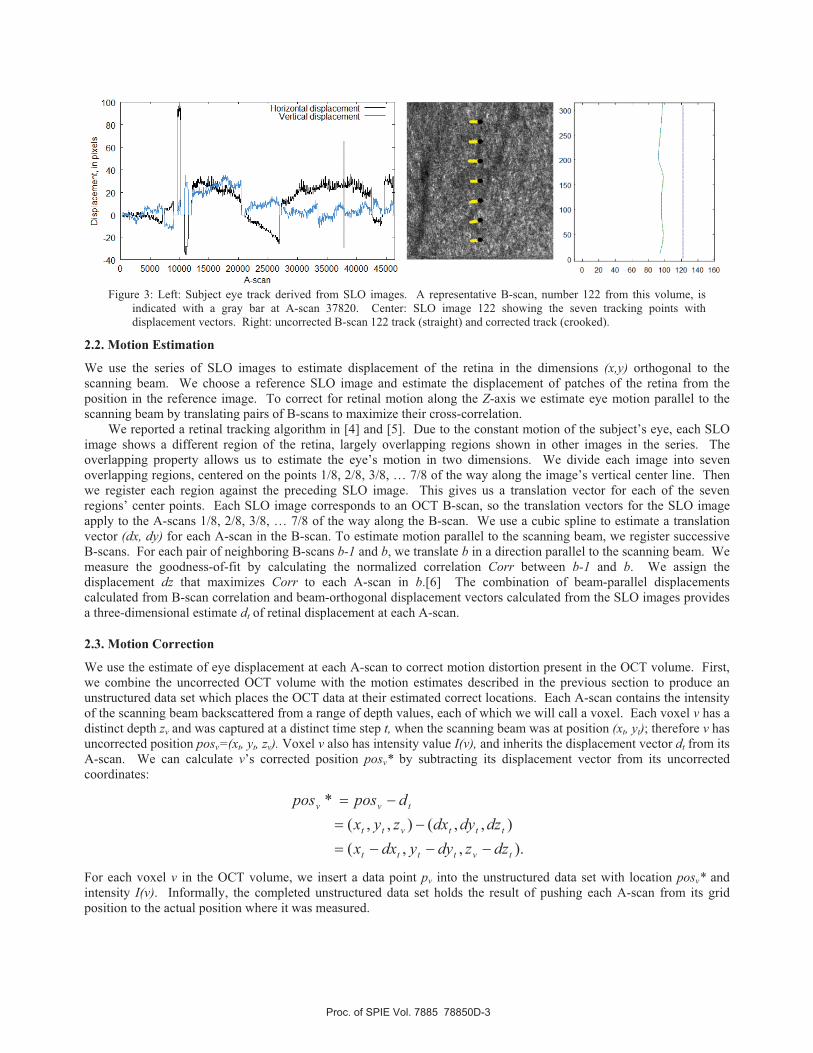
Figure 3: Left: Subject eye track derived from SLO images. A representative B-scan, number 122 from this volume, is
indicated with a gray bar at A-scan 37820. Center: SLO image 122 showing the seven tracking points with displacement vectors. Right: uncorrected B-scan 122 track (straight) and corrected track (crooked).
2.2. Motion Estimation We use the series of SLO images to estimate displacement of the retina in the dimensions (x,y) orthogonal to the scanning beam. We choose a reference SLO image and estimate the displacement of patches of the retina from the position in the reference image. To correct for retinal motion along the Z-axis we estimate eye motion parallel to the scanning beam by translating pairs of B-scans to maximize their cross-correlation.
We reported a retinal tracking algorithm in [4] and [5]. Due to the constant motion of the subject’s eye, each SLO image shows a different region of the retina, largely overlapping regions shown in other images in the series. The overlapping property allows us to estimate the eye’s motion in two dimensions. We divide each image into seven overlapping regions, centered on the points 1/8, 2/8, 3/8, … 7/8 of the way along the image’s vertical center line. Then we register each region against the preceding SLO image. This gives us a translation vector for each of the seven regions’ center points. Each SLO image corresponds to an OCT B-scan, so the translation vectors for the SLO image apply to the A-scans 1/8, 2/8, 3/8, … 7/8 of the way along the B-scan. We use a cubic spline to estimate a translation vector (dx, dy) for each A-scan in the B-scan. To estimate motion parallel to the scanning beam, we register successive B-scans. For each pair of neighboring B-scans b-1 and b, we translate b in a direction parallel to the scanning beam. We measure the goodness-of-fit by calculating the normalized correlation Corr between b-1 and b. We assign the displacement dz that maximizes Corr to each A-scan in b.[6] The combination of beam-parallel displacements calculated from B-scan correlation and beam-orthogonal displacement vectors calculated from the SLO images provides a three-dimensional estimate dt of retinal displacement at each A-scan.
2.3. Motion Correction We use the estimate of eye displacement at each A-scan to correct motion distortion present in the OCT volume. First, we combine the uncorrected OCT volume with the motion estimates described in the previous section to produce an unstructured data set which places the OCT data at their estimated correct locations. Each A-scan contains the intensity of the scanning beam backscattered from a range of depth values, each of which we will call a voxel. Each voxel v has a distinct depth zv and was captured at a distinct time step t, when the scanning beam was at position (xt, yt); therefore v has uncorrected position posv=(xt, yt, zv). Voxel v also has intensity value I(v), and inherits the displacement vector dt from its A-scan. We can calculate v’s corrected position posv* by subtracting its displacement vector from its uncorrected coordinates:
).,,(),,(),,(
*
tvtttt
tttvtt
tvv
dzzdyydxxdzdydxzyx
dpospos
!!!"!"
!"
For each voxel v in the OCT volume, we insert a data point pv into the unstructured data set with location posv* and intensity I(v). Informally, the completed unstructured data set holds the result of pushing each A-scan from its grid position to the actual position where it was measured.
Proc. of SPIE Vol. 7885 78850D-3
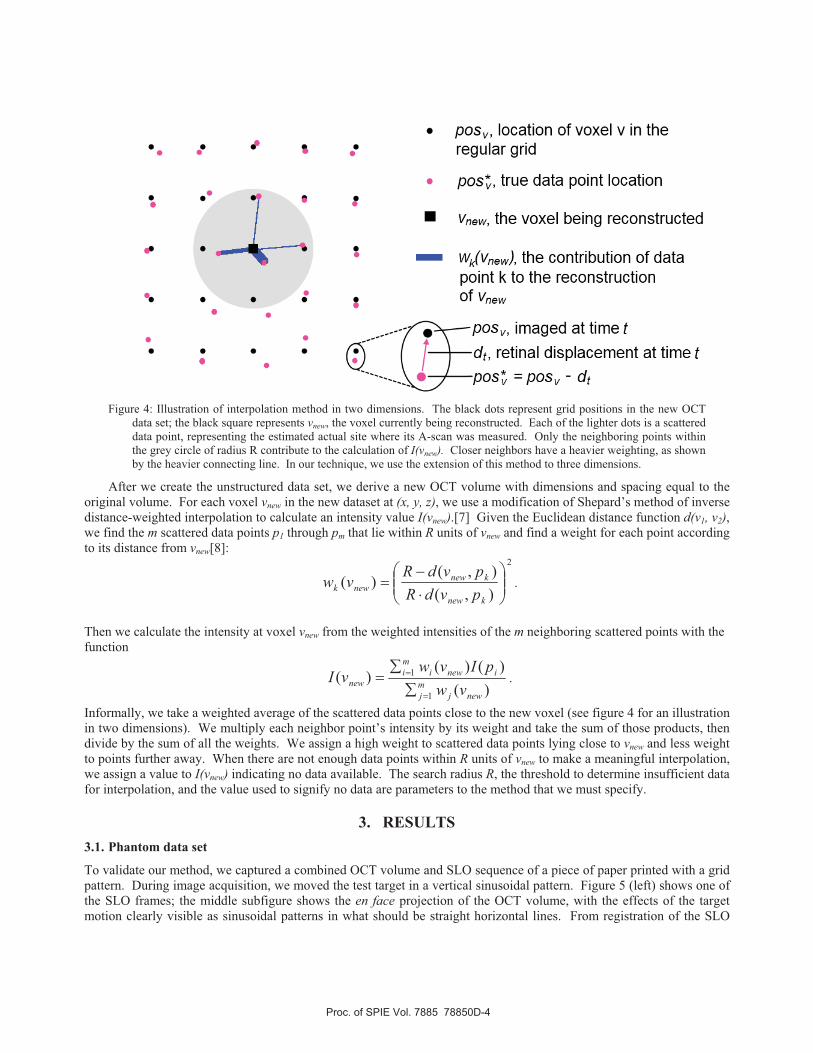
Figure 4: Illustration of interpolation method in two dimensions. The black dots represent grid positions in the new OCT
data set; the black square represents vnew, the voxel currently being reconstructed. Each of the lighter dots is a scattered data point, representing the estimated actual site where its A-scan was measured. Only the neighboring points within the grey circle of radius R contribute to the calculation of I(vnew). Closer neighbors have a heavier weighting, as shown by the heavier connecting line. In our technique, we use the extension of this method to three dimensions.
After we create the unstructured data set, we derive a new OCT volume with dimensions and spacing equal to the original volume. For each voxel vnew in the new dataset at (x, y, z), we use a modification of Shepard’s method of inverse distance-weighted interpolation to calculate an intensity value I(vnew).[7] Given the Euclidean distance function d(v1, v2), we find the m scattered data points p1 through pm that lie within R units of vnew and find a weight for each point according to its distance from vnew[8]:
2
),(),()( ##$
%&&'
()!
"knew
knewnewk pvdR
pvdRvw .
Then we calculate the intensity at voxel vnew from the weighted intensities of the m neighboring scattered points with the function
)()()()(
1
1
newjmj
inewimi
new vwpIvwvI
"
"
**
" .
Informally, we take a weighted average of the scattered data points close to the new voxel (see figure 4 for an illustration in two dimensions). We multiply each neighbor point’s intensity by its weight and take the sum of those products, then divide by the sum of all the weights. We assign a high weight to scattered data points lying close to vnew and less weight to points further away. When there are not enough data points within R units of vnew to make a meaningful interpolation, we assign a value to I(vnew) indicating no data available. The search radius R, the threshold to determine insufficient data for interpolation, and the value used to signify no data are parameters to the method that we must specify.
3. RESULTS 3.1. Phantom data set To validate our method, we captured a combined OCT volume and SLO sequence of a piece of paper printed with a grid pattern. During image acquisition, we moved the test target in a vertical sinusoidal pattern. Figure 5 (left) shows one of the SLO frames; the middle subfigure shows the en face projection of the OCT volume, with the effects of the target motion clearly visible as sinusoidal patterns in what should be straight horizontal lines. From registration of the SLO
Proc. of SPIE Vol. 7885 78850D-4
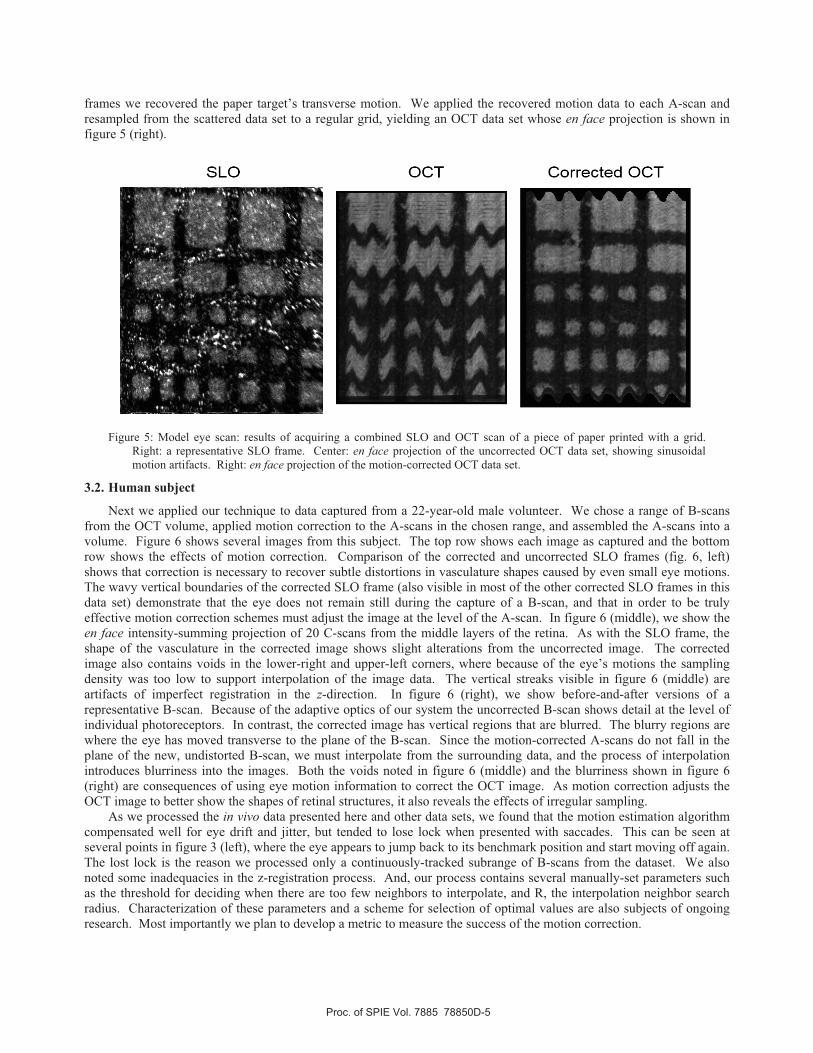
frames we recovered the paper target’s transverse motion. We applied the recovered motion data to each A-scan and resampled from the scattered data set to a regular grid, yielding an OCT data set whose en face projection is shown in figure 5 (right).
Figure 5: Model eye scan: results of acquiring a combined SLO and OCT scan of a piece of paper printed with a grid. Right: a representative SLO frame. Center: en face projection of the uncorrected OCT data set, showing sinusoidal motion artifacts. Right: en face projection of the motion-corrected OCT data set.
3.2. Human subject Next we applied our technique to data captured from a 22-year-old male volunteer. We chose a range of B-scans
from the OCT volume, applied motion correction to the A-scans in the chosen range, and assembled the A-scans into a volume. Figure 6 shows several images from this subject. The top row shows each image as captured and the bottom row shows the effects of motion correction. Comparison of the corrected and uncorrected SLO frames (fig. 6, left) shows that correction is necessary to recover subtle distortions in vasculature shapes caused by even small eye motions. The wavy vertical boundaries of the corrected SLO frame (also visible in most of the other corrected SLO frames in this data set) demonstrate that the eye does not remain still during the capture of a B-scan, and that in order to be truly effective motion correction schemes must adjust the image at the level of the A-scan. In figure 6 (middle), we show the en face intensity-summing projection of 20 C-scans from the middle layers of the retina. As with the SLO frame, the shape of the vasculature in the corrected image shows slight alterations from the uncorrected image. The corrected image also contains voids in the lower-right and upper-left corners, where because of the eye’s motions the sampling density was too low to support interpolation of the image data. The vertical streaks visible in figure 6 (middle) are artifacts of imperfect registration in the z-direction. In figure 6 (right), we show before-and-after versions of a representative B-scan. Because of the adaptive optics of our system the uncorrected B-scan shows detail at the level of individual photoreceptors. In contrast, the corrected image has vertical regions that are blurred. The blurry regions are where the eye has moved transverse to the plane of the B-scan. Since the motion-corrected A-scans do not fall in the plane of the new, undistorted B-scan, we must interpolate from the surrounding data, and the process of interpolation introduces blurriness into the images. Both the voids noted in figure 6 (middle) and the blurriness shown in figure 6 (right) are consequences of using eye motion information to correct the OCT image. As motion correction adjusts the OCT image to better show the shapes of retinal structures, it also reveals the effects of irregular sampling.
As we processed the in vivo data presented here and other data sets, we found that the motion estimation algorithm compensated well for eye drift and jitter, but tended to lose lock when presented with saccades. This can be seen at several points in figure 3 (left), where the eye appears to jump back to its benchmark position and start moving off again. The lost lock is the reason we processed only a continuously-tracked subrange of B-scans from the dataset. We also noted some inadequacies in the z-registration process. And, our process contains several manually-set parameters such as the threshold for deciding when there are too few neighbors to interpolate, and R, the interpolation neighbor search radius. Characterization of these parameters and a scheme for selection of optimal values are also subjects of ongoing research. Most importantly we plan to develop a metric to measure the success of the motion correction.
Proc. of SPIE Vol. 7885 78850D-5
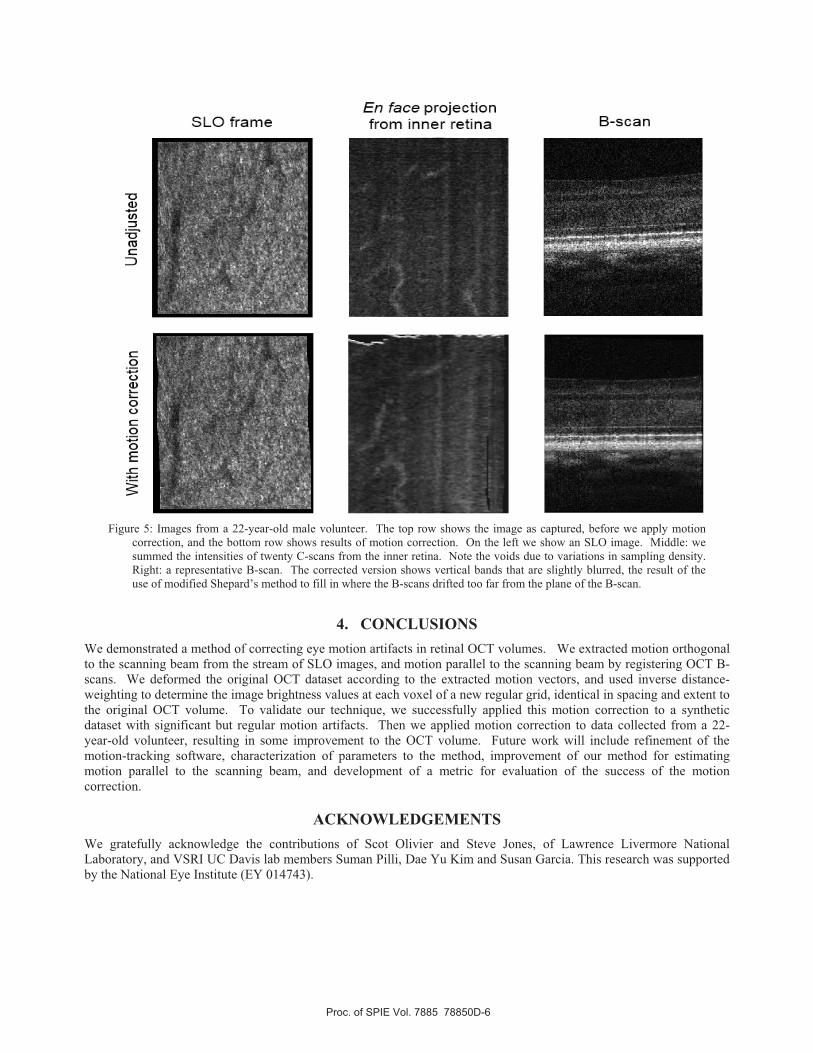
Figure 5: Images from a 22-year-old male volunteer. The top row shows the image as captured, before we apply motion
correction, and the bottom row shows results of motion correction. On the left we show an SLO image. Middle: we summed the intensities of twenty C-scans from the inner retina. Note the voids due to variations in sampling density. Right: a representative B-scan. The corrected version shows vertical bands that are slightly blurred, the result of the use of modified Shepard’s method to fill in where the B-scans drifted too far from the plane of the B-scan.
4. CONCLUSIONS We demonstrated a method of correcting eye motion artifacts in retinal OCT volumes. We extracted motion orthogonal to the scanning beam from the stream of SLO images, and motion parallel to the scanning beam by registering OCT B-scans. We deformed the original OCT dataset according to the extracted motion vectors, and used inverse distance-weighting to determine the image brightness values at each voxel of a new regular grid, identical in spacing and extent to the original OCT volume. To validate our technique, we successfully applied this motion correction to a synthetic dataset with significant but regular motion artifacts. Then we applied motion correction to data collected from a 22-year-old volunteer, resulting in some improvement to the OCT volume. Future work will include refinement of the motion-tracking software, characterization of parameters to the method, improvement of our method for estimating motion parallel to the scanning beam, and development of a metric for evaluation of the success of the motion correction.
ACKNOWLEDGEMENTS We gratefully acknowledge the contributions of Scot Olivier and Steve Jones, of Lawrence Livermore National Laboratory, and VSRI UC Davis lab members Suman Pilli, Dae Yu Kim and Susan Garcia. This research was supported by the National Eye Institute (EY 014743).
Proc. of SPIE Vol. 7885 78850D-6

REFERENCES 1. R. J. Zawadzki, S. S. Choi, S. M. Jones, S. S. Olivier, and J. S. Werner “Adaptive optics - optical coherence
tomography: Optimizing visualization of microscopic retinal structures in three dimensions,” J. Opt. Soc. of Am. A 24 (5), 1373-1383 (2007)
2. M. Wojtkowski, “High-speed optical coherence tomography: basics and applications,” Appl. Opt. 49, D30-D61 (2010)
3. R. J. Zawadzki, S. M. Jones, S. Pilli, D. Kim, S. S. Olivier, and J. S. Werner “Retinal imaging with a combined adaptive optics/optical coherence tomography and adaptive optics/scanning laser ophthalmoscopy system” Proc. SPIE Vol. 7550, 75500Z (2010)
4. C. R. Vogel, D. W. Arathorn, A. Roorda, and A. Parker, “Retinal motion estimation in adaptive optics scanning laser ophthalmoscopy,” Opt. Express 14, 487-497 (2006)
5. D. W. Arathorn, Q. Yang, C. R. Vogel, Y. Zhang, P. Tiruveedhula and A. Roorda “Retinally stabilized cone-targeted stimulus delivery,” Opt. Express 15, 13731-13744 (2007)
6. P. Thévenaz, U. E. Ruttimann, and M. Unser, “A Pyramid Approach to Subpixel Registration Based on Intensity,” IEEE Transactions on Image Processing, vol. 7, no. 1, pp. 27-41 (January 1998)
7. D. Shepard “A two-dimensional interpolation function for irregularly-spaced data,” Proc. 23rd Nat. Conf. ACM, pp. 517-524 (1968)
8. R. E. Barnhill “Representation and approximation of surfaces” in Mathematical Software III (J. R. Rice, Ed.), Academic Press, New York, p. 112 (1977)
Proc. of SPIE Vol. 7885 78850D-7