Embed Size (px)
Citation preview

213
A Competing Values Framework forAnalyzing Presentational Communicationin Management Contexts
Robert E. QuinnHerbert W. HildebrandtPriscilla S. RogersUniversity of MichiganMichael P. ThompsonBrigham Young University
Communication specialists have long been interested in analyzing messages. Morerecently, they have stressed the need for evaluative tools that account for situational ex-pectations and constraints. Drawing from the literature on organizational andmanagerial effectiveness, we constructed an empirical model applicable to presenta-tional communication. Over 100 communication professors evaluated the relevance ofdescriptors for six different types of business presentations: three oral and three writ-ten. Their judgments were used to create similarity scores, which were submitted tomultidimensional scaling. A three-dimensional model emerged. This "competingvalues model" illustrates the dynamic interplay between the highly contrasting charac-teristics of four general types of presentational communication: relational, information-al, instructional, and transformational. In conclusion, we discuss the benefits of themodel and suggest its usefulness as an evaluative tool, particularly for the training ofmanagers.
C ommunication is an ancient discipline which has evolved consider-ably. Throughout this evolutionary process, effectiveness has beena central concern. In the fifth century BC, for instance, Corax, one of thefirst teachers of human discourse, suggested the need for speakers to&dquo;produce an effect in listeners&dquo; (Hinks, 1940; Kennedy, 1959). Such aneed filters through the ages in the voices of familiar sophists,rhetoricians, logicians, philosophers and textbook writers, as one pivotalquestion: How does one communicate effectively? In addressing thisquestion, subsequent writers add, amend or critique the work ofpredecessors. Modem writers are no less hesitant to express dissatisfac-tion with the traditional approaches to presentational effectiveness.Smith (1968, p. 323), for example, calls for a &dquo;dynamic&dquo; model that viewsspeech as a continuous stimulus stream with corresponding effects onthe audience. Past models, he contends, are &dquo;static&dquo; and do not faithfullyaccount for the communication processes they purport to describe, norare they viable as generators of new communication research. Monge(1973) suggests that theory construction in the future should &dquo;focus ona new set of variables and employ a new set of analytic techniques&dquo; (p.16).
214
Growing criticism is also extended to speaking and writing &dquo;rules&dquo; thatare a part of pedagogical texts. There is a recognition that formulaic,prescriptive approaches alone are insufficient. Halpern (1988) characterizescurrent pedagogy as &dquo;folklore and textbook incantations about what busi-ness and technical communications ought to be.&dquo; Hagge (1989) believespedagogy &dquo;ignores the real complexities of how writers actually get texts tocohere in the real world.&dquo; Similarly, Huckin and Hutz (1987) conclude thatthe rules of the plain English movement lack a solid empirical base ofsupport because they fail to depict how language is actually used.
Recent field research supports these views. Brown and Hemdl (1986)discovered that managers deliberately employed superfluous nominaliza-tions and narrative, structures understood as &dquo;verbose&dquo; and &dquo;muddy&dquo; andwhich these managers could have eliminated. Similarly, Rogers (1989)found that automotive field managers persisted in using narrative for theirreports despite the company’s declared preference for an inductive problem-recommendation format. These and other findings suggest the inadequacyof writing rules, forms and formulas that do not account for situationaldemands communicators face day-to-day. As Janis writes: &dquo;Anyone who iswilling to make a comparison cannot fail to be impressed by the disparitybetween ’rules’ that govern the style of business correspondence and theactual on-the-job performance in almost any large company&dquo; (1973, p. 81).The rules of rhetoric, Janis concludes, are unrealistic because they are notresponsive to the context of communication.As early as the fifties, social psychologists tried to replace the hunches
of ancient rhetoricians with experimentally-grounded laws of behaviorby identifying elements of messages that would trigger particularaudience reactions. Hovland, Janis and Kelly (1953) actually testedvarious modes of message presentation and tried to measure changes inaudience attitudes. Hovland and his colleagues were interested in manyof the same questions that occupied earlier rhetoricians: Are messageson controversial topics more persuasive if their counter-arguments areincluded or omitted? Is an appeal to fear more effective than an appealto some intrinsic rationality? Is it more effective to present the strongestarguments in a case first or last? In contrast to the ancients, Hovlandand his contemporaries applied the scientific method to these questions.By analyzing audience reactions in a systematic way they attempted tomake the art of rhetoric into a science in which audience reactions couldbe predicted. But, as Billig suggests, their dream was not realized.
Social psychologists working in the area of persuasion would freely admitthat the bold vision of Hovland remains unfulfilled....The clear principleswhose discovery Hovland anticipated have not emerged... [and] the fixed
215
rules of rhetoric have failed to materialize, despite the efforts of the old-stylerhetoricians and their psychological descendents. (1989, pp. 69, 55)
What emerged from the work of Hovland and others was a bewilderingcollage of evidence and counter-evidence. Subsequently, as Fishbein andAjzen ( 1981) conclude, much of the experimental work on communication&dquo;has been an accumulation of largely contradictory and inconsistentresearch findings with a few (if any) generalizable principles of effectivecommunication&dquo; ( p. 340).
Neither classical or renaissance rhetorical principles, nor contem-porary social science research has provided unvarying rules for presen-tational effectiveness. At best we have only guidelines, expressed in themodern idiom of social psychology. As Billig (1989) notes, we are notmuch better at predicting and advising the functional orator today thanwe were 2500 years ago. However, Billig suggests, extensive experimen-tation on communication effectiveness has demonstrated the infinite
complexity of rhetorical phenomena and the need for constant alertnessto the possibility of exceptions.We believe it is necessary to draw from both the traditionally-accepted
precepts of the past and the experimental insights of the mid-twentiethcentury to develop theoretical and pedagogical approaches that ultimate-ly help speakers and writers achieve results with their audiences.However, we also believe that past precepts and recent insights aloneare insufficient. Today’s message givers and message receivers operatein a diverse, complex, information-rich, rapidly changing, and oftenchaotic world. Consequently, theories of communication and tools foranalyzing written and spoken presentations must be adaptable to avariety of contexts and must help communicators understand the com-plexities of their tasks and the multiplicity of their choices. In otherwords, contemporary notions of presentation must account for situation-al demands and present communicators with the possibility of exceptionsto the traditionally established rules and norms. We believe the searchfor theoretical frameworks and analytical tools that address these needsis enriched by exploring studies on managerial effectiveness in the fieldof Organizational Behavior. Scholars in Organizational Behavior areengaged in a discussion very similar to ours. They, too, are debating theadequacy of traditional, rule-based approaches and exploringmanagerial adaptation to situational demands. As a result, organiza-tional theorists have proposed a number of theoretical models, one ofwhich we have found particularly useful for thinking about businesspresentations. After briefly reviewing this organizational model, wedescribe the methods used to build a similar model for presentational
216
communication. We conclude by discussing the significance of this modelfor management communication.
THE COMPETING VALUES MODEL
In the literature of Organizational Behavior, many attempts havebeen made to answer the question, &dquo;What is an effective organization?&dquo;Of particular interest to us is ’a study that resulted in an integrativemodel of organizational effectiveness called the &dquo;competing valuesmodel.&dquo; We describe the model below.
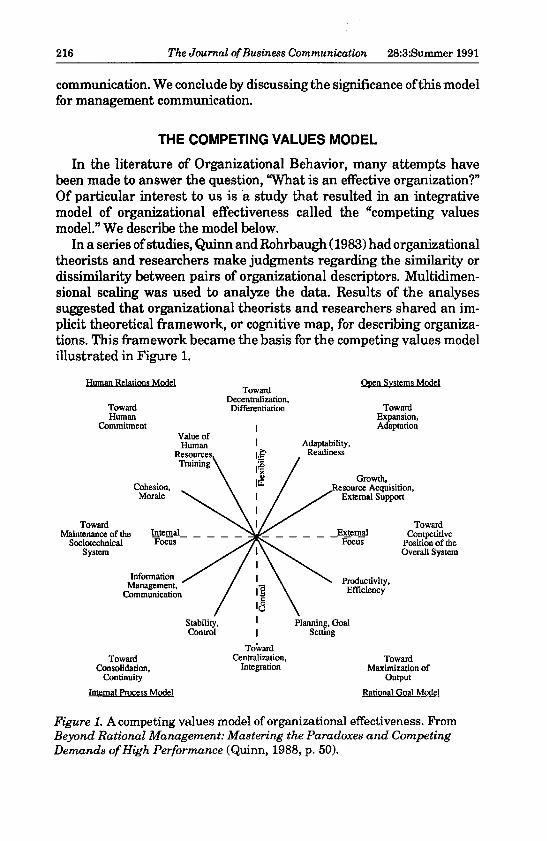
In a series of studies, Quinn and Rohrbaugh (1983) had organizationaltheorists and researchers make judgments regarding the similarity ordissimilarity between pairs of organizational descriptors. Multidimen-sional scaling was used to analyze the data. Results of the analysessuggested that organizational theorists and researchers shared an im-plicit theoretical framework, or cognitive map, for describing organiza-tions. This framework became the basis for the competing values modelillustrated in Figure 1.
Figure 1. A competing values model of organizational efl’ectiveness. FromBeyond Rational Management: Mastering the Paradoxes and CompetingDemands of High Performance (Quinn, 1988, p. 50).

217
The competing values model has two axes which define four quad-rants. The vertical axis ranges from flexibility to control; the horizontalaxis ranges from an internal to an external focus. Each quadrant of theframework represents one of the four major organizational theories. Inthe human relations quadrant one finds descriptors such as cohesion andmorale, criteria suggesting the value of human resources and training.Horizontally contiguous to the human relations quadrant is the opensystems quadrant including descriptors such as adaptability, readiness,growth, resource acquisition, and external support. The lower-rightrational goal quadrant includes descriptors such as planning, goalsetting, productivity and efficiency. Last, the lower-right internal processquadrant includes information management and communication,stability, and control.As presented in the model, each quadrant has a polar opposite. For
instance, the human relations quadrant, emphasizing flexibility andinternal focus, stands in stark contrast to the rational goal quadrant,emphasizing control and external focus. The open systems quadrant,characterizing flexibility and external focus, runs counter to the internalprocess quadrant where control and internal focus are valued.
Parallels among the quadrants are also important. For example, thehuman relations and open systems quadrants share an emphasis onflexibility. In the same manner, the open systems and rational goalquadrants have an external focus which responds to outside change andproduction needs in a competitive market. Central to both the internalprocess and rational goal quadrants is the concept of control; whereasthe internal process and human relations quadrants share a concern forthe human and technical systems inside the organization.
Brought together in this fashion, the four quadrants form a model thatillustrates the conflicts or competing values of organizational life. Wewant our organizations to be adaptable and flexible, but we also wantthem to be stable and controlled. We want growth, resource acquisition,and external support, but we also want tight information managementand formal communication. We want an emphasis on the value of humanresources, but we also want an emphasis on planning and goal setting.The competing values model portrays these oppositions as mutuallyexisting in real systems. By implication, it suggests that these descrip-tors, and the values and assumptions they represent, are oppositionsonly in our minds-we tend to think that the four organizational ap-proaches are very different from one another, and may sometimes evenassume them to be mutually exclusive.
218
Quinn (1988) and his colleagues used the competing values model toanalyze organizational and managerial performance. They found amajor advantage inherent in the model. It allows the observer of anorganization or of a manager to assess the presence of perceptuallycontrasting characteristics. In a certain situation an effective managermay behave in a way that is both caring and demanding; or a managermay take a position that advocates both change and stability. The modelsuggests these seemingly contrasting approaches may occur simul-taneously and, in this way, it contributes to our understanding ofmanagerial and organizational complexities.
Using Quinn’s work as a guide, our research develops a similar modelfor communication. For this study, we sought to build a competing valuesmodel applicable to oral and written presentations in managerial con-texts (Rogers, 1988). Most discussions of communication competence are,as Monge, Backman, Dillard, and Eisenberg (1983) point out, based onbroader models developed by social psychologists. These models of socialskills are more applicable to interpersonal communication than to busi-ness presentations such as technical briefmgs, sales demonstrations ortechnical reports, which may be more goal oriented and situationallyconstrained than interpersonal communication (Monge, et al., 1983, p.506). We hope the model proposed here will serve as the foundation forinstruments that allow us to evaluate the effectiveness of presentationsin a variety of management contexts.
METHOD
To construct a competing values model for presentational communica-tion, we employed a process similar to the one Quinn and Rohrbaugh(1983) used to build their organizational model. Generally, this processinvolved the following: (a) originating a comprehensive list of descriptors,(b) designing and distributing a research instrument that would provideinformation on the relevance of and relationships between the descrip-tors, and (c) analyzing responses to the research instrument usingseveral computer programs that categorized and placed the descriptorsin a model.
Originating a Comprehensive List of Presentational DescriptorsWe originated a list of descriptors through a series of developmental
steps. First, we asked three communication professors to individuallycompile exhaustive lists of characteristics of effective presentations byconsulting communication textbooks and files of evaluation forms. Once

219
their initial lists were created, we asked these professors to match eachcharacteristic with a highly contrasting characteristic. If, for example,they listed the characteristic &dquo;technically correct,&dquo; they might list acontrasting characteristic such as &dquo;creative&dquo; or &dquo;insightful.&dquo; None of thesecontrasting characteristics were to be phrased negatively. This processforced them to think more comprehensively than they might haveotherwise. Subsequently, five professors independently categorized thecharacteristics or descriptors from these lists. Their resultingcategorized lists of descriptors were highly comparable. Slight differen-ces were discussed until consensus was reached. This resulted in a singlelist of descriptors.
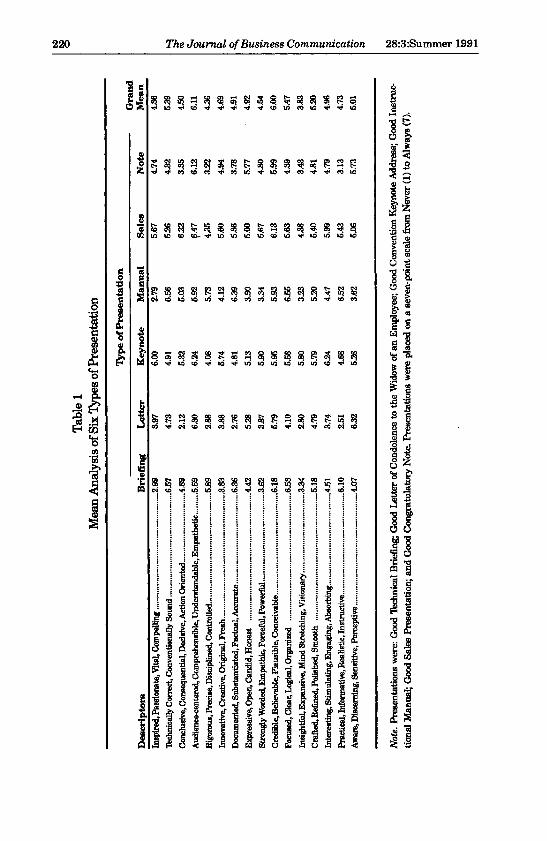
Second, using this list of descriptors, we developed a research instru-ment that asked respondents to indicate the extent to which each of thedescriptors reflected each type of presentation. Forty-five managementcommunication students completed this instrument. In performing theanalysis we took an &dquo;appropriateness data&dquo; approach (Hair, Anderson,& Tatham, 1987), which allowed us to obtain similarity measures on thedescriptors. In the final instrument, respondents were asked to indicatehow frequently good instances of each of the six types of presentation arecharacterized by the descriptors using a seven-point scale. Respondents’rankings of the descriptors in relationship to the six types of presenta-tions became cases for drawing pairwise correlations between thedescriptors. For example, if two descriptors are both ranked low on twotypes of presentations, moderate on two others, and high on the remain-ing two, then there is a high correlation between the descriptors, andthey are treated as closely related. The correlation matrix became thedistance measures submitted to multidimensional scaling. The resultswere used to eliminate highly redundant items and to combine neigh-boring items. To double-check our results we repeated this process witha second group of 43 students. The 16 sets of descriptors seen in Table 1resulted from this process. The comprehensive and systematic nature ofthis multistep listing-reviewing-revising process leads us to believe thatthe sets of descriptors fairly represent the characteristics experts use toanalyze presentations.
Designing and Distributing the Research Instrument
We subsequently designed a research instrument consisting of the 16sets of descriptors and the six types of presentations seen in Table 1.Since the purpose of the six presentation types used in the researchinstrument was to associate the sets of descriptors, the key property ofthe presentation types had to be diversity. They did not need to be
220
t2.~ ~:
m!g : 2bZO
~ -~1 ci I 8U
~’~c3 é:mor4 9 I§1
aa~E 2] 0ra2 08
(L)
C18~18 k1 I~1,
r.) zU
I IT
co
A . .4
m0œ !~ i

221
representative of all types of presentation. As can be seen in Table 1, thesix presentation types we used are very diverse: technical briefing, letterof condolence to the widow of an employee, convention keynote address,instructional manual, sales presentation, and congratulatory note.We mailed the research instrument to 150 communication professors,
all members of communication journal boards and associations. Theresponse rate was 70%. Asking experts, who regularly evaluate presen-tations, to participate in our study was a logical first step. Testing theresults using other groups remains for subsequent studies.
Analyzing Responses to the Research Instrument
The completed instruments were coded and analyzed using the sameapproach described earlier. All measures of similarity derived from thecorrelations between the sets of descriptors were analyzed using theSPSS multidimensional scaling program including the INDSCAL algo-rithm. INDSCAL, developed by Carrol and Chang (1970), assumes thatrespondents’ judgments of similarity depend on the euclidian distancesbetween stimuli in an underlying psychological space common to allparticipants. INDSCAL does not, however, assume that participantsshare common weightings for each dimension in this common space.A summation of the grand means and the means for each of the six
types of presentation can be seen in Table 1; grand means range from3.83 to 6.11. All but one of the grand means are above four, the midpointon the original scale. Only one grand mean falls below the midpoint, 3.83,hence, only one grand mean misses by less than .20. This suggests thatcommunication experts find all 16 sets of descriptors applicable to someextent.
Initial MDS results required a choice between a three-dimensionaland a four-dimensional solution. The three-dimensional solution had astress level of .189 and an R squared of .603. A view of the four-dimen-sional solution showed an improvement in both numbers (.142 and .628),but interpretability decayed badly. For this reason, the three-dimen-sional solution was selected (Kruskal & Wish, 1978). It is shown in Figure2.
DISCUSSION
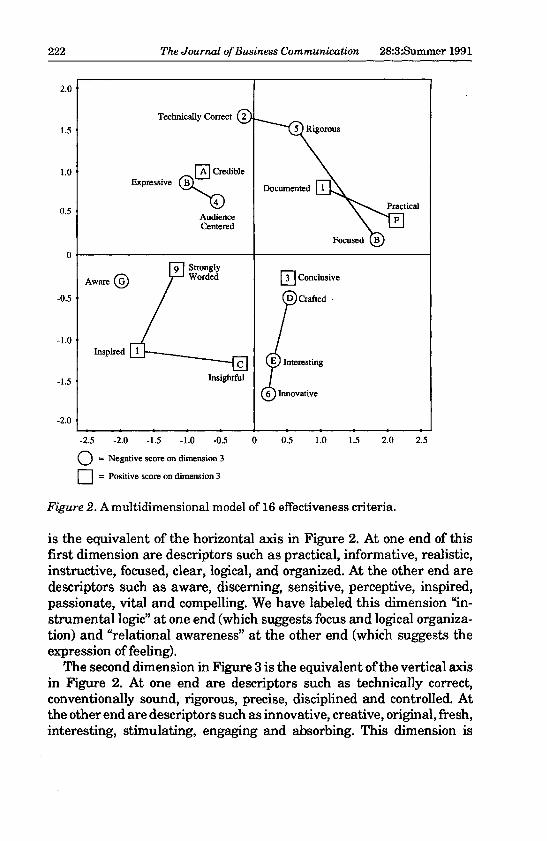
Preliminary findings suggest that the participants in our study sharean implicit framework for describing presentations. Furthermore, theanalysis suggests the descriptors can be interpreted according to threedimensions, as seen in Figures 2 and 3. The first dimension in Figure 3
222
Figure 2. A multidimensional model of 16 effectiveness criteria.
is the equivalent of the horizontal axis in Figure 2. At one end of thisfirst dimension are descriptors such as practical, informative, realistic,instructive, focused, clear, logical, and organized. At the other end aredescriptors such as aware, discerning, sensitive, perceptive, inspired,passionate, vital and compelling. We have labeled this dimension &dquo;in-strumental logic&dquo; at one end (which suggests focus and logical organiza-tion) and &dquo;relational awareness&dquo; at the other end (which suggests theexpression of feeling).The second dimension in Figure 3 is the equivalent of the vertical axis
in Figure 2. At one end are descriptors such as technically correct,conventionally sound, rigorous, precise, disciplined and controlled. Atthe other end are descriptors such as innovative, creative, original, fresh,interesting, stimulating, engaging and absorbing. This dimension is

223
Figure 3. A simplified version of the three dimensional model.
labeled &dquo;conventional structure&dquo; at one end (which suggests followingtraditional rules), and &dquo;dynamic content&dquo; at the other end (which sug-gests innovative material). The third dimension in Figure 3 is repre-
224
sented by the boxes and circles in Figure 2. At one end are descriptorssuch as documented, practical, credible, conclusive, strongly worded,insightful and inspired. At the other end are descriptors such as focused,rigorous, technically correct, audience centered, expressive, crafted,interesting, innovative and aware. The first we have labeled &dquo;forcefulpresentation&dquo; and the second &dquo;perceptive preparation.&dquo;
Four General Orientations
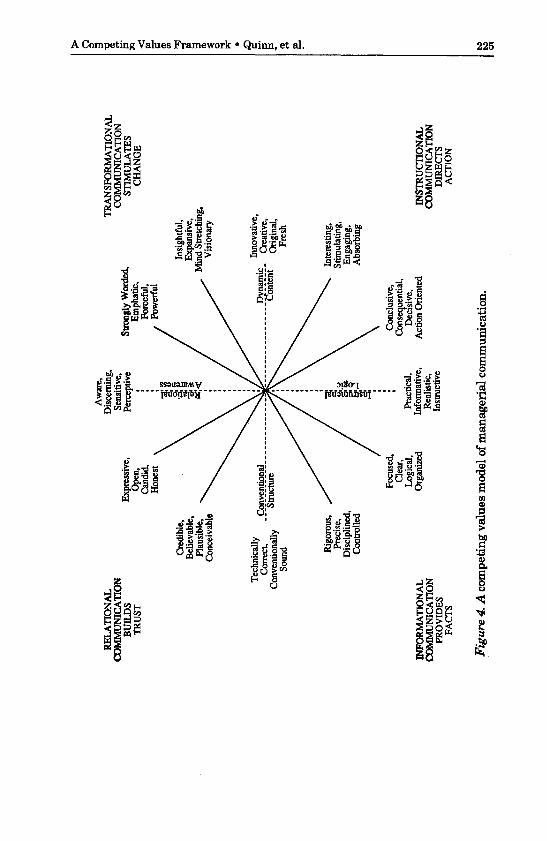
The analysis and labeling of descriptors resulted in the competingvalues model of presentational communication seen in Figure 4. The firsttwo dimensions in this model create a four quadrant space, which, inturn, suggests four different orientations toward managerial presenta-tion. The lower left quadrant represents presentations high on conven-tional structure and instrumental logic. Therefore, descriptors includingrigorous, precise, disciplined, controlled, focused, clear, logical and or-ganized occur in this quadrant. We call this quadrant &dquo;informationalcommunication&dquo; and suggest that it represents presentations that focuson providing facts.The upper right quadrant represents presentations high on relational
awareness and dynamic content. Here are descriptors including stronglyworded, emphatic, forceful, powerful, insightful, expansive, mind-stretching and visionary. In contrast to informational presentations thatdispense facts, we call this quadrant &dquo;transformational communication&dquo;and suggest it represents presentations that focus on stimulatingchange. Here are the images and ideas of the charismatic presenter whocreates new visions and paradigms in the minds of an audience. Thiscommunicator primarily aims to &dquo;transform&dquo; message receivers orstimulate change.The lower right quadrant represents presentations high on in-
strumental logic and dynamic content. Here the descriptors are con-clusive, consequential, decisive, action oriented, interesting,stimulating, engaging and absorbing. These descriptors suggest thequadrant be called &dquo;instructional&dquo; or &dquo;persuasive communication.&dquo; Suchpresentations direct audiences toward specific actions.
In contrast is the upper left quadrant, which represents presentationshigh on conventional structure and relational awareness. Here thedescriptors are credible, believable, plausible, conceivable, expressive,open, candid and honest. As opposed to instructional communication,which directs action, this quadrant is called &dquo;relational communication.&dquo;The kind of presentations represented by this upper left quadrant focuson building trust and establishing rapport between people.
225
226
ADVANTAGES OF THE MODEL
The result of the preceding analysis is a competing values model forpresentational communication. We believe this model articulates a setof perceptual relationships, which, in turn, have some important ad-vantages for helping us analyze written and spoken presentations.
First, the model suggests that there are alternative approaches toviewing messages. As suggested earlier, the four quadrants in Figure 4might be considered general orientations. Quinn’s (1988) study ofmanagerial leadership suggests that these are not emotionally neutralorientations, however. He found strong preferences among managers forleadership styles typified by certain quadrants. Similarly, it might alsobe expected that individuals will be biased toward certain styles ofpresentation; that is, some individuals may believe some orientationsare inherently more important for effective presentations than others.Such assertions may arise from the success individuals experience withcertain orientations or in particular contexts. It may further be arguedthat even textbooks may support some orientations over others. Forexample, the pedagogical literature on management communication (ason most topics in management) tends to display a strong orientationtowards the two bottom quadrants. Going a step further, we suggest thatnot only individuals and texts may be biased, but even groups andcultures may be predisposed in a certain way. The two top quadrants,for example, may receive far less attention in organizations in the UnitedStates.
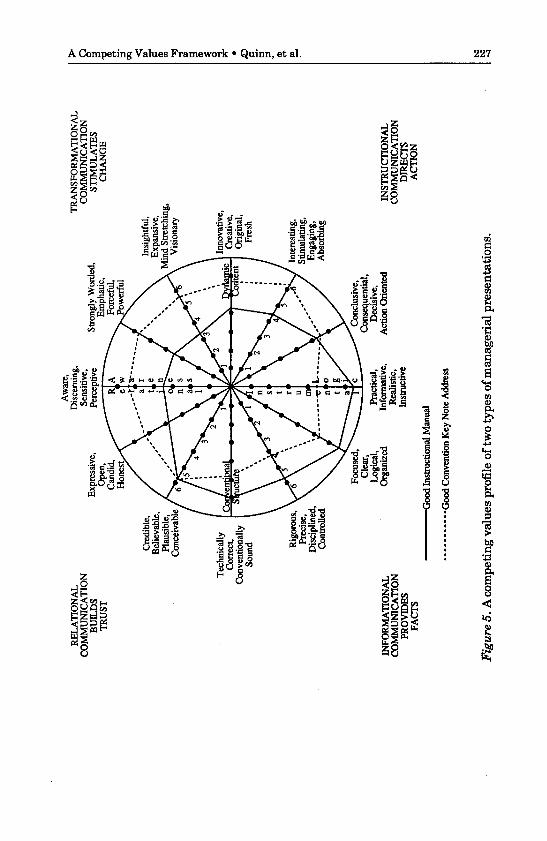
Second, the model suggests the paradoxical nature of effective presen-tations. That is, an effective presentation may include some ingredientsfrom all four quadrants. Thus, a message characterized by one criterionin one quadrant without any trace of its opposite criterion in anotherquadrant, may be ineffective. A presentation, for example, that is highon all the descriptors associated with the informational communicationquadrant and yet possesses none of the characteristics associated withthe transformational communication quadrant may be so boring andmonotonic as to receive virtually no consideration. Presentations ofvarious types may possess more characteristics from one quadrant thanany other; however, we assert that effective presentations must havesome combination of characteristics from all the quadrants. In this way,the model suggests that effective spoken and written messages mustachieve competing goals or possess characteristics that may, upon firstthought, seem incompatible.
Figure 5 illustrates the above argument. In Figure 5 we use the modelto profile the mean scores shown in Table 1. These scores were obtained
227

228
by analyzing respondents’ rankings for two of the presentation types. Agood keynote address, as represented in the collective judgment of ourrespondents, is indicated with a dotted line. Compare that profile withthe solid line, which profiles our respondents’ view of a good instructionalmanual. The two profiles contrast sharply, with the keynote addressweighted towards the upper right and the instructional manual weightedtoward the lower left. Notice, however, that the profile of the manualstays just below the midpoint for many of the descriptors in the upperright quadrant, while the keynote address is slightly above the midpointon the descriptors in the lower left. This result suggests that, accordingto our respondents, each presentation type will manifest some contrast-ing characteristics. In this way, the profile keeps us from assuming awaythe presence of those characteristics not immediately associated with agiven type of presentation.
Third, the model provides a scheme for empirically exploring thecomplexity and trade-offs involved in effective written and spokenpresentations. Suppose, for example, that the 100 best instructionalmanuals were selected from all those published last year, and that eachof the 100 best was then rated from 1 to 7 on each set of descriptors.Further suppose that the scores were then cluster analyzed so as tocreate subsets of manuals with similar characteristics and that eachsubset was then profiled on Figure 5. What would emerge from such ananalysis? One subset of manuals might exactly fit the assumptions ofour respondents as represented in the profile in Figure 5. Other manualprofiles would, however, differ from that general expectation. Theseother profiles would show unexpected relationships among the descrip-tors. For example, one subset of manuals might have a profile similar tothat of the convention keynote address. If this were so, an analysis of themanuals in that subset might modify our current thinking about writinginstructional manuals. This argument would also hold for any other typeof presentation. (For a parallel illustration, relating to managementstyle, see Quinn, 1988).As an aside, we note that the idea of certain characteristics associated
with certain types of presentations raises the issue of context. The modeldoes not itself map context. Our assumption is that both presenters andaudience bring to the interchange their own constructs of context in anyparticular case. Audience assessment of message effectiveness stemsfrom implicit views of contextual demands and audiences evaluate apresenter’s success accordingly. However, our experiences with studentsand executives described below suggest the usefulness of the model asan evaluative tool in a variety of communication contexts.
229
Fourth, the model can be used for applied as well as theoreticalpurposes. Student oral and written assignments can by analyzed withthe model. For instance, the model has been used in the following mannerin a graduate writing course: First, a student writer and other studentreaders score the student writer’s document on each set of descriptors.Second, the means of these scores are used to create a competing valuesprofile, in a manner similar to the results shown in Figure 5. Third, suchan analysis is done for each class member, with all completed profilescoming to the instructor. Fourth, three results occur: (a) the studentshave individual profiles of themselves on at least one document; (b) theinstructor has a profile of the entire class; and (c) the instructor can givefeedback on specific areas to both the student and the class as a whole.Here then are interesting possibilities in linking communicationanalysis, feedback, and improvement efforts with the similarly struc-tured management improvement framework outlined in Quinn, Faer-man, Thompson and McGrath ( 1990).1A similar feedback procedure may be applied to oral presentations.
After a presentation, the student speaker and class members plot thatpresentation on the model. In other words, they create a competingvalues profile of the presentation. Immediately, student speakers havea visualization of their performance, and can begin thinking of ways toimprove their next presentation.We find that executives also respond positively to this kind of presen-
tation analysis. With executives we collect, prior to training, individualcompeting values profiles of each participant’s presentational com-munication abilities, which are completed by peers, subordinates, supe-riors, and the executives themselves. In other words, four profiles arecreated, permitting visual comparisons as to agreements and differencesbetween the evaluators. Executives then meet with the communication
trainer, who provides analysis and suggestions for change. Subsequentpresentations allow additional analysis to determine whether progressoccurs.
When reviewing the competing values profiles with the executives, wehave discovered that the model lends itself well to discussing interper-sonal communication skills.2 In fact, many of the peers, subordinatesand superiors involved suggested that we build a model that identifiesinterpersonal variables. The presentational model offered here mightalso be applied to group communication.We hope the competing values model proposed here is useful in
studying oral and written presentations in a variety of managerialcontexts. The model may help us understand what audiences expect from

230
various presentations and how audience reactions compare with apresenter’s intentions - we know from research that compares selfassessments with assessments by others that communicators oftenevaluate their effectiveness very differently than do their peers, subor-dinates and superiors in the same organization (Sypher & Sypher, 1984).Perhaps the model can help us determine more precisely how presenters’intentions and audiences’ reactions differ.
In concluding, we note that the competing values framework sug-gested by our model is tentative and developmental. This study is aneffort to conceptualize at a very general level. While we use data andsystematic analyses that can be replicated, the data are ultimately basedon the subjective judgments of communication specialists. Surely thedescriptors in the model might be rearranged into numerous patterns.Additional descriptors might also be identified and different presenta-tion types might be employed. Alternative analytic methods might alsobe used. All would modify the present findings. It should be remembered,however, that rather than finding some preexisting, empirical reality,we are here engaged in the process of creating meaning.
Ultimately, the competing values model offered here is a theoreticaltool. We are empirically and systematically building a model that nor-mally would be developed in the armchair of some scholar. Our effortsare exploratory and our expectations are modest. We see this as an initialmodel, one that starts a conversation, and leads to future improvements.Along the way, we hope it provides some useful insights into the analysisof written and spoken presentations.
NOTES &dquo;
This research was supported by The University of Michigan School ofBusiness Administration. We extend special thanks to Carol Mohr and ChristiBemister who prepared the final manuscript, figures, and table. A copy of theresearch instrument is available from the third author.
1Presentational success or failure is usually focused upon audienceresponse. Granted, functionality is not all there is to assessing competence(Spitzberg, 1983, p. 327). We all want to apply other intrinsic criteria tocommunication assessment — such as tests of truth or candor, or the upright-ness of the presentor’s motives. But competence, as we define it, is primarilya function of goal attainment.2We do not assume that the present model is applicable, without modifica-
tion, to interpersonal communication. We did not, for example, use themanagement interview as one of our types of presentation, because it is, webelieve, more representative of a "regulative situation" (O’Keefe & McCornack,
231
1987, p. 69). In that situation, the more interactional criteria of interpersonalcommunication models are more appropriate.
REFERENCES
Billig, M. (1989).Arguing and thinking:A rhetorical approach to social psychol-ogy. Cambridge: Cambridge University Press.
Brown, R.L., & Herndl, C.C. (1986). An ethnographic study of corporatewriting: Job status as reflected in written texts. In B. Couture (Ed.),Functional approaches to writing: Research perspectives (pp.11-28). Nor-wood, NJ: Ablex.
Carroll, J.D., & Chang, J.F. (1970). Analysis of individual differences inmultidimensional scaling via an N-way generalization of Eckhart Youngdecomposition. Psychometrika, 35, 283-319.
Fishbein, M. & Ajzen, I. (1981). Acceptance, yielding and impact: Cognitiveprocesses in persuasion. In R.E. Petty et al. (Eds.). Cognitive responses inpersuasion (pp.339-359). Hinsdale: Lawrence Erlbaum.
Hagge, J. (1989). The spurious paternity of business communication principles.The Journal of Business Communication, 26, 33-55.
Hair, J.F., Anderson, R.E., & Tatham, R.C. (1987). Multivariate data analysis(2nd ed). New York: Macmillan.
Halpern, J.W. (1988). Getting in deep: Using qualitative research in businessand technical communication. Journal of Business and Technical Com-munication, 2(2), 22-43.
Hinks, D.A.G. (1940). Tisias and Corax and the invention of rhetoric. ClassicalQuarterly, 34(1,2), 61-69.
Hovland, C.I., Janis, I.L., & Kelly, H.H. (1953). Communication and per-suasion. New Haven: Yale University Press.
Huckin, T.N., & Hutz, L. (1987). Existential "there." (CDC Technical ReportNo. 36). Pittsburgh, PA: Carnegie Mellon University.
Janis, J.H. (1973). The writing behavior of businessmen. Journal of Com-munication, 15, 1965, 81-88.
Kennedy, G.A. (1959). The earliest rhetorical handbooks. American Journal ofPhilology, 80(2), 169-178.
Kruskal, J.B., & Wish, M. (1978). Multidimensional scaling. Beverly Hills, CA:Sage.
Monge, P.R. (1973). Theory construction in the study of communication: Thesystem paradigm. Journal of Communication, 23, 5-16.
Monge, P.R., Backman, S.G., Dillard, J.P., & Eisenberg, E.M. (1983). Com-municator competence in the workplace: Model testing and scale develop-ment. In M. Burgoon (Ed.), Communication Yearbook 5 ( pp. 505-528). NewBrunswick, N.J.: Transaction.

232
O’Keefe, B.J., & McCornack, S A. (1987). Message design logic and messagegoal structure: Effects on perceptions of message quality in regulativecommunication situations. Human Communication Research, 14, 68-92.
Quinn, R.E. (1988). Beyond rational management: Mastering the paradoxesand competing demands of high performance. San Francisco: Jossey-Bass.
Quinn, R.E., Faerman, S.R., Thompson, M.P., & McGrath, M.R. (1990). Becom-ing a master manager: A competency framework. New York: Wiley.
Quinn, R.E. & Rohrbaugh, J. (1983). A spatial model of effectiveness criteria:Towards a competing values approach to organizational analysis. Manage-ment Science, 29(3), 363-377.
Rogers, P.S. (1988). Distinguishing public and presentational speaking.Management Communication Quarterly, 2, 102-115.
Rogers, P.S. (1989). Choice-based writing in managerial contexts: The case ofthe Dealer Contact Report. The Journal of Business Communication, 26,197-216.
Smith, R.G. (1968). Public speaking models: Process and response. SouthernSpeech Journal, 33, 316-327.
Spitzberg, B.H. (1983). Communication competence as knowledge, skill andimpression. Communication Education, 32, 323-329.
Sypher, B.D., & Sypher, H.E. (1984). Seeing ourselves as others see us:Convergence and divergence in assessments of communication behavior.Communication Research, 11(7), 97-115.