Embed Size (px)
Citation preview

Incorporation of motion information for tumour volume definition in PET
1
Comparison of different methods of incorporating respiratorymotion for lung cancer tumor volume delineation on PETimages: a simulation study
Incorporation of motion information for lung tumor volume definition in PET
Mathieu Hatt@*, Amandine Le Maitre1*, Daphné Wallach2*, Hadi Fayad, and Dimitris Visvikis*First three authors listed in alphabetical order contributed equally to this work
INSERM, UMR 1101 LaTIM, CHRU Morvan, Brest F-29200, France
@ corresponding authorMathieu HattINSERM UMR 1101 LaTIMCHRU MorvanBrest, 29609 [email protected]: +33 2 98 01 81 11
Wordcount: >7986
1 Amandine Le Maitre is currently with the LTSI INSERM UMR 1099, University of Rennes 1, Rennes,France
2 Daphné Wallach is currently with the ARTORG Center for Computer Aided Surgery, University of Bern,Bern, Switzerland.
Confidential: not for distribution. Submitted to IOP Publishing for peer review 17 September 2012ha
l-007
4901
0, v
ersi
on 1
- 6
Nov
201
2Author manuscript, published in "Physics in Medicine and Biology 57, 22 (2012) 7409-30"
DOI : 10.1088/0031-9155/57/22/7409

Incorporation of motion information for tumour volume definition in PET
2
Abstract. The interest of PET complementary information for the delineation of the targetvolume in radiotherapy of lung cancer is increasing. However, respiratory motion requires thedetermination of a functional internal target volume (ITV) on PET images for which severalstrategies have been proposed. The purpose of this study was the comparison of these strategiesfor taking into account respiratory motion and deriving the ITV: 1) adding fixed margins to thevolume defined on a single binned image, 2) segmenting a motion averaged image, and 3)considering the union of volumes delineated on binned frames. For this third strategy, binnedframes were either non-corrected for motion, or corrected using two different methods: elasticregistration or super resolution. The strategies’ performances were assessed on realisticsimulated datasets combining the NCAT phantom with a PET Philips GEMINI scanner modelin GATE, and containing various configurations of tumor to background contrast, with bothregular and irregular respiratory motion (with a range of motion amplitudes). The obtainedITVs’ sensitivity (SE) and positive predictive value (PVE) with respect to the known true ITVwere significantly higher (from 0.8 to 0.95) than all other techniques when using binned framescorrected for motion, independently of motion regularity, amplitude, or tumor to backgroundcontrast. Although the absolute difference was small and not always significant, imagescorrected using super resolution led to systematically better results than using elasticregistration. The worst results were obtained when using the motion averaged image forsensitivity (around 0.5-0.6) and using the margins added to a single frame for PPV (0.6-0.7)respectively. The best strategy to account for breathing motion for tumor ITV delineation inradiotherapy planning is to rely on the use of the union of volumes delineated on superresolution-corrected binned images.
Keywords: radiotherapy treatment planning, respiratory motion, super-resolution, 4D PETimaging
1. IntroductionComputed tomography (CT) is routinely used for delineating gross target volumes (GTV) and
organs at risk (OAR) in radiotherapy treatment planning (RTP) of lung cancer. However, the highsensitivity and specificity of 18F-FDG Positron Emission Tomography (PET) for diagnosis andstaging, as well as the widespread availability of combined PET/CT scanners, led to numerous studiesinvestigating the potential of PET/CT for target volume delineation. Use of PET/CT images has beenshown to reduce intra and inter observer variability in target volume delineation [Ashamalla 2005,Steenbakkers 2006, van Baardwijk 2007], as well as significantly modifying GTVs [Walter 1999,Bradley 2004]. Moreover, PET imaging allows characterizing tracer uptake heterogeneities than canbe exploited for the prescription of inhomogeneous doses in scenarios of dose boosting, painting orredistribution [Aristophanous 2011, van Loon 2011]. However, metabolically active tumor volume(MATV) delineation faces a number of challenges due to the poor spatial resolution and high level ofnoise characterizing emission images [Hatt 2011a].
Respiratory motion constitutes an additional challenge for lung cancer RTP. In order to thoroughlyirradiate the tumor while sparing OARs, it is desirable to define the smallest target volumeencompassing the tumor in each phase of the respiratory cycle. Visualizing the tumor morphologicalvolume and location throughout the respiratory cycle, requires a four-dimensional (4D) CT scan. Theoverall internal target volume (ITV) is then defined as the union of all GTV volumes delineated on theimages corresponding to all phases of the respiratory cycle [De Bari 2011].
On the other hand, the functional ITV definition may be performed on a standard PET imageunder the assumption that a motion averaged image represents the tumor motion extent [Riegel 2012,Caldwell 2003], or through the addition of fixed margins on a single respiration synchronized frameimage [De Bari 2011]. Alternatively, 4D imaging can be also used to define a functional ITV on PETimages [Nehmeh 2004, Wolthaus 2005, Aristophanous 2012], which requires the MATV delineationon each respiratory synchronized PET frame. The main advantage of binned frames over the motionaverage image is that they should in principle more accurately reflect the total extent of the MATVmotion displacement. However, one significant disadvantage with respect to the motion averagedimage is the reduced quality of the individual respiratory synchronized image frames [Boucher 2004,
hal-0
0749
010,
ver
sion
1 -
6 N
ov 2
012

Incorporation of motion information for tumour volume definition in PET
3
Jarritt 2006, Park 2008], since each temporal frame contains only a fraction of the overall acquireddata. Consequently, the reconstructed respiratory synchronized PET images are characterized by lowersignal to noise ratio and contrast [Jarritt 2006]. Such a decreased image quality should in turn lead toincreased errors in overall MATV determination considering the current clinically available PETsegmentation algorithms [Hatt 2011b]. On the other hand, several methods allowing the correction ofmotion artifacts and the improvement of statistical quality of respiratory synchronized PET imageshave been proposed. These include both ‘post-reconstruction’ or ‘reconstruction’ based approaches,making use of affine [Lamare 2007a] and/or deformable respiratory motion models [Qiao 2006,Lamare 2007b] or making use of the superresolution principle [Chang 2009, Wallach 2012].
All of these different ways of taking into account the respiratory motion can have a significantinfluence on the determination of the functional GTV/ITV using PET images. To the best of ourknowledge, there exists no such comparison study considering all these different approaches withinthe context of MATV for RTP. Therefore the objective of the present study was to provide acomprehensive comparison of the impact and accuracy of different methods taking into account therespiratory motion when defining the functional ITV in lung cancer RTP, by providing a frameworkconsisting of state-of-the-art simulated Monte Carlo (MC) based datasets. The following strategieswere compared: (a). delineating the GTV on a motion averaged image and assume it is the ITV[Caldwell 2003], (b). delineating the GTV on one respiratory frame and add fixed margins to derivethe ITV, similarly to current practice using CT images [De Bari 2011], (c). considering the ITV as theunion of the delineated GTVs on all respiratory frames, with or without incorporating motioncorrection based on different approaches.
2. Materials and methods
2.1 Evaluation datasetsFifteen simulated datasets were generated using a model of the Philips GEMINI PET systemimplemented and validated [Lamare 2006] using the Monte-Carlo simulation platform in Geant4Application for Tomography Emission (GATE) [Jan 2004], combined with the Non-Uniform RationalB-Spline (NURBS)-based 4D cardiac-torso phantom (NCAT) [Segars 2009]. Patient specificanatomical modifications were applied to the NCAT phantom as previously described [Le Maitre2009], using patient-specific anatomy based on patient CT scans and associated respiratory signals.The simulation was carried out using the Real Time NCAT module implemented in GATE [Descourt2006], with update of the phantom position every 0.1s. 150 positions of the phantom were simulatedfor each dataset, corresponding to three different respiratory cycles of 5s each (50 positions per 5scycle). Finally, 3-minute acquisitions (36 respiratory cycles) were simulated in total. The list-modedata output of the simulation was subsequently divided in eight bins according to the amplitude of therespiratory motion.
The first 12 datasets correspond to the default anatomy of the NCAT with a regular sinusoidalrespiratory motion. The phantom in figure 1 was simulated using three different maximum diaphragmdisplacements in the cranio-caudal direction (0.5, 1.5 and 2.5 cm, see figure 2), two different levels oftracer uptake heterogeneity within the tumor (either homogeneous or heterogeneous with a contrastbetween the intra-tumor activities set to 4), and two different tumor to background contrast (4:1 and10:1). The tumor had a 5 cm diameter and the sub-volume a 2 cm diameter.
(a) (b) (c)
hal-0
0749
010,
ver
sion
1 -
6 N
ov 2
012

Incorporation of motion information for tumour volume definition in PET
4
Figure 1: Phantom used to simulate the first 12 datasets. The inner tumor sphere (2cm diameter) hasthe same level of activity and four times the activity of the outer one for homogeneous (b). and
heterogeneous (c). cases respectively.
(a)
(b)
(c)
(d)
(e)Figure 2: Images simulated at the two extreme positions (left and right) of the respiratory cycle, usinga maximum diaphragm displacement of (a) 0.5 cm, (b) 1.5 cm and (c-d) 2.5 cm. This phantom uses theNCAT default anatomy and a regular respiratory cycle. (a-c) contain a heterogeneous tumor, with a10:1 tumor to background contrast ratio (and a contrast between the tumor and the inner sphere of4:1), whereas (d) illustrates the 2.5 cm motion amplitude for a homogeneous case (contrast 4:1). Thered line represents the reference diaphragm position. (e) shows the frame 1 (on the left) and the motionaveraged image (on the right) for case (c).
For the 3 last datasets, both regular and irregular (in phase and in amplitude) motion wereconsidered. The 13th dataset was simulated using the same phantom as the first 12 datasets with aheterogeneous tumor. The last two datasets were based on the NCAT phantom adapted to real PET/CTclinical datasets (figure 3). Two levels of motion amplitude were considered with maximumdiaphragm displacement of 2.5 cm and 1.5 cm respectively. Different lesions based on manualsegmentation of patients’ 18F-FDG images were incorporated in the each of these two datasets (14th
and 15th dataset respectively). The first (see figure 3(a)) was an approximately spherical lesion(diameter of 4cm) with a tumor to background contrast of 20:1 and with a core (maximum length of 2cm) exhibiting lower uptake with a contrast of 4:1 with respect to the lung. The second dataset (seefigure 3(b)) had a heterogeneous, crescent-shaped tumor with a contrast of 2.5:1 and 9:1 between thehigh and low uptake regions and between the low uptake region and the background respectively. The
hal-0
0749
010,
ver
sion
1 -
6 N
ov 2
012
Incorporation of motion information for tumour volume definition in PET
5
high uptake region was approximately spherical (1.8 cm diameter). This tumor had a necrotic corewith activity similar as the background. For the 14th case (figure 3a), the core with lower uptake wasconsidered part of the GTV ground-truth since its activity was above background, whereas in the 15th
case (figure 3b) the necrotic core was considered outside the GTV ground-truth since its activity wasthe same as the background.
(a)
(b)
Figure 3: Illustration of the (a) 14th and (b) 15th datasets with patient-specific NCAT anatomy andrealistic tumors: (left) the ground-truth and (right) the corresponding slice simulated PET image.
2.2 Respiratory motion incorporation and associated ITV definitionWe compared three different strategies of taking into account respiratory motion within the ITV
determination. The first strategy is similar to the clinical practice for morphological ITV definition onCT images without the use of a 4D-CT acquisition [de Bari 2011]. It consists in delineating thefunctional GTV on the mid-inspiration binned images and adding fixed margins (20mm and 10mm inthe cranio-caudal and other directions respectively) in all binned images in order to account for thetypical tumor displacement during the respiratory cycle allowing to derive the ITV. The other twoapproaches are in accordance with the recommendations of the AAPM task group number 76 [Keall2006]. The second strategy consists in delineating the functional GTV on the motion averaged image,assuming it can be considered as the ITV since the motion averaged image is expected to contain thesum of all tumor positions during the breathing cycle [Caldwell 2003]. The last and third strategyrequires delineating the MATV on all gated images, the final ITV being defined as the union of alldelineated GTVs. For this last strategy, we considered four different approaches, two without and twowith motion correction. Without motion correction, binned images were reconstructed with small(2×2×2 mm3) and large voxels (4×4×4 mm3). With motion correction, two different correctionapproaches (see section 2.3 below) were applied to the gated images prior to delineation in order tocompare the results obtained using these correction methods, that also lead to different voxel sizeimages. For these cases, list-mode data output was divided also in eight bins leading to eightsynchronized PET images.
In all simulated datasets, volumes were automatically delineated using the Fuzzy LocallyAdaptive Bayesian algorithm based on statistical and fuzzy modeling [Hatt 2009]. It is an accurate,robust and reproducible segmentation method, allowing the use of up to three classes for thedelineation of heterogeneous tumors [Hatt 2010, 2011b]. Therefore, the entire volume delineated bythe algorithm (either homogeneous volume or the union of the two classes in the heterogeneous tumorcases) was considered as the GTV.
This led to the comparison of the following six different reconstructed images:(A). Frame 1 with margins: GTV corresponding to the volume delineated on the mid-
inspiration frame of the gated sequence reconstructed with standard 4×4×4mm3 voxels.
hal-0
0749
010,
ver
sion
1 -
6 N
ov 2
012

Incorporation of motion information for tumour volume definition in PET
6
To obtain the ITV fixed margins were added (20mm and 10mm in the cranio-caudal andother directions respectively),
(B). Motion averaged image: GTV segmented on the motion averaged image reconstructedwith standard 4×4×4mm3 voxels and considered as the ITV,
(C). a) Union of LR images: ITV corresponding to the union of GTVs delineated on each lowresolution gated frame reconstructed with standard 4×4×4 mm3 voxels,b) Union of upsampled LR images: ITV corresponding to the union of GTVs delineatedon each low resolution gated frame reconstructed with smaller 2×2×2 mm3 voxels,c) Union of elastic-corrected images: ITV corresponding to the union of GTVs delineatedon each gated frame, reconstructed with the motion-incorporated reconstruction algorithmbased on elastic transforms (4×4×4 mm3 voxels),d) Union of SR-corrected images: ITV corresponding to the union of GTVs delineated oneach gated frame, reconstructed with the super-resolution reconstruction algorithm(2×2×2 mm3 voxels).
2.3 Motion correction reconstruction algorithmsTwo different reconstruction-incorporated motion correction methods (one based on elastictransformations [Lamare 2007b], the other on the super-resolution concept [Wallach 2010]) wereconsidered here and compared regarding the third strategy in this study (union of GTVs delineated ongated frames). Although both motion correction approaches are applicable directly on reconstructedimages [Lamare 2007b, Wallach 2012] or during the reconstruction process [Lamare 2007b, Wallach2010], the second implementation approach using the simulated raw list-mode data, previously shownto lead to superior quality corrected images, was used in this work.Let ��, � � 1,… , � denote the counts detected in line of response (LOR) �, , � � 1,… , � the intensityof voxel � in the reconstructed image, and � the probability of detecting at LOR � an event generatedin voxel �. The static tomographic problem is:
� � . �1� In order to adapt equation (1) to the case of reconstruction with respiratory motion, we introduce theindex � � 1,… , �, representing the respiratory phase, ��� the counts detected in LOR � duringrespiratory state �, �the intensity of voxel � during respiratory state �, and �� the probability ofdetecting at LOR � an event generated in voxel � during respiratory state �. Equation (1) hencebecomes:
�� � ��� ���, �2�
where is the reconstructed image in the reference position, and �� is the motion matrix between thereference position and position �. The model (2) was used to build both motion-incorporatedreconstruction algorithms used in our study.
The first correction method is based on the incorporation of elastic transformations into theone-pass list mode EM (OPL-EM) reconstruction algorithm [Lamare 2007b]. Its update equation is:
��� ��
∑ ∑ � �������� �� �����
����
�
� �
1� ������ , �3�
where " is both the iteration number and the subset used in that iteration. #� is the set of list-modeevents in the "th subset. Images reconstructed using this correction scheme have the same voxel size asthe original images.
The second reconstruction scheme incorporates a super-resolution (SR) model. SR techniquesmake use of the motion in a sequence of low-resolution (LR) images in order to improve them [Kang2003]. By modeling each image of the original sequence as a degraded version of an underlying high-resolution (HR) image with wider bandwidth than that of any of the individual LR frames, it ispossible to estimate the high-resolution image. Let us consider the 3D HR image of size $�, written asthe vector %, which is the ideal image resulting from sampling (at or above the Nyquist rate) acontinuous, band-limited 3D scene. The parameter $ represents the down-sampling factor in theobservation model. Each of the � observed LR images is of size � and is denoted in lexicographicalnotation as �, � � 1 to �. Using these notations, a typically used degradation model is:
hal-0
0749
010,
ver
sion
1 -
6 N
ov 2
012
Incorporation of motion information for tumour volume definition in PET
7
� � &'��% ( )�, � � 1. . �, �4� where & is a � + $� subsampling matrix performing an averaging over neighboring voxels, ' is a$� + $� blur matrix that models the action of the point spread function of the PET system, �� is thesame $� + $� warp matrix as in equation (2), and )� is an additive noise vector. This degradationmodel can be incorporated into the tomographic problem [Wallach 2010] incorporating motion inequation (2), yielding:
�� � ��� �&'��% ( )�. �5�
This model was incorporated within the one-step late (OSL) algorithm [Green 1990], a maximum aposteriori (MAP)-based reconstruction method:
%��� �%�
∑ ∑ � �&'���� ( - ./.% �%������� �����
0
� �
�
� �
���� �&'��%��� , �6�
where, / is a regularization term representing a priori information about the image %. We chose thefollowing form for function /
/�%� � � � /23% 4 %565�78
9
�, �7�
where,7 is the neighborhood of voxel � and /2 is the Huber function [Huber 1981]
/2�;� � < ;= �% |;| ? @2@|;| 4 @= �% |;| A @.
B �8� @ is a positive parameter controlling the switch between the quadratic and the linear part of thefunction. This function is quadratic near the origin and linear far from the origin, which means thatsmall intensity differences between neighboring voxels are more penalized than large ones, assumed tobe associated with signal rather than noise. It should be noted that the images reconstructed using thissecond method have voxels twice as small as the original images.
In both reconstruction methods (3) and (6), the system matrices � include normalization andattenuation corrections and are computed as follows:
� � DE�F�. �9� D is a diagonal � + � matrix whose term D�� is the normalization term of the LOR � and F� is a � + � matrix whose term F�� represents the probability of detecting at LOR � an event generated in voxel �during respiratory state �, considering only geometric effects such as the length of intersectionbetween LOR � and voxel �. The diagonal matrix E� is of size � + � and models the attenuationoccurring along the LOR �
E��� � expH4�F�����I�9
�J, �10�
where I is the linear attenuation coefficient at the energy of 511 keV (I is the intensity of the voxel �in the NCAT attenuation image).
2.4 Data analysis and figures of merit
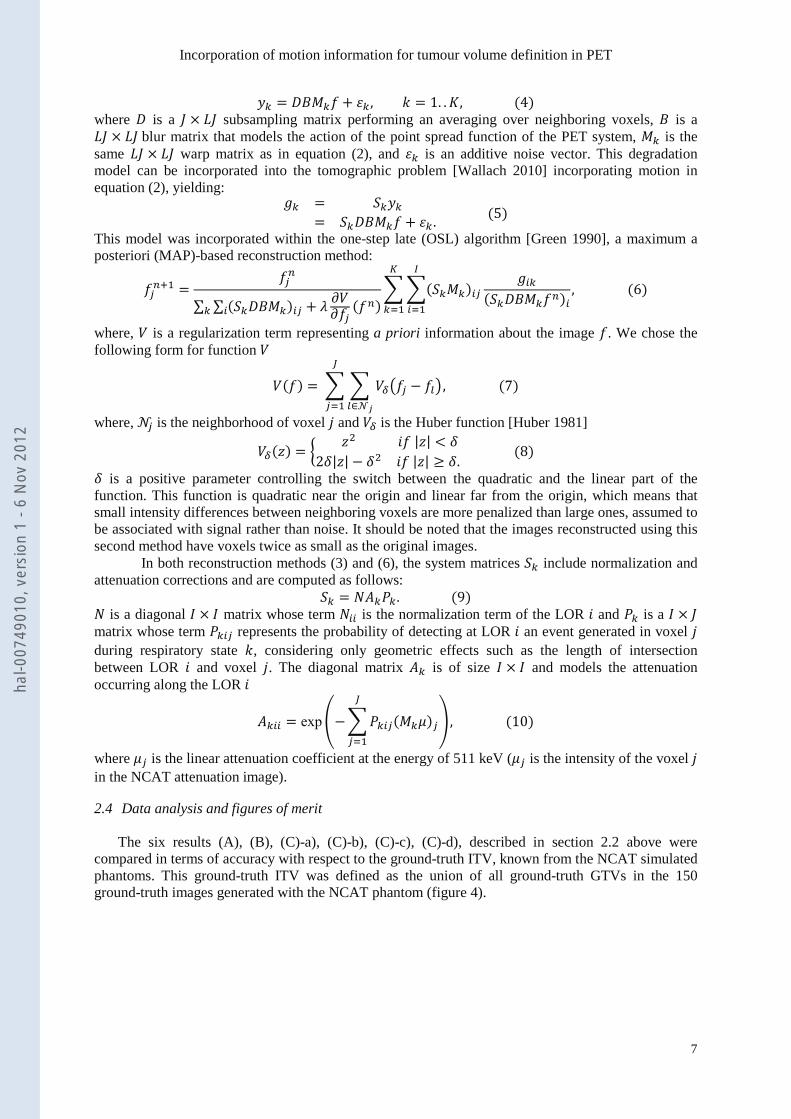
The six results (A), (B), (C)-a), (C)-b), (C)-c), (C)-d), described in section 2.2 above werecompared in terms of accuracy with respect to the ground-truth ITV, known from the NCAT simulatedphantoms. This ground-truth ITV was defined as the union of all ground-truth GTVs in the 150ground-truth images generated with the NCAT phantom (figure 4).
hal-0
0749
010,
ver
sion
1 -
6 N
ov 2
012
Incorporation of motion information for tumour volume definition in PET
8
Figure 4: Definition of the ground-truth ITV as the union of all ground-truth GTVs.
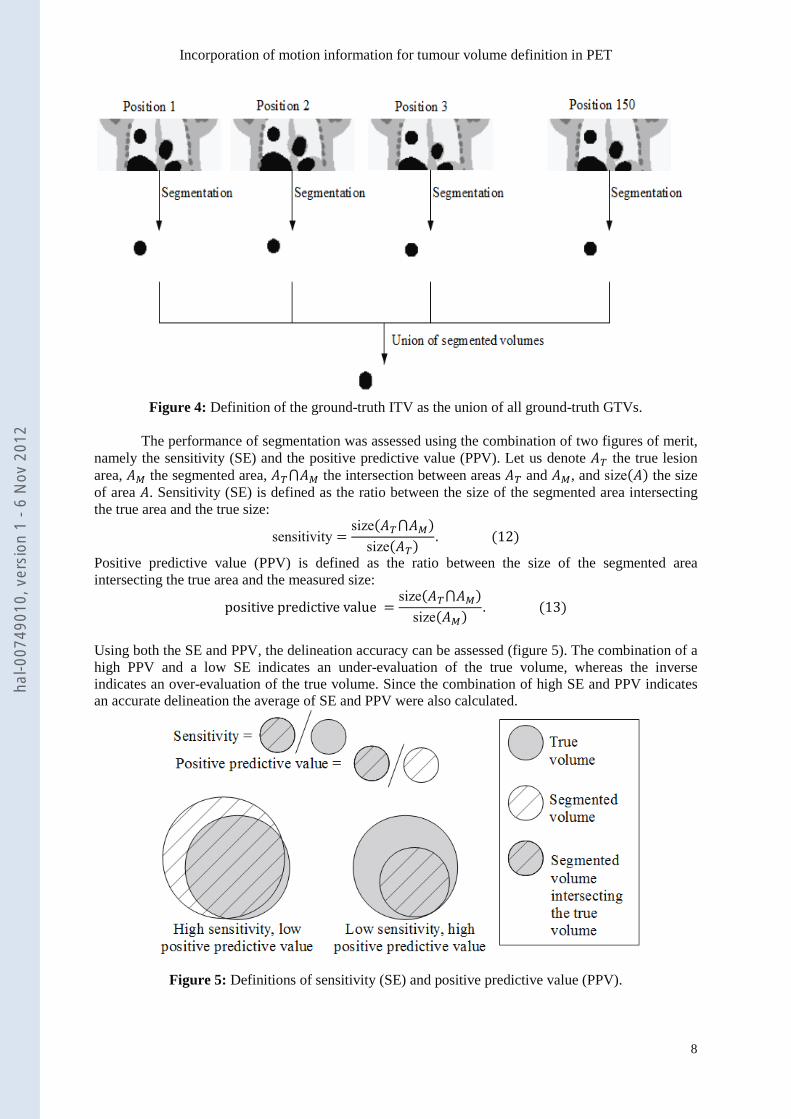
The performance of segmentation was assessed using the combination of two figures of merit,namely the sensitivity (SE) and the positive predictive value (PPV). Let us denote E� the true lesionarea, EL the segmented area, E�MEL the intersection between areas E� and EL, and size�E� the sizeof area E. Sensitivity (SE) is defined as the ratio between the size of the segmented area intersectingthe true area and the true size:
sensitivity � size�E�MEL�size�E�� . �12�
Positive predictive value (PPV) is defined as the ratio between the size of the segmented areaintersecting the true area and the measured size:
positive predictive value � size�E�MEL�size�EL� . �13�
Using both the SE and PPV, the delineation accuracy can be assessed (figure 5). The combination of ahigh PPV and a low SE indicates an under-evaluation of the true volume, whereas the inverseindicates an over-evaluation of the true volume. Since the combination of high SE and PPV indicatesan accurate delineation the average of SE and PPV were also calculated.
Figure 5: Definitions of sensitivity (SE) and positive predictive value (PPV).
hal-0
0749
010,
ver
sion
1 -
6 N
ov 2
012

Incorporation of motion information for tumour volume definition in PET
9
Statistical tests were carried out with MedcalcTM (Medcalc software, Belgium) to assess differencesbetween SE, PPV, and average of SE and PPV calculated for all six results, using Mann-Whitney U orKruskal-Wallis tests for two, three or more distributions respectively. All tests were two-sided and a pvalue below 0.05 was considered statistically significant.
3. ResultsResults are presented separately for the first twelve standard NCAT datasets with a regular
respiratory motion only (section 3.1), and for the three other datasets (realistic NCAT modifiedphantoms), considering both regular and irregular motion (section 3.2).
3.1 Standard NCAT cases
Values of SE and PPV are presented in table 1 whereas figure 6 shows the values of averagingPPV and SE.
n=12 Mean±SDSensitivityFrame 1 with margins 0.989±0.016Motion averaged image 0.704±0.109Union of LR images 0.907±0.033Union of upsampled LR images 0.824±0.104Union of elastic-corrected images 0.912±0.016Union of SR-corrected images 0.931±0.015Positive predictive valueFrame 1 with margins 0.475±0.087Motion averaged image 0.920±0.052Union of LR images 0.830±0.087Union of upsampled LR images 0.823±0.041Union of elastic-corrected images 0.903±0.042Union of SR-corrected images 0.934±0.042
Table 1: SE and PPV for the compared ITVs of all 12 datasets with a regular breathing motion.
hal-0
0749
010,
ver
sion
1 -
6 N
ov 2
012

Incorporation of motion information for tumour volume definition in PET
10
Figure 6: Distributions of the average of SE and PPV values for the compared ITVs of all 12 datasetswith a regular breathing motion. * denotes non-significant difference between distributions.
According to the average of SE and PPV values (figure 6), the results point to an advantage ofusing the two motion-corrected images, resulting in values between 0.9 and 1, with a slight butsignificant advantage for SR-corrected images over elastic-corrected images (p=0.0056). On the onehand, no significant differences were seen between the two correction methods regarding PPV,although SR-corrected images led to slightly higher values (0.90±0.04 vs. 0.93±0.04, p=0.052). On theother hand, SE was significantly higher for SR-corrected images (0.91±0.02 vs. 0.93±0.02, p=0.01)(table 1).
All methods led to significantly different results of average SE and PPV, except betweenupsampled LR images and motion averaged image (p=0.45). The worst performance was obtained bydelineation on the first gated PET frame with the addition of fixed margins, with an average of SE andPPV between 0.65 and 0.8. This approach led to significantly higher SE (close to 1) but significantlylower PPV (<0.5) than all other 5 results (table 1) (p<0.0001). The delineation performed on themotion averaged image led to the second most inaccurate volume, with mean SE of 0.7 (significantlylower than all other approaches, p<0.0001) and PPV of 0.9 (significantly higher than all approachesexcept the images corrected for motion, p<0.01) respectively. All other approaches dealing with LRimages (for both voxel sizes) or corrected images (using either elastic transforms or SR) resulted forall cases in both mean SE and PPV above 0.8. The use of smaller voxels in the reconstruction of LRimages led to significantly lower SE (0.91±0.03 vs. 0.82±0.10, p=0.04) but similar PPV (0.83±0.09 vs.0.82±0.04, p=0.4). Effects of motion amplitude
Figures of merit are presented for each motion amplitude (0.5, 1.5 and 2.5 cm) in table 2 andfigure 7(a-c). P values are provided in table 2 (values <0.05 in bold) to demonstrate statisticalsignificance of the sensitivity to increasing motion amplitude.
n=4 Mean±SDSensitivity Amplitude
0.5 cmAmplitude1.5 cm
p r/t*0.5 cm
Amplitude2.5 cm
p r/t*0.5 cm
p r/t*1.5 cm
(pp
v+se
)/2
Aver
age
ofSE
and
PPV
Union of LR images
Union of upsampledLR images
Motion averagedimage
Frame 1 withmargins
Union of elastic-correctedimages
Union of SR-correctedimages
*
hal-0
0749
010,
ver
sion
1 -
6 N
ov 2
012

Incorporation of motion information for tumour volume definition in PET
11
Frame 1 with margins 1.00±0.001 0.996±0.001 0.02 0.974±0.018 0.02 0.02Motion averaged image 0.833±0.017 0.669±0.032 0.02 0.602±0.043 0.02 0.08Union of LR images 0.922±0.023 0.915±0.011 0.4 0.885±0.045 0.3 0.4Union of upsampled LR images 0.844±0.109 0.837±0.069 0.8 0.794±0.138 0.4 0.8Union of elastic-corrected images 0.916±0.011 0.901±0.006 0.04 0.916±0.024 0.6 0.2Union of SR-corrected images 0.942±0.011 0.936±0.007 0.2 0.915±0.009 0.03 0.04Positive predictive valueFrame 1 with margins 0.390±0.031 0.468±0.045 0.02 0.565±0.050 0.02 0.04Motion averaged image 0.907±0.062 0.914±0.067 0.8 0.937±0.041 0.4 0.2Union of LR images 0.802±0.108 0.841±0.099 0.8 0.850±0.073 0.8 0.6Union of upsampled LR images 0.811±0.039 0.811±0.058 0.8 0.844±0.031 0.3 0.3Union of elastic-corrected images 0.911±0.026 0.920±0.043 0.4 0.883±0.055 0.6 0.3Union of SR-corrected images 0.923±0.047 0.939±0.048 0.4 0.942±0.044 0.8 0.6
Table 2: SE and PPV for the compared ITVs of all 12 standard NCAT datasets with a regularbreathing motion with respect to motion amplitude. * p values are provided for significance of thedependency of SE and PPV for the 1.5cm amplitude relative to (r/t) the 0.5 cm one, and for 2.5cmrelative to 0.5 and 1.5cm.
Regarding SE, the two strategies showing the highest dependency to motion amplitude wereFrame 1 with margins and motion averaged image, although the union of SR-corrected images alsoexhibited significant decrease of SE with increasing motion amplitude. It should be emphasizedhowever that whereas the union of SR-corrected images and Frame 1 with margins resulted in veryhigh SE (>0.9) for all motion amplitudes, in the case of the motion averaged image, the SE decreasedfrom satisfactory values (0.83±0.02) to significantly lower SE values of 0.67±0.03 and 0.60±0.04 formotion amplitudes of 1.5 and 2.5 cm respectively (p=0.02).
Regarding PPV, the only approach that exhibited significantly increased values (from0.39±0.03 to 0.47±0.05 and 0.57±0.05 for 1.5 and 2.5 motion amplitude respectively), was Frame 1with margins, although the absolute PPV values were low (<0.6) even for high amplitude.
The performance hierarchy of the different motion approaches considered was affected byincreasing motion amplitudes (figure 7). For the minimum motion amplitude (0.5 cm, figure 7a) therewas no significant difference between the performance of the use of the motion averaged image, LRimages and upsampled LR images, although there was a trend of superior performance considering themotion averaged image. With increasing motion amplitude, the motion averaged image performancetended to worsen, whereas performance of LR images improved with significantly higher values thanmotion averaged image and upsampled LR images (figures 7b and 7c). Frame 1 with margins led tosignificantly worse performance than all other approaches, except for a motion amplitude of 2.5cm forwhich a similar performance to the motion averaged image was obtained (figure 7c), considering thatthe performance of Frame 1 with margins improved with increasing motion amplitudes (see figures7a-c).
The two results based on motion corrected images led to systematically significantly betterperformance than the other methods for all motion amplitudes (figures 7a-c). Only a small advantage,although not statistically significant (p=0.08) was observed for the SR-corrected over the elastic-corrected images, especially for 1.5 and 2.5 cm motion amplitudes. SR-corrected images led tosignificantly higher performance than all other methods for all motion amplitudes. On the contrary,elastic-corrected images led to significantly higher performance than all methods except with respectto LR images for motion amplitudes higher than 0.5 cm, for which only a non-significant performanceimprovement was observed.
hal-0
0749
010,
ver
sion
1 -
6 N
ov 2
012

Incorporation of motion information for tumour volume definition in PET
12
(a)
(b)
(ppv
05+
se05
)/2Av
erag
eof
SEan
dPP
V
Union of LR images
Union of upsampledLR images
Motion averagedimage
Frame 1 withmargins
Union of elastic-correctedimages
Union of SR-correctedimages
*
*
*
*
(ppv
15+
se1
5)/2
Aver
age
ofSE
and
PPV
Union of LR images
Union of upsampledLR images
Motion averagedimage
Frame 1 withmargins
Union of elastic-correctedimages
Union of SR-correctedimages
*
*
*
hal-0
0749
010,
ver
sion
1 -
6 N
ov 2
012
Incorporation of motion information for tumour volume definition in PET
13
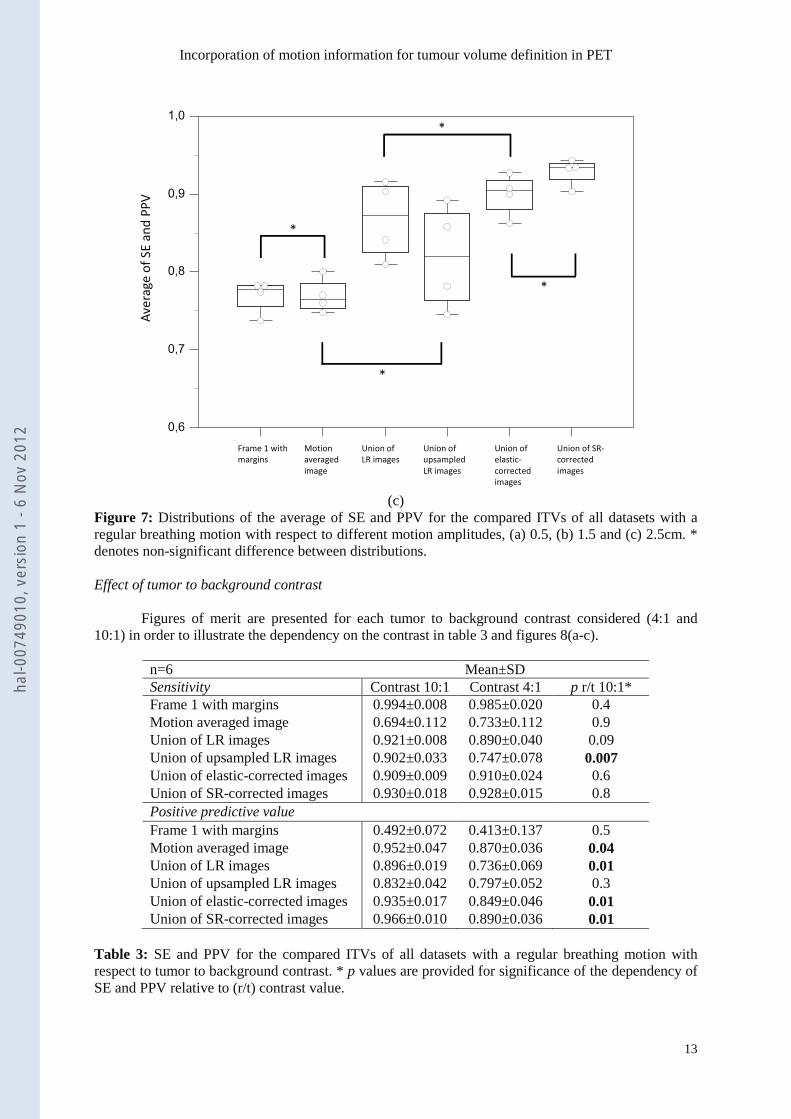
(c)Figure 7: Distributions of the average of SE and PPV for the compared ITVs of all datasets with aregular breathing motion with respect to different motion amplitudes, (a) 0.5, (b) 1.5 and (c) 2.5cm. *denotes non-significant difference between distributions.
Effect of tumor to background contrast
Figures of merit are presented for each tumor to background contrast considered (4:1 and10:1) in order to illustrate the dependency on the contrast in table 3 and figures 8(a-c).
n=6 Mean±SDSensitivity Contrast 10:1 Contrast 4:1 p r/t 10:1*Frame 1 with margins 0.994±0.008 0.985±0.020 0.4Motion averaged image 0.694±0.112 0.733±0.112 0.9Union of LR images 0.921±0.008 0.890±0.040 0.09Union of upsampled LR images 0.902±0.033 0.747±0.078 0.007Union of elastic-corrected images 0.909±0.009 0.910±0.024 0.6Union of SR-corrected images 0.930±0.018 0.928±0.015 0.8Positive predictive valueFrame 1 with margins 0.492±0.072 0.413±0.137 0.5Motion averaged image 0.952±0.047 0.870±0.036 0.04Union of LR images 0.896±0.019 0.736±0.069 0.01Union of upsampled LR images 0.832±0.042 0.797±0.052 0.3Union of elastic-corrected images 0.935±0.017 0.849±0.046 0.01Union of SR-corrected images 0.966±0.010 0.890±0.036 0.01
Table 3: SE and PPV for the compared ITVs of all datasets with a regular breathing motion withrespect to tumor to background contrast. * p values are provided for significance of the dependency ofSE and PPV relative to (r/t) contrast value.
0,6
0,7
0,8
0,9
1,0
code
(pp
v25
+se
25
)/2
1 2 3 4 5 6
Aver
age
ofSE
and
PPV
Union of LR images
Union of upsampledLR images
Motion averagedimage
Frame 1 withmargins
Union of elastic-correctedimages
Union of SR-correctedimages
*
*
*
*
hal-0
0749
010,
ver
sion
1 -
6 N
ov 2
012

Incorporation of motion information for tumour volume definition in PET
14
Regarding SE, only upsampled LR images exhibited significant dependency to decreasingtumor contrast (0.90±0.03 vs. 0.75±0.08, p=0.007). On the contrary, regarding PPV, all methods,except upsampled LR images and Frame 1 with margins, exhibited significantly lower values forlower contrast (p 0.04-0.01) although they also showed decreasing values.
The hierarchy between the methods was not significantly modified by the decreasing contrast,with only the motion averaged image and upsampled LR images resulting in non-significantlydifferent performances for both contrast configurations (figure 8). The performance of LR images wassignificantly reduced with lower contrast (from >0.9 to 0.8- 0.9) but stayed significantly higher thanthe motion averaged image and upsampled LR images. Frame 1 with fixed margins was the worstperforming method, whereas the top two methods were consistently the motion-corrected images, witha significant advantage of the union of SR-corrected images, in both contrast configurations.
(a)
0,6
0,7
0,8
0,9
1,0
code
(pp
v10+
se1
0)/2
1 2 3 4 5 6
Aver
age
ofSE
and
PPV
Union of LR images
Union of upsampledLR images
Motion averagedimage
Frame 1 withmargins
Union of elastic-correctedimages
Union of SR-correctedimages
*
hal-0
0749
010,
ver
sion
1 -
6 N
ov 2
012

Incorporation of motion information for tumour volume definition in PET
15
(b)
Figure 8: Distributions of the average of SE and PPV for the compared ITVs of all datasets with aregular breathing motion with respect to (a) 10:1 and (b) 4:1 contrast. * denotes non-significantdifference between distributions.
3.2 Realistic NCAT cases
This dataset contains three different phantoms, one based on the standard NCAT anatomy with a“simple” heterogeneous lesion (one sphere within another), whereas the two others are based onNCAT phantoms adapted to specific anatomies of real patients, and more realistic lesions in terms ofboth shape and heterogeneity uptake distributions (section 2.1, figure 3). For these three phantoms,both regular and irregular respiratory motion was simulated, with two different amplitudes ofmaximum 1.5 and 2.5 cm respectively.
Regular vs. irregular motion
Values of SE and PPV for these three simulated datasets, for both regular and irregularmotion, are presented in table 4 whereas figure 9(a-b) shows the values of averaging PPV and SE.
n=6 Mean±SDRegular motion Irregular motion p r/t regular*
SensitivityFrame 1 with margins 0.935±0.045 0.940±0.051 0.9Motion averaged image 0.564±0.140 0.509±0.148 0.2Union of LR images 0.837±0.071 0.762±0.030 0.016Union of upsampled LR images 0.826±0.047 0.755±0.046 0.025Union of elastic-corrected images 0.848±0.043 0.787±0.015 0.0039Union of SR-corrected images 0.860±0.066 0.799±0.052 0.07Positive predictive valueFrame 1 with margins 0.618±0.085 0.600±0.048 0.4
(pp
v4+s
e4)/2
Aver
age
ofSE
and
PPV
Union of LR images
Union of upsampledLR images
Motion averagedimage
Frame 1 withmargins
Union of elastic-correctedimages
Union of SR-correctedimages
*
hal-0
0749
010,
ver
sion
1 -
6 N
ov 2
012

Incorporation of motion information for tumour volume definition in PET
16
Motion averaged image 0.912±0.039 0.954±0.044 0.15Union of LR images 0.883±0.052 0.897±0.062 0.4Union of upsampled LR images 0.842±0.060 0.871±0.051 0.3Union of elastic-corrected images 0.935±0.027 0.938±0.028 0.9Union of SR-corrected images 0.964±0.010 0.950±0.033 0.3
Table 4: SE and PPV for the compared ITVs of all datasets 13th to 15th for a regular vs. irregularbreathing motion. * p values are provided for significance of the dependency of SE and PPV relativeto (r/t) regularity of breathing.
(a)
0,6
0,7
0,8
0,9
1,0
coderegular=1
(pp
v+se
)/2
1 2 3 4 5 6
Aver
age
ofSE
and
PPV
Union of LR images
Union of upsampledLR images
Motion averagedimage
Frame 1 withmargins
Union of elastic-correctedimages
Union of SR-correctedimages
*
*
*
*
hal-0
0749
010,
ver
sion
1 -
6 N
ov 2
012

Incorporation of motion information for tumour volume definition in PET
17
(b)
Figure 9: Distributions of the average of SE and PPV for the compared ITVs of all datasets withrespect to (a) regular, and (b) irregular breathing motion. * denotes non-significant difference betweendistributions.
Regarding SE, all methods led to decreased sensitivity with irregular motion, although it wassignificant only for the union of LR (upsampled or not) and the elastic-corrected images (p<0.03). SR-corrected images exhibited also lower sensitivity with irregular motion but the trend was notsignificant (p=0.07). Frame 1 with margins and the motion averaged image led to very low SE values(<0.7), irrespective of regular or irregular motion (p>0.2). On the contrary, although PPV values weresystematically higher, none of the methods exhibited significantly different values for irregularbreathing motion (p>0.1).
The hierarchy between the methods was similar to that observed on the first dataset of standardNCAT phantoms, and was not impacted by the regular nature of breathing motion (figure 9). The bestperformance for regular (0.912±0.032), as for irregular (0.875±0.032) motion was observed for theITVs delineated on SR-corrected images. Although there was a trend of overall slightly higherperformance for the use of SR-corrected over elastic-corrected images, especially for regular motion(0.892±0.021 vs. 0.912±0.032, p=0.2), this trend was not statistically significant (p>0.2). In addition,there was also no statistically significant difference between the performance of Frame 1 with marginsand motion average image, although the latter exhibited a larger spread of values (0.6-0.75) whereasFrame 1 with margins had a much smaller spread with all values between 0.75 and 0.8. Finally, therewas no statistically significant difference between the standard LR and upsampled LR images, with aperformance situated between, on one hand, Frame 1 with margins and motion average image, and onthe other hand, the motion corrected images (0.75-0.9).
Varying motion amplitude
Values of SE and PPV for the three phantoms, for different motion amplitudes, are presentedin table 5 whereas figure 10(a-b) shows the values of averaging PPV and SE.
n=6 Mean±SD
0,6
0,7
0,8
0,9
1,0
coderegular=0
(pp
v+se
)/2
1 2 3 4 5 6
Aver
age
ofSE
and
PPV
Union of LR images
Union of upsampledLR images
Motion averagedimage
Frame 1 withmargins
Union of elastic-correctedimages
Union of SR-correctedimages
*
*
*
*
hal-0
0749
010,
ver
sion
1 -
6 N
ov 2
012

Incorporation of motion information for tumour volume definition in PET
18
Amplitude 1.5 cm Amplitude 2.5 cm p r/t 1.5cm*SensitivityFrame 1 with margins 0.932±0.052 0.943±0.044 0.9Motion averaged image 0.560±0.093 0.513±0.184 1.0Union of LR images 0.794±0.069 0.805±0.067 0.3Union of upsampled LR images 0.790±0.040 0.791±0.076 0.9Union of elastic-corrected images 0.815±0.044 0.820±0.049 0.9Union of SR-corrected images 0.830±0.074 0.830±0.061 0.9Positive predictive valueFrame 1 with margins 0.609±0.030 0.608±0.094 0.6Motion averaged image 0.921±0.046 0.945±0.045 0.3Union of LR images 0.898±0.020 0.883±0.079 0.6Union of upsampled LR images 0.845±0.051 0.868±0.061 0.8Union of elastic-corrected images 0.942±0.026 0.932±0.028 0.6Union of SR-corrected images 0.953±0.028 0.961±0.021 0.7
Table 5: SE and PPV for the compared ITVs of datasets 13th to 15th for a breathing motion amplitudeof 1.5 and 2.5 cm. * p values are provided for significance of the dependency of SE and PPV relativetoamplitude of motion.
(a)
0,6
0,7
0,8
0,9
1,0
codeampli=1
(se+
ppv)
/2
1 2 3 4 5 6
Aver
age
ofSE
and
PPV
Union of LR images
Union of upsampledLR images
Motion averagedimage
Frame 1 withmargins
Union of elastic-correctedimages
Union of SR-correctedimages
*
*
*
hal-0
0749
010,
ver
sion
1 -
6 N
ov 2
012
Incorporation of motion information for tumour volume definition in PET
19
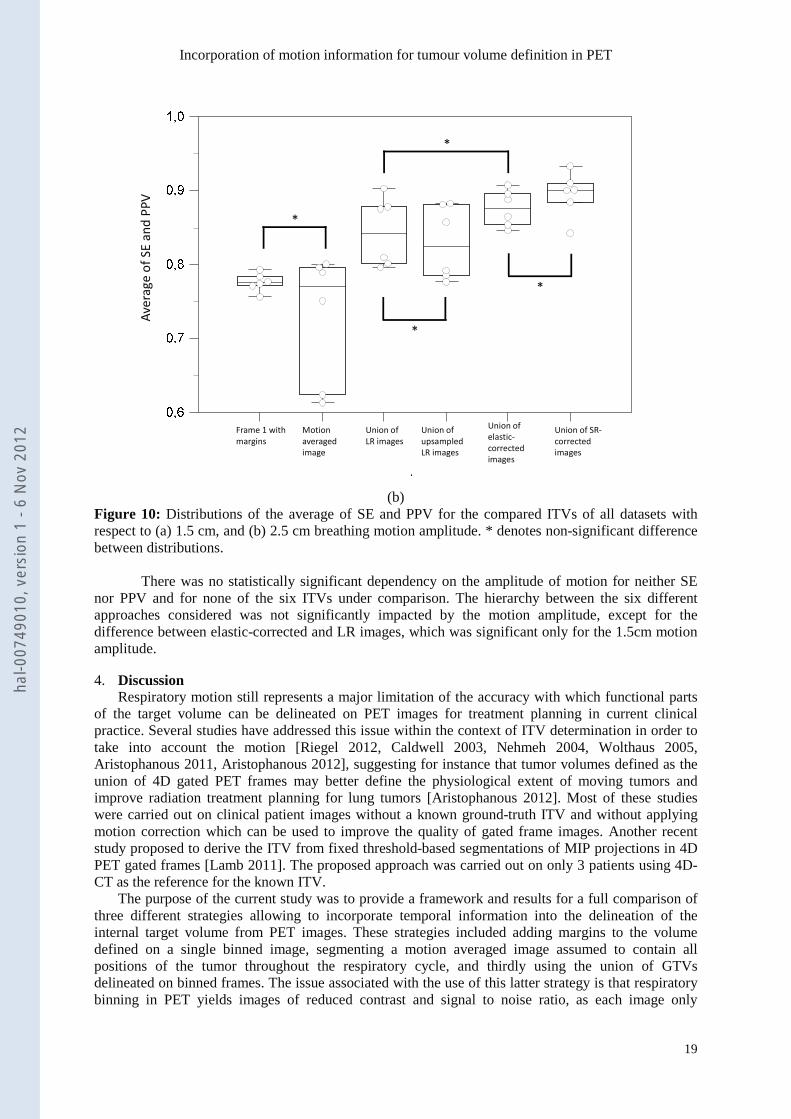
(b)Figure 10: Distributions of the average of SE and PPV for the compared ITVs of all datasets withrespect to (a) 1.5 cm, and (b) 2.5 cm breathing motion amplitude. * denotes non-significant differencebetween distributions.
There was no statistically significant dependency on the amplitude of motion for neither SEnor PPV and for none of the six ITVs under comparison. The hierarchy between the six differentapproaches considered was not significantly impacted by the motion amplitude, except for thedifference between elastic-corrected and LR images, which was significant only for the 1.5cm motionamplitude.
4. DiscussionRespiratory motion still represents a major limitation of the accuracy with which functional parts
of the target volume can be delineated on PET images for treatment planning in current clinicalpractice. Several studies have addressed this issue within the context of ITV determination in order totake into account the motion [Riegel 2012, Caldwell 2003, Nehmeh 2004, Wolthaus 2005,Aristophanous 2011, Aristophanous 2012], suggesting for instance that tumor volumes defined as theunion of 4D gated PET frames may better define the physiological extent of moving tumors andimprove radiation treatment planning for lung tumors [Aristophanous 2012]. Most of these studieswere carried out on clinical patient images without a known ground-truth ITV and without applyingmotion correction which can be used to improve the quality of gated frame images. Another recentstudy proposed to derive the ITV from fixed threshold-based segmentations of MIP projections in 4DPET gated frames [Lamb 2011]. The proposed approach was carried out on only 3 patients using 4D-CT as the reference for the known ITV.
The purpose of the current study was to provide a framework and results for a full comparison ofthree different strategies allowing to incorporate temporal information into the delineation of theinternal target volume from PET images. These strategies included adding margins to the volumedefined on a single binned image, segmenting a motion averaged image assumed to contain allpositions of the tumor throughout the respiratory cycle, and thirdly using the union of GTVsdelineated on binned frames. The issue associated with the use of this latter strategy is that respiratorybinning in PET yields images of reduced contrast and signal to noise ratio, as each image only
(se+
ppv)
/2Av
erag
eof
SEan
dPP
V
Union of LR images
Union of upsampledLR images
Motion averagedimage
Frame 1 withmargins
Union of elastic-correctedimages
Union of SR-correctedimages
*
*
*
*
hal-0
0749
010,
ver
sion
1 -
6 N
ov 2
012
Incorporation of motion information for tumour volume definition in PET
20
contains a fraction of the overall acquired data. We therefore considered the use of two differentmotion correction methods, both incorporated into the image reconstruction step. The first one is basedon the incorporation of elastic transformations into the OPL-EM reconstruction algorithm [Lamare2007b]. The second one incorporates a super-resolution model in the OSL reconstruction algorithm[Wallach 2010]. Both enable the reconstruction of one frame of the binned sequence with the statisticscorresponding to the entire acquisition. The ITVs obtained as the union of the volumes delineated oneach binned image thus reconstructed were compared to those obtained as the union of the volumesdelineated on non-corrected binned frames, reconstructed with two different voxel sizes. Contrary tomost of the studies previously conducted in the subject, all volumes were automatically segmentedusing a previously validated automatic segmentation based on statistical and fuzzy modeling [Hatt2009, 2010, 2011a] instead of fixed thresholding.
In this study we decided not to work with clinical images for which it is difficult to obtain theground-truth. We instead relied on very realistic simulated data generated using the GATE simulationplatform in combination with the NCAT phantom and a previously validated model of the PhilipsGEMINI scanner. We considered both regular and irregular respiratory motion, with realistic motionamplitudes ranging from 0.5 cm to 2.5 cm.
Adding margins to the volume defined on a single binned image led to an ITV much largerthan the true one, covering it almost completely, as measured by a very high SE (>0.9), but alsoassociated with a low PPV (between 0.4 and 0.6). The larger the motion amplitude, the more accuratethis ITV was, suggesting it would be beneficial to adapt margins to the real motion amplitude if such astrategy is chosen. Conversely, the ITV defined as the GTV delineated on the motion averaged imagewas found to be much smaller than the true ITV and the larger the motion amplitude, the less accurateit was, with opposite results relative to what was observed for the first strategy (very high PPV andlow SE). This approach is therefore ill-adapted for the estimation of the real tumor target volumeduring the respiratory cycle, confirming recent conclusions derived from observations on clinicaldatasets [Hanna 2012] and in contradiction to previous findings [Caldwell 2003]. This can beexplained by the blurring effect of respiratory motion; as the tumor spends less time at the extremepositions during breathing, the signal is significantly weaker at these positions, resulting in smallervolumes when delineating them on the motion averaged image.
ITVs defined as the union of GTVs delineated on each respiration binned frame were the mostaccurate ones, in accordance with previous observations on clinical images when comparing 3D vs.4D PET volumes [Aristophanous 2012]. Moreover, their accuracy was found to be independent of themotion amplitude. Using smaller voxels in the reconstruction grid (upsampled LR images) led tosystematically worst results in all cases. This can be explained by the higher level of noise in suchreconstructions, since the statistics are divided by a factor of about 8 (going from 64mm3 to 8mm3
voxels). This has a strong impact on the image quality, especially since individual respiratorysynchronized frames are characterized by low statistical quality. Results were further significantlyimproved by considering motion corrected images over simple respiration synchronized frames. Theunion of GTVs delineated on corrected images were always closer to the true ITV, irrespective ofmotion amplitude, regularity or tumor to background contrast. Although both considered motioncorrection methods led to good results with both SE and PPV around or above 0.9 in most cases, therewas a small but systematic advantage of the SR-correction over the deformation model basedapproach. Thus, defining the tumor target volume as the union of volumes delineated on correctedbinned images seems the most accurate way of incorporating temporal information in the ITVdelineation step for treatment planning.
Our study provided a full comparison of different strategies for the incorporation of respiratorymotion in the PET-based ITV delineation step in RTP. This study was carried out within a simulatedframework only, although as realistic as possible, and validation on even more complex cases andclinical images should now be performed. It should be emphasized that some of the statistical tests hadto be performed on very small samples (n=4 for instance) and/or potentially correlated variables.These results should therefore be interpreted with caution. Another limitation of our study is that weonly investigated the delineation of PET images without considering associatedanatomical/morphological datasets. One should keep in mind that radiotherapy delivery should alsotake into account anatomical information regarding the delineation of tumor volumes in the planningstep, and actual respiratory motion monitoring during the treatment delivery step. Finally, the actual
hal-0
0749
010,
ver
sion
1 -
6 N
ov 2
012

Incorporation of motion information for tumour volume definition in PET
21
dosimetry impact of this increased accuracy, especially on OARs sparing and the definition of tumorsub-volumes for dose painting, redistribution or boosting scenarios [Perrin 2010, Aristophanous 2011]requires further investigation that will form the basis of future studies.
5. ConclusionDifferent strategies of incorporating respiratory motion information during the functional internaltarget volume delineation on PET images for radiotherapy treatment planning were compared within arealistic simulated framework. Our results suggest that the functional tumor internal target volumedefined as the union of functional gross tumor volumes delineated on motion-corrected binned imagesis the closest to the real functional internal target volume with respiratory motion, independently ofmotion regularity, motion amplitude, or tumor to background contrast.
hal-0
0749
010,
ver
sion
1 -
6 N
ov 2
012
Incorporation of motion information for tumour volume definition in PET
22
References
[Aristophanous 2011] M. Aristophanous, J.T. Yap, J.H. Killoran, et al, “Four dimensional positronemission tomography: implications for dose painting of high-uptake regions”, Int J Radiat Oncol BiolPhys 2011;80(3):900-908.
[Aristophanous 2012] M. Aristophanous, R.I. Berbeco, J.H. Killoran, et al, “Clinical utility of 4DFDG-PET/CT scans in radiation treatment planning”, Int J Radiat Oncol Biol Phys 2012;82(1):99-105.
[Ashamalla 2005] H. Ashamalla, S. Rafla, K. Parikh, et al, “The contribution of integrated PET/CT tothe evolving definition of treatment volumes in radiation treatment planning in lung cancer”, Int JRadiat Oncol Biol Phys 2005;63(4):1016-23
[Boucher 2004] L. Boucher, S. Rodrigue, R. Lecomte, F. Benard, “Respiratory gating for 3-dimensional PET of the thorax: feasibility and initial results” J Nucl Med 2004;45(2):214-219.
[Bradley 2004] J. Bradley, W. L. Thorstad, S. Mutic, et al., “Impact of FDG-PET on radiation therapyvolume delineation in non-small-cell lung cancer,” Int J Radiat Oncol Biol Phys 2004;59(1):78-86.
[Caldwell 2003] C.B. Caldwell, K. Mah, M. Skinner, C.E. Danjoux, “Can PET provide the 3D extentof tumor motion for individualized internal target volumes? A phantom study of the limitations of CTand the promise of PET.” Int J Radiat Oncol Biol Phys 2003;55(5):1381-93.
[Chang 2009] G. Chang, T. Pan, F. Qiao, J. W. Clark, O. R. Mawlawi, “Comparison between twosuper-resolution implementations in PET imaging,” Med. Phys 2009;36(4):1370
[de Bari 2011] B. De Bari, N. Sellal, F. Mornex, “4D-CT scan and radiotherapy for hepatocellularcarcinoma: role in the definition of internal target volume (ITV)”, Cancer Radiother. 2011;15(1):43-8.
[Descourt 2006] P. Descourt, W.P. Segars, F. Lamare, et al, “RTNCAT (Real Time NCAT):Implementing Real Time physiological movement of voxellized phantoms in GATE”, in proc. IEEENSS-MIC 2006.
[Green 1990] P. J. Green, “Bayesian reconstructions from emission tomography data using a modifiedEM algorithm,” IEEE Trans. Med. Imag. 1990;9(1):84–93.
[Hanna 2012] G.G. Hanna, J.R. van Sörnsen de Koste, M.R. Dahele, et al, “Defining Target Volumesfor Stereotactic Ablative Radiotherapy of Early-stage Lung Tumours: A Comparison of Three-dimensional (18)F-fluorodeoxyglucose Positron Emission Tomography and Four-dimensionalComputed Tomography.” Clin Oncol (R Coll Radiol). 2012 Aug;24(6):71-80
[Hatt 2009] M. Hatt, A. Turzo, C. Roux, D. Visvikis, “A fuzzy locally adaptive Bayesiansegmentation approach for volume determination in PET”, IEEE Trans Med Imaging 2009;28(6):881-893.
[Hatt 2010] M. Hatt, C. Cheze le Rest, P. Descourt, et al, “Accurate automatic delineation ofheterogeneous functional volumes in positron emission tomography for oncology applications,” Int JRadiat Oncol Biol Phys 2010;77(1):301-308.
[Hatt 2011a] M. Hatt, C. Cheze-Le Rest, N. Albarghach, O. Pradier, D. Visvikis “PET functionalvolume delineation: a robustness and repeatability study”, Eur J. Nucl. Med. Mol. Imaging2011;38(4):663-672.
hal-0
0749
010,
ver
sion
1 -
6 N
ov 2
012
Incorporation of motion information for tumour volume definition in PET
23
[Hatt 2011b] M. Hatt, C. Cheze le Rest, A. van Baardwijk, P. Lambin, O. Pradier, D. Visvikis,“Impact of tumor size and tracer uptake heterogeneity in 18F-FDG PET and CT Non–Small Cell LungCancer tumor delineation”, J Nucl Med 2011;52(11):1690-7.
[Huber 1981] P. J. Huber, “Robust Statistics,” John Wiley & Sons, New York, 1981.
[Jan 2004] S. Jan, G. Santin, D. Strul, et al, “GATE: a simulation toolkit for PET and SPECT” PhysMed Biol 2004;49:4543-4561.
[Jarrit 2006] P.H. Jarritt, K. Carson, D. Visvikis, “The role of PET/CT scanning in radiotherapytreatment planning”, Br J Rad 2006;79:S27-S35.
[Kang 2003] M. G. Kang and S. Chaudhuri, “Super-resolution image reconstruction,” SignalProcessing Magazine, IEEE, vol. 20, no. 3, pp. 19-20, 2003.
[Keall 2006] P. J. Keal, G. S. Mageras, J. M. Balter, et al., “The management of respiratory motion inradiation oncology report of AAPM Task Group 76,” Med Phys 2006;33(10):3874–3900.
[Lamare 2006] F. Lamare, A. Turzo, Y. Bizais, C. Cheze Le Rest, D. Visvikis, “Validation of a MonteCarlo simulation of the Philips Allegro/GEMINI PET systems using GATE,” Phys Med Biol2006;51(4):943-962.
[Lamare 2007a] F. Lamare, T. Cresson, J. Savean, et al, “Respiratory motion correction for PEToncology applications using affine transformation of list mode data.” Phys Med Biol 2007;52(1):121-40.
[Lamare 2007b] F. Lamare et al., “List-mode-based reconstruction for respiratory motion correction inPET using non-rigid body transformations,” Phys Med Biol 2007;52(17):5187-5204.
[Lamb 2011] J.M. Lamb, C. Robinson, J. Bradle, et al, “Generating lung tumor internal target volumesfrom 4D-PET maximum intensity projections” Med Phys 2011;38(10):5732-7.
[Le Maitre 2009] A. Le Maitre, W.P. Segars, S. Marache, et al, “Incorporating patient specificvariability in the simulation of realistic whole body 18F-FDG distributions for oncology applications”,Proceedings of the IEEE 2009;97(12):2026–2038.
[Nehmeh 2004] S.A. Nehmeh, Y.E. Erdi, T. Pan, et al, “Four-dimensional (4D) PET/CT imaging ofthe thorax”, Med Phys. 2004;31(12):3179-86.
[Park 2008] S.J. Park, D. Ionascu, J. Killoran, et al, “Evaluation of the combined effects of target size,respiratory motion and background activity on 3D and 4D PET/CT images.” Phys Med Biol2008;53(13):3661-79.
[Perrin 2010] R. Perrin, P.M. Evans, S. Webb, M. Partridge, “The use of PET images for radiotherapytreatment planning: an error analysis using radiobiological endpoints” Med Phys 2010;37(2):516-31.
[Qiao 2006] F. Qiao, T. Pan, W.J. Clark Jr, O.R. Mawlawi, “A motion-incorporated reconstructionmethod for gated PET studies”, Phys. Med. Biol. 2006;51:3769-3783.
[Riegel 2010] A.C. Riegel, M.K. Bucci, O.R. Mawlawi, et al, “Target definition of moving lungtumors in positron emission tomography: correlation of optimal activity concentration thresholds withobject size, motion extent, and source-to-background ratio”, Med Phys. 2010;37(4):1742-52.
[Segars 2009] W.P. Segars, D.S. Lalush, E.C. Frey, et al, “Improved Dynamic Cardiac Phantom Basedon 4D NURBS and Tagged MRI.” IEEE Trans Nucl Sci. 2009;56(5):2728-2738.
hal-0
0749
010,
ver
sion
1 -
6 N
ov 2
012

Incorporation of motion information for tumour volume definition in PET
24
[Steenbakkers 2006] R.J.H.M. Steenbakkers, J.C. Duppen, I. Fitton, et al, “Reduction of observervariation using matched CT-PET for lung cancer delineation: a three dimensional analysis,” Int JRadiat Oncol Biol Phys 2006;64(2):435-448.
[van Baardwijk 2007] A. van Baardwijk, G. Bosmans, L. Boersma, et al., “PET-CT–Based Auto-Contouring in Non–Small-Cell Lung Cancer Correlates With Pathology and Reduces InterobserverVariability in the Delineation of the Primary Tumour and Involved Nodal Volumes,” Int J RadiatOncol Biol Phys 2007;68(3):771-778.
[van Loon 2011] J. van Loon, A. van Baardwijk, L. Boersma, M. Ollers, P. Lambin, D. De Ruysscher,“Therapeutic implications of molecular imaging with PET in the combined modality treatment of lungcancer.”, Cancer Treat Rev. 2011;37(5):331-43.
[Walter 1999] K. Walter, S. Schmidt, N. Licht, C. Nieder, B. Motaref, D. Hellwig, et al., “18F-deoxyglucose positron emission tomography (FDG-PET) for the planning of radiotherapy in lungcancer: high impact in patients with atelectasis,” Int J Radiat Oncol Biol Phys 1999;44(3):593-597.
[Wallach 2010] D. Wallach, F. Lamare, C. Roux, D. Visvikis, “Comparison between reconstruction-incorporated super-resolution and super-resolution as a post-processing step for motion correction inPET” , in proc. IEEE NSS/MIC 2010:2294-2297.
[Wallach 2012] D. Wallach, F. Lamare, G. Kontaxakis, D. Visvikis, “Super-resolution in respiratorysynchronized positron emission tomography” IEEE Trans Med Imaging 2012;31(2):438-48.
[Wolthaus 2005] J.W. Wolthaus, M. van Herk, S.H. Muller, et al. “Fusion of respiration-correlatedPET and CT scans: correlated lung tumour motion in anatomical and functional scans”, Phys Med Biol2005;50(7):1569-83.
hal-0
0749
010,
ver
sion
1 -
6 N
ov 2
012