Embed Size (px)
Citation preview

C O V E R S H E E T
SEC Registration Number
7 7 8 2 3
C O M P A N Y N A M E
C I T Y L A N D D E V E L O P M E N T
C O R P O R A T I O N
PRINCIPAL OFFICE ( No. / Street / Barangay / City / Town / Province )
2 / F C i t y l a n d C o n d o m i n i u m 1 0 ,
T o w e r I , 1 5 6 H . V . D e l a C o s t a
S t r e e t , M a k a t i C i t y
Form Type Department requiring the report Secondary License Type, If Applicable
2 0 - I S M S R D Not Applicable
C O M P A N Y I N F O R M A T I O N
Company’s Email Address Company’s Telephone Number Mobile Number
[email protected] 893-6060 N/A
No. of Stockholders Annual Meeting (Month / Day) Fiscal Year (Month / Day)
668 (as of April 15, 2018) 1st Tuesday of June December 31
CONTACT PERSON INFORMATION
The designated contact person MUST be an Officer of the Corporation
Name of Contact Person Email Address Telephone Number/s Mobile Number
RUDY GO [email protected] 893-6060 N/A
CONTACT PERSON’S ADDRESS
3F Cityland Condominium 10, Tower II, 154 H.V. Dela Costa Street, Makati City
NOTE 1 : In case of death, resignation or cessation of office of the officer designated as contact person, such incident shall be reported to the Commission within thirty (30) calendar days from the occurrence thereof with information and complete contact details of the new contact person designated. 2 : All Boxes must be properly and completely filled-up. Failure to do so shall cause the delay in updating the corporation’s records with the Commission and/or non-receipt of Notice of Deficiencies. Further, non-receipt of Notice of Deficiencies shall not excuse the corporation from liability for its deficiencies.

CIIYTAND
DEVELOPMENT
CORPORATION
ryoTrcE oF AH?{UAL STOCKHOLDER$' qtEETlirc
NOTICE lS HEREBY GIVEN that flre annual shckholders rneeting of CITYLAHB IIEVELOPMEHTCORPORATION will be held at the 3F Cltyland Condominium 10 Tower tt, 154 H,V. Dela Costa Street, MakatiCity, on June 5, 2018 at 4:00PM with the following:
CITYLAND
1.
2.e
4.(A
7.
L
AG.ENDA
Callto Order
Proof of Notice of fuleeting
Determination of Quorum and Rules of Conduct and Proced
Approvalof Minutes of Annual Stockholders' Meeting
Presidents Report
Election of Directors (includirq lndeperdent Dirccto$)Appointnent of the Extemal AuditorsApprovalof the Board Resolution dated May 2,2018 regarding the following:
a. Declaration of five percent (5%) stock dividends out of the unappropriated retained earnings whichwill come from increase in authorized capital stock;
b. lncrease of authorized capital stock from 4,000,000,000 shares to 5,000,000,000 shares with parvalue of Php1.00 per share; and
c. Amendment of Articles of lncorporation to increase the authorized capital stock to 5,000,000,000shares with par value of Php1.00 per share.
9. Confirmation of all acts of the Board of Directors for the period covering January 1, 2017 throughDecember 31,2017 adopted in the ordinary course of business, including but not limited to:
a, Approval of investments;
b. Treasury matters related to opening of accounts and bank transactions;
c. Appointment of signatories and amendments thereof; and
d. Approval of Annual Report and related Financial Statements
10. Other matters which may be raised by the body
11. Adjournment
For the purpose of the meeting, only stockholders of record as of May 7 ,2A18 are entitled to attend and vote inthe said meeting.
Copies of the minutes of the Annual Stockholders' Meeting held on June 6, 2017 will be available upon request,
Makati City, May 7 ,2018
FOR THE OF DIRECTORS
ATTY.
#o*^i' llCorporate
*We are not soliciting your proxy. However, if you would be unable to attend the meeting but like to be representedthereat, you may accomplish the enclosed proxy forrn and submit the same to the Affice of the Corporate Secretary at 3/FCityland Condominium 10 Tower l, 156 H.V. Dela Costa Street, Makati City. Validation of proiles shall be held onMay 29, 2018 at the Office of the Secretary. Thank you.
2/F CITYLAND CONDOMINIUM 1 O TOWERI, 156 H.V. DELA COSTA STREET, MAKATI 1226
P0 BOX 5000 N/AKATI 1290, TEL. # : 893-60-60 FAX # : 892-7656 www.cityland.net

EXPLANATION OF AGENDA ITEMS REQUIRING STOCKHOLDERS' APPROVAL
ln accordance with Arfrcie Vll - Stockholders' Meeting of the Company's Amended By-Laws, the annuaimeeting of the stockholders shall be held every 1st Tuesday of June of each calendar year at four o'clockin the afternoon, when the Board of Directors shall be elected by plurality of votes by ballot system orviva voce.
Item 1: Call to Order
The Chairman of the Board of Directors will formally call the meeting to order.
Item 2: Proof of Notice of Meetinq
Rationale: To inform the stockhalders that the notice of meeting were sent to all stockholders in
accordance with the Carporation Code of the Philippines and Company's Amended By-laws.
The Corporate Secretary (or Secretary) wiil show proof of the sending of the required notice of the
meeting. The Secretary will also certify the date of sending of the notices of the meeting to all the
stockholders, Written notice of the annual meeting of the Company shall be sent to each registered
stockholders at least fifteen (15) days prior to the date of such meeting. Waiver of such notice may onlybe made in writing.
Item 3: Determination of Quorum and Votinq Procedures
Rationale:Ta determinethe presence of a quorumforthe 2A18 Annual Stockholders' Meeting (ASM) andta inform the stockltolders of fhe voting procedures for the agenda items to be discusse d in the ASM.
The Secretary will inform the body and attest the existence of a quorum in the meeting. As stated in the
Company's Amended By-Laws, the stockholders' meeting shall be competent to decide any matter ortransact any business, unless a rnajority of the subscribed capital stock is present or represented
thereat, except in those cases wherein the Corporation Laws requires the affirmative vote of a
greater proportion. The number of shares represented in the meeting is validated by a third-party stocktransfer agent.
Votinq Procedures
Each common share shall be entitled to one vote with respect to all matters to be taken up during the
annual stockholders' meeting. ln accordance with the Company's Amended By-Laws, voting upon ailquestions at all meetings of the stockholders shall be by shares of stock and not per capital.
At least a majority of the outstanding capital stock of the Company is required for the election of directors
and approval of the following matters:
a. Minutes of the previous Annual Stockholders' Meeting
b. Appointment of external auditor
c. Acts of the management and of the Board of Directors relative to Annual Report and related
financial statements.
The method by which votes will be counted through viva voce. The "Ayes" and "Nayes" are requested to
raise their hands during the ASM. The Secretary will count the number of votes approving, dissenting
and abstaining. The Company also has an independent party who willvalidate the votes counted by the
Secretary.
The voting procedures are discussed in the Definitive lnformation Statement.

Item 4: Approval of Minutes of plevious Annual stockholders' Meetinq
Rationale: Ta abtain from the sfockho/ders the approvat af the minutes of the ASM held tast June 6, 2017.
The Chairman will request the Secretary to read the minutes of the said meeting, The minutes of ASMheld last June 6, 2017 are posted in the Company's website {,,i,. ', i,,,1:q.., '_,.1., ). The results of theprevious ASM are hereby presented to the stockholders for approval.
Item 5: President's Report
Rationale:To inform the stockhalders of the Company's financiat pasitian and performance.
The Secretary will read the President's Report on the Company's financiai position and performance asof and for the year ended December 31,2A17 including any future pro.lects of the Company. The detaileddiscussion of the financial position and resulis of operations are presented in the Definitive InformationStatement. The audited financial statements are duly submitted to the Philippine Siock Exchange,securities and Exchange commission and the Bureau of lnternai Revenue.
Representatives of SyciB Gorres Veiayo & Co., the Company's external auditors for the year 2017, areinvited in the ASM to respond to queries concerning the audited financial statements.
Item 6: Election of Directors (inciudinq lndependent Directors)
Rationale: To give the stocklto/ders the opportunity to elect the Company's Board of Directars inaccordance with Section 24 of the Corporation Code and the Company's Amended By-Laws.
ln accordance with the Company's Amended By-Laws, the general management of the Corporation, shallbe vested in a Board of nine (9) directors, at least two i2) of whom shall be independent directors, whoare stockholders and who shall be elected annually by the stockholders owning or representing themajority of the subscribed capitalstock of the term of one (1)year and shallserve untilthe election andqualification of their successors.
A nomination of independent directors shall be conducted by the Nomination Committee prior to thestockholders' rneeting, All recommendations shall be signed by the norninating stockholders togetherwith the acceptance and conformity by the would-be nominees^ The Committee shall pre-screen thequalifications and prepare a final list of all candidates and put in place screening policies and parametersto enable it to effectively review the qualifications of the nominees for independent directors.
The names of the individuals who have been duly nominated as members of the Board of Directors ofthe Company, including independent directors shall be presented during the ASM. The qualifications andprofiles of the nominees are discussed in the Definitive lnformation Statement. The stockholders whonominated the independent directors and other members of the Board are also disclosed in the DefinitiveI nformation Statement.
Item 7: Appointment of External Auditors
Ratianale: To appoint external auditars who will provide an opinion as fo fhe farmess of the financialsfafemenfs of the Company and assess the adequacy of the internalconfrols implemented by theCompany.
The Audit and Risk Commitlee will recommend to the Board of the Directors the appointment of externalauditors who will provide an opinion on the fairness of the financial statements of the Company andassess the adequacy of internal controls implemented by the Company. The Audit and Risk Committee,

in its meeting heid on March 26,2018, recommended io the Board of Directors the re-appointment ofSycip Gorres Velayo & Co" as the Company's external auditors for the calendar year 2018.
The appointmenl of ihe externai auditors will be presented to the stockholders for approval.
item 8: Aoproval of thq Board Resolution dated May 2, 2018:
Rationale: ln accordance with the Corporation Code. the following matfers shall be presenled to thesfockholders for appravalof al leasl two-thirds {U3) of the outstanding capital stock:
The Board of Directors, in its meeiing held on May 2,2A18, approved the following:
a. Declaration of Stock Dividends
The Board of Directors approved the declaration of five percent (5%) stock dividends out of the
unappropriated retained earnings which will come from increase in authorized capital stock.Record date of the stock dividend shall be fixed by the Securities and Exchange Commissionafter clearance and approval,
b. increase of Authorized Capital Stock
The Board of Director"s approved the increase of the Company's authorized capital stock from
4,000,000,000 shares to 5,000,000,000 shares with par value of Php1.00 per share.
c. Amendment of Articles of lncorporation
The Board of Directors approved the arnendment of Articles of lncorporation to increase the
authorized capital stock to 5,000,000,000 shares with par value of Php1.00 shares.
Item 9: Confirmation qf all acts of the tsoard of Directors for the period coverinq January 1, 2017 throuqhDecember 31 , 2017 adopted in the ordinary course of business
Rationale: To obtain from the sfockholders confirmation of all the acts of the Board of Directars for theperiod covering January 1 , 2A17 through December 31, 2017.
Confirmation of all the acts of the Board of Directors will be requested from the stockholders" Allsignificant transactions required to be submitted to the Securities and Exchange Commission throughSEC Form 17-C and to the Philippine Stock Exchange can be accessed on the Company's website
{http :l/cityland.neU).
Item 10: Other Matters which may be raised bv the body
Rationale: Ta give the stockholders fhe opportunity lo ask quesfions and raise concerns.
The Chairman will ask the stockholders any other matter or business which he or she would like to presentin the ASM. Such items will be discussed in the 2018 ASkl
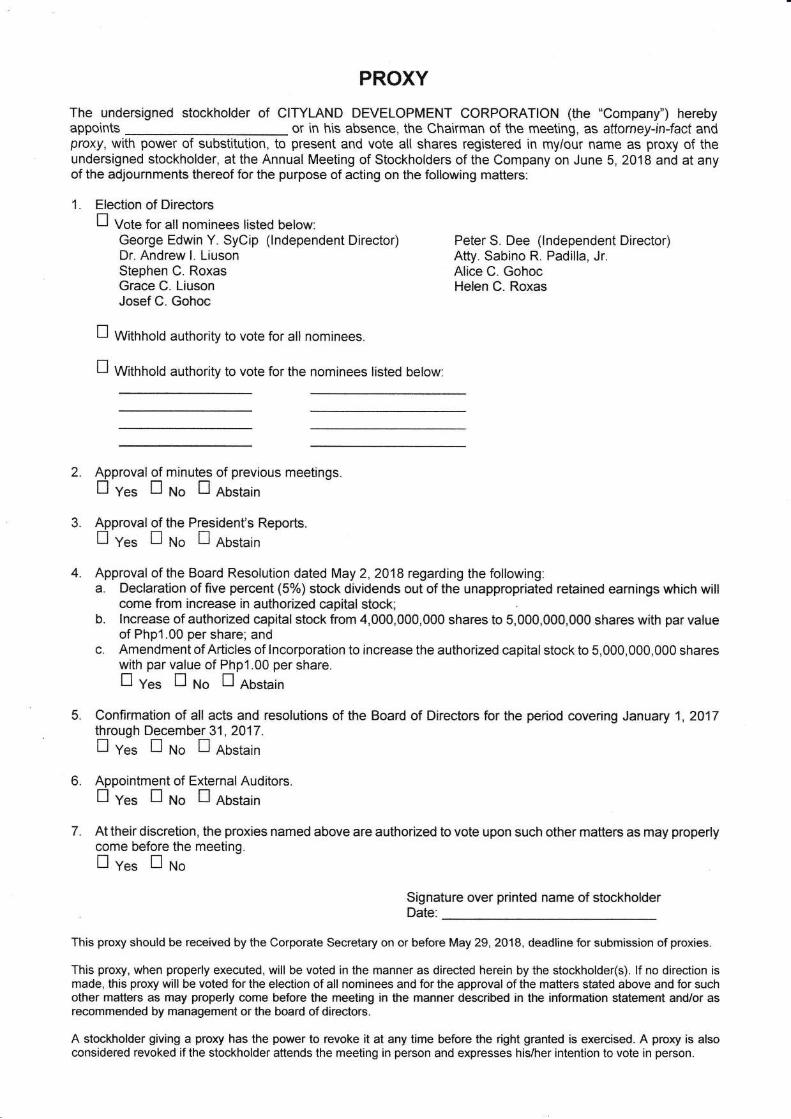
PROXY
The undersigned stockholder of CITYLAND DEVELOPMENT CORPORATION (the "Company") herebyappoints or in his absence, the Chairman of the meeting, as afforney-in-fact andproxy, with power of substitution, to present and vote all shares registered in my/our name as proxy of theundersigned stockholder, at the Annual Meeting of Stockholders of the Company on June 5, 2018 and at anyof the adjournments thereof for the purpose of acting on the following rnatrers:
1. Election of Direetorsn Vot" for all nominees listed below;
George Edwin Y. SyCip (lndependent Director)Dr. Andrew l. LiusonStephen C. RoxasGrace C. LiusonJosef C. Gohoc
Peter S. Dee (lndependent Director)Atty. Sabino R. Padilla, Jr.Alice C. GohocHelen C. Roxas
tr
n
Withhold authority to vote for all nominees.
Withhold authority to vote for the nominees listed below:
2. Approvalof minutes of previous meetings.I y*" f] ruo fl Abrr"in
4.
6.
3. Approval of the President's Reports.n y", n ruo n no.t in
Approval of the Board Resolution dated May 2,2018 regarding the following:a. Declaration of five percent (5%) stock dividends out of the unappropriated retained earnings which will
come from increase in authorized capital stock;b. lncrease of authorized capital stock from 4,000,000,000 shares to 5,000,000,000 shares with par value
of Php1.00 per share; andc. Amendment of Artictes of lncorporation to increase the authorized capital stock to 5,000,000,000 shares
with par value of Php'1.00 per share.I y", n uo n Rb"trin
Confirmation of all acts and resolutions of the Board of Directors for the period covering January 1,2017through December 31,2017 "
n y". n No n Ao.trin
Appointment of External Auditors.I y", fl no n Rortrin
7. At their discretion, the proxies named above are authorized to vote upon such other matters as may properlycome before the meeting.[v". [ruo
Signature over printed name of stockholderDate:
This proxy should be received by the Corporate Secretary on or before May 29, 2018, deadline for submission of proxies.
This proxy, when properly executed, will be voted in the manner as directed herein by the stockholde(s). lf no direction ismade, this proxy will be voted for the election of all nominees and for the approval of the matters stated above and for suchother maters as n'!ay properly corne before the rneeting in the rnanner describe<l in the information statement andlor asrecommended by management orthe board of directors.
A stockhotder giving a proxy has the power to revoke it at any time before the right granted is exercised" A pr-oxy is alsoconsidered revoked if the stockholder attends the meeting in person and expresses his/her intention to vote in person.
5.

SECURITIES AND EXCHANGE COMMISSION
SEC FORM 2O-ISINF'ORMATION STATEMENT
INFORMATION STATEMENTOF THE SECURITIES
L Check the appropriate box:Preliminary Infbrrnation StatementDe t'i niti ve I nlbrmation Statement
Stock ExchangePhilippine Stock Exchange
I]lxl
2. Name of the Registrant as specified in its chafier Cityland Development Corporation
i. Makati City, PhilippinesProvince" countr,y- or otlrer jurisdiction of incorporation or organization
4. SEC ldentification Nunrber 77823
5. BIR Tax Identification Code 000-527-103
8.
6. 2/F Cityland Condominium l0 Tower l, 156 H.V. Dela CostaStreet, Makati CityAddress of principal office
7. Registrant's telephone number, including area code (632) 893-6060
Title of Each ClassUnclassilied Common Shares
Date, time and place of the meeting of security holders
Date - June 5, 2018Time - ,l:00pmPlace - 3F Cityland Condominium l0 Tower II, 154 H.V. Dela Costa Street,
Makati City, Philippines
Approximate date on rr-hich the Inlbnnation Statement is to be first sent or given to securitl' holdersMay 15,2018
Securities registered pursuant to Sections 8 and 12 of the Code or Sections 4 and 8 of the RSA(infonnation on number of shares and amount of debt is applicable only to corporate registrants):
1226Postal Code
Nurnber of Shares Outstanding3,938,063,701
Title of Each ClassUnclassified Common Shares
9.
10.
Are any or all ofregistrant's securities listed on a Stock Exchange?
Yes x No
If yes, disclose the name of such stock exchange and the class of securities listed therein:
IL
I-ATIONTllrtE:
MAY 0I 2018

2
INFORMATION REQUIRED IN INFORMATION STATEMENT
A. GENERAL INFORMATION
I. Date, Time and Place of Meeting of Security Holders
Date - June 5, 2018
Time - 4:00 pm
Place - 3F Cityland Condominium 10 Tower II, 154 H.V. Dela Costa Street,
Makati City, Philippines
Principal - 2/F Cityland Condominium 10 Tower I, 156 H.V. Dela Costa Street,
Office Makati City, Philippines
Approximate date on which the Information Statement is to be first sent or given to security holders
May 15, 2018.
II. Dissenters’ Right of Appraisal
Under the Corporation Code, a dissenting stockholder who has voted against a proposed corporate
action, shall have the right of appraisal or the right to demand payment of the fair value of his shares
only in the following instances:
1. Any amendment to the Articles of Incorporation which has the effect of changing or restricting
the rights of any stockholder or class of shares, or of authorizing preferences in any respect
superior to those of the outstanding shares of any class, or of extending or shortening the term of
corporate existence;
2. Sale, lease, exchange, transfer, mortgage, pledge or other disposition of all or substantially all of
the corporate property and assets;
3. Merger or consolidation; and
4. Investment in another corporation, business or for any purpose other than the primary purpose
for which the corporation was organized.
Statutory procedures to be followed by the dissenting security holders in order to perfect such rights:
1. The appraisal right may be exercised by any stockholder who shall have voted against the
proposed corporate action, by making a written demand on the corporation within thirty (30)
days after the date on which the vote was taken for payment of the fair values of his shares;
provided, that failure to make the demand within such period shall be deemed a waiver of the
appraisal right. If the proposed corporate action is implemented or affected, the corporation shall
pay to such stockholder, upon surrender of the certificate(s) of stock representing his shares, the
fair value thereof as of the day prior to the date on which the vote was taken, excluding any
appreciation or depreciation in anticipation of such corporate action.
2. If within a period of sixty (60) days from the date the corporate action was approved by the
stockholders, the withdrawing stockholder and the corporation cannot agree on the fair value of
the shares, it shall be determined and appraised by three (3) disinterested persons, one of whom
shall be named by the stockholder, another by the corporation, and the third by the two thus
chosen. The findings of the majority of the appraisers shall be final, and their award shall be
paid by the corporation within thirty (30) days after the award is made; provided, further, that
upon payment by the corporation of the agreed or awarded price, the stockholder shall forth with
transfer his shares to the corporation.
There is no matter to be acted upon at the Annual Stockholders’ Meeting of the Registrant which
would fall under any of the foregoing instances of appraisal.
III. Interest of Certain Persons in or Opposition to Matters to be Acted Upon
1. No person who has been a director or officer of the Registrant, nor a nominee for election
as a director of the Registrant, nor any of their associates have a substantial interest in any

3
matter to be acted upon at the Annual Stockholders’ Meeting, other than the election of
directors for the fiscal year 2018.
2. No director has informed the Registrant in writing that he intends to oppose any action to be
taken at the Annual Stockholders’ Meeting.
B. CONTROL AND COMPENSATION INFORMATION
IV. Voting Securities and Principal Holders Thereof
1. The Registrant has 3,938,063,701 unclassified common shares issued and outstanding (excluding
treasury shares which total to 1,937,947) as of March 31, 2018. Each common share shall be
entitled to one vote with respect to all matters to be taken up during the Annual Stockholders’
Meeting.
2. The record date for determining stockholders entitled to notice and to vote during the Annual
Stockholders’ Meeting and also to this information statement is on May 7, 2018.
3. In the election of directors, the number of votes to which each stockholder is entitled shall be
equal to the number of shares he owns multiplied by the number of directors to be elected. All
stockholders shall have cumulative voting rights. Each stockholder may vote such number of
shares for as many persons as there are directors to be elected or he may cumulate said shares
and give one candidate as many votes as the number of directors to be elected multiplied by the
number of his shares shall equal, or he may distribute them on the same principle among as many
candidates as he shall see fit.
4. Security Ownership of Record and Beneficial Owner and Management
a. Security Ownership of Record and Beneficial Owner owning more than 5% of the
outstanding capital stock of the Registrant as of March 31, 2018:
Title of Class
Name, Address &
Relationship with Issuer
Beneficial Owner & Relationship
Citizenship
No. of Shares
Held
%
Unclassified
common shares
Cityland, Inc. *
3/F Cityland Condominium
10 Tower I,
156 H.V. Dela Costa Street,
Makati City
- principal stockholder
Filipino 2,007,461,023 50.98%
Unclassified
common shares
Stephen C. Roxas
1392 Campañilla St.,
Dasmariñas Village, Makati
- Director / Chairman of
Executive Committee
Jefcon, Inc.
Obadiah Inc.
Corporation of
which record owner
is a controlling
shareholder
Filipino 232,576,751 5.91%
Unclassified
common shares
Grace C. Liuson
2072 Lumbang cor. Cypress
Dasmariñas Village, Makati
- Director / Vice Chairman
of the Board
-N.A.- Filipino 210,117,387 5.34%
*The following directors direct the voting or disposition of the shares held by Cityland, Inc. (Beneficial
Owners):
Name Position
Stephen C. Roxas Chairman of the Board
Andrew I. Liuson Director / Vice Chairman of the Board
Grace C. Liuson Director / Deputy Vice Chairman of the Board
Josef C. Gohoc President / Director
Peter S. Dee Independent Director
Alice C. Gohoc Director
Helen C. Roxas Director
b. No change of control in the corporation has occurred since the beginning of its fiscal year.
4
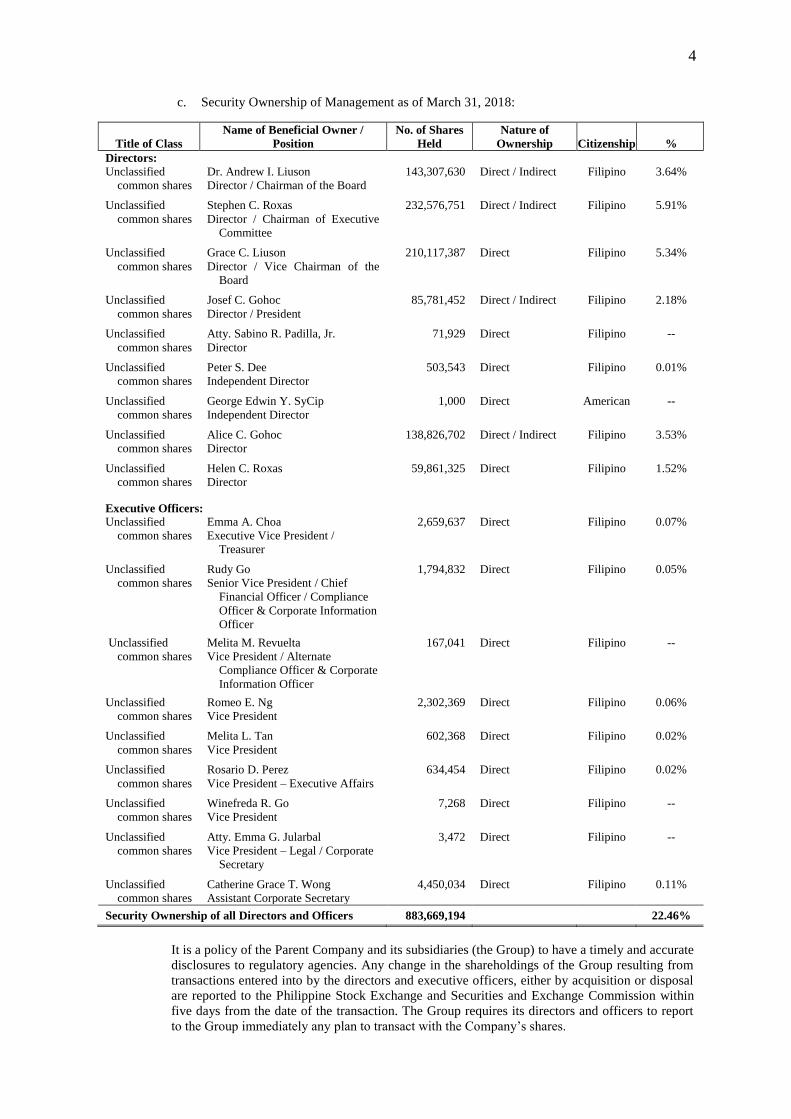
c. Security Ownership of Management as of March 31, 2018:
Title of Class
Name of Beneficial Owner /
Position
No. of Shares
Held
Nature of
Ownership Citizenship %
Directors: Unclassified
common shares
Dr. Andrew I. Liuson
Director / Chairman of the Board
143,307,630 Direct / Indirect Filipino 3.64%
Unclassified
common shares
Stephen C. Roxas
Director / Chairman of Executive
Committee
232,576,751 Direct / Indirect Filipino 5.91%
Unclassified
common shares
Grace C. Liuson
Director / Vice Chairman of the
Board
210,117,387 Direct Filipino 5.34%
Unclassified
common shares
Josef C. Gohoc
Director / President
85,781,452 Direct / Indirect Filipino 2.18%
Unclassified
common shares
Atty. Sabino R. Padilla, Jr.
Director
71,929 Direct Filipino --
Unclassified
common shares
Peter S. Dee
Independent Director
503,543 Direct Filipino 0.01%
Unclassified
common shares
George Edwin Y. SyCip
Independent Director
1,000 Direct American --
Unclassified
common shares
Alice C. Gohoc
Director
138,826,702 Direct / Indirect Filipino 3.53%
Unclassified
common shares
Helen C. Roxas
Director
59,861,325 Direct Filipino 1.52%
Executive Officers: Unclassified
common shares
Emma A. Choa
Executive Vice President /
Treasurer
2,659,637 Direct Filipino 0.07%
Unclassified
common shares
Rudy Go
Senior Vice President / Chief
Financial Officer / Compliance
Officer & Corporate Information
Officer
1,794,832 Direct Filipino 0.05%
Unclassified
common shares
Melita M. Revuelta
Vice President / Alternate
Compliance Officer & Corporate
Information Officer
167,041 Direct Filipino --
Unclassified
common shares
Romeo E. Ng
Vice President
2,302,369 Direct Filipino 0.06%
Unclassified
common shares
Melita L. Tan
Vice President
602,368 Direct Filipino 0.02%
Unclassified
common shares
Rosario D. Perez
Vice President – Executive Affairs
634,454 Direct Filipino
0.02%
Unclassified
common shares
Winefreda R. Go
Vice President
7,268 Direct Filipino --
Unclassified
common shares
Atty. Emma G. Jularbal
Vice President – Legal / Corporate
Secretary
3,472 Direct Filipino --
Unclassified
common shares
Catherine Grace T. Wong
Assistant Corporate Secretary
4,450,034 Direct Filipino
0.11%
Security Ownership of all Directors and Officers 883,669,194 22.46%
It is a policy of the Parent Company and its subsidiaries (the Group) to have a timely and accurate
disclosures to regulatory agencies. Any change in the shareholdings of the Group resulting from
transactions entered into by the directors and executive officers, either by acquisition or disposal
are reported to the Philippine Stock Exchange and Securities and Exchange Commission within
five days from the date of the transaction. The Group requires its directors and officers to report
to the Group immediately any plan to transact with the Company’s shares.

5
For the past five (5) years, there were no trading by insiders. The Group continues to adhere with
existing government regulations.
d. The Registrant knows no person holding more than 5% of common shares under a voting
trust or similar agreement.
e. Percentage of ownership as of March 31, 2018:
Nationality
Number of shares
Percentage
of ownership
Local-owned shares (Filipino) 3,851,647,965 97.81
Foreign-owned shares (Non-Filipino) 86,415,736 2.19
Total 3,938,063,701 100.00
V. Directors and Executive Officers
1. Identify Directors, Including Independent Directors, and Executive Officers
The following are the Directors and Executive Officers of the Company for the year 2017:
Name Citizenship Position(s) Held with
the Registrant
Term
of
Office
(Year)
Period of Service Age Family Relationship
Dr. Andrew I.
Liuson
Filipino Director/ Chairman of
the Board
1
09/25/79 to present
12/13/17 to present
73 Husband of Grace
Liuson; brother-in-
law of Stephen C.
Roxas and Alice C.
Gohoc
Stephen C. Roxas
Filipino Director/
Chairman of the
Executive Committee
1
09/25/79 to present
07/01/97 to present
76
Husband of Helen
Roxas; brother of
Grace Liuson and
Alice Gohoc; brother-
in-law of Dr. Andrew
I. Liuson; and uncle
of Josef C. Gohoc
Grace C. Liuson
Filipino Director /
Vice Chairman of the
Board
1 09/25/79 to present
01/05/18 to present
72
Wife of Dr. Andrew
Liuson; sister of
Stephen Roxas and
Alice Gohoc; aunt of
Josef C. Gohoc; and
sister-in-law of Helen
C. Roxas
Josef C. Gohoc Filipino Director/
President
1 01/14/11 to present
02/01/11 to present
48 Son of Alice Gohoc;
and nephew of
Stephen Roxas, Helen
C. Roxas, Grace
Liuson and Dr.
Andrew I. Liuson
Atty. Sabino R.
Padilla Jr.
Filipino Director 1 06/2006 to present 82 ---
Peter S. Dee Filipino Independent Director 1 10/79 to present
76 ---
Dr. Washington
SyCip
Filipino-
American
Independent Director /
Chairman of the Board
1 04/97 to 10/7/17
06/13/01 to 10/7/17
96 ---
George Edwin Y.
SyCip
American Independent Director 1 12/13/17 to present 61 ---

6
Name Citizenship Position(s) Held with
the Registrant
Term
of
Office
(Year)
Period of Service Age Family Relationship
Alice C. Gohoc Filipino Director 1 09/06/96 to present 75
Sister of Stephen
Roxas and Grace
Liuson; mother of
Josef C. Gohoc; and
sister-in-law of Dr.
Andrew Liuson and
Helen C. Roxas
Helen C. Roxas Filipino Director 1 09/25/79 to present
68 Wife of Stephen
Roxas; sister-in-law
of Grace C. Liuson,
Dr. Andrew I.
Liuson and Alice C.
Gohoc
Emma A. Choa Filipino Executive Vice
President / Treasurer
1 01/01/15 to present
02/01/11 to present
57
---
Rudy Go Filipino Senior Vice President/
Chief Financial
Officer/
Compliance Officer &
Corporate Information
Officer
1 01/01/15 to present 58
---
Melita M. Revuelta Filipino Vice President /
Alternate Compliance
Officer & Alternate
Corporate Information
Officer
1 01/16/08 to present
01/01/15 to present
59
---
Romeo E. Ng Filipino Vice President 1 01/10/05 to present 56 ---
Melita L. Tan Filipino Vice President 1 02/21/04 to present 57
---
Rosario D. Perez Filipino Vice President-
Executive Affairs
1 02/09/17 to present 58 ---
Atty. Emma G.
Jularbal
Filipino Vice President – Legal
Affairs / Corporate
Secretary
1 07/2001 to present
07/1997 to present
62 ---
Catherine Grace T.
Wong
Filipino Assistant Corporate
Secretary
1 07/01/13 to present 60 ---
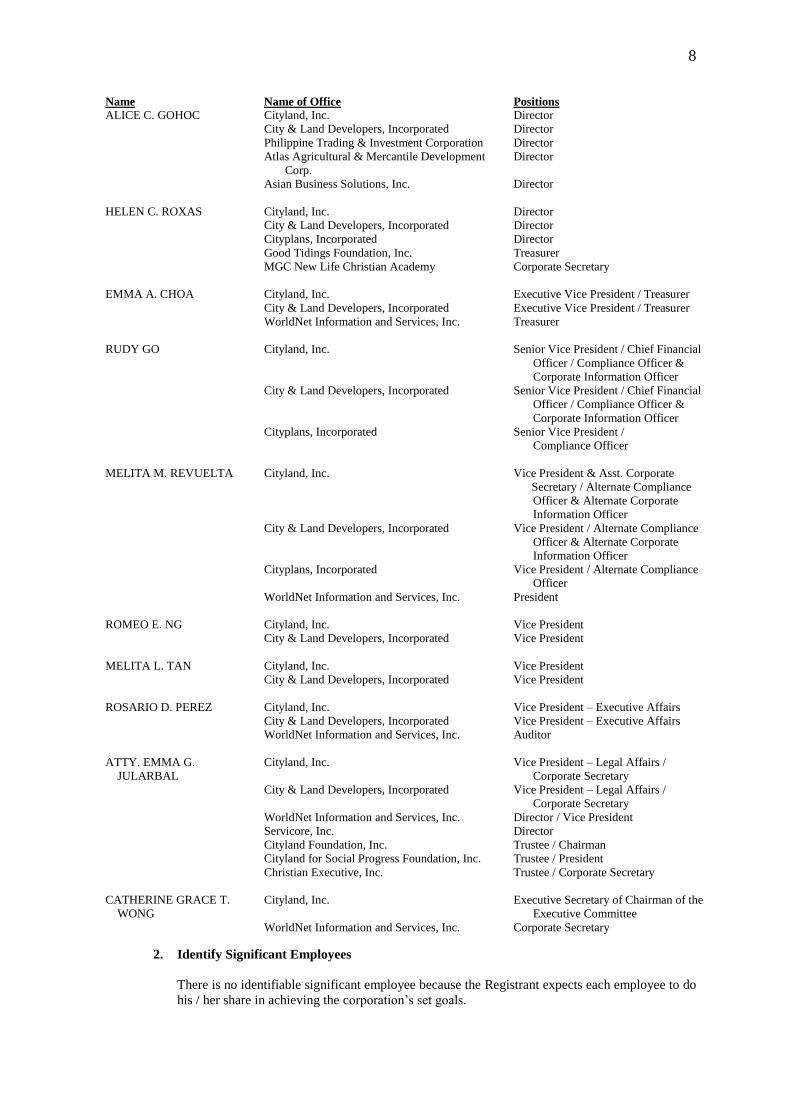
Business Experience for the Past Five Years
Name Name of Office Positions
ANDREW I. LIUSON Cityland, Inc.
City & Land Developers, Incorporated
Cityplans, Incorporated
Febias College of Bible
International Graduate School of Leadership
Grace Christian College
Philippine Council of Evangelical Churches
Director / Vice Chairman of the Board
Director / Vice Chairman of the Board
Director / Chairman of the Board
Chairman
Chairman
Chairman
Vice Chairman
Makati Gospel Church Corporate Secretary / Trustee
STEPHEN C. ROXAS Cityland, Inc.
City & Land Developers, Incorporated
Cityplans Incorporated
MGC New Life Christian Academy
Center for Community Transformation
Director / Chairman of the Board
Director / Chairman of Executive
Committee
Director / President
Chairman
Vice Chairman

7
Name Name of Office Positions
GRACE C. LIUSON Cityland, Inc.
Director / Deputy Vice Chairman
of the Board
City & Land Developers, Incorporated
Cityplans, Incorporated
Youth Gospel Center of the Philippines
Makati Gospel Church
Director / Deputy Vice Chairman
of the Board
Director / Executive Vice President/
Treasurer
Treasurer / Trustee
Treasurer / Trustee
JOSEF C. GOHOC Cityland, Inc.
City & Land Developers, Incorporated
Asian Business Solutions, Inc.
Philippine Trading & Investment Corporation
Atlas Agricultural & Mercantile Development
Corp.
Febias College of Bible
Cityland Foundation, Inc.
Director / President
Director / President
Director
Director
Director
Board of Trustee
Director
ATTY. SABINO R.
PADILLA, JR.
Padilla Law Office
Apostolic Nunciature to the Phils.
Catholic Bishops’ Conference of the Philippines
(CBCP) and various archdioceses, dioceses,
& prelatures
Association of Major Religious Superiors of the
Philippines
Philippine Association of Religious Treasurers
Partner
Legal Counsel
Legal Counsel
Legal Counsel
Legal Counsel
Grace Christian College
Various Catholic religious congregations, orders
and societies for men and women
(Dominicans, Augustinian, Franciscan,
Columbians, Religious of the Virgin Mary,
Daughters of Charity, Sisters of St. Paul
of Charters, Carmelite Sisters, Holy Spirit
Sisters, etc.)
Bank of the Philippine Islands and its
subsidiaries
Ayala Land, Inc.
City & Land Developers, Incorporated
State Investment Trust, Inc.
Stateland Investment, Inc.
Mother Seton Hospital
St. Paul Hospital Cavite
Various Catholic universities, colleges, schools,
and foundation.
Legal Counsel
Legal Counsel
Legal Counsel
Legal Counsel
Chairman of the Board
Legal Counsel
Chairman of the Board / Legal Counsel
Legal Counsel
Legal Counsel / Trustee
Trustee
PETER S. DEE Asean Finance Corporation, Limited
Alpolac, Inc.
China Banking Corporation
CBC Insurance Brokers, Inc.
CBC Properties & Computer Center, Inc.
Cityland, Inc.
City & Land Developers, Incorporated
Cityplans, Incorporated
Commonwealth Foods, Inc.
GDSK Development Corporation
Hydee Management & Resources Corporation
Kemwerke, Inc.
Makati Curbs Holdings Corporation
Great Expectation Holdings, Inc.
The Big D Holdings Corporation
Director
Director
Director
Chairman of the Board
Director / President
Independent Director
Independent Director
Independent Director
Director
Director
Director
Director
Director
Director / Chairman / President
Director / Chairman / President
GEORGE EDWIN Y. SYCIP Halanna Management Corp. President
Bank of the Orient Director
Asian Alliance Holdings and Development Corp. Director
Beneficial Life Insurance Company Director
FMF Development Corporation Director
Paxys, Inc. Director
Alliance Select Foods International, Inc. Director
8
Name Name of Office Positions
ALICE C. GOHOC Cityland, Inc.
City & Land Developers, Incorporated
Philippine Trading & Investment Corporation
Atlas Agricultural & Mercantile Development
Corp.
Asian Business Solutions, Inc.
Director
Director
Director
Director
Director
HELEN C. ROXAS Cityland, Inc.
City & Land Developers, Incorporated
Cityplans, Incorporated
Good Tidings Foundation, Inc.
MGC New Life Christian Academy
Director
Director
Director
Treasurer
Corporate Secretary
EMMA A. CHOA Cityland, Inc.
City & Land Developers, Incorporated
Executive Vice President / Treasurer
Executive Vice President / Treasurer
WorldNet Information and Services, Inc. Treasurer
RUDY GO Cityland, Inc.
City & Land Developers, Incorporated
Cityplans, Incorporated
Senior Vice President / Chief Financial
Officer / Compliance Officer &
Corporate Information Officer
Senior Vice President / Chief Financial
Officer / Compliance Officer &
Corporate Information Officer
Senior Vice President /
Compliance Officer
MELITA M. REVUELTA Cityland, Inc.
City & Land Developers, Incorporated
Cityplans, Incorporated
WorldNet Information and Services, Inc.
Vice President & Asst. Corporate
Secretary / Alternate Compliance
Officer & Alternate Corporate
Information Officer
Vice President / Alternate Compliance
Officer & Alternate Corporate
Information Officer
Vice President / Alternate Compliance
Officer
President
ROMEO E. NG Cityland, Inc.
City & Land Developers, Incorporated
Vice President
Vice President
MELITA L. TAN Cityland, Inc.
City & Land Developers, Incorporated
Vice President
Vice President
ROSARIO D. PEREZ Cityland, Inc.
City & Land Developers, Incorporated
Vice President – Executive Affairs
Vice President – Executive Affairs
WorldNet Information and Services, Inc. Auditor
ATTY. EMMA G.
JULARBAL
Cityland, Inc.
City & Land Developers, Incorporated
WorldNet Information and Services, Inc.
Servicore, Inc.
Cityland Foundation, Inc.
Cityland for Social Progress Foundation, Inc.
Christian Executive, Inc.
Vice President – Legal Affairs /
Corporate Secretary
Vice President – Legal Affairs /
Corporate Secretary
Director / Vice President
Director
Trustee / Chairman
Trustee / President
Trustee / Corporate Secretary
CATHERINE GRACE T.
WONG
Cityland, Inc.
WorldNet Information and Services, Inc.
Executive Secretary of Chairman of the
Executive Committee
Corporate Secretary
2. Identify Significant Employees
There is no identifiable significant employee because the Registrant expects each employee to do
his / her share in achieving the corporation’s set goals.

9
3. Involvement in Certain Legal Proceedings of Any of the Directors and Executive Officers
During the Past Five Years up to the Latest Date
During the past five years up to the latest date, there is no involvement in certain legal
proceedings of any of the directors and executive officers in any court or administrative agency
of the government.
a. None of them has been involved in any bankruptcy petition.
b. None of them has been convicted by final judgment in any criminal proceeding or being
subject to a pending criminal proceeding, both domestic and foreign.
c. None of them has been subjected to any order, judgment, or decree, not subsequently
reversed, suspended or vacated, of any court of competent jurisdiction, domestic or foreign,
permanently or temporarily enjoining, barring, suspending or otherwise limiting their
involvement in any type of business, securities, commodities or banking activities.
d. None of them has been found by a domestic or foreign court of competent jurisdiction (in a
civil action), the Commission or comparable body, or a domestic or foreign exchange or
other organized trading market or self-regulatory organization, to have violated a securities
or commodities law or regulation.
4. Attendance of Board of Directors
For the year 2017, there were 30 Board of Directors’ meetings. Below is the summary of the
attendance of the Board of Directors:
No. of Meetings Attended / Held
Regular Special Total
Dr. Washington SyCip (died on October 7, 2017) 3 / 4 19 / 26 22 / 30
Mr. Stephen C. Roxas 4 / 4 26 / 26 30 / 30
Dr. Andrew I. Liuson 4 / 4 26 / 26 30 / 30
Mrs. Grace C. Liuson 4 / 4 26 / 26 30 / 30
Mr. Josef C. Gohoc 4 / 4 26 / 26 30 / 30
Atty. Sabino R. Padilla, Jr. 4 / 4 26 / 26 30 / 30
Mr. Peter S. Dee 4 / 4 22 / 26 26 / 30
Mrs. Alice C. Gohoc 4 / 4 26 / 26 30 / 30
Mrs. Helen C. Roxas 4 / 4 25 / 26 29 / 30
Mr. George Edwin Y. SyCip (elected on December 13, 2017) 1 / 1* 1 / 1* 2 / 2* *Number of meetings held from the time of his election
5. Legal Proceedings to Which the Registrant or Any of its subsidiaries is a Party
The material legal proceedings to which the Group is a party or of which any of its subject
during the past five (5) years up to latest date are as follows:
COMPANY
A. Cityland Development Corporation
1. Cristy Katsui vs. Cityland Development Corporation
OP Case No. 15-A-001
Office of the President
Date Instituted: June 26, 2012
Cristy Katsui filed a Complaint dated June 20, 2012 which was received by Cityland on
July 20, 2012, seeking an order for the rescission of the Contract to Sell over a
commercial unit no. G-11 in Makati Executive Tower IV and for the return of all the
amortizations paid by her and her children in the total amount of P=1,634,000.00.
Cityland stated in its Answer that it cancelled the above-mentioned Contract to Sell in
compliance with the instruction of Katsui in her letter, in behalf of all the Buyers, dated
June 21, 2011. She was informed that she is not entitled to any cash surrender value
under R.A. No. 6552 that requires a minimum payment of 24 monthly installments.
Katsui paid only 14 installments. Besides, the unit is a commercial unit which is not
covered by the law which seeks to protect buyers of residential units. Unfavorable

10
decision was rendered by the HLURB and the same was elevated to the Office of the
President which is now pending.
2. Esmeraldo Balosa vs. Cityland Development Corporation
CA-G.R. CV No. 106040
Court of Appeals
Date Instituted: April 11, 2008
Esmeraldo Balosa filed a case for Preliminary Mandatory Injunction with damages
against Cityland after the Business and License Department of Mandaluyong City
closed his stalls due to Balosa’s failure to secure the necessary permits. He alleged that
he has not been paying the lease because another entity is also claiming ownership of
the leased property and that the property cannot be used for his business. Balosa claims
Cityland illegally ejected him. The Regional Trial Court dismissed the complaint of
Balosa and denied his Motion for Reconsideration. The Court of Appeals dismissed
Balosa’s appeal and now attained finality.
B. City & Land Developers, Incorporated
1. Republic of the Philippines represented by the Department of Public Works and
Highways (DPWH), through the Bureau of Design-Right of Way Office
(BOD-ROWO) vs. City & Land Developers, Inc.
Civil Case No. 13-0209
Paranaque Regional Trial Court – Branch 274
Date Instituted: July 16, 2013
DPWH filed a Complaint for Expropriation for certain portions of the properties,
including the improvements therein, of CLDI located in Barangay Tambo, Paranaque
City, which will be part of the NAIA Expressway Project Phase II. A Writ of Possession
was issued by the court. Trial of the case is ongoing on the issue of just compensation.
2. Sta. Ana Village Homeowners' Assoc. Inc. (SAVHA) vs. City & Land Developers,
Inc.
Civil Case No. 12-009
Paranaque Regional Trial Court – Branch 274
Date Instituted: January 16, 2012
SAVHA filed a Complaint dated January 16, 2012 which was received by CLDI on
March 3, 2012, to enjoin defendant and all persons allowed by said defendant CLDI
from using Benedictine Street in Sta. Ana Village, Barangay Sun Valley, Paranaque City,
and to order the defendant by way of a writ of mandatory injunction, to open another
outlet to the main road without cost or liability to plaintiff.
CLDI stated in its Answer that plaintiff has not proven its claim over Benedictine Street
because the Deed of Donation used by the plaintiff is a falsified and/or spurious
document. Furthermore, there is a Right-of-Way Agreement for Benedictine Street.
Case was dismissed. However, SAVHA filed a Motion for Reconsideration which was
granted. SAVHA’s unnotarized Judicial Affidavit of first witness was expunged from
the records of the case. SAVHA’s legal counsel withdrew from the case. New counsel
for SAVHA appeared. Trial of the case is ongoing.
PROPERTY
Aside from the above mentioned cases, there were no cases filed wherein the Group’s
property/ies is/are the subject.
The Group does not expect that the outcome of the material legal proceedings above involving
the Group will have a material adverse effect on the financial condition of the Group.

11
During the past five years up to present, there is no bankruptcy petition filed by or against any
business of which such person was a general partner or executive officer of the Group either at a
time of the bankruptcy or within two years prior to that time.
During the past five years up to present, the Group, any of its directors or executive officers has
no conviction by final judgment, domestic or foreign, or is not subject to a pending criminal
proceeding, domestic or foreign.
During the past five years up to present, the Group, any of its directors or executive officers is
not subject to any order, judgment, or decree, not subsequently reversed, suspended or vacated,
of any court of competent jurisdiction, domestic or foreign, permanently or temporarily
enjoining, barring, suspending or otherwise limiting his involvement in any type of business,
securities, commodities or banking activities.
During the past five years up to present, the Group, any of its directors or executive officers has
not been found by a domestic or foreign court of competent jurisdiction (in civil action), the
Commission or comparable foreign body, or a domestic or foreign exchange or other organized
trading market or self- regulatory organization, to have violated a securities or commodities law
or regulation and the judgment has not been reversed, suspended, or vacated.
6. Nominees for Election as Members of the Board of Directors for the ensuing term / year:
The following have been nominated to the Board of Directors for the ensuing term / year.
George Edwin Y. SyCip (Independent Director) Peter S. Dee (Independent Director)
Dr. Andrew I. Liuson Atty. Sabino R. Padilla, Jr.
Stephen C. Roxas Alice C. Gohoc
Grace C. Liuson Helen C. Roxas
Josef C. Gohoc
The independent directors possess all qualifications to serve as an independent director of the
Company, as provided for in Section 38 of Securities Regulation Code (SRC) and its
implementing rules.
The final list of nominees for independent directors as nominated by respective stockholders of
Cityland Development Corporation and endorsed by Nomination Committee are the following:
Independent Directors Nominating Stockholders
George Edwin Y. SyCip Romeo E. Ng
Peter S. Dee Marianne M. Martin
The aforementioned nominees were nominated by the respective stockholders who are not
related to said nominees.
The Corporate Governance Committee performs the role of the Nomination Committee. The
following are the members of the Corporate Governance Committee:
Mr. George Edwin Y. SyCip (Chairman)
Mr. Stephen C. Roxas
Dr. Andrew I. Liuson
7. Procedures for Nomination and Election of Independent Directors
a. Nomination of independent directors shall be conducted by the Corporate Governance
Committee prior to a stockholders’ meeting. All recommendations shall be signed by the
nominating stockholders together with the acceptance and conformity by the would-be
nominees.
The Committee shall pre-screen the qualifications and prepare a final list of all candidates
and put in place screening policies and parameters to enable it to effectively review the
qualifications of the nominees for independent director/s.
After the nomination, the Committee shall prepare a Final List of Candidates which shall
contain all the information about all the nominees for independent directors, as required

12
under Part IV (A) and (C) of “Annex C” of SRC Rule 12, which list, shall be made available
to the Commission and to all stockholders through the filing and distribution of the
Information Statement, in accordance with SRC Rule 20, or in such other reports the
company is required to submit to the Commission. The name of the person or group of
persons who recommended the nomination of the independent directors shall be identified in
such report including any relationship with the nominee.
Only nominees whose names appear on the Final List of Candidates shall be eligible for
election as independent directors. No other nominations shall be entertained after the Final
List of Candidates shall have been prepared. No further nominations shall be entertained or
allowed on the floor during the actual annual stockholders’ meeting.
b. Subject to pertinent existing laws, rule and regulations, the conduct of the election of the
independent director shall be made in accordance with the standard election procedures of
this By-laws.
It shall be the responsibility of the Chairman of the meeting to inform all stockholders in
attendance of the mandatory requirement of electing independent directors. He shall ensure
that independent directors are elected during the stockholders’ meeting.
Specific slot for the independent directors shall not be filled-up by unqualified nominee.
8. Related Party Transactions
The Registrant and its subsidiaries, in their regular conduct of business, have entered into
transactions with associates and related parties principally consisting of advances, and
reimbursement of expenses. These transactions to and from related parties are made on an arm’s
length basis and at current market prices at the time of the transaction.
There is an existing management contract with Cityland, Inc. (CI), its parent company, wherein
CI provides management services for the business of the Registrant. The agreement is for a
period of five years renewable automatically for another five years unless either party notifies the
other six months prior to expiration. The management fee is based on a certain percentage of net
income as mutually agreed upon by both parties. The management fees for 2017, 2016 and 2015
were waived by CI. There are no conditions attached to the waiver of these management fees.
The Registrant or its related parties have no relationship on parties that fall outside the definition
of related parties that enables to negotiate terms of material transactions that may not be
available from others or independent parties on an arm’s length basis. Moreover, the Registrant
has no transactions with former senior management or persons that would result in negotiations
of terms that are more or less favorable than those available on an arm’s length basis from clearly
independent parties that are material to the Registrant’s financial position or financial
performance.
Please refer to Note 26 – Related Party Transactions of the Notes to 2017 Audited Consolidated
Financial Statements which is incorporated in the Index to Financial Statements and
Supplementary Schedules.
9. Parent Company of the Registrant:
Cityland, Inc. owns 50.98% of the outstanding capital stock of the Registrant.

13
VI. Compensation of Directors and Executive Officers
Executive Compensation Summary Table
Name Position 2018 (estimate)
Josef C. Gohoc President x
Emma G. Jularbal Vice President - Legal x
Melita L. Tan Vice President x
Ma. Veronica S. Emaguin Senior Manager x
Alvin Albert Anthony H.
Ocampo
Assistant Manager x
Salaries ₱6,005,286
Bonus 1,519,791
Others 152,400
Total (Top 5) ₱7,677,477
Salaries ₱20,708,418
Bonus 5,287,503
Others 848,400
All officers & directors as a group unnamed ₱26,844,321
Grand Total ₱34,521,798
Name Position 2017 (actual)
Josef C. Gohoc President x
Emma G. Jularbal Vice President - Legal x
Melita L. Tan Vice President x
Dorothy U. So AVP- Internal Audit x
Therese Raimunda A. Anoos Senior Manager x
Salaries ₱5,382,448
Bonus 1,375,321
Others 10,490,280
Total (Top 5) ₱17,248,049
Salaries ₱20,781,156
Bonus 5,231,708
Others 8,037,325
All officers & directors as a group unnamed ₱34,050,189
Grand Total ₱51,298,238
Name Position 2016 (actual)
Josef C. Gohoc President x
Emma G. Jularbal Vice President - Legal x
Melita L. Tan Vice President x
Patrocinio M. Pablo AVP- Research and Development
Department
x
Dorothy U. So AVP- Internal Audit x
Salaries P=5,089,043
Bonus 1,310,889
Others 16,696,901
Total (Top 5) P=23,096,833
Salaries P=17,670,074
Bonus 4,701,349
Others 7,264,561
All officers & directors as a group unnamed P=29,635,984
Grand Total P=52,732,817
The Group has no standard arrangements with regards to the remuneration of its directors. In 2017, 2016, and
2015, the Board of Directors received a total of P=20.43 million, P=29.44 million and P=20.28 million,
respectively, including a total per diem of P=1.30 million per annum (aggregate of CLDI and CDC) for the
board meetings attended. Moreover, the Group has no standard arrangement with regards to the remuneration
of its existing officers aside from the compensation received nor any other arrangement with employment
contracts, compensatory plan and stock warrants or options.
14
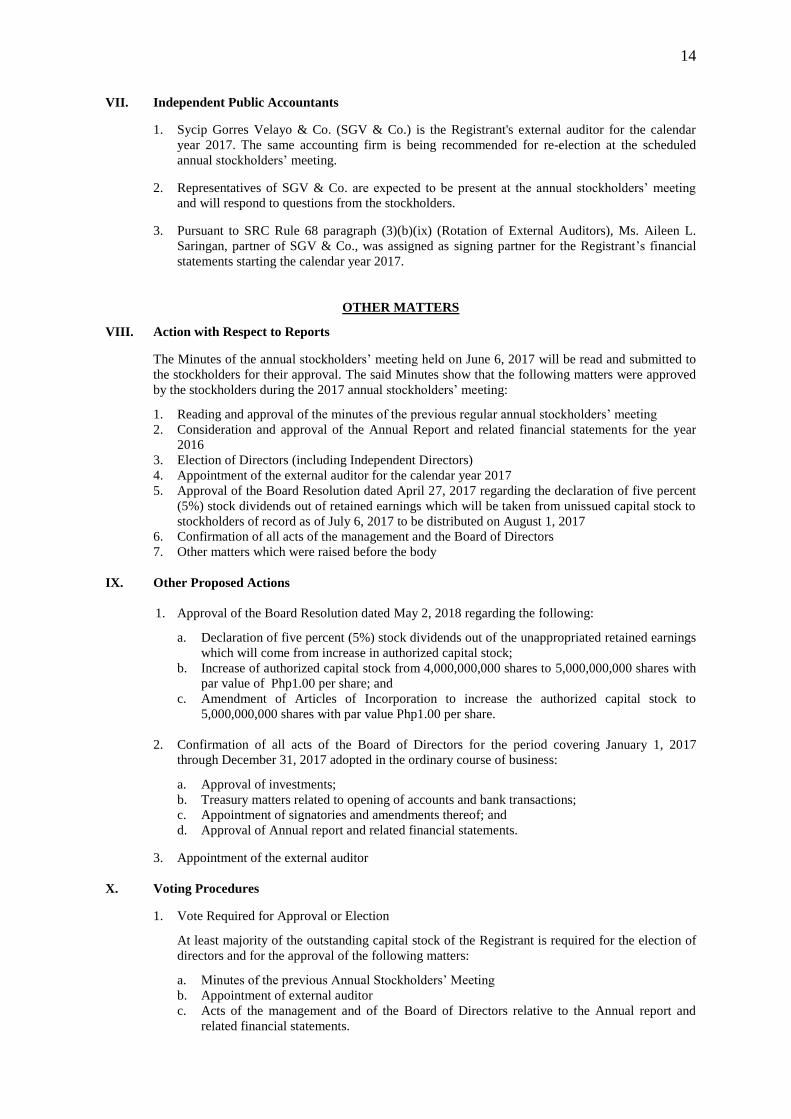
VII. Independent Public Accountants
1. Sycip Gorres Velayo & Co. (SGV & Co.) is the Registrant's external auditor for the calendar
year 2017. The same accounting firm is being recommended for re-election at the scheduled
annual stockholders’ meeting.
2. Representatives of SGV & Co. are expected to be present at the annual stockholders’ meeting
and will respond to questions from the stockholders.
3. Pursuant to SRC Rule 68 paragraph (3)(b)(ix) (Rotation of External Auditors), Ms. Aileen L.
Saringan, partner of SGV & Co., was assigned as signing partner for the Registrant’s financial
statements starting the calendar year 2017.
OTHER MATTERS
VIII. Action with Respect to Reports
The Minutes of the annual stockholders’ meeting held on June 6, 2017 will be read and submitted to
the stockholders for their approval. The said Minutes show that the following matters were approved
by the stockholders during the 2017 annual stockholders’ meeting:
1. Reading and approval of the minutes of the previous regular annual stockholders’ meeting
2. Consideration and approval of the Annual Report and related financial statements for the year
2016
3. Election of Directors (including Independent Directors)
4. Appointment of the external auditor for the calendar year 2017
5. Approval of the Board Resolution dated April 27, 2017 regarding the declaration of five percent
(5%) stock dividends out of retained earnings which will be taken from unissued capital stock to
stockholders of record as of July 6, 2017 to be distributed on August 1, 2017
6. Confirmation of all acts of the management and the Board of Directors
7. Other matters which were raised before the body
IX. Other Proposed Actions
1. Approval of the Board Resolution dated May 2, 2018 regarding the following:
a. Declaration of five percent (5%) stock dividends out of the unappropriated retained earnings
which will come from increase in authorized capital stock;
b. Increase of authorized capital stock from 4,000,000,000 shares to 5,000,000,000 shares with
par value of Php1.00 per share; and
c. Amendment of Articles of Incorporation to increase the authorized capital stock to
5,000,000,000 shares with par value Php1.00 per share.
2. Confirmation of all acts of the Board of Directors for the period covering January 1, 2017
through December 31, 2017 adopted in the ordinary course of business:
a. Approval of investments;
b. Treasury matters related to opening of accounts and bank transactions;
c. Appointment of signatories and amendments thereof; and
d. Approval of Annual report and related financial statements.
3. Appointment of the external auditor
X. Voting Procedures
1. Vote Required for Approval or Election
At least majority of the outstanding capital stock of the Registrant is required for the election of
directors and for the approval of the following matters:
a. Minutes of the previous Annual Stockholders’ Meeting
b. Appointment of external auditor
c. Acts of the management and of the Board of Directors relative to the Annual report and
related financial statements.

15
2. Method by which votes will be counted: plurality of votes by ballot system or viva voce.
3. The “Ayes” and “Nayes” are requested to raise their hands during the stockholders’ meeting
where they are counted by the Corporate Secretary. The Company also has an independent party
who will validate the votes counted by the Secretary.

16
SIGNATURf
After reasonable inquiry and to the best of m-v knorvledge and beliei I certify that the information set forth inthis repofi is true, coriplete and corect. This repofi is signed in the City of Makati on trnayj/-otl_.
DEVELOPMENT CORPORATION

17
CITYLAND DEVELOPMENT CORPORATION
THE PRESIDENT’S REPORT
The Philippines remains to be one of the best performing economies in Asia as it registered a 6.7% growth in
2017 ranking 3rd in Asia behind China and Vietnam. According to the National Economic Development
Authority (NEDA), the growth was mainly driven by public spending, which is in line with the government’s
commitment to deliver timely public services and social protection programs, including assistance to victims
of typhoons as well as in the Marawi conflict, public scholarship and health care programs. In addition, a
recovered agricultural sector and better exports and imports supported the economic growth.
At present, the real estate industry is still dynamic and growing as evidenced by the wide array of
developments. This is expected to continue since the government is committed to spend ₱8.4 trillion on
infrastructure until 2022 (source: bworldonline.com). The property sector is currently experiencing a positive
business climate as evidenced by a vibrant stock market, strong consumer spending, high overseas remittances
and stable interest rates. In addition, the heavy and worsening traffic in the metropolis increased the demand
for condominium units within the central business districts. Moreover, the tax reform on lowering income tax
including the government’s policies on infrastructure and ease in doing business will bring further gains in the
real estate industry.
GENERAL NATURE OF BUSINESS
A. Background Information
1. Brief Company History
Cityland Development Corporation (the Registrant, Company or CDC) is a domestic publicly listed
corporation which is duly organized and existing under and by virtue of the laws of the Philippines
since January 31, 1978 with the primary purpose of engaging in real estate development.
2. Listing in Stock Exchange
The Company was listed with the Manila and Makati Stock Exchange in March 1983.
3. Subsidiaries
a. City & Land Developers, Incorporated (CLDI): a publicly-listed real estate company
incorporated under the laws of the Philippines and registered with the Securities and Exchange
Commission (SEC) on June 28, 1988.
b. Cityplans, Incorporated (CPI): a pre-need company incorporated under the laws of Philippines
and registered with the SEC on October 27, 1988.
4. Nature of Operations
The Company’s and its subsidiaries’ (the Group) primary purpose is to acquire and develop
suitable land sites for residential, office, commercial, institutional, and industrial uses. CPI is
engaged in the business of establishing, organizing, developing, maintaining, conducting,
operating, marketing and selling pension plans.
Its projects include medium to high-rise office, commercial, and residential condominiums located
in cities of Makati, Mandaluyong, Manila and Pasig; and residential subdivisions and farmlots in
Bulacan and Cavite.

18
FINANCIAL HIGHLIGHTS
In Millions of Pesos
2017 2016 2015
Consolidated Net Income 551.93 476.37 775.77
Consolidated Net Worth 7,733.28 7,318.24 7,092.65
Consolidated Total Assets 9,698.83 9,870.95 8,813.65
Consolidated Revenues 1,843.38 1,926.67 2,837.04
0 1000 2000 3000 4000 5000 6000 7000 8000 9000
Revenues
Total assets
Net Worth
Net Income
2017
2016
2015
5. Project Description
CDC
Future Projects:
101 Xavierville
101 Xavierville is a 40-storey residential and commercial condominium to be located along
Xavierville Avenue, Loyola Heights, Quezon City. The project is easily accessible to various
schools such as Ateneo de Manila University, University of the Philippines and Miriam College;
recreational parks and leisure places. This project was launched in April 2018.
Pioneer Heights 1
Pioneer Heights 1 is a 26-storey residential and commercial condominium to be located in Pioneer
St., Mandaluyong City. Its amenities include swimming pool, children’s playground, multi-purpose
function room, laundry room, information area, administration room and 24-hour association
security.
Ongoing Projects:
Pines Peak Tower II
Pines Peak Tower II is a 27-storey residential condominium conceptualized for the fast-paced
Filipino family. It is beside Pines Peak Tower I along Pines St., Brgy. Barangka Ilaya,
Mandaluyong City. It is only a block away from the major thoroughfare of EDSA, near Shaw
Boulevard, Pioneer and MRT Boni Station. The project is easily accessible to various commercial
centers like Shangri-La Mall, Star Mall, Robinson’s Place Pioneer, SM Megamall, The Podium,
Metrowalk and schools like Lourdes School of Mandaluyong, St. Paul College of Makati and
University of Asia and the Pacific.
Estimated Date of Completion: March 2021

19
Completed Projects:
CityNet Central
CityNet Central is a 22-storey commercial and BPO office building located in central business
district along Sultan Street, Brgy. Highway Hills, Mandaluyong City with its proximity to MRT
station and various transportation hubs.
Pines Peak Tower I
Pines Peak Tower I is a 27-storey residential condominium located at Union corner Pines St.,
Barangka, City of Mandaluyong. Its amenities include swimming pool, viewing deck, multi-
purpose function room with movable children play set, gym and 24-hour association security.
CityNet1
CityNet1 is a 5-storey premiere business technology hub located along 183 EDSA, Brgy. Wack-
Wack, Mandaluyong City.
Grand Central Residences
Grand Central Residences is a 40-storey office, commercial and residential condominium located at
EDSA corner Sultan St., (fronting MRT Shaw), Mandaluyong City. It is in close proximity to
schools, churches, malls and hospitals. It is equipped with swimming pool, multi-purpose function
room, gym, multi-purpose deck, CCTV and 24-hour association security.
Makati Executive Tower IV
Makati Executive Tower IV is a 29-storey commercial and residential condominium located at
Cityland Square, Sen. Gil Puyat Ave., cor. P. Medina St., Makati City. It is in close proximity to
schools, malls, hypermarkets and hospitals. Its amenities include swimming pool, gym,
playground, function room, roof deck and 24-hour association security.
Mandaluyong Executive Mansion III
Mandaluyong Executive Mansion III is a 7-storey commercial and residential condominium
located at G. Enriquez St., Brgy. Vergara, Mandaluyong City. It is in close proximity to schools,
malls, churches and hospitals. Its amenities include playground, swimming pool, basketball court
and 24-hour association security.
Makati Executive Tower III
Makati Executive Tower III is a 37-storey commercial, office, and residential condominium
located at Cityland Square, Sen. Gil Puyat Avenue, Pio Del Pilar, Makati City. Its amenities
include swimming pool, sauna, viewing deck, jogging area, mini-gym, children’s playground,
function room and 24-hour association security.
Manila Executive Regency
Manila Executive Regency is a 39-storey office, commercial and residential condominium situated
along J. Bocobo St. Ermita. This property has a close proximity to churches, malls, parks, party
places, historical places, government institutions, and commercial establishments. Its amenities and
facilities include swimming pool, gym, spa, function room, children’s playground and Manila Bay
viewing deck.
RADA Regency
RADA Regency is a 25-storey residential, office and commercial condominium in Legaspi Village,
at the heart of the Makati Business District. It is just a leisurely walk to major shopping and
entertainment centers, banks, school and universities, churches, hospitals and restaurants. The
Greenbelt malls, Makati Medical Center and many recreation centers are also within close reach.

20
Corinthian Executive Regency
Corinthian Executive Regency is a 39-storey office, commercial and residential condominium
located along Ortigas Avenue, Pasig City. It has an excellent location and close proximity to
various schools (La Salle Greenhills, Saint Pedro Poveda College), churches, hospital (The Medical
City), banks, shopping malls (Robinson’s Galleria, SM Megamall, The Podium, Shangri-La),
restaurants and other leisure centers. Its amenities and facilities include swimming pool, gym,
sauna for men and women, viewing deck, function room, laundromat, provision for children’s
playground and 24-hour association security.
Makati Executive Tower II
Makati Executive Tower II is a 35-storey residential condominium located in Dela Rosa St., corner
Medina St., Makati City. The tower offers a great location being few steps away from shopping
centers, hotels, banks, hospitals, churches and major thoroughfares. Also, its proximity to LRT and
MRT gives easy access to transportation.
CLDI
Future Project:
One Hidalgo
One Hidalgo is a 39-storey mixed residential, office and commercial condominium to be located at
1730 P. Hidalgo Lim St., corner Gen. Malvar St., Malate, Manila. It is near to various universities
(De La Salle University, University of the Philippines – Manila, Philippine Christian University),
government agencies (Supreme Court, Court of Appeals, Department of Justice) and other leisure
establishments.
Ongoing Projects:
One Taft Residences
One Taft Residences is a 40-storey mixed residential, office and commercial condominium which
is located at 1939 Taft Avenue, Malate, Manila. It is with easy access to various universities (De
La Salle University, University of the Philippines – Manila, Philippine Christian University),
transportation hubs, shopping centers, businesses, commercial and government offices.
Estimated Date of Completion: September 2022
North Residences
This 29-storey commercial and residential condominium is located along EDSA (beside
WalterMart) corner Lanutan, Brgy. Veterans Village, Quezon City. It is conceptualized for the
practical modern families to enjoy suburban city living that is friendly on the budget. The project
was turned over in March 2018.
Completed Projects:
Manila Residences Bocobo
Manila Residences Bocobo is a 34-storey commercial, office and residential condominium located
along Jorge Bocobo St., Ermita, Manila City. Its amenities and facilities include swimming pool,
children’s play area, gym, multi-purpose deck, function room and 24-hour association security. It
is proximate to schools, malls, banks, hospitals, restaurants, churches, government offices and
other leisure establishments.
Grand Emerald Tower
Grand Emerald Tower is a 39-storey commercial, office and residential condominium located
along Emerald Avenue Corner Ruby and Garnet Streets, Ortigas Center, Pasig City. Its amenities
and facilities include swimming pool, gymnasium, viewing deck, sauna, children’s playground,

21
multi-purpose function room, and 24-hour association security. It is proximate to schools,
hospitals, shopping malls, banks, restaurants, hotels, churches and other leisure and business
establishments.
Pacific Regency
Pacific Regency is a 38-storey commercial, office and residential condominium located at Pablo
Ocampo Sr. Ave. (formerly Vito Cruz Street) in front of Rizal Memorial Sports Complex in
Manila. Amenities and facilities include swimming pool, gymnasium, separate sauna for male and
female, function room, children’s playground, 24-hour association security, viewing area and
jogging areas at the roof deck.
CPI
Windsor Mansion
Windsor Mansion is an 8-storey commercial and residential condominium located along
Evangelista St., New Santolan, Pasig City. Amenities and facilities include 2 elevators,
administrative office, visitors’ lounge, provision for cable TV and telephone line, individual water
sub meter / Meralco meter and 24-hour association security. This project is also developed together
with Cityland, Inc. (CI or the Ultimate Parent Company).
Oxford Mansion
Oxford Mansion is an 8-storey commercial and residential condominium located along Evangelista
St., New Santolan, Pasig City. Amenities and facilities include 2 elevators, administrative office,
visitor’s lounge, provision for cable TV and telephone line, individual water sub meter / Meralco
meter and 24-hour association security. This project is also developed together with CI.
Pasig Royale Mansion
Pasig Royale Mansion is an 8-storey mid-rise condominium located at Evangelista St., New
Santolan, Pasig City. Amenities and facilities include a swimming pool, a function room, a viewing
area and a visitor’s lounge. This project is also developed together with CI.
6. Major Risks Involved in Each of the Business of the Company
The risks to which the Group is exposed include the internal risks such as refinancing risk, credit
risk, interest rate risk, market risk and liquidity risk; business risks and operational risks; and
external ones arising from the political and economic situation, real estate industry outlook, market
competition and asset price bubble.
INTERNAL FACTORS
Refinancing The Group is primarily engaged in real estate development. Risk factor includes
short-term borrowings which increases the possibility of refinancing risks. This
debt mix in favor of short-term borrowings is a strategy which the Group
adopted to take advantage of lower cost of money for short-term loans versus
long-term loans. Because the Group has the flexibility to convert its short-term
loans to a long-term position by drawing down its credit lines with several banks
or sell its receivables, refinancing risk is greatly reduced.
The Group manages such refinancing risks by having a current and acid-test
ratio of 2.42:1 and 1.69:1 as of December 31, 2017 from 2.43:1 and 1.66:1 as of
December 31, 2016, respectively.

22
Credit Risk This is defined as the risk that one party to a financial instrument will cause a
financial loss for the other party by failing to discharge an obligation. The
financial instruments, which may be the subject of credit risk, are the installment
contracts receivable and other financial assets of the Group. The corresponding
management strategies for the aforementioned risks are as follows:
a. The credit risk on the installment contracts receivable may arise from the
buyers who may default on the payment of their amortizations. The Group
manages this risk by dealing only with recognized, credit worthy third
parties. Moreover, it is the Group’s policy to subject customers, who buy
on financing, to credit verification procedures. Also, installment contracts
receivable balances are monitored on an on-going basis with the result that
the Group's exposure to bad debts is insignificant.
b. The credit risk on the other financial assets of the Group such as cash and
cash equivalents, short-term investments, notes receivable and financial
assets at fair value through profit or loss may arise from default of the
counterparty. The Group manages such risks by its policy to enter into
transactions with a diversified creditworthy parties to mitigate any
significant concentration of credit risks. As such, there are no significant
concentrations of credit risks in the Group.
Interest Rate
Risk
This is the risk arising from uncertain future interest rates.
The Group’s financial assets mainly consist of installment contract receivables,
notes receivable, cash and cash equivalents and short-term investments. Interest
rates on these assets are fixed at their inception and are therefore not subject to
fluctuations in interest rates.
For the financial liabilities, the Group only has commercial papers which bear
fixed interest rates, thus, are not exposed to fluctuations in interest rates.
Market Risk This is the risk that the fair value or future cash flows of a financial instrument
will fluctuate because of changes in market prices. Financial instruments which
are measured at fair value are subject to market risk.
The available-for-sale financial assets are exposed to market risk. There is a risk
for a decline in the value due to changes in the market. The exposure, however,
is negligible because the amount of the said investment is insignificant as
compared to the financial assets of the Group.
Liquidity Risk
This is the current and prospective risk to earnings or capital from the Group’s
inability to meet its obligations when they become due without incurring
unacceptable losses. The Group’s treasury has a well-monitored funding and
settlement management plan. The following is the liquidity risk management
framework maintained by the Company:
a. Asset- Liability Management: Funding sources are substantially from short-
term borrowings. Funding sources are abundant and provide a competitive
cost advantage. The Group also holds financial assets for which there is a
liquid market and are, therefore, readily saleable to meet liquidity needs.
b. Conservative/ Liability Structure: Funding is widely diversified. There is
little reliance on wholesale funding services or other credit sensitive fund
providers. The Group accesses funding across a diverse range of markets and
counter parties.
c. Excess Liquidity: The Group maintains considerable excess liquidity to meet
a broad range of potential cash outflows from business needs including
financial obligations.
d. Funding Flexibility: The Group has an objective to maintain a balance
between continuity of funding and flexibility through the use of loans from

23
banks and commercial papers.
As such, the Group addresses risk on liquidity by maintaining committed
borrowing facilities in the form of bank lines and established record in accessing
these markets.
The Company is also exposed to risks which are beyond financial as follows:
GROUP’S BUSINESS AND OPERATIONS
Land Banking The Group’s land banking consists of parcels of land wherein some lots are
being leased while awaiting the development of the Group’s condominium
projects. Having enough and diversified land banking is important to support the
sustainability of the Group’s business. The Group may be exposed to risks
because of the possible changes in the value of these lots due to market
circumstances which may result in impairment or decline in rental rate levels.
The Group currently has prime lots for future development and/or investment
properties which are located in the different areas of Metro Manila and Cavite.
The management also is in continuous study and research on the possible land
acquisition which will depend on the need of the Group and negotiations with
prospective sellers. For the land value changes and decline, the Group continues
to be cautious in buying new properties by conducting studies on appraisal and
conditions of the property within the vicinity.
Property
development
and
construction
Construction of a condominium project starts from the planning and securing of
permits, to the development or construction of the project and to the delivery or
turnover of the units to the buyers. The construction of a project involves an
average period of three to four years to complete the building. During this
period, the Group may be exposed to the following risks:
delays or longer than expected time of securing necessary licenses,
permits and approvals from different government agencies or
neighborhood;
possible rise in the cost of materials and labor which will impact
pricing and cost;
labor disputes among and with the contractors and sub-contractors; and
delay in the delivery of the project.
These risks are managed by the Group as follows:
well-planned and carefully-phased project development with a
reasonable timetable;
concrete sources of financing of the project;
accreditation and careful selection of general contractors and sub-
contractors to ensure fulfillment and quality of work; and
continuous and meticulous management of the Group’s project
development team to ensure that the project is progressing and being
accomplished according to plan.
ECONOMIC FACTORS
Economic The Group’s business consists mainly of providing office and housing units in
the Philippines and the results of the operations will be influenced by the general
conditions of the Philippine economy. Any economic instability or failure to
register improved economic performance in the future may adversely affect the
Group’s operations and eventually its financial performance.
Effect of climate change
It cannot be denied that the country is already experiencing the impact of
climate change which is considered as a global problem which needs to be
addressed by all countries.
Climate change has greatly affected the operations of the businesses, both
private and local. Due to climate change, the supply or resources may

24
decline which will lead to increase in cost. Thus, businesses should consider
measures to cope with the impact of environmental changes. Aside from
considering the impact, businesses should also take its role in ensuring its
compliance with the rules and regulations imposed by the environmental
authorities.
Cityland Group has invested considerable effort in the development of
programming approaches that integrate disaster risk management with long-
term programs that have the objective of addressing the underlying causes of
vulnerability. This means developing and applying various prevention,
mitigation and preparedness policies, strategies and practices to minimize
vulnerabilities and disaster risks. The Group firmly believes that emergency
preparedness planning is a critical component for all development
programming and is a necessary ingredient not only for effective emergency
response but also for effective risk prevention, mitigation and preparedness
before a disaster occurs. For the Group, emergency preparedness
encompasses all aspects of disaster risk management – from addressing
underlying causes to responding in times of emergencies. First and
foremost, preparedness must focus on prevention and mitigation – taking
pre-emptive measures to help communities avoid emergencies and become
better equipped so that the impact of disasters are reduced. As one of the
criteria set by the Group in acquisition of property, the Group considers
whether the location of the prospective property is within the fault line and
whether the area is prone to flooding. In this case, the Group minimizes the
risk of incurring any additional costs/damages in the future.
Further, the Group has adopted the following controls to ensure its
compliance with the environmental laws but not limited to the following:
tree planting activities as required by the Board of Investments (BOI)
for the Group’s BOI-registered projects;
appointment of Pollution Control Officers in all condominium projects;
and
avoiding hazards and mitigating their potential impacts by reducing
vulnerabilities and exposure and enhancing capacities of communities.
Political The Group’s business like all other businesses may be influenced by the political
situation in the country. Any political instability in the future could have a
material adverse effect in the Group’s business.
Industry The industry is characterized by boom-bust cyclical pattern exhibited in the past
couple of decades where the industry normally goes through years of robust
growth following years of slowdown. The industry is still in the boom stage.
Competition
The demand for housing especially in the medium-cost category has moderately
stepped up. The situation has attracted both old and new players to develop
projects that cater to this rising demand. As a result of the foregoing,
competition in the area of medium-cost development is expected to intensify.
The Group believes that it is in a better position to cope with the competition
because of the affordability of the projects it offers in the market.
Asset Price
Bubble
Asset price bubble in real estate occurs when there is an identified rapid
increases in valuations of real property until they reach unsustainable levels and
then decline. Real estate bubbles had existed in the recent past and is still widely
believed to still exist in many countries such as the United States which had
resulted in the recent subprime mortgage crisis.
In the Philippines, records of low interest rates have raised concerns over
potential asset price bubble, however, the government through the Finance
Secretary said that these risks are under control (www.cnbc.com). Increased
scrutiny and monitoring of this risk in the country comes after Hongkong and
Singapore adopted measures to cool property prices (www.bloomberg.com).
This asset price bubble risk is intensely monitored by the government agencies,

25
Department of Finance and the Philippine Central Bank which is set to introduce
a residential property-price index. This risk will be continuously mitigated by
the appropriate actions and policies of regulators as well as the banking sector.
Also, since the Philippine economy showed a healthy and sustainable growth,
this reduces the risk of asset price bubble.
The Bangko Sentral ng Pilipinas (BSP) has reiterated that there are no macro-
prudential risks from the real estate market as growth in the property sector
remains demand driven. Mr. Amando Maglalang Tetangco, Jr., the incumbent
Governor of BSP, said the BSP closely monitors the lending of banks to the
property sector through a quarterly stress test. “For real estate, we do the stress
test quarterly because of the special nature of the property sector. Historically
that is a source of problem. Not that we have that problem now but what we
want is try to avert a potential problem in the property sector,” he said. “Right
now we believe there is no asset bubble in the property sector. Basically the
increase in property prices and the growth in the property sector has essentially
been demand driven,” Tetangco added. Unlike before, Tetangco said property
developers are more conservative in their construction activities. (Source:
http://www.msn.com/en-ph/money/topstories/no-asset-bubble-in-real-estate-bsp-
reiterates/ar-BBminOS)
Demand for residential properties is mainly driven by the middle class,
particularly overseas Filipinos and the young professionals from the BPO
sectors. The Group’s projects, which cater to the middle income groups, belong
to the medium-cost category. This minimizes the Group’s exposure to asset
price bubble risk as compared to the high-end players in the real estate industry.
The Group manages the above risks by conducting assessments of the economic and political
situations of the country as well as new developments in the industry. The procedures involve the
gathering of information of economic indicators and political events as well as being aware of the
new developments in the industry through media, business conferences, economic briefings and
other sources.
With this information, the Group is able to assess and manage the risks mentioned above.
7. Management’s Discussion and Analysis or Plan of Operation
Financial Performance
The Group is pre-selling the following on-going projects as of December 31, 2017:
One Taft Residences (project of CLDI)
North Residences (project of CLDI, turned over last March 2018)
Pines Peak Tower II (project of CDC)
Also, the Group is selling the remaining units of the following completed and operational projects:
Cityland Development Corporation
Pines Peak Tower I
Grand Central Residences
Makati Executive Tower IV
Makati Executive Tower III
Makati Executive Tower II
Mandaluyong Executive Mansion III
Corinthian Emerald Regency
Manila Executive Regency
City & Land Developers, Incorporated
Manila Residences Bocobo
Grand Emerald Tower
The Pacific Regency

26
Cityplans, Incorporated (joint project with Cityland, Inc.)
Oxford Mansion
Windsor Mansion
The Group has also a number of prime lots reserved for future projects. Its land bank is situated in
strategic locations ideal for horizontal and vertical developments.
Internal sources of liquidity come from sales of condominiums and real estate projects, rental income
from leased properties, collection of installment receivables, maturing short-term investments and notes
receivable while external sources come from SEC-registered commercial papers.
Plan of Operations
The Group will continue to maintain a cautious stance in order to continuously achieve a healthy
financial position. This will ensure that the development and construction of all its existing projects
will be delivered on time or even ahead of its scheduled turnover. The Group will also continue to
scout and develop quality projects suited for the middle and working class which will be situated at
convenient locations with affordable and flexible payment terms. The Group’s projects will be funded
through cash generated from operations and issuance of commercial papers. The Group plans to remain
liquid in order to avail attractive investment opportunities to meet the demands of the present growing
economy.
As for the Group’s future projects, CDC plans to launch Pioneer Heights 1, a 26-storey residential/
commercial condominium which is located along Pioneer St., Mandaluyong City. CDC also launched
last April 2018 101 Xavierville, a 40-storey residential/ commercial condominium located along
Xavierville Avenue, Loyola Heights, Quezon City. Meantime, its subsidiary, CLDI, plans to launch
One Hidalgo, a 39-storey condominium located along P. Hidalgo Lim St., corner Gen. Malvar St.,
Malate, Manila.
Financial Condition/Changes in Financial Condition (March 31, 2018 vs. December 31, 2017)
Total assets amounted to P=9.71 billion as of the first quarter of 2018, slightly lower by approximately
0.10% as compared with the previous year’s ending balance of P=9.70 billion. Sale of condominium
units increased the Group’s installment contracts receivable and decreased real estate properties for
sale. The Group’s fund were generated from sales and lease of condominium units and other real estate
projects, while other financial sources came from issuance of commercial papers with interest rates
ranging from 1.06% to 1.25%. Majority of the funds were utilized for operations and to finance the
construction of the on-going projects which led its progressive increase in the projects’ percentage of
completion. The Group also partially settled notes payable which amounted to P=158.25 million,
bringing down the outstanding notes payable by 10.89% from its previous balance of P=1.45 billion. In
addition, the healthy cash position allowed the acquisition of a property held for future development.
Excess cash from operations were shifted to shorter-term investments to increase funds for operations.
On the liability side, total liabilities were reduced by P=152.06 million, equivalent to 7.74% of total
liabilities. The reduction was due to partial payment of notes payable and decrease in deferred income
tax liabilities.
Total equity stood at P=7.89 billion as of March 31, 2018, higher by 2.09% from 2017 year-end balance
of P=7.73 billion due to comprehensive income of P=158.81 million.
As a result of the foregoing, the Group’s liquidity position remained stable with acid-test and current
ratio of 1.51:1 and 2.22:1 as of March 31, 2018, as compared to 1.69:1 and 2.42:1 in
December 31, 2017, respectively. On the other hand, debt-equity ratio slightly improved to 0.19:1 as of
March 31, 2018, as compared to 0.22:1 in December 31, 2017.
Financial Condition/Changes in Financial Condition (December 31, 2017 vs. December 31, 2016)
Total assets amounted to P=9.70 billion as of December 31, 2017, lower by 1.74% as compared with the
previous year’s ending balance of P=9.87 billion. Sale of condominium units decreased the Group’s real
estate properties for sale, while collections from sale of real estate properties decreased installment
contracts receivable. The Group’s fund were generated from sales of condominium projects and rental
income, while other financial sources came from issuance of commercial papers with interest rates
ranging from 1.06% to 1.25%. Majority of the funds were utilized for operations, development of

27
projects and partial settlement of liabilities. This led to the increase in the percentage of completion of
the Group’s on-going projects and completion of a new building for lease in Mandaluyong City, the
CityNet Central. Excess cash and cash equivalents were shifted to both short-term and long-term
investments consequently, increasing the balance of notes receivable.
On the liability side, total liabilities were reduced by P=587.16 million, equivalent to 23.00% of total
liabilities. The reduction was due to partial payment of accounts payable and accrued expenses and
reversal of deposit of Pines Peak Tower II and One Taft Residences since these projects reached
beyond the preliminary stage of construction. In addition, income taxes paid including creditable and
final withholding taxes in 2017 amounted to P=181.52 million.
Total equity stood at P=7.73 billion as of December 31, 2017, higher by 5.67% from 2016 year-end
balance of P=7.32 billion due to comprehensive income of P=552.42 million less cash dividends declared
by CDC of P=135.02 million and by the subsidiaries of P=8.08 million.
As a result of the foregoing, the Group’s liquidity position recorded an acid test and current ratio of
1.69:1 and 2.42:1 as of December 31, 2017, as compared to 1.66:1 and 2.43:1 in December 31, 2016,
respectively. On the other hand, debt-equity ratio slightly improved to 0.22:1 as of December 31, 2017,
as compared to 0.26:1 as of the same period of the previous year.
Financial Condition/Changes in Financial Condition (December 31, 2016 vs. December 31, 2015) The Group maintained a healthy financial position as it ended the year with total assets of P=9.87 billion,
12% higher as compared to the previous year’s ending balance of P=8.81 billion. The increase in assets
can be attributed to increase in installment contracts receivable, real estate properties for sale and for
future development and investment properties. The Group’s resources were substantially derived from
sales of condominium projects resulting to the increase in installment contracts receivable, while other
financial sources came from the issuance of commercial papers with interest rates ranging from 1.06%
to 1.31%. Most of the Group’s resources were utilized for operation and for the development of the on-
going condominium projects. Funds were also used to acquire three parcels of land in 2016, increasing
real estate properties for future development.
The growth in business activities led to the increase in total liabilities by 48.33% from higher notes
payable and accounts payable and accrued expenses. Furthermore, the Group declared cash dividends
of P=0.066 per share in the second quarter of 2016, while excess funds were channeled to shorter term
investments resulting to the increase in cash and cash equivalents account.
Total equity stood at P=7.32 billion as of December 31, 2016, higher by 3.18% from 2015 year-end
balance of P=7.09 billion due to comprehensive income of P=471.22 million less cash dividends declared
by CDC of P=235.75 million and by the subsidiaries of P=10.47 million.
As a result of the foregoing, the Group’s liquidity position registered an acid test and current ratio of
1.66:1 and 2.43:1 as of 2016, as compared to 2.45:1 and 3.42:1 in December 31, 2015, respectively. On
the other hand, solvency position translated to a debt-equity ratio of 0.26:1 as of 2016, as compared to
0.19:1 as of 2015.
Financial Condition/Changes in Financial Condition (December 31, 2015 vs. December 31, 2014) The Group’s balance sheet remained solid with total assets of P=8.81 billion as of 2015, 6.16 % higher
than the previous year’s level of P=8.30 billion. Increase in assets was primarily attributed to the
increase in short-term cash investments, installment contracts receivable, and investment properties.
Sales of real estate and collections of installment contract receivable increased the Group’s funds. The
parent company also sold a raw land in 2015, which increased the Group’s cash account. Other sources
of funds came from issuance of commercial papers with interest rates ranging from 1.06% to 1.25%.
Most of the funds were utilized in financing the Group’s on-going condominium projects, namely
Grand Central Residences, Pines Peak Tower I and North Residences. The healthy cash position
allowed the Group to purchase of a prime lot and finance the development costs of the building for
lease consequently increasing investment properties by 39.53%. Excess funds were channeled to longer
period investments to increase interest earnings.

28
On the liabilities side, the Group partially settled its contracts payable amounting to P=112.50 million
and notes payable of P=5.01 billion in 2015. Contracts payable balance as of December 31, 2015
amounting to P=52.75 million pertains to the investment property acquired during the year and was fully
settled on February 18, 2016. In addition, notes payable availed during 2015 amounted to P=4.93 billion.
Net effect of the aforementioned transactions, reduced the notes and contracts payable account by
10.53%.
Total equity stood at P=7.09 billion as of December 31, 2015 from P=6.42 billion as of
December 31, 2014 due to total comprehensive income of P=771.72 million net of cash dividends
declared and paid by the Group amounting to P=106.44 million.
The foregoing resulted to an enhanced liquidity position with current ratio and acid ratio recorded at
3.42:1 and 2.45:1 in 2015 as compared to 2.85:1 and 1.74:1 in 2014. Moreover, the decrease in total
liabilities strengthened the Group’s debt-equity ratio which improved to 0.19:1 in 2015 from 0.24:1 in
2014.
Results of Operation (March 31, 2018 vs. March 31, 2017)
Sales expanded by 34.18% in March 31, 2018 reaching P=375.50 million from P=279.86 million as
compared to the same period of the previous year. The increase in sales was attributed to higher sales
and construction accomplishment of several projects. As of March 31, 2018, CDC generated 66.39% in
total revenue on sales of real estate properties. Pines Peak Tower II contributed P=106.73 million, while
a substantial portion came from the sales of the remaining units of Grand Central Residences and Pines
Peak Tower I, totaling P=96.82 million and P=27.37 million, respectively. Percentage of sales contribution
to total Group sales of Pines Peak Tower II, Grand Central Residences and Pines Peak Tower I reached
28.42%, 25.78% and 7.29%, respectively. Since Grand Central Residences and Pines Peak Tower I
were almost sold out, revenues of CDC are projected to be generated from the sale and construction
accomplishment of Pines Peak Tower II and launching of future projects.
On the other hand, CLDI contributed 28.67% of the Group’s sales. Its latest condominium project,
North Residences, was in full blast construction as of March 31, 2018. This project reached total sales
of P=94.64 million, representing 25.20% of the Group’s sales.
Other sources of income are financial income, rent income and other income. Financial income which
is composed of interest income from sale of real estate properties, cash and cash equivalents, short-term
cash investments and notes receivable contributed 16.65% of total revenues. Likewise, rent income
grew by 10.38% from P=27.26 million to P=30.09 million in the first quarter of 2017 and 2018,
respectively. Rent income came from the lease operations of CityNet Central, CityNet1 and other
properties which are held for lease. Other revenue, on the other hand, are primarily from adjustment of
market value of repossessed units, penalties charged to clients, and other miscellaneous income.
Revenue contribution of this account increased by 12.29%, amounting to P=28.00 million and P=24.93
million for the quarter ended March 31, 2018 and 2017, respectively.
On the cost side, cost of real estate sales and operating expenses and provision for income tax increased
due to higher revenues.
Results of Operation (December 31, 2017 vs. December 31, 2016)
Net income for the year 2017 reached P=551.93 million, higher by 15.86% as compared to
P=476.37 million last year. The Group follows the percentage of completion method in recognizing
revenue hence, realized revenue for projects in the initial stages of completion is lower as compared to
projects with higher completion rates. As of December 31, 2017, Pines Peak Tower II reached a
completion rate of 52.98% thereby allowing the partial recognition of income for this project as
compared to last year’s completion rate of 7.50%. CDC contributed 65.12% in total revenue on sales of
real estate properties. Pines Peak Tower II contributed P=261.39 million, while a large portion came
from the sales of the remaining units of Grand Central Residences and Pines Peak Tower I, totaling
P=333.14 million and P=130.06 million, respectively. Percentage of sales contribution to total Group sales
of Pines Peak Tower II, Grand Central Residences and Pines Peak Tower I reached 19.89%, 25.42%
and 9.92%, respectively. It is to be noted that Pines Peak Tower I inventory level was already less than
10% at the beginning of the year resulting to lower sales of this project in 2017 as compared to the
previous year.

29
On the other hand, CLDI contributed 33.54% of the Group’s sales. Its latest condominium project,
North Residences, reached a high completion rate of 97.37% from 75.55% of the same period last year.
This project reached total sales of P=352.28 million, representing 26.88% of the Group’s sales. One Taft
Residences, the latest condominium project launched last year reached 14.93% completion rate
allowing the partial realization of revenues in 2017. The Group is optimistic that this project will
contribute significantly to future sales revenue.
Other sources of income are financial income, rent income and other income. Financial income which
is composed of interest income from sale of real estate properties, cash and cash equivalents, short-term
cash investments and notes receivable contributed 17.80% of total revenues. Likewise, rent income
contributed P=119.68 million, higher from the previous year’s level of P=92.76 million brought about by
the rental income from CityNet Central and other lease contracts entered into by the Group. Other
income consists primarily from adjustment of market value of repossessed units, penalties charged to
clients, and other miscellaneous income. Revenue contribution of this account reached P=84.78 million
and P=65.37 million for the years ended December 31, 2017 and 2016, respectively.
On the cost side, cost of real estate sales and operating expenses decreased as these accounts move in
tandem with sales.
Altogether, the consolidated net income of 2017 reached P=551.93 million, 15.86% higher as compared
to P=476.37 million of the same period last year. This translated to earnings per share and return on
equity of P=0.12 and 7.20% as compared to the same period of the previous year of P=0.11 and 6.94%,
respectively.
Results of Operation (December 31, 2016 vs. December 31, 2015)
The Group posted a net income of P=476.37 million as compared to P=775.77 million of the same period
of the previous year. Net income was comparatively higher last year due to the sale of a parcel of land
in 2015. The completion of Pines Peak Tower I in the first quarter of 2016 increased revenue on sales
posting a contribution of 41.58% and percentage of sold units at 90.76%, while Grand Central
Residences contributed 24.42% and percentage of sold units was at 78.69%. The Group’s on-going
project, North Residences, was in full blast construction resulting to 75.55% completion rate from last
year’s 37.73%. The continuous demand for residential condominiums prompted the Group to launch
Pines Peak Tower II in June 2016 which is located beside Pines Peak Tower I. In addition, another
condominium project, One Taft Residences, was launched in October 2016.
Other sources of revenues are financial income, rent income and other income. Financial Income which
is substantially composed of interest income from sales of real estate properties slightly increased by
1.24% and contributed 14.95% to total revenues. As for leasing operations, rent income reached
P=92.76 million, higher by 11.41% as compared to the same period last year. Revenues from lease were
generated mostly from the BPO building, CityNet1. Another source of revenue is other income which
is substantially earned from penalties charged to clients and other miscellaneous income.
On the cost side, cost of real estate sales decreased as this move in tandem with sales, while higher
percentage of common expenses shared, increased operating expenses by 26.13%. In addition, the
Group’s interest expense from commercial papers increased by P=1.20 million as compared to the same
period last year. Other expenses resulting from forfeiture increased by 8.91% amounting to
P=33.10 million from P=30.39 million in 2016 and 2015, respectively. On the other hand, lower net
income decreased provision for income tax by 40.84%.
The decrease in consolidated income of the Group translated to lower earnings per share and return on
equity (both annualized) of P=0.11 and 6.94% as compared to the same period of the previous year of
P=0.19 and 11.97%, respectively.
Results of Operation (December 31, 2015 vs. December 31, 2014)
The Group’s sales of real estate properties amounted to P=2.371 billion in the current year outperforming
last year’s figure of P=1.15 billion, thus, leading to an increase of 105.76%. The significant increase in
sales was due to the sale of a raw land and the continuous sales and high accomplishment rates of the
Group’s condominium projects. Consequently, realized gross profit increased by 116.47% from
P=438.50 million in 2014 to P=949.24 million in 2015. The Parent Company’s project, Grand Central
Residences I, was completed in 2015, while Pines Peak Tower I was in the final stages of completion
and was turned over in the first quarter of 2016. The fast construction of the two projects led to their
sales contribution of 23.83% and 29.28%, respectively. Total sell-out rate as of 2015, which refers to

30
the percentage of total units that were sold for Grand Central Residences and Pines Peak Tower I, were
at 64.30% and 60.52% as compared to 47.91% and 16.54% in 2014, respectively.
Revenue on sales of real estate properties were likewise increased by another subsidiary, CLDI.
Construction accomplishment of the new project, North Residences, rose to 37.73% from the previous
year’s 1.01%, allowing the increase in realization of revenues in 2015. Revenues on sales are expected
to increase as the construction accomplishment of North Residences advances. To increase future
revenues, CLDI plans to launch a new project in Manila.
Other sources of revenues are financial income, rent income and other income. Financial income,
which is substantially composed of interest income from sales of real estate properties, increased by
2.36% and contributed 10.03% to total revenues. As for leasing operations, rent income from the BPO
building, Citynet1, continued to generate steady rental income. This is further augmented by rentals of
condominium and other investment properties resulting to a total rent income of P=83.26 million.
Another source of revenues is the other income which is substantially earned from penalties charged to
clients, and other miscellaneous income. Revenue contribution of other income accounted for 3.45%
and 4.15% of total revenues in 2015 and 2014, respectively.
On the cost side, cost of real estate sales, operating expenses and provision for income tax increased as
these move in tandem with sales. The Group was successful in managing its disbursements as cost of
sales percentage to sales was maintained at 59.97% and 61.95% in 2015 and 2014, respectively.
Maintaining its conservative view on borrowings, the Group’s interest-bearing expense from
commercial papers remained manageable at P=13.32 million as compared to the prior year’s
P=13.12 million.
The Group ended in 2015 with a net income of P=775.77 million outperforming last year’s figure of
P=417.66 million, thus, leading to an increase of 85.74%. This translated to an earnings per share and
return on equity of P=0.19 and 11.97% for 2015 as compared to P=0.10 and 6.69% of the same period last
year.
Key Performance Indicators (2017 vs 2016 vs 2015)
Cityland Development Corporation
(Consolidated)
2017
2016
2015
Earnings per share P=0.12 P=0.11 P=0.19
Return on equity 7.20% 6.94% 11.97% Solvency ratio 0.30 0.20 0.47
Interest rate coverage ratio 84.00 110.18 154.37
Asset to liability ratio 4.93 3.87 5.12 Asset to equity ratio 1.44 1.54 1.42
Debt to equity ratio 0.22 0.26 0.19
Current ratio 2.42 2.43 3.42 Acid – test ratio 1.69 1.66 2.45
City & Land Developers, Incorporated
(Subsidiary)
Earnings per share P=0.10 P=0.05 P=0.05 Return on equity 6.79% 3.60% 4.00%
Solvency ratio 0.49 0.15 0.49 Interest rate coverage ratio 21,937.96 132.46 74.45
Asset to liability ratio 8.17 5.26 13.16
Asset to equity ratio 1.14 1.23 1.08 Debt to equity ratio 0.08 0.08 0.05
Current ratio 6.59 5.05 9.20
Acid – test ratio 4.40 2.96 7.14
Cityplans, Incorporated
(Subsidiary)
Earnings per share P=0.08 P=0.03 P=0.02
Return on equity 3.90% 1.41% 0.96% Solvency ratio 0.35 0.20 0.11
Asset to liability ratio 6.28 5.84 5.32
Asset to equity ratio 1.24 1.26 1.27 Current ratio 14.43 12.13 10.81
Acid – test ratio 15.31 12.76 10.05

31
Manner of Calculation:
Earnings per share = Net income after tax
Outstanding number of shares
Return on equity ratio = Net income after tax
Total Equity
Solvency ratio = Net income after tax + Depreciation expense
Total liabilities
Interest rate coverage
ratio
= Income before income tax + Depreciation expense + Interest expense
Interest expense
Asset-to-liability ratio = Total assets / Total liabilities
Asset-to-equity ratio = Total assets
Total equity (net of net changes in fair value of available-for-sale
financial assets and accumulated re-measurement on defined benefit plan)
Debt-to-equity ratio = Notes payable and contracts payable
Total equity (net of net changes in fair value of available-for-sale financial assets and accumulated re-measurement on defined benefit
plan)
Current ratio
=
Total current assets / Total current liabilities
Acid-test ratio
=
Cash and cash equivalents + Short-term cash investments +
Current portion of installment contracts receivable + Current portion of notes receivable + Current portion of other receivables + Available-for-
sale financial assets
Total current liabilities
1. Any Known Trends, Events or Uncertainties (material impact on liquidity)
There are no known trends, events, and uncertainties that have a material effect on liquidity.
2. Internal and External Sources of Liquidity
Internal sources come from sales of condominiums and real estate projects, collection of installment
contracts receivable, maturing short-term investments and notes receivable, and other sources such as
rental income, interest income and dividend income. External sources come from issuances of
commercial papers.
3. Any Material Commitments for Capital Expenditures and Expected Sources of Funds of such
Expenditures
The estimated development cost of P=97.20 million as of December 31, 2017 representing the cost to
complete the development of real estate projects sold will be sourced through:
a) Sales of condominium and real estate projects
b) Collection of installment contracts receivable
c) Maturing short-term investments and notes receivable
d) Issuance of commercial papers
4. Any Known Trend or Events or Uncertainties (Material Impact on Net Sales or Revenues or
Income)
There is no known trend, event, or uncertainties that have a material effect on the net sales or
revenues or income.

32
5. Any Significant Elements of Income or Loss that did not arise from Registrant’s Continuing
Operations
There were no significant element of income or loss that did not arise from registrants continuing
operations.
6. Any Known Trends or Events or Uncertainties (Direct or Contingent Financial Obligation)
There are no events nor any default or acceleration of an obligation that will trigger direct or
contingent financial obligation that is material to the Group.
7. Any Known Trends or Events or Uncertainties (Material off-balance sheet transactions,
arrangements, obligations and other relationships)
There are no material off-balance sheet transactions, arrangements, obligations (including contingent
obligations) and other relationships of the Group with unconsolidated entities or other persons created
during the reporting period.
8. Any Seasonal Aspects that had Material Effect on the Financial Condition or Results of
Operations
There are no seasonal aspects that had material effect on the financial condition or results of
operations.
9. Causes for any Material Changes from Period to Period in One or More Line of the
Registrant's Financial Statements
Financial Condition (March 31, 2018 vs. December 31, 2017)
a. Increase in Cash and Cash Equivalents was substantially due to sales, collection of receivables
and shift of funds to shorter period investments.
b. Decrease in Short-term Cash Investments was substantially due to shift of funds to shorter period
placements, partial payment of notes payable, payment of cost of operations, development of
projects and acquisition of land for future development.
c. Increase in Installment Contracts Receivables was due to sales of real estate properties.
d. Net decrease in Other Receivables was substantially due to collection of advances to customers.
e. Decrease in Real Estate Properties for Sale was due to sales of real estate properties and transfer
to investment properties.
f. Increase in Investments in Trust Fund was due to additional contribution to the trust fund.
g. Decrease in Prepaid Income Tax was due to application to the income tax payable as of the first
quarter of 2018.
h. Increase in Real Estate Properties for Future Development was due to acquisition of land for
future development and other development costs incurred.
i. Decrease in Investment Properties was due to depreciation of buildings for lease.
j. Decrease in Property and Equipment was due to depreciation.
k. Increase in Deferred Income Tax Assets – net was due to increase in realized gain on sale of real
estate transactions and higher accrued expenses of CLDI.
l. Decrease in Other Asset - Current was due to utilization of input VAT and amortization of
prepaid real estate tax.
m. Decrease in Accounts Payable and Accrued Expenses was due to partial payment of trade
payables. n. Decrease in Notes Payable was due to settlement of matured notes payable.
o. Increase in Income Tax Payable was due higher taxable income.
p. Decrease in Deferred Tax Liabilities – net was primarily due to decrease in unrealized gain on
real estate transactions.
q. Increase in Retained Earnings was due to net income.
r. Decrease in Net Changes in Fair Value of Investments was due to decrease in market value of
available-for-sale financial assets.
s. Increase in Non-Controlling Interests was due to net income of subsidiaries.

33
Financial Condition (December 31, 2017 vs. December 31, 2016)
a. Decrease in Cash and Cash Equivalents was substantially due to shift of investments to short and
long-term investments, partial payment of notes and accounts payable and accrued expenses,
income tax and development costs of projects and payment of cash dividends.
b. Increase in Short-term Cash Investments was substantially due to sales, collections of receivables
and shift to excess cash and cash equivalents to longer period placements.
c. Net decrease in Installment Contract Receivable was due to collections.
d. Increase in Notes Receivable was due to placements made by the Company in different financial
institutions.
e. Net decrease in Other Receivables was substantially due to collections of advances paid for real
estate taxes and advances paid to contractors.
f. Decrease in Real Estate Properties for Sale was due to sales of real estate properties and partial
reclassification of account to investment properties.
g. Decrease in Investments in Trust Funds was due payment of matured and terminated pension
plans.
h. Increase in Prepaid Income Tax was due to higher creditable withholding tax charged to income
tax payable.
i. Increase in Real Estate Properties for Future Development was due to additional cost incurred
and properties transferred from Investment Properties.
j. Increase in Investment Properties was due to additional development costs incurred for the
construction of the building for lease.
k. Increase in Property and Equipment was due to acquisition of office equipment.
l. Increase in Retirement Plan Assets was due to increase in contributions in 2017 and increase in
investments.
m. Increase in Deferred Tax Assets - net was due to increased realized gain on sale of real estate
transactions of CLDI and higher accrued expenses of the Group.
n. Increase in Other Assets - current was due to prepaid real estate taxes while decrease in Other
Assets - noncurrent was primarily due to refund of Meralco meter deposits.
o. Decrease in Accounts Payable and Accrued Expenses was primarily due to reversal of deposits
of Pines Peak Tower II and One Taft Residences, lower deferred rent and partial payment
development costs, withholding taxes and other trade payables.
p. Decrease in Notes Payable was due to partial settlement of notes payable.
q. Decrease in Income Tax Payable was due to payment and lower taxable income.
r. Decrease in Pre-need and Other Reserves was due to maturities and termination of pension plans.
s. Decrease in Deferred Tax Liabilities- net was primarily due to decrease in deemed cost
adjustment and unrealized gain on real estate transactions of CDC.
t. Increase in Capital Stock was due to issuance of 5% stock dividends.
u. Increase in Retained Earnings was due to net income recognized as of December 31, 2017, net of
cash and stock dividends.
v. Decrease in Net Changes in Fair Value of Investments was due to decrease in market value of
available-for-sale financial assets.
w. Increase in Accumulated Re-measurement on Defined Benefit Plan was due to increase in value
of plan assets.
x. Increase in Non-Controlling Interests was due to net income of subsidiaries.
Financial Condition (December 31, 2016 vs. December 31, 2015)
a. Increase in Cash and Cash Equivalents was substantially due to sales, collection of receivables
and shift of funds to shorter period investments.
b. Decrease in Short-term Cash Investments was primarily due to shift of funds to shorter period
placements, acquisitions of land for future development, payment of cash dividends and payment
of development cost of investment properties.
c. Net increase in Installment Contract Receivable was due to sales of real estate properties.
d. Increase in Other Receivables was substantially due to long-term cash investments, advances to
contractors and other prepaid expenses.
e. Increase in Real Estate Properties for Sale was due to the launching of a new condominium
project of the subsidiary, CLDI.
f. Decrease in Investments in Trust Funds was due to the decline in cash and cash equivalents held
in the trust fund as a result of the decrease in the return of investment and payment of maturities
and termination values of the plan.
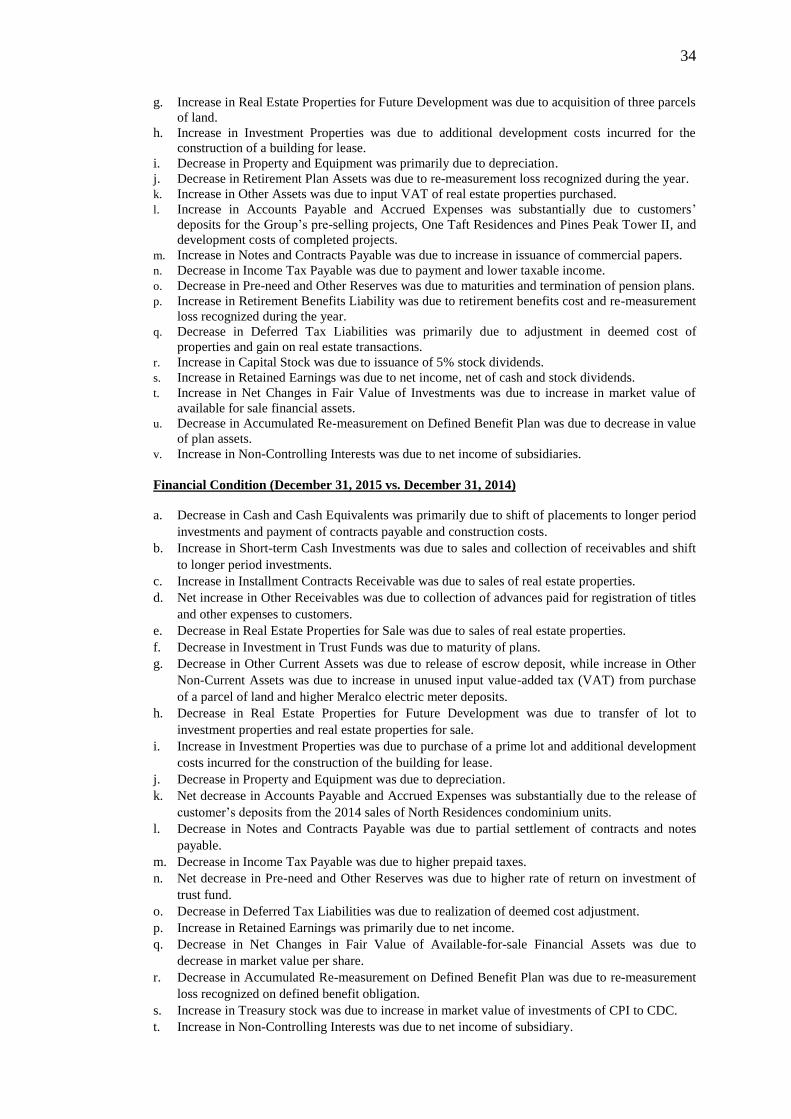
34
g. Increase in Real Estate Properties for Future Development was due to acquisition of three parcels
of land.
h. Increase in Investment Properties was due to additional development costs incurred for the
construction of a building for lease.
i. Decrease in Property and Equipment was primarily due to depreciation.
j. Decrease in Retirement Plan Assets was due to re-measurement loss recognized during the year.
k. Increase in Other Assets was due to input VAT of real estate properties purchased.
l. Increase in Accounts Payable and Accrued Expenses was substantially due to customers’
deposits for the Group’s pre-selling projects, One Taft Residences and Pines Peak Tower II, and
development costs of completed projects.
m. Increase in Notes and Contracts Payable was due to increase in issuance of commercial papers.
n. Decrease in Income Tax Payable was due to payment and lower taxable income.
o. Decrease in Pre-need and Other Reserves was due to maturities and termination of pension plans.
p. Increase in Retirement Benefits Liability was due to retirement benefits cost and re-measurement
loss recognized during the year.
q. Decrease in Deferred Tax Liabilities was primarily due to adjustment in deemed cost of
properties and gain on real estate transactions.
r. Increase in Capital Stock was due to issuance of 5% stock dividends.
s. Increase in Retained Earnings was due to net income, net of cash and stock dividends.
t. Increase in Net Changes in Fair Value of Investments was due to increase in market value of
available for sale financial assets.
u. Decrease in Accumulated Re-measurement on Defined Benefit Plan was due to decrease in value
of plan assets.
v. Increase in Non-Controlling Interests was due to net income of subsidiaries.
Financial Condition (December 31, 2015 vs. December 31, 2014)
a. Decrease in Cash and Cash Equivalents was primarily due to shift of placements to longer period
investments and payment of contracts payable and construction costs.
b. Increase in Short-term Cash Investments was due to sales and collection of receivables and shift
to longer period investments.
c. Increase in Installment Contracts Receivable was due to sales of real estate properties.
d. Net increase in Other Receivables was due to collection of advances paid for registration of titles
and other expenses to customers.
e. Decrease in Real Estate Properties for Sale was due to sales of real estate properties.
f. Decrease in Investment in Trust Funds was due to maturity of plans.
g. Decrease in Other Current Assets was due to release of escrow deposit, while increase in Other
Non-Current Assets was due to increase in unused input value-added tax (VAT) from purchase
of a parcel of land and higher Meralco electric meter deposits.
h. Decrease in Real Estate Properties for Future Development was due to transfer of lot to
investment properties and real estate properties for sale.
i. Increase in Investment Properties was due to purchase of a prime lot and additional development
costs incurred for the construction of the building for lease.
j. Decrease in Property and Equipment was due to depreciation.
k. Net decrease in Accounts Payable and Accrued Expenses was substantially due to the release of
customer’s deposits from the 2014 sales of North Residences condominium units.
l. Decrease in Notes and Contracts Payable was due to partial settlement of contracts and notes
payable.
m. Decrease in Income Tax Payable was due to higher prepaid taxes.
n. Net decrease in Pre-need and Other Reserves was due to higher rate of return on investment of
trust fund.
o. Decrease in Deferred Tax Liabilities was due to realization of deemed cost adjustment.
p. Increase in Retained Earnings was primarily due to net income.
q. Decrease in Net Changes in Fair Value of Available-for-sale Financial Assets was due to
decrease in market value per share.
r. Decrease in Accumulated Re-measurement on Defined Benefit Plan was due to re-measurement
loss recognized on defined benefit obligation.
s. Increase in Treasury stock was due to increase in market value of investments of CPI to CDC.
t. Increase in Non-Controlling Interests was due to net income of subsidiary.

35
Results of Operations (March 31, 2018 vs. March 31, 2017)
a. Increase in Sales of Real Estate was primarily due to higher sales and construction
accomplishment of Pines Peak Tower II and North Residences.
b. Increase in Financial Income was due to higher interest income from sale of real estate properties
and long-term cash investments.
c. Increase in Rent Income was due to rentals earned from the new building for lease, CityNet
Central, and additional lease contracts entered by CDC.
d. Increase in Other Income was due to the increase in value of repossessed real estate properties
for sale.
e. Increase in Cost of Real Estate Sales was due to higher sales of real estate properties.
f. Increase in Operating Expenses was due to higher sales and increase in personnel expenses,
depreciation, professional fees, outside services, repairs and maintenance, rent expense, brokers’
commission and other operating expenses.
g. Increase in Financial Expenses was due to lower capitalized interest.
h. Increase in Other Expenses was due to higher adjustment of prior years’ income from forfeited
units.
i. Increase in Provision for Income Tax was due to higher revenues.
j. Increase in Net Income was primarily due to higher revenues.
Results of Operations (December 31, 2017 vs. December 31, 2016)
a. Decrease in Sale of Real Estate was primarily due to lower sales recognized from Pines Peak
Tower I, since this was almost fully sold last year. Furthermore, revenues are recognized under
the percentage of completion under the accounting method, and One Taft Residences is still in its
initial stage of completion.
b. Increase in Financial Income was due to higher interest income from sale of real estate properties
and long-term cash investments.
c. Increase in Rent Income was due to rentals earned from the new building for lease, CityNet
Central, and additional lease contracts entered by the Group.
d. Increase in Other Income was due to the higher management fees charged by the Group and
increase in value of repossessed real estate properties for sale.
e. Decrease in Cost of Real Estate Sales was primarily due to lower sales.
f. Decrease in Operating Expenses was due to decrease in personnel expenses, decrease in taxes
and licenses, professional fees, outside services, membership dues, advertising and promotions,
brokers’ commission, repairs and maintenance, rent expense, donations, postage, telephone and
telegraph, stationery and office supplies and other miscellaneous expenses.
g. Increase in Financial Expenses was primarily due to increase in interest expense on commercial
papers.
h. Decrease in Other Expenses was due to decrease in forfeiture/ cancellation of prior years’ sales.
i. Decrease in Provision for Income Tax was due to lower taxable income.
j. Increase in Net Income was due to lower expenses and provision for income tax.
Results of Operations (December 31, 2016 vs. December 31, 2015)
a. Decrease in Sale of Real Estate was substantially due to the sale of a parcel of land last year.
b. Increase in Financial Income was due to higher total investment balance as compared to the
previous year.
c. Increase in Rent Income was due to additional lease contracts entered during the year.
d. Decrease in Other Income was substantially due to the lower number of forfeited units in 2016.
e. Decrease in Cost of Real Estate Sales was due to sale of lot by the Parent Company last year.
f. Increase in Operating Expenses was due to higher personnel expenses, taxes and licenses, outside
services, insurance expense, membership and association dues and other expenses.
g. Decrease in Financial Expenses was due to higher capitalized interest expense as compared to
the previous year.
h. Increase in Other Expenses was due to higher adjustment of prior year’s income of forfeited
units.
i. Decrease in Provision for Income Tax was due to lower net income.
j. Decrease in Net Income was due to lower sales of real estate properties as compared to the
previous period.

36
Results of Operations (December 31, 2015 vs. December 31, 2014)
a. Increase in Sales of Real Estate Properties was substantially due to sale of a lot by CDC.
b. Increase in Financial Income was due primarily due to higher interest earnings from short-term
cash investments resulting in higher level of placements.
c. Decrease in Rent Income was due to termination of lease contracts resulting from sale of
condominium units.
d. Increase in Other Income was primarily due to adjustment of fair market value of repossessed
real estate properties.
e. Increase in Cost of Real Estate Sales was due to cost of land sold by CDC.
f. Increase in Operating Expenses was primarily due to higher personnel expenses, professional
fees and light, power and water.
g. Increase in Financial expenses was due to higher finance charge and interest on notes payable
and other charges.
h. Decrease in Other Expenses was due to loss from forfeiture.
i. Increase in Provision for Income Tax was due to higher taxable income.
j. Increase in Net Income was due to higher revenues.
Information on Independent Accountant
Sycip Gorres Velayo & Co. is the Group’s external auditor for the years 2017 and 2016. The engagement
partner for the year 2017 is Ms. Aileen L. Saringan while in 2016, the engagement partner is Ms.
Josephine H. Estomo.
External Audit Fees
2017 2016
Audit and audit-related fees (Parent Company) P=950,000 P=935,000
Tax fees – –
All other fees – –
Total P=950,000 P=935,000
The Group did not avail any non-audit related services from external parties.
The Audit and Risk Committee’s approval policies and procedures consist of:
a. Discussion with the external auditors of the Audited Financial Statements.
b. Recommendation to the Board of Directors the approval and release of the Audited Financial
Statements.
c. Recommendation to the Board of Directors the appointment of the external auditors.
DIVIDENDS AND MARKET PRICE OF SHARES OF STOCK
1. Dividends Policy
Dividends declared by the Group on its shares of stock are payable in cash or in additional shares of stock.
The payment of dividends in the future will depend upon the earnings, cash flow, and financial condition
of the Group and other factors.
Dividends declared on shares of stock are payable in cash or in additional shares of stock. Future dividend
payments, if any, will depend on the earnings, cash flow and financial condition of the Group and other
factors.
The Corporation Code prohibits stock corporations from retaining surplus profits in excess of 100% of
their paid-in capital stock, except when justified by definite corporate expansion projects or programs
approved by the Board of Directors (BOD), or when the corporation is prohibited under any loan
agreement with any financial institution or creditor from declaring dividends without its consent, and such
consent has not yet been secured, or when it can be clearly shown that such retention is necessary under
special circumstances obtaining in the corporation.

37
2. Dividends
2017 2016 2015
Cash P=0.036 P=0.066 P=0.027
Stock 5% 5% -
Cash dividends on common shares were deducted from retained earnings upon declaration by the BOD.
All cash dividends due during the year were paid.
The Parent Company declared 5% stock dividends in 2017. All stock dividends declared during the year
were distributed.
Stock dividends on common shares are measured based on the total par value of declared stock dividend.
Stock dividends are deducted from retained earnings when the BOD’s declaration is ratified by the
stockholders of the Parent Company. Unissued stock dividends are recorded as stock dividends
distributable and credited to capital stock upon issuance. Dividends for the year that are declared after the
end of the reporting period but before the approval for issuance of financial statements are dealt with as an
event after the reporting period.
3. Stock Prices
Unclassified Common Shares
High Low
2018 First Quarter 1.19 0.99
2017 First Quarter 1.45 1.13
Second Quarter 1.63 1.14
Third Quarter 1.65 1.46
Fourth Quarter 1.48 1.10
2016 First Quarter 1.19 0.90
Second Quarter 1.25 0.96
Third Quarter 1.25 0.98
Fourth Quarter 1.59 1.00
Note: Prices in 2017 took into account the 5% stock dividends declared to the stockholders of
record as of July 6, 2017.
4. Trading Market
The Registrant’s common equity is traded in the Philippine Stock Exchange.
The Registrant has no plans of acquisition, business combination, or other reorganization that will take
effect in the near future that involves issuances of securities.
5. Price Information on the Latest Practicable Date
The Registrant’s shares were last traded on May 3, 2018 at P=0.99 per share.
6. Public Ownership
Total number of shares owned by the public as of April 30, 2018 is 1,039,539,680 shares which represent
26.40% of the total 3,940,001,648 number of listed common shares.
7. Holders
a. The number of shareholders of record as of April 30, 2018 was 668.
b. Top 20 Stockholders of record as of April 30, 2018:
Name No. of Shares Held Percentage
1. Cityland, Inc. 2,007,461,023 50.98%
2. PCD Nominee Corporation – Filipino 709,172,849 18.01
3. Liuson, Grace C. 210,117,387 5.34
4. Roxas, Stephen C. 197,493,045 5.02

38
Name No. of Shares Held Percentage
5. Gohoc, Alice C. 135,229,926 3.43
6. Liuson, Andrew I. (Dr.) 120,534,675 3.06
7. Gohoc, Josef C. 77,871,095 1.98
8. Roxas, Helen C. 59,861,325 1.52
9. Recto, Ester 30,752,467 0.78
10. PCD Nominee Corporation - Others 22,683,019 0.53
11. Jefcon, Inc. 18,263,318 0.46
12. Tan, Joyce Liuson or Tan, Philip Sim 17,591,425 0.45
13. Chang, Rita D. 17,034,341 0.43
14. Obadiah, Inc. 16,820,388 0.43
15. Shao Chien Yin &/or Shao, Christine L. 14,387,114 0.37
16. Chiong, Elizabeth 11,989,262 0.30
17. Recto, Ester 11,989,262 0.30
18. Co, Stephen Vincent 10,910,230 0.28
19. Co, Sharon Valerie 10,790,337 0.27
20. Roxas, Jefferson C.
Roxas, Lincoln C.
7,314,199
7,314,199
0.19
0.19
8. Recent Sale of Unregistered Securities (including recent issuance of securities constituting an exempt
transaction)
a. There was no sale of unregistered securities.
b. The total number of shares issued and outstanding of the Company is 3,938,063,701 for 2017
and 3,750,537,168 for 2016 excluding 1,937,947 treasury common shares.
CHANGES IN AND DISAGREEMENTS WITH ACCOUNTANTS ON ACCOUNTING AND
FINANCIAL DISCLOSURE
There are no changes in and disagreements with accountants on accounting and financial disclosures.
COMPLIANCE WITH LEADING PRACTICES ON CORPORATE GOVERNANCE
The evaluation system employed by the Registrant is thru a periodic self-rating system based on the criteria on
the leading practices and principles on good governance.
1. Measures being undertaken by the Registrant to fully comply with the adopted Leading Practices on Good
Corporate Governance
We have implemented the periodic self-rating system.
2. Any Deviation from the Registrant’s Manual of Corporate Governance. (including a disclosure of the
name and position of the persons involved and sanctions imposed on said individual)
There were no major deviations that require sanctions.
3. Any plan to improve corporate governance of the company
Based on the outcome of the periodic self-rating, we will come up with necessary actions / procedures to
improve the corporate governance of the Registrant.
Pursuant to SEC Memorandum Circular No. 5, Series of 2013, the Corporate Governance Section of the
Annual Report has been deleted and to be submitted separately to Securities and Exchange Commission.

39
ACKNOWLEDGEMENT
In behalf of the Board of Directors, Consultants and Management of Cityland Development Corporation, I
would like to express our appreciation to all our stockholders for your trust and confidence.
I also acknowledge the time and expertise shared to us by our consultants and directors and the commitment
and hard work of our managers and staff in the attainment of our corporate goals.
With God’s grace, we look forward to a better year in 2018 for Cityland and the real estate industry.
Upon written request, the Company undertakes to provide without charge a copy of the Annual Report
on SEC Form 17-A. Copies can be picked up from Ms. Michelle Marcelino, 2/F Cityland Condominium
10 Tower I, 156 H.V. Dela Costa Street, Makati City, Tel. 893-6060 local 152.
iilIiIIIilil nil ilIIIlllililffrfflIEIIiltiltililffilltil ilffi ililHffiil iltil filtillt1032,t20.i8001332
SECURITIES AI{D EXCHANGE COMMISSIONSECBu ilding, EDSA, Greenhilla,MandaluyongCig, MetroManila.Phitippines
Tel:(63?) 72&O931 to 39 Far{632r7255293€maii: [email protected]
Barcode PageThe following document has been receivod:
Receiving OffleerlEncoder : Ramon L. LegaspiReceiving Braneh : SEC Head OfficeReceipt Date and Time : March 21, 2A1A 11:38:00 AMReceived From : Head Office
Company Representative
Doc Source
Company lnformation
SEC Registration No.
Company Name
lndustry Classification
CompanyType
Doeument lnformation
0000077s23
CITYLAND DEV. CORF,
Stock Corporation
Document lD
Document Type
Docurnent CodePerisd Covered
No. of Days Late
Department
Remarks
1032120180}fi3217-C {FORM 11-G:CURRENT DISCLIRPT)17-C
March 14, 2A18
0
CFD

##wffire sffiffiffiY5Ee Regi=tration Number
7 s Z {
€sffipf,ruY ereffi€{ q Y niatu!n N B & F v E E {j r M ff. ft I
q,_ d*'& H. p s I} il t,, N
FBBH*GP&L eFSEeE i IrJ$. rSffffi/ Eerengay i ti?l /Iowrt j Fravinte )
z Is g fr & rE q., G qr m i E
!E EM t *? * iY a ! E 5 * * Ei EI e? cl* e
r3 t r t &a E k G *e {- r
Eepartrnent r*quiring ihe
iryii 4ablSecondary Lrcense Type, ti
.epo|-I
eertEfie*tie* *f E#SeF*ft***e *Ercet+r*9 &Gr. Ge*rge *d',el* Y. Syfl€p
€ S# P&F€Y I H F€& IH&YI€SICcmpany's Email Adeiress fcmpany'r T+ieph+ne f,lumbeiffiI s.'lt*:xil=rgJj&:;'+*r= i i 8#5-**6s i
l{q. +f StocF:h*ider=
6$8 *s *fFebr$ac"y ?S. SSiS
M0bile f'Jumltef
l4J i€
Fiscai Yeer i M4nih / Dayi
Seeelnber 3!
A;n,:aj i'deeiir,g li4Onth i L'lalri
**EY&*? p€ftSGru t$lF*ffi ffi &E96ru
Tile 4esiqnated r:*t"rtaet #*rsa* ff{JSE be an iiffi{er *i tiie aorForation
Teiep;rofie ruumberls
i 8q.B-6fi60 I
N*me sl Ccnlact Fei';c*
*.udy Go
-ilEii AiriresE
rg.;*; .a-{r' c i + Erz I; dr: * i
F6oh!ie Numbei-
el*
€effiE&s" pEHs{}H'S AE&REsS
3 r ln casr af death, r€signatian or a5 contact Der50n.be repor",ed ts tfoe Cofirmrssion within thirly {30} *lendar days fram the occurrence ther*af with information and campletecofitact dstails of the fi€w contaf,l person desigaated.
2 : All Soxes musf 5e properly and campletely filied-up. Failure ta do so siiall rause tfte delay in updating thecarparation's recorcs wilh ihe dommissian andlar nan-receipt of Notice of Oeficiencies. F$fther, nan-receipt of Notiae af#efrfi€ficies stid,i i?ot s-xcuse fi'ie t*{poration frar* iiabiiity for iis defciencies.
J'{ Flo*r Cig'l*x+! Collier*!ni'.$ 10, T'ower il,- 15d it,trr, rleia Casfa $tlert, Makaii Citl
Fcrm Typ*i-**r---i._Jl-iirittriit

CERTIFICATION OF INDEPENDENT I}IRECTOR
l. Ceorge Edwin Yu SyCip. American. of legal age and resident of 60 Carnbridge Circle, North Forbes park,Makati City. ailer having been dulv sworn to in accordance witlr lara, do hereby declare that;
i. I anr a ncmiree tbr indep*ndeni director of Citylaxd Bevelopme*t Corporatinn an6 have been its inciependentdirector since Decerriber I i- 201?.
2. I arrr aifiliated with t!:e follor.ving con-rpanies/organizalio*s {incluclinu Covernment-Ouned and ControlledCorporations):
i _ coMrANy , p$sirloN , pERroD oF sERvICE
'Asian Alliance Holdings and Developmeat Corp. Dirsctor , Noo"mber 1995 to present
i Befieficial Life Insurance company Direct{jr , Julv 199g to present
Paxy's. Inc. I)irector October 2004 to present
Aiiiancc Seiecr i:oods Inlernational. [nc. , __ !il*l _r i:l:2_o-otpJ,:':1r
,i.
possess all the clualifications and none i-rf the disqualificarions to serve as an lnelrpendent Direetor af Cit.y-ltrntlIlevclopment Ccrporation. as provided ibr in Section i8 of the Securiries Regulatior Ccile. and its hnpiemenringRules and B=egulations and cthr.r SEC issuances.
I am telated to tlie fcllcwirrg directcrr'ofticer/substantial shareholder o{'Citylantl Development Corporation otherthan the relationship provided unrjer Rule 38.2.i of'the Seeurities Reguiation Cocie.
Name of Direetor / OtTicerr' Substantial Shareholcler Companl, Nature of Relationship
ilONE NONE NONE
5. ?o dre best of m,v knorvledge, i at:t the subject *f the following criminal or adniinistratile inl,estigation orpraceedings.
Otfense - Charged,'lnvestigated Trifiunai or Agency invclved StaIus
Aileged violatian of'Seetior:s 74 & 75 ir:relatior: ti-r Sectirn 144 ,-:l rhr. CcrporationCode ior ailegeei vialation of the riglrt toinspect) - Prelirn inar3, Invesligatir:n
l-)ffice the Secrelary Eepartmertof Justise {OSEC-PR-DTF-:-uiLlgt6-txll; HPS Doeket hii:s.XYl-fu\'l\r- I -iB-+00i3 tc 0S034.iitled f7*ryesi ,1lt !tti estwen!Linitecl, et tt!- v. ,4rwsle.v B.
Eangka.t. tl *l.lHan'est Aillrivestsncnt Li*itt:d, et al. i). {ieorgeSr'{lip, et ul.\
The Departmerrt ol Justicerer=erssd rhe dismissal +l theca\es b\ the DOJ ProsecLrtionStafT even t}:+*gh there rvas *finding that thc ,Jir*c,t*rr.including m1'seli, has noi issLied
a rcsolirrion that e-xprcssl,v
denicd the request tbrinspection. Ir4-v motion t'olreconsirlerati*n of the DtlJR"esoiuti on is pending.
Alleged violarion o1'Seetior:s i4 & 75 inreiaiit'rn to Section i44 af the {lcrporaiionLode (*r alleged violatti-:n ol the rieht toinspecli - f iled in Cour"t
Metropolitan Trial Court of Pasig.Braneh T2 (Ct'irninal Case Nos. M-IISC-18-00148-CR to 00i49-t-R,litled People o.f rhe Philippines y.
Annsley B. Bangkas. et al.)
l"his is an of,fshoat of the case
abor'e. Tlre triai coufl is
presenrl,v determin ing prohablecause along rvith the issr.re ofrryhether or not to suspend theproceeclings because of theexisteiree of a prejudicialquestion. J'here has heen rro
arraignment Rnd no warrant ofarrest hes been issued.

Alleged violation of Secticns 74 & 75 inrelation tc Sectiorr 1.44 of the CarporationCcde {or: alieged viclaticn of the right toinspect.) - Ple i irn i nar,v I n,":esti gation
Deparlrrrent of JusticeProsecution Staif {NPS Docket }.Jo.
XVI-l}rl\"1- i -58-00053. titled llerlIS.C. Yap-Chr.ta t,. Jottatltan Y. Dee,et d.l
The ccrrnplaint ltlr allegedriolatiun of the riehr to irrspecr
{cveri thougli the rcqrresr tvasgranted by the board ofdirectors. includinc nrvself) issubuiued lor decision.
Alleged violation of Presidential Decree No.i689. in relation to Arricle 315(2)[ai of theRevised Penal Code (si..ndicated estal.al andArticle 171(l) of fhe Revised Perral Codeifalsification of public docrimer:r)Pie! irninary [nvestigaliru
Office the Secretary - Depannrentot Justice (!PS Docket Nos. XV-07-iNv-t68-01028 & XV-07-INV-l6D-01843, titled t'ictrxyFuncl Liruited, et al. ,-. Jonathun Y.
Dee, ,-'t Lt!."-l,t'ttttltttr ). Dce, ct l!.v. Hed), S-C. Yap-Chtta)
The Office of the CityProsecutor - Maniia disuissedboth complaints. Theconrplainants' appeal with theDepartment ol Justice is wasa.lsr-r denied. The complaiuants'nlotion for reconsideration ispsnding resolution.
6.
1
I alri not an independeiit direcfor in ar1'of governrrent service,raffiliated rlith a government agency or GOCC.
I siiall itithfulil"and diligentl-v eeirrpil, with my qluties and respcniilrilitie; a-r ipciepenr-leirt dii'ector ulder iireSecurities Regulation Code and its lmpieinenting R-ules and Regulations Code of Corpora-te Covemance and other.5EC issuances.
I shall inforlr the Cotporate Secretary of Cityland Development Corlroration of any chalges in theabovementioned information within five days tion its occurrence,
Done this day of tlAR 'l { 2018,, rfft*Tr c{ry
Ueorle Sdwin Yu SvCipI udilt
suBscRrBEE.{N}SWORNtabet.orc*--n,=ry4fr ?{ ?-ij?&r #=4ei}-1-. t#"?Y.affianrpersonallyappearedbefore me and exhibited io me his Passport No. SOOZS+jjA;s-.ueO on OZ lanuary ZOf : Uy tfre US Oepariment aistate. U.S.A.
- Iiluoc tlo. qJ :
Ptge nr,. -TS-.D,,^r,..- tilDrrt)rt ii!r. ts
Scrics oi20 I 8.
il MAi(i."ri.fiTYUilTiL DtiEr'{F.ER .t 1, 7-r,18
APfOINTMENT i,ii). : M-;i2IBP R0LL NO.:3-ll5?
I$F NO. : 06547/Liferirne/PFLf.$PTR iio.: 66I 5775101-n,+-?ni {litlal:r,fil:o n"V, DelE Cosic:.x., I"takiti CiV

1ruilil illll lillllllil illliffiil ililiilili ilril ilililIilt iltil iltil ililtililltililllt103212018001342
SECURITIES AND EXCHANGE CCINfi Ii,IISSIONSECBuilding, EDSA, Greenhills,MandaluyongCity, MetroManita,philippines
Teli632i 726-0931 to 39 Fax{632} 225-5493 Email: [email protected]
Barcode Page
The following document has been receiyed:
Receiving OfficerlEncoder : Ramon L. LegaspiReceiving Branch : SEC Head OfficeReceipt Date and Time : March 21, ZCI1A 11:38:3g AMReceived From : l'lead Office
Company Representative
Doc Source
Company lnforrnation
$EG Registraiion No.
Company Name
lndusby Classification
CompanyType
Document lnformation
0000077823
CITYLAND DEV. CORP.
Stock Corporation
Document lD
Document Type
Document Code
Period Covered
No. of Days Late
Department
Remarks
1032120180013/.2
17-C (FORM 1I-C:CURRENT DISCURPT)17-C
March 19, 2018
0
CFD

C6WER $HHHTNumber
7 7 I 1
**ffF&ruY roAndE
{- I Tf
wtrJ A N rt D E 1t/
v H: t + P M E Ihl E
t-- t, R F s R, r? I ?f t
pffTSAPAL SFFIGE { No. / Street I Barangay I City lTawn / Province }
2 I F' t v f ft t! u C o d a ErAi i tl I t! itl I s
.E-E G w F a x i 5 5 E{ v r} I a {T e t a
€ € rie * t , tu5 6 fi a (- a v
Secondary License Type, {fApplicable
r-T--r-1-*-]LrylLel__l
Certitication of !i?dependent Directorof Mr, Peter 5. Dee
E O Rfi FAFiY ! N F&R H&TT& T6
Company's Ernail Address
st{}{ !.{si s r e iin- t!3n i"i " !t et
No. cf Stcckholders
668 as of?{}1S
Company's Telephone llumber
E9a.5S{6S
Mobile Number
da
Annual Meeting {Month I Day} Fiscal Year {Month / Day}
I ," Tmesday oflJune I i Decemrber 3l Ii-"!
G@hITAGT PERSoN IS{FSRNfrATIOH
The designated co$tact person ,rfU97 be an Officer qf the Corporation
Telephone Nurnber/s
f sr3-oofi-lName of Contact Person
Itudy Go
Email Address Mobile Number
nJa
C@hI?AG? PER$ON'S ADETESS
: in aase a5 aoniactperson, such irtcident shallbe reparted la rhe Cammission vtithin thi{fy {30} calendar davs from the scturrence thereof with informatian and carnpleteeontact details of the new contact person designated.
? : AII Boxes must be praperly and eamptetely fitled-up, Failure ta do sa shail rause tre delay in updaiing m€
ctrpcration's records with the Cammlssion and/ar nqn-receipt af Norice of Defieieneies. Further, nari-rercipt at ltlatice offre{tciencies shall noi excuse fhe carporation iram liabitig for its deficiencies,
;d FI++r Cifyt*nd Cqniomhirux lt, Tower'$ ts.l H.V. del* C**ta Streeto Makati Clf.v
:;-g!_{-{g@eiiy_{aixt. a? q3

1.
CER.TTS'ICATTSN OF INSEPENBENT BIRECTGR
1, PETER S. DEE, Fiiipino. of legal age and resident of 7 Banaba Circle, Sauth Forbes Park, Makati City. afterira.;ing becn dul-v slv.irl; io in ac+*rda*ee qith iarv d* hereby deeiare that.
i am a nr:minee i"ol'independent directar *f Cityiand E*veloglneemt Corporatiom and have been its hdependentdirector sinee Setaber 197*.
fie::rber - Noinination Cor:imittee
Ciry' &. t,**C Dcvel*pcrs- !:'irci'poiatrd ladep*;id*rt *ir*si*rChairman - eor-ssrate {icvemarce ConrmitterChairinan - Auiiit & R.isk Comtutteefulcrmber - Nomriution Cornn)rti.cr
I l /]") /rna!,'i r^
present
GDSK Dsr,elopm.nt Corp*r,ition Dire{tor l99i; to pr*sent
H1'dee Managei*ent &. Rescurces Corp Director l?91 tcpresent
Kemrerke. {nc. Direclor 1994 to presenl
Ir.{*kati Curirs Holdings Ccrporatiar; Drec cr 2012 io pres*nr
Great Espeetetion Holdings- tne. Director I Chaintra*: President l0l?0 12 io prssent
C,:mir:oxlvralt}r F*od;, i:rc. Sircci*r S{a5 2{i i 3 t!} presex{
?he Eig D i{alCi*gs Ccrpar:ilern Ili:eet*r I Ch*ir:n*:. Pr*sideni rJ+l:lllj tirFi,gss.nt
I p*ss**: aii tlre qu*lifres-Iio11s aed trc'n* *f rhe disq'.;alifir:a{i,,-ns to sei v*e *.s ai'} 'Irrdeperde*t *irect*r of Cif-vtxcd&es*lopra*irt Cor6roa'a€i**" as pravided fbi: il: Secti*:: 38 *ith* See:-irities Reguiati*n C*de, *rtd its lmplerneatingRuies aild F*egulations anC *tlrer SEC issuan*es.
i am not reiated ta any direetorlofficer/subsiarrtial shareh*lder of Cityland Sevelopmeur[ Corporation ct]rer than the
5. To the best of my knorr..ledge, I am aat the subject of any pending crin{nai or administrative investigation or
I an:i not an indepeadeflt dtrector in any ci'gar.er$ment serviceiaffiiiated with a government agencv or GOCC.
I shall f'aithfully aad diligenity comply witl: iriy duties and responsibilitie$ as iildependent dir€ctor ufider the Securities
Eegr.ilation eode and its Implemenring F-ules and fi.egulations Code of Corporate Gsrieilla.ilce and other 5ECisguance:.
j"
d.
6.
1
-4qlarylaigdg4tllltq*iglloyr ng cornp m
COMPANY
A-lp*iac. lirc.
lr€s/{Jfsaruzau(Jl$:
i posmoNIIr'"=*- ---- --iOirector
PER1OD OFSERVICE
i994 to presfilt
China Brrrk;ng Curpclr:itii,l illl i]LtLil 19i7 t-o prstsilt
CEC l:rsurance Brolq*rs" k:*- Chain:ian cf th* Board 1998 fo present
CEC Frap*rties & Comp:,rier Cenier. i*c. Direci*r I F:rriderrt 1984 to presett
Cird*;d- lne. iiidepeadei:i Dire;icrC]:+ii:tan - Corpami* Co:'en:ancc Comm-rttee
Ch;iiri*ae - Aur:lii fs Eisk {lom:}rittee}.iember - lrcmrnair,-.u Commiliec
1 2 i 2 {}t}i} ti} p.i-eserr
: Citlpians. lneorpcrate,$ i,rCepcndent {Jii'ccl+r ' i!}9 I io prcsent
Ci:airman - Corpcrate *ove.maree Cammitte.e i20{-}2 to presei-ri
under Itule 38.2.3 of the Securiiies Code.
Nair"ie of *irect*r I Offieerl Sub;tantiai Shareholdcr Compa;ry RI-a,-^ ^f P ^l'ri^-.I.;^f ldlUr a Ui r-r!lqLruriottlH
l'j0NE NOhIE l\tit\-c.
u
Offense - Chargedlln.:esti-Eale<i Triu'unal or Agency Involved Status
Ri/-I\TE l\i(.iNF }I.GNE

I shall inibrm the Corporate Se€rstaftr *f Cityland Scvelopment Corpor*tio* af any changes in the aboveinentioredintlimatic;: witHn llv* ia','s ii*in itg *ceurre*,:e.
i]*ne this da.v *f nAR 1 $ t01fi
SLiBSCRiBED AND SWOB$ tc b*iore me *t , ,' ,-. aliia*i Personalll'r)UrJ!,lUULU nl\U J tY Vl'J\ !U ,!lut! llp trtrp_ .
before i:rc and exhibited to me i:i* SSS lD uitli nc'. 0l- t l!i3{il i -$ rrui ot}:er ccmpetelt evrdence cliqienfificatiort.
Dxno.Page no.
*lok i.:o.
Series cf20i8.
*TTY. Ei,lI \-j
Ut{TiL OLII,4!:EF ^'.i . li iEAP!-:OINTHrN] i;;).: i,l_i..2 ,
IBP ROLI". N().: 33i52I8P NO.: 0654:/Lifelinrei PFi-i"!
PTR .'to. : 66lt 57751fi i -n+7-01 8ll'14!;':.U
156 H.v. LlSa Cusrn n"., Ftal€tiCitY
I/iAKAT'I CITV
Il-s'i.s&L
Cityland Development Corporationand Subsidiaries
Consolidated Financial StatementsDecember 31, 2017 and 2016and Years Ended December 31, 2017, 2016and 2015
and
Independent Auditor’s Report

CIIYLANDDEVELOPMENT
CORPORATION
CERTIFTCATE 01\ THB COMPILATION SERVICES FOR THE PREPARATION OF THECONSOLIDATBD FINANCIAL STATBMENTS AND NOTES TO THE CONSOLIDATED
FINANCIAL STATEMENTS
I liereby certiff that I am the Ceftified Public Accountant (CPA) who perlbrmed the compilationservices related to the preparation and presentation of financial information of an entity in accordancewith an applicable financial reporting framework and reports as required by accounting and auditingstandards for Cityland Development Corporation for the period ending December 31"2017 .
In discharging this responsibility. I hereby declare that I am the Senior Manager of CirylandDevelopment Corporation.
Fufthermore, in my compilation services fbr the preparation of the Consolidated Financial Statementsand Notes to the Consolidated Financial Statements, I was not assisted by or did not avail of the serryicesof SyCip Gorres Velayo & Co. rvhicli is the externatr auditor who rendered the audit opinion for the saidConsolidated Financial Statements and Notes to the Consolidated Financial Statements.
I hereby declare. under penalties of perjury and violation of Republic Act No. 9298 that my statementsare true and correct.
CITYLAND
,rz - lLu^u* /.efiMA. VERONICA SAN
PROFESSIONALVALID UNTIL:
IDENTIFICATION CARD NO. :
Ausust 29.201900561 1 I
ACCTREDITATION NO.: 2718VALID t-lNTlt.: August 29.2020
Signed tr-I.i# it au! o1018 zo r s.
t,qqSqRLBEgAND SwoRN to before me in lxiAl(ATl{}tTY Ciry. philippines on[lAl( I U lUlU .affiantpersonallyapp"ar"dbefo.ern"rrd"iliibitedtorleherSociaisecurityS),rt.* N"J3-?5r 1;43-8 and other competent evidence of- identification.
Doc No. tl* :
Page No. --[-,go-ok Xo. -n--Series of 20IL
ATTY. E It..A'irS.,i;LNOTARY PiJ I lrar,r:;tr flfry
UMfiL DECIr'll-f;R.11, 2i t8\ Apr,,-tiruTl4ENT i{J.: t"t-.iflIBP ROLL. NO.: 33152
IBP NO.: 0r,5471l. ifetime/FPr-i'lPTR lio.: 661 577c1fi 1 -{}4-)-t}1S1Mai;iff
lro h.V. Deri: Ctista'.x., lvlaKati City
2/F CITYLAND CONDOMINIUM 1 O TOWERI, 1 56 H.V. DELA COSTA STREET, MAKATI 1226
P0. BOX 5000 N/AKATI 1290, TEL. #: 893-60-60 FAX # : 892-7656 www.cityland.net

CIIYLAND
DEVELOPMENT
CORPORATION
STATEMENT OF MANAGESlENT'S RESPONSTBILITYF-OR CONSOLIDATED FINANCIAL STATEMENTS
The management olCityland Development Corporation (the Company) is responsible fbrthe pleparation and fairpresentatic,n ofthe consolidated balance sheets as at December 31,2Afi and 20i6, and the consolidated statentents oiittcome, consolidated statenrents of comprehensive income, consolidated statenlents of changes in equity an<J
conscrlidated statements of cash flows fbr each of thethree years in tl.re period ended December 31, 2017 an<t notes tothe consolidated financial statements. including a summary of signiticant accounting policies and schedules attachedtherein, in accordance rvith Philippine Financial Reporting Standards, and for such internal control as managementdetermines is necessarv to enable the preparation of consolidated financial statements that are free from materialmisstatement. whether due to fraud or error.
ln preparing the consolidated financial statements. managemeflt is responsibie for assessing the Company's ability tocontinue as a going concern. disclosing, as applicable matters related to going concern and using the going concembasis of accounting unless management either intends to liquidate the Company or to cease operations. or has norealistic alternative but to do so"
The Board of Directors is responsible fbr overseeing the Compan,v's financial reporting process"
The Board of Directors reviews and approves the consolidated financial statements including the schedules attachedtherein, and submits the same to the stockholders.
SyCip Gorres Velayo & Co., the independent auditors appointed by the srockholders. has audited the consolidatedits report to thestatements of the Company in accordance with Philippine Standards on Auditing. and in
has expressed its opinion on the fairness ofpresentation upon cornpletion ofsuch audit.
of the Board
C]
CITYLAND
DR. ANDREW I. LIUSON
;.,:-;ffi;il'?"i*
ident /
RUDY GO
NameDr. Andrew I. LiusonJoselC. GohocRudy Go
Doc No. 2N^Pase No. --d<-e;otxo. ffSeries of 20 1 8.
i.TE)..r,i'. orficer V
&g*rY,
Type of ldentificationSSS
SSS
SSS
at-fiant(s) exhibiting to me their Social
Number03- r 872470-633-4942781-403-,1602228-9
I,BFET, MAKATT 1226
.rliriywqityland.nel':.lt:i.C
h{AR 2 ? 2010SUBSCRIBED AND SWORN to befbre me this dav ofSecurity Numbers or other comperent evidence r:f identification, as follorvs:
,ro* *gi,rilA
2/F CITYLAND
UifI-JLAPi,OlruTf,tf i'.IT t\i0. : ?_A j.7 -U44
t iep RCLL tJc*',r".r;.;
P.0. BOx 5000
IBF IIJ*":

*SGVFS027825*
INDEPENDENT AUDITOR’S REPORT
The Stockholders and the Board of DirectorsCityland Development Corporation
Opinion
We have audited the consolidated financial statements of Cityland Development Corporation and itssubsidiaries (the Group), which comprise the consolidated balance sheets as at December 31, 2017 and2016, and the consolidated statements of income, consolidated statements of comprehensive income,consolidated statements of changes in equity and consolidated statements of cash flows for each of thethree years in the period ended December 31, 2017, and notes to the consolidated financial statements,including a summary of significant accounting policies.
In our opinion, the accompanying consolidated financial statements present fairly, in all materialrespects, the consolidated financial position of the Group as at December 31, 2017 and 2016, and itsconsolidated financial performance and its consolidated cash flows for each of the three years in theperiod ended December 31, 2017 in accordance with Philippine Financial Reporting Standards(PFRSs).
Basis for Opinion
We conducted our audits in accordance with Philippine Standards on Auditing (PSAs). Ourresponsibilities under those standards are further described in the Auditor’s Responsibilities for theAudit of the Consolidated Financial Statements section of our report. We are independent of theGroup in accordance with the Code of Ethics for Professional Accountants in the Philippines (Code ofEthics) together with the ethical requirements that are relevant to our audit of the consolidatedfinancial statements in the Philippines, and we have fulfilled our other ethical responsibilities inaccordance with these requirements and the Code of Ethics. We believe that the audit evidence wehave obtained is sufficient and appropriate to provide a basis for our opinion.
Key Audit Matters
Key audit matters are those matters that, in our professional judgment, were of most significance inour audit of the consolidated financial statements of the current period. These matters were addressedin the context of our audit of the consolidated financial statements as a whole, and in forming ouropinion thereon, and we do not provide a separate opinion on these matters. For the matter below, ourdescription of how our audit addressed the matter is provided in that context.
SyCip Gorres Velayo & Co.6760 Ayala Avenue1226 Makati CityPhilippines
Tel: (632) 891 0307Fax: (632) 819 0872ey.com/ph
BOA/PRC Reg. No. 0001, December 14, 2015, valid until December 31, 2018SEC Accreditation No. 0012-FR-4 (Group A), November 10, 2015, valid until November 9, 2018
A member firm of Ernst & Young Global Limited

*SGVFS027825*
- 2 -
We have fulfilled the responsibilities described in the Auditor’s Responsibilities for the Audit of theConsolidated Financial Statements section of our report, including in relation to these matters.Accordingly, our audit included the performance of procedures designed to respond to our assessmentof the risks of material misstatement of the consolidated financial statements. The results of our auditprocedures, including the procedures performed to address the matter below, provide the basis for ouraudit opinion on the accompanying consolidated financial statements.
Revenue and cost recognition on sales of real estate properties under the Percentage-of-CompletionMethodThe Group applies the percentage of completion (POC) method in determining the revenue and costarising from sales of real estate properties. The POC is based on the physical completion of the realestate project, while the cost of sales is determined on the basis of the total estimated projectdevelopment costs applied with the POC of the project. The Group’s real estate revenue and costsaccounts for 71% of total revenue and 64% of total cost and expenses, respectively, for the year endedDecember 31, 2017. The assessment of the physical stage of completion and the total estimatedproject development costs requires technical determination by third party project developmentengineers. In addition, the Group requires the collection of a certain percentage of the buyer’spayments of total selling price (buyer’s equity) as one of the criteria to initiate revenue recognition. Itis upon reaching this collection level that management has assessed the buyers’ continuingcommitment with the sales agreement and thus, is probable that the economic benefits will flow to theGroup. This matter is significant to our audit because the assessment of the stage of completion, thetotal estimated project development costs and the level of buyer’s equity involves significantmanagement judgment and estimation.
Refer to Notes 2 and 3 to the consolidated financial statements for the disclosures on revenuerecognition.
Audit responseWe obtained an understanding of the Group’s processes for determining the POC, and for determiningand updating total estimated project development costs, and performed tests of the relevant controls ofthese processes. We obtained the certified POC reports prepared by the third party projectdevelopment engineers and assessed their competence and objectivity by reference to theirqualifications, experience and reporting responsibilities. For selected projects, we conducted ocularinspections, made relevant inquiries and obtained the supporting details of POC reports showing thecompletion of the major project development activities. For selected projects, we obtained theapproved total estimated costs and any revisions thereto and the supporting details such as contractor’sbillings, cash vouchers and estimated project development cost to complete report. We likewiseperformed inquiries with the project development engineers for the revisions. We evaluatedmanagement’s basis of the buyer’s equity by comparing this to the historical analysis of salescollections from buyers with accumulated payments above the collection threshold. We traced, on asampling basis, the analysis to supporting documents such as contracts to sell and buyers’ history ofpayments.
A member firm of Ernst & Young Global Limited

*SGVFS027825*
- 3 -
Other Information
Management is responsible for the other information. The other information comprises theinformation included in the SEC Form 20-IS (Definitive Information Statement), SEC Form 17-A andAnnual Report for the year ended December 31, 2017, but does not include the consolidated financialstatements and our auditor’s report thereon. The SEC Form 20-IS (Definitive Information Statement),SEC Form 17-A and Annual Report for the year ended December 31, 2017 are expected to be madeavailable to us after the date of this auditor’s report.
Our opinion on the consolidated financial statements does not cover the other information and we willnot express any form of assurance conclusion thereon.
In connection with our audits of the consolidated financial statements, our responsibility is to read theother information identified above when it becomes available and, in doing so, consider whether theother information is materially inconsistent with the consolidated financial statements or ourknowledge obtained in the audits, or otherwise appears to be materially misstated.
Responsibilities of Management and Those Charged with Governance for the ConsolidatedFinancial Statements
Management is responsible for the preparation and fair presentation of the consolidated financialstatements in accordance with PFRSs, and for such internal control as management determines isnecessary to enable the preparation of consolidated financial statements that are free from materialmisstatement, whether due to fraud or error.
In preparing the consolidated financial statements, management is responsible for assessing theGroup’s ability to continue as a going concern, disclosing, as applicable, matters related to goingconcern and using the going concern basis of accounting unless management either intends to liquidatethe Group or to cease operations, or has no realistic alternative but to do so.
Those charged with governance are responsible for overseeing the Group’s financial reporting process.
Auditor’s Responsibilities for the Audit of the Consolidated Financial Statements
Our objectives are to obtain reasonable assurance about whether the consolidated financial statementsas a whole are free from material misstatement, whether due to fraud or error, and to issue an auditor’sreport that includes our opinion. Reasonable assurance is a high level of assurance, but is not aguarantee that an audit conducted in accordance with PSAs will always detect a material misstatementwhen it exists. Misstatements can arise from fraud or error and are considered material if, individuallyor in the aggregate, they could reasonably be expected to influence the economic decisions of userstaken on the basis of these consolidated financial statements.
A member firm of Ernst & Young Global Limited
*SGVFS027825*
- 4 -
As part of an audit in accordance with PSAs, we exercise professional judgment and maintainprofessional skepticism throughout the audit. We also:
∂ Identify and assess the risks of material misstatement of the consolidated financial statements,whether due to fraud or error, design and perform audit procedures responsive to those risks, andobtain audit evidence that is sufficient and appropriate to provide a basis for our opinion. The riskof not detecting a material misstatement resulting from fraud is higher than for one resulting fromerror, as fraud may involve collusion, forgery, intentional omissions, misrepresentations, or theoverride of internal control.
∂ Obtain an understanding of internal control relevant to the audit in order to design auditprocedures that are appropriate in the circumstances, but not for the purpose of expressing anopinion on the effectiveness of the Group’s internal control.
∂ Evaluate the appropriateness of accounting policies used and the reasonableness of accountingestimates and related disclosures made by management.
∂ Conclude on the appropriateness of management’s use of the going concern basis of accountingand, based on the audit evidence obtained, whether a material uncertainty exists related to eventsor conditions that may cast significant doubt on the Group’s ability to continue as a going concern.If we conclude that a material uncertainty exists, we are required to draw attention in our auditor’sreport to the related disclosures in the consolidated financial statements or, if such disclosures areinadequate, to modify our opinion. Our conclusions are based on the audit evidence obtained upto the date of our auditor’s report. However, future events or conditions may cause the Group tocease to continue as a going concern.
∂ Evaluate the overall presentation, structure and content of the consolidated financial statements,including the disclosures, and whether the consolidated financial statements represent theunderlying transactions and events in a manner that achieves fair presentation.
∂ Obtain sufficient appropriate audit evidence regarding the financial information of the entities orbusiness activities within the Group to express an opinion on the consolidated financialstatements. We are responsible for the direction, supervision and performance of the audit. Weremain solely responsible for our audit opinion.
We communicate with those charged with governance regarding, among other matters, the plannedscope and timing of the audit and significant audit findings, including any significant deficiencies ininternal control that we identify during our audit.
We also provide those charged with governance with a statement that we have complied with relevantethical requirements regarding independence, and to communicate with them all relationships andother matters that may reasonably be thought to bear on our independence, and where applicable,related safeguards.
A member firm of Ernst & Young Global Limited

*SGVFS027825*
- 5 -
From the matters communicated with those charged with governance, we determine those matters thatwere of most significance in the audit of the consolidated financial statements of the current period andare therefore the key audit matters. We describe these matters in our auditor’s report unless law orregulation precludes public disclosure about the matter or when, in extremely rare circumstances, wedetermine that a matter should not be communicated in our report because the adverse consequences ofdoing so would reasonably be expected to outweigh the public interest benefits of such communication.
SYCIP GORRES VELAYO & CO.
Aileen L. SaringanPartnerCPA Certificate No. 72557SEC Accreditation No. 0096-AR-4 (Group A), August 18, 2016, valid until August 18, 2019Tax Identification No. 102-089-397BIR Accreditation No. 08-001998-58-2018 February 26, 2018, valid until February 25, 2021PTR No. 6621327, January 9, 2018, Makati City
March 27, 2018
A member firm of Ernst & Young Global Limited

*SGVFS027825*
CITYLAND DEVELOPMENT CORPORATION AND SUBSIDIARIESCONSOLIDATED BALANCE SHEETS
December 312017 2016
ASSETS
Current AssetsCash and cash equivalents (Note 4) P=860,828,317 P=1,788,970,275Short-term cash investments (Note 4) 1,523,000,000 1,218,272,353Current portion of installment contracts receivable (Note 6) 325,914,643 320,467,060Current portion of notes receivables (Note 7) 128,000,000 –Current portion of other receivables (Note 8) 46,587,820 49,805,723Real estate properties for sale (Note 9) 1,177,390,644 1,518,256,209Current portion of investments in trust funds (Note 5) 4,269,063 4,489,499Prepaid income tax 1,066,469 –Other current assets (Note 13) 60,542,937 53,526,245Total Current Assets 4,127,599,893 4,953,787,364
Noncurrent AssetsInstallment contracts receivable - net of current portion (Note 6) 1,509,504,341 1,687,290,041Notes receivable - net of current portion (Note 7) 600,000,000 20,000,000Other receivables - net of current portion (Note 8) 15,266,489 12,862,409Investments in trust funds - net of current portion (Note 5) 30,337,287 30,807,590Real estate properties held for future development (Note 10) 1,194,820,381 978,108,206Investment properties (Note 11) 2,107,285,414 2,082,546,614Property and equipment (Note 12) 10,533,627 10,338,934Net retirement plan assets (Note 24) 14,139,371 12,378,475Deferred income tax assets - net (Note 25) 11,425,848 3,860,457Other noncurrent assets (Note 13) 77,917,561 78,972,233Total Noncurrent Assets 5,571,230,319 4,917,164,959
TOTAL ASSETS P=9,698,830,212 P=9,870,952,323
LIABILITIES AND EQUITY
Current LiabilitiesAccounts payable and accrued expenses (Note 14) P=251,755,093 P=337,516,557Notes payable (Note 15) 1,453,450,000 1,673,000,000Income tax payable – 29,150,719Current portion of pre-need and other reserves (Note 5) 1,500,028 1,198,235Total Current Liabilities 1,706,705,121 2,040,865,511
Noncurrent LiabilitiesAccounts payable and accrued expenses - noncurrent portion (Note 14) 103,764,222 337,136,893Pre-need and other reserves - net of current portion (Note 5) 39,844,243 43,909,277Net retirement benefits liability (Note 24) 5,488,859 6,432,116Deferred income tax liabilities - net (Note 25) 109,746,859 124,367,457Total Noncurrent Liabilities 258,844,183 511,845,743
Total Liabilities 1,965,549,304 2,552,711,254
(Forward)
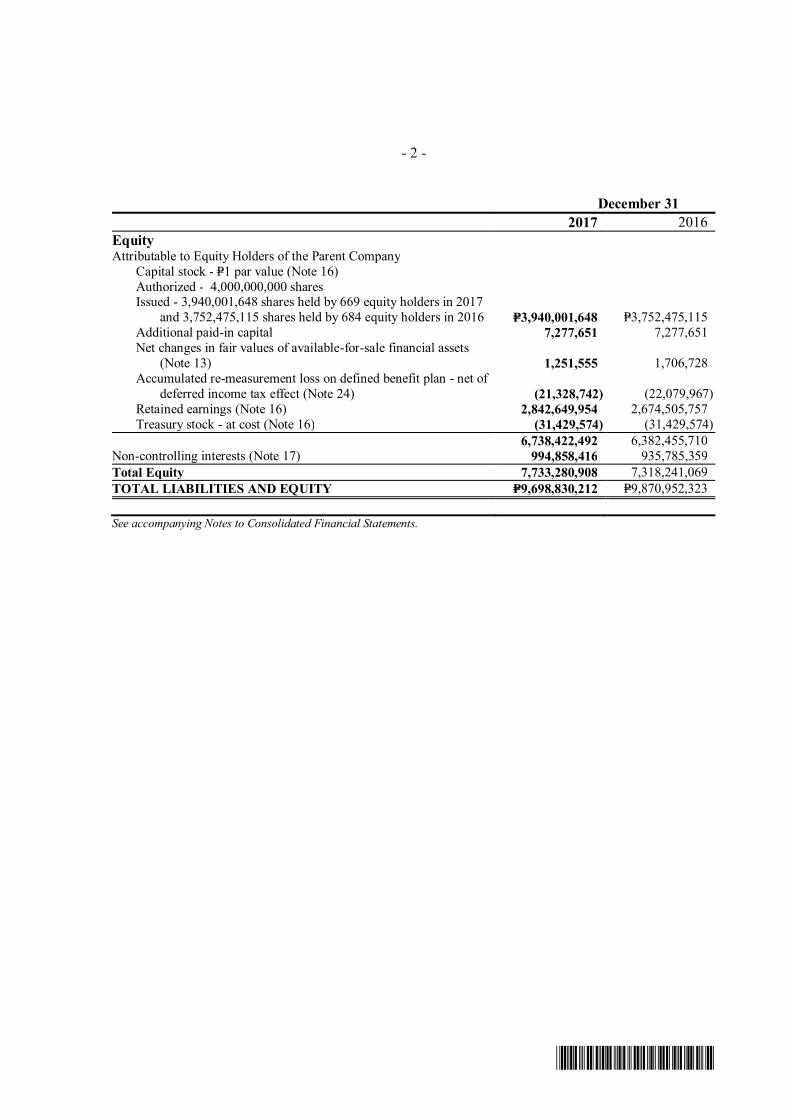
- 2 -
*SGVFS027825*
December 312017 2016
EquityAttributable to Equity Holders of the Parent Company
Capital stock - P=1 par value (Note 16)Authorized - 4,000,000,000 sharesIssued - 3,940,001,648 shares held by 669 equity holders in 2017
and 3,752,475,115 shares held by 684 equity holders in 2016 P=3,940,001,648 P=3,752,475,115Additional paid-in capital 7,277,651 7,277,651Net changes in fair values of available-for-sale financial assets
(Note 13) 1,251,555 1,706,728Accumulated re-measurement loss on defined benefit plan - net of
deferred income tax effect (Note 24) (21,328,742) (22,079,967)Retained earnings (Note 16) 2,842,649,954 2,674,505,757Treasury stock - at cost (Note 16) (31,429,574) (31,429,574)
6,738,422,492 6,382,455,710Non-controlling interests (Note 17) 994,858,416 935,785,359Total Equity 7,733,280,908 7,318,241,069TOTAL LIABILITIES AND EQUITY P=9,698,830,212 P=9,870,952,323
See accompanying Notes to Consolidated Financial Statements.

*SGVFS027825*
CITYLAND DEVELOPMENT CORPORATION AND SUBSIDIARIESCONSOLIDATED STATEMENTS OF INCOME
Years Ended December 312017 2016 2015
REVENUESales of real estate properties P=1,310,712,989 P=1,480,504,914 P=2,371,262,489Financial income (Note 21) 328,200,343 288,034,674 284,515,478Rent income (Note 11) 119,681,308 92,760,364 83,257,768Other income (Note 23) 84,783,339 65,372,375 98,004,319
1,843,377,979 1,926,672,327 2,837,040,054
COST AND EXPENSESCost of real estate sales (Note 9) 738,985,531 826,197,687 1,422,019,784Operating expenses (Note 18) 381,289,647 429,546,775 340,551,414Financial expenses (Note 22) 9,961,121 7,472,117 7,998,261Other expenses (Note 23) 26,983,018 33,098,815 30,389,630
1,157,219,317 1,296,315,394 1,800,959,089
INCOME BEFORE INCOME TAX 686,158,662 630,356,933 1,036,080,965
PROVISION FOR INCOME TAX (Note 25) 134,228,747 153,989,211 260,310,532
NET INCOME P=551,929,915 P=476,367,722 P=775,770,433
Attributable to:Equity holders of the Parent Company P=485,108,127 P=443,176,793 P=739,915,065Non-controlling interests 66,821,788 33,190,929 35,855,368
P=551,929,915 P=476,367,722 P=775,770,433
BASIC/DILUTED EARNINGS PERSHARE (Note 29) P=0.12 P=0.11 P=0.19
See accompanying Notes to Consolidated Financial Statements.

*SGVFS027825*
CITYLAND DEVELOPMENT CORPORATION AND SUBSIDIARIESCONSOLIDATED STATEMENTS OF COMPREHENSIVE INCOME
Years Ended December 312017 2016 2015
NET INCOME P=551,929,915 P=476,367,722 P=775,770,433
OTHER COMPREHENSIVE INCOME(LOSS)
To be reclassified to profit or loss insubsequent periods - gain or loss fromchanges in fair value of available-for-salefinancial assets (Note 13) (433,494) 659,861 (780,697)
Not to be reclassified to profit or loss insubsequent periods:Re-measurement gain (loss) on defined
benefit plan (Note 24) 1,319,830 (8,295,906) (4,672,936)Income tax effect (Note 25) (395,949) 2,488,772 1,401,881
490,387 (5,147,273) (4,051,752)
TOTAL COMPREHENSIVE INCOME P=552,420,302 P=471,220,449 P=771,718,681
Attributable to:Equity holders of the Parent Company P=485,404,179 P=438,612,521 P=736,348,884Non-controlling interests 67,016,123 32,607,928 35,369,797
P=552,420,302 P=471,220,449 P=771,718,681
See accompanying Notes to Consolidated Financial Statements.

*SGVFS027825*
CITYLAND DEVELOPMENT CORPORATION AND SUBSIDIARIESCONSOLIDATED STATEMENTS OF CHANGES IN EQUITYFOR THE YEARS ENDED DECEMBER 31, 2017, 2016 AND 2015
Attributable to Equity Holders of the Parent CompanyAccumulated
Re-measurementNet Changes Loss on Defined
in Fair Values of Benefit PlanCapital Additional Available-for-Sale - Net of Deferred TreasuryStock
(Note 16) Paid-inCapital
Financial Assets(Note 13)
Income Tax Effect (Note 24)
Retained Earnings(Note 16)
Stock(Note 16) Subtotal
Non-controllingInterests Total
BALANCES AT DECEMBER 31, 2014 P=3,573,878,400 P=7,277,651 P=1,768,846 (P=14,011,632) P=1,997,774,818 (P=31,150,762) P=5,535,537,321 P=888,333,129 P=6,423,870,450Net income – – – – 739,915,065 – 739,915,065 35,855,368 775,770,433Other comprehensive loss – – (666,306) (2,899,875) – – (3,566,181) (485,571) (4,051,752)Total comprehensive income (loss) – – (666,306) (2,899,875) 739,915,065 – 736,348,884 35,369,797 771,718,681Transfer of deferred tax liability on deemed cost adjustment
of property and equipment absorbed through depreciation – – – – 726,861 – 726,861 – 726,861Transfer of deferred tax liability on deemed cost adjustment
of properties realized through sale – – – – 2,779,123 – 2,779,123 – 2,779,123Parent Company shares of stock held by CPI – – – – – (6,833) (6,833) – (6,833)Cash dividends - P=0.027 per share – – – – (96,386,148) – (96,386,148) – (96,386,148)Cash dividends declared by subsidiaries – – – – – – – (10,051,122) (10,051,122)BALANCES AT DECEMBER 31, 2015 3,573,878,400 7,277,651 1,102,540 (16,911,507) 2,644,809,719 (31,157,595) 6,178,999,208 913,651,804 7,092,651,012Net income – – – – 443,176,793 – 443,176,793 33,190,929 476,367,722Other comprehensive income (loss) – – 604,188 (5,168,460) – – (4,564,272) (583,001) (5,147,273)Total comprehensive income (loss) – – 604,188 (5,168,460) 443,176,793 – 438,612,521 32,607,928 471,220,449Transfer of deferred tax liability on deemed cost adjustment
of property and equipment absorbed through depreciation – – – – 726,852 – 726,852 – 726,852Parent Company shares of stock held by CPI – – – – – (271,979) (271,979) – (271,979)Stock dividends - 5% 178,596,715 – – – (178,596,715) – – – –Fractional shares – – – – (308) – (308) – (308)Cash dividends - P=0.066 per share – – – – (235,748,070) – (235,748,070) – (235,748,070)Dividends received by CPI from CDC – – – – 137,486 – 137,486 – 137,486Cash dividends declared by subsidiaries – – – – – – – (10,474,373) (10,474,373)BALANCES AT DECEMBER 31, 2016 3,752,475,115 7,277,651 1,706,728 (22,079,967) 2,674,505,757 (31,429,574) 6,382,455,710 935,785,359 7,318,241,069
(Forward)

*SGVFS027825*
- 2 -
Attributable to Equity Holders of the Parent CompanyAccumulated
Re-measurementNet Changes Loss on Defined
in Fair Values of Benefit PlanCapital Additional Available-for-Sale - Net of Deferred TreasuryStock
(Note 16) Paid-inCapital
Financial Assets(Note 13)
Income Tax Effect (Note 24)
Retained Earnings(Note 16)
Stock(Note 16) Subtotal
Non-controllingInterests Total
BALANCES AT DECEMBER 31, 2016 P=3,752,475,115 P=7,277,651 P=1,706,728 (P=22,079,967) P=2,674,505,757 (P=31,429,574) P=6,382,455,710 P=935,785,359 P=7,318,241,069Net income – – – – 485,108,127 – 485,108,127 66,821,788 551,929,915Other comprehensive income (loss) – – (455,173) 751,225 – – 296,052 194,335 490,387Total comprehensive income (loss) – – (455,173) 751,225 485,108,127 – 485,404,179 67,016,123 552,420,302Transfer of deferred tax liability on deemed cost adjustment
of property and equipment absorbed through depreciation – – – – 726,858 – 726,858 – 726,858Transfer of deferred tax liability on deemed cost adjustment
of properties realized through sale – – – – 4,776,668 – 4,776,668 – 4,776,668Stock dividends - 5% 187,526,533 – – – (187,526,533) – – – –Fractional shares – – – – (325) – (325) – (325)Cash dividends - P=0.036 per share – – – – (135,019,338) – (135,019,338) – (135,019,338)Dividends received by CPI from CDC – – – – 78,740 – 78,740 – 78,740Dividends received by CLDI – – – – – – – (8,082,853) (8,082,853)Dividends received by CLDI from CPI – – – – – – – 139,787 139,787BALANCES AT DECEMBER 31, 2017 P=3,940,001,648 P=7,277,651 P=1,251,555 (P=21,328,742) P=2,842,649,954 (P=31,429,574) P=6,738,422,492 P=994,858,416 P=7,733,280,908
See accompanying Notes to Consolidated Financial Statements.

*SGVFS027825*
CITYLAND DEVELOPMENT CORPORATION AND SUBSIDIARIESCONSOLIDATED STATEMENTS OF CASH FLOWS
Years Ended December 312017 2016 2015
CASH FLOWS FROM OPERATING ACTIVITIESIncome before income tax P=686,158,662 P=630,356,933 P=1,036,080,965Adjustments for:
Interest income (Note 21) (328,177,519) (288,009,928) (284,486,345)Depreciation (Note 20) 38,560,608 23,738,651 25,111,714Interest expense - net of amounts capitalized
(Note 22) 8,731,471 5,990,805 6,919,259Retirement benefits costs (Note 24) 2,310,847 1,408,344 1,514,899Trust fund income (Note 23) (2,285,042) (1,548,383) (477,071)Dividend income (Note 21) (22,824) (24,746) (29,133)
Operating income before working capital changes 405,276,203 371,911,676 784,634,288Decrease (increase) in:
Installment contracts receivable 172,338,117 (260,197,791) (371,310,838)Other receivables 4,889,042 (3,964,595) 1,405,018Real estate properties for sale 308,599,214 134,488,592 779,160,911Real estate properties held for future development
(Note 10)(9,489,075) (312,097,107) (172,748,792)
Deposits and others (5,801,288) (5,431,808) (4,249,420)Increase (decrease) in: Accounts payable and accrued expenses (320,827,687) 393,164,357 (3,249,174)
Pre-need and other reserves (2,850,513) (5,828,345) (4,322,985)Cash generated from operations 552,134,013 312,044,979 1,009,319,008Contributions to the plan (3,695,170) (3,695,170) (3,695,170)Interest received 324,102,300 289,279,971 280,853,210Income taxes paid, including creditable and final withholding taxes (181,524,347) (197,935,039) (267,104,038)Net cash flows from operating activities 691,016,796 399,694,741 1,019,373,010
CASH FLOWS FROM INVESTING ACTIVITIESProceeds from matured (Purchase of) short-term cash
investments (Note 4) (304,727,647) 971,627,647 (1,005,779,445)Purchase of notes receivable (Note 7) (708,000,000) (20,000,000) –Additions to:
Investment properties (Note 11) (233,043,351) (357,380,568) (331,691,441)Property and equipment (Note 12) (5,407,500) (876,786) (303,572)
Contributions to investments in trust fund (Note 5) (2,567,482) (2,684,897) (3,062,709)Withdrawals from investments in trust funds (Note 5) 4,036,310 7,090,313 3,673,351Dividends received (Note 21) 22,824 24,746 29,133Net cash flows from (used in) investing activities (1,249,686,846) 597,800,455 (1,337,134,683)
(Forward)

*SGVFS027825*
- 2 -
Years Ended December 312017 2016 2015
CASH FLOWS FROM FINANCING ACTIVITIESProceeds from issuance of notes payable (Note 15) P=6,106,350,000 P=5,581,503,287 P=4,926,800,000Payments of notes payable (Note 15) (6,325,900,000) (5,043,703,287) (5,006,900,000)Interest paid (Notes 14 and 15) (8,859,592) (5,300,736) (6,642,555)Dividends paid (Note 14) (141,062,316) (245,639,372) (105,897,983)Payment of contracts payable (Note 15) – (52,750,000) (112,500,000)Net cash flows from (used in) financing activities (369,471,908) 234,109,892 (305,140,538)
NET INCREASE (DECREASE) IN CASHAND CASH EQUIVALENTS (928,141,958) 1,231,605,088 (622,902,211)
CASH AND CASH EQUIVALENTSAT BEGINNING OF YEAR 1,788,970,275 557,365,187 1,180,267,398
CASH AND CASH EQUIVALENTSAT END OF YEAR (Note 4) P=860,828,317 P=1,788,970,275 P=557,365,187
See accompanying Notes to Consolidated Financial Statements.

*SGVFS027825*
CITYLAND DEVELOPMENT CORPORATION AND SUBSIDIARIESNOTES TO CONSOLIDATED FINANCIAL STATEMENTS
1. Corporate Information
Cityland Development Corporation (the Parent Company) was incorporated in the Philippines onJanuary 31, 1978. It has two subsidiaries, Cityplans, Incorporated (CPI) and City & LandDevelopers, Incorporated (CLDI), a publicly listed company, which are all incorporated anddomiciled in the Philippines. The Parent Company’s and CLDI’s primary business purpose is toacquire, develop, improve, subdivide, cultivate, lease, sublease, sell, exchange, barter and/or disposeof agricultural, industrial, commercial, residential and other real properties, as well as to construct,improve, lease, sublease, sell and/or dispose of houses, buildings and other improvements thereon,and to manage and operate subdivisions and housing projects or otherwise engage in the financingand trading of real estate. CPI is engaged in the business of establishing, organizing, developing,maintaining, conducting, operating, marketing and selling pension plans. The Parent Company is50.98% owned by Cityland, Inc. (CI), the ultimate parent company incorporated in the Philippines,which also prepares consolidated financial statements.
The Parent Company’s registered office and principal place of business is 2/F CitylandCondominium 10 Tower I, 156 H. V. Dela Costa Street, Makati City.
The consolidated financial statements of the Parent Company and its subsidiaries (the Group) as atDecember 31, 2017 and 2016 and for each of the three years in the period ended December 31, 2017were authorized for issuance by the Board of Directors (BOD) on March 27, 2018.
2. Summary of Significant Accounting and Financial Reporting Policies
Basis of PreparationThe consolidated financial statements of the Group have been prepared using the historical costbasis, except for financial assets at fair value through profit or loss and available-for-sale financialassets that have been measured at fair values. These consolidated financial statements are presentedin Philippine peso (Peso), which is the Group’s functional currency, and rounded to the nearest Pesoexcept when otherwise indicated.
Statement of ComplianceThe consolidated financial statements have been prepared in compliance with Philippine FinancialReporting Standards (PFRSs).
Changes in Accounting PoliciesThe accounting policies adopted are consistent with those of the previous financial year, except thatthe Group has adopted the following new accounting pronouncements starting January 1, 2017.
∂ Amendments to PFRS 12, Disclosure of Interests in Other Entities, Clarification of the Scopeof the Standard (Part of Annual Improvements to PFRSs 2014 - 2016 Cycle)
The amendments clarify that the disclosure requirements in PFRS 12, other than those relatingto summarized financial information, apply to an entity’s interest in a subsidiary, a joint ventureor an associate (or a portion of its interest in a joint venture or an associate) that is classified (orincluded in a disposal group that is classified) as held for sale.
Adoption of these amendments did not have any impact on the Group’s financial statements.

- 2 -
*SGVFS027825*
∂ Amendments to PAS 7, Statement of Cash Flows, Disclosure Initiative
The amendments require entities to provide disclosure of changes in their liabilities arising fromfinancing activities, including both changes arising from cash flows and non-cash changes (suchas foreign exchange gains or losses).
The Group has provided the required information in Notes 14 and 15 to the consolidatedfinancial statements. As allowed under the transition provisions of the standard, the Group didnot present comparative information for the years ended December 31, 2016 and 2015.
∂ Amendments to PAS 12, Income Taxes, Recognition of Deferred Tax Assets for UnrealizedLosses
The amendments clarify that an entity needs to consider whether tax law restricts the sources oftaxable profits against which it may make deductions upon the reversal of the deductibletemporary difference related to unrealized losses. Furthermore, the amendments provideguidance on how an entity should determine future taxable profits and explain the circumstancesin which taxable profit may include the recovery of some assets for more than their carryingamount.
The adoption of the amendments has no effect on the Group’s financial position andperformance as the Group has no deductible temporary differences or assets that are in the scopeof the amendments.
Basis of Consolidation The consolidated financial statements consist of the financial statements of the Parent Company and
its subsidiaries as of December 31 of each year. The financial statements of the subsidiaries areprepared for the same reporting year as the Parent Company using consistent accountingpolicies.
The percentage of ownership of the Parent Company in these subsidiaries as of December 31, 2017and 2016 are as follows:
Percentage of Nature ofOwnership Activity
CPI 90.81 Pre-need pension plansCLDI 49.73 Real estate
The registered office and principal place of business of CLDI is 3/F Cityland Condominium 10Tower I, 156 H. V. Dela Costa Street, Makati City. On the other hand, registered office address ofCPI is at 3/F Cityland Condo. 10 Tower 2, 154 H.V. Dela Costa St., Salcedo Village, Makati City.
A subsidiary is an entity that is controlled by the Parent Company. The Group controls an investeeif, and only if, the Group has:
∂ Power over the investee (i.e., existing rights that give it the current ability to direct the relevantactivities of the investee)
∂ Exposure, or rights, to variable returns from its involvement with the investee∂ The ability to use its power over the investee to affect its returns

- 3 -
*SGVFS027825*
When the Parent Company has less than a majority of the voting or similar rights of an investee, theGroup considers all relevant facts and circumstances in assessing whether it has power over aninvestee, including:
∂ the contractual arrangement with the other vote holders of the investee∂ rights arising from other contractual arrangements∂ the Parent Company’s voting rights and potential voting rights
The Parent Company re-assesses whether or not it controls an investee if facts and circumstancesindicate that there are changes to one or more of the three elements of control.
Consolidation of a subsidiary begins when the Group obtains control over the subsidiary and ceaseswhen the Group loses control of the subsidiary. Assets, liabilities, income and expenses of asubsidiary acquired or disposed of during the year are included in the consolidated financialstatements from the date the Group gains control until the date the Group ceases to control thesubsidiary.
Profit or loss and each component of other comprehensive income (OCI) are attributed to the equityholders of the parent of the Group and to the non-controlling interests, even if this results in the non-controlling interests having a deficit balance. When necessary, adjustments are made to the financialstatements of subsidiaries to bring their accounting policies in line with the Group’s accountingpolicies. All intra-group assets and liabilities, equity, income, expenses and cash flows relating totransactions between members of the Group are eliminated in full on consolidation.
A change in the ownership interest of a subsidiary, without a loss of control, is accounted for as anequity transaction. In such circumstances, the carrying amounts of the controlling and non-controlling interests shall be adjusted to reflect the changes in their relative interests in thesubsidiary. Any difference between the amount by which the non-controlling interests is adjustedand the fair value of the consideration paid or received shall be recognized directly in equity andattributed to the owners of the parent.
If the Group loses control over a subsidiary, it derecognizes the related assets (including goodwill,if any), liabilities, non-controlling interest and other components of equity while any resulting gainor loss is recognized in profit or loss. Any investment retained is recognized at fair value.
Non-controlling Interests Non-controlling interests represent the interests in the subsidiaries not held by the Parent Company,
and are presented separately in the consolidated statement of income, consolidated statement ofcomprehensive income and within the equity section of the consolidated balance sheet, separatefrom the Parent Company’s equity.
Current versus Noncurrent ClassificationThe Group presents assets and liabilities in balance sheet based on current/noncurrent classification.
An asset is current when it is:∂ Expected to be realized or intended to be sold or consumed in normal operating cycle∂ Held primarily for the purpose of trading∂ Expected to be realized within 12 months after the reporting period, or∂ Cash or cash equivalent unless restricted from being exchanged or used to settle a liability for
at least 12 months after the reporting period.
All other assets are classified as noncurrent.
- 4 -
*SGVFS027825*
A liability is current when:∂ It is expected to be settled in normal operating cycle∂ It is held primarily for the purpose of trading∂ It is due to be settled within 12 months after the reporting period, or∂ There is no unconditional right to defer the settlement of the liability for at least 12 months after
the reporting period.
The Group classifies all other liabilities as noncurrent.
Deferred income tax assets and liabilities are classified as noncurrent assets and liabilities,respectively.
Cash and Cash EquivalentsCash includes cash on hand and in banks. Cash equivalents are short-term, highly liquid investmentsthat are readily convertible to known amounts of cash with original maturities of three months orless from dates of acquisition, and are subject to an insignificant risk of change in value.
Short-term Cash InvestmentsShort-term cash investments are investments with maturities of more than three months but notexceeding one year from dates of acquisition.
Fair Value MeasurementFair value is the price that would be received to sell an asset or paid to transfer a liability in anorderly transaction between market participants at the measurement date. The fair valuemeasurement is based on the presumption that the transaction to sell the asset or transfer the liabilitytakes place either:
∂ In the principal market for the asset or liability, or∂ In the absence of a principal market, in the most advantageous market for the asset or liability
The principal or the most advantageous market must be accessible to the Group.
The fair value of an asset or a liability is measured using the assumptions that market participant’swould use when pricing the asset or liability, assuming that market participants act in their economicbest interest.
A fair value measurement of a non-financial asset takes into account a market participant's abilityto generate economic benefits by using the asset in its highest and best use or by selling it to anothermarket participant that would use the asset in its highest and best use.
The Group uses valuation techniques that are appropriate in the circumstances and for whichsufficient data are available to measure fair value, maximizing the use of relevant observable inputsand minimizing the use of unobservable inputs.
All assets and liabilities for which fair value is measured or disclosed in the consolidated financialstatements are categorized within the fair value hierarchy, described as follows, based on the lowestlevel of input that is significant to the fair value measurement as a whole:
∂ Level 1 - Quoted (unadjusted) market prices in active markets for identical assets or liabilities∂ Level 2 - Valuation techniques for which the lowest level of input that is significant to the fair
value measurement is directly or indirectly observable∂ Level 3 - Valuation techniques for which the lowest level of input that is significant to the fair
value measurement is unobservable

- 5 -
*SGVFS027825*
For assets and liabilities that are recognized in the consolidated financial statements on a recurringbasis, the Group determines whether transfers have occurred between Levels in the hierarchy by re-assessing categorization (based on the lowest level input that is significant to the fair valuemeasurement as a whole) at the end of each reporting period.
Financial Assets and Financial LiabilitiesDate of recognitionThe Group recognizes a financial asset or a financial liability in the consolidated balance sheet whenit becomes a party to the contractual provisions of the instrument. In the case of a regular waypurchase or sale of financial assets, recognition and derecognition, as applicable, is done usingsettlement date accounting.
Initial recognition of financial instrumentsFinancial instruments are recognized initially at fair value, which is the fair value of theconsideration given (in case of an asset) or received (in case of a liability). The initial measurementof financial instruments, except for those designated at fair value through profit or loss, includesdirectly attributable transaction costs.
Classification of financial instrumentsSubsequent to initial recognition, the Group classifies its financial instruments in the followingcategories: financial assets and financial liabilities at fair value through profit or loss, loans andreceivables, held-to-maturity investments, available-for-sale financial assets and other financialliabilities. The classification depends on the purpose for which the instruments are acquired andwhether they are quoted in an active market. Management determines the classification at initialrecognition and, where allowed and appropriate, re-evaluates this classification at each end ofreporting period.
a. Financial Assets or Financial Liabilities at Fair Value through Profit or Loss
A financial asset or financial liability is classified in this category if acquired principally for thepurpose of selling or repurchasing in the near term or upon initial recognition, it is designatedby management as at fair value through profit or loss.
Financial assets or financial liabilities classified in this category are designated as at fair valuethrough profit or loss by management on initial recognition when any of the following criteriaare met:
∂ The designation eliminates or significantly reduces the inconsistent treatment that wouldotherwise arise from measuring the assets or liabilities or recognizing gains or losses onthem on a different basis; or
∂ The assets or liabilities are part of a group of financial assets or financial liabilities, or bothfinancial assets and financial liabilities, which are managed and their performance isevaluated on a fair value basis, in accordance with a documented risk management orinvestment strategy; or
∂ The financial instrument contains an embedded derivative, unless the embedded derivativedoes not significantly modify the cash flows or it is clear, with little or no analysis, that itwould not be separately recorded.
Financial assets or financial liabilities classified under this category are carried at fair value inthe consolidated balance sheet. Changes in the fair value of such assets and liabilities arerecognized in the consolidated statement of income.

- 6 -
*SGVFS027825*
The Group designated its investments in trust funds as financial assets at fair value throughprofit or loss. The Group’s investments in trust funds directly relate to the Pre-need Reservesaccounts.
b. Loans and Receivables
Loans and receivables are non-derivative financial assets with fixed or determinable paymentsthat are not quoted in an active market. They arise when the Group provides money, goods orservices directly to a debtor with no intention of trading the receivables. Loans and receivablesare carried at amortized cost in the consolidated balance sheet. Amortization is determined usingthe effective interest method.
The Group’s loans and receivables consist of cash in banks, cash equivalents, short-term cashinvestments, installment contracts receivable, notes receivable, refundable deposits, and otherreceivables.
c. Held-to-maturity Investments
Held-to-maturity investments are non-derivative financial assets with fixed or determinablepayments and fixed maturities wherein the Group has the positive intention and ability to holdto maturity. Held-to-maturity investments are carried at amortized cost in the consolidatedbalance sheet. Amortization is determined using the effective interest method.
The Group has no held-to-maturity investments as of December 31, 2017 and 2016.
d. Available-for-sale Financial Assets
Available-for-sale financial assets are non-derivatives that are either designated in this categoryor not classified in any of the other categories. Available-for-sale financial assets are carried atfair value in the consolidated balance sheet. Changes in the fair value of such assets areaccounted in the consolidated statement of comprehensive income and in equity.
The Group’s available-for-sale financial assets consist of investments in quoted equity securitiesthat are traded in liquid markets, held for the purpose of investing in liquid funds and notgenerally intended to be retained on a long-term basis.
e. Other Financial Liabilities
Other financial liabilities are non-derivative financial liabilities with fixed or determinablepayments that are not quoted in an active market. They arise when the Group owes money,goods or services directly to a creditor with no intention of trading the payables. Other financialliabilities are carried at cost or amortized cost in the consolidated balance sheet. Amortizationis determined using the effective interest method.
The Group’s other financial liabilities consist of accounts payable and accrued expenses andnotes payable.
Cash dividend distributions to stockholders are recognized as financial liabilities when thedividends are approved by the BOD.
Offsetting of financial instrumentsFinancial assets and financial liabilities are offset and the net amount is reported in the consolidatedbalance sheet if, and only if, there is a currently enforceable legal right to offset the recognizedamounts and there is an intention to settle on a net basis, or to realize the asset and settle the liabilitysimultaneously. The Group assesses that it has a currently enforceable right of offset if the right is

- 7 -
*SGVFS027825*
not contingent on a future event, and is legally enforceable in the normal course of business, eventof default, and event of insolvency or bankruptcy of the Group and all of the counterparties.
“Day 1” differenceWhere the transaction price in a non-active market is different from the fair value from otherobservable current market transactions in the same instrument or based on a valuation techniquewhose variables include only data from observable market, the Group recognizes the differencebetween the transaction price and fair value (a “Day 1” difference) in the consolidated statement ofincome unless it qualifies for recognition as some other type of asset. In cases where inputs aremade of data which are not observable, the difference between the transaction price and model valueis only recognized in the consolidated statement of income when the inputs become observable orwhen the instrument is derecognized. For each transaction, the Group determines the appropriatemethod of recognizing the “Day 1” difference.
Derecognition of Financial Assets and Financial LiabilitiesFinancial assetsA financial asset (or, where applicable, a part of a financial asset or part of a group of similarfinancial assets) is derecognized when:
∂ the rights to receive cash flows from the asset have expired; or∂ the Group retains the right to receive cash flows from the asset, but has assumed an obligation
to pay them in full without material delay to a third party under a “pass-through” arrangement;or
∂ the Group has transferred its right to receive cash flows from the asset and either (a) hastransferred substantially all the risks and rewards of the asset, or (b) has neither transferred norretained substantially all the risks and rewards of the asset, but has transferred control of theasset.
Where the Group has transferred its rights to receive cash flows from a financial asset and has neithertransferred nor retained substantially all the risks and rewards of the financial asset nor transferredcontrol of the financial asset, the asset is recognized to the extent of the Group’s continuinginvolvement in the financial asset. Continuing involvement that takes the form of a guarantee overthe transferred financial asset is measured at the lower of the original carrying amount of the assetand the maximum amount of consideration that the Group could be required to repay.
Financial liabilitiesA financial liability is derecognized when the obligation under the liability is discharged, cancelledor has expired.
Where an existing financial liability is replaced by another from the same lender on substantiallydifferent terms, or the terms of an existing liability are substantially modified, such an exchange ormodification is treated as a derecognition of the original liability and the recognition of a newliability, and the difference in the respective carrying amounts is recognized in the consolidatedstatement of income.
Impairment of Financial AssetsThe Group assesses at each reporting period whether a financial asset or a group of financial assetsis impaired.
Assets carried at amortized costThe Group first assesses whether objective evidence of impairment exists individually for financialassets that are individually significant, and individually or collectively for financial assets that arenot individually significant. Objective evidence includes observable data that comes to the attention

- 8 -
*SGVFS027825*
of the Group about loss events such as, but not limited to significant financial difficulty of thecounterparty, a breach of contract, such as default or delinquency in interest or principal payments,probability that the borrower will enter bankruptcy or other financial reorganization. If it isdetermined that no objective evidence of impairment exists for an individually assessed financialasset, whether significant or not, the asset is included in the group of financial assets with similarcredit risk and characteristics and that group of financial assets is collectively assessed forimpairment. Financial assets that are individually assessed for impairment and for which animpairment loss is recognized are not included in a collective assessment of impairment.
The impairment assessment is performed at each end of reporting period. For the purpose ofcollective evaluation of impairment, financial assets are grouped on the basis of such credit riskcharacteristics such as customer type, payment history, past-due status and term.
If there is an objective evidence that an impairment loss on loans and receivables carried atamortized cost has been incurred, the amount of loss is measured as the difference between theasset’s carrying amount and the present value of estimated future cash flows (excluding future creditlosses that have not been incurred) discounted at the financial asset’s original effective interest rates(i.e., the effective interest rate computed at initial recognition). The carrying amount of the assetshall be reduced either directly or through the use of an allowance account. The amount of loss, ifany, is recognized in the consolidated statement of income.
If, in a subsequent period, the amount of the impairment loss decreases and the decrease can berelated objectively to an event occurring after the impairment was recognized, the previouslyrecognized impairment loss is reversed by adjusting the allowance account. The amount of thereversal is recognized in the consolidated statement of income. Interest income continues to beaccrued on the reduced carrying amount based on the original effective interest rate of the asset.Loans together with the associated allowance are written off when there is no realistic prospect offuture recovery and all collateral, if any, has been realized or has been transferred to the Group. Ifin a subsequent year, the amount of the estimated impairment loss increases or decreases becauseof an event occurring after the impairment was recognized, the previously recognized impairmentloss is increased or reduced by adjusting the allowance for impairment losses account. If a futurewrite-off is later recovered, the recovery is recognized in the consolidated statement of income under“Other income” account. Any subsequent reversal of an impairment loss is recognized in theconsolidated statement of income to the extent that the carrying value of the asset does not exceedits amortized cost at reversal date.
Assets carried at costIf there is an objective evidence that an impairment loss of an unquoted equity instrument that is notcarried at fair value because its fair value cannot be reliably measured, or a derivative asset that islinked to and must be settled by delivery of such an unquoted equity instrument has been incurred,the amount of loss is measured as the difference between the asset’s carrying amount and the presentvalue of estimated future cash flows discounted at the current market rate of return for a similarfinancial asset.
Available-for-sale financial assetsIn the case of debt instruments classified as available-for-sale financial assets, impairment isassessed based on the same criteria as financial assets carried at amortized cost. Future interestincome is based on the reduced carrying amount and is accrued based on the rate of interest used todiscount future cash flows for the purpose of measuring impairment loss. Such accrual is recordedas part of “Financial income” in the consolidated statement of income. If, in subsequent year, thefair value of a debt instrument increases and the increase can be objectively related to an eventoccurring after the impairment loss was recognized in the consolidated statement of income, theimpairment loss is reversed through the consolidated statement of income.

- 9 -
*SGVFS027825*
In case of equity investments classified as available-for-sale financial assets, this would include asignificant or prolonged decline in the fair value of the investments below its cost. Where there isevidence of impairment, the cumulative loss - measured as the difference between the acquisitioncost and the current fair value, less any impairment loss on that financial asset previously recognizedin the consolidated statement of income - is removed from equity and recognized in the consolidatedstatement of income. Increases in fair value after impairment are recognized in the consolidatedstatement of comprehensive income and directly in the consolidated statement of changes in equity.
Real Estate Properties for Sale and Real Estate Properties Held for Future DevelopmentProperty acquired or being constructed for sale in the ordinary course of business and held for futuredevelopment, rather than to be held for rental or capital appreciation, is classified as real estateproperties for sale and real estate properties held for future development and are measured at thelower of cost and net realizable value (NRV).
Cost includes:∂ Land cost∂ Amounts paid to contractors for construction∂ Borrowing costs directly attributable to the acquisition, development and construction of real
estate projects∂ Planning and design costs, costs of site preparation, professional fees, property transfer taxes,
construction overheads and other related costs.
NRV is the estimated selling price in the ordinary course of the business, based on market prices atthe reporting date, less estimated costs to complete and the estimated costs necessary to make thesale. The Group recognizes the effect of revisions in the total project cost estimates in the year inwhich these changes become known.
Upon commencement of development, the real estate properties held for future development istransferred to real estate properties for sale.
Upon repossession, real estate properties for sale arising from sale cancellations and forfeitures aremeasured at fair value less estimated costs to make the sale. Any resulting gain or loss is creditedor charged to “Other income” or “Other expenses”, respectively, in the consolidated statement ofincome.
Investments in Trust FundsThe trust fund assets and liabilities are recognized in accordance with the provisions of theapplicable PAS and PFRSs and their interpretations.
Investments in trust funds are restricted to cover the Group’s pre-need reserves. These are classifiedas current assets to the extent of the currently maturing pre-need reserves. The remaining portion isclassified as noncurrent assets in the consolidated balance sheet.
Investment PropertiesInvestment properties which represent real estate properties for lease and capital appreciation aremeasured initially at cost, including transaction costs. The carrying amount includes the cost ofreplacing part of existing investment properties at the time that cost is incurred if the recognitioncriteria are met, and excludes the costs of day-to-day servicing of the property. The carrying valuesof revalued properties transferred to investment properties on January 1, 2004 were considered asthe assets’ deemed cost as of said date.
- 10 -
*SGVFS027825*
Subsequent to initial measurement, investment properties, except land, are carried at cost lessaccumulated depreciation and amortization and any impairment in value. Land is carried at costless any impairment in value. Buildings for lease are depreciated over their useful life of 25 yearswhile machineries and equipment are depreciated over their useful life of 5 to 15 years using thestraight-line method.
Investment properties are derecognized when either they have been disposed of or when the propertyis permanently withdrawn from use and no future economic benefit is expected from its disposal.Any gains or losses on the retirement or disposal of investment properties are recognized in theconsolidated statement of income in the year of retirement or disposal.
Transfers are made to investment properties when, and only when, there is a change in use,evidenced by ending of owner-occupation, commencement of an operating lease to another party,or ending of construction or development. Transfers are made from investment properties when,and only when, there is a change in use, evidenced by commencement of owner-occupation orcommencement of development with a view to sale.
Transfers between investment properties, owner-occupied property and inventories do not changethe carrying amount of the property transferred and they do not change the cost of that property formeasurement or disclosure purposes.
Construction in progress is stated at cost. This includes costs of construction and other direct costsrelated to the investment property being constructed. Construction in progress is not depreciateduntil such time when the relevant assets are complete and ready for use. When such construction iscompleted and assets are ready for use, the costs of the said assets are transferred to specificclassification under “Investment properties” account.
Property and EquipmentProperty and equipment, except for office premises, are stated at cost less accumulated depreciationand any impairment in value. Office premises are stated at appraised values (asset’s deemed cost)as determined by SEC-accredited and independent firms of appraisers at the date of transition toPFRSs, less accumulated depreciation and any impairment in value. Subsequent additions to officepremises are stated at cost less accumulated depreciation and any impairment in value.
The initial cost of property and equipment consists of the purchase price and any directly attributablecost of bringing the assets to their working condition and location for their intended use.Expenditures incurred after the property and equipment have been put into operations, such asrepairs and maintenance costs, are normally charged to the consolidated statement of income in theperiod in which the costs are incurred. In situations where it can be clearly demonstrated that theexpenditures have resulted in an increase in the future economic benefits expected to be obtainedfrom the use of an item of property and equipment beyond its originally assessed standard ofperformance, the expenditures are capitalized as an additional cost of property and equipment.
Depreciation of an item of property and equipment begins when the asset becomes available for use,i.e., when it is in the location and condition necessary for it to be capable of operating in the mannerintended by management. Depreciation ceases at the earlier of the date that the item is classified asheld for sale (or included in a disposal group that is classified as held for sale) in accordance withPFRS 5, Noncurrent Assets Held for Sale and Discontinued Operations, and the date the asset isderecognized.

- 11 -
*SGVFS027825*
Depreciation is computed using the straight-line method over the estimated useful lives of theproperties as follows:
YearsOffice premises:
Building 25Furniture, fixtures and office equipment 5-15
Transportation and other equipment 5
The assets’ useful lives and depreciation method are reviewed periodically to ensure that these areconsistent with the expected pattern of economic benefits from items of property and equipment.
When property and equipment are sold or retired, the cost and related accumulated depreciation andany impairment in value are removed from the accounts, and any gains or losses from their disposalis included in the consolidated statement of income.
Impairment of Nonfinancial AssetsThe carrying values of real estate properties held for future development, investment properties andproperty and equipment are reviewed for impairment when events or changes in circumstancesindicate that the carrying values may not be recoverable. If any such indication exists and wherethe carrying value exceeds the estimated recoverable amount, the assets are either written down totheir recoverable amount or provided with valuation allowance. An asset’s recoverable amount isthe higher of an asset’s or cash-generating unit’s (CGU) fair value less costs of disposal and itsvalue-in-use. Impairment losses, if any, are recognized in the consolidated statement of income.
In assessing value in use, the estimated future cash flows are discounted to their present value usinga pre-tax discount rate that reflects current market assessments of the time value of money and therisks specific to the asset. In determining fair value less costs of disposal, recent market transactionsare taken into account.
The Group assesses at each reporting period whether there is an indication that previouslyrecognized impairment losses may no longer exist or may have decreased. The Group considersexternal and internal sources of information in its assessment of the reversal of previouslyrecognized impairment losses. A previously recognized impairment loss is reversed only if therehas been a change in the estimates used to determine the asset’s recoverable amount since the lastimpairment loss was recognized. If that is the case, the carrying amount of the asset is increased toits recoverable amount. That increased amount cannot exceed the carrying amount that would havebeen determined, net of depreciation, had no impairment loss been recognized for the asset in prioryears. Such reversal is recognized in the consolidated statement of income. After such a reversal,the depreciation is adjusted in future periods to allocate the asset’s revised carrying amount, lessany residual value, on a systematic basis over its remaining useful life.
Value-added Tax (VAT)Revenues, expenses, and assets are recognized net of the amount of VAT, if applicable.
When VAT from sales of goods and/or services (output VAT) exceeds VAT passed on frompurchases of goods or services (input VAT), the excess is recognized as payable in the consolidatedbalance sheet. When VAT passed on from purchases of goods or services (input VAT) exceeds VATfrom sales of goods and/or services (output VAT), the excess is recognized as an asset in theconsolidated balance sheet to the extent of the recoverable amount.

- 12 -
*SGVFS027825*
The net amount of VAT recoverable from or payable to, the taxation authority is included as part of“Other current assets” or “Accounts payable and accrued expenses,” respectively, in theconsolidated balance sheet.
Pre-Need Reserves (PNR)PNR for pension plans are calculated on the basis of the methodology and assumptions set out inPre-need Rule 31, as Amended, as follows:
∂ The amount of provision is the present value of the funding expected to be required to settlethe obligation with due consideration of the different probabilities as follows:
i. Provision for termination values applying the inactivity and surrender rate experience ofCPI.
ii. The liability is equivalent to the present value of future maturity benefits reduced by thepresent value of future trust fund contributions required per Product Model discounted atthe lower of attainable rate or discount rate provided by the Insurance Commission (IC) forSEC-approved plans and the pricing discount rate for IC-approved plans.
∂ The rates of surrender, cancellation, reinstatement, utilization, and inflation considered theactual experience of CPI in the last three years.
∂ The computation of the foregoing assumptions has been validated by the internal qualifiedactuary of CPI.
∂ Based on CPI’s experience, the probability of pre-termination or surrender of fully paid plansis below 5% and therefore considered insignificant. The derecognition of liability shall berecorded at pre-termination date.
In 2017 and 2016, CPI followed IC Circular Letter No. 23-2012 dated November 28, 2012 whichsets the guidelines for the discount rate to be used in the valuation of PNR as follows:
∂ Discount interest rate for the PNRThe transitory discount interest rate per year shall be used in the valuation of PNR shall notexceed the lower of the attainable rates as certified by the trustee banks and the following ratesbelow:
Year Discount interest rate2012 – 2016 8.00%
2017 7.25%2018 6.50%
2019 and onwards 6.00%
∂ Transitory PNR (TPNR)In effecting the transition in the valuation of reserves for old basket of plans, IC shall prescribea PNR with a maximum transition period of 10 years. For each of the pre-need plan categories,the TPNR shall be computed annually on the old basket of plans outstanding at the end of eachyear from 2012 to 2021 using the discount interest rates provided above. If the actual trust fundbalance is higher than or equal to the resulting PNR then the liability set-up shall be the PNR.However, if the resulting PNR is greater than the actual trust fund balance at the end of the year,TPNR shall be computed.
The actual trust fund balance shall be the trust fund balance at the end of the year net of anyreceivables by CPI from the trustee for the contractual benefits outstanding as of the end of theyear.

- 13 -
*SGVFS027825*
The TPNR liability shall be recognized each year. As of December 31, 2017 and 2016, CPI’sactual trust fund balance is lower than the resulting PNR (see Note 5).
Other reservesCPI sets up other provisions in accordance with PAS 37, Provisions, Contingent Liabilities andContingent Assets, to cover obligations such as Insurance Premium Reserves (IPR), pension bonus,and trust fund deficiency.
Unless the IC shall so specifically require, CPI may, at its option, set up other provisions as a prudentmeasure.
Capital StockCapital stock is measured at par value for all shares issued and outstanding. When the ParentCompany issues more than one class of stock, a separate account is maintained for each class ofstock and the number of shares issued. Incremental costs incurred directly attributable to theissuance of new shares are shown in equity as a deduction from proceeds, net of tax.
When the shares are sold at premium, the difference between the proceeds and the par value iscredited to the “Additional paid-in capital” account. When shares are issued for a considerationother than cash, the proceeds are measured by the fair value of the consideration received. In casethe shares are issued to extinguish or settle the liability of the Parent Company, the shares shall bemeasured either at the fair value of the shares issued or fair value of the liability settled, whicheveris more reliably determinable.
Retained EarningsRetained earnings represent the cumulative balance of net income or loss, dividend distributions,effects of changes in accounting policy and other capital adjustments.
Unappropriated retained earnings represent that portion of retained earnings which can be declaredas dividends to stockholders after adjustments for any unrealized items which are considered notavailable for dividend declaration. Appropriated retained earnings represent that portion of retainedearnings which has been restricted and therefore is not available for any dividend declaration.
The retained earnings include deemed cost adjustments on real estate properties for sale, investmentproperties and property and equipment that arose when the Group transitioned to PFRSs in 2005.The deemed cost adjustment will be realized through depreciation in profit or loss for depreciableassets (property and equipment and investment properties) and through sale for inventories(classified under real estate properties for sale) and land (classified under investment properties).The deferred income tax liability on deemed cost adjustments on investment properties, propertyand equipment and inventories sold under Income Tax Holiday (ITH) projects is transferred toretained earnings upon realization while the deferred income tax liability on deemed costadjustments on inventories sold under regular tax regime is transferred to consolidated statement ofincome upon sale.
Dividend DistributionsCash dividends on common shares are deducted from retained earnings upon declaration by theBOD.
Stock dividends on common shares are measured based on the total par value of declared stockdividend. Stock dividends are deducted from retained earnings when the BOD’s declaration isratified by the stockholders of the Group. Unissued stock dividends are recorded as stock dividendsdistributable and credited to capital stock upon issuance.

- 14 -
*SGVFS027825*
Dividends for the year that are declared after the end of the reporting period but before the approvalfor issuance of consolidated financial statements are dealt with as an event after the reporting period.
Treasury StockTreasury stock is the Group’s own equity instruments that has been issued and then reacquired butnot yet cancelled. Treasury stock are recognized at cost and deducted from equity. No gain or lossis recognized in the consolidated statement of income on the purchase, sale, issue or cancellation ofthe Group’s own equity instruments. Any difference between the carrying amount and theconsideration, if reissued, is recognized as additional paid-in capital.
Revenue and Costs RecognitionRevenue is recognized to the extent that it is probable that the economic benefit will flow to theGroup and the amount of revenue can be reliably measured. For sales of real estate properties, theGroup assesses whether it is probable that the economic benefits will flow to the Group when thesales prices are collectible. Revenue is measured at the fair value of the consideration receivedexcluding VAT. The Group assesses its revenue arrangements against specific criteria in order todetermine if it is acting as principal or agent. The Group has concluded that it is acting as a principalin all of its revenue arrangements. The following specific recognition criteria must also be metbefore revenue is recognized:
Sales of real estate propertiesRevenue from sales of completed real estate properties and undeveloped land is accounted for usingthe full accrual method. Under the full accrual method, revenue is recognized when the risks andrewards of ownership on the properties have been passed to the buyer and the amount of revenuecan be measured reliably.
In accordance with Philippine Interpretations Committee Q&A 2006-01, Revenue Recognition forSales of Property Units under Pre-completion Contracts, the percentage-of-completion (POC)method is used to recognize income from sales of real estate properties when the Group has materialobligations under the sales contract to complete the project after the property is sold. The Groupstarts recognizing revenue under the POC method when the equitable interest has been transferredto the buyer, construction is beyond preliminary stage (i.e., engineering, design work, constructioncontracts execution, site clearance and preparation, excavation and the building foundation arefinished) and the costs incurred or to be incurred can be measured reliably. Under this method,revenue on sale is recognized as the related obligations are fulfilled, measured principally on thebasis of the estimated completion of a physical proportion of the contract work.
If the criteria of full accrual and POC method are not satisfied and when the license to sell andcertificate of registration for a project are not yet issued by the Housing and Land Use RegulatoryBoard (HLURB), any cash received by the Group is recorded as part of “Customers’ deposits”account which is included under “Accounts payable and accrued expenses” in the consolidatedbalance sheet until all the conditions for recognizing the sale are met.
Cost of real estate salesCost of real estate sales is recognized consistent with the revenue recognition method applied. Costof real estate properties sold before completion is determined using the POC used for revenuerecognition applied on the acquisition cost of the land plus the total estimated development costs ofthe property.
The cost of inventory recognized in profit or loss on disposal (cost of real estate sales) is determinedwith reference to the specific and allocated costs incurred on the sold property taking into accountthe POC. The cost of real estate sales also include the estimated development costs to complete the

- 15 -
*SGVFS027825*
real estate property, as determined by independent project engineers, and taking into account thePOC. The accrued development costs account is presented under “Accounts payable and accruedexpenses” in the consolidated balance sheet.
Any changes in estimated development costs used in the determination of the amount of revenueand expenses are recognized in consolidated statement of income in the period in which the changeis made.
Sales of pre-need plansPremiums from sale of pre-need plans, included under “Other income” account in the consolidatedstatement of income are recognized as earned when collected.
Cost of contracts issued This account pertains to (a) the increase or decrease in PNR as at the current year as compared to
the provision for the same period of the previous year; (b) amount of trust funds contributed duringthe year including any trust fund deficiency; and (c) documentary stamp tax and SEC registrationfees.
If there is a decrease in the PNR as a result of new information or developments, the amount shallbe deducted from the cost of contracts issued in the current period. In case of material prior perioderrors, the requirements of PAS 8, Accounting Policies, Changes in Accounting Estimates andErrors, shall be complied with by CPI.
Interest incomeInterest income from cash in banks, cash equivalents, cash investments, installment contractsreceivable and notes receivable is recognized as the interest accrues taking into account the effectiveyield on interest.
Dividend incomeDividend income is recognized when the Group’s right to receive the payment is established.
Trust fund incomeTrust fund income mainly pertains to rental income on investment properties under the trust fundaccount, as well as, trading gains and losses from buying and selling and changes in fair value offinancial assets and financial liabilities categorized upon initial recognition as at fair value throughprofit or loss investments under the trust fund account.
Operating leases – Group as a lessorOperating leases represent those leases under which substantially all the risks and rewards ofownership of the leased assets remain with the lessors. Rent income from operating leases isrecognized as income when earned on a straight-line basis over the term of the lease agreement.Initial direct costs incurred in negotiating and arranging an operating lease are added to the carryingamount of the leased asset and recognized over the term on the same basis as rental income.Contingent rents are recognized as revenue in the period in which they are earned.
The determination of whether an arrangement is, or contains, a lease is based on the substance ofthe arrangement at inception date whether the fulfillment of the arrangement is dependent on theuse of a specific asset or assets or the arrangement conveys a right to use the asset. A reassessmentis made after inception of the lease only if one of the following applies:
(a) there is a change in contractual terms, other than a renewal or extension of the arrangement;(b) a renewal option is exercised or extension granted, unless the term of the renewal or extension
was initially included in the lease term;

- 16 -
*SGVFS027825*
(c) there is a change in the determination of whether fulfillment is dependent on a specified asset;or
(d) there is substantial change to the asset.
Where a reassessment is made, lease accounting shall commence or cease from the date when thechange in circumstances gave rise to the reassessment for scenarios (a), (c), or (d) and at the date ofrenewal or extension period for scenario (b).
Operating expensesOperating expenses constitute costs of administering the business. These costs are expensed asincurred.
Financial expensesFinancial expenses consist of interest incurred on notes and contracts payable. Interest attributableto a qualifying asset is capitalized as part of the cost of the asset while others are expensed asincurred.
Interest costs are capitalized if they are directly attributable to the acquisition, development andconstruction of real estate projects as part of the cost of such projects. Capitalization of interest cost(1) commences when the activities to prepare the assets for their intended use are in progress andexpenditures and interest costs are being incurred, (2) is suspended during extended periods in whichactive development is interrupted, and (3) ceases when substantially all the activitiesnecessary to prepare the assets for their intended use are complete. If the carrying amount of theasset exceeds its recoverable amount, an impairment loss is recorded.
Other income and other expensesOther income and other expenses pertain mainly to the gain or loss, respectively, arising fromforfeiture or cancellation of prior years’ real estate sales.
Retirement Benefits CostThe net defined benefit liability or asset is the aggregate of the present value of the defined benefitobligation at the end of the reporting period reduced by the fair value of plan assets (if any), adjustedfor any effect of limiting a net defined benefit asset to the asset ceiling. The asset ceiling is thepresent value of any economic benefits available in the form of refunds from the plan or reductionsin future contributions to the plan.
The cost of providing benefits under the defined benefit plans is actuarially determined using theprojected unit credit method.
Retirement benefits cost comprises the following:∂ Service cost∂ Net interest on the net defined benefit liability or asset∂ Re-measurements of net defined benefit liability or asset
Service costs which include current service costs, past service costs and gains or losses on non-routine settlements are recognized as expense in the consolidated statement of income. Past servicecosts are recognized when plan amendment or curtailment occurs. These amounts are calculatedperiodically by independent qualified actuary.
Net interest on the net defined benefit liability or asset is the change during the period in the netdefined benefit liability or asset that arises from the passage of time which is determined by applyingthe discount rate based on government bonds to the net defined benefit liability or asset. Net interest

- 17 -
*SGVFS027825*
on the net defined benefit liability or asset is recognized as expense or income in the consolidatedstatement of income.
Re-measurements comprising actuarial gains and losses, return on plan assets and any change in theeffect of the asset ceiling (excluding net interest on defined benefit liability) are recognizedimmediately in the consolidated statement of comprehensive income in the period in which theyarise. Re-measurements are not reclassified to consolidated statement of income in subsequentperiods.
Plan assets are assets that are held by a long-term employee benefit fund. Plan assets are notavailable to the creditors of the Group, nor can they be paid directly to the Group. Fair value of planassets is based on market price information. When no market price is available, the fair value ofplan assets is estimated by discounting expected future cash flows using a discount rate that reflectsboth the risk associated with the plan assets and the maturity or expected disposal date of thoseassets (or, if they have no maturity, the expected period until the settlement of the relatedobligations). If the fair value of the plan assets is higher than the present value of the defined benefitobligation, the measurement of the resulting defined benefit asset is limited to the present value ofeconomic benefits available in the form of refunds from the plan or reductions in future contributionsto the plan.
The Group’s right to be reimbursed of some or all of the expenditure required to settle a definedbenefit obligation is recognized as a separate asset at fair value when and only when reimbursementis virtually certain.
Employee leave entitlementEmployee entitlements to annual leave are recognized as a liability when they are earned by theemployees. The undiscounted liability for leave expected to be settled within 12 months after theend of the reporting period is recognized for services rendered by employees up to the end of thereporting period. Accumulating leave credits which can be utilized anytime when needed orconverted to cash upon employee separation (i.e., resignation or retirement) are presented at itsdiscounted amount as “Accounts payable and accrued expenses - noncurrent portion” in theconsolidated balance sheet.
Provisions and ContingenciesProvisions are recognized when the Group has a present obligation (legal or constructive) as a resultof a past event, it is probable that an outflow of resources embodying economic benefits will berequired to settle the obligation and a reliable estimate can be made of the amount of the obligation.When the Group expects some or all of a provision to be reimbursed, for example, under aninsurance contract, the reimbursement is recognized as a separate asset, but only when thereimbursement is virtually certain. The expense relating to a provision is presented in theconsolidated statement of income net of any reimbursement. If the effect of the time value of moneyis material, provisions are determined by discounting the effective future cash flows at a pre-tax ratethat reflects current market assessment of the time value of money and where appropriate, the risksspecific to the liability. Where discounting is used, the increase in the provision due to the passageof time is recognized as an interest expense.
Contingent liabilities are not recognized in the consolidated financial statements. They are disclosedunless the possibility of an outflow of resources embodying economic benefits is remote. Acontingent asset is not recognized in the consolidated financial statements but disclosed in the notesto consolidated financial statements when an inflow of economic benefits is probable.

- 18 -
*SGVFS027825*
Income TaxesCurrent income taxCurrent income tax assets and liabilities for the current and prior periods are measured at the amountexpected to be recovered from or paid to the taxation authorities. The tax rates and the tax lawsused to compute the amount are those that are enacted or substantively enacted at the end ofreporting period.
Current income tax for current and prior periods shall, to the extent unpaid, be recognized as aliability under “Income tax payable” account in the consolidated balance sheet. If the amountalready paid in respect of current and prior periods exceeds the amount due for those periods, theexcess shall be recognized as an asset under “Other current assets” account in the consolidatedbalance sheet.
Deferred income taxDeferred income tax is recognized on all temporary differences at the end of reporting periodbetween the tax bases of assets and liabilities and their carrying amounts for financial reportingpurposes.
Deferred income tax liabilities are recognized for all taxable temporary differences, except (a) wherethe deferred income tax liability arises from the initial recognition of goodwill or of an asset orliability in a transaction that is not a business combination and, at the time of the transaction, affectsneither the accounting profit nor taxable profit or loss; and (b) in respect of taxable temporarydifferences associated with investments in subsidiaries, associates and interests in joint ventures,where the timing of the reversal of the temporary differences can be controlled and it is probablethat the temporary differences will not reverse in the foreseeable future.
Deferred income tax assets are recognized for all deductible temporary differences to the extent thatit is probable that sufficient future taxable profits will be available against which the deductibletemporary differences can be utilized. Deferred income tax assets and deferred income tax liabilitiesare not recognized when it arises from the initial recognition of an asset or liability in a transactionthat is not a business combination and, at the time of the transaction, affects neither the accountingprofit nor taxable profit or loss.
The carrying amount of deferred income tax assets is reviewed at each end of reporting period andreduced to the extent that it is no longer probable that sufficient future taxable profits will beavailable to allow all or part of the deferred income tax assets to be utilized. Unrecognized deferredincome tax assets are reassessed at each end of reporting period and are recognized to the extent thatit has become probable that sufficient future taxable profits will allow the deferred income tax assetto be recovered.
Deferred income tax assets and deferred income tax liabilities are measured at the tax rates that areexpected to apply to the period when the asset is realized or the liability is settled, based on tax ratesand tax laws that have been enacted or substantively enacted at the end of reporting period.
Deferred income tax relating to items recognized directly in equity is recognized in equity and thosedirectly in comprehensive income such as re-measurement of defined benefit plan are recognized inthe consolidated statement of comprehensive income and not in the consolidated statement ofincome.
Deferred income tax assets and deferred income tax liabilities are offset, if a legally enforceableright exists to offset current tax assets against current income tax liabilities and the deferred taxesrelate to the same taxable entity and the same taxation authority.
- 19 -
*SGVFS027825*
Other Comprehensive IncomeOther comprehensive income comprises items of income and expense that are not recognized in theconsolidated statement of income in accordance with PFRSs. Other comprehensive income of theGroup includes gains and losses on fair value changes of available-for-sale financial assets,re-measurements comprising actuarial gains and losses, return on plan assets and any change in theeffect of the asset ceiling (excluding net interest on defined benefit liability).
Earnings Per ShareBasic earnings per share is computed by dividing the net income for the year attributable to equityholders of the Parent Company by the weighted average number of ordinary shares issued andoutstanding after considering the retroactive effect, if any, of stock dividends declared during theyear.
Diluted earnings per share is calculated by dividing the net income for the year attributable to equityholders of the Parent Company by the weighted average number of ordinary sharesoutstanding during the year, excluding treasury shares and adjusted for the effects of all dilutivepotential common shares, if any. In determining both the basic and diluted earnings per share, theeffect of stock dividends, if any, is accounted for retrospectively.
Segment ReportingThe Group’s operating businesses are organized and managed separately according to the nature ofthe products and services provided, with each segment representing a strategic business unit thatoffers different products and serves different markets. Financial information on business segmentsis presented in Note 30 to the consolidated financial statements. The Group’s asset-producingrevenues are located in the Philippines (i.e., one geographical location). Therefore, geographicalsegment information is no longer presented.
Events After the Reporting PeriodPost year-end events that provide additional information about the Group’s position at the end ofreporting period (adjusting events) are reflected in the consolidated financial statements. Post year-end events that are not adjusting events are disclosed in the notes to the consolidated financialstatements when material.
Standards Issued but not yet EffectivePronouncements issued but not yet effective are listed below. Unless otherwise indicated, the Groupdoes not expect that the future adoption of the said pronouncements to have a significant impact onits consolidated financial statements. The Group intends to adopt the following pronouncementswhen they become effective.
Effective beginning on or after January 1, 2018
∂ Amendments to PFRS 2, Share-based Payment, Classification and Measurement of Share-based Payment Transactions
The amendments to PFRS 2 address three main areas: the effects of vesting conditions on themeasurement of a cash-settled share-based payment transaction; the classification of a share-based payment transaction with net settlement features for withholding tax obligations; and theaccounting where a modification to the terms and conditions of a share-based paymenttransaction changes its classification from cash settled to equity settled.

- 20 -
*SGVFS027825*
On adoption, entities are required to apply the amendments without restating prior periods, butretrospective application is permitted if elected for all three amendments and if other criteria aremet. Early application of the amendments is permitted.
The Group has assessed that the adoption of these amendments will not have any impact on the2018 consolidated financial statements.
∂ PFRS 9, Financial Instruments
PFRS 9 reflects all phases of the financial instruments project and replaces PAS 39, FinancialInstruments: Recognition and Measurement, and all previous versions of PFRS 9. The standardintroduces new requirements for classification and measurement, impairment, and hedgeaccounting. Retrospective application is required but providing comparative information is notcompulsory. For hedge accounting, the requirements are generally applied prospectively, withsome limited exceptions.
The Group is currently assessing the impact of PFRS 9 and believes that this new standard willaffect the consolidated financial statements. The Group plans to adopt the new standard on themandatory effective date.
∂ Amendments to PFRS 4, Insurance Contracts, Applying PFRS 9, Financial Instruments, withPFRS 4
The amendments address concerns arising from implementing PFRS 9, the new financialinstruments standard before implementing the new insurance contracts standard. Theamendments introduce two options for entities issuing insurance contracts: a temporaryexemption from applying PFRS 9 and an overlay approach. The temporary exemption is firstapplied for reporting periods beginning on or after January 1, 2018. An entity may elect theoverlay approach when it first applies PFRS 9 and apply that approach retrospectively tofinancial assets designated on transition to PFRS 9. The entity restates comparative informationreflecting the overlay approach if, and only if, the entity restates comparative information whenapplying PFRS 9.
The amendments are not applicable to the Group since it has no activities that are predominantlyconnected with insurance or issue insurance contracts.
∂ PFRS 15, Revenue from Contracts with Customers
PFRS 15 establishes a new five-step model that will apply to revenue arising from contractswith customers. Under PFRS 15, revenue is recognized at an amount that reflects theconsideration to which an entity expects to be entitled in exchange for transferring goods orservices to a customer. The principles in PFRS 15 provide a more structured approach tomeasuring and recognizing revenue.
The new revenue standard is applicable to all entities and will supersede all current revenuerecognition requirements under PFRSs. Either a full retrospective application or a modifiedretrospective application is required for annual periods beginning on or after January 1, 2018.Early adoption is permitted.
The Group is currently assessing the impact of PFRS 15 and believes that this new revenuestandard will affect the consolidated financial statements. The Group plans to adopt the newstandard on the mandatory effective date.

- 21 -
*SGVFS027825*
∂ Amendments to PAS 28, Measuring an Associate or Joint Venture at Fair Value (Part of AnnualImprovements to PFRSs 2014 - 2016 Cycle)
The amendments clarify that an entity that is a venture capital organization, or other qualifyingentity, may elect, at initial recognition on an investment-by-investment basis, to measure itsinvestments in associates and joint ventures at fair value through profit or loss. They also clarifythat if an entity that is not itself an investment entity has an interest in an associate or jointventure that is an investment entity, the entity may, when applying the equity method, elect toretain the fair value measurement applied by that investment entity associate or joint venture tothe investment entity associate’s or joint venture’s interests in subsidiaries. This election is madeseparately for each investment entity associate or joint venture, at the later of the date on which(a) the investment entity associate or joint venture is initially recognized; (b) the associate orjoint venture becomes an investment entity; and (c) the investment entity associate or jointventure first becomes a parent.
The amendments should be applied retrospectively, with earlier application permitted.
These amendments are not expected to have any impact on the Group.
∂ Amendments to PAS 40, Investment Property, Transfers of Investment Property
The amendments clarify when an entity should transfer property, including property underconstruction or development into, or out of investment property. The amendments state that achange in use occurs when the property meets, or ceases to meet, the definition of investmentproperty and there is evidence of the change in use. A mere change in management’s intentionsfor the use of a property does not provide evidence of a change in use. The amendments shouldbe applied prospectively to changes in use that occur on or after the beginning of the annualreporting period in which the entity first applies the amendments. Retrospective application isonly permitted if this is possible without the use of hindsight.
Since the Group’s current practice is in line with the clarifications issued, the Group does notexpect any effect on its consolidated financial statements upon adoption of these amendments.
∂ Philippine Interpretation IFRIC-22, Foreign Currency Transactions and AdvanceConsideration
The interpretation clarifies that, in determining the spot exchange rate to use on initialrecognition of the related asset, expense or income (or part of it) on the derecognition of a non-monetary asset or non-monetary liability relating to advance consideration, the date of thetransaction is the date on which an entity initially recognizes the nonmonetary asset or non-monetary liability arising from the advance consideration. If there are multiple payments orreceipts in advance, then the entity must determine a date of the transactions for each paymentor receipt of advance consideration. Entities may apply the amendments on a fully retrospectivebasis. Alternatively, an entity may apply the interpretation prospectively to all assets, expensesand income in its scope that are initially recognized on or after the beginning of the reportingperiod in which the entity first applies the interpretation or the beginning of a prior reportingperiod presented as comparative information in the financial statements of the reporting periodin which the entity first applies the interpretation.
Since the Group’s current practice is in line with the clarifications issued, the Group does notexpect any effect on its financial statements upon adoption of this interpretation.

- 22 -
*SGVFS027825*
Effective beginning on or after January 1, 2019
∂ Amendments to PFRS 9, Prepayment Features with Negative Compensation
The amendments to PFRS 9 allow debt instruments with negative compensation prepaymentfeatures to be measured at amortized cost or fair value through other comprehensive income.An entity shall apply these amendments for annual reporting periods beginning on or afterJanuary 1, 2019. Earlier application is permitted.
These amendments are not expected to have any impact on the Group.
∂ PFRS 16, Leases
PFRS 16 sets out the principles for the recognition, measurement, presentation and disclosureof leases and requires lessees to account for all leases under a single on-balance sheet modelsimilar to the accounting for finance leases under PAS 17, Leases. The standard includes tworecognition exemptions for lessees – leases of ’low-value’ assets (e.g., personal computers) andshort-term leases (i.e., leases with a lease term of 12 months or less). At the commencementdate of a lease, a lessee will recognize a liability to make lease payments (i.e., the lease liability)and an asset representing the right to use the underlying asset during the lease term (i.e., theright-of-use asset). Lessees will be required to separately recognize the interest expense on thelease liability and the depreciation expense on the right-of-use asset.
Lessees will be also required to remeasure the lease liability upon the occurrence of certainevents (e.g., a change in the lease term, a change in future lease payments resulting from achange in an index or rate used to determine those payments). The lessee will generallyrecognize the amount of the remeasurement of the lease liability as an adjustment to the right-of-use asset.
Lessor accounting under PFRS 16 is substantially unchanged from today’s accounting underPAS 17. Lessors will continue to classify all leases using the same classification principle as inPAS 17 and distinguish between two types of leases: operating and finance leases.
PFRS 16 also requires lessees and lessors to make more extensive disclosures than underPAS 17.
Early application is permitted, but not before an entity applies PFRS 15. A lessee can choose toapply the standard using either a full retrospective or a modified retrospective approach. Thestandard’s transition provisions permit certain reliefs.
The Group is currently assessing the impact of adopting PFRS 16.
∂ Amendments to PAS 28, Long-term Interests in Associates and Joint Ventures
The amendments to PAS 28 clarify that entities should account for long-term interests in anassociate or joint venture to which the equity method is not applied using PFRS 9. An entityshall apply these amendments for annual reporting periods beginning on or afterJanuary 1, 2019. Earlier application is permitted.
These amendments are not expected to have any impact on the Group.

- 23 -
*SGVFS027825*
∂ Philippine Interpretation IFRIC-23, Uncertainty over Income Tax Treatments
The interpretation addresses the accounting for income taxes when tax treatments involveuncertainty that affects the application of PAS 12 and does not apply to taxes or levies outsidethe scope of PAS 12, nor does it specifically include requirements relating to interest andpenalties associated with uncertain tax treatments.
The interpretation specifically addresses the following:∂ Whether an entity considers uncertain tax treatments separately∂ The assumptions an entity makes about the examination of tax treatments by taxation
authorities∂ How an entity determines taxable profit (tax loss), tax bases, unused tax losses, unused tax
credits and tax rates∂ How an entity considers changes in facts and circumstances
An entity must determine whether to consider each uncertain tax treatment separately ortogether with one or more other uncertain tax treatments. The approach that better predicts theresolution of the uncertainty should be followed.
The Group is currently assessing the impact of adopting this interpretation.
Deferred effectivity
∂ Amendments to PFRS 10 and PAS 28, Sale or Contribution of Assets between an Investor andits Associate or Joint Venture
The amendments address the conflict between PFRS 10 and PAS 28 in dealing with the loss ofcontrol of a subsidiary that is sold or contributed to an associate or joint venture. Theamendments clarify that a full gain or loss is recognized when a transfer to an associate or jointventure involves a business as defined in PFRS 3, Business Combinations. Any gain or lossresulting from the sale or contribution of assets that does not constitute a business, however, isrecognized only to the extent of unrelated investors’ interests in the associate or joint venture.
On January 13, 2016, the Financial Reporting Standards Council postponed the originaleffective date of January 1, 2016 of the said amendments until the International AccountingStandards Board has completed its broader review of the research project on equity accountingthat may result in the simplification of accounting for such transactions and of other aspects ofaccounting for associates and joint ventures.
3. Significant Accounting Judgments, Estimates and Assumptions
The preparation of the consolidated financial statements requires management to make judgments,estimates and assumptions that affect the amounts reported in the consolidated financial statementsand accompanying notes.
In the opinion of management, these consolidated financial statements reflect all adjustmentsnecessary to present fairly the results for the period presented. Actual results could differ from suchestimates.
- 24 -
*SGVFS027825*
Judgments In the process of applying the Group’s accounting policies, management has made the following
judgments, apart from those involving estimations, which have the most significant effect on theamounts recognized in the consolidated financial statements:
Consolidation of CLDI in which the Group holds less than a majority of voting right (de factocontrol)
The Group consolidates the accounts of CLDI since it considers that it controls CLDI even thoughit owns less than 50% of voting interest. The factors that the Group considered in making thisdetermination include the size of its block of voting shares and the relative size and dispersion ofholdings by other stockholders. The Group is the single largest shareholder of CLDI with 49.73%equity interest. The Parent Company, some of its stockholders and affiliates (whose stockholdersalso own equity ownership in the Parent Company) collectively own more than 50% of the equityof CLDI giving the Parent Company effective control over CLDI.
In addition, majority of the members of its governing body or its key management personnel are thesame as those of CLDI.
Revenue recognitionSelecting the appropriate revenue recognition method for a particular real estate transaction requirescertain judgments based on the following, among others:
∂ Buyer’s continuing commitment to the sales agreementCollectability of the sales price is demonstrated by the buyer’s commitment to pay, which inturn is supported by substantial initial and continuing investments that gives the buyer asufficient stake in the property that risk of loss through default motivates the buyer to honor theobligation. Collectability is also assessed by considering factors such as the credit standing ofthe buyer, age, and location of the property.
For sale of real estate properties, in determining whether the sales prices are collectible, theGroup considers that the initial payments from the buyer of about 10% would demonstrate thebuyer’s commitment to pay.
∂ Stage of completion of the projectThe Group commences the recognition of revenue from sale of uncompleted projects where thePOC method is used when the POC, as determined by independent project engineers, is at 10%.At this stage, the Group considers that the construction has gone beyond preliminary stage, thatis, engineering, design work, construction contracts execution, site clearance and preparation,excavation and the building foundation are completed.
Distinction between investment properties and owner-occupied propertiesThe Group determines whether a property qualifies as investment property. In making its judgment,the Group considers whether the property generates cash flows largely independent of the otherassets held by an entity. Owner-occupied properties generate cash flows that are attributable notonly to the property but also to the other assets used for administrative purposes.
Some properties comprise a portion that is held to earn rentals or for capital appreciation and anotherportion that is held for administrative purposes. If these portions cannot be sold separately at thereporting date, the property is accounted for as investment property only if an insignificant portionis held for administrative purposes. Judgment is applied in determining whether ancillary servicesare so significant that a property does not qualify as investment property. The Group considers eachproperty separately in making its judgment.

- 25 -
*SGVFS027825*
Investment properties amounted to P=2.11 billion and P=2.08 billion as of December 31, 2017 and2016, respectively (see Note 11). Property and equipment amounted to P=10.53 million andP=10.34 million as of December 31, 2017 and 2016, respectively (see Note 12).
Distinction between real estate properties for sale and investment propertiesThe Group determines whether a property is classified as for sale, for lease or for capitalappreciation.
Real estate properties which the Group develops and intends to sell on or before completion ofconstruction are classified as real estate properties for sale. Real estate properties for sale amountedto P=1.18 billion and P=1.52 billion as of December 31, 2017 and 2016, respectively (see Note 9).Real estate properties which are not occupied substantially for use by, or in the operations of theGroup, nor for sale in the ordinary course of business, but are held primarily to earn rental incomeand capital appreciation are classified as investment properties. Investment properties amounted toP=2.11 billion and P=2.08 billion as of December 31, 2017 and 2016, respectively (see Note 11).
Distinction between real estate properties for sale and held for future developmentThe Group determines whether a property will be classified as real estate properties for sale or heldfor future development. In making this judgment, the Group considers whether the property will besold in the normal operating cycle (real estate properties for sale) or whether it will be retained aspart of the Group’s strategic landbanking activities for development or sale in the medium or long-term (real estate properties held for future development). Real estate properties for sale amountedto P=1.18 billion and P=1.52 billion as of December 31, 2017 and 2016, respectively (see Note 9).Real estate properties held for future development amounted to P=1.19 billion and P=0.98 billion asof December 31, 2017 and 2016, respectively (see Note 10).
Estimates The key assumptions concerning the future and other key sources of estimation uncertainty at the
end of reporting period, that have a significant risk of causing a material adjustment to the carryingamounts of assets and liabilities within the next financial year are discussed below:
Revenue and cost recognitionThe Group’s revenue recognition and cost policies require management to make use of estimatesand assumptions that may affect the reported amount of revenue and cost. The Group’s revenuefrom real estate properties based on the POC is measured principally on the basis of the estimatedcompletion of a physical proportion of the contract work.
Estimation of POC of real estate projectsThe Group estimates the POC of ongoing projects for purposes of accounting for the estimated costsof development as well as revenue to be recognized. Actual costs of development could differ fromthese estimates. Such estimates will be adjusted accordingly when the effects become reasonablydeterminable. The POC is based on the technical evaluation of the independent project engineersas well as management’s monitoring of the costs, progress and improvements of the projects. Salesof real estate properties amounted to P=1.31 billion, P=1.48 billion and P=2.37 billion in 2017, 2016and 2015, respectively. Cost of real estate sales amounted to P=0.74 billion, P=0.83 billion andP=1.42 billion in 2017, 2016 and 2015, respectively.
Estimation of allowance for impairment of receivablesThe level of this allowance is evaluated by management based on past collection history and otherfactors, which include, but not limited to the length of the Group’s relationship with customer, thecustomer’s payment behavior, known market factors that affect the collectability of the accountsand the fair value of real estate properties held as collaterals. As of December 31, 2017 and 2016,
- 26 -
*SGVFS027825*
installment contracts receivable, notes receivable, and other receivables aggregated to P=2.63 billionand P=2.09 billion, respectively. There was no impairment of receivables in 2017 and 2016 (seeNotes 6, 7 and 8).
Determination of net realizable value of real estate properties for sale and held for futuredevelopmentThe Group’s estimates of net realizable value of real estate properties for sale and held for futuredevelopment are based on the most reliable evidence available at the time the estimates are made,or the amount that the real estate properties for sale and held for future development are expectedto be realized. These estimates consider the fluctuations of price or cost directly relating to eventsoccurring after the end of the reporting period to the extent that such events confirm conditionsexisting at the end of the period. A new assessment is made of net realizable value in eachsubsequent period. When the circumstances that previously caused the real estate properties for saleto be written down below cost no longer exist or when there is a clear evidence of an increase in netrealizable value because of changes in economic circumstances, the amount of the write-down isreversed so that the new carrying amount is the lower of the cost and the revised net realizable value.
The Group’s real estate properties for sale as of December 31, 2017 and 2016 amounted toP=1.18 billion and P=1.52 billion, respectively (see Note 9). On the other hand, the Group’s real estateproperties held for future development as of December 31, 2017 and 2016 amounted to P=1.19 billionand P=0.98 billion, respectively (see Note 10).
Estimation of useful lives of investment properties and property and equipment The Group estimates the useful lives of investment properties and property and equipment based on
the internal technical evaluation and experience with similar assets. Estimated lives of investmentproperties and property and equipment are reviewed periodically and updated if expectations differfrom previous estimates due to wear and tear, technical and commercial obsolescence and otherlimits on the use of the assets. Net book value of depreciable investment properties as ofDecember 31, 2017 and 2016 amounted to P=1.15 billion and P=0.25 billion, respectively(see Note 11). On the other hand, the net book value of property and equipment, which are alldepreciable, amounted to P=10.53 million and P=10.34 million as of December 31, 2017 and 2016,respectively (see Note 12).
Determination of the fair value of investment propertiesThe Group discloses the fair values of its investment properties in accordance withPAS 40, Investment Property, the Group engaged SEC-accredited and independent valuationspecialists to assess fair value as of December 31, 2017 and 2016. The Group’s investmentproperties consist of land and building pertaining to commercial properties. These are valued byreference to sales of similar or substitute properties and other related market data had the investmentproperties been transacted in the market. The significant unobservable inputs used in determiningthe fair value are the sales price per square meter of similar or substitute property, location, size,shape of lot and the highest and best use. Another method used in determining the fair value of landproperties is based on the market data approach. The value of land is based on sales and listings ofcomparable property registered within the vicinity. This requires adjustments of comparableproperty by reducing reasonable comparative sales and listings to a common denominator byadjusting the difference between the subject property and those actual sales and listings regarded ascomparables. The comparison is premised on the factors of location; size and shape of the lot; timeelement and others (see Note 27).
Impairment of investment properties and property and equipment The Group determines whether its nonfinancial assets such as investment properties and property
and equipment are impaired when impairment indicators exist such as significant underperformance
- 27 -
*SGVFS027825*
relative to expected historical or projected future operating results and significant negative industryor economic trends. When an impairment indicator is noted, the Group makes an estimation of thevalue-in-use of the cash-generating units to which the assets belong. Estimating the value-in-userequires the Group to make an estimate of the expected future cash flows from the cash-generatingunit and also to choose an appropriate discount rate in order to calculate the present value of thosecash flows. No impairment indicator was noted as of December 31, 2017 and 2016. Net book valueof investment properties as of December 31, 2017 and 2016 amounted to P=2.11 billion andP=2.08 billion, respectively (see Note 11). On the other hand, the net book value of property andequipment amounted to P=10.53 million and P=10.34 million as of December 31, 2017 and 2016,respectively (see Note 12).
Estimation of retirement benefits costThe cost of the defined benefit plan and the present value of the defined benefit obligation aredetermined using actuarial valuations which involves making various assumptions that may differfrom actual developments in the future. These assumptions include the determination of the discountrate, future salary increases, mortality rates and future pension increases. Due to the complexitiesinvolved in the valuation and its long-term nature, a defined benefit obligation is highly sensitive tochanges in these assumptions. All assumptions are reviewed at each reporting date.
In determining the appropriate discount rate, management considers the PDEX PDST-R2 rates atvarious tenors, rates for intermediate durations were interpolated and the rates were then weightedby the expected benefits payments at those durations to arrive at the single weighted averagediscount rate.
The mortality rate is based on publicly available mortality table in the Philippines. Future salaryincreases are based on expected future inflation rates. Further details about assumptions used aregiven in Note 24.
Net retirement benefits cost amounted to P=2.31 million, P=1.41 million and P=1.51 million in 2017,2016 and 2015, respectively. The carrying value of the Parent Company’s and CPI’s net retirementplan assets as of December 31, 2017 and 2016 amounted to P=14.14 million and P=12.38 million,respectively. The carrying value of CLDI’s net retirement benefits liability as of December 31, 2017and 2016 amounted to P=5.49 million and P=6.43 million, respectively (see Note 24).
Estimation of reservesReserves are set up for all pre-need benefits guaranteed and payable by CPI as defined in the pre-need plan contracts. The determination of CPI’s reserves is based on the actuarial formula, methods,and assumptions allowed by applicable SEC and IC circulars.
As of December 31, 2017, the principal assumptions used in determining the PNR was based on theIC Circular Letter No. 23-2012 dated November 28, 2012. The transitory discount interest rate thatshall be used in the valuation of pre-need reserves shall not exceed the lower of the attainable ratesas certified by the Trustee of 5.470% and 5.467% in 2017 and 2016, respectively, and the IC rate of7.25%.
The following are the assumptions used in the computation of pre-need reserves:
December 31, 2017:
a. Currently-Being-Paid Pension Plans - Actively Paying Plans
∂ Plans issued prior to 2006 and after - 5.470% discount rate (ROI rate) and nosurrender/lapse rates were used.

- 28 -
*SGVFS027825*
b. Currently-Being-Paid Pension Plans - Lapsed Plans
∂ Plans issued prior to 2006 and after - reserves equal the termination values (as originallycomputed) at the date of lapse and no reinstatement rate was assumed.
c. Fully paid plans - Availing and Not Yet Availing
∂ Plans with maturity dates in years 2018 and after - 5.470% discount rate (ROI rate) and nosurrender rates were assumed for fully paid plans.
December 31, 2016:
a. Currently-Being-Paid Pension Plans - Actively Paying Plans
∂ Plans issued prior to 2006 and after - 5.467% discount rate (ROI rate) and nosurrender/lapse rates were used.
b. Currently-Being-Paid Pension Plans - Lapsed Plans
∂ Plans issued prior to 2006 and after - reserves equal the termination values (as originallycomputed) at the date of lapse and no reinstatement rate was assumed.
c. Fully paid plans - Availing and Not Yet Availing
∂ Plans with maturity dates in years 2017 and after - 5.467% discount rate (ROI rate) and nosurrender rates were assumed for fully paid plans.
December 31, 2015:
a. Currently-Being-Paid Pension Plans - Actively Paying Plans
∂ Plans issued prior to 2006 and after - 5.448% discount rate (ROI rate) and nosurrender/lapse rates were used.
b. Currently-Being-Paid Pension Plans - Lapsed Plans
∂ Plans issued prior to 2006 and after - reserves equal the termination values (as originallycomputed) at the date of lapse and no reinstatement rate was assumed.
c. Fully paid plans - Availing and Not Yet Availing
∂ Plans with maturity dates in years 2016 and after - 5.448% discount rate (ROI rate) and nosurrender rates were assumed for fully paid plans.
Management believes that the amount of pre-need reserves and other reserves recorded in the booksclosely reflect potential plan claims as of end of reporting period. As of December 31, 2017 and2016, pre-need reserve and other reserves amounted to P=41.34 million and P=45.11 million,respectively (see Note 5).
Recognition of deferred income tax assetsThe Group reviews the carrying amounts of deferred income tax assets at the end of each reportingperiod and reduces deferred income tax assets to the extent that it is no longer probable that sufficient
- 29 -
*SGVFS027825*
future taxable profits will be available to allow all or part of the deferred income tax assets to beutilized.
As of December 31, 2017 and 2016, deferred income tax assets amounted to P=36.62 million andP=27.24 million, respectively (see Note 25).
4. Cash and Cash Equivalents and Short-term Cash Investments
Cash and cash equivalents consist of:
2017 2016Cash on hand and in banks P=25,328,317 P=12,392,628Cash equivalents 835,500,000 1,776,577,647
P=860,828,317 P=1,788,970,275
Cash in banks earn interest at the respective bank deposit rates. Cash equivalents are made forvarying periods up to three months depending on the immediate cash requirements of the Group,and earn interest at the respective investment rates.
Short-term cash investments amounting to P=1.52 billion and P=1.22 billion as of December 31, 2017and 2016, respectively, have maturities of more than three months to one year from dates ofacquisition and earn interest at the prevailing market rates.
Interest income earned from cash in banks, cash equivalents and short-term cash investmentsamounted to P=67.34 million, P=63.86 million and P=60.28 million in 2017, 2016 and 2015,respectively (see Note 21).
5. Investments in Trust Funds and Pre-need and Other Reserves
Investments in trust funds Pursuant to the provisions of the SEC Memorandum Circular No. 6, Guidelines on the Management
of the Trust Fund of Pre-Need Corporation (SEC Circular No. 4), the SEC requires, among others,that companies engaged in the sale of pre-need plans and similar contracts to planholders set up atrust fund to guarantee the delivery of property or performance of service in the future. Withdrawalsfrom these trust funds are limited to, among others, payments of pension plan benefits, bank chargesand investment expenses in the operation of the trust funds, termination value payable to planholders, contributions to the trust funds of cancelled plans and final taxes on investment income ofthe trust funds.
In accordance with the SEC requirements, CPI has funds deposited with two local trusteebanks with net assets aggregating to P=34.61 million and P=35.30 million as of December 31, 2017and 2016, respectively, which are recorded under “Investments in trust funds” account in theconsolidated balance sheets.

- 30 -
*SGVFS027825*
The details of investments in trust funds as of December 31 are as follows:
2017 2016AssetsCash and cash equivalents P=4,336,908 P=4,240,193Debt and listed equity securities 22,997,450 23,839,071Investment properties 4,186,000 6,782,000Loans and receivables 3,419,893 366,470Others 147,410 424,014
35,087,661 35,651,748Liabilities (481,311) (354,659)
34,606,350 35,297,089Less noncurrent portion 30,337,287 30,807,590
P=4,269,063 P=4,489,499
Total contributions to the trust funds amounted to P=2.57 million, P=2.68 million and P=3.06 million in2017, 2016 and 2015, respectively. Total withdrawals from the trust funds amounted toP=4.04 million, P=7.09 million and P=3.67 million in 2017, 2016 and 2015, respectively.
Mark to market gain (loss) of available-for-sale financial assets amounted to (P=0.26 million) andP=0.78 million and in 2017 and 2016, respectively.
The movements in reserve for fluctuation in value of available-for-sale financial assets held in trustfunds follow:
2017 2016Balances at beginning of year P=1,266,802 P=489,137Changes in fair value during the year (594,225) 777,665Balances at end of year P=672,577 P=1,266,802
Details of reserves are as follows:
2017 2016PNR P=31,710,864 P=31,513,795Reserve for trust fund deficiency 8,824,505 12,611,300Pension bonus reserve 651,186 785,847Insurance premium reserve 157,716 196,570
41,344,271 45,107,512Less noncurrent portion 39,844,243 43,909,277
P=1,500,028 P=1,198,235
Net contractual liabilities comprise the PNR and reserve for trust fund deficiency. In the opinion ofmanagement and the independent actuary, CPI’s net contractual liabilities amounting toP=40.54 million and P=44.13 million as of December 31, 2017 and 2016, respectively, which is basedon the actuarial reports, closely reflect actual potential plan claims as of those dates.
In accordance with IC Circular Letter No. 23-2012 issued on November 28, 2012, the Groupcomputed for the transitory PNR which amounted to P=31.71 million and P=31.51 million as ofDecember 31, 2017 and 2016, respectively. If the resulting pre-need reserve is greater than the actualtrust fund balance at the end of the year, the transitory pre-need reserves shall be computed inaccordance with the schedule provided in the IC Circular Letter.
- 31 -
*SGVFS027825*
Although not required, in 2017 and 2016, the BOD has deemed it prudent and opted to set up thedifference in net contractual liabilities and transitory pre-need reserve amounting to P=8.82 million(to be funded for the next 4 years) and P=12.61 million (to be funded for the next 5 years) under “Pre-need and other reserves” account as of December 31, 2017 and 2016, respectively.
The trust fund deficiency amounting to P=2.21 million, P=2.52 million and P=2.59 million in 2017,2016 and 2015, respectively, should be placed in the trust fund within 60 days from April 30following the valuation date. The trust fund deficiency for the year represents the difference of pre-need reserve and trust fund investment, net of investment in trust funds allocated to pension bonusand unrealized gains.
6. Installment Contracts Receivable2017 2016
Installment contracts receivable P=1,835,418,984 P=2,007,757,101Less noncurrent portion 1,509,504,341 1,687,290,041Current portion P=325,914,643 P=320,467,060
Installment contracts receivable arise from sales of real estate properties and are collectible inmonthly installments for periods ranging from one (1) to 10 years which bear monthly interest ratesof 0.67% to 2.00% in 2017, 2016 and 2015 computed on the diminishing balance.
Interest income earned from installment contracts receivable amounted to P=247.47 million,P=222.55 million and P=222.81 million in 2017, 2016 and 2015, respectively (see Note 21).
The Parent Company, CLDI and CI entered into a contract of guaranty under Retail Guaranty Linein the amount of P=2.00 billion in 2015 with Home Guaranty Corporation (HGC). The amount ofinstallment contracts receivable enrolled and renewed by the Group amounted to P=1.67 billion andP=0.73 billion in 2017 and 2016, respectively. The Group paid a guarantee premium of 1.00%, basedon outstanding principal balance of the receivables enrolled in 2017 and 2016.
7. Notes Receivable
Notes receivable pertains to short-term and long-term investments placed by the Company todifferent financial institutions which earn interest at the prevailing market interest rates ranging from3.375% to 4.625%.
2017 2016Notes receivable P=728,000,000 P=20,000,000Less noncurrent portion 600,000,000 20,000,000Current portion P=128,000,000 P=–
There were no properties offered as collaterals for the said notes receivables. Details of notesreceivables are as follows:
Date of Placement Amount Maturity DateDecember 2017 P=100,000,000 2 to 3 monthsDecember 2017 70,000,000 5 years
(Forward)

- 32 -
*SGVFS027825*
Date of Placement Amount Maturity DateOctober 2017 P=70,000,000 1 year and 6 monthsOctober 2017 60,000,000 2 yearsApril 2017 380,000,000 3 yearsMarch 2017 28,000,000 1 year and 3 monthsAugust 2016 20,000,000 4 years
Interest income earned from notes receivable amounted to P=12.08 million and P=0.16 million in 2017and 2016, respectively (see Note 21).
8. Other Receivables
Other receivables consist of:2017 2016
Advances to:Customers P=21,892,387 P=29,807,407Contractors 7,793,890 8,674,949
Accrued interest 11,838,196 7,762,977Rent receivable 11,044,207 11,177,329Retention 2,771,681 724,766Due from BIR 2,673,535 1,231,682Due from related parties (Note 26) 1,017,855 416,106Others 2,822,558 2,872,916
61,854,309 62,668,132Less noncurrent portion 15,266,489 12,862,409Current portion P=46,587,820 P=49,805,723
Advances to customers are receivables of the Group for the real estate property taxes of soldcondominium units initially paid by the Group whereas advances to contractors are advances madeby the Group for the contractors’ supply requirements.
Rent receivable arose from the investment properties rented-out under non-cancellable long-termoperating lease contracts (see Note 11). Due from BIR pertains to input VAT refund relating to zero-rated sales in 2017 and 2016.
Other receivables include receivables from customers relating to registration of title and otherexpenses initially paid by the Group on behalf of the buyers and employees’ advances.
9. Real Estate Properties for Sale
Real estate properties for sale consists of costs incurred in the development of condominium unitsand residential houses. Real estate properties for sale includes deemed cost adjustment amountingto P=49.82 million and P=10.23 million as of December 31, 2017 and 2016, respectively(see Note 16). The deemed cost adjustment arose when the Group transitioned to PFRSs in 2005.

- 33 -
*SGVFS027825*
The movements in real estate properties for sale follows:
2017 2016Balances at beginning of year P=1,518,256,209 P=1,378,393,226Construction/development costs incurred 423,212,900 660,196,952Disposals (cost of real estate sales) (738,985,531) (826,197,687)Transfer from (to) investment properties (Note 11) (32,266,351) 118,355,052Borrowing costs capitalized (Note 22) 3,247,060 503,569Transfer from real estate properties held for future
development (Note 10) – 155,996,523Other adjustments - net 3,926,357 31,008,574Balances at end of year P=1,177,390,644 P=1,518,256,209
Real estate properties for sale account includes capitalized borrowing costs incurred during eachyear in connection with the development of the properties. The average capitalization rate used todetermine the amount of capitalized borrowing costs eligible for capitalization is 1.24% in 2017 and2016 and 1.23% in 2015.
Other adjustments include realized deemed cost adjustment and the effect of stating repossessed realestate properties during the year at fair value less cost to sell.
10. Real Estate Properties Held for Future Development
Real estate properties held for future development include land properties reserved by the Group forits future condominium projects.
Movements in real estate properties held for future development are as follows:
2017 2016Balances at beginning of year P=978,108,206 P=822,007,622Additions 9,489,074 312,097,107Transfer to investment properties (Note 11) (4,371,873) –Transfer from investment properties (Note 11) 211,594,974 –Transfer to real estate properties for sale (Note 9) – (155,996,523)Balances at end of year P=1,194,820,381 P=978,108,206
On various dates in 2016, the Parent Company purchased three parcels of land for futuredevelopment amounting to P=294.62 million.

- 34 -
*SGVFS027825*
11. Investment Properties
Investment properties represent real estate properties for lease which consist of:
2017
Land Building
Machineryand
EquipmentConstruction
in Progress TotalCostsBalances at beginning of year P=1,104,314,985 P=340,434,058 P=15,730,535 P=727,113,016 P=2,187,592,594Additions 58,442 24,315,568 – 201,594,034 225,968,044Transfer from real estate
properties for sale (Note 9) 32,266,351 – – – 32,266,351Transfer from real estate
properties held for futuredevelopment (Note 10) 4,371,873 – – – 4,371,873
Transfer to real estate propertiesheld for futuredevelopment (Note 10) (189,094,365) (22,500,609) – – (211,594,974)
Capitalized borrowing costs(Note 22) – – – 7,075,307 7,075,307
Reclassification – 773,937,663 161,005,946 (934,943,609) –Balances at end of year 951,917,286 1,116,186,680 176,736,481 838,748 2,245,679,195Accumulated DepreciationBalances at beginning of year – 98,842,725 6,203,255 – 105,045,980Depreciation (Notes 18 and 20) – 31,220,969 2,126,832 – 33,347,801Balances at end of year – 130,063,694 8,330,087 – 138,393,781Net Book Values P=951,917,286 P=986,122,986 P=168,406,394 P=838,748 P=2,107,285,414
2016
Land Building
Machineryand
EquipmentConstruction
in Progress TotalCostsBalances at beginning of year P=1,219,861,668 P=339,890,150 P=15,730,535 P=373,084,725 P=1,948,567,078Additions 2,808,369 543,908 – 344,883,842 348,236,119Transfer to real estate properties
for sale (Note 9) (118,355,052) – – – (118,355,052)Capitalized borrowing costs
(Note 22) – – – 9,144,449 9,144,449Balances at end of year 1,104,314,985 340,434,058 15,730,535 727,113,016 2,187,592,594Accumulated DepreciationBalances at beginning of year – 81,812,838 4,076,423 – 85,889,261Depreciation (Notes 18 and 20) – 17,029,887 2,126,832 – 19,156,719Balances at end of year – 98,842,725 6,203,255 – 105,045,980Net Book Values P=1,104,314,985 P=241,591,333 P=9,527,280 P=727,113,016 P=2,082,546,614
CityNet1 was registered with the Philippine Economic Zone Authority (PEZA) on March 3, 2014with Registration No. EZ14-04. The Company leases out this property to a business processoutsourcing (BPO) company which is also a PEZA-registered entity.
Construction in progress as of December 31, 2017 pertains to the construction of a building whichcommenced in 2017 and is expected to be completed in the first semester of 2018.
Construction in progress as of December 31, 2016 pertains to the construction costs of CityNetCentral, a BPO building, which commenced in 2014 and was completed on August 31, 2017.CityNet Central is also registered with PEZA on February 17, 2015 with RegistrationNo. EZ 15-06.

- 35 -
*SGVFS027825*
The net book values of land and building include net deemed cost adjustment amounting toP=158.67 million and P=219.83 million as of December 31, 2017 and 2016, respectively(see Note 16). The deemed cost adjustment arose when the Group transitioned to PFRSs in 2005.
Based on the appraisal reports by SEC-accredited and independent firms of appraisers using marketdata and sales comparison approach at various dates in 2017 and 2016, appraised values of theseinvestment properties amounted to P=4.17 billion and P=2.59 billion as of dates of appraisal in 2017and 2016, respectively (see Note 27).
The Company entered into a non-cancellable operating lease contracts with various third parties asfollows:
Year Lessee (Third Parties) Term2017 BPO 3 years2017 Convenience Store 5 years2016 Domestic Corporation 5 years2016 Fast Food 10 years2015 Domestic Corporation 4 years and 4 months2014 BPO 6 years2011 Fast Food 10 years
The lease contracts include clauses to enable periodic upward revision of the rental chargeaccording to prevailing market conditions.
The future minimum lease payments for these lease agreements as of December 31 are as follows:
2017 2016Within one year P=102,271,503 P=78,382,646After one year but not more than five years 169,925,542 220,593,884Later than five years 32,836,048 41,030,584
P=305,033,093 P=340,007,114
Rent income from investment properties amounted to P=119.68 million, P=92.76 million andP=83.26 million in 2017, 2016, and 2015, respectively.
Direct operating expenses on investment properties pertaining to depreciation, real estate taxes andother expenses amounted to P=59.68 million, P=33.85 million and P=23.43 million in 2017, 2016 and2015, respectively.
Other lease agreements with third parties are generally for a one year term renewable every year.

- 36 -
*SGVFS027825*
12. Property and Equipment
Property and equipment consists of:2017
OfficePremises
Furniture,Fixtures
and OfficeEquipment
Transportationand Other
Equipment TotalAt CostBalances at beginning of year P=– P=34,700,959 P=6,380,142 P=41,081,101Additions – 5,407,500 – 5,407,500Balances at end of year – 40,108,459 6,380,142 46,488,601Accumulated DepreciationBalances at beginning of year – 32,304,511 5,000,269 37,304,780Depreciation (Notes 18 and 20) – 1,834,549 301,607 2,136,156Balances at end of year – 34,139,060 5,301,876 39,440,936Net Book Value – 5,969,399 1,078,266 7,047,665At Deemed Cost 253,365,628 – – 253,365,628Accumulated DepreciationBalances at beginning of year 246,803,015 – – 246,803,015Depreciation (Notes 18 and 20) 3,076,651 – – 3,076,651Balances at end of year 249,879,666 – – 249,879,666Net Deemed Cost 3,485,962 – – 3,485,962Total P=3,485,962 P=5,969,399 P=1,078,266 P=10,533,627
2016
OfficePremises
Furniture,Fixtures
and OfficeEquipment
Transportationand Other
Equipment TotalAt CostBalances at beginning of year P=– P=34,700,959 P=5,970,856 P=40,671,815Additions – – 876,786 876,786Disposals – – (467,500) (467,500)Balances at end of year – 34,700,959 6,380,142 41,081,101Accumulated DepreciationBalances at beginning of year – 31,100,837 5,166,162 36,266,999Depreciation (Notes 18 and 20) – 1,203,674 301,607 1,505,281Disposals – – (467,500) (467,500)Balances at end of year – 32,304,511 5,000,269 37,304,780Net Book Value – 2,396,448 1,379,873 3,776,321At Deemed Cost 253,365,628 – – 253,365,628Accumulated DepreciationBalances at beginning of year 243,726,364 – – 243,726,364Depreciation (Notes 18 and 20) 3,076,651 – – 3,076,651Balances at end of year 246,803,015 – – 246,803,015Net Deemed Cost 6,562,613 – – 6,562,613Total P=6,562,613 P=2,396,448 P=1,379,873 P=10,338,934
For the office premises, the Group elected to apply the optional exemption under PFRS 1, First-Time Adoption of PFRS, to use the revalued amount as deemed cost as at January 1, 2005, the dateof transition to PFRSs. As of December 31, 2017 and 2016, the balances at pre-PFRS cost of theoffice premises are as follows:
2017 2016Office premises P=55,775,746 P=55,775,746Less accumulated depreciation 55,036,250 54,382,454Net book values P=739,496 P=1,393,292

- 37 -
*SGVFS027825*
Difference between the net deemed cost and the net pre-PFRSs cost amounting to P=2.75 million andP=5.17 million as of December 31, 2017 and 2016, respectively, represents the remaining balance ofthe deemed cost adjustment (see Note 16).
The cost of fully depreciated property and equipment still used in operations amounted toP=33.40 million as of December 31, 2017 and 2016.
13. Other Assets
Other current assets amounting to P=60.54 million and P=53.53 million as of December 31, 2017 and2016, respectively, represent unused input VAT and prepaid real estate taxes.
Other noncurrent assets consist of:
2017 2016Unused input VAT P=57,187,022 P=56,746,092Available-for-sale financial assets 1,629,078 1,468,347Deposits and others 19,101,461 20,757,794
P=77,917,561 P=78,972,233
The unused input VAT arose from the purchase of parcels of land recorded as part of “Real estateproperties held for future development” and “Investment properties” accounts in 2017 and 2016,respectively (see Notes 10 and 11).
Available-for-sale financial assets consist of investments in quoted equity securities. The fair valuesof available-for-sale financial assets were determined based on published prices in an active market.
The movement in “Net changes in fair values of available-for-sale financial assets” accountpresented in the equity section of the consolidated balance sheets is as follows:
2017 2016Balances at beginning of year P=1,706,728 P=1,102,540Mark-to-market gain (loss) attributable to equity
holders of the Parent Company (455,173) 604,188Balances at end of year P=1,251,555 P=1,706,728
Mark-to-market gain on available-for-sale financial assets pertaining to the non-controlling interestsamounted to P=0.02 million and P=0.06 million in 2017 and 2016, respectively.
Dividend income from available-for-sale financial assets amounted to P=22,824, P=24,746 andP=29,133 in 2017, 2016 and 2015, respectively (see Note 21).
Deposits and others represent payments made by the Group to various utility companies for theinstallation of electric and water meters for unsold condominium units.

- 38 -
*SGVFS027825*
14. Accounts Payable and Accrued Expenses
Accounts payable and accrued expenses consist of:
2017 2016Trade payables P=137,980,436 P=97,276,169Customers’ deposits 37,816,462 170,626,671Accrued expenses:
Development costs 97,195,128 333,967,559Sick leave (Note 24) 24,020,922 23,074,846Directors’ fee (Note 26) 20,660,349 13,083,295Interest payable 2,398,253 2,526,374Taxes, premiums, others 5,248,552 1,777,316
Dividends payable 11,050,680 9,229,007Withholding taxes payable 4,644,064 7,771,084Deferred rent income 5,177,513 6,976,210Others 9,326,956 8,344,919
355,519,315 674,653,450Less noncurrent portion 103,764,222 337,136,893Current portion P=251,755,093 P=337,516,557
Trade payables consist of payables to suppliers, contractors and other counterparties. Customers’deposits in 2016 consist of collections from the pre-selling of Pines Peak Tower II andOne Taft Residences condominium units, which were realized in 2017 upon reaching 10% ofpreliminary construction activities. This account also consists of rental deposits and collecteddeposits for water and electric meters of the sold units. Accrued development costs represent thecorresponding accrued expenses for the completed condominium units of the Group. Deferred ren tincome pertains to rent received from long-term operating lease. Other payables consistsubstantially of commissions payable, unclaimed checks of pension holders, and payables due togovernment agencies.
The movements in dividends payable and accrued interest are as follows:
PaymentsJanuary 1, 2017 Additions Expensed Capitalized December 31, 2017
Dividends payable (Note 16) P=9,229,007 P=142,883,989 (P=141,062,316) P=– P=11,050,680Accrued interest (Note 15) 2,526,374 19,053,838 (8,859,592) (10,322,367) 2,398,253
P=11,755,381 P=161,937,827 (P=149,921,908) (P=10,322,367) P=13,448,933
15. Notes Payable
Notes payable pertain to commercial papers with varying maturities and annual interest rates rangingfrom 1.06% to 1.25% and 1.06% to 1.31% as of December 31, 2017 and 2016, respectively.
On various dates in 2017 and 2016, the SEC authorized the Parent Company and CLDI to issue totalaggregated amount of P=1.75 billion and P=1.60 billion, respectively, worth of commercial papersregistered with the SEC in accordance with the provision of the Securities Regulation Code and itsimplementing rules and regulations and other applicable laws and orders. Outstanding commercialpapers issued by the Parent Company and CLDI as of December 31, 2017 and 2016 aggregated toP=1.45 billion and P=1.67 billion, respectively.

- 39 -
*SGVFS027825*
The movements in notes payable are as follows:
2017 2016Beginning balance P=1,673,000,000 P=1,135,200,000Availment 6,106,350,000 5,581,503,287Payment (6,325,900,000) (5,043,703,287)Ending balance P=1,453,450,000 P=1,673,000,000
Interest expense related to notes payable amounted to P=18.50 million, P=14.52 million andP=13.32 million in 2017, 2016 and 2015, respectively (see Note 22). Capitalized borrowing costsamounted to P=10.32 million, P=9.65 million and P=7.68 million in 2017, 2016 and 2015, respectively(see Notes 9, 11 and 22). Total interest paid amounted to P=19.18 million, P=14.95 million andP=14.32 million in 2017, 2016 and 2015, respectively.
The Group and CI have credit lines with financial institutions aggregating to about P=2.45 billion asof December 31, 2017 and 2016, which are available for drawing by any of the companies in theGroup. No loans were availed by the Group from the credit line in 2017 and 2016.
The Parent Company has specific credit lines amounting to P=500.00 million in 2017 and 2016.
The carrying values of the Parent Company’s investment properties that will be used as collateralsas of December 31, 2017 and 2016 amounted to P=191.87 million and P=291.64 million, respectively.
16. Equity
a. The Parent Company registered 10,000,000 shares with the SEC on June 15, 1978 with an initialoffer price of P=10.00. On July 27, 2012, the SEC approved the Amended Articles ofIncorporation on the application for increase in authorized capital stock from P=3.00 billion toP=4.00 billion with a par value of P=1.00 each. As of December 31, 2017 and 2016, the ParentCompany has 3,940,001,648 shares held by 669 equity holders and 3,752,475,115 shares heldby 684 equity holders, respectively.
The following table summarizes the reconciliation of the issued and outstanding shares ofcapital stock for each of the following:
2017 2016 2015Shares Amount Shares Amount Shares Amount
Authorized shares- P=1 parvalue 4,000,000,000 P=4,000,000,000 4,000,000,000 P=4,000,000,000 4,000,000,000 P=4,000,000,000
Issued, beginning of year 3,752,475,115 P=3,752,475,115 3,573,878,400 P=3,573,878,400 3,573,878,400 P=3,573,878,400Treasury stock (4,234,588) (4,234,588) (4,125,225) (4,125,225) (4,021,067) (4,021,067)Outstanding 3,748,240,527 3,748,240,527 3,569,753,175 3,569,753,175 3,569,857,333 3,569,857,333Stock dividends 187,526,533 187,526,533 178,596,715 178,596,715 – –
3,935,767,060 3,935,767,060 3,748,349,890 3,748,349,890 3,569,857,333 3,569,857,333Treasury stock 4,234,588 4,234,588 4,125,225 4,125,225 4,021,067 4,021,067Issued, end of year 3,940,001,648 P=3,940,001,648 3,752,475,115 P=3,752,475,115 3,573,878,400 P=3,573,878,400
Treasury stock includes 2,296,641 shares and 2,187,278 shares in 2017 and 2016, respectively,held by CPI.

- 40 -
*SGVFS027825*
b. Dividends declared and issued/paid by the Parent Company in 2017, 2016 and 2015 are asfollows:
BOD Stockholders’ Stockholders ofDividends Approval Date Approval Date Per Share Record Date Date Issued/PaidCash May 23, 2017 P=0.036 June 6, 2017 June 22, 2017
June 3, 2016 0.066 June 17, 2016 July 1, 2016May 28, 2015 0.027 June 26, 2015 July 22, 2015
Stock April 27, 2017 June 6, 2017 5% July 6, 2017 August 1, 2017April 25, 2016 June 7, 2016 5% July 7, 2016 August 2, 2016
Fractional shares of stock dividends were paid in cash based on the par value.
In 2017 and 2016, the SEC approved the issuance of 5% stock dividends declared by the BODand ratified by the stockholders during the Annual Stockholders’ Meeting.
c. As of December 31, 2017 and 2016, the retained earnings attributable to equity holders of theParent Company and the non-controlling interest include the remaining balance of deemed costadjustment which arose when the Group transitioned to PFRSs in 2005.
The components of the deemed cost adjustment, net of deferred income tax liabilities includedin equity, as of December 31 are as follows:
2017 2016Real estate properties for sale (Note 9) P=49,824,290 P=10,232,819Investment properties (Note 11) 158,666,020 219,825,103Property and equipment (Note 12) 2,746,466 5,169,321Deemed cost adjustment 211,236,776 235,227,243Deferred income tax liability (Note 25) (63,371,033) (70,568,173)Net deemed cost adjustment P=147,865,743 P=164,659,070
In 2017, P=61.16 million of deemed cost adjustment on investment properties was transferred toreal estate properties for sale of which P=16.28 million was realized through sale.
The net deemed cost adjustment is allocated in the consolidated statements of changes in equityas follows:
2017 2016Attributable to:
Equity holders of the Parent Company P=141,921,126 P=158,714,453Non-controlling interest 5,944,617 5,944,617
P=147,865,743 P=164,659,070
The balance of retained earnings is restricted for the payment of dividends to the extent of thefollowing:
2017 2016Undistributed earnings of subsidiaries P=998,775,299 P=934,074,626Net deemed cost adjustment in properties 147,865,743 164,659,070Cost of treasury shares 31,429,574 31,429,574Deferred income tax assets 26,045,164 16,275,995Fair value adjustment arising from repossessed
inventories 25,768,060 23,565,123P=1,229,883,840 P=1,170,004,388
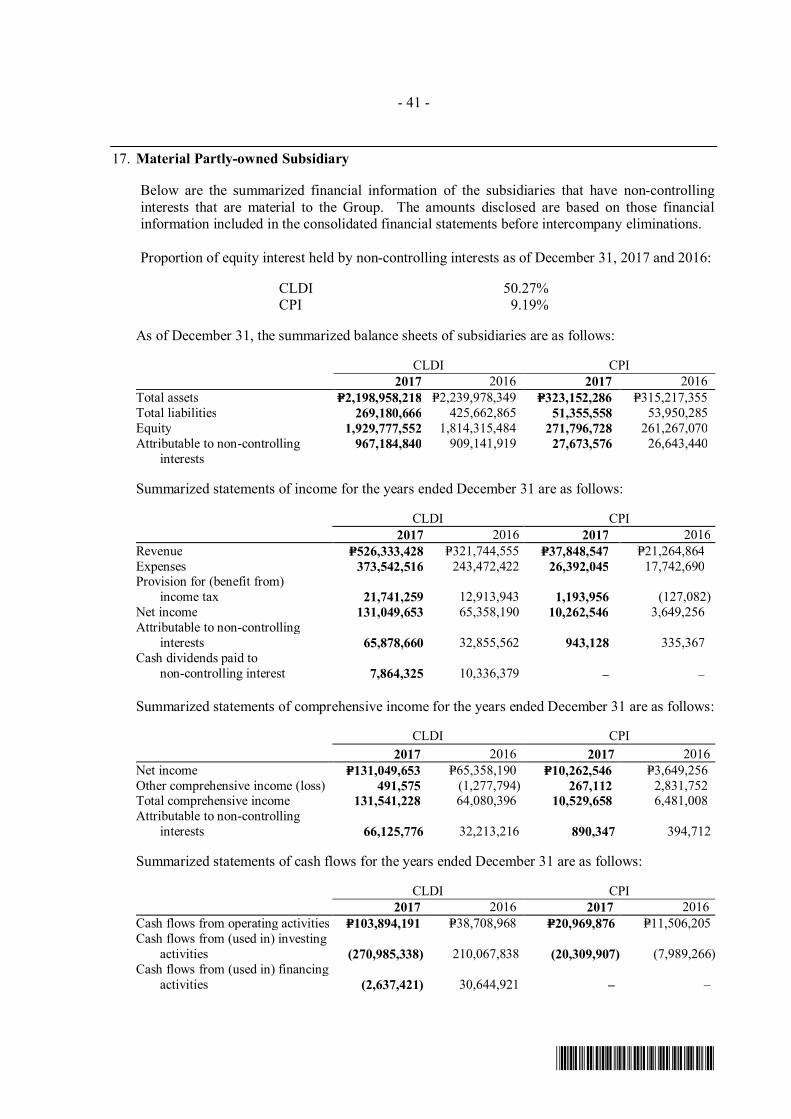
- 41 -
*SGVFS027825*
17. Material Partly-owned Subsidiary
Below are the summarized financial information of the subsidiaries that have non-controllinginterests that are material to the Group. The amounts disclosed are based on those financialinformation included in the consolidated financial statements before intercompany eliminations.
Proportion of equity interest held by non-controlling interests as of December 31, 2017 and 2016:
CLDI 50.27%CPI 9.19%
As of December 31, the summarized balance sheets of subsidiaries are as follows:
CLDI CPI2017 2016 2017 2016
Total assets P=2,198,958,218 P=2,239,978,349 P=323,152,286 P=315,217,355Total liabilities 269,180,666 425,662,865 51,355,558 53,950,285Equity 1,929,777,552 1,814,315,484 271,796,728 261,267,070Attributable to non-controlling
interests967,184,840 909,141,919 27,673,576 26,643,440
Summarized statements of income for the years ended December 31 are as follows:
CLDI CPI2017 2016 2017 2016
Revenue P=526,333,428 P=321,744,555 P=37,848,547 P=21,264,864Expenses 373,542,516 243,472,422 26,392,045 17,742,690Provision for (benefit from) income tax 21,741,259 12,913,943 1,193,956 (127,082)Net income 131,049,653 65,358,190 10,262,546 3,649,256Attributable to non-controlling
interests 65,878,660 32,855,562 943,128 335,367Cash dividends paid to
non-controlling interest 7,864,325 10,336,379 – –
Summarized statements of comprehensive income for the years ended December 31 are as follows:
CLDI CPI2017 2016 2017 2016
Net income P=131,049,653 P=65,358,190 P=10,262,546 P=3,649,256Other comprehensive income (loss) 491,575 (1,277,794) 267,112 2,831,752Total comprehensive income 131,541,228 64,080,396 10,529,658 6,481,008Attributable to non-controlling
interests 66,125,776 32,213,216 890,347 394,712
Summarized statements of cash flows for the years ended December 31 are as follows:
CLDI CPI2017 2016 2017 2016
Cash flows from operating activities P=103,894,191 P=38,708,968 P=20,969,876 P=11,506,205Cash flows from (used in) investing
activities (270,985,338) 210,067,838 (20,309,907) (7,989,266)Cash flows from (used in) financing
activities (2,637,421) 30,644,921 – –

- 42 -
*SGVFS027825*
18. Operating Expenses
Operating expenses consist of:
2017 2016 2015Personnel (Note 19) P=160,270,199 P=200,210,464 P=162,173,610Taxes and licenses 42,439,179 43,990,167 31,548,305Depreciation (Note 20) 38,560,608 23,738,651 25,111,714Professional fees 34,691,331 42,874,410 41,090,490Insurance (Note 6) 18,329,482 16,865,456 9,106,085Outside services 16,940,127 18,387,608 13,350,710Light, power and water 16,342,968 12,374,444 13,143,583Membership dues 8,238,928 14,850,692 9,121,455Advertising and promotions 7,040,061 8,488,064 7,212,462Brokers’ commission 6,392,024 7,525,831 4,785,840Repairs and maintenance 6,319,031 6,792,703 4,819,660Rent expense 4,825,052 6,551,991 5,132,041Donations 2,555,000 2,975,000 594,000Postage, telephone and telegraph 2,108,232 2,737,546 2,328,192Stationery and office supplies 1,797,568 1,815,010 1,351,044Others 14,439,857 19,368,738 9,682,223
P=381,289,647 P=429,546,775 P=340,551,414
Others include transportation and miscellaneous expenses.
19. Personnel Expenses
Personnel expenses consist of:
2017 2016 2015Salaries and wages P=67,192,578 P=86,762,925 P=70,348,958Bonuses and other employee
benefits 53,309,428 73,505,128 58,359,689Commissions 37,457,346 38,534,067 31,950,064Retirement benefits cost (Note 24) 2,310,847 1,408,344 1,514,899
P=160,270,199 P=200,210,464 P=162,173,610
20. Depreciation
Depreciation consists of:
2017 2016 2015Investment properties (Note 11) P=33,347,801 P=19,156,719 P=20,516,597Property and equipment (Note 12) 5,212,807 4,581,932 4,595,117
P=38,560,608 P=23,738,651 P=25,111,714
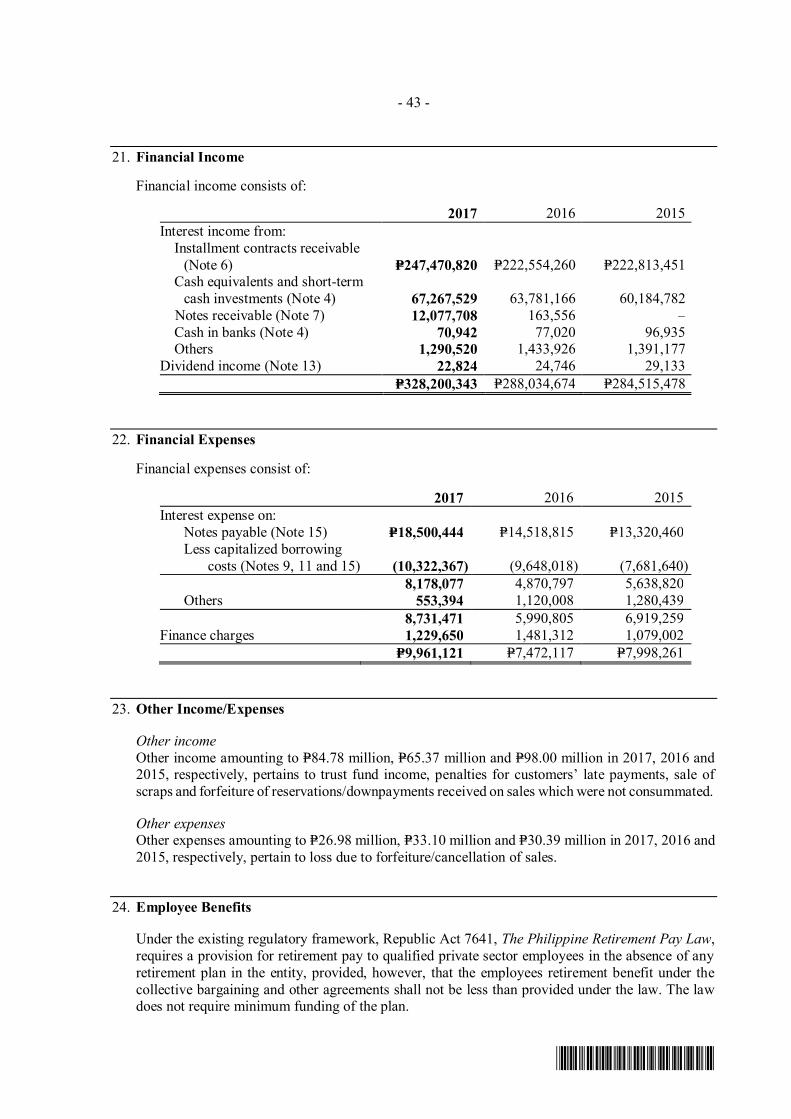
- 43 -
*SGVFS027825*
21. Financial Income
Financial income consists of:
2017 2016 2015Interest income from:
Installment contracts receivable(Note 6) P=247,470,820 P=222,554,260 P=222,813,451
Cash equivalents and short-termcash investments (Note 4) 67,267,529 63,781,166 60,184,782
Notes receivable (Note 7) 12,077,708 163,556 –Cash in banks (Note 4) 70,942 77,020 96,935Others 1,290,520 1,433,926 1,391,177
Dividend income (Note 13) 22,824 24,746 29,133P=328,200,343 P=288,034,674 P=284,515,478
22. Financial Expenses
Financial expenses consist of:
2017 2016 2015Interest expense on:
Notes payable (Note 15) P=18,500,444 P=14,518,815 P=13,320,460Less capitalized borrowing
costs (Notes 9, 11 and 15) (10,322,367) (9,648,018) (7,681,640)8,178,077 4,870,797 5,638,820
Others 553,394 1,120,008 1,280,4398,731,471 5,990,805 6,919,259
Finance charges 1,229,650 1,481,312 1,079,002P=9,961,121 P=7,472,117 P=7,998,261
23. Other Income/Expenses
Other income Other income amounting to P=84.78 million, P=65.37 million and P=98.00 million in 2017, 2016 and
2015, respectively, pertains to trust fund income, penalties for customers’ late payments, sale ofscraps and forfeiture of reservations/downpayments received on sales which were not consummated.
Other expensesOther expenses amounting to P=26.98 million, P=33.10 million and P=30.39 million in 2017, 2016 and2015, respectively, pertain to loss due to forfeiture/cancellation of sales.
24. Employee Benefits
Under the existing regulatory framework, Republic Act 7641, The Philippine Retirement Pay Law,requires a provision for retirement pay to qualified private sector employees in the absence of anyretirement plan in the entity, provided, however, that the employees retirement benefit under thecollective bargaining and other agreements shall not be less than provided under the law. The lawdoes not require minimum funding of the plan.

- 44 -
*SGVFS027825*
Retirement benefits costThe Group, jointly with affiliated companies, has a funded, noncontributory defined benefitretirement plan, covering all of its permanent employees. This provides for payment of benefits tocovered employees upon retirement subject to certain condition which is based on a certainpercentage of the employee’s final monthly salary and the number of years of service.
The fund is administered by a third-party trustee bank under the supervision of the RetirementCommittee of the plan who is responsible for the investment strategy of the plan.
The details of net retirement benefits cost, which is included in “Personnel expense” account(see Note 19), are as follows:
2017 2016 2015Current service cost P=2,618,861 P=2,037,975 P=2,194,482Net interest income on net
defined benefit obligation (308,014) (629,631) (679,583)Net retirement benefits cost P=2,310,847 P=1,408,344 P=1,514,899
Re-measurement loss (gain) recognized in the consolidated statements of comprehensive incomecomprises the following:
2017 2016 2015Actuarial loss (gain) on defined benefit
obligation:Due to experience adjustments P=1,057,054 P=2,002,482 P=3,197,545Due to change in financial assumption (3,247,966) 6,021,576 (3,144,659)Due to change in demographic
assumption – – 166,479Loss on plan assets excluding
amounts included in net interestcost 871,082 271,848 4,453,571
Re-measurement loss (gain) (P=1,319,830) P=8,295,906 P=4,672,936
The details of the net retirement plan assets are as follows:
2017 2016Present value of defined benefit obligation P=56,483,069 P=55,087,221Fair value of plan assets 65,133,581 61,033,580Net retirement plan assets P=8,650,512 P=5,946,359
The breakdown of net retirement plan assets as of December 31 per entity follows:
2017 2016Net retirement plan assets:
Parent Company P=13,725,742 P=12,001,854CPI 413,629 376,621
14,139,371 12,378,475Net retirement benefits liability - CLDI (5,488,859) (6,432,116)Net retirement plan assets P=8,650,512 P=5,946,359

- 45 -
*SGVFS027825*
Changes in net retirement plan assets are as follows:
2017 2016Beginning balances P=5,946,359 P=11,955,439Retirement benefits cost (2,310,847) (1,408,344)Re-measurement gain (loss) 1,319,830 (8,295,906)Contributions 3,695,170 3,695,170Ending balances P=8,650,512 P=5,946,359
Changes in present value of defined benefit obligation are as follows:
2017 2016Defined benefit obligation, January 1 P=55,087,221 P=43,465,586Current service cost 2,618,861 2,037,975Interest cost on benefit obligation 2,856,572 2,233,427Benefits paid (1,888,673) (673,825)Actuarial losses (gains) (2,190,912) 8,024,058Defined benefit obligation, December 31 P=56,483,069 P=55,087,221
Changes in fair value of plan assets are as follows:
2017 2016Fair value of plan assets, January 1 P=61,033,580 P=55,421,025Actual return including amount recognized in net
interest cost 2,293,504 2,591,210Contributions to the plan 3,695,170 3,695,170Benefits paid (1,888,673) (673,825)Fair value of plan assets, December 31 P=65,133,581 P=61,033,580
The major categories of plan assets of the Group with its affiliated companies as a percentage ofthe fair value of net plan assets are as follows:
2017 2016Cash and cash equivalents 50.66% 48.30%Investment properties 42.72% 43.97%Investments in equity securities 6.93% 7.89%Receivables 0.23% 0.36%Payables (0.54%) (0.52%)
100.00% 100.00%
Cash and cash equivalents consist of savings deposits and short-term time deposits with maturitiesof less than 3 months. Investments in equity securities consist of investment in shares of stock oflisted companies. Investments in equity securities have quoted market prices in an active market.Loans and receivables include loans to individuals and accrued interest income. Investmentproperties pertain to condominium units which are held for lease and are stated at fair value.
The Group expects to contribute P=6.23 million to the retirement fund in 2018.
The Group does not currently employ any asset-liability matching strategy.
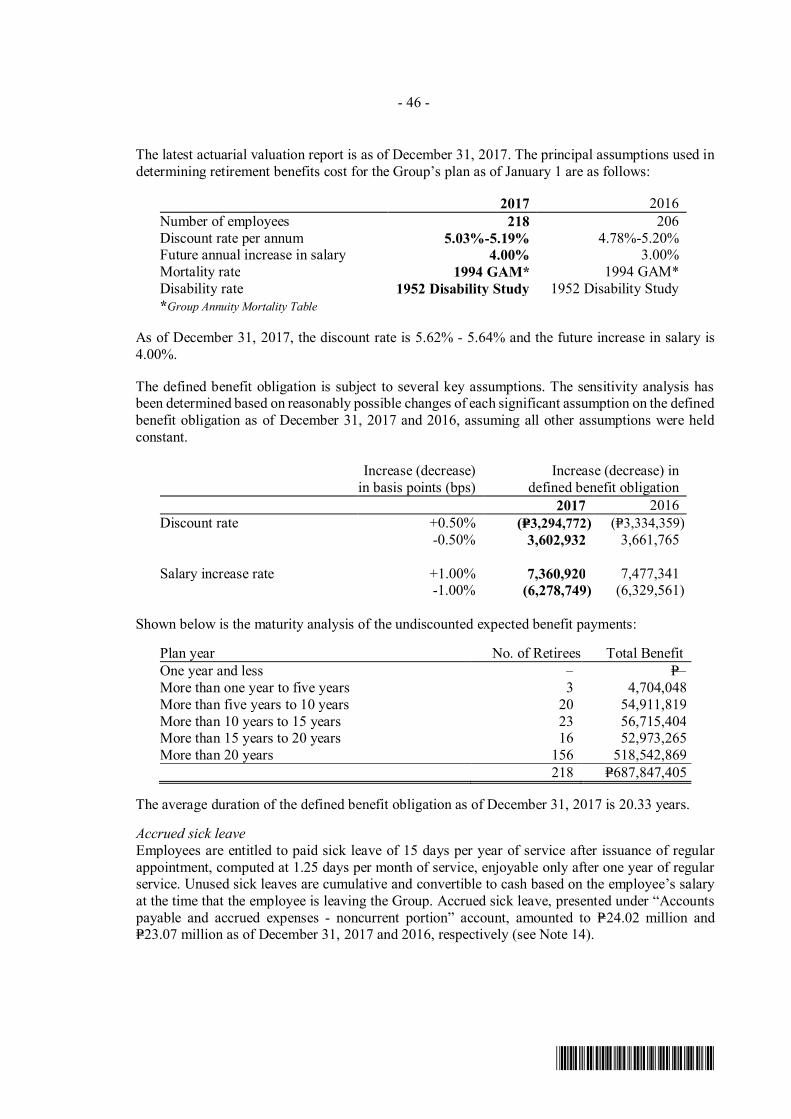
- 46 -
*SGVFS027825*
The latest actuarial valuation report is as of December 31, 2017. The principal assumptions used indetermining retirement benefits cost for the Group’s plan as of January 1 are as follows:
2017 2016Number of employees 218 206Discount rate per annum 5.03%-5.19% 4.78%-5.20%Future annual increase in salary 4.00% 3.00%Mortality rate 1994 GAM* 1994 GAM*Disability rate 1952 Disability Study 1952 Disability Study*Group Annuity Mortality Table
As of December 31, 2017, the discount rate is 5.62% - 5.64% and the future increase in salary is4.00%.
The defined benefit obligation is subject to several key assumptions. The sensitivity analysis hasbeen determined based on reasonably possible changes of each significant assumption on the definedbenefit obligation as of December 31, 2017 and 2016, assuming all other assumptions were heldconstant.
Increase (decrease)in basis points (bps)
Increase (decrease) indefined benefit obligation
2017 2016Discount rate +0.50% (P=3,294,772) (P=3,334,359)
-0.50% 3,602,932 3,661,765
Salary increase rate +1.00% 7,360,920 7,477,341-1.00% (6,278,749) (6,329,561)
Shown below is the maturity analysis of the undiscounted expected benefit payments:
Plan year No. of Retirees Total BenefitOne year and less – P=–More than one year to five years 3 4,704,048More than five years to 10 years 20 54,911,819More than 10 years to 15 years 23 56,715,404More than 15 years to 20 years 16 52,973,265More than 20 years 156 518,542,869
218 P=687,847,405
The average duration of the defined benefit obligation as of December 31, 2017 is 20.33 years.
Accrued sick leaveEmployees are entitled to paid sick leave of 15 days per year of service after issuance of regularappointment, computed at 1.25 days per month of service, enjoyable only after one year of regularservice. Unused sick leaves are cumulative and convertible to cash based on the employee’s salaryat the time that the employee is leaving the Group. Accrued sick leave, presented under “Accountspayable and accrued expenses - noncurrent portion” account, amounted to P=24.02 million andP=23.07 million as of December 31, 2017 and 2016, respectively (see Note 14).
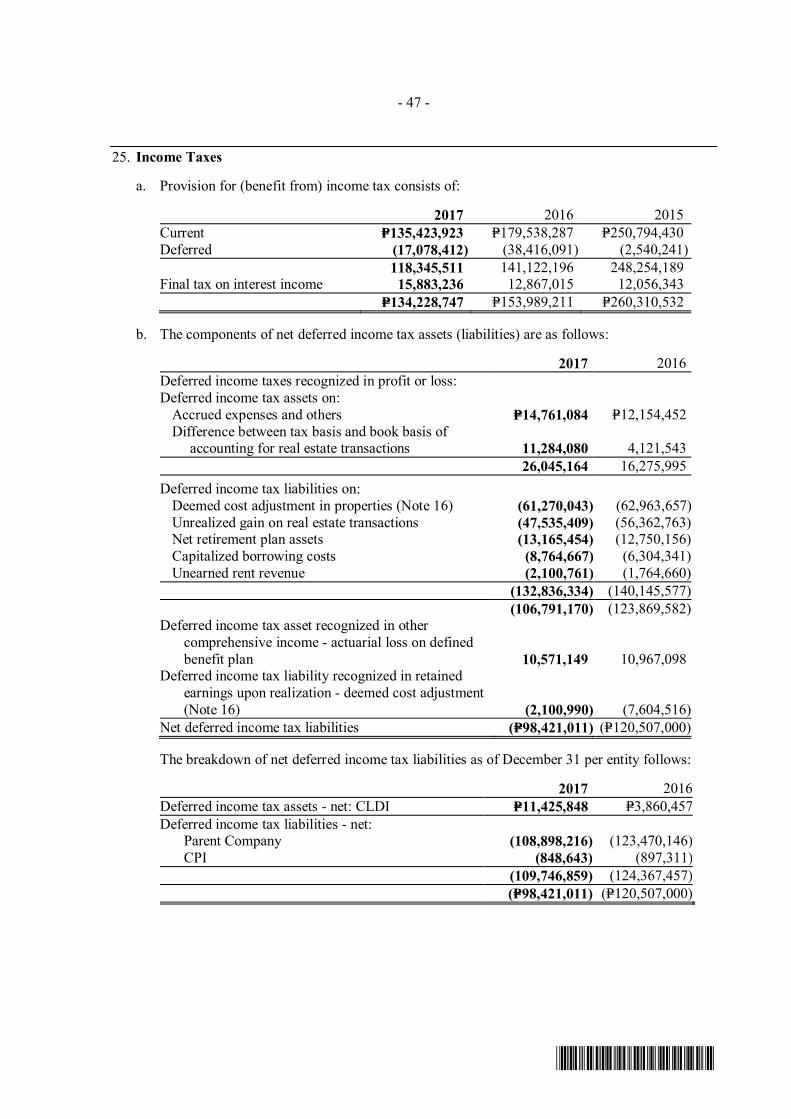
- 47 -
*SGVFS027825*
25. Income Taxes
a. Provision for (benefit from) income tax consists of:
2017 2016 2015Current P=135,423,923 P=179,538,287 P=250,794,430Deferred (17,078,412) (38,416,091) (2,540,241)
118,345,511 141,122,196 248,254,189Final tax on interest income 15,883,236 12,867,015 12,056,343
P=134,228,747 P=153,989,211 P=260,310,532
b. The components of net deferred income tax assets (liabilities) are as follows:
2017 2016Deferred income taxes recognized in profit or loss:Deferred income tax assets on:
Accrued expenses and others P=14,761,084 P=12,154,452Difference between tax basis and book basis of
accounting for real estate transactions 11,284,080 4,121,54326,045,164 16,275,995
Deferred income tax liabilities on:Deemed cost adjustment in properties (Note 16) (61,270,043) (62,963,657)Unrealized gain on real estate transactions (47,535,409) (56,362,763)Net retirement plan assets (13,165,454) (12,750,156)Capitalized borrowing costs (8,764,667) (6,304,341)Unearned rent revenue (2,100,761) (1,764,660)
(132,836,334) (140,145,577)(106,791,170) (123,869,582)
Deferred income tax asset recognized in othercomprehensive income - actuarial loss on definedbenefit plan 10,571,149 10,967,098
Deferred income tax liability recognized in retainedearnings upon realization - deemed cost adjustment(Note 16) (2,100,990) (7,604,516)
Net deferred income tax liabilities (P=98,421,011) (P=120,507,000)
The breakdown of net deferred income tax liabilities as of December 31 per entity follows:
2017 2016Deferred income tax assets - net: CLDI P=11,425,848 P=3,860,457Deferred income tax liabilities - net:
Parent Company (108,898,216) (123,470,146)CPI (848,643) (897,311)
(109,746,859) (124,367,457)(P=98,421,011) (P=120,507,000)

- 48 -
*SGVFS027825*
c. The reconciliation of income tax computed at statutory tax rate to provision for income taxfollows:
2017 2016 2015Income tax at statutory tax rate P=205,847,599 P=189,107,080 P=310,824,290Adjustments to income tax resulting
from:Tax-exempt interest income (37,770,939) (33,433,013) (29,725,171)Net loss (income) under income tax
holiday (Note 31) (29,683,340) 1,264,878 (19,957,462)Interest income subjected to final tax (23,824,854) (19,300,523) (18,084,516)Final tax on interest income 15,883,236 12,867,015 12,056,343Nondeductible interest expense 5,550,433 5,718,222 4,050,341Trust fund income already subjected to final tax (685,512) (464,515) (143,121)Nontaxable dividend income (6,847) (7,424) (8,740)Others - net (1,081,029) (1,762,509) 1,298,568
Provision for income tax P=134,228,747 P=153,989,211 P=260,310,532
d. Republic Act (RA) No.10963 or the Tax Reform for Acceleration and Inclusion Act (TRAIN)was signed into law on December 19, 2017 and took effect January 1, 2018, making the newtax law enacted as of the reporting date. Although the TRAIN changes existing tax law andincludes several provisions that will generally affect businesses on a prospective basis, themanagement assessed that the same will not have any significant impact on the consolidatedfinancial statement balances as of the reporting date.
26. Related Party Transactions
Enterprises and individuals that directly, or indirectly through one or more intermediaries, controlor are controlled by or under common control with the Group, including holding companies,subsidiaries and fellow subsidiaries, are related parties of the Group. Associates and individualsowning, directly or indirectly, an interest in the voting power of the Group that gives themsignificant influence over the enterprise, key management personnel, including directors andofficers of the Group and close members of the family of these individuals, and companiesassociated with these individuals also constitute related parties. In considering each possible relatedentity relationship, attention is directed to the substance of the relationship and not merely the legalform.
The Group discloses the nature of the related party relationship and information about thetransactions and outstanding balances necessary for an understanding of the potential effect of therelationship on the consolidated financial statements, including, as a minimum, the amount ofoutstanding balances and its terms and conditions including whether they are secured, and the natureof the consideration to be provided in settlement.

- 49 -
*SGVFS027825*
The Group, in the normal course of business, has transactions and account balances with relatedparties consisting mainly of the following:
Outstanding BalancesTerms andConditions
Amount of Transactions Receivable (Note 8) Payable (Note 14)Nature of Transaction 2017 2016 2015 2017 2016 2017 2016Ultimate parent (CI)
Sharing of expensescharged by the ParentCompany* (Note 26b) P=1,017,855 P=1,005,062 P=400,955 P=1,017,855 P=416,106 P=– P=–
30-day, unsecured,non-interestbearing; to besettled in cash
Retirement Plan(Note 26c)
Contribution to the plan 3,695,170 3,695,170 3,695,170 – – – – Settled in cash
Key managementpersonnelSalaries and other
compensation(Note 26e) 19,561,041 33,190,752 22,700,465 – – 20,660,349 13,083,295 Settled in cash
BOD
Shares of stock held byBOD (Note 26d) 9,733,427 23,749,220 (3,737,771) – – – –
Pertains to872,141,674 and881,875,101common shares atP=1 par value in2017 and 2016,respectively
Total P=1,017,855 P=416,106 P=20,660,349 P=13,083,295*Outstanding balances are included under “Accounts payable and accrued expenses” account in the consolidated balance sheets.
The transactions of the Parent Company with CLDI and CPI are eliminated in the consolidatedbalance sheets and consolidated statements of income.
a. The Group has an existing management contract with CI wherein the latter providesmanagement services to the Group. The agreement is for a period of five years renewableautomatically for another five years unless either party notifies the other party six months priorto expiration. Management fee is based on a certain percentage of net income as mutually agreedupon by both parties. Management fees for 2017, 2016 and 2015 were waived by CI. There areno conditions attached to the waiver of these management fees.
b. The Group has various shared expenses with other affiliates pertaining to general andadministrative expenses such as salaries, transportation, association dues, professional fees andrent.
c. The Group, jointly with affiliated companies under common control, has a trust fund for theretirement plan of their employees. The trust fund is being maintained by a third party trusteebank under the supervision of the Retirement Committee of the plan who is responsible for theinvestment strategy of the plan. The Group’s share on the fair value of plan assets amounted toP=65.13 million and P=61.03 million as of December 31, 2017 and 2016, respectively. TheGroup’s share on the carrying value of plan assets is equivalent to its share on the fair value.
The major categories of plan assets are cash and cash equivalents, investments in equitysecurities, loans and receivables and investment properties (see Note 24). Investments in equitysecurities of plan assets include investment in shares of the Parent Company. The third-partytrustee bank exercises the voting rights over the shares. The fair value of the investment in theParent Company amounted to P=5.96 million and P=6.60 million as of December 31, 2017 and2016, respectively, with original cost of P=3.31 million. Unrealized gain on changes of fair valueof these investments amounted to P=2.65 million and P=3.45 million as of December 31, 2017 and2016, respectively. Loans and receivables of plan assets include installment contracts receivablepurchased in prior years on a non-recourse basis from the Parent Company amounting to

- 50 -
*SGVFS027825*
P=0.11 million and P=0.26 million as of December 31, 2017 and 2016, respectively. The retirementplan assets as of December 31, 2017 and 2016 include investment properties held for leaseamounting to P=36.79 million which was purchased from CDC in 2013. The sale was conductedin the normal course of business and was measured at current selling price and settled in cash.
Contributions to the fund amounted to P=3.70 million in 2017 and 2016 (see Note 24).
d. The Parent Company’s shares held by members of the BOD aggregated to P=872.14 million andP=881.88 million as of December 31, 2017 and 2016, respectively. On the other hand, sharesheld by the ultimate parent and affiliate totaled P=2.01 billion and P=1.91 billion as ofDecember 31, 2017 and 2016.
e. Compensation of key management personnel are as follows:
2017 2016 2015Short-term benefits:
Salaries P=6,058,838 P=8,509,445 P=6,890,719Bonuses 1,547,799 2,135,549 1,806,125Other benefits 11,032,704 21,611,801 13,226,879
Long-term benefits 921,700 933,957 776,742P=19,561,041 P=33,190,752 P=22,700,465
Other benefits consist of incentives and performance bonuses.
The Group has no standard arrangements with regard to the remuneration of its directors. In2017, 2016 and 2015, the BOD received a total of P=20.43 million, P=29.44 million and P=20.28million, respectively. Moreover, the Group has no standard arrangement with regard to theremuneration of its existing officers aside from the compensation received or any otherarrangements in the employment contracts and compensatory plan. The Group does not haveany arrangements for stock warrants or options offered to its employees.
f. The following are the balances and transactions among related parties which are eliminatedduring consolidation:
Amounts owed by Amounts owed to Nature 2017 2016Parent Company CLDI Sharing of expenses P=– P=–CPI Parent Company Sharing of expenses 199,567 30,751CLDI Parent Company Sharing of expenses 120,296 2,486,108CPI CLDI Sharing of expenses 14,304 –CPI CLDI Sale of real estate properties 150,000 150,000
Revenue andincome by
Capitalizable costand expense by Nature 2017 2016 2015
CLDI Parent Company Interest charges on advances P=– P=– P=103,920Parent Company CLDI Interest charges on advances – – 16,949
Dividend declared to Dividend declared by 2017 2016 2015Parent Company CLDI P=7,996,028 P=10,544,212 P=10,118,140CPI Parent Company 78,740 137,486 56,244

- 51 -
*SGVFS027825*
27. Financial Instruments
Financial Risk Management Objectives and Policies The Group’s principal financial instruments comprise cash and cash equivalents, short-term cash
investments, notes receivable and notes payable. The main purpose of these financial instrumentsis to finance the Group’s operations. The Group’s other financial instruments consist of financialassets at fair value through profit or loss and available-for-sale financial assets, which are held forinvesting purposes and investments in trust funds to cover pre-need reserves obligation. The Grouphas various other financial instruments such as installment contracts receivable, other receivablesand accounts payable and accrued expenses which arise directly from its operations.
It is, and has been throughout the year under review, the Group’s policy that no trading in financialinstruments shall be undertaken.
The main risks arising from the Group’s financial instruments are market risk (i.e., cash flow interestrate risk and equity price risk), credit risk and liquidity risk. The BOD reviews and approves policiesfor managing these risks and they are summarized as follows:
Market risk Cash flow interest rate risk Cash flow interest rate risk is the risk that the fair value or future cash flows of a financial instrument
will fluctuate because of changes in market interest rates. The Group’s exposure to the risk forchanges in market interest rates relates primarily to the Group’s short-term notes payable, all withrepriced interest rates.
The Group’s policy in addressing volatility in interest rates includes maximizing the use of operatingcash flows to be able to fulfill principal and interest obligations even in periods of rising interestrates.
The following table demonstrates the sensitivity of the Group’s income before income tax to areasonably possible change in interest rates based on forecasted and average movements of interestrates (with all other variables held constant):
Change in bpsEffect on Income
before Income TaxDecember 31, 2017 -/+1 bps +/-P=922,941December 31, 2016 -/+2 bps +/-P=4,167,443
There is no impact on the Group’s equity other than those already affecting income beforeincome tax.
Equity price risk Equity price risk is the risk that the fair values of investments in equity securities will decrease as a
result of changes in the market values of individual shares of stock. The Group is exposed to equityprice risk because of investments held by the Group classified as available-for-sale financial assetsincluded under “Other noncurrent asset account” in the consolidated balance sheets. The Groupemploys the service of a third-party stock broker to manage its investments in shares of stock.

- 52 -
*SGVFS027825*
The following table demonstrates the sensitivity analysis of the Group’s equity to a reasonablypossible change in equity price based on forecasted and average movements of equity prices (withall other variables held constant):
Change inequity price Effect on equity
2017 +/-P=0.01 +/-P=22,6912016 +/-P=0.09 +/-P=127,729
Credit risk Credit risk arises when the Group will incur a loss because its customers, clients or counterparties
fail to discharge their obligations. The Group trades only with recognized, creditworthy third parties.It is the Group’s policy that all customers who wish to trade on credit terms are subject to creditverification procedures. In addition, receivable balances are monitored on an on-going basis withthe objective that the Group’s exposure to bad debts is not significant. The risk is further mitigatedbecause the Group holds the title to the real estate properties with outstanding installment contractsreceivable balance and the Group can repossess such real estate properties upon default of thecustomer in paying the outstanding balance. The Group’s policy is to enter into transactions with adiversity of creditworthy parties to mitigate any significant concentration of credit risk. There areno significant concentrations of credit risk within the Group.
The tables below show the Group’s exposure to credit risk for the components of the consolidatedbalance sheets. The exposure as of December 31, 2017 and 2016 is shown at gross, before takingthe effect of mitigation through the use of collateral agreements and other credit enhancements, andat net, after taking the effect of mitigation through the use of collateral agreements and other creditenhancements.
December 31, 2017:
Gross Financial effect ofmaximumexposure
Fair value ofcollaterals
Netexposure
collateral/creditenhancements
Financial assets at fair value through profit or loss:Investments in trust funds P=34,606,350 P=– P=34,606,350 P=–
Loans and receivables:Cash and cash equivalents, excluding
cash on hand 860,610,775 – 860,610,775 –Short-term cash investments 1,523,000,000 – 1,523,000,000 –Installment contracts receivable 1,835,418,984 4,157,780,897 – 1,835,418,984Notes receivable 728,000,000 – 728,000,000 –Refundable deposits 37,517,102 – 37,517,102 –Other receivables*:
Advances to customers 21,892,387 – 21,892,387 –Rent receivable 11,044,207 – 11,044,207 –Accrued interest 11,838,196 – 11,838,196 –Due from BIR 2,673,535 – 2,673,535 –Retention 2,771,681 – 2,771,681 –
Due from related parties 1,017,855 – 1,017,855 –Others 2,822,558 – 2,822,558 –
Total credit risk exposure P=5,073,213,630 P=4,157,780,897 P=3,237,794,646 P=1,835,418,984*Excludes advances to contractors amounting to P=7,793,890.

- 53 -
*SGVFS027825*
December 31, 2016:Gross Financial effect of
maximumexposure
Fair value ofcollaterals
Netexposure
collateral/creditenhancements
Financial assets at fair value through profit or loss:Investments in trust funds P=35,297,089 P=– P=35,297,089 P=–
Loans and receivables:Cash and cash equivalents, excluding
cash on hand 1,788,740,775 – 1,788,740,775 –Short-term cash investments 1,218,272,353 – 1,218,272,353 –Installment contracts receivable 2,007,757,101 3,716,809,348 – 2,007,757,101Notes receivable 20,000,000 – 20,000,000 –Refundable deposits 19,663,376 – 19,663,376 –Other receivables*:
Advances to customers 29,807,407 – 29,807,407 –Rent receivable 11,177,329 – 11,177,329 –Accrued interest 7,762,977 – 7,762,977 –Due from BIR 1,231,682 – 1,231,682 –Retention 724,766 – 724,766 –
Due from related parties 416,106 – 416,106 –Others 2,872,916 – 2,872,916 –
Total credit risk exposure P=5,143,723,877 P=3,716,809,348 P=3,135,966,776 P=2,007,757,101*Excludes advances to contractors amounting to P=8,674,949.
The following tables summarize the aging analysis of receivables:
December 31, 2017:
Neither Past Due Nor Impaired Past due But Not Impaired
Current > One year < 30 days 30-60 days 61-90 daysOver
90 days TotalInstallment contracts
receivable P=319,390,173 P=1,509,504,341 P=2,177,055 P=896,281 P=626,734 P=2,824,400 P=1,835,418,984Notes receivable 128,000,000 600,000,000 – – – – 728,000,000Refundable deposits – 37,517,102 – – – – 37,517,102Other receivables*:
Advances to customers 12,079,757 5,693,291 – 334,441 153,826 3,631,072 21,892,387Rent receivable 11,044,207 – – – – – 11,044,207
Accrued interest 11,838,196 – – – – – 11,838,196Due from BIR 2,673,535 – – – – – 2,673,535
Retention 1,711,681 1,060,000 – – – – 2,771,681 Due from related parties 1,017,855 – – – – – 1,017,855 Others 2,103,250 719,308 – – – – 2,822,558
P=489,858,654 P=2,154,494,042 P=2,177,055 P=1,230,722 P=780,560 P=6,455,472 P=2,654,996,505*Excludes advances to contractors amounting to P=7,793,890.
December 31, 2016:
Neither Past Due Nor Impaired Past due But Not Impaired
Current > One year < 30 days 30-60 days 61-90 daysOver
90 days TotalInstallment contracts
receivable P=310,407,130 P=1,687,290,041 P=3,201,714 P=2,077,326 P=853,133 P=3,927,757 P=2,007,757,101Notes receivable – 20,000,000 – – – – 20,000,000Refundable deposits – 19,663,376 – – – – 19,663,376Other receivables*:
Advances to customers 20,924,326 3,353,304 – 407,496 239,222 4,883,059 29,807,407Rent receivable 11,177,329 – – – – – 11,177,329
Accrued interest 7,762,977 – – – – – 7,762,977Due from BIR 1,231,682 – – – – – 1,231,682
Retention 112,366 612,400 – – – – 724,766 Due from related parties 416,106 – – – – – 416,106 Others 2,651,160 221,756 – – – – 2,872,916
P=354,683,076 P=1,731,140,877 P=3,201,714 P=2,484,822 P=1,092,355 P=8,810,816 P=2,101,413,660*Excludes advances to contractors amounting to P=8,674,949.

- 54 -
*SGVFS027825*
The tables below show the credit quality by class of asset for loan-related balance sheet lines basedon the Group’s credit rating system:
December 31, 2017:Neither past due nor impaired
Medium Past Due but High Grade* Grade** not Impaired Total
Financial asset at fair value through profitor loss - investments in trust funds P=34,606,350 P=– P=– P=34,606,350
Loans and receivables: Cash and cash equivalents, excluding cash on hand 860,610,775 – – 860,610,775 Short-term cash investments 1,523,000,000 – – 1,523,000,000 Installment contracts receivable 1,828,894,514 – 6,524,470 1,835,418,984
Notes receivable 728,000,000 – – 728,000,000Refundable deposits 37,517,102 – – 37,517,102
Other receivables***:Advances to customers 17,773,048 – 4,119,339 21,892,387Rent receivable 11,044,207 – – 11,044,207
Accrued interest 11,838,196 – – 11,838,196Due from BIR 2,673,535 – – 2,673,535
Retention 2,771,681 – – 2,771,681 Due from related parties 1,017,855 – – 1,017,855 Others 1,890,980 931,578 – 2,822,558Total P=5,061,638,243 P=931,578 P=10,643,809 P=5,073,213,630* High Grade - financial assets with reputable counterparties and which management believes to be reasonably assured to be recoverable.** Medium Grade - financial assets for which there is low risk of default of counterparties.***Excluding advances to contractors amounting to P=7,793,890.
December 31, 2016:Neither past due nor impaired
Medium Past Due but High Grade* Grade** not Impaired Total
Financial asset at fair value through profitor loss - investments in trust funds P=35,297,089 P=– P=– P=35,297,089
Loans and receivables: Cash and cash equivalents, excluding cash on hand 1,788,740,775 – – 1,788,740,775 Short-term cash investments 1,218,272,353 – – 1,218,272,353 Installment contracts receivable 1,997,697,171 – 10,059,930 2,007,757,101
Notes receivable 20,000,000 – – 20,000,000Refundable deposits 19,663,376 – – 19,663,376
Other receivables***:Advances to customers 24,277,630 – 5,529,777 29,807,407Rent receivable 11,177,329 – – 11,177,329
Accrued interest 7,762,977 – – 7,762,977Due from BIR 1,231,682 – – 1,231,682
Retention 724,766 – – 724,766 Due from related parties 416,106 – – 416,106 Others 2,574,161 298,755 – 2,872,916Total P=5,127,835,415 P=298,755 P=15,589,707 P=5,143,723,877* High Grade - financial assets with reputable counterparties and which management believes to be reasonably assured to be recoverable.** Medium Grade - financial assets for which there is low risk of default of counterparties.***Excluding advances to contractors amounting to P=8,674,949.
The main considerations for impairment assessment include whether any payments are overdue orif there are any known difficulties in the cash flows of the counterparties. The Group assessesimpairment into two areas: individually assessed allowances and collectively assessed allowances.

- 55 -
*SGVFS027825*
The Group determines allowance for each significant receivable on an individual basis. Among thefactors that the Group considers in assessing impairment is the inability to collect from thecounterparty based on the contractual terms of the receivables. The Group also considers the fairvalue of the real estate collateralized in computing the impairment of the receivables. Receivablesincluded in the specific assessment are those receivables under the installment contracts receivableaccounts.
For collective assessment, allowances are assessed for receivables that are not individuallysignificant and for individually significant receivables where there is no objective evidence ofindividual impairment. Impairment losses are estimated by taking into consideration the age of thereceivables, past collection experience and other factors that may affect collectability.
Liquidity riskLiquidity risk is defined as the risk that the Group would not be able to settle or meet its obligationson time or at a reasonable price.
The Group’s objective is to maintain a balance between continuity of funding and flexibility throughthe use of commercial papers.
The tables below summarize the maturity analysis of the Group’s financial assets held for managing liquidity and financial liabilities based on contractual undiscounted payments:
December 31, 2017:30 days 31-90 days 91-180 days 181-365 days Above 1 year Total
Financial LiabilitiesAccounts payable and accrued
expenses** P=150,410,872 P=14,803,608 P=26,322,905 P=49,937,912 P=62,858,290 P=304,333,587Notes payable*** 702,331,709 641,787,618 127,415,951 – – 1,471,535,278
852,742,581 656,591,226 153,738,856 49,937,912 62,858,290 1,775,868,865Financial AssetsCash and cash equivalents 438,828,317 422,000,000 – – – 860,828,317Short-term cash investments 352,500,000 544,000,000 626,500,000 – – 1,523,000,000Installment contracts receivable 38,392,616 81,555,362 72,877,326 133,089,339 1,509,504,341 1,835,418,984Notes receivable – 100,000,000 28,000,000 – 600,000,000 728,000,000Refundable deposits – – – – 37,517,102 37,517,102Other receivables* 28,936,218 3,791,157 3,620,559 10,239,886 7,472,599 54,060,419Financial assets at FVPL – – – – 34,606,350 34,606,350
858,657,151 1,151,346,519 730,997,885 143,329,225 2,189,100,392 5,073,431,172Liquidity position P=5,914,570 P=494,755,293 P=577,259,029 P=93,391,313 P=2,126,242,102 P=3,297,562,307*Excludes advances to contractors amounting to P=7,793,890.** Excludes statutory liabilities amounting to P=5,793,500, deferred rent income amounting to P=5,177,513, customers’ deposits amounting to P=37,816,462 and accrued interest amounting to P=2,398,253.*** Includes interest expense amounting to P=18,085,278.
December 31, 2016:30 days 31-90 days 91-180 days 181-365 days Above 1 year Total
Financial LiabilitiesAccounts payable and accrued
expenses** P=114,909,664 P=10,924,403 P=156,859,473 P=38,421,387 P=165,632,137 P=486,747,064Notes payable*** 746,708,896 726,511,157 157,481,620 63,073,641 – 1,693,775,314
861,618,560 737,435,560 314,341,093 101,495,028 165,632,137 2,180,522,378Financial AssetsCash and cash equivalents 882,970,275 906,000,000 – – – 1,788,970,275Short-term cash investments 413,822,353 691,500,000 55,950,000 57,000,000 – 1,218,272,353Installment contracts receivable 44,190,484 54,307,237 78,141,935 143,827,404 1,687,290,041 2,007,757,101Notes receivable – – – – 20,000,000 20,000,000Refundable deposits – – – – 19,663,376 19,663,376Other receivables* 36,011,587 4,990,838 2,856,151 5,947,147 4,187,460 53,993,183Financial assets at FVPL – – – – 35,297,089 35,297,089
1,376,994,699 1,656,798,075 136,948,086 206,774,551 1,766,437,966 5,143,953,377Liquidity position (gap) P=515,376,139 P=919,362,515 (P=177,393,007) P=105,279,523 P=1,600,805,829 P=2,963,430,999*Excludes advances to contractors amounting to P=8,674,949.** Excludes statutory liabilities amounting to P=7,777,131, deferred rent income amounting to P=6,976,210, customers’ deposits amounting to P=170,626,671 and accrued interest amounting to P=2,526,374.*** Includes interest expense amounting to P=20,775,314.

- 56 -
*SGVFS027825*
Fair ValuesThe following tables provide fair value hierarchy of the Group’s financial assets, financial liabilitiesand investment properties, other than those with carrying amounts which are reasonableapproximations of fair values:
Date of valuation: December 31, 2017Fair value
Level 1 Level 2 Level 3Assets measured at fair value:
Investment in trust fundFinancial assets at FVPL
Debt securities P=4,445,116 P=– P=–Available-for-sale financial assets
Debt securities 18,646,689 – –Equity securities - listed 881,491 – –
Investment properties – – 4,186,000Available-for-sale financial assets 1,629,078 – –
Assets for which fair values are disclosed:Investment properties – – 4,170,534,400
Date of valuation: December 31, 2016Fair value
Level 1 Level 2 Level 3Assets measured at fair value:
Investment in trust fundFinancial assets at FVPL
Debt securities P=4,724,931 P=– P=–Available-for-sale financial assets
Debt securities 18,483,180 – –Equity securities - listed 1,606,806 – –
Investment properties – – 6,782,000Available-for-sale financial assets 1,468,347 – –
Assets for which fair values are disclosed:Investment properties – – 2,585,058,000
The following method and assumptions were used to estimate the fair value of each class of financialinstruments and investment properties, for which it is practicable to estimate such value.
Cash and cash equivalents, short-term cash investments, installment contracts receivable, notesreceivable, other receivables, accounts payable and accrued expenses and notes payableDue to the short-term nature of the transactions, the fair values of cash and cash equivalents,short-term cash investments, notes receivable, other receivables, accounts payable and accruedexpenses and notes payable approximate their carrying amounts. The fair values of notes receivableand installment contracts receivable approximate their carrying amounts as they carry interest ratesthat approximate the interest rates for comparable instruments in the market.
Financial assets at FVPL and available-for-sale financial assetsFinancial assets at FVPL and available-for-sale financial assets are stated at fair value based onquoted market prices.
Investment propertiesThe fair value of certain investment properties is determined using sales comparison. Salescomparison approach considers the sales of similar or substitute properties and other related market
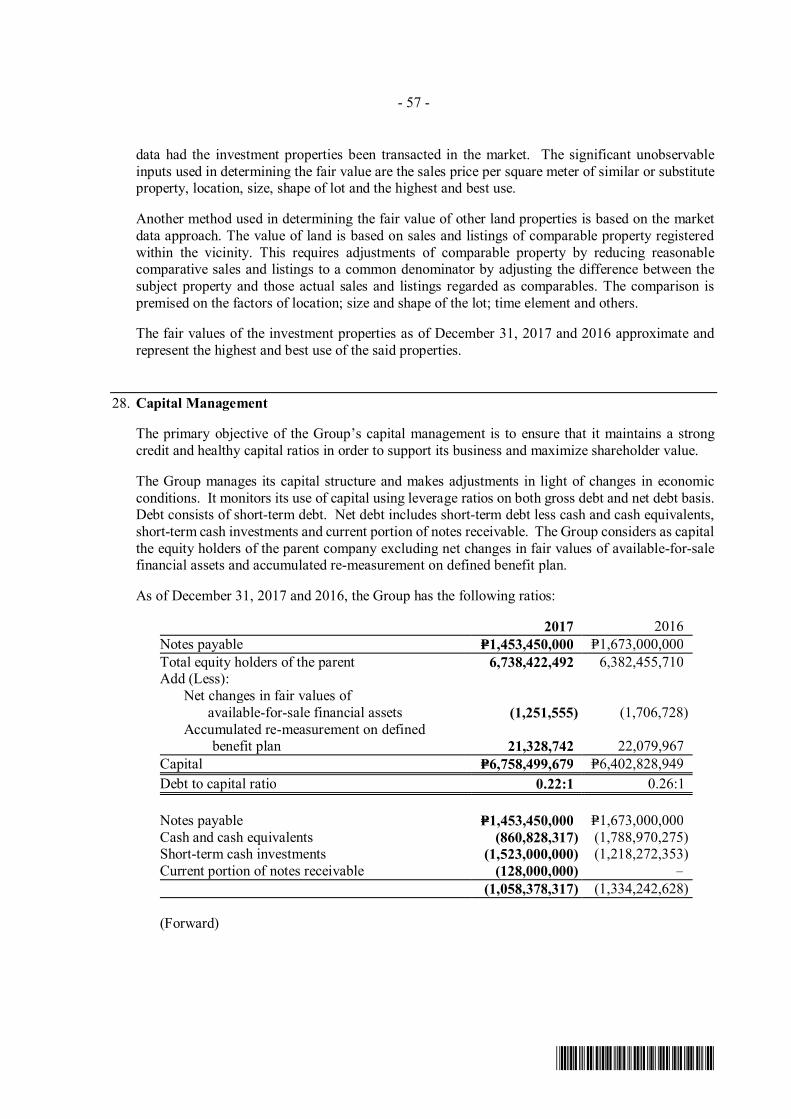
- 57 -
*SGVFS027825*
data had the investment properties been transacted in the market. The significant unobservableinputs used in determining the fair value are the sales price per square meter of similar or substituteproperty, location, size, shape of lot and the highest and best use.
Another method used in determining the fair value of other land properties is based on the marketdata approach. The value of land is based on sales and listings of comparable property registeredwithin the vicinity. This requires adjustments of comparable property by reducing reasonablecomparative sales and listings to a common denominator by adjusting the difference between thesubject property and those actual sales and listings regarded as comparables. The comparison ispremised on the factors of location; size and shape of the lot; time element and others.
The fair values of the investment properties as of December 31, 2017 and 2016 approximate andrepresent the highest and best use of the said properties.
28. Capital Management
The primary objective of the Group’s capital management is to ensure that it maintains a strongcredit and healthy capital ratios in order to support its business and maximize shareholder value.
The Group manages its capital structure and makes adjustments in light of changes in economicconditions. It monitors its use of capital using leverage ratios on both gross debt and net debt basis.Debt consists of short-term debt. Net debt includes short-term debt less cash and cash equivalents,short-term cash investments and current portion of notes receivable. The Group considers as capitalthe equity holders of the parent company excluding net changes in fair values of available-for-salefinancial assets and accumulated re-measurement on defined benefit plan.
As of December 31, 2017 and 2016, the Group has the following ratios:
2017 2016Notes payable P=1,453,450,000 P=1,673,000,000Total equity holders of the parent 6,738,422,492 6,382,455,710Add (Less):
Net changes in fair values ofavailable-for-sale financial assets (1,251,555) (1,706,728)
Accumulated re-measurement on defined benefit plan 21,328,742 22,079,967
Capital P=6,758,499,679 P=6,402,828,949Debt to capital ratio 0.22:1 0.26:1
Notes payable P=1,453,450,000 P=1,673,000,000Cash and cash equivalents (860,828,317) (1,788,970,275)Short-term cash investments (1,523,000,000) (1,218,272,353)Current portion of notes receivable (128,000,000) –
(1,058,378,317) (1,334,242,628)
(Forward)

- 58 -
*SGVFS027825*
2017 2016Total equity holders of the parent P=6,738,422,492 P=6,382,455,710Add (Less):
Net changes in fair values ofavailable-for-sale financial assets (1,251,555) (1,706,728)Accumulated re-measurement on defined
benefit plan 21,328,742 22,079,967Capital P=6,758,499,679 P=6,402,828,949Net debt to capital ratio (0.16):1 (0.21):1
As of December 31, 2017 and 2016, the Group has no externally imposed capital requirements.
In accordance with the Rule on Minimum Public Ownership issued by the Philippine StockExchange requiring listed companies to maintain a 10% public float at all times, the total number ofshares owned by the public as of December 31, 2017 and 2016 are 1,038,452,993 and 938,343,353shares which are approximately 26.37% and 25.02%, respectively, of the total number of issued andoutstanding shares of the Parent Company.
29. Basic/Diluted Earnings Per Share
Basic/diluted earnings per share amounts were computed as follows:
2017 2016 2015Net income attributable to equity
holders of the Parent P=485,108,127 P=443,176,793 P=739,915,065Weighted average number of
outstanding shares 3,938,063,701 3,938,063,701* 3,938,063,701*Basic/diluted earnings
per share (a/b) P=0.12 P=0.11 P=0.19*After retroactive effect of 5% stock dividends in 2017.
The Group has no potential dilutive common shares as of December 31, 2017, 2016 and 2015.Thus, the basic and diluted earnings per share are the same as of those dates.
30. Business Segments
The Group derives its revenues primarily from the sale and lease of real estate properties and pensionplan operations. These are the operating segments classified as business groups which are consistentwith the segments reported to the BOD, its Chief Operating Decision Maker (CODM).
In 2015, the Parent Company sold parcels of land in Naic, Cavite to a domestic corporation whichrepresents 33.01% of the Group’s sales from real estate properties. Aside from this transaction, theGroup does not have any major customers and all sales and leases of real estate properties and salesof pension plans are made to external customers.

- 59 -
*SGVFS027825*
Segment Revenue and Expenses
2017Sales of Real
Estate PropertiesLease of Real
Estate PropertiesPension Plan
Operations TotalRevenue: Sales of real estate P=1,310,712,989 P=– P=– P=1,310,712,989 Financial income 327,919,030 – 281,313 328,200,343 Rent income – 119,681,308 – 119,681,308 Other income 83,411,025 – 1,372,314 84,783,339Cost of real estate sales 738,985,531 – – 738,985,531Operating expenses: Personnel 159,380,478 – 889,721 160,270,199 Taxes and licenses 34,605,333 7,048,462 785,384 42,439,179 Depreciation 6,828,833 29,245,752 2,486,023 38,560,608 Professional fees 34,280,920 – 410,411 34,691,331 Insurance 18,328,468 – 1,014 18,329,482 Others 58,161,018 23,384,583 5,453,247 86,998,848Financial expenses 9,961,121 – – 9,961,121Other expense 26,983,018 – – 26,983,018Provision for (benefit from) income tax 120,819,077 18,000,753 (4,591,083) 134,228,747Net income (loss) P=513,709,247 P=42,001,758 (P=3,781,090) P=551,929,915
2016Sales of Real Estate
PropertiesLease of Real
Estate PropertiesPension Plan
Operations TotalRevenue: Sales of real estate P=1,480,504,914 P=– P=– P=1,480,504,914 Financial income 287,632,337 – 402,337 288,034,674 Rent income – 92,760,364 – 92,760,364 Other income 63,473,964 – 1,898,411 65,372,375Cost of real estate sales 826,197,687 – – 826,197,687Operating expenses: Personnel 199,217,420 – 993,044 200,210,464 Taxes and licenses 34,994,725 8,255,178 740,264 43,990,167 Professional fees 42,594,107 – 280,303 42,874,410 Depreciation 6,197,936 15,024,804 2,515,911 23,738,651 Insurance 16,864,577 – 879 16,865,456 Others 88,557,997 10,565,773 2,743,857 101,867,627Financial expenses 7,472,117 – – 7,472,117Other expense 33,098,815 – – 33,098,815Provision for (benefit from) income tax 140,134,292 17,674,383 (3,819,464) 153,989,211Net income (loss) P=436,281,542 P=41,240,226 (P=1,154,046) P=476,367,722
2015Sales of Real Estate
PropertiesLease of Real
Estate PropertiesPension Plan
Operations TotalRevenue: Sales of real estate P=2,371,262,489 P=– P=– P=2,371,262,489 Financial income 284,118,068 – 397,410 284,515,478 Rent income 3,481,183 79,776,585 – 83,257,768 Other income 97,208,258 – 796,061 98,004,319Cost of real estate sales 1,422,019,784 – – 1,422,019,784Operating expenses: Personnel 161,154,739 – 1,018,871 162,173,610 Taxes and licenses 30,772,522 257,775 518,008 31,548,305 Professional fees 41,020,240 – 70,250 41,090,490 Depreciation 6,211,141 15,024,804 3,875,769 25,111,714 Insurance 9,105,206 – 879 9,106,085 Others 63,269,425 8,145,980 105,805 71,521,210
(Forward)
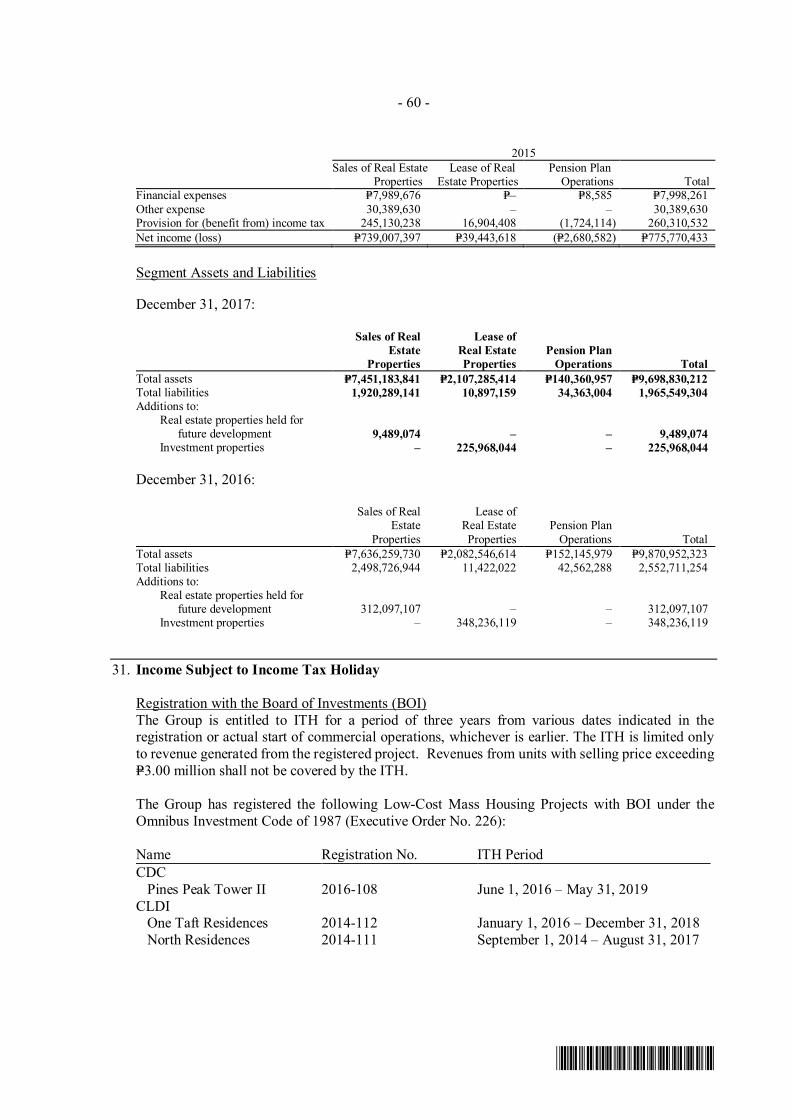
- 60 -
*SGVFS027825*
2015Sales of Real Estate
PropertiesLease of Real
Estate PropertiesPension Plan
Operations TotalFinancial expenses P=7,989,676 P=– P=8,585 P=7,998,261Other expense 30,389,630 – – 30,389,630Provision for (benefit from) income tax 245,130,238 16,904,408 (1,724,114) 260,310,532Net income (loss) P=739,007,397 P=39,443,618 (P=2,680,582) P=775,770,433
Segment Assets and Liabilities
December 31, 2017:
Sales of RealEstate
Properties
Lease ofReal EstateProperties
Pension PlanOperations Total
Total assets P=7,451,183,841 P=2,107,285,414 P=140,360,957 P=9,698,830,212Total liabilities 1,920,289,141 10,897,159 34,363,004 1,965,549,304Additions to:
Real estate properties held forfuture development 9,489,074 – – 9,489,074
Investment properties – 225,968,044 – 225,968,044
December 31, 2016:
Sales of RealEstate
Properties
Lease ofReal EstateProperties
Pension PlanOperations Total
Total assets P=7,636,259,730 P=2,082,546,614 P=152,145,979 P=9,870,952,323Total liabilities 2,498,726,944 11,422,022 42,562,288 2,552,711,254Additions to:
Real estate properties held forfuture development 312,097,107 – – 312,097,107
Investment properties – 348,236,119 – 348,236,119
31. Income Subject to Income Tax Holiday
Registration with the Board of Investments (BOI)The Group is entitled to ITH for a period of three years from various dates indicated in theregistration or actual start of commercial operations, whichever is earlier. The ITH is limited onlyto revenue generated from the registered project. Revenues from units with selling price exceedingP=3.00 million shall not be covered by the ITH.
The Group has registered the following Low-Cost Mass Housing Projects with BOI under theOmnibus Investment Code of 1987 (Executive Order No. 226):
Name Registration No. ITH PeriodCDC
Pines Peak Tower II 2016-108 June 1, 2016 – May 31, 2019CLDI
One Taft Residences 2014-112 January 1, 2016 – December 31, 2018North Residences 2014-111 September 1, 2014 – August 31, 2017

- 61 -
*SGVFS027825*
32. Contingencies
The Group is contingently liable for certain lawsuits or claims filed by third parties which are eitherpending decisions by the courts or are under negotiation, the outcomes of which are not presentlydeterminable. In the opinion of management and its legal counsel, the eventual liability under theselawsuits or claims, if any, will not have a material effect on the consolidated financial statements.Hence, no provision was recognized as of December 31, 2017 and 2016.

*SGVFS027825*
INDEPENDENT AUDITOR’S REPORTON SUPPLEMENTARY SCHEDULES
The Board of Directors and StockholdersCityland Development Corporation2/F, Cityland Condominium 10, Tower I156 H.V. de la Costa StreetMakati City
We have audited in accordance with Philippine Standards on Auditing, the consolidated financialstatements of Cityland Development Corporation and its subsidiaries as at December 31, 2017 and 2016and for each of the three years in the period ended December 31, 2017, included in this Form 17-A, andhave issued our report thereon dated March 27, 2018. Our audits were made for the purpose of formingan opinion on the basic financial statements taken as a whole. The schedules listed in the Index to theConsolidated Financial Statements and Supplementary Schedules are the responsibility of the Company’smanagement. These schedules are presented for purposes of complying with Securities Regulation CodeRule 68, As Amended (2011) and are not part of the basic financial statements. These schedules havebeen subjected to the auditing procedures applied in the audit of the basic financial statements and, in ouropinion, fairly state, in all material respects, the information required to be set forth therein in relation tothe basic financial statements taken as a whole.
SYCIP GORRES VELAYO & CO.
Aileen L. SaringanPartnerCPA Certificate No. 72557SEC Accreditation No. 0096-AR-4 (Group A), August 18, 2016, valid until August 18, 2019Tax Identification No. 102-089-397BIR Accreditation No. 08-001998-58-2018 February 26, 2018, valid until February 25, 2021PTR No. 6621327, January 9, 2018, Makati City
March 27, 2018
SyCip Gorres Velayo & Co.6760 Ayala Avenue1226 Makati CityPhilippines
Tel: (632) 891 0307Fax: (632) 819 0872ey.com/ph
BOA/PRC Reg. No. 0001, December 14, 2015, valid until December 31, 2018SEC Accreditation No. 0012-FR-4 (Group A), November 10, 2015, valid until November 9, 2018
A member firm of Ernst & Young Global Limited
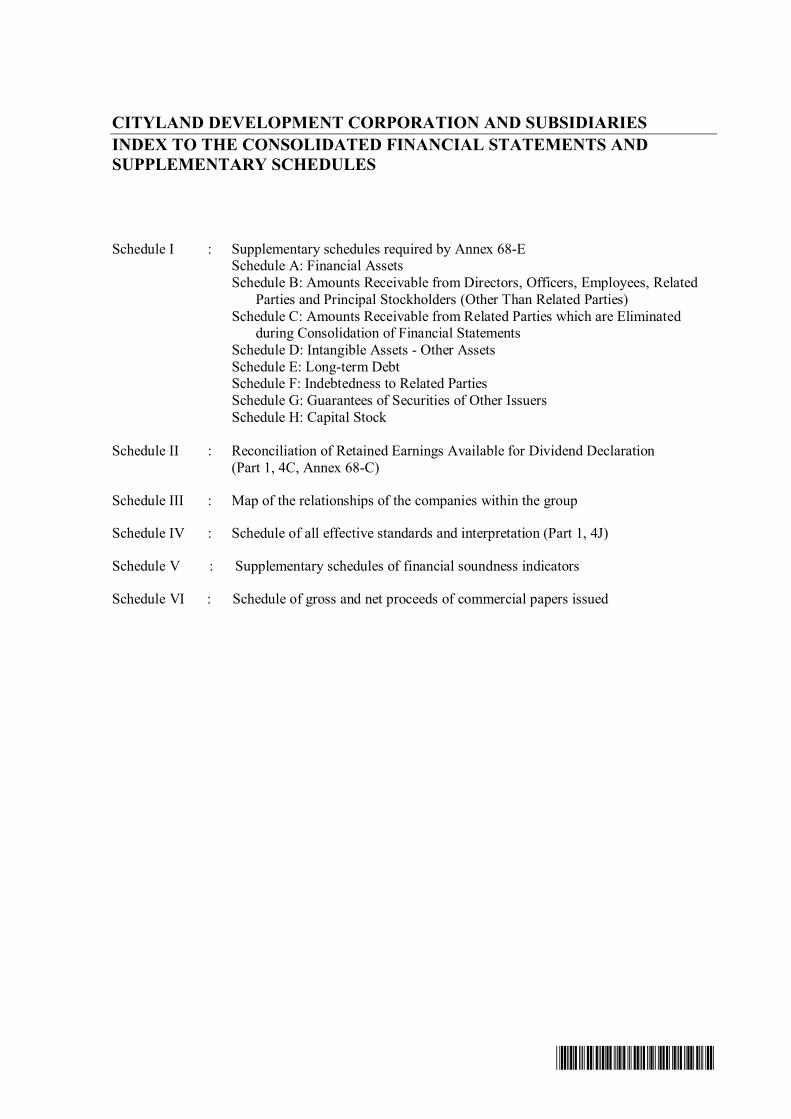
*SGVFS027825*
CITYLAND DEVELOPMENT CORPORATION AND SUBSIDIARIESINDEX TO THE CONSOLIDATED FINANCIAL STATEMENTS ANDSUPPLEMENTARY SCHEDULES
Schedule I : Supplementary schedules required by Annex 68-E Schedule A: Financial Assets
Schedule B: Amounts Receivable from Directors, Officers, Employees, RelatedParties and Principal Stockholders (Other Than Related Parties)
Schedule C: Amounts Receivable from Related Parties which are Eliminatedduring Consolidation of Financial Statements
Schedule D: Intangible Assets - Other AssetsSchedule E: Long-term DebtSchedule F: Indebtedness to Related PartiesSchedule G: Guarantees of Securities of Other IssuersSchedule H: Capital Stock
Schedule II : Reconciliation of Retained Earnings Available for Dividend Declaration (Part 1, 4C, Annex 68-C)
Schedule III : Map of the relationships of the companies within the group
Schedule IV : Schedule of all effective standards and interpretation (Part 1, 4J)
Schedule V : Supplementary schedules of financial soundness indicators
Schedule VI : Schedule of gross and net proceeds of commercial papers issued

*SGVFS027825*
SCHEDULE I
CITYLAND DEVELOPMENT CORPORATION AND SUBSIDIARIESSUPPLEMENTARY SCHEDULES REQUIRED BY ANNEX 68-E
Schedule A. Financial Assets
Name of Issuing Entity and Description ofEach Issue
Number of Sharesor Principal Amountof Bonds and Notes
Amount Shown inthe Balance Sheet
Value Based onMarket Quotations
at Balance SheetDate
Income Received andAccrued
Cash and Cash EquivalentsCash on hand and in banks – P=25,328,317 P=25,328,317 P=70,942Cash equivalents
Amalgamated Investment Bancorporation – 16,500,000 16,500,000 32,028Banco De Oro – 118,000,000 118,000,000 312,153China Bank Savings – 248,439,042 248,439,042 1,076,636Citysavings Bank – 83,700,000 83,700,000 103,232Eastwest Bank – 16,500,000 16,500,000 33,125Philippine Bank of Communications – 40,000,000 40,000,000 8,333Philippine National Bank – 49,500,000 49,500,000 104,403Philippine Savings Bank – 18,500,000 18,500,000 27,816Philippine Trust Company – 149,132,092 149,132,092 496,808United Coconut Planters Bank – 33,500,000 33,500,000 66,042UCPB Savings Bank – 61,728,866 61,728,866 215,140
– 860,828,317 860,828,317 2,546,658Short-term Cash Investments
Amalgamated Investment Bancorporation – 55,000,000 55,000,000 3,131,022Banco De Oro – 28,000,000 28,000,000 2,062,252
(Forward)

*SGVFS027825*
Name of Issuing Entity and Description ofEach Issue
Number of Sharesor Principal Amountof Bonds and Notes
Amount Shown inthe Balance Sheet
Value Based onMarket Quotations
at Balance SheetDate
Income Received andAccrued
China Bank Savings – P=58,500,000 P=58,500,000 P=7,508,400Citysavings Bank – 154,900,000 154,900,000 10,142,791Eastwest Bank – 206,000,000 206,000,000 9,028,783Malayan Bank – 48,000,000 48,000,000 1,203,878Maybank – 16,000,000 16,000,000 3,355,983Philippine Bank of Communications – 44,000,000 44,000,000 3,007,646Philippine National Bank – 22,500,000 22,500,000 2,905,948Philippine Savings Bank – 24,500,000 24,500,000 444,618Philippine Trust Company – 146,500,000 146,500,000 10,264,387RCBC Savings Bank – 39,000,000 39,000,000 241,854Security Bank Trust Corporation – 535,500,000 535,500,000 2,250,375United Coconut Planters Bank – 3,800,000 3,800,000 2,732,520UCPB Savings Bank – 140,800,000 140,800,000 5.169,572China Banking Corporation – – – 61,924Union Bank – – – 357,656Metrobank – – – 204,444Philippine Business Bank – – – 248,438Philippine Commercial Capital Inc. – – – 421,694Philippine Veterans Bank – – – 458Robinsons Savings Bank – – – 47,170
– P=1,523,000,000 P=1,523,000,000 P=64,791,813
(Forward)

*SGVFS027825*
Name of Issuing Entity and Description ofEach Issue
Number of Sharesor Principal Amountof Bonds and Notes
Amount Shown inthe Balance Sheet
Value Based onMarket Quotations
at Balance SheetDate
Income Received andAccrued
Available-for-sale InvestmentsPLDT Common 77 P=167,240 P=167,240 P=–Filinvest 1,445 2,717 2,717 –Union Bank 684 59,269 59,269 –Empire East 600,602 390,391 390,391 –Ayala Corp. “B” Common 676 686,140 686,140 –Ayala Corp. “B” Preferred 227 227 227 –Ayala Land “B” Common 75 3,345 3,345 –Ayala Land “B” Preferred 16,875 1,687 1,687 –First Holdings B 5,126 317,812 317,812 –Swift Foods 1,866 250 250 –
627,653 1,629,078 1,629,078 –Investments in Trust Funds – 34,606,350 34,606,350 –Installment Contracts Receivable – 1,835,418,984 1,835,418,984 247,470,820Notes Receivable 728,000,000 728,000,000 12,077,708Others Receivables – 61,854,309 61,854,309 –
– P=5,045,337,038 P=5,045,337,038 P=326,886,999

*SGVFS027825*
Schedule B. Amounts Receivable from Directors, Officers, Employees, Related Parties and Principal Stockholders(Other Than Related Parties)
Name of Designationor Debtor
Balance atbeginning of
periodAdditions Amounts
collectedAmounts
written off Current Not Current Balance at endof period
Schedule C. Amounts Receivable from Related Parties which are Eliminated during Consolidation of Financial StatementsName andDesignation of Debtor
Balance atbeginning of period Additions
Amountscollected
Amountswritten-off Current Non-current
Balance atend of period
CLDI (subsidiary) P=2,486,108 P=5,590,118 P=7,955,930 P=– P=120,296 P=– P=120,296CPI (subsidiary) 180,751 2,213,083 2,029,963 – 363,871 – 363,871
Parent Company’s transactions with CLDI and CPI are eliminated in the consolidated financial statements.
Schedule D. Intangible Assets - Other Assets
Description Beginning Balance Additions at cost Charged to costand expenses
Charged to otheraccounts
Other changesadditions
(deductions)Ending balance
Not applicable. No directors, officers, employees, and principal stockholders (other than related parties) fromwhom an aggregate indebtedness of more than P100,000 or one per cent of total assets, whichever is less, is owed.
Not Applicable. The Group has no intangible assets.

*SGVFS027825*
Schedule E. Long-term Debt
Title of Issue and type ofObligation
Amountauthorized by indenture
Amount shown undercaption "Current portion oflong-term debt" in related
balance sheet
Amount shown undercaption "Long-Term Debt" in
related balance sheet
Schedule F. Indebtedness to Related Parties
Name of related parties Balance at beginning of period Balance at end of period
Directors’ fee P=13,083,295 P=20,660,349
Schedule G. Guarantees of Securities of Other IssuersName of issuing entity of
securities guaranteed by thecompany for which this
statement is filed
Title of issue of each classof securities guaranteed
Total amountguaranteed and
outstanding
Amount ownedby person for
which statementis filed
Nature of guarantee
Schedule H. Capital Stock
Title of Issue Number of SharesAuthorized
Number of SharesIssued and
Outstanding
Number of SharesReserved for Options,Warrants, Conversion
and Other Rights
Number of Shares Held By
Affiliates Directors, Officersand Employees
Others
Common Stock – P1 par value 4,000,000,000 3,940,001,648 – 2,009,757,664 884,755,881 1,045,488,103
Not applicable. The Group has no guarantees of securities of other issuers.
Not applicable. The Group has no long-term debt.

*SGVFS027825*
SCHEDULE II
CITYLAND DEVELOPMENT CORPORATIONSUPPLEMENTARY SCHEDULE OF RETAINED EARNINGSAVAILABLE FOR DIVIDEND DECLARATIONDECEMBER 31, 2017
Unappropriated retained earnings, beginning P=1,718,215,092Deemed cost adjustment on real estate properties, net of tax (152,833,690)Treasury shares (28,524,728)Fair value adjustment arising from repossessed inventories, net of tax (23,565,123)Deferred income tax assets, beginning (8,790,182)Unappropriated retained earnings, as adjusted to
available for dividends declaration, beginning 1,504,501,369Add: Net income actually earned/realized during the year
Net income during the year closed to retained earnings 412,019,664Realized deemed cost adjustments on real estate properties 16,793,327Fair value adjustment arising from repossessed inventories (2,202,937)Movement in deferred income tax assets (1,302,639)
425,307,415Less:Dividends declared during the year
Cash dividends 135,019,338Stock dividends 187,526,533Transfer of deferred tax liability on deemed cost adjustment of properties
realized through sale (4,776,668)Transfer of deferred tax liability on deemed cost adjustment of
property and equipment absorbed through depreciation (726,858)Fractional shares 325
317,042,670Unappropriated retained earnings available for dividends declaration, end P=1,612,766,114

*SGVFS027825*
SCHEDULE IIICITYLAND DEVELOPMENT CORPORATIONMAP OF THE RELATIONSHIPS OF THE COMPANIES WITHIN THE GROUP
CITYLAND, INC. (CI)(Ultimate Parent)
CITYADS, INCORPORATED(CAI)
(Subsidiary of CI)
CITYLAND DEVELOPMENTCORPORATION (CDC)
(Subsidiary of CI)
50.98%
CREDIT & LANDHOLDINGS,
INCORPORATED. (CLHI)(Subsidiary of CI)
100.00% 100.00%
CITYPLANS, INCORPORATED(CPI)
(Subsidiary of CDC)
CITY & LAND DEVELOPERS,INCORPORATED (CLDI)
(Subsidiary of CDC)
29.54% 9.18%
49.73% 90.81%
0.87%
0.06%
0.52%
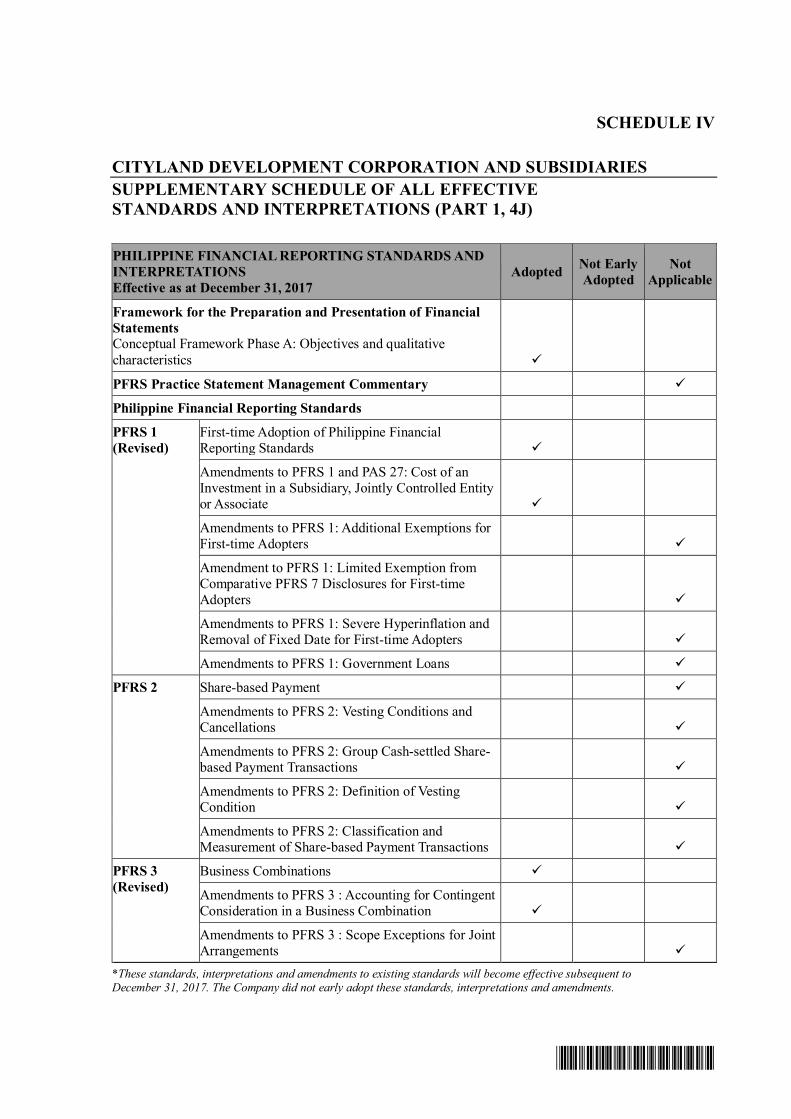
*SGVFS027825*
SCHEDULE IV
CITYLAND DEVELOPMENT CORPORATION AND SUBSIDIARIESSUPPLEMENTARY SCHEDULE OF ALL EFFECTIVESTANDARDS AND INTERPRETATIONS (PART 1, 4J)
PHILIPPINE FINANCIAL REPORTING STANDARDS ANDINTERPRETATIONSEffective as at December 31, 2017
Adopted Not EarlyAdopted
NotApplicable
Framework for the Preparation and Presentation of FinancialStatementsConceptual Framework Phase A: Objectives and qualitativecharacteristics
PFRS Practice Statement Management Commentary
Philippine Financial Reporting Standards
PFRS 1(Revised)
First-time Adoption of Philippine FinancialReporting Standards
Amendments to PFRS 1 and PAS 27: Cost of anInvestment in a Subsidiary, Jointly Controlled Entityor Associate
Amendments to PFRS 1: Additional Exemptions forFirst-time Adopters
Amendment to PFRS 1: Limited Exemption fromComparative PFRS 7 Disclosures for First-timeAdopters
Amendments to PFRS 1: Severe Hyperinflation andRemoval of Fixed Date for First-time Adopters
Amendments to PFRS 1: Government Loans
PFRS 2 Share-based Payment
Amendments to PFRS 2: Vesting Conditions andCancellations
Amendments to PFRS 2: Group Cash-settled Share-based Payment Transactions
Amendments to PFRS 2: Definition of VestingCondition
Amendments to PFRS 2: Classification andMeasurement of Share-based Payment Transactions
PFRS 3(Revised)
Business Combinations
Amendments to PFRS 3 : Accounting for ContingentConsideration in a Business Combination
Amendments to PFRS 3 : Scope Exceptions for JointArrangements
*These standards, interpretations and amendments to existing standards will become effective subsequent toDecember 31, 2017. The Company did not early adopt these standards, interpretations and amendments.

- 2 -
*SGVFS027825*
PHILIPPINE FINANCIAL REPORTING STANDARDS ANDINTERPRETATIONSEffective as at December 31, 2017
Adopted Not EarlyAdopted
NotApplicable
PFRS 4 Insurance Contracts
Amendments to PAS 39 and PFRS 4: FinancialGuarantee Contracts
Amendments to PFRS 4: Applying PFRS 9,Financial Instruments, with PFRS 4
PFRS 5 Non-current Assets Held for Sale and DiscontinuedOperations
Amendments to PFRS 5: Changes in Method ofDisposal
PFRS 6 Exploration for and Evaluation of Mineral Resources
PFRS 7 Financial Instruments Disclosures
Amendments to PFRS 7: Transition
Amendments to PAS 39 and PFRS 7:Reclassification of Financial Assets
Amendments to PAS 39 and PFRS 7:Reclassification of Financial Assets - Effective Dateand Transition
Amendments to PFRS 7: Improving Disclosuresabout Financial Instruments
Amendments to PFRS 7: Disclosures - Transfers ofFinancial Assets
Amendments to PFRS 7: Disclosures - OffsettingFinancial Assets and Financial Liabilities
Amendments to PFRS 7: Mandatory Effective Dateof PFRS 9 and Transition Disclosures
Amendments to PFRS 7: Applicability of theAmendments to PFRS 7 to Condensed InterimFinancial Statements
Amendments to PFRS 7: Servicing Contracts
PFRS 8 Operating Segments
Amendments to PFRS 8 : Aggregation of OperatingSegments and Reconciliation of the Total of theReportable Segments’ Assets to the Entity’s Asset
PFRS 9 Financial Instruments*
Amendments to PFRS 9: Prepayment Features withNegative Compensation*
*These standards, interpretations and amendments to existing standards will become effective subsequent toDecember 31, 2017. The Company did not early adopt these standards, interpretations and amendments.

- 3 -
*SGVFS027825*
PHILIPPINE FINANCIAL REPORTING STANDARDS ANDINTERPRETATIONSEffective as at December 31, 2017
Adopted Not EarlyAdopted
NotApplicable
PFRS 10 Consolidated Financial Statements Ο
Amendments to PFRS 10: Transition Guidance
Amendments to PFRS 10, PFRS 12 and PAS 27:Investment Entities Ο
Amendments to PFRS 10, PFRS 12 and PAS 28,Investment Entities: Applying the ConsolidationException
Amendments to PFRS 10 and PAS 28: Sale orContribution of Assets between an Investor and itsAssociate or Joint Venture
PFRS 11 Joint Arrangements
Amendments to PFRS 11: Transition Guidance
Amendments to PFRS 11: Accounting forAcquisitions of Interests in Joint Operations
PFRS 12 Disclosure of Interests in Other Entities Ο
Amendments to PFRS 12: Transition Guidance
Amendments to PFRS 10, PFRS 12 and PAS 27:Investment Entities
Amendments to PFRS 10, PFRS 12 and PAS 28,Investment Entities: Applying the ConsolidationException
Amendments to PFRS 12: Clarification of the Scopeof the Standard*
PFRS 13 Fair Value Measurement
Amendments to PFRS 13 : Portfolio Exception
PFRS 14 Regulatory Deferral Accounts
PFRS 15 Revenue from Contracts with Customers*
PFRS 16 Leases*
Philippine Accounting Standards
PAS 1(Revised)
Presentation of Financial Statements
Amendment to PAS 1: Capital Disclosures
Amendments to PAS 32 and PAS 1: PuttableFinancial Instruments and Obligations Arising onLiquidation
Amendments to PAS 1: Presentation of Items ofOther Comprehensive Income
*These standards, interpretations and amendments to existing standards will become effective subsequent toDecember 31, 2017. The Company did not early adopt these standards, interpretations and amendments.

- 4 -
*SGVFS027825*
PHILIPPINE FINANCIAL REPORTING STANDARDS ANDINTERPRETATIONSEffective as at December 31, 2017
Adopted Not EarlyAdopted
NotApplicable
Amendments to PAS 1, Disclosure Initiative
PAS 2 Inventories
PAS 7 Statement of Cash Flows
Amendments to PAS 7: Disclosure Initiative*
PAS 8 Accounting Policies, Changes in AccountingEstimates and Errors
PAS 10 Events after the Reporting Period
PAS 11 Construction Contracts
PAS 12 Income Taxes
Amendment to PAS 12 : Deferred Tax: Recovery ofUnderlying Assets
Amendments to PAS 12: Recognition of DeferredTax Assets for Unrealized Losses
PAS 16 Property, Plant and Equipment
Amendments to PAS 16 and PAS 38: Clarification ofAcceptable Methods of Depreciation andAmortization
Amendments to PAS 16 and 38: ProportionateRestatement of Accumulated Amortization
Amendments to PAS 16 and PAS 41: Bearer Plants
PAS 17 Leases
PAS 18 Revenue
PAS 19(Revised)
Employee Benefits
Amendments to PAS 19: Actuarial Gains and Losses,Group Plans and Disclosures
Regional Market Issue Regarding Discount Rate
Amendments to PAS 19: Defined Benefit Plans:Employee Contributions
PAS 20 Accounting for Government Grants and Disclosureof Government Assistance
PAS 21 The Effects of Changes in Foreign Exchange Rates
Amendment: Net Investment in a Foreign Operation
PAS 23(Revised)
Borrowing Costs
*These standards, interpretations and amendments to existing standards will become effective subsequent toDecember 31, 2017. The Company did not early adopt these standards, interpretations and amendments.

- 5 -
*SGVFS027825*
PHILIPPINE FINANCIAL REPORTING STANDARDS ANDINTERPRETATIONSEffective as at December 31, 2017
Adopted Not EarlyAdopted
NotApplicable
PAS 24(Revised)
Related Party Disclosures
Key Management Personnel
PAS 26 Accounting and Reporting by Retirement BenefitPlans
PAS 27(Amended)
Separate Financial Statements
Amendments to PFRS 10, PFRS 12 and PAS 27:Investment Entities
Amendment: Equity Method in Separate FinancialStatements
PAS 28(Amended)
Investments in Associates and Joint Ventures
Amendments to PFRS 10, PFRS 12 and PAS 28,Investment Entities: Applying the ConsolidationException
Amendments to PAS 28: Measuring an Associate orJoint Venture at Fair Value*
Amendments to PAS 28: Long-term Interests inAssociates and Joint Ventures*
Amendments to PFRS 10 and PAS 28: Sale orContribution of Assets between an Investor and itsAssociate or Joint Venture
PAS 29 Financial Reporting in Hyperinflationary Economies
PAS 32 Financial Instruments: Disclosure and Presentation
Amendments to PAS 32 and PAS 1: PuttableFinancial Instruments and Obligations Arising onLiquidation
Amendment to PAS 32: Classification of RightsIssues
Amendments to PAS 32: Offsetting Financial Assetsand Financial Liabilities
PAS 33 Earnings per Share
PAS 34 Interim Financial Reporting
Disclosure of Information ‘Elsewhere in the InterimFinancial Report’
PAS 36 Impairment of Assets
Amendment to PAS 36: Impairment ofAssets - Recoverable Amount Disclosures for Non-Financial Assets
*These standards, interpretations and amendments to existing standards will become effective subsequent toDecember 31, 2017. The Company did not early adopt these standards, interpretations and amendments.

- 6 -
*SGVFS027825*
PHILIPPINE FINANCIAL REPORTING STANDARDS ANDINTERPRETATIONSEffective as at December 31, 2017
Adopted Not EarlyAdopted
NotApplicable
PAS 37 Provisions, Contingent Liabilities and ContingentAssets
PAS 38 Intangible Assets
Amendments to PAS 16 and PAS 38: Clarification ofAcceptable Methods of Depreciation andAmortization
PAS 39 Financial Instruments: Recognition and Measurement
Amendments to PAS 39: Transition and InitialRecognition of Financial Assets and FinancialLiabilities
Amendments to PAS 39: Cash Flow HedgeAccounting of Forecast Intragroup Transactions
Amendments to PAS 39: The Fair Value Option
Amendments to PAS 39 and PFRS 4: FinancialGuarantee Contracts
Amendments to PAS 39 and PFRS 7:Reclassification of Financial Assets
Amendments to PAS 39 and PFRS 7:Reclassification of Financial Assets - Effective Dateand Transition
Amendments to Philippine InterpretationIFRIC-9 and PAS 39: Embedded Derivatives
Amendment to PAS 39: Eligible Hedged Items
Amendment to PAS 39: Novation of Derivatives andContinuation of Hedge Accounting
PAS 40 Investment Property
Interrelationship between PFRS 3 and PAS 40
Amendments to PAS 40: Transfers of InvestmentProperty
PAS 41 Agriculture
Philippine Interpretations
IFRIC 1 Changes in Existing Decommissioning, Restorationand Similar Liabilities
IFRIC 2 Members’ Share in Co-operative Entities and SimilarInstruments
IFRIC 4 Determining Whether an Arrangement Contains aLease
*These standards, interpretations and amendments to existing standards will become effective subsequent toDecember 31, 2017. The Company did not early adopt these standards, interpretations and amendments.

- 7 -
*SGVFS027825*
PHILIPPINE FINANCIAL REPORTING STANDARDS ANDINTERPRETATIONSEffective as at December 31, 2017
Adopted Not EarlyAdopted
NotApplicable
IFRIC 5 Rights to Interests arising from Decommissioning,Restoration andEnvironmental Rehabilitation Funds
IFRIC 6 Liabilities arising from Participating in a SpecificMarket - Waste Electrical and Electronic Equipment
IFRIC 7 Applying the Restatement Approach underPAS 29 Financial Reporting in HyperinflationaryEconomies
IFRIC 9 Reassessment of Embedded Derivatives
Amendments to Philippine InterpretationIFRIC - 9 and PAS 39: Embedded Derivatives
IFRIC 10 Interim Financial Reporting and Impairment
IFRIC 12 Service Concession Arrangements
IFRIC 13 Customer Loyalty Programmes
IFRIC 14 The Limit on a Defined Benefit Asset, MinimumFunding Requirements and their Interaction
Amendments to Philippine InterpretationsIFRIC- 14, Prepayments of a Minimum FundingRequirement
IFRIC 15 Agreements for the Construction of Real Estate*
IFRIC 16 Hedges of a Net Investment in a Foreign Operation
IFRIC 17 Distributions of Non-cash Assets to Owners
IFRIC 18 Transfers of Assets from Customers
IFRIC 19 Extinguishing Financial Liabilities with EquityInstruments
IFRIC 20 Stripping Costs in the Production Phase of a SurfaceMine
IFRIC 21 Levies
IFRIC 22 Foreign Currency Transactions and AdvanceConsideration*
IFRIC 23 Uncertainty over Income Tax Treatments*
SIC-7 Introduction of the Euro
SIC-10 Government Assistance - No Specific Relation toOperating Activities
SIC-15 Operating Leases - Incentives
*These standards, interpretations and amendments to existing standards will become effective subsequent toDecember 31, 2017. The Company did not early adopt these standards, interpretations and amendments.

- 8 -
*SGVFS027825*
PHILIPPINE FINANCIAL REPORTING STANDARDS ANDINTERPRETATIONSEffective as at December 31, 2017
Adopted Not EarlyAdopted
NotApplicable
SIC-25 Income Taxes - Changes in the Tax Status of anEntity or its Shareholders
SIC-27 Evaluating the Substance of Transactions Involvingthe Legal Form of a Lease
SIC-29 Service Concession Arrangements: Disclosures
SIC-31 Revenue - Barter Transactions Involving AdvertisingServices
SIC-32 Intangible Assets - Web Site Costs
*These standards, interpretations and amendments to existing standards will become effective subsequent toDecember 31, 2017. The Company did not early adopt these standards, interpretations and amendments.

*SGVFS027825*
SCHEDULE V
CITYLAND DEVELOPMENT CORPORATION AND SUBSIDIARIESSUPPLEMENTARY SCHEDULE OFFINANCIAL SOUNDNESS INDICATORS
Financial Ratios December 312017 2016 2015
Current 2.42 2.43 3.43Asset-to-equity 1.44 1.54 1.42Debt-to-equity 0.22 0.26 0.19Asset-to-liability 4.93 3.87 5.12Solvency 0.30 0.20 0.47Interest rate coverage 84.00 110.18 154.37Acid-test ratio 1.69 1.66 2.45Return on equity (%) 7.20% 6.94% 11.97%Earnings per share P=0.12 P=0.11 P=0.19
Manner of Calculations:
Earnings per share = Net income after TaxOutstanding shares
Return on equityratio = Net Income after Tax
Stockholder's Equity
Solvency ratio = Net Income after Tax + Depreciation ExpenseTotal Liabilities
Interest ratecoverage ratio = Net Income Before Tax + Depreciation Expense + Interest Expense
Interest Expense
Asset-to-liabilityratio = Total Assets / Total Liabilities
Asset-to-equity ratio = Total AssetsTotal equity (net of net changes in fair value of available-for-sale
financial assets and accumulated re-measurement on defined benefitplan)
Debt-to-equity ratio =
Notes and Contracts PayableTotal equity (net of net changes in fair value of available-for-sale
financial assets and accumulated re-measurement on defined benefitplan)
Current ratio = Total Current Assets / Total Current Liabilities
Acid-test ratio =
Cash and Cash Equivalents + Short-term Cash Investments +Installment Contracts Receivable, current + Notes Receivable, current +
Other Receivables, current + Available-for-sale Financial AssetsTotal Current Liabilities

*SGVFS027825*
SCHEDULE VI
CITYLAND DEVELOPMENT CORPORATIONSCHEDULE OF GROSS AND NET PROCEEDS OF COMMERCIAL PAPERS ISSUEDAs of December 31, 2017
SEC-MSRD Order No. 35, Series of 2016 dated November 14, 2016
A. As stated in the Final Prospectus (November 2016 to October 2017)
Gross Proceeds Php 1,300,000,000
Less: Expenses
Documentary Stamps Tax 6,500,000
Registration Fees 896,375
Printing Costs 65,000
Legal and Accounting Fees 30,000
Publication Fees 30,000 7,521,375
Net Proceeds Php 1,292,478,625
Use of Proceeds
Payment of Maturing Notes 720,608,625
Project-related Costs 555,750,000
Interest Expense 16,120,000
Total Php 1,292,478,625
B. Use of Proceeds (November 2016 to October 2017)
Gross Proceeds Php 1,930,150,000
Less: Expenses
Documentary Stamps Tax 6,155,179
Registration Fees 896,375
Printing Costs 71,250
Legal and Accounting Fees 30,000
Publication Fees 30,000 7,182,804
Total Net Proceeds Php 1,922,967,196
Less: Use of Proceeds
Payment of Maturing Notes 1,405,618,104
Project-related Costs 509,763,682
Interest Expense 7,585,410 1,922,967,196
Balance of Proceeds as of December 31, 2017 Php -

- 2 -
*SGVFS027825*
CITYLAND DEVELOPMENT CORPORATIONSCHEDULE OF GROSS AND NET PROCEEDS OF COMMERCIAL PAPERS ISSUEDAs of December 31, 2017
SEC-MSRD Order No. 32, Series of 2017 dated November 6, 2017
A. As stated in the Final Prospectus (November 6, 2017 to November 5, 2018)
Gross Proceeds Php 1,350,000,000
Less: Expenses
Documentary Stamps Tax 6,750,000
Registration Fees 719,625
Printing Costs 67,500
Legal and Accounting Fees 30,000
Publication Fees 30,000 7,597,125
Net Proceeds Php 1,342,402,875
Use of Proceeds
Project-related Costs 671,500,000
Payment of Maturing Notes 654,297,875
Interest Expense 16,605,000
Total Php 1,342,402,875
B. Use of Proceeds (November 6, 2017 to December 31, 2017)
Gross Proceeds Php 566,500,000
Less: Expenses
Registration Fess 719,625
Documentary Stamps tax 679,405
Publication Fees 30,000
Legal and Accounting Fees 30,000
Printing Costs 7,200 1,466,230
Total Net Proceeds Php 565,033,770
Less: Use of Proceeds
Payment of Maturing Notes 542,644,861
Project-related Costs 22,388,909 565,033,770
Balance of Proceeds as of December 31, 2017 Php -
C. Outstanding Commercial Papers as of December 31, 2017:
SEC-MSRD Order No. 35 Series of 2016 dated November 14, 2016 SEC-MSRD Order No. 32 Series of 2017 dated November 6, 2017
-- 734,650,000
566,500,000 Total Php 1,301,150,000

- 3 -
*SGVFS027825*
CITY & LAND DEVELOPERS, INCORPORATEDSCHEDULE OF GROSS AND NET PROCEEDS OF COMMERCIAL PAPERS ISSUEDAs of December 31, 2017
SEC-MSRD Order No. 12, Series of 2016 dated November 14, 2016 (2nd Tranche)
A. As stated in the Final Prospectus (November 14, 2016 to November 13, 2017)
Gross Proceeds Php 200,000,000
Less: Expenses
Documentary Stamps Tax 1,000,000
Registration Fees 202,000
Printing Costs 10,000 1,212,000
Net Proceeds Php 198,788,000
Use of Proceeds
Project-related Costs 149,255,000
Payment of Maturing Notes 47,133,000
Interest Expense 2,400,000
Total Php 198,788,000
B. Use of Proceeds (November 2016 to October 2017)
Project-related Costs 141,037,780
Payment of Maturing Notes
Interest Expense
80,527,997
298,362 221,864,139
Balance of Proceeds as of December 31, 2017 Php -
Gross Proceeds Php 222,850,000
Less: ExpensesDocumentary Stamps Tax 769,711
Registration Fees 202,000
Printing Costs 14,150 985,861
Net Proceeds Php 221,864,139
Less: Use of Proceeds

- 4 -
*SGVFS027825*
CITY & LAND DEVELOPERS, INCORPORATEDSCHEDULE OF GROSS AND NET PROCEEDS OF COMMERCIAL PAPERS ISSUEDAs of December 31, 2017
SEC-MSRD Order No. 33, Series of 2017 dated November 6, 2017
A. As stated in the Final Prospectus (November 6, 2017 to November 5, 2018)
Gross Proceeds Php 400,000,000
Less: ExpensesDocumentary Stamps Tax 2,000,000
Registration Fees 366,125
Legal and Accounting Fees 30,000
Publication Fees 30,000
Printing Costs 20,000 2,446,125
Net Proceeds Php 397,553,875
Use of ProceedsProject-related Costs 375,600,000
Payment of Maturing Notes 17,033,875
Interest Expense 4,920,000
Total Php 397,553,875
B. Use of Proceeds (November 6, 2017 to December 31, 2017)
Gross Proceeds Php 55,100,000
Less: Expenses
Registration Fees 366,125
Documentary Stamps Tax 54,146
Legal and Accounting Fees 30,000
Publication Fees 30,000
Printing Costs 1,250 481,521
Net Proceeds Php 54,618,479
Less: Use of Proceeds
Project-related Costs 54,618,479
Balance of Proceeds as of December 31, 2017 Php -
C. Outstanding Commercial Papers as of December 31, 2017:
SEC-MSRD Order No. 12, Series of 2016 dated September 15, 2016 - 28,550,000 SEC-MSRD Order No. 12, Series of 2016 dated November 14, 2016 SEC-MSRD Order No. 33, Series of 2017 dated November 6, 2017
--
68,650,00055,100,000
Total Php 152,300,000

C O V E R S H E E T
SEC Registration Number
7 7 8 2 3
C O M P A N Y N A M E
C I T Y L A N D D E V E L O P M E N T
C O R P O R A T I O N A N D S U B S I D I A R I E S
PRINCIPAL OFFICE ( No. / Street / Barangay / City / Town / Province )
2 / F C i t y l a n d C o n d o m i n i u m 1 0 ,
T o w e r I , 1 5 6 H . V . D e l a C o s t a
S t r e e t , M a k a t i C i t y
Form Type Department requiring the report Secondary License Type, If Applicable
1 7 - Q M S R D N A
C O M P A N Y I N F O R M A T I O N
Company’s Email Address Company’s Telephone Number Mobile Number
[email protected] 893-6060 N/A
No. of Stockholders Annual Meeting (Month / Day) Calendar Year (Month / Day)
668
(as of MARCH 31, 2018)
1st Tuesday of June December 31
CONTACT PERSON INFORMATION
The designated contact person MUST be an Officer of the Corporation
Name of Contact Person Email Address Telephone Number/s Mobile Number
RUDY GO [email protected] 893-6060 N/A
CONTACT PERSON’S ADDRESS
3/F Cityland Condominium 10, Tower II, 154 H.V. Dela Costa Street, Makati City
NOTE 1 : In case of death, resignation or cessation of office of the officer designated as contact person, such incident shall be reported to the Commission within thirty (30) calendar days from the occurrence thereof with information and complete contact details of the new contact person designated. 2 : All Boxes must be properly and completely filled-up. Failure to do so shall cause the delay in updating the corporation’s records with the Commission and/or non-receipt of Notice of Deficiencies. Further, non-receipt of Notice of Deficiencies shall not excuse the corporation from liability for its deficiencies.

SECURITIBS AND EXCHANGE
sEC FORM 17- Q
QUARTERLY REPORT PT]RSUANT TO SECTION 17OT,'THE SECURITIES REGULATION CODE AND SECTION 141
OF THF' CORPORATION CODE OF THf, PIIILPPINIS
1. For the fiscal year ended March 31. 2018
2. SEC Identification Number 77823 3. BIR Tax
4. CITYLAND DEYELOPMENT CORPORATIONExact narne of,issuer as specified in its eharter
5. Makati Citv. PhilipoinesProvince, country or other jurisdictionof incorporation
7- 2/F Cityland Condominium 10 Towerl,156ILY. Dgla Costa Street Makati CitvAddress of Principal Office
Ideritifi cation No. 000-527-103
1226Postal Code
Number of Shares of Common Stock Outstanding3,939,063,701
Title of Each ClassUnclassified Common Shares
6.1 i (SECUseOrrly)Industry Classification Code
8. (632)-893-60-60Issuer's telephone number, including area code
L Former name, former address and former fiscal year, if changed since last report N/A
10. SecuritiesregisteredpursuanttoSectionsSand i2oftheSRC,orSec.4andSoftheRSA
Title of Each ClassUnclassified Common Shares
Stock ExchangePhilippine Stock Exchange
1i. Are any or all of these securities listed on a Stock Exchange.
Yes [x] No [ ]
If yes. state the natne of such stock exchange and the classes of securities Iisted therein:
12. Check whether the issuer:
(a) Has filed all repoffs required to be filed by Section l7 of the SRC and SRC Rule l7 thereunderor Section 11 of the RSA and RSA Rule 1l(a)-1 thereunder, and Sections 26 and 141 of theCorporatiort Code of ttre Philippines during the preceding tu,elve (12) months (or for sucl-rshorter period that the registrant r,r,as required to f-lle such reports):
Yes [x] No t l
(b) Has been sr-rbject to such filing requirements for the past 90 days.
Yes [x] No t l
$:ffi

2
PART I - FINANCIAL INFORMATION
Item 1. Financial Statements
The financial statements and accompanying notes are filed as part of this form (pages 10 to 64).
Item 2. Management’s Discussion and Analysis of Financial Condition and Results of Operations
The country’s economic boom shows no signs of slowing down and is expected to remain steady and
strong in 2018. The Philippines is considered as one of the fastest –growing economies in Asia as it
exhibited an increase in the Gross Domestic Product (GDP) by 6.7% in 2017 as reported last year by
the National Economic Development Authority (NEDA). This robust condition paves the way to
different sectors to flourish, including that of the real estate. The real estate industry’s steady growth
over the past years is attributed to the increase in demand for residential and commercial properties
driven by various factors. These includes rising urban population growth, housing needs of BPO
(business process outsourcing) employees, worsening traffic in the metropolis and remittances from
overseas Filipino workers (OFWs) . The bullish performance of the country’s real estate sector is
projected to further thrive with the opportunities that could arise from the government’s commitment
to boost infrastructure.
Cityland Development Corporation (CDC or the Parent Company) is selling the following projects as
of March 31, 2018:
Pines Peak Tower II, a 27-storey residential condominium located at Union corner Pines St.,
central business district of Mandaluyong was launched last June 2016 and estimated to be
completed in March 2021.
Pines Peak Tower I, a 27-storey residential condominium located at Union corner Pines St., central
business district of Mandaluyong.
Grand Central Residences, a 40-storey office, commercial and residential condominium located at
EDSA corner Sultan St., Mandaluyong City.
Makati Executive Tower IV, a 29-storey office, commercial and residential condominium located
at Cityland Square, Senator Gil Puyat Avenue, Pio del Pilar Makati City.
Makati Executive Tower III, a 37-storey office, commercial and residential condominium located
at Cityland Square, Senator Gil Puyat Avenue, Pio del Pilar Makati City.
Makati Executive Tower II, a 35-storey residential condominium located in Dela Rosa St., corner
Medina St., Makati City.
Mandaluyong Executive Mansion III, a residential condominium located at Mandaluyong
Executive Mansion Subdivision, G. Enriquez St., Brgy. Vergara, Mandaluyong City.
Corinthian Executive Regency, a 39-storey office, commercial and residential condominium
located along Ortigas Avenue, Pasig City.
Manila Executive Regency, a 39-storey office, commercial and residential condominium situated
along J. Bocobo St. Ermita.

3
Buildings for lease
CityNet1, a 5-storey premiere business technology hub located along 183 EDSA, Brgy. Wack-
Wack, Mandaluyong City. It is currently being leased out to a business process outsourcing (BPO)
company and other various companies.
CityNet Central, a 22-storey commercial and BPO office building located in Sultan Street, Brgy.
Highway Hills (close to MRT Shaw), Mandaluyong City.
Also the Company’s subsidiaries, City & Land Developers, Incorporated (CLDI) and Cityplans,
Incorporated (CPI), are selling the following projects:
CLDI
One Taft Residences, a 40-storey mixed residential, office and commercial condominium which is
located at 1939 Taft Avenue, Malate, Manila was launched last October 2016 and is estimated to
be completed in September 2022.
North Residences, a 29-storey commercial and residential condominium located in EDSA (beside
Waltermart) corner Lanutan, Brgy. Veterans Village, Quezon City was launched in October 2014
and estimated to be completed in September 2018. The project was turned over in March 2018.
Manila Residences Bocobo, a 34-storey office and residential condominium project located at
Jorge Bocobo St., Ermita, Manila City.
Grand Emerald Tower, a 39-storey commercial, office and residential condominium located along
Emerald corner Ruby and Garnet Streets, Ortigas Center, Pasig City.
The Pacific Regency, a 38-storey commercial, office and residential condominium located at Pablo
Ocampo Sr. Ave. (formerly Vito Cruz Street) in front of Rizal Memorial Sports Complex in
Manila.
CPI
Oxford Mansion (joint project of CPI and Cityland, Inc.), an 8-storey commercial and residential
condominium located along Evangelista St., New Santolan, Pasig City.
Windsor Mansion (joint project of CPI and Cityland, Inc.), an 8-storey commercial and residential
condominium located at New Santolan, Pasig City.
The Cityland Development Corporation and subsidiaries (the Group) has also a number of prime lots
reserved for future projects. Its land bank is situated in strategic locations ideal for horizontal and
vertical developments.
Internal sources come from sale of condominium units and real estate properties, collection of
installment contract receivables, maturing short-term investments and notes receivable, and other
sources such as rental income, interest income and dividend income. External sources come from
Securities and Exchange Commission (SEC) registered commercial papers.
The estimated development cost of P=107.83 million as of March 31, 2018 representing the cost to
complete the development of real estate projects sold will be sourced through:
a) Sales of condominium units and real estate properties
b) Collection of installment contracts receivables
c) Maturing short-term investments and notes receivable
d) Issuance of commercial papers

4
Financial Condition (March 31, 2018 vs. December 31, 2017)
Total assets amounted to P=9.71 billion as of the first quarter of 2018, slightly lower by approximately
0.10% as compared with the previous year’s ending balance of P=9.70 billion. Sale of condominium
units increased the Group’s installment contracts receivable and decreased real estate properties for
sale. The Group’s fund were generated from sales and lease of condominium and other real estate
projects, while other financial sources came from issuance of commercial papers with interest rates
ranging from 1.06% to 1.25%. Majority of the funds were utilized for operations and to finance the
construction of the on-going projects which led its progressive increase in construction
accomplishments. The Group also partially settled notes payable which amounted to P=158.25 million,
bringing down the outstanding notes payable by 10.89% from its previous balance of P=1.45 billion. In
addition, the healthy cash position allowed the acquisition of a property held for future development.
Excess cash from operations were shifted to shorter-term investments to increase funds for operations.
On the liability side, total liabilities were reduced by P=152.06 million, equivalent to 7.74% of total
liabilities. The reduction was due to partial payment of notes payable and decrease in deferred income
tax liabilities.
Total equity stood at P=7.89 billion as of March 31, 2018, higher by 2.09% from 2017 year-end balance
of P=7.73 billion due to comprehensive income of P=158.81 million.
As a result of the foregoing, the Group’s liquidity position remained stable with acid-test and current
ratio of 1.51:1 and 2.22:1 as of March 31, 2018, as compared to 1.69:1 and 2.42:1 in
December 31, 2017, respectively. On the other hand, debt-equity ratio slightly improved to 0.19:1 as
of March 31, 2018, as compared to 0.22:1 in December 31, 2017.
Results of Operation (March 31, 2018 vs. March 31, 2017)
Sales expanded by 34.18% in March 31, 2018 reaching P=375.50 million from P=279.86 million as
compared to the same period of the previous year. The increase in sales was attributed to higher sales
and construction accomplishment of several projects. As of March 31, 2018, CDC generated 66.39%
in total revenue on sales of real estate properties. Pines Peak Tower II contributed P=106.73 million,
while a substantial portion came from the sales of the remaining units of Grand Central Residences
and Pines Peak Tower I, totaling P=96.82 million and P=27.37 million, respectively. Percentage of sales
contribution to total Group sales of Pines Peak Tower II, Grand Central Residences and Pines Peak
Tower I reached 28.42%, 25.78% and 7.29%, respectively. Since Grand Central Residences and Pines
Peak Tower I were almost sold out, revenues of CDC are projected to be generated from the sale and
construction accomplishment of Pines Peak Tower II and launching of future projects.
On the other hand, CLDI contributed 28.67% of the Group’s sales. Its latest condominium project,
North Residences, was in full blast construction as of March 31, 2018. This project reached total sales
of P=94.64 million, representing 25.20% of the Group’s sales.
Other sources of income are financial income, rent income and other income. Financial income which
is composed of interest income from sale of real estate properties, cash and cash equivalents, short-
term cash investments and notes receivable contributed 16.65% of total revenues. Likewise, rent
income grew by 10.38% from P=27.26 million to P=30.09 million in the first quarter of 2017 and 2018,
respectively. Rent income came from the lease operations of CityNet Central, CityNet1 and other
properties which are held for lease. Other revenue on the other hand, are primarily from adjustment of
market value of repossessed units, penalties charged to clients, and other miscellaneous income.
Revenue contribution of this account increased by 12.29%, amounting to P=28.00 million and P=24.93
million for the quarter ended March 31, 2018 and 2017, respectively.
On the cost side, cost of real estate sales and operating expenses and provision for income tax
increased due to higher revenues.

5
The Group ended the first quarter of 2018 with a net income of P=160.98 million, 54.72% higher than
the first quarter of 2017, generated from P=520.22 of consolidated revenues, which grew by 27.28% as
compared to the same period last year. This translated into an improved the annualized earnings per
share and return on equity of P=0.15 and 8.36% as compared to the same period of the previous year of
P=0.11 and 6.08%, respectively.
Financial Ratios
March 31, 2018
(Unaudited)
December 31, 2017
(Audited)
March 31, 2017
(Unaudited)
Earnings per share* P=0.15 P=0.12 P=0.11
Return on equity* (%) 8.36 % 7.20 % 6.08 %
Solvency ratio* 0.39 0.30 0.19
Interest rate coverage ratio 63.55 84.00 83.64
Asset-to-liability ratio 5.35 4.93 4.28
Asset-to-equity ratio 1.41 1.44 1.49
Debt-to-equity ratio 0.19 0.22 0.23
Current ratio 2.22 2.42 2.46
Acid-test ratio 1.51 1.69 1.71 *Annualized for the period of March 31, 2018 and March 31, 2017
Manner of Calculation:
Earnings per share
= Net Income after Tax
Outstanding shares
Return on equity
ratio
=
Net Income after Tax
Equity
Solvency ratio
= Net Income after Tax + Depreciation Expense
Total Liabilities
Interest rate
coverage ratio
=
Net Income Before Tax + Depreciation Expense + Interest Expense
Interest Expense
Asset-to-liability
ratio = Total Assets / Total Liabilities
Asset-to-equity ratio
=
Total Assets
Total equity (net of net changes in fair value of available-for-sale
financial assets and accumulated re-measurement on defined benefit
plan)
Debt-to-equity ratio
=
Notes and Contracts Payable
Total equity (net of net changes in fair value of available-for-sale
financial assets and accumulated re-measurement on defined benefit
plan)
Current ratio = Total Current Assets / Total Current Liabilities
Acid-test ratio
=
Cash and Cash Equivalents + Short-term Cash Investments +
Installment Contracts Receivable, current + Notes Receivable, current +
Other Receivables, current + Available-for-sale Financial Assets
Total Current Liabilities

6
Any issuances, repurchases, and repayments of debt and equity securities
Debt securities
The Parent Company and CLDI issued SEC-Registered Commercial Papers during the period with
outstanding balance of P=971.50 million and P=313.70 million, respectively, as of
March 31, 2018.
Equity securities
There are no issuances, repurchases and repayments of equity securities during the first quarter of
2018.
Any Known Trends, Events or Uncertainties (material impact on liquidity)
There are no known trends, events and uncertainties that have a material effect on liquidity.
Any unusual items affecting assets, liabilities, equity, net income or cash flows in the current
interim financial statements
There are no unusual items affecting assets, liabilities, equity and net income or cash flows in the
current interim financial statements.
Any significant changes in estimates of amounts reported in prior interim periods of the current
financial year or changes in estimates of amounts reported in prior year financial years that
have a material effect in the current interim period
There are no significant changes in estimates of amounts reported in prior interim periods of the
current financial year or changes in estimates of amounts reported in prior year financial years that
have a material effect in the current interim period.
Any material events subsequent to the end of the interim period that have not been reflected in
the financial statements for the interim period
There are no material events subsequent to the end of the interim period that have not been reflected in
the financial statements for the interim period.
Effects of changes in the composition of the issuer during the interim period, including business
combinations, acquisition or disposal of subsidiaries and long-term investments, restructuring,
and discontinuing operations
There are no significant effects of changes in the composition of the issuer during the interim period,
including business combinations, acquisition or disposal of subsidiaries and long-term investments,
restructuring, and discontinuing operations.
Changes in contingent liabilities or contingent assets since the last balance sheet date
There are no contingent liabilities or contingent assets recorded since the last balance sheet date.
Any Known Trend or Events or Uncertainties (Material Impact on Net Sales or Revenues or
Income from Continuing Operations)
There are no known trends, events or uncertainties that have a material effect on the net sales or
revenues or income from continuing operations.

7
Any Significant Elements of Income or Loss that did not arise from Registrant’s Continuing
Operations
There are no significant elements of income or loss that did not arise from registrant’s continuing
operations.
Causes for any Material Changes from Period to Period in One or More Line of the Registrant's
Financial Statements
Financial Condition (March 31, 2018 vs December 31, 2017)
1. Increase in Cash and Cash Equivalents was substantially due to sales, collection of receivables and
shift of funds to shorter period investments.
2. Decrease in Short-term Cash Investments was substantially due to shift of funds to shorter period
placements, partial payment of notes payable, payment of cost of operations, development of
projects and acquisition of land for future development.
3. Increase in Installment Contracts Receivables was due to sales of real estate properties.
4. Net decrease in Other Receivables was substantially due to collection of advances to customers.
5. Decrease in Real Estate Properties for Sale was due to sales of real estate properties and transfer to
investment properties.
6. Increase in Investments in Trust Fund was due to additional contribution to the trust fund.
7. Decrease in Prepaid Income Tax was due to application to first quarter of 2018 income tax
payable.
8. Increase in Real Estate Properties for Future Development was due to acquisition of land for future
development and other development costs incurred.
9. Decrease in Investment Properties was due to depreciation of buildings for lease.
10. Decrease in Property and Equipment was due to depreciation.
11. Increase in Deferred Income Tax Assets – net was due to increase in realized gain on sale of real
estate transactions and higher accrued expenses of CLDI.
12. Decrease in Other Asset - Current was due to utilization of input VAT and amortization of prepaid
real estate tax.
13. Decrease in Accounts Payable and Accrued Expenses was due to partial payment of trade
payables.
14. Decrease in Notes Payable was due to settlement of matured notes payable.
15. Increase in Income Tax Payable was due to higher taxable income.
16. Decrease in Deferred Tax Liabilities – net was primarily due to decrease in unrealized gain on real
estate transactions.
17. Increase in Retained Earnings was due to net income.
18. Decrease in Net Changes in Fair Value of Investments was due to decrease in market value of
available-for-sale financial assets.
19. Increase in Non-Controlling Interest was due to net income of subsidiaries.
Results of Operation (March 31, 2018 vs March 31, 2017)
1. Increase in Sales of Real Estate was primarily due to higher sales and construction
accomplishment of Pines Peak Tower II and North Residences.
2. Increase in Financial Income was due to higher interest income from sale of real estate properties
and long-term cash investments.
3. Increase in Rent Income was due to rentals earned from the new building for lease, CityNet
Central, and additional lease contracts entered by the Parent Company.
4. Increase in Other Income was due to the increase in value of repossessed real estate properties for
sale.
5. Increase in Cost of Real Estate Sales was due to higher sales of real estate properties.
8
6. Increase in Operating Expenses was due to higher sales and increase in personnel expenses,
depreciation, professional fees, outside services, repairs and maintenance, rent expense, brokers’
commission and other operating expenses.
7. Increase in Financial Expenses was due to lower capitalized interest.
8. Increase in Other Expenses was due to higher adjustment of prior years’ income from forfeited
units.
9. Increase in Provision for Income Tax was due to higher revenues.
10. Increase in Net Income was primarily due to higher revenues.
Any seasonal aspects that had a material effect on the financial condition and results of
operation
There were no seasonal aspects that had a material effect on the financial condition and results of
operations.
Compliance to Philippine Accounting Standard (PAS) 34, Interim Financial Reporting
The Group’s unaudited interim consolidated financial statements is in compliance with Philippine
Accounting Standard (PAS) 34, Interim Financial Reporting. The same accounting policies and
methods of computation are followed as compared with the most recent annual audited consolidated
financial statements. However, the unaudited interim consolidated financial statements as of
March 31, 2018 do not include all of the information and disclosures required in the annual audited
consolidated financial statements and therefore, should be read in conjunction with the annual audited
consolidated financial statements as of and for the year ended December 31, 2017. There are no any
events or transactions that are material to an understanding of the current interim period.
PART II – OTHER INFORMATION
Disclosures not made under SEC Form 17-C
There are no reports that were not made under SEC Form 17-C.
SIGNATURES
Pursuant to the requirements of tl-re Securities Regulation Code, the issuer has duly caused this report to besigned on its behalfby the undersigned thereunto duly authorized.
By: CITYLAND DEVELOPMENT CORPORATION
Date: s-g*r( Date: S-q- rlRudy CoSenior Vice President ,/ Contpliance ()/fiaer
\1, /
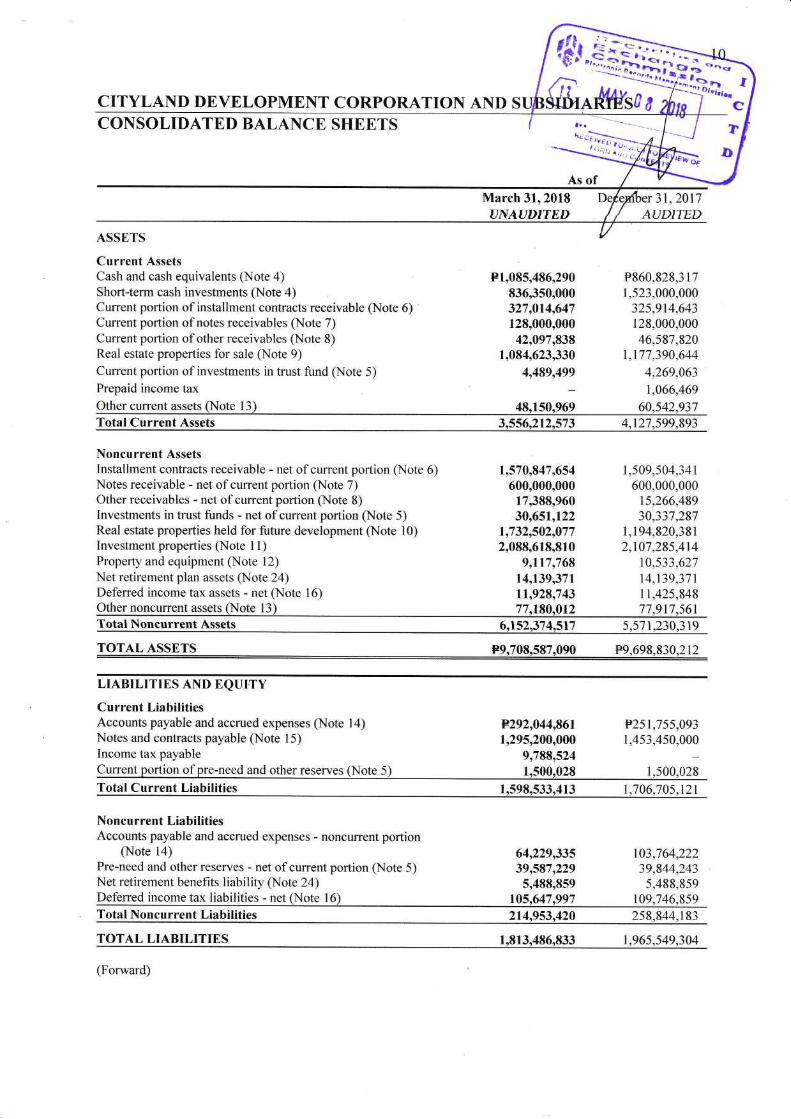
tr',fuCITYLAND DEVELOPMENT CORPORATION ANDCONSOLIDATED BALANCE SHEETS
^"Pg<:.,;As of
ASSETS
Current AssetsCash and cash equivalents (Note zl)
Shorl-term cash investnrents (Note 4)Curent portion of installment contracts receivable (Note 6)Current portion of notes receivables (Note 7)Current portion of other receivabies (Note 8)Real estate properties fbr sale (Note 9)Current portion of investments in trust fund (Note 5)Prepaid income tax
Other current assets (Note 13)
March 31,2018UNAUDITED
F1,085,486,290836,350,000327,014,647129,000,000
.d2,097,838
1,084,623,330
4,4gg,4gg
48,150,969
31.2011AUDITED
F860,828.3171.523.000,000
325,9t4,643i 28,000,00046,587,820
1,171.390.644
4.269"063
1,466,469
64.542,931Total Current Assets 3,556,212,573 4.127,599,893
Noncurrent AssetsInstalhnent contracts receivable - net ofcurrent portion (Note 6)Notes receivable - net of curent portion (Note 7)Other receivables - net of current portion (Note 8)Investments in trust f'unds - net of current portion (Note 5)Real estate propefiies held for tuture development (Note 10)Investment properties (Note 1 1)
Proper-ty and equipment (Note 12)
Net retirement plan assets (Note 24)Defened income tax assets - net (Note 16)Other noncurrert assets (Note 13)
1,570,847,654600,000,000
17,388,96034,651,122
7,732,502,0772,088,618,810
9,117,76814,139,371t\928,74377,180,A12
I ,509.504,34 i600.000.000
t5^266,48930,337.287
1,19,t.820.3 8l2,107.285.414
10.533.627t 4,139.37lr 1.425,84877,911,561
Total Noncurrent Assets 6,152,374,517 5"571.230.3 r9
TOTALASSETS P9,708,587.090 F9,698,830,212
LIABILITIES AND EQUITY
Current LiabilitiesAccounts payable and accrued expenses (Note l4)Notes and contracts payable (Note I5)lncome tax payable
P292,044,8611,295,200,000
9,799,524
P251.755,0931,45i,450.000
1.500,028Current portion ofpre-need and other reserves O{ote 5) 1,500.028Total Current Liabilities 1.598,533.413 1.746^705.t21
Noncurrent LiabilitiesAccounts payable and accrued expenses - noncurrent portion
(Note l4)Pre-need and other reserves - net ofcurrent porlion (Note 5)Net retirement benefits liability (Nore 24)Delerred income tax liabilities - net (Note l6)
64,229,33539,587,229
5,4gg,g5g105,647,997
t43,764,22239.844.243
5.488.859t09.746.8-59
Total Noncurrent Liabilities 214,953,420 258"844,183
TOTAL LIABTLTTTES 1"813,486,833
(Forward)
1.965.549,304

11
CITYLAND DEVELOPMENT CORPORATION AND SUBSIDIARIES
CONSOLIDATED BALANCE SHEETS
As of
March 31, 2018
UNAUDITED
December 31, 2017
AUDITED
Equity Attributable to Equity Holders of the Parent Company
Capital stock - P=1 par value (Note 17)
Authorized - 4,000,000,000 shares
Issued - 3,940,001,648 shares held by 668 equity holders as
of March 31, 2018 and 669 equity holders as of
December 31, 2017 P=3,940,001,648 P=3,940,001,648
Additional paid-in capital 7,277,651 7,277,651
Net changes in fair values of available-for-
sale financial assets (Note 13) (704,719) 1,251,555
Accumulated re-measurement loss on defined benefit
plan – net of deferred income tax effect (21,328,742) (21,328,742)
Retained earnings (Note 17) 2,989,581,190 2,842,649,954
Treasury stock – 1,937,947 shares (31,429,574) (31,429,574)
6,883,397,454 6,738,422,492
Non-controlling Interests (Note 18) 1,011,702,803 994,858,416
Total Equity 7,895,100,257 7,733,280,908
TOTAL LIABILITIES AND EQUITY P=9,708,587,090 P=9,698,830,212
See accompanying Notes to Consolidated Financial Statements.

12
CITYLAND DEVELOPMENT CORPORATION AND SUBSIDIARIES
CONSOLIDATED STATEMENTS OF INCOME
UNAUDITED FOR THE 3-MONTH ENDING
March 31, 2018 March 31, 2017
REVENUE
Sales from real estate properties P=375,502,263 P=279,859,397
Financial income (Note 22) 86,632,187 76,670,280
Rent income (Note 11) 30,092,354 27,261,482
Other income (Note 23) 27,995,949 24,930,886
520,222,753 408,722,045
COST AND EXPENSES
Cost of real estate sales (Note 9) 171,453,636 156,944,234
Operating expenses (Note 19) 133,941,935 108,505,920
Financial expenses (Note 22) 3,666,323 2,045,572
Other expenses (Note 23) 14,117,641 6,999,103
323,179,535 274,494,829
INCOME BEFORE INCOME TAX
197,043,218
134,227,216
PROVISION FOR INCOME TAX (Note 25)
36,068,168
30,181,053
NET INCOME
P=160,975,050
P=104,046,163
Attributable to:
Equity holders of the Parent Company P=143,918,073 P=98,502,002
Non-controlling interests (Note 18) 17,056,977 5,544,161
P=160,975,050 P=104,046,163
BASIC/DILUTED EARNINGS PER
SHARE (Note 27) P=0.04 P=0.03
See accompanying Notes to Consolidated Financial Statements.
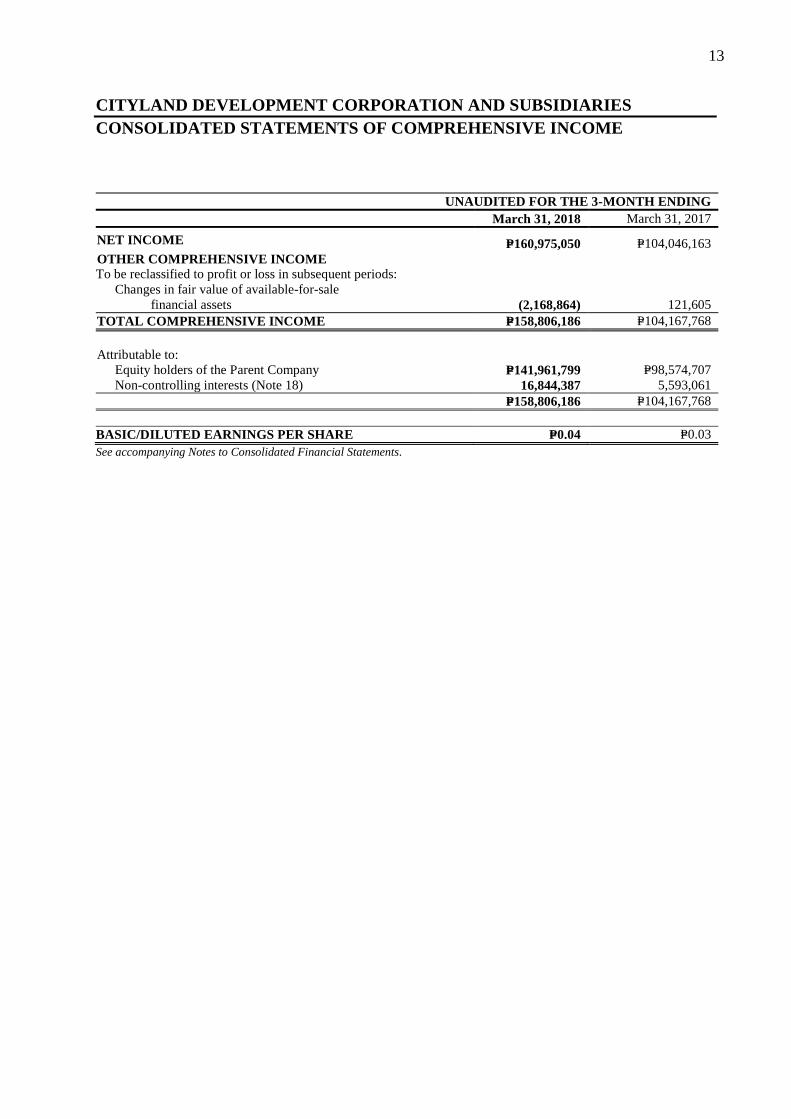
13
CITYLAND DEVELOPMENT CORPORATION AND SUBSIDIARIES
CONSOLIDATED STATEMENTS OF COMPREHENSIVE INCOME
UNAUDITED FOR THE 3-MONTH ENDING
March 31, 2018 March 31, 2017
NET INCOME
P=160,975,050
P=104,046,163
OTHER COMPREHENSIVE INCOME
To be reclassified to profit or loss in subsequent periods:
Changes in fair value of available-for-sale
financial assets
(2,168,864)
121,605
TOTAL COMPREHENSIVE INCOME P=158,806,186 P=104,167,768
Attributable to:
Equity holders of the Parent Company P=141,961,799 P=98,574,707
Non-controlling interests (Note 18) 16,844,387 5,593,061
P=158,806,186 P=104,167,768
BASIC/DILUTED EARNINGS PER SHARE P=0.04 P=0.03
See accompanying Notes to Consolidated Financial Statements.
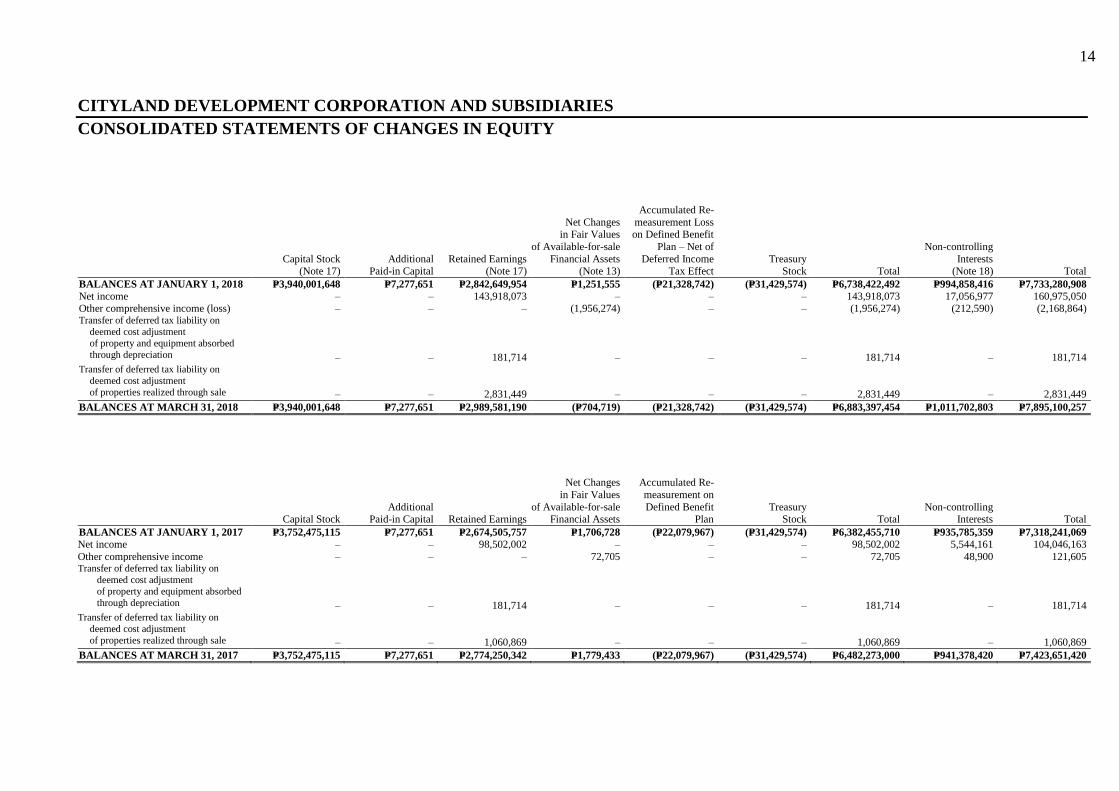
14
CITYLAND DEVELOPMENT CORPORATION AND SUBSIDIARIES
CONSOLIDATED STATEMENTS OF CHANGES IN EQUITY
Capital Stock (Note 17)
Additional Paid-in Capital
Retained Earnings (Note 17)
Net Changes in Fair Values
of Available-for-sale
Financial Assets (Note 13)
Accumulated Re-
measurement Loss on Defined Benefit
Plan – Net of
Deferred Income Tax Effect
Treasury Stock
Total
Non-controlling
Interests (Note 18)
Total
BALANCES AT JANUARY 1, 2018 P=3,940,001,648 P=7,277,651 P=2,842,649,954 P=1,251,555 (P=21,328,742) (P=31,429,574) P=6,738,422,492 P=994,858,416 P=7,733,280,908
Net income – – 143,918,073 – – – 143,918,073 17,056,977 160,975,050 Other comprehensive income (loss) – – – (1,956,274) – – (1,956,274) (212,590) (2,168,864) Transfer of deferred tax liability on
deemed cost adjustment
of property and equipment absorbed
through depreciation
–
–
181,714
–
–
–
181,714
–
181,714 Transfer of deferred tax liability on
deemed cost adjustment
of properties realized through sale
–
–
2,831,449
–
–
–
2,831,449
–
2,831,449
BALANCES AT MARCH 31, 2018 P=3,940,001,648 P=7,277,651 P=2,989,581,190 (P=704,719) (P=21,328,742) (P=31,429,574) P=6,883,397,454 P=1,011,702,803 P=7,895,100,257
Capital Stock
Additional Paid-in Capital
Retained Earnings
Net Changes
in Fair Values
of Available-for-sale Financial Assets
Accumulated Re-
measurement on
Defined Benefit Plan
Treasury Stock
Total
Non-controlling Interests
Total
BALANCES AT JANUARY 1, 2017 P=3,752,475,115 P=7,277,651 P=2,674,505,757 P=1,706,728 (P=22,079,967) (P=31,429,574) P=6,382,455,710 P=935,785,359 P=7,318,241,069
Net income – – 98,502,002 – – – 98,502,002 5,544,161 104,046,163
Other comprehensive income – – – 72,705 – – 72,705 48,900 121,605 Transfer of deferred tax liability on
deemed cost adjustment
of property and equipment absorbed
through depreciation
–
–
181,714
–
–
–
181,714
–
181,714 Transfer of deferred tax liability on
deemed cost adjustment
of properties realized through sale
–
–
1,060,869
–
–
–
1,060,869
–
1,060,869
BALANCES AT MARCH 31, 2017 P=3,752,475,115 P=7,277,651 P=2,774,250,342 P=1,779,433 (P=22,079,967) (P=31,429,574) P=6,482,273,000 P=941,378,420 P=7,423,651,420

15
CITYLAND DEVELOPMENT CORPORATION AND SUBSIDIARIES
CONSOLIDATED STATEMENTS OF CASH FLOWS
UNAUDITED
As of March 31, 2018 As of March 31, 2017
CASH FLOWS FROM OPERATING ACTIVITIES
Income before income tax P=197,043,218 P=134,227,216
Adjustments for:
Interest income (86,628,548) (76,667,016)
Depreciation and amortization 16,636,839 5,923,695
Interest expense – net of amounts capitalized 3,416,073 1,696,022
Trust fund income 76,448 (1,585,025)
Dividend income (3,639) (3,264)
Operating income before working capital changes 130,540,391 63,591,628
Decrease (increase) in:
Installment contracts receivable – net (62,443,317) 103,356,994
Other receivables 3,040,263 889,276
Real estate properties for sale 85,938,446 139,768,489
Real estate properties for future development (523,517,636) (2,261,368)
Deposits and other assets 12,939,850 7,154,432
Pre-need reserves 426,701 (1,497,535)
Decrease in accounts payable and accrued expenses (3,411,894) (155,455,591)
Cash generated from (used in) operations (356,487,196) 155,546,325
Interest received 85,955,796 79,473,051
Income taxes paid (27,868,238) (18,295,796)
Net cash flows from (used in) operating activities (298,399,638) 216,723,580
CASH FLOWS FROM INVESTING ACTIVITIES
Proceeds from matured short-term cash investments 686,650,000 954,872,353
Additions to investment properties (3,138,866) (71,445,414)
Dividends received 3,639 3,264
Contributions to investment in trust fund (2,207,162) (2,897)
Purchase of notes receivable – (28,000,000)
Net cash flows from investing activities 681,307,611 855,427,306
CASH FLOWS FROM FINANCING ACTIVITIES
Availments of commercial papers 1,469,950,000 1,739,250,000
Payment of commercial papers (1,638,200,000) (1,887,800,000)
Interest paid – (2,113,226)
Availments of contracts payable 10,000,000 –
Net cash flows used in financing activities (158,250,000) (150,663,226)
NET INCREASE IN CASH AND CASH EQUIVALENTS
224,657,973
921,487,660
CASH AND CASH EQUIVALENTS AT BEGINNING
OF PERIOD
860,828,317
1,788,970,275
CASH AND CASH EQUIVALENTS AT END OF
THE PERIOD
P=1,085,486,290
P=2,710,457,935
16
CITYLAND DEVELOPMENT CORPORATION AND SUBSIDIARIES
NOTES TO CONSOLIDATED FINANCIAL STATEMENTS
1. Corporate Information
Cityland Development Corporation (the Parent Company) was incorporated in the Philippines on
January 31, 1978. It has two subsidiaries, Cityplans, Incorporated (CPI) and City & Land
Developers, Incorporated (CLDI), a publicly listed company, which are all incorporated and
domiciled in the Philippines. The Parent Company’s and CLDI’s primary business purpose is to
acquire, develop, improve, subdivide, cultivate, lease, sublease, sell, exchange, barter and/or dispose
of agricultural, industrial, commercial, residential and other real properties, as well as to construct,
improve, lease, sublease, sell and/or dispose of houses, buildings and other improvements thereon,
and to manage and operate subdivisions and housing projects or otherwise engage in the financing
and trading of real estate. CPI is engaged in the business of establishing, organizing, developing,
maintaining, conducting, operating, marketing and selling pension plans. The Parent Company is
50.98% owned by Cityland, Inc. (CI), the ultimate parent company incorporated in the Philippines,
which also prepares consolidated financial statements.
The Parent Company’s registered office and principal place of business is 2/F Cityland
Condominium 10 Tower I, 156 H. V. Dela Costa Street, Makati City.
2. Summary of Significant Accounting and Financial Reporting Policies
Basis of Preparation
The consolidated financial statements of the Group have been prepared using the historical cost
basis, except for financial assets at fair value through profit or loss and available-for-sale financial
assets that have been measured at fair values. These consolidated financial statements are presented
in Philippine peso (Peso), which is the Group’s functional currency, and rounded to the nearest Peso
except when otherwise indicated.
Statement of Compliance
The consolidated financial statements have been prepared in compliance with Philippine Financial
Reporting Standards (PFRSs).
Changes in Accounting Policies
The accounting policies adopted are consistent with those of the previous financial year, except that
the Group has adopted the following new accounting pronouncements starting January 1, 2017.
Amendments to PFRS 12, Disclosure of Interests in Other Entities, Clarification of the Scope of
the Standard (Part of Annual Improvements to PFRSs 2014 - 2016 Cycle)
The amendments clarify that the disclosure requirements in PFRS 12, other than those relating to
summarized financial information, apply to an entity’s interest in a subsidiary, a joint venture or
an associate (or a portion of its interest in a joint venture or an associate) that is classified (or
included in a disposal group that is classified) as held for sale.
Adoption of these amendments did not have any impact on the Group’s financial statements.

17
Amendments to PAS 7, Statement of Cash Flows, Disclosure Initiative
The amendments require entities to provide disclosure of changes in their liabilities arising from
financing activities, including both changes arising from cash flows and non-cash changes (such
as foreign exchange gains or losses).
The Group has provided the required information in Notes 14 and 15 to the consolidated
financial statements.
Amendments to PAS 12, Income Taxes, Recognition of Deferred Tax Assets for Unrealized
Losses
The amendments clarify that an entity needs to consider whether tax law restricts the sources of
taxable profits against which it may make deductions upon the reversal of the deductible
temporary difference related to unrealized losses. Furthermore, the amendments provide
guidance on how an entity should determine future taxable profits and explain the circumstances
in which taxable profit may include the recovery of some assets for more than their carrying
amount.
The adoption of the amendments has no effect on the Group’s financial position and
performance as the Group has no deductible temporary differences or assets that are in the scope
of the amendments.
Basis of Consolidation
The consolidated financial statements consist of the financial statements of the Parent Company and
its subsidiaries as of the period presented. The financial statements of the subsidiaries are prepared
for the same reporting year as the Parent Company using consistent accounting policies.
These subsidiaries, all incorporated and domiciled in the Philippines, and the percentage of
ownership of the Parent Company as of March 31, 2018 and December 31, 2017 are as follows:
Percentage of Nature of
Ownership Activity
CPI 90.81 Pre-need pension plans
CLDI 49.73 Real estate
The registered office and principal place of business of CLDI is 3/F Cityland Condominium 10
Tower I, 156 H. V. Dela Costa Street, Makati City. On the other hand, registered office address of
CPI is at 3/F Cityland Condo. 10 Tower 2, 154 H.V. Dela Costa St., Salcedo Village, Makati City.
A subsidiary is an entity that is controlled by the Parent Company. The Group controls an investee
if, and only if, the Group has:
Power over the investee (i.e., existing rights that give it the current ability to direct the relevant
activities of the investee)
Exposure, or rights, to variable returns from its involvement with the investee
The ability to use its power over the investee to affect its returns

18
When the Parent Company has less than a majority of the voting or similar rights of an investee, the
Group considers all relevant facts and circumstances in assessing whether it has power over an
investee, including:
the contractual arrangement with the other vote holders of the investee
rights arising from other contractual arrangements
the Parent Company’s voting rights and potential voting rights
The Parent Company re-assesses whether or not it controls an investee if facts and circumstances
indicate that there are changes to one or more of the three elements of control.
Consolidation of a subsidiary begins when the Group obtains control over the subsidiary and ceases
when the Group loses control of the subsidiary. Assets, liabilities, income and expenses of a
subsidiary acquired or disposed of during the year are included in the consolidated financial
statements from the date the Group gains control until the date the Group ceases to control the
subsidiary.
Profit or loss and each component of other comprehensive income (OCI) are attributed to the equity
holders of the parent of the Group and to the non-controlling interests, even if this results in the non-
controlling interests having a deficit balance. When necessary, adjustments are made to the financial
statements of subsidiaries to bring their accounting policies in line with the Group’s accounting
policies. All intra-group assets and liabilities, equity, income, expenses and cash flows relating to
transactions between members of the Group are eliminated in full on consolidation.
A change in the ownership interest of a subsidiary, without a loss of control, is accounted for as an
equity transaction. In such circumstances, the carrying amounts of the controlling and non-
controlling interests shall be adjusted to reflect the changes in their relative interests in the
subsidiary. Any difference between the amount by which the non-controlling interests is adjusted
and the fair value of the consideration paid or received shall be recognized directly in equity and
attributed to the owners of the parent.
If the Group loses control over a subsidiary, it derecognizes the related assets (including goodwill, if
any), liabilities, non-controlling interest and other components of equity while any resultant gain or
loss is recognized in profit or loss. Any investment retained is recognized at fair value.
Non-controlling Interests
Non-controlling interests represent the interests in the subsidiaries not held by the Parent Company,
and are presented separately in the consolidated statement of income, consolidated statement of
comprehensive income and within the equity section of the consolidated balance sheet, separate
from the Parent Company’s equity.
Current versus Noncurrent Classification
The Group presents assets and liabilities in balance sheet based on current/noncurrent classification.
An asset as current when it is:
Expected to be realized or intended to be sold or consumed in normal operating cycle
Held primarily for the purpose of trading
Expected to be realized within 12 months after the reporting period, or
Cash or cash equivalent unless restricted from being exchanged or used to settle a liability for at
least 12 months after the reporting period.
All other assets are classified as noncurrent.

19
A liability is current when:
It is expected to be settled in normal operating cycle
It is held primarily for the purpose of trading
It is due to be settled within 12 months after the reporting period, or
There is no unconditional right to defer the settlement of the liability for at least 12 months after
the reporting period.
The Group classifies all other liabilities as noncurrent.
Deferred income tax assets and liabilities are classified as noncurrent assets and liabilities,
respectively.
Cash and Cash Equivalents
Cash includes cash on hand and in banks. Cash equivalents are short-term, highly liquid investments
that are readily convertible to known amounts of cash with original maturities of three months or less
from dates of acquisition, and are subject to an insignificant risk of change in value.
Short-term Cash Investments
Short-term cash investments are investments with maturities of more than three months but not
exceeding one year from dates of acquisition.
Fair Value Measurement
Fair value is the price that would be received to sell an asset or paid to transfer a liability in an
orderly transaction between market participants at the measurement date. The fair value
measurement is based on the presumption that the transaction to sell the asset or transfer the liability
takes place either:
In the principal market for the asset or liability, or
In the absence of a principal market, in the most advantageous market for the asset or liability
The principal or the most advantageous market must be accessible to the Group.
The fair value of an asset or a liability is measured using the assumptions that market participant’s
would use when pricing the asset or liability, assuming that market participants act in their economic
best interest.
A fair value measurement of a non-financial asset takes into account a market participant's ability to
generate economic benefits by using the asset in its highest and best use or by selling it to another
market participant that would use the asset in its highest and best use.
The Group uses valuation techniques that are appropriate in the circumstances and for which
sufficient data are available to measure fair value, maximizing the use of relevant observable inputs
and minimizing the use of unobservable inputs.
All assets and liabilities for which fair value is measured or disclosed in the consolidated financial
statements are categorized within the fair value hierarchy, described as follows, based on the lowest
level of input that is significant to the fair value measurement as a whole:
Level 1 - Quoted (unadjusted) market prices in active markets for identical assets or liabilities
Level 2 - Valuation techniques for which the lowest level of input that is significant to the fair
value measurement is directly or indirectly observable

20
Level 3 - Valuation techniques for which the lowest level of input that is significant to the fair
value measurement is unobservable
For assets and liabilities that are recognized in the consolidated financial statements on a recurring
basis, the Group determines whether transfers have occurred between Levels in the hierarchy by re-
assessing categorization (based on the lowest level input that is significant to the fair value
measurement as a whole) at the end of each reporting period.
Financial Assets and Financial Liabilities
Date of recognition
The Group recognizes a financial asset or a financial liability in the consolidated balance sheet when
it becomes a party to the contractual provisions of the instrument. In the case of a regular way
purchase or sale of financial assets, recognition and derecognition, as applicable, is done using
settlement date accounting.
Initial recognition of financial instruments
Financial instruments are recognized initially at fair value, which is the fair value of the
consideration given (in case of an asset) or received (in case of a liability). The initial measurement
of financial instruments, except for those designated at fair value through profit or loss, includes
directly attributable transaction costs.
Classification of financial instruments
Subsequent to initial recognition, the Group classifies its financial instruments in the following
categories: financial assets and financial liabilities at fair value through profit or loss, loans and
receivables, held-to-maturity investments, available-for-sale financial assets and other financial
liabilities. The classification depends on the purpose for which the instruments are acquired and
whether they are quoted in an active market. Management determines the classification at initial
recognition and, where allowed and appropriate, re-evaluates this classification at each end of
reporting period.
a. Financial Assets or Financial Liabilities at Fair Value through Profit or Loss
A financial asset or financial liability is classified in this category if acquired principally for the
purpose of selling or repurchasing in the near term or upon initial recognition, it is designated by
management as at fair value through profit or loss.
Financial assets or financial liabilities classified in this category are designated as at fair value
through profit or loss by management on initial recognition when any of the following criteria
are met:
The designation eliminates or significantly reduces the inconsistent treatment that would
otherwise arise from measuring the assets or liabilities or recognizing gains or losses on
them on a different basis; or
The assets or liabilities are part of a group of financial assets or financial liabilities, or both
financial assets and financial liabilities, which are managed and their performance is
evaluated on a fair value basis, in accordance with a documented risk management or
investment strategy; or
The financial instrument contains an embedded derivative, unless the embedded derivative
does not significantly modify the cash flows or it is clear, with little or no analysis, that it
would not be separately recorded.

21
Financial assets or financial liabilities classified under this category are carried at fair value in
the consolidated balance sheet. Changes in the fair value of such assets and liabilities are
recognized in the consolidated statement of income.
The Group designated its investments in trust funds as financial assets at fair value through profit
or loss. The Group’s investments in trust funds directly relate to the Pre-need Reserves
accounts.
b. Loans and Receivables
Loans and receivables are non-derivative financial assets with fixed or determinable payments
that are not quoted in an active market. They arise when the Group provides money, goods or
services directly to a debtor with no intention of trading the receivables. Loans and receivables
are carried at amortized cost in the consolidated balance sheet. Amortization is determined using
the effective interest method.
The Group’s loans and receivables consist of cash in banks, cash equivalents, short-term cash
investments, installment contracts receivable, notes receivable, refundable deposits, escrow
deposit and other receivables.
c. Held-to-maturity Investments
Held-to-maturity investments are non-derivative financial assets with fixed or determinable
payments and fixed maturities wherein the Group has the positive intention and ability to hold to
maturity. Held-to-maturity investments are carried at amortized cost in the consolidated balance
sheet. Amortization is determined using the effective interest method.
The Group has no held-to-maturity investments as of March 31, 2018 and December 31, 2017.
d. Available-for-sale Financial Assets
Available-for-sale financial assets are non-derivatives that are either designated in this category
or not classified in any of the other categories. Available-for-sale financial assets are carried at
fair value in the consolidated balance sheet. Changes in the fair value of such assets are
accounted in the consolidated statement of comprehensive income and in equity.
The Group’s available-for-sale financial assets consist of investments in quoted equity securities
that are traded in liquid markets, held for the purpose of investing in liquid funds and not
generally intended to be retained on a long-term basis.
e. Other Financial Liabilities
Other financial liabilities are non-derivative financial liabilities with fixed or determinable
payments that are not quoted in an active market. They arise when the Group owes money,
goods or services directly to a creditor with no intention of trading the payables. Other financial
liabilities are carried at cost or amortized cost in the consolidated balance sheet. Amortization is
determined using the effective interest method.
The Group’s other financial liabilities consist of accounts payable and accrued expenses and
notes and contracts payable.
Cash dividend distributions to stockholders are recognized as financial liabilities when the
dividends are approved by the BOD.
22
Offsetting of financial instruments
Financial assets and financial liabilities are offset and the net amount is reported in the consolidated
balance sheet if, and only if, there is a currently enforceable legal right to offset the recognized
amounts and there is an intention to settle on a net basis, or to realize the asset and settle the liability
simultaneously. The Group assesses that it has a currently enforceable right of offset if the right is
not contingent on a future event, and is legally enforceable in the normal course of business, event of
default, and event of insolvency or bankruptcy of the Group and all of the counterparties.
“Day 1” difference
Where the transaction price in a non-active market is different from the fair value from other
observable current market transactions in the same instrument or based on a valuation technique
whose variables include only data from observable market, the Group recognizes the difference
between the transaction price and fair value (a “Day 1” difference) in the consolidated statement of
income unless it qualifies for recognition as some other type of asset. In cases where inputs are
made of data which are not observable, the difference between the transaction price and model value
is only recognized in the consolidated statement of income when the inputs become observable or
when the instrument is derecognized. For each transaction, the Group determines the appropriate
method of recognizing the “Day 1” difference.
Derecognition of Financial Assets and Financial Liabilities
Financial assets
A financial asset (or, where applicable, a part of a financial asset or part of a group of similar
financial assets) is derecognized when:
the rights to receive cash flows from the asset have expired; or
the Group retains the right to receive cash flows from the asset, but has assumed an obligation to
pay them in full without material delay to a third party under a “pass-through” arrangement; or
the Group has transferred its right to receive cash flows from the asset and either (a) has
transferred substantially all the risks and rewards of the asset, or (b) has neither transferred nor
retained substantially all the risks and rewards of the asset, but has transferred control of the
asset.
Where the Group has transferred its rights to receive cash flows from a financial asset and has
neither transferred nor retained substantially all the risks and rewards of the financial asset nor
transferred control of the financial asset, the asset is recognized to the extent of the Group’s
continuing involvement in the financial asset. Continuing involvement that takes the form of a
guarantee over the transferred financial asset is measured at the lower of the original carrying
amount of the asset and the maximum amount of consideration that the Group could be required to
repay.
Financial liabilities
A financial liability is derecognized when the obligation under the liability is discharged, cancelled
or has expired.
Where an existing financial liability is replaced by another from the same lender on substantially
different terms, or the terms of an existing liability are substantially modified, such an exchange or
modification is treated as a derecognition of the original liability and the recognition of a new
liability, and the difference in the respective carrying amounts is recognized in the consolidated
statement of income.
Impairment of Financial Assets
The Group assesses at each reporting period whether a financial asset or a group of financial assets is
impaired.

23
Assets carried at amortized cost
The Group first assesses whether objective evidence of impairment exists individually for financial
assets that are individually significant, and individually or collectively for financial assets that are
not individually significant. Objective evidence includes observable data that comes to the attention
of the Group about loss events such as, but not limited to significant financial difficulty of the
counterparty, a breach of contract, such as default or delinquency in interest or principal payments,
probability that the borrower will enter bankruptcy or other financial reorganization. If it is
determined that no objective evidence of impairment exists for an individually assessed financial
asset, whether significant or not, the asset is included in the group of financial assets with similar
credit risk and characteristics and that group of financial assets is collectively assessed for
impairment. Financial assets that are individually assessed for impairment and for which an
impairment loss is recognized are not included in a collective assessment of impairment.
The impairment assessment is performed at each end of reporting period. For the purpose of
collective evaluation of impairment, financial assets are grouped on the basis of such credit risk
characteristics such as customer type, payment history, past-due status and term.
If there is an objective evidence that an impairment loss on loans and receivables carried at
amortized cost has been incurred, the amount of loss is measured as the difference between the
asset’s carrying amount and the present value of estimated future cash flows (excluding future credit
losses that have not been incurred) discounted at the financial asset’s original effective interest rates
(i.e., the effective interest rate computed at initial recognition). The carrying amount of the asset
shall be reduced either directly or through the use of an allowance account. The amount of loss, if
any, is recognized in the consolidated statement of income.
If, in a subsequent period, the amount of the impairment loss decreases and the decrease can be
related objectively to an event occurring after the impairment was recognized, the previously
recognized impairment loss is reversed by adjusting the allowance account. The amount of the
reversal is recognized in the consolidated statement of income. Interest income continues to be
accrued on the reduced carrying amount based on the original effective interest rate of the asset.
Loans together with the associated allowance are written off when there is no realistic prospect of
future recovery and all collateral, if any, has been realized or has been transferred to the Group. If in
a subsequent year, the amount of the estimated impairment loss increases or decreases because of an
event occurring after the impairment was recognized, the previously recognized impairment loss is
increased or reduced by adjusting the allowance for impairment losses account. If a future write-off
is later recovered, the recovery is recognized in the consolidated statement of income under “Other
income” account. Any subsequent reversal of an impairment loss is recognized in the consolidated
statement of income to the extent that the carrying value of the asset does not exceed its amortized
cost at reversal date.
Assets carried at cost
If there is an objective evidence that an impairment loss of an unquoted equity instrument that is not
carried at fair value because its fair value cannot be reliably measured, or a derivative asset that is
linked to and must be settled by delivery of such an unquoted equity instrument has been incurred,
the amount of loss is measured as the difference between the asset’s carrying amount and the present
value of estimated future cash flows discounted at the current market rate of return for a similar
financial asset.
Available-for-sale financial assets
In the case of debt instruments classified as available-for-sale financial assets, impairment is
assessed based on the same criteria as financial assets carried at amortized cost. Future interest
income is based on the reduced carrying amount and is accrued based on the rate of interest used to
discount future cash flows for the purpose of measuring impairment loss. Such accrual is recorded
24
as part of “Financial income” in the consolidated statement of income. If, in subsequent year, the
fair value of a debt instrument increases and the increase can be objectively related to an event
occurring after the impairment loss was recognized in the consolidated statement of income, the
impairment loss is reversed through the consolidated statement of income.
In case of equity investments classified as available-for-sale financial assets, this would include a
significant or prolonged decline in the fair value of the investments below its cost. Where there is
evidence of impairment, the cumulative loss - measured as the difference between the acquisition
cost and the current fair value, less any impairment loss on that financial asset previously recognized
in the consolidated statement of income - is removed from equity and recognized in the consolidated
statement of income. Increases in fair value after impairment are recognized in the consolidated
statement of comprehensive income and directly in the consolidated statement of changes in equity.
Real Estate Properties for Sale and Real Estate Properties Held for Future Development
Property acquired or being constructed for sale in the ordinary course of business and held for future
development, rather than to be held for rental or capital appreciation, is classified as real estate
properties for sale and real estate properties held for future development and are measured at the
lower of cost and net realizable value (NRV).
Cost includes:
Land cost
Amounts paid to contractors for construction
Borrowing costs directly attributable to the acquisition, development and construction of real
estate projects
Planning and design costs, costs of site preparation, professional fees, property transfer taxes,
construction overheads and other related costs.
NRV is the estimated selling price in the ordinary course of the business, based on market prices at
the reporting date, less estimated costs to complete and the estimated costs necessary to make the
sale. The Group recognizes the effect of revisions in the total project cost estimates in the year in
which these changes become known.
Upon commencement of development, the real estate properties held for future development is
transferred to real estate properties for sale.
Upon repossession, real estate properties for sale arising from sale cancellations and forfeitures are
measured at fair value less estimated costs to make the sale. Any resulting gain or loss is credited or
charged to “Other income” or “Other expenses”, respectively, in the consolidated statement of
income.
Investments in Trust Funds
The trust fund assets and liabilities are recognized in accordance with the provisions of the
applicable PAS and PFRSs and their interpretations.
Investments in trust funds are restricted to cover the Group’s pre-need reserves. These are classified
as current assets to the extent of the currently maturing pre-need reserves. The remaining portion is
classified as noncurrent assets in the consolidated balance sheet.
Investment Properties
Investment properties which represent real estate properties for lease and capital appreciation are
measured initially at cost, including transaction costs. The carrying amount includes the cost of
replacing part of existing investment properties at the time that cost is incurred if the recognition
criteria are met, and excludes the costs of day-to-day servicing of the property. The carrying values

25
of revalued properties transferred to investment properties on January 1, 2004 were considered as the
assets’ deemed cost as of said date.
Subsequent to initial measurement, investment properties, except land, are carried at cost less
accumulated depreciation and amortization and any impairment in value. Land is carried at cost less
any impairment in value. Buildings for lease are depreciated over their useful life of 25 years while
machineries and equipment are depreciated over their useful life of 5 to 15 years using the straight-
line method.
Investment properties are derecognized when either they have been disposed of or when the property
is permanently withdrawn from use and no future economic benefit is expected from its disposal.
Any gains or losses on the retirement or disposal of investment properties are recognized in the
consolidated statement of income in the year of retirement or disposal.
Transfers are made to investment properties when, and only when, there is a change in use,
evidenced by ending of owner-occupation, commencement of an operating lease to another party, or
ending of construction or development. Transfers are made from investment properties when, and
only when, there is a change in use, evidenced by commencement of owner-occupation or
commencement of development with a view to sale.
Transfers between investment properties, owner-occupied property and inventories do not change
the carrying amount of the property transferred and they do not change the cost of that property for
measurement or disclosure purposes.
Construction in progress is stated at cost. This includes costs of construction and other direct costs
related to the investment property being constructed. Construction in progress is not depreciated
until such time when the relevant assets are complete and ready for use. When such construction is
completed and assets are ready for use, the costs of the said assets are transferred to specific
classification under “Investment properties” account.
Property and Equipment
Property and equipment, except for office premises, are stated at cost less accumulated depreciation
and any impairment in value. Office premises are stated at appraised values (asset’s deemed cost) as
determined by SEC-accredited and independent firms of appraisers at the date of transition to
PFRSs, less accumulated depreciation and any impairment in value. Subsequent additions to office
premises are stated at cost less accumulated depreciation and any impairment in value.
The initial cost of property and equipment consists of the purchase price and any directly attributable
cost of bringing the assets to their working condition and location for their intended use.
Expenditures incurred after the property and equipment have been put into operations, such as
repairs and maintenance costs, are normally charged to the consolidated statement of income in the
period in which the costs are incurred. In situations where it can be clearly demonstrated that the
expenditures have resulted in an increase in the future economic benefits expected to be obtained
from the use of an item of property and equipment beyond its originally assessed standard of
performance, the expenditures are capitalized as an additional cost of property and equipment.
Depreciation of an item of property and equipment begins when the asset becomes available for use,
i.e., when it is in the location and condition necessary for it to be capable of operating in the manner
intended by management. Depreciation ceases at the earlier of the date that the item is classified as
held for sale (or included in a disposal group that is classified as held for sale) in accordance with
PFRS 5, Noncurrent Assets Held for Sale and Discontinued Operations, and the date the asset is
derecognized.

26
Depreciation is computed using the straight-line method over the estimated useful lives of the
properties as follows:
Years
Office premises:
Building 25
Furniture, fixtures and office equipment 5-15
Transportation and other equipment 5
The assets’ useful lives and depreciation method are reviewed periodically to ensure that these are
consistent with the expected pattern of economic benefits from items of property and equipment.
When property and equipment are sold or retired, the cost and related accumulated depreciation and
any impairment in value are removed from the accounts, and any gains or losses from their disposal
is included in the consolidated statement of income.
Impairment of Nonfinancial Assets
The carrying values of real estate properties held for future development, investment properties and
property and equipment are reviewed for impairment when events or changes in circumstances
indicate that the carrying values may not be recoverable. If any such indication exists and where the
carrying value exceeds the estimated recoverable amount, the assets are either written down to their
recoverable amount or provided with valuation allowance. An asset’s recoverable amount is the
higher of an asset’s or cash-generating unit’s (CGU) fair value less costs of disposal and its value-in-
use. Impairment losses, if any, are recognized in the consolidated statement of income.
In assessing value in use, the estimated future cash flows are discounted to their present value using
a pre-tax discount rate that reflects current market assessments of the time value of money and the
risks specific to the asset. In determining fair value less costs of disposal, recent market transactions
are taken into account.
The Group assesses at each reporting period whether there is an indication that previously
recognized impairment losses may no longer exist or may have decreased. The Group considers
external and internal sources of information in its assessment of the reversal of previously
recognized impairment losses. A previously recognized impairment loss is reversed only if there
has been a change in the estimates used to determine the asset’s recoverable amount since the last
impairment loss was recognized. If that is the case, the carrying amount of the asset is increased to
its recoverable amount. That increased amount cannot exceed the carrying amount that would have
been determined, net of depreciation, had no impairment loss been recognized for the asset in prior
years. Such reversal is recognized in the consolidated statement of income. After such a reversal,
the depreciation is adjusted in future periods to allocate the asset’s revised carrying amount, less any
residual value, on a systematic basis over its remaining useful life.
Value-added Tax (VAT)
Revenues, expenses, and assets are recognized net of the amount of VAT, if applicable.
When VAT from sales of goods and/or services (output VAT) exceeds VAT passed on from
purchases of goods or services (input VAT), the excess is recognized as payable in the consolidated
balance sheet. When VAT passed on from purchases of goods or services (input VAT) exceeds VAT
from sales of goods and/or services (output VAT), the excess is recognized as an asset in the
consolidated balance sheet to the extent of the recoverable amount.

27
The net amount of VAT recoverable from or payable to, the taxation authority is included as part of
“Other current assets” or “Accounts payable and accrued expenses,” respectively, in the consolidated
balance sheet.
Pre-Need Reserves (PNR)
PNR for pension plans are calculated on the basis of the methodology and assumptions set out in
Pre-need Rule 31, as Amended, as follows:
The amount of provision is the present value of the funding expected to be required to settle the
obligation with due consideration of the different probabilities as follows:
i. Provision for termination values applying the inactivity and surrender rate experience of
CPI.
ii. The liability is equivalent to the present value of future maturity benefits reduced by the
present value of future trust fund contributions required per Product Model discounted at the
lower of attainable rate or discount rate provided by the Insurance Commission (IC) for
SEC-approved plans and the pricing discount rate for IC-approved plans.
The rates of surrender, cancellation, reinstatement, utilization, and inflation considered the actual
experience of CPI in the last three years.
The computation of the foregoing assumptions has been validated by the internal qualified
actuary of CPI.
Based on CPI’s experience, the probability of pre-termination or surrender of fully paid plans is
below 5% and therefore considered insignificant. The derecognition of liability shall be recorded
at pre-termination date.
In 2017 and 2016, CPI follows IC Circular Letter No. 23-2012 dated November 28, 2012 which sets
the guidelines for the discount rate to be used in the valuation of PNR as follows:
Discount interest rate for the PNR
The transitory discount interest rate per year shall be used in the valuation of PNR shall not
exceed the lower of the attainable rates as certified by the trustee banks and the following rates
below:
Year Discount interest rate
2012 – 2016 8.00%
2017 7.25%
2018 6.50%
2019 and onwards 6.00%
Transitory PNR (TPNR)
In effecting the transition in the valuation of reserves for old basket of plans, IC shall prescribe a
PNR with a maximum transition period of 10 years. For each of the pre-need plan categories, the
TPNR shall be computed annually on the old basket of plans outstanding at the end of each year
from 2012 to 2021 using the discount interest rates provided above. If the actual trust fund
balance is higher than or equal to the resulting PNR then the liability set-up shall be the PNR.
However, if the resulting PNR is greater than the actual trust fund balance at the end of the year,
TPNR shall be computed.
The actual trust fund balance shall be the trust fund balance at the end of the year net of any
receivables by CPI from the trustee for the contractual benefits outstanding as of the end of the
year.

28
The TPNR liability shall be recognized each year. As of March 31, 2018 and
December 31, 2017, CPI’s actual trust fund balance is lower than the resulting PNR
(see Note 5).
Other reserves
CPI sets up other provisions in accordance with PAS 37, Provisions, Contingent Liabilities and
Contingent Assets, to cover obligations such as Insurance Premium Reserves (IPR), pension bonus,
and trust fund deficiency.
Unless the IC shall so specifically require, CPI may, at its option, set up other provisions as a
prudent measure.
Capital Stock
Capital stock is measured at par value for all shares issued and outstanding. When the Parent
Company issues more than one class of stock, a separate account is maintained for each class of
stock and the number of shares issued. Incremental costs incurred directly attributable to the
issuance of new shares are shown in equity as a deduction from proceeds, net of tax.
When the shares are sold at premium, the difference between the proceeds and the par value is
credited to the “Additional paid-in capital” account. When shares are issued for a consideration
other than cash, the proceeds are measured by the fair value of the consideration received. In case
the shares are issued to extinguish or settle the liability of the Parent Company, the shares shall be
measured either at the fair value of the shares issued or fair value of the liability settled, whichever is
more reliably determinable.
Retained Earnings
Retained earnings represent the cumulative balance of net income or loss, dividend distributions,
effects of changes in accounting policy and other capital adjustments.
Unappropriated retained earnings represent that portion of retained earnings which can be declared
as dividends to stockholders after adjustments for any unrealized items which are considered not
available for dividend declaration. Appropriated retained earnings represent that portion of retained
earnings which has been restricted and therefore is not available for any dividend declaration.
The retained earnings include deemed cost adjustments on real estate properties for sale, investment
properties and property and equipment that arose when the Group transitioned to PFRSs in 2005.
The deemed cost adjustment will be realized through depreciation in profit or loss for depreciable
assets (property and equipment and investment properties) and through sale for inventories
(classified under real estate properties for sale) and land (classified under investment properties).
The deferred income tax liability on deemed cost adjustments on investment properties, property and
equipment and inventories sold under Income Tax Holiday (ITH) projects is transferred to retained
earnings upon realization while the deferred income tax liability on deemed cost adjustments on
inventories sold under regular tax regime is transferred to consolidated statement of income upon
sale.
Dividend Distributions
Cash dividends on common shares are deducted from retained earnings upon declaration by the
BOD.
Stock dividends on common shares are measured based on the total par value of declared stock
dividend. Stock dividends are deducted from retained earnings when the BOD’s declaration is
ratified by the stockholders of the Group. Unissued stock dividends are recorded as stock dividends
distributable and credited to capital stock upon issuance.

29
Dividends for the year that are declared after the end of the reporting period but before the approval
for issuance of consolidated financial statements are dealt with as an event after the reporting period.
Treasury Stock
Treasury stock is the Group’s own equity instruments that has been issued and then reacquired but
not yet cancelled. Treasury stock are recognized at cost and deducted from equity. No gain or loss
is recognized in the consolidated statement of income on the purchase, sale, issue or cancellation of
the Group’s own equity instruments. Any difference between the carrying amount and the
consideration, if reissued, is recognized as additional paid-in capital.
Revenue and Costs Recognition
Revenue is recognized to the extent that it is probable that the economic benefit will flow to the
Group and the amount of revenue can be reliably measured. For sales of real estate properties, the
Group assesses whether it is probable that the economic benefits will flow to the Group when the
sales prices are collectible. Revenue is measured at the fair value of the consideration received
excluding VAT. The Group assesses its revenue arrangements against specific criteria in order to
determine if it is acting as principal or agent. The Group has concluded that it is acting as a principal
in all of its revenue arrangements. The following specific recognition criteria must also be met
before revenue is recognized:
Sales of real estate properties
Revenue from sales of completed real estate properties and undeveloped land is accounted for using
the full accrual method. Under the full accrual method, revenue is recognized when the risks and
rewards of ownership on the properties have been passed to the buyer and the amount of revenue can
be measured reliably.
In accordance with Philippine Interpretations Committee Q&A 2006-01, Revenue Recognition for
Sales of Property Units under Pre-completion Contracts, the percentage-of-completion (POC)
method is used to recognize income from sales of real estate properties when the Group has material
obligations under the sales contract to complete the project after the property is sold. The Group
starts recognizing revenue under the POC method when the equitable interest has been transferred to
the buyer, construction is beyond preliminary stage (i.e., engineering, design work, construction
contracts execution, site clearance and preparation, excavation and the building foundation are
finished) and the costs incurred or to be incurred can be measured reliably. Under this method,
revenue on sale is recognized as the related obligations are fulfilled, measured principally on the
basis of the estimated completion of a physical proportion of the contract work.
If the criteria of full accrual and POC method are not satisfied and when the license to sell and
certificate of registration for a project are not yet issued by the Housing and Land Use Regulatory
Board (HLURB), any cash received by the Group is recorded as part of “Customers’ deposits”
account which is included under “Accounts payable and accrued expenses” in the consolidated
balance sheet until all the conditions for recognizing the sale are met.
Cost of real estate sales
Cost of real estate sales is recognized consistent with the revenue recognition method applied. Cost
of real estate properties sold before completion is determined using the POC used for revenue
recognition applied on the acquisition cost of the land plus the total estimated development costs of
the property.
The cost of inventory recognized in profit or loss on disposal (cost of real estate sales) is determined
with reference to the specific and allocated costs incurred on the sold property taking into account
the POC. The cost of real estate sales also include the estimated development costs to complete the

30
real estate property, as determined by independent project engineers, and taking into account the
POC. The accrued development costs account is presented under “Accounts payable and accrued
expenses” in the consolidated balance sheet.
Any changes in estimated development costs used in the determination of the amount of revenue and
expenses are recognized in consolidated statement of income in the period in which the change is
made.
Sales of pre-need plans
Premiums from sale of pre-need plans, included under “Other income” account in the consolidated
statement of income are recognized as earned when collected.
Cost of contracts issued
This account pertains to (a) the increase or decrease in PNR as at the current year as compared to the
provision for the same period of the previous year; (b) amount of trust funds contributed during the
year including any trust fund deficiency; and (c) documentary stamp tax and SEC registration fees.
If there is a decrease in the PNR as a result of new information or developments, the amount shall be
deducted from the cost of contracts issued in the current period. In case of material prior period
errors, the requirements of PAS 8, Accounting Policies, Changes in Accounting Estimates and
Errors, shall be complied with by CPI.
Interest income
Interest income from cash in banks, cash equivalents, cash investments, installment contracts
receivable and notes receivable is recognized as the interest accrues taking into account the effective
yield on interest.
Dividend income
Dividend income is recognized when the Group’s right to receive the payment is established.
Trust fund income
Trust fund income mainly pertains to rental income on investment properties under the trust fund
account, as well as, trading gains and losses from buying and selling and changes in fair value of
financial assets and financial liabilities categorized upon initial recognition as at fair value through
profit or loss investments under the trust fund account.
Operating leases – Group as a lessor
Operating leases represent those leases under which substantially all the risks and rewards of
ownership of the leased assets remain with the lessors. Rent income from operating leases is
recognized as income when earned on a straight-line basis over the term of the lease agreement.
Initial direct costs incurred in negotiating and arranging an operating lease are added to the carrying
amount of the leased asset and recognized over the term on the same basis as rental income.
Contingent rents are recognized as revenue in the period in which they are earned.
The determination of whether an arrangement is, or contains, a lease is based on the substance of the
arrangement at inception date whether the fulfillment of the arrangement is dependent on the use of a
specific asset or assets or the arrangement conveys a right to use the asset. A reassessment is made
after inception of the lease only if one of the following applies:
(a) there is a change in contractual terms, other than a renewal or extension of the arrangement;
(b) a renewal option is exercised or extension granted, unless the term of the renewal or extension
was initially included in the lease term;

31
(c) there is a change in the determination of whether fulfillment is dependent on a specified asset;
or
(d) there is substantial change to the asset.
Where a reassessment is made, lease accounting shall commence or cease from the date when the
change in circumstances gave rise to the reassessment for scenarios (a), (c), or (d) and at the date of
renewal or extension period for scenario (b).
Operating expenses
Operating expenses constitute costs of administering the business. These costs are expensed as
incurred.
Financial expenses
Financial expenses consist of interest incurred on notes and contracts payable. Interest attributable to
a qualifying asset is capitalized as part of the cost of the asset while others are expensed as incurred.
Interest costs are capitalized if they are directly attributable to the acquisition, development and
construction of real estate projects as part of the cost of such projects. Capitalization of interest cost
(1) commences when the activities to prepare the assets for their intended use are in progress and
expenditures and interest costs are being incurred, (2) is suspended during extended periods in which
active development is interrupted, and (3) ceases when substantially all the activities
necessary to prepare the assets for their intended use are complete. If the carrying amount of the
asset exceeds its recoverable amount, an impairment loss is recorded.
Other income and other expenses
Other income and other expenses pertain mainly to the gain or loss, respectively, arising from
forfeiture or cancellation of prior years’ real estate sales.
Retirement Benefits Cost
The net defined benefit liability or asset is the aggregate of the present value of the defined benefit
obligation at the end of the reporting period reduced by the fair value of plan assets (if any), adjusted
for any effect of limiting a net defined benefit asset to the asset ceiling. The asset ceiling is the
present value of any economic benefits available in the form of refunds from the plan or reductions
in future contributions to the plan.
The cost of providing benefits under the defined benefit plans is actuarially determined using the
projected unit credit method.
Retirement benefits cost comprises the following:
Service cost
Net interest on the net defined benefit liability or asset
Re-measurements of net defined benefit liability or asset
Service costs which include current service costs, past service costs and gains or losses on non-
routine settlements are recognized as expense in the consolidated statement of income. Past service
costs are recognized when plan amendment or curtailment occurs. These amounts are calculated
periodically by independent qualified actuary.
Net interest on the net defined benefit liability or asset is the change during the period in the net
defined benefit liability or asset that arises from the passage of time which is determined by applying
the discount rate based on government bonds to the net defined benefit liability or asset. Net interest
on the net defined benefit liability or asset is recognized as expense or income in the consolidated
statement of income.

32
Re-measurements comprising actuarial gains and losses, return on plan assets and any change in the
effect of the asset ceiling (excluding net interest on defined benefit liability) are recognized
immediately in the consolidated statement of comprehensive income in the period in which they
arise. Re-measurements are not reclassified to consolidated statement of income in subsequent
periods.
Plan assets are assets that are held by a long-term employee benefit fund. Plan assets are not
available to the creditors of the Group, nor can they be paid directly to the Group. Fair value of plan
assets is based on market price information. When no market price is available, the fair value of
plan assets is estimated by discounting expected future cash flows using a discount rate that reflects
both the risk associated with the plan assets and the maturity or expected disposal date of those
assets (or, if they have no maturity, the expected period until the settlement of the related
obligations). If the fair value of the plan assets is higher than the present value of the defined benefit
obligation, the measurement of the resulting defined benefit asset is limited to the present value of
economic benefits available in the form of refunds from the plan or reductions in future
contributions to the plan.
The Group’s right to be reimbursed of some or all of the expenditure required to settle a defined
benefit obligation is recognized as a separate asset at fair value when and only when reimbursement
is virtually certain.
Employee leave entitlement
Employee entitlements to annual leave are recognized as a liability when they are earned by the
employees. The undiscounted liability for leave expected to be settled within 12 months after the end
of the reporting period is recognized for services rendered by employees up to the end of the
reporting period. Accumulating leave credits which can be utilized anytime when needed or
converted to cash upon employee separation (i.e., resignation or retirement) are presented at its
discounted amount as “Accounts payable and accrued expenses - noncurrent portion” in the
consolidated balance sheet.
Provisions and Contingencies
Provisions are recognized when the Group has a present obligation (legal or constructive) as a result
of a past event, it is probable that an outflow of resources embodying economic benefits will be
required to settle the obligation and a reliable estimate can be made of the amount of the obligation.
When the Group expects some or all of a provision to be reimbursed, for example, under an
insurance contract, the reimbursement is recognized as a separate asset, but only when the
reimbursement is virtually certain. The expense relating to a provision is presented in the
consolidated statement of income net of any reimbursement. If the effect of the time value of money
is material, provisions are determined by discounting the effective future cash flows at a pre-tax rate
that reflects current market assessment of the time value of money and where appropriate, the risks
specific to the liability. Where discounting is used, the increase in the provision due to the passage
of time is recognized as an interest expense.
Contingent liabilities are not recognized in the consolidated financial statements. They are disclosed
unless the possibility of an outflow of resources embodying economic benefits is remote. A
contingent asset is not recognized in the consolidated financial statements but disclosed in the notes
to consolidated financial statements when an inflow of economic benefits is probable.
Income Taxes
Current income tax
Current income tax assets and liabilities for the current and prior periods are measured at the amount
expected to be recovered from or paid to the taxation authorities. The tax rates and the tax laws used

33
to compute the amount are those that are enacted or substantively enacted at the end of reporting
period.
Current income tax for current and prior periods shall, to the extent unpaid, be recognized as a
liability under “Income tax payable” account in the consolidated balance sheet. If the amount
already paid in respect of current and prior periods exceeds the amount due for those periods, the
excess shall be recognized as an asset under “Other current assets” account in the consolidated
balance sheet.
Deferred income tax
Deferred income tax is recognized on all temporary differences at the end of reporting period
between the tax bases of assets and liabilities and their carrying amounts for financial reporting
purposes.
Deferred income tax liabilities are recognized for all taxable temporary differences, except (a) where
the deferred income tax liability arises from the initial recognition of goodwill or of an asset or
liability in a transaction that is not a business combination and, at the time of the transaction, affects
neither the accounting profit nor taxable profit or loss; and (b) in respect of taxable temporary
differences associated with investments in subsidiaries, associates and interests in joint ventures,
where the timing of the reversal of the temporary differences can be controlled and it is probable that
the temporary differences will not reverse in the foreseeable future.
Deferred income tax assets are recognized for all deductible temporary differences to the extent that
it is probable that sufficient future taxable profits will be available against which the deductible
temporary differences can be utilized. Deferred income tax assets and deferred income tax liabilities
are not recognized when it arises from the initial recognition of an asset or liability in a transaction
that is not a business combination and, at the time of the transaction, affects neither the accounting
profit nor taxable profit or loss.
The carrying amount of deferred income tax assets is reviewed at each end of reporting period and
reduced to the extent that it is no longer probable that sufficient future taxable profits will be
available to allow all or part of the deferred income tax assets to be utilized. Unrecognized deferred
income tax assets are reassessed at each end of reporting period and are recognized to the extent that
it has become probable that sufficient future taxable profits will allow the deferred income tax asset
to be recovered.
Deferred income tax assets and deferred income tax liabilities are measured at the tax rates that are
expected to apply to the period when the asset is realized or the liability is settled, based on tax rates
and tax laws that have been enacted or substantively enacted at the end of reporting period.
Deferred income tax relating to items recognized directly in equity is recognized in equity and those
directly in comprehensive income such as re-measurement of defined benefit plan are recognized in
the consolidated statement of comprehensive income and not in the consolidated statement of
income.
Deferred income tax assets and deferred income tax liabilities are offset, if a legally enforceable
right exists to offset current tax assets against current income tax liabilities and the deferred taxes
relate to the same taxable entity and the same taxation authority.
Other Comprehensive Income
Other comprehensive income comprises items of income and expense that are not recognized in the
consolidated statement of income in accordance with PFRSs. Other comprehensive income of the
Group includes gains and losses on fair value changes of available-for-sale financial assets,

34
re-measurements comprising actuarial gains and losses, return on plan assets and any change in the
effect of the asset ceiling (excluding net interest on defined benefit liability).
Earnings Per Share
Basic earnings per share is computed by dividing the net income for the year attributable to equity
holders of the Parent Company by the weighted average number of ordinary shares issued and
outstanding after considering the retroactive effect, if any, of stock dividends declared during the
year.
Diluted earnings per share is calculated by dividing the net income for the year attributable to equity
holders of the Parent Company by the weighted average number of ordinary shares
outstanding during the year, excluding treasury shares and adjusted for the effects of all dilutive
potential common shares, if any. In determining both the basic and diluted earnings per share, the
effect of stock dividends, if any, is accounted for retrospectively.
Segment Reporting
The Group’s operating businesses are organized and managed separately according to the nature of
the products and services provided, with each segment representing a strategic business unit that
offers different products and serves different markets. Financial information on business segments is
presented in Note 29 to the consolidated financial statements. The Group’s asset-producing
revenues are located in the Philippines (i.e., one geographical location). Therefore, geographical
segment information is no longer presented.
Events After the Reporting Period
Post year-end events that provide additional information about the Group’s position at the end of
reporting period (adjusting events) are reflected in the consolidated financial statements. Post year-
end events that are not adjusting events are disclosed in the notes to the consolidated financial
statements when material.
Standards Issued but not yet Effective
Pronouncements issued but not yet effective are listed below. Unless otherwise indicated, the Group
does not expect that the future adoption of the said pronouncements to have a significant impact on
its consolidated financial statements. The Group intends to adopt the following pronouncements
when they become effective.
Effective beginning on or after January 1, 2018
Amendments to PFRS 2, Share-based Payment, Classification and Measurement of Share-based
Payment Transactions
The amendments to PFRS 2 address three main areas: the effects of vesting conditions on the
measurement of a cash-settled share-based payment transaction; the classification of a share-
based payment transaction with net settlement features for withholding tax obligations; and the
accounting where a modification to the terms and conditions of a share-based payment
transaction changes its classification from cash settled to equity settled.
On adoption, entities are required to apply the amendments without restating prior periods, but
retrospective application is permitted if elected for all three amendments and if other criteria are
met. Early application of the amendments is permitted.
The Group has assessed that the adoption of these amendments will not have any impact on the
2018 consolidated financial statements.

35
PFRS 9, Financial Instruments
PFRS 9 reflects all phases of the financial instruments project and replaces PAS 39, Financial
Instruments: Recognition and Measurement, and all previous versions of PFRS 9. The standard
introduces new requirements for classification and measurement, impairment, and hedge
accounting. Retrospective application is required but providing comparative information is not
compulsory. For hedge accounting, the requirements are generally applied prospectively, with
some limited exceptions.
The Group is currently assessing the impact of PFRS 9 and believes that this new standard will
affect the consolidated financial statements.
Amendments to PFRS 4, Insurance Contracts, Applying PFRS 9, Financial Instruments, with
PFRS 4
The amendments address concerns arising from implementing PFRS 9, the new financial
instruments standard before implementing the new insurance contracts standard. The
amendments introduce two options for entities issuing insurance contracts: a temporary
exemption from applying PFRS 9 and an overlay approach. The temporary exemption is first
applied for reporting periods beginning on or after January 1, 2018. An entity may elect the
overlay approach when it first applies PFRS 9 and apply that approach retrospectively to
financial assets designated on transition to PFRS 9. The entity restates comparative information
reflecting the overlay approach if, and only if, the entity restates comparative information when
applying PFRS 9.
The amendments are not applicable to the Group since it has no activities that are predominantly
connected with insurance or issue insurance contracts.
PFRS 15, Revenue from Contracts with Customers
PFRS 15 establishes a new five-step model that will apply to revenue arising from contracts with
customers. Under PFRS 15, revenue is recognized at an amount that reflects the consideration to
which an entity expects to be entitled in exchange for transferring goods or services to a
customer. The principles in PFRS 15 provide a more structured approach to measuring and
recognizing revenue.
The new revenue standard is applicable to all entities and will supersede all current revenue
recognition requirements under PFRSs. Either a full retrospective application or a modified
retrospective application is required for annual periods beginning on or after January 1, 2018.
Early adoption is permitted.
The Group is currently assessing the impact of PFRS 15 and believes that this new revenue
standard will affect the consolidated financial statements.
Amendments to PAS 28, Measuring an Associate or Joint Venture at Fair Value (Part of Annual
Improvements to PFRSs 2014 - 2016 Cycle)
The amendments clarify that an entity that is a venture capital organization, or other qualifying
entity, may elect, at initial recognition on an investment-by-investment basis, to measure its
investments in associates and joint ventures at fair value through profit or loss. They also clarify
that if an entity that is not itself an investment entity has an interest in an associate or joint
venture that is an investment entity, the entity may, when applying the equity method, elect to
retain the fair value measurement applied by that investment entity associate or joint venture to

36
the investment entity associate’s or joint venture’s interests in subsidiaries. This election is made
separately for each investment entity associate or joint venture, at the later of the date on which
(a) the investment entity associate or joint venture is initially recognized; (b) the associate or
joint venture becomes an investment entity; and (c) the investment entity associate or joint
venture first becomes a parent.
The amendments should be applied retrospectively, with earlier application permitted.
These amendments are not expected to have any impact on the Group.
Amendments to PAS 40, Investment Property, Transfers of Investment Property
The amendments clarify when an entity should transfer property, including property under
construction or development into, or out of investment property. The amendments state that a
change in use occurs when the property meets, or ceases to meet, the definition of investment
property and there is evidence of the change in use. A mere change in management’s intentions
for the use of a property does not provide evidence of a change in use. The amendments should
be applied prospectively to changes in use that occur on or after the beginning of the annual
reporting period in which the entity first applies the amendments. Retrospective application is
only permitted if this is possible without the use of hindsight.
Since the Group’s current practice is in line with the clarifications issued, the Group does not
expect any effect on its consolidated financial statements upon adoption of these amendments.
Philippine Interpretation IFRIC-22, Foreign Currency Transactions and Advance Consideration
The interpretation clarifies that, in determining the spot exchange rate to use on initial
recognition of the related asset, expense or income (or part of it) on the derecognition of a non-
monetary asset or non-monetary liability relating to advance consideration, the date of the
transaction is the date on which an entity initially recognizes the nonmonetary asset or non-
monetary liability arising from the advance consideration. If there are multiple payments or
receipts in advance, then the entity must determine a date of the transactions for each payment or
receipt of advance consideration. Entities may apply the amendments on a fully retrospective
basis. Alternatively, an entity may apply the interpretation prospectively to all assets, expenses
and income in its scope that are initially recognized on or after the beginning of the reporting
period in which the entity first applies the interpretation or the beginning of a prior reporting
period presented as comparative information in the financial statements of the reporting period
in which the entity first applies the interpretation.
Since the Group’s current practice is in line with the clarifications issued, the Group does not
expect any effect on its financial statements upon adoption of this interpretation.
Effective beginning on or after January 1, 2019
Amendments to PFRS 9, Prepayment Features with Negative Compensation
The amendments to PFRS 9 allow debt instruments with negative compensation prepayment
features to be measured at amortized cost or fair value through other comprehensive income. An
entity shall apply these amendments for annual reporting periods beginning on or after
January 1, 2019. Earlier application is permitted.
These amendments are not expected to have any impact on the Group.

37
PFRS 16, Leases
PFRS 16 sets out the principles for the recognition, measurement, presentation and disclosure of
leases and requires lessees to account for all leases under a single on-balance sheet model similar
to the accounting for finance leases under PAS 17, Leases. The standard includes two
recognition exemptions for lessees – leases of ’low-value’ assets (e.g., personal computers) and
short-term leases (i.e., leases with a lease term of 12 months or less). At the commencement date
of a lease, a lessee will recognize a liability to make lease payments (i.e., the lease liability) and
an asset representing the right to use the underlying asset during the lease term (i.e., the right-of-
use asset). Lessees will be required to separately recognize the interest expense on the lease
liability and the depreciation expense on the right-of-use asset.
Lessees will be also required to remeasure the lease liability upon the occurrence of certain
events (e.g., a change in the lease term, a change in future lease payments resulting from a
change in an index or rate used to determine those payments). The lessee will generally
recognize the amount of the remeasurement of the lease liability as an adjustment to the right-of-
use asset.
Lessor accounting under PFRS 16 is substantially unchanged from today’s accounting under
PAS 17. Lessors will continue to classify all leases using the same classification principle as in
PAS 17 and distinguish between two types of leases: operating and finance leases.
PFRS 16 also requires lessees and lessors to make more extensive disclosures than under
PAS 17.
Early application is permitted, but not before an entity applies PFRS 15. A lessee can choose to
apply the standard using either a full retrospective or a modified retrospective approach. The
standard’s transition provisions permit certain reliefs.
The Group is currently assessing the impact of adopting PFRS 16.
Amendments to PAS 28, Long-term Interests in Associates and Joint Ventures
The amendments to PAS 28 clarify that entities should account for long-term interests in an
associate or joint venture to which the equity method is not applied using PFRS 9. An entity
shall apply these amendments for annual reporting periods beginning on or after
January 1, 2019. Earlier application is permitted.
These amendments are not expected to have any impact on the Group.
Philippine Interpretation IFRIC-23, Uncertainty over Income Tax Treatments
The interpretation addresses the accounting for income taxes when tax treatments involve
uncertainty that affects the application of PAS 12 and does not apply to taxes or levies outside
the scope of PAS 12, nor does it specifically include requirements relating to interest and
penalties associated with uncertain tax treatments.
The interpretation specifically addresses the following:
Whether an entity considers uncertain tax treatments separately
The assumptions an entity makes about the examination of tax treatments by taxation
authorities

38
How an entity determines taxable profit (tax loss), tax bases, unused tax losses, unused tax
credits and tax rates
How an entity considers changes in facts and circumstances
An entity must determine whether to consider each uncertain tax treatment separately or together
with one or more other uncertain tax treatments. The approach that better predicts the resolution
of the uncertainty should be followed.
The Group is currently assessing the impact of adopting this interpretation.
Deferred Effectivity
Amendments to PFRS 10 and PAS 28, Sale or Contribution of Assets between an Investor and its
Associate or Joint Venture
The amendments address the conflict between PFRS 10 and PAS 28 in dealing with the loss of
control of a subsidiary that is sold or contributed to an associate or joint venture. The
amendments clarify that a full gain or loss is recognized when a transfer to an associate or joint
venture involves a business as defined in PFRS 3, Business Combinations. Any gain or loss
resulting from the sale or contribution of assets that does not constitute a business, however, is
recognized only to the extent of unrelated investors’ interests in the associate or joint venture.
On January 13, 2016, the Financial Reporting Standards Council postponed the original effective
date of January 1, 2016 of the said amendments until the International Accounting Standards
Board has completed its broader review of the research project on equity accounting that may
result in the simplification of accounting for such transactions and of other aspects of accounting
for associates and joint ventures.
3. Significant Accounting Judgments, Estimates and Assumptions
The preparation of the consolidated financial statements requires management to make judgments,
estimates and assumptions that affect the amounts reported in the consolidated financial statements
and accompanying notes.
In the opinion of management, these consolidated financial statements reflect all adjustments
necessary to present fairly the results for the period presented. Actual results could differ from such
estimates.
Judgments
In the process of applying the Group’s accounting policies, management has made the following
judgments, apart from those involving estimations, which has the most significant effect on the
amounts recognized in the consolidated financial statements:
Consolidation of CLDI in which the Group holds less than a majority of voting right (de facto
control)
The Group consolidates the accounts of CLDI since it considers that it controls CLDI even though it
owns less than 50% of voting interest. The factors that the Group considered in making this
determination include the size of its block of voting shares and the relative size and dispersion of
holdings by other stockholders. The Group is the single largest shareholder of CLDI with 49.73%
equity interest. The Parent Company, some of its stockholders and affiliates (whose stockholders

39
also own equity ownership in the Parent Company) collectively own more than 50% of the equity of
CLDI giving the Parent Company effective control over CLDI.
In addition, majority of the members of its governing body or its key management personnel are the
same as those of CLDI.
Revenue recognition
Selecting the appropriate revenue recognition method for particular real estate transaction requires
certain judgments based on the following, among others:
Buyer’s continuing commitment to the sales agreement
Collectability of the sales price is demonstrated by the buyer’s commitment to pay, which in turn
is supported by substantial initial and continuing investments that gives the buyer a sufficient
stake in the property that risk of loss through default motivates the buyer to honor the obligation.
Collectability is also assessed by considering factors such as the credit standing of the buyer,
age, and location of the property.
For sale of real estate properties, in determining whether the sales prices are collectible, the
Group considers that the initial payments from the buyer of about 10% would demonstrate the
buyer’s commitment to pay.
Stage of completion of the project
The Group commences the recognition of revenue from sale of uncompleted projects where the
POC method is used when the POC, as determined by independent project engineers, is at 10%.
At this stage, the Group considers that the construction has gone beyond preliminary stage, that
is, engineering, design work, construction contracts execution, site clearance and preparation,
excavation and the building foundation are completed.
Distinction between investment properties and owner-occupied properties
The Group determines whether a property qualifies as investment property. In making its judgment,
the Group considers whether the property generates cash flows largely independent of the other
assets held by an entity. Owner-occupied properties generate cash flows that are attributable not only
to the property but also to the other assets used for administrative purposes.
Some properties comprise a portion that is held to earn rentals or for capital appreciation and another
portion that is held for administrative purposes. If these portions cannot be sold separately at the
reporting date, the property is accounted for as investment property only if an insignificant portion is
held for administrative purposes. Judgment is applied in determining whether ancillary services are
so significant that a property does not qualify as investment property. The Group considers each
property separately in making its judgment.
Investment properties amounted to P=2.09 billion and P=2.11 billion as of March 31, 2018 and
December 31, 2017, respectively (see Note 11). Property and equipment amounted to P=9.12 million
and P=10.53 million as of March 31, 2018 and December 31, 2017, respectively (see Note 12).
Distinction between real estate properties for sale and investment properties
The Group determines whether a property is classified as for sale, for lease and for capital
appreciation.
Real estate properties which the Group develops and intends to sell on or before completion of
construction are classified as real estate properties for sale. Real estate properties for sale amounted
to P=1.08 billion and P=1.18 billion as of March 31, 2018 and December 31, 2017, respectively
(see Note 9). Real estate properties which are not occupied substantially for use by, or in the
40
operations of the Group, nor for sale in the ordinary course of business, but are held primarily to earn
rental income and capital appreciation are classified as investment properties. Investment properties
amounted to P=2.09 billion and P=2.11 billion as of March 31, 2018 and December 31, 2017,
respectively (see Note 11).
Distinction between real estate properties for sale and held for future development
The Group determines whether a property will be classified as real estate properties for sale or held
for future development. In making this judgment, the Group considers whether the property will be
sold in the normal operating cycle (real estate properties for sale) or whether it will be retained as
part of the Group’s strategic landbanking activities for development or sale in the medium or long-
term (real estate properties held for future development). Real estate properties for sale amounted to
P=1.08 billion and P=1.18 billion as of March 31, 2018 and December 31, 2017, respectively
(see Note 9). Real estate properties held for future development amounted to P=1.73 billion and
P=1.19 billion as of March 31, 2018 and December 31, 2017, respectively (see Note 10).
Estimates
The key assumptions concerning the future and other key sources of estimation uncertainty at the
end of reporting period, that have a significant risk of causing a material adjustment to the carrying
amounts of assets and liabilities within the next financial year are discussed below:
Revenue and cost recognition
The Group’s revenue recognition and cost policies require management to make use of estimates and
assumptions that may affect the reported amount of revenue and cost. The Group’s revenue from real
estate properties based on the POC is measured principally on the basis of the estimated completion
of a physical proportion of the contract work.
Estimation of POC of real estate projects
The Group estimates the POC of ongoing projects for purposes of accounting for the estimated costs
of development as well as revenue to be recognized. Actual costs of development could differ from
these estimates. Such estimates will be adjusted accordingly when the effects become reasonably
determinable. The POC is based on the technical evaluation of the independent project engineers as
well as management’s monitoring of the costs, progress and improvements of the projects. Sales of
real estate properties amounted to P=375.50 million and P=279.86 million as of March 31, 2018 and
March 31, 2017, respectively. Cost of real estate sales amounted to P=171.45 million and
P=156.94 million as of March 31, 2018 and March 31, 2017, respectively.
Estimation of allowance for impairment of receivables
The level of this allowance is evaluated by management based on past collection history and other
factors, which include, but not limited to the length of the Group’s relationship with customer, the
customer’s payment behavior, known market factors that affect the collectability of the accounts and
the fair value of real estate properties held as collaterals. As of March 31, 2018 and
December 31, 2017, installment contracts receivable, notes receivable and other receivables
aggregated to P=2.69 billion and P=2.63 billion, respectively. There was no impairment of receivables
in March 31, 2018 and December 31, 2017 (see Notes 6, 7 and 8).
Determination of net realizable value of real estate properties for sale and held for future
development
The Group’s estimates of net realizable value of real estate properties for sale and held for future
development are based on the most reliable evidence available at the time the estimates are made, or
the amount that the real estate properties for sale and held for future development are expected to be
realized. These estimates consider the fluctuations of price or cost directly relating to events
occurring after the end of the reporting period to the extent that such events confirm conditions
existing at the end of the period. A new assessment is made of net realizable value in each

41
subsequent period. When the circumstances that previously caused the real estate properties for sale
to be written down below cost no longer exist or when there is a clear evidence of an increase in net
realizable value because of changes in economic circumstances, the amount of the write-down is
reversed so that the new carrying amount is the lower of the cost and the revised net realizable value.
The Group’s real estate properties for sale as of March 31, 2018 and December 31, 2017 amounted
to P=1.08 billion and P=1.18 billion, respectively (see Note 9). On the other hand, the Group’s real
estate properties held for future development as of March 31, 2018 and December 31, 2017
amounted to P=1.73 billion and P=1.19 billion, respectively (see Note 10).
Estimation of useful lives of investment properties and property and equipment
The Group estimates the useful lives of investment properties and property and equipment based on
the internal technical evaluation and experience with similar assets. Estimated lives of investment
properties and property and equipment are reviewed periodically and updated if expectations differ
from previous estimates due to wear and tear, technical and commercial obsolescence and other
limits on the use of the assets. Net book value of depreciable investment properties as of
March 31, 2018 and December 31, 2017 amounted to P=1.36 billion and P=1.15 billion, respectively
(see Note 11). On the other hand, the net book value of property and equipment amounted to
P=9.12 million and P=10.53 million as of March 31, 2018 and December 31, 2017, respectively
(see Note 12).
Determination of the fair value of investment properties
The Group discloses the fair values of its investment properties in accordance with
PAS 40, Investment Property, the Group engaged SEC-accredited and independent valuation
specialists to assess fair value as of December 31, 2017. The Group’s investment properties consist
of land and building pertaining to commercial properties. These are valued by reference to sales of
similar or substitute properties and other related market data had the investment properties been
transacted in the market. The significant unobservable inputs used in determining the fair value are
the sales price per square meter of similar or substitute property, location, size, shape of lot and the
highest and best use. Another method used in determining the fair value of land properties is based
on the market data approach. The value of land is based on sales and listings of comparable property
registered within the vicinity. This requires adjustments of comparable property by reducing
reasonable comparative sales and listings to a common denominator by adjusting the difference
between the subject property and those actual sales and listings regarded as comparables. The
comparison is premised on the factors of location; size and shape of the lot; time element and others.
Impairment of investment properties and property and equipment
The Group determines whether its nonfinancial assets such as investment properties and property
and equipment are impaired when impairment indicators exist such as significant underperformance
relative to expected historical or projected future operating results and significant negative industry
or economic trends. When an impairment indicator is noted, the Group makes an estimation of the
value-in-use of the cash-generating units to which the assets belong. Estimating the value-in-use
requires the Group to make an estimate of the expected future cash flows from the cash-generating
unit and also to choose an appropriate discount rate in order to calculate the present value of those
cash flows. No impairment indicator was noted as of March 31, 2018 and December 31, 2017. Net
book value of investment properties as of March 31, 2018 and December 31, 2017 amounted to
P=2.09 billion and P=2.11 billion, respectively (see Note 11). On the other hand, the net book value of
property and equipment amounted to P=9.12 million and P=10.53 million as of March 31, 2018 and
December 31, 2017, respectively (see Note 12).

42
Estimation of retirement benefits cost
The cost of the defined benefit plan and the present value of the defined benefit obligation are
determined using actuarial valuations which involves making various assumptions that may differ
from actual developments in the future. These assumptions include the determination of the discount
rate, future salary increases, mortality rates and future pension increases. Due to the complexities
involved in the valuation and its long-term nature, a defined benefit obligation is highly sensitive to
changes in these assumptions. All assumptions are reviewed at each reporting date.
In determining the appropriate discount rate, management considers the PDEX PDST-R2 rates at
various tenors, rates for intermediate durations were interpolated and the rates were then weighted
by the expected benefits payments at those durations to arrive at the single weighted average
discount rate.
Estimation of reserves
Reserves are set up for all pre-need benefits guaranteed and payable by CPI as defined in the pre-
need plan contracts. The determination of CPI’s reserves is based on the actuarial formula, methods,
and assumptions allowed by applicable SEC and IC circulars.
Recognition of deferred income tax assets
The Group reviews the carrying amounts of deferred income tax assets at the end of each reporting
period and reduces deferred income tax assets to the extent that it is no longer probable that
sufficient future taxable profits will be available to allow all or part of the deferred income tax assets
to be utilized.
4. Cash and Cash Equivalents and Short-term Cash Investments
Cash and cash equivalents consist of:
March 31, 2018 December 31, 2017
Cash on hand and in banks P=10,486,290 P=25,328,317
Cash equivalents 1,075,000,000 835,500,000
P=1,085,486,290 P=860,828,317
Cash in banks earn interest at the respective bank deposit rates. Cash equivalents are made for
varying periods up to three months depending on the immediate cash requirements of the Group,
and earn interest at the respective investment rates.
Short-term cash investments amounting to P=0.84 billion and P=1.52 billion as of
March 31, 2018 and December 31, 2017, respectively, are placed with banks with maturities of more
than three months to one year from dates of acquisition and earn interest at the prevailing market
rates.
5. Investments in Trust Funds and Pre-need and Other Reserves
Investments in trust funds
Pursuant to the provisions of the SEC Memorandum Circular No. 6, Guidelines on the Management
of the Trust Fund of Pre-Need Corporation (SEC Circular No. 4), the SEC requires, among others,
that companies engaged in the sale of pre-need plans and similar contracts to planholders set up a
trust fund to guarantee the delivery of property or performance of service in the future. Withdrawals
from these trust funds are limited to, among others, payments of pension plan benefits, bank charges

43
and investment expenses in the operation of the trust funds, termination value payable to plan
holders, contributions to the trust funds of cancelled plans and final taxes on investment income of
the trust funds.
In accordance with the SEC requirements, CPI has funds deposited with two local trustee
banks with net assets aggregating to P=35.14 million and P=34.61 million as of March 31, 2018 and
December 31, 2017, respectively, which are recorded under “Investments in trust funds” account in
the consolidated balance sheets.
The details of investments in trust funds are as follows:
March 31, 2018 December 31, 2017
Assets
Cash and cash equivalents P=5,998,292 P=4,336,908
Debt and listed equity securities 21,862,211 22,997,450
Investment properties 6,782,000 4,186,000
Others 974,853 3,567,303
35,617,356 35,087,661
Liabilities (476,735) (481,311)
35,140,621 34,606,350
Less noncurrent portion 30,651,122 30,337,287
P=4,489,499 P=4,269,063
Pre-need and other reserves
Details of pre-need and other reserves are as follows:
March 31, 2018 December 31, 2017
Transitory pre-need reserves P=31,459,347 P=31,710,864
Reserve for trust fund deficiency 8,824,505 8,824,505
Pension bonus reserve 645,689 651,186
Insurance premium reserve 157,716 157,716
41,087,257 41,344,271
Less noncurrent portion 39,587,229 39,844,243
P=1,500,028 P=1,500,028
6. Installment Contracts Receivable
March 31, 2018 December 31, 2017
Installment contracts receivable P=1,897,862,301 P=1,835,418,984 Less noncurrent portion 1,570,847,654 1,509,504,341
Current portion P=327,014,647 P=325,914,643
Installment contracts receivable arise from sales of real estate properties and are collectible in
monthly installments for periods ranging from one to 10 years and bear monthly interest rates of
0.67% to 2.00% in 2018, 2017 and 2016 computed on the diminishing balance.
The Parent Company, CLDI and CI entered into a contract of guaranty under Retail Guaranty Line
in the amount of P=2.00 billion in 2015 with Home Guaranty Corporation (HGC). The amount of
installment contracts receivable enrolled and renewed by the Group amounted to P=1.67 billion and

44
P=0.73 billion in 2017 and 2016, respectively. The Group paid a guarantee premium of 1.00%, based
on outstanding principal balance of the receivables enrolled in 2017 and 2016.
7. Notes Receivable
Notes receivable pertains to short-term and long-term investments placed by the Company to
different financial institutions which earn interest at the prevailing market interest rates ranging from
3.375% to 4.625%.
March 31, 2018 December 31, 2017
Notes receivable P=728,000,000 P=728,000,000
Less noncurrent portion 600,000,000 600,000,000
Current portion P=128,000,000 P=128,000,000
There were no properties offered as collaterals for the said notes receivables. Details of notes
receivables are as follows:
Date of Placement Amount Maturity Date
December 2017 P=100,000,000 2 to 3 months
December 2017 70,000,000 5 years
October 2017 70,000,000 1 year and 6 months
October 2017 60,000,000 2 years
April 2017 380,000,000 3 years
March 2017 28,000,000 1 year and 3 months
August 2016 20,000,000 4 years
8. Other Receivables
Other receivables consist of:
March 31, 2018 December 31, 2017
Advances to:
Customers P=17,927,625 P=21,892,387
Contractors 7,677,677 7,793,890
Accrued interest 12,510,948 11,838,196
Rent receivable 12,083,095 11,044,207
Due from BIR 3,011,095 2,673,535
Retention 2,781,682 2,771,681
Due from related parties (Note 26) 897,172 1,017,855
Others 2,597,504 2,822,558
59,486,798 61,854,309
Less noncurrent portion 17,388,960 15,266,489
Current portion P=42,097,838 P=46,587,820
Advances to customers are receivables of the Group for the real estate property taxes of sold
condominium units initially paid by the Group whereas advances to contractors are advances made
by the Group for the contractors’ supply requirements.

45
Rent receivable arose from the investment properties rented-out under non-cancellable long-term
operating lease contracts (see Note 11). Due from BIR pertains to input VAT refund relating to zero-
rated sales in March 31, 2018 and December 31, 2017.
Other receivables include receivables from customers relating to registration of title and other
expenses initially paid by the Group on behalf of the buyers and employees’ advances.
9. Real Estate Properties for Sale
Real estate properties for sale consists of costs incurred in the development of condominium units
and residential houses. Real estate properties for sale includes deemed cost adjustment amounting to
P=39.65 million and P=49.82 million as of March 31, 2018 and December 31, 2017, respectively. The
deemed cost adjustment arose when the Group transitioned to PFRS in 2005.
The movement of real estate properties for sale follows:
March 31, 2018 December 31, 2017
Balances at beginning of year P=1,177,390,644 P=1,518,256,209
Construction/development costs incurred 79,676,987 423,212,900 Disposals (cost of real estate sales) (171,453,636) (738,985,531)
Transfer to investment properties (Note 11) (7,579,570) (32,266,351)
Borrowing costs capitalized 833,071 3,247,060
Other adjustments - net 5,755,834 3,926,357
Balance at the end of year P=1,084,623,330 P=1,177,390,644
Real estate properties for sale account includes capitalized interest costs incurred during each year in
connection with the development of the properties. The average capitalization rate used to determine
the amount of interest costs eligible for capitalization is 1.24% both in March 31, 2018 and
December 31, 2017.
Other adjustments include realized deemed cost adjustment and the effect of stating repossessed real
estate properties during the period/year at fair value less cost to sell.
10. Real Estate Properties Held for Future Development
Real estate properties held for future development includes land properties reserved by the Group for
its future condominium projects.
Movements in real estate properties held for future development are as follows:
March 31, 2018 December 31, 2017
Balance at beginning of year P=1,194,820,381 P=978,108,206
Additions 523,517,636 9,489,074
Transfer to investment properties (Note 11) – (4,371,873)
Transfer from investment properties (Note 11) 14,164,060 211,594,974
Balance at end of year P=1,732,502,077 P=1,194,820,381
In February 2018, CLDI purchased a property located along Boni Ave., Mandaluyong City.

46
11. Investment Properties
Investment properties represent real estate properties for lease which consist of:
March 31, 2018
Land Building
Machinery
and
Equipment
Construction
in Progress Total
Costs
Balances at beginning of year P=951,917,286 P=1,116,186,680 P=176,736,481 P=838,748 P=2,245,679,195
Additions – – – 3,138,866 3,138,866 Transfer from real estate
properties for sale (Note 9) – 7,579,570 – – 7,579,570 Transfer to real estate properties
held for future development
(Note 10) – (14,164,060) – – (14,164,060)
Balances at end of year 951,917,286 1,109,602,190 176,736,481 3,977,614 2,242,233,571
Accumulated Depreciation
Balances at beginning of year – 130,063,694 8,330,087 – 138,393,781
Depreciation (Notes 19 and 21) – 10,856,123 4,364,857 – 15,220,980
Balances at end of year – 140,919,817 12,694,944 – 153,614,761
Net Book Values P=951,917,286 P=968,682,373 P=164,041,537 P=3,977,614 P=2,088,618,810
December 31, 2017
Land Building
Machinery
and
Equipment
Construction
in Progress Total
Costs
Balances at beginning of year P=1,104,314,985 P=340,434,058 P=15,730,535 P=727,113,016 P=2,187,592,594
Additions 58,442 24,315,568 – 201,594,034 225,968,044
Transfer from real estate
properties for sale (Note 9) 32,266,351 – – – 32,266,351
Transfer from real estate
properties held for future
development (Note 10) 4,371,873 – – – 4,371,873
Transfer to real estate properties
held for future development
(Note 10) (189,094,365) (22,500,609) – – (211,594,974)
Capitalized borrowing costs – – – 7,075,307 7,075,307
Reclassification – 773,937,663 161,005,946 (934,943,609) –
Balances at end of year 951,917,286 1,116,186,680 176,736,481 838,748 2,245,679,195
Accumulated Depreciation
Balances at beginning of year – 98,842,725 6,203,255 – 105,045,980
Depreciation (Notes 19 and 21) – 31,220,969 2,126,832 – 33,347,801
Balances at end of year – 130,063,694 8,330,087 – 138,393,781
Net Book Values P=951,917,286 P=986,122,986 P=168,406,394 P=838,748 P=2,107,285,414
CityNet1 was registered with the Philippine Economic Zone Authority (PEZA) on March 3, 2014
with Registration No. EZ14-04. The Company leases out this property to a business process
outsourcing (BPO) company which is also a PEZA-registered entity.
Construction in progress as of March 31, 2018 and December 31, 2017 pertains to the construction
of a building which commenced in 2017 and is expected to be completed in the first semester of
2018.
CityNet Central is also registered with PEZA on February 17, 2015 with Registration
No. EZ 15-06.

47
The net book values of land and building include net deemed cost adjustment amounting to
P=158.67 million as of March 31, 2018 and December 31, 2017. The deemed cost adjustment arose
when the Group transitioned to PFRS in 2005.
The Parent Company entered into a non-cancellable operating lease contracts with various third
parties as follows:
Year Lessee (Third Parties) Term
2017 BPO 3 years
2017 Convenience Store 5 years
2016 Domestic Corporation 5 years
2016 Fast Food 10 years
2015 Domestic Corporation 4 years and 4 months
2014 BPO 6 years
2011 Fast Food 10 years
The lease contracts include clauses to enable periodic upward revision of the rental charge
according to prevailing market conditions.
The future minimum lease payments for these lease agreements are as follows:
March 31, 2018 December 31, 2017
Within one year P=102,626,906 P=102,271,503
After one year but not more than five years 146,265,743 169,925,542
Later than five years 30,735,544 32,836,048
P=279,628,193 P=305,033,093
Rent income from investment properties amounted to P=30.09 million and P=27.26 million in
March 31, 2018 and March 31, 2017, respectively.
Other lease agreements with third parties are generally for a one year term renewable every year.
12. Property and Equipment
Property and equipment consists of:
March 31, 2018
Office
Premises
Furniture,
Fixtures
and Office
Equipment
Transportation
and Other
Equipment Total
At Cost
Balances at beginning and end
of period P=– P=40,108,459 P=6,380,142 P=46,488,601
Accumulated Depreciation
Balances at beginning of period – 34,139,060 5,301,876 39,440,936
Depreciation (Notes 19 and 21) – 571,294 75,402 646,696
Balances at end of period – 34,710,354 5,377,278 40,087,632
Net Book Value – 5,398,105 1,002,864 6,400,969
At Deemed Cost 253,365,628 – – 253,365,628

48
Office
Premises
Furniture,
Fixtures
and Office
Equipment
Transportation
and Other
Equipment Total
Accumulated Depreciation
Balances at beginning of period P=249,879,666 P=– P=– P=249,879,666
Depreciation (Notes 19 and 21) 769,163 – – 769,163
Balances at end of period 250,648,829 – – 250,648,829
Net Deemed Cost 2,716,799 – – 2,716,799
Total P=2,716,799 P=5,398,105 P=1,002,864 P=9,117,768
December 31, 2017
Office
Premises
Furniture,
Fixtures
and Office
Equipment
Transportation
and Other
Equipment Total
At Cost
Balances at beginning of year P=– P=34,700,959 P=6,380,142 P=41,081,101
Additions – 5,407,500 – 5,407,500
Balances at end of year – 40,108,459 6,380,142 46,488,601
Accumulated Depreciation
Balances at beginning of year – 32,304,511 5,000,269 37,304,780
Depreciation – 1,834,549 301,607 2,136,156
Balances at end of year – 34,139,060 5,301,876 39,440,936
Net Book Value – 5,969,399 1,078,266 7,047,665
At Deemed Cost 253,365,628 – – 253,365,628
Accumulated Depreciation
Balances at beginning of year 246,803,015 – – 246,803,015
Depreciation 3,076,651 – – 3,076,651
Balances at end of year 249,879,666 – – 249,879,666
Net Deemed Cost 3,485,962 – – 3,485,962
Total P=3,485,962 P=5,969,399 P=1,078,266 P=10,533,627
For the office premises, the Group elected to apply the optional exemption under PFRS 1, First-Time
Adoption of PFRS, to use the revalued amount as deemed cost as at January 1, 2005, the date of
transition to PFRS. As of March 31, 2018 and December 31, 2017, the balances at pre-PFRS cost of
the office premises are as follows:
March 31, 2018 December 31, 2017
Office premises P=55,775,746 P=55,775,746 Less accumulated depreciation 55,199,700 55,036,250
P=576,046 P=739,496
The cost of fully depreciated property and equipment still used in operations amounted to
P=33.40 million as of March 31, 2018 and December 31, 2017.
13. Other Assets
Other current assets amounting to P=48.15 million and P=60.54 million as of March 31, 2018 and
December 31, 2017, respectively, represent unused input VAT and prepaid real estate taxes.

49
Other noncurrent assets consist of:
March 31, 2018 December 31, 2017
Unused input VAT P=57,121,511 P=57,187,022
Available-for-sale financial assets 1,586,842 1,629,078
Deposits and others 18,471,659 19,101,461
P=77,180,012 P=77,917,561
The unused input VAT arose from the purchase of parcels of land recorded as part of “Real estate
properties held for future development” and “Investment properties” accounts (see Note 10 and 11).
Available-for-sale financial assets consist of investments in quoted equity securities. The fair values
of available-for-sale financial assets were determined based on published prices in an active market.
The movement in “Net changes in fair values of available-for-sale financial assets” account
presented in the equity section of the consolidated balance sheets is as follows:
March 31, 2018 December 31, 2017
Balances at beginning of year P=1,251,555 P=1,706,728
Mark-to-market loss attributable to equity
holders of the Parent Company (1,956,274) (455,173)
Balances at end of year (P=704,719) P=1,251,555
Deposits and others represent payments made by the Group to various utility companies for the
installation of electric and water meters for unsold condominium units.
14. Accounts Payable and Accrued Expenses
Accounts payable and accrued expenses consist of:
March 31, 2018 December 31, 2017
Trade payables P=119,457,032 P=137,980,436
Customers’ deposits 37,027,525 37,816,462
Accrued expenses:
Development costs 107,829,963 97,195,128
Sick leave (Note 24) 24,138,872 24,020,922
Directors’ fee 24,043,211 20,660,349
Interest payable 1,768,522 2,398,253
Taxes, premiums, others 7,153,200 5,248,552
Dividends payable 11,138,315 11,050,680
Withholding taxes payable 2,676,068 4,644,064
Deferred rent income 4,937,995 5,177,513
Others 16,103,493 9,326,956
356,274,196 355,519,315
Less noncurrent portion 64,229,335 103,764,222
Current portion P=292,044,861 P=251,755,093
Trade payables consist of payables to suppliers, contractors and other counterparties. Customers’
deposits consist of rental deposits and collected deposits for water and electric meters of the sold
units. Accrued development costs represent the corresponding accrued expenses for the completed

50
condominium units of the Group. Deferred rent income pertains to rent received from long-term
operating lease. Other payables consist substantially of commission payable, unclaimed checks of
pension holders, and payables due to government agencies.
The movements in dividends payable and accrued interest are as follows:
Payments
December 31, 2017 Additions Expensed Capitalized March 31, 2018
Dividends payable (Note 17) P=11,050,680 P=87,635 P=– P=– P=11,138,315
Accrued interest (Note 15) 2,398,253 124,415 – (754,146) 1,768,522
P=13,448,933 P=212,050 P=– (P=754,146) P=12,906,837
15. Notes and Contracts Payable
The details of notes and contracts payable are as follows:
March 31, 2018 December 31, 2017
Notes Payable P=1,285,200,000 P=1,453,450,000
Contracts Payable 10,000,000
P=1,295,200,000 P=1,453,450,000
Notes payable pertains to commercial papers with varying maturities and annual interest rates
ranging from 1.06% to 1.25% of March 31, 2018 and December 31, 2017.
On various dates in 2017 and 2016, the SEC authorized the Parent Company and CLDI to issue total
aggregated amount of P=1.75 billion and P=1.60 billion, respectively, worth of commercial papers
registered with the SEC in accordance with the provision of the Securities Regulation Code and its
implementing rules and regulations and other applicable laws and orders. Outstanding commercial
papers issued by the Parent Company and CLDI as of March 31, 2018 and December 31, 2017
aggregated to P=1.30 billion and P=1.45 billion, respectively.
The movements in notes payable are as follows:
March 31, 2018 December 31, 2017
Beginning balance P=1,453,450,000 P=1,673,000,000
Availment 1,469,950,000 6,106,350,000
Payment (1,638,200,000) (6,325,900,000)
Ending balance P=1,285,200,000 P=1,453,450,000
Contracts payable amounting to P=10.00 million as of March 31, 2018 represents liability arising
from a contract entered into by CLDI to purchase a property held for future development.
16. Deferred Income Tax Liabilities
The components of the deferred tax liabilities net are as follows:
March 31, 2018 December 31, 2017
Deferred income tax assets:
Accrued expenses and others P=14,993,363 P=14,761,084
Difference between tax basis and book basis of
accounting for real estate transactions 11,696,582 11,284,080
26,689,945 26,045,164

51
March 31, 2018 December 31, 2017
Deferred income tax liabilities:
Deemed cost adjustment in properties (P=59,690,368) (P=63,371,033)
Unrealized gain on real estate transactions (51,873,684) (47,535,409)
Accumulated excess contributions over
retirement benefits cost (2,594,305) (2,594,305)
Capitalized interest (8,694,242) (8,764,667)
Unearned rent revenue 2,443,400 (2,100,761)
(120,409,199) (124,366,175)
Net deferred income tax liabilities (P=93,719,254) (P=98,321,0111)
Deferred income tax assets – net: CLDI P=11,928,743 P=11,425,848
Deferred income tax liabilities – net:
Parent Company (103,774,304) (108,898,216)
CPI (1,873,693) (848,643)
(105,647,997) (109,746,859)
(P=93,719,254) (P=98,321,011)
17. Equity
a. The following table summarizes the reconciliation of the authorized, issued and outstanding
shares of capital stock as of March 31, 2018 and December 31, 2017:
Shares Amount
Authorized - P=1 par value
Balance at beginning and end of
year / period
4,000,000,000 P=4,000,000,000
Issued, beginning of year 3,752,475,115 P=3,752,475,115 Treasury stock (4,234,588) (4,234,588)
Outstanding 3,748,240,527 3,748,240,527
Stock dividends 187,526,533 187,526,533
3,935,767,060 3,935,767,060
Treasury stock 4,234,588 4,234,588
Issued, ending of year 3,940,001,648 P=3,940,001,648
Treasury stock includes 2,296,641 shares in March 31, 2018 and December 31, 2017 held by
CPI.
The Parent Company registered 10,000,000 shares with SEC on June 15, 1978 with an initial
offer price of P=10.00. On July 27, 2012, the SEC approved the Amended Articles of
Incorporation on the application for increase in authorized capital stock from
P=3,000.00 million to P=4,000.00 million with a par value of P=1.00 each.
b. Dividends declared and issued/paid by the Parent Company in 2018, 2017, and 2016 are as
follows:
BOD Stockholders’ Stockholders of
Dividends Approval Date Approval Date Per Share Record Date Date Issued/Paid
Cash May 23, 2017 P=0.036 June 6, 2017 June 22, 2017
June 3, 2016 0.066 June 17, 2016 July 1, 2016
Stock April 27, 2017 June 6, 2017 5% July 6, 2017 August 1, 2017
April 25, 2016 June 7, 2016 5% July 7, 2016 August 2, 2016
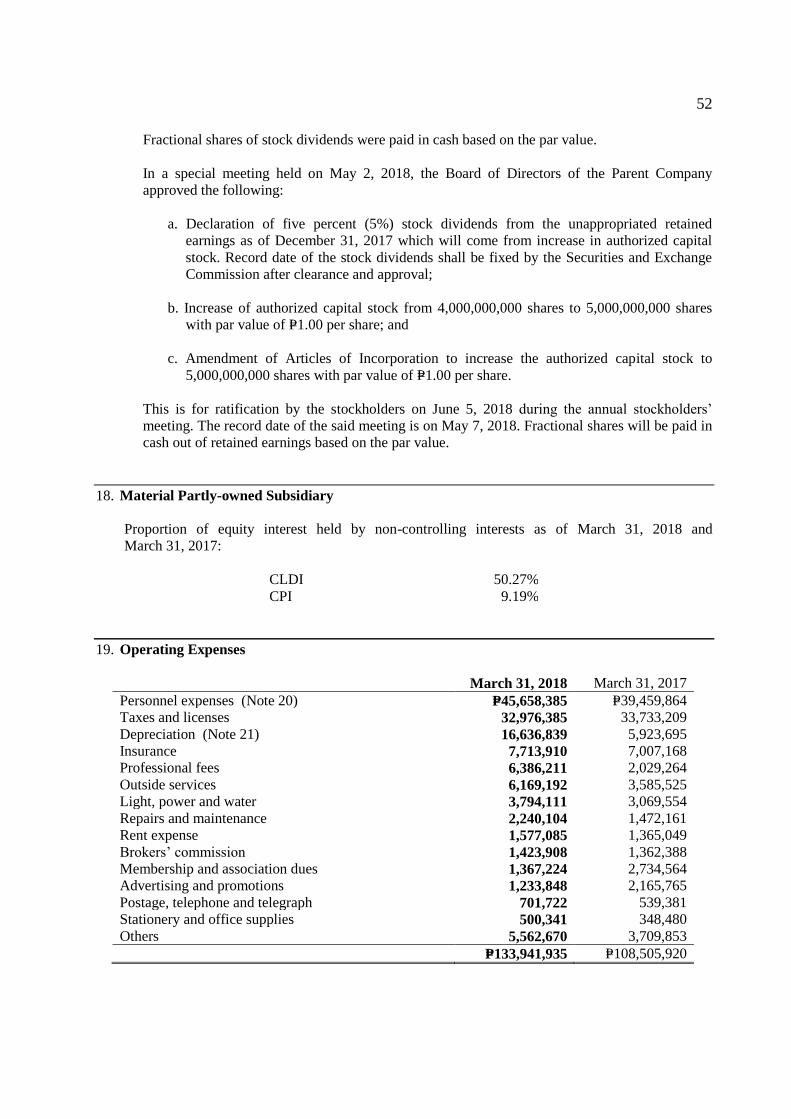
52
Fractional shares of stock dividends were paid in cash based on the par value.
In a special meeting held on May 2, 2018, the Board of Directors of the Parent Company
approved the following:
a. Declaration of five percent (5%) stock dividends from the unappropriated retained
earnings as of December 31, 2017 which will come from increase in authorized capital
stock. Record date of the stock dividends shall be fixed by the Securities and Exchange
Commission after clearance and approval;
b. Increase of authorized capital stock from 4,000,000,000 shares to 5,000,000,000 shares
with par value of P=1.00 per share; and
c. Amendment of Articles of Incorporation to increase the authorized capital stock to
5,000,000,000 shares with par value of P=1.00 per share.
This is for ratification by the stockholders on June 5, 2018 during the annual stockholders’
meeting. The record date of the said meeting is on May 7, 2018. Fractional shares will be paid in
cash out of retained earnings based on the par value.
18. Material Partly-owned Subsidiary
Proportion of equity interest held by non-controlling interests as of March 31, 2018 and
March 31, 2017:
CLDI 50.27%
CPI 9.19%
19. Operating Expenses
March 31, 2018 March 31, 2017
Personnel expenses (Note 20) P=45,658,385 P=39,459,864
Taxes and licenses 32,976,385 33,733,209
Depreciation (Note 21) 16,636,839 5,923,695
Insurance 7,713,910 7,007,168
Professional fees 6,386,211 2,029,264
Outside services 6,169,192 3,585,525
Light, power and water 3,794,111 3,069,554
Repairs and maintenance 2,240,104 1,472,161
Rent expense 1,577,085 1,365,049
Brokers’ commission 1,423,908 1,362,388
Membership and association dues 1,367,224 2,734,564
Advertising and promotions 1,233,848 2,165,765
Postage, telephone and telegraph 701,722 539,381
Stationery and office supplies 500,341 348,480
Others 5,562,670 3,709,853
P=133,941,935 P=108,505,920

53
20. Personnel Expenses
March 31, 2018 March 31, 2017
Salaries and wages P=22,689,070 P=16,676,429
Commissions 10,185,973 10,373,055
Bonuses and other employee benefits 12,783,342 12,410,380
P=45,658,385 P=39,459,864
21. Depreciation
Depreciation consists of:
March 31, 2018 March 31, 2017
Investment properties P=15,220,980 P=4,778,211
Property and equipment 1,415,859 1,145,484
P=16,636,839 P=5,923,695
22. Financial Income (Expenses)
March 31, 2018 March 31, 2017
Financial Income
Interest income P=86,628,548 P=76,667,016
Dividend income 3,639 3,264
P=86,632,187 P=76,670,280
Financial Expenses
Interest expense (P=3,416,073) (P=1,696,022)
Finance charges (250,250) (349,550)
(P=3,666,323) (P=2,045,572)
23. Other income/expenses
Other income
Other income amounting to P=28.00 million and P=24.93 million in March 31, 2018 and
March 31, 2017, respectively, pertains to trust fund income, penalties for customers’ late payments,
sale of scraps and forfeiture of reservations/downpayments received on sales which were not
consummated.
Other expenses
Other expenses amounting to P=14.12 million and P=7.00 million in March 31, 2018 and
March 31, 2017, respectively, pertain to loss due to forfeiture/cancellation of sales.
24. Retirement Benefits Cost
The Group, jointly with affiliated companies, has a funded, noncontributory defined benefit
retirement plan, administered by trustee covering all of its permanent employees.

54
Accrued sick leave
Employees are entitled to paid sick leave of 15 days per year of service after issuance of regular
appointment, computed at 1.25 days per month of service, enjoyable only after one year of regular
service. Unused sick leaves are cumulative and convertible to cash based on the employee’s salary at
the time that the employee is leaving the Group. Accrued sick leave, presented under “Accounts
payable and accrued expenses - noncurrent portion” account, amounted to P=24.14 million and
P=24.02 million as of March 31, 2018 and December 31, 2017, respectively (see Note 14).
25. Income Taxes
Provision for income tax consists of:
March 31, 2018 March 31, 2017
Current P=33,217,710 P=32,413,459
Deferred (1,588,594) (5,692,131)
Final tax 4,439,052 3,459,725
P=36,068,168 P=30,181,053
Registration with the Board of Investments (BOI)
The Group is entitled to ITH for a period of three years from various dates indicated in the
registration or actual start of commercial operations, whichever is earlier. The ITH is limited only to
revenue generated from the registered project. Revenues from units with selling price exceeding
P=3.00 million shall not be covered by the ITH.
The Group has registered the following Low-Cost Mass Housing Projects with BOI under the
Omnibus Investment Code of 1987 (Executive Order No. 226):
Name Registration No. ITH Period
CDC
Pines Peak Tower II 2016-108 June 1, 2016 – May 31, 2019
CLDI
One Taft Residences 2014-112 January 1, 2016 – December 31, 2018
North Residences 2014-111 September 1, 2014 – August 31, 2017
26. Related Party Transactions
Enterprises and individuals that directly, or indirectly through one or more intermediaries, control or
are controlled by or under common control with the Group, including holding companies,
subsidiaries and fellow subsidiaries, are related parties of the Group. Associates and individuals
owning, directly or indirectly, an interest in the voting power of the Group that gives them
significant influence over the enterprise, key management personnel, including directors and officers
of the Group and close members of the family of these individuals, and companies
associated with these individuals also constitute related parties. In considering each possible related
entity relationship, attention is directed to the substance of the relationship and not merely the legal
form.
The Group discloses the nature of the related party relationship and information about the
transactions and outstanding balances necessary for an understanding of the potential effect of the
relationship on the consolidated financial statements, including, as a minimum, the amount of
outstanding balances and its terms and conditions including whether they are secured, and the nature
of the consideration to be provided in settlement.

55
The Group, in the normal course of business, has transactions and account balances with related parties consisting mainly of the following:
Outstanding Balances
Terms
and
Conditions
Amount of transactions
Receivable (Note 8) Payable
Nature of Transaction March 31,
2018
December 31,
2017
March 31,
2018
December 31,
2017 March 31,
2018
December 31,
2017
Ultimate parent (CI)
Sharing of expenses charged
by (to) the Company P=897,172
P=1,017,855
P=897,172
P=1,017,855 P=–
P=–
30-day,
unsecured, non-
interest bearing;
to be settled in
cash
Subsidiaries (CLDI & CPI)
Sharing of expenses charged
by (to) the Company 1,539,867 313,863
– – – –
30-day,
unsecured, non-
interest bearing;
to be received or
settled in cash; no
impairment
Total
P=897,172 P=1,017,855 P=– P=–
Parent Company’s transactions with CLDI and CPI are eliminated in the consolidated balance sheets and statements of income.

56
a. The Group has an existing management contract with CI wherein the latter provides
management services to the Group. The agreement is for a period of five years renewable
automatically for another five years unless either party notifies the other party six months
prior to expiration. Management fee is based on a certain percentage of net income as
mutually agreed upon by both parties. Management fees for 2018, 2017, 2016 and 2015
were waived by CI. There are no conditions attached to the waiver of these management
fees.
b. The Group, jointly with affiliated companies under common control, has a trust fund for the
retirement plan of their employees. The trust fund is being maintained by a third-party
trustee bank under the supervision of the Retirement Committee of the plan. The Retirement
Committee is responsible for the investment strategy of the plan.
c. The Group has no standard arrangements with regards to the remuneration of its directors.
Moreover, the Group has no standard arrangement with regards to the remuneration of its
existing officers aside from the compensation received or any other arrangements in the
employment contracts and compensatory plan. The Group does not have any arrangements
for stock warrants or options offered to its employees.
d. The Group has various shared expenses with other affiliates pertaining to general and
administrative expenses such as salaries, transportation, association dues, professional fees
and rent.
27. Basic/Diluted Earnings Per Share
Basic/diluted earnings per share amounts were computed as follows:
March 31, 2018 March 31, 2017
a. Net income attributable to equity
holders of the Parent
P=143,918,073
P=98,502,002
b. Weighted average number of
outstanding shares
3,938,063,701
3,938,063,701*
c. Basic/diluted earnings per share (a/b) P=0.04 P=0.03 *After retroactive effect of 5% stock dividends in 2017.
The Group has no potential dilutive common shares for the years ended March 31, 2018 and
March 31, 2017. Thus, the basic and diluted earnings per share are the same as of those dates.
28. Financial Instruments
Financial Risk Management Objectives and Policies
The Group’s principal financial instruments comprise cash and cash equivalents, short-term cash
investments, notes receivable and notes and contracts payable. The main purpose of these
financial instruments is to finance the Group’s operations. The Group’s other financial
instruments consist of financial assets at fair value through profit or loss and available-for-sale
financial assets, which are held for investing purposes and investments in trust funds to cover
pre-need reserves obligation. The Group has various other financial instruments such as
installment contracts receivable, other receivables and accounts payable and accrued expenses
which arise directly from its operations.
It is, and has been throughout the year under review, the Group’s policy that no trading in
financial instruments shall be undertaken.

57
The main risks arising from the Group’s financial instruments are market risk (i.e., cash flow
interest rate risk and equity price risk), credit risk and liquidity risk. The BOD reviews and
approves policies for managing these risks and they are summarized as follows:
Market risk
Cash flow interest rate risk
Cash flow interest rate risk is the risk that the fair value or future cash flows of a financial
instrument will fluctuate because of changes in market interest rates. The Group’s exposure to
the risk for changes in market interest rates relates primarily to the Group’s short-term notes
payable, all with repriced interest rates.
The Group’s policy in addressing volatility in interest rates includes maximizing the use of
operating cash flows to be able to fulfill principal and interest obligations even in periods of
rising interest rates.
Equity price risk
Equity price risk is the risk that the fair values of investments in equity securities will decrease
as a result of changes in the market values of individual shares of stock. The Group is exposed
to equity price risk because of investments held by the Group classified as available-for-sale
financial assets included under “Other noncurrent asset account” in the consolidated balance
sheets. The Group employs the service of a third-party stock broker to manage its investments
in shares of stock.
A sensitivity analysis of the Group’s equity to a reasonably possible change in equity price
based on forecasted and average movements of equity prices of P=0.03, higher or lower, would
increase or decrease the equity by P=46,017.67.
Credit risk
Credit risk arises when the Group will incur a loss because its customers, clients or
counterparties fail to discharge their obligations. The Group trades only with recognized,
creditworthy third parties. It is the Group’s policy that all customers who wish to trade on credit
terms are subject to credit verification procedures. In addition, receivable balances are
monitored on an on-going basis with the objective that the Group’s exposure to bad debts is not
significant. The risk is further mitigated because the Group holds the title to the real estate
properties with outstanding installment contracts receivable balance and the Group can
repossess such real estate properties upon default of the customer in paying the outstanding
balance. The Group’s policy is to enter into transactions with a diversity of creditworthy parties
to mitigate any significant concentration of credit risk. There are no significant concentrations
of credit risk within the Group.
The tables below show the Group’s exposure to credit risk for the components of the
consolidated balance sheets. The exposure as of March 31, 2018 is shown at gross, before
taking the effect of mitigation through the use of collateral agreements and other credit
enhancements, and at net, after taking the effect of mitigation through the use of collateral
agreements and other credit enhancements.
Gross
maximum
exposure
Fair value of
collaterals/credit
enhancements
Net
exposure
Financial effect of
collateral/credit
enhancements
Financial assets at fair value through profit or loss:
Investments in trust funds P=35,140,621 P=– P=35,140,621 P=–
Loans and receivables:
Cash and cash equivalents, excluding
cash on hand 1,085,295,290 – 1,085,295,290 –
Short-term cash investments 836,350,000 – 836,350,000 –
Installment contracts receivable 1,897,862,301 4,281,193,886 – 1,897,862,301
Notes receivable 728,000,000 – 728,000,000 –
Refundable deposits 17,476,015 – 17,476,015 –
(Forward)

58
Gross
maximum
exposure
Fair value of
collaterals/credit
enhancements
Net
exposure
Financial effect of
collateral/credit
enhancements
Other receivables*:
Advances to customers P=17,927,625 P=– P=17,927,625 P=–
Accrued interest 12,510,948 – 12,510,948 –
Rent receivable 12,083,095 – 12,083,095 –
Due from BIR 3,011,095 – 3,011,095 –
Retention 2,781,682 – 2,781,682 –
Due from related parties 897,172 – 897,172 –
Others 2,597,504 – 2,597,504 –
Total credit risk exposure P=4,651,933,348 P=4,281,193,886 P=2,754,071,047 P=1,897,862,301
*Excluding advances to contractors assets amounting to P=7,677,677.
The following table summarizes the aging analysis and credit quality of the receivables as of
March 31, 2018:
Past due But Not Impaired
Current > One year < 30 days 31 - 60 days 61- 90 days
Over
90 days
Total
Installment contracts
receivable P=317,633,606 P=1,570,847,654 P=3,460,633 P=984,733 P=4,935,675 – P=1,897,862,301
Notes Receivable 128,000,000 600,000,000 – – – – 728,000,000
Refundable deposits – 17,476,015 – – – – 17,476,015
Other receivables*:
Advances to customers 6,986,280 7,005,492 – 569,393 122,322 3,244,138 17,927,625
Accrued interest 12,510,948 – – – – – 12,510,948
Rent receivable 12,083,095 – – – – – 12,083,095
Due from BIR 3,011,095 – – – – – 3,011,095
Retention 1,641,682 1,140,000 – – – – 2,781,682
Due from related parties 897,172 – – – – – 897,172
Others 1,031,713 1,565,791 – – – – 2,597,504
P=483,795,591 P=2,198,034,952 P=3,460,633 P=1,554,126 P=5,057,997 P=3,244,138 P=2,695,147,437
*Excluding advances to contractors amounting to P=7,677,677.
The table below shows the credit quality by class of asset for loan-related balance sheet lines,
based on the Group’s credit rating system as of March 31, 2018:
Neither past due nor impaired
Medium Past Due but
High Grade* Grade** not Impaired Total
Financial asset at fair value through profit
or loss - Investments in trust fund P=35,140,621 P=– P=– P=35,140,621
Loans and receivables:
Cash and cash equivalents, excluding
cash on hand 1,085,295,290 – – 1,085,295,290
Short-term cash investments 836,350,000 – – 836,350,000
Installment contracts receivable 1,888,481,260 – 9,381,041 1,897,862,301
Notes Receivable 728,000,000 728,000,000
Refundable deposits 17,476,015 – – 17,476,015
Other receivables***:
Advances to customers 12,505,928 – 3,895,416 16,401,344
Accrued interest 12,510,948 – – 12,510,948
Rent receivable 12,083,095 – – 12,083,095
Due from BIR 3,011,095 – – 3,011,095
Retention 2,781,682 – – 2,781,682
Due from related parties 897,172 – – 897,172
Others 2,400,166 1,723,619 – 4,123,785
Total P=4,636,933,272 P=1,723,619 P=13,276,457 P=4,651,933,348
* High Grade - financial assets with reputable counterparties and which management believes to be reasonably assured to be
recoverable.
** Medium Grade - financial assets for which there is low risk on default of counterparties. *** Excluding advances to contractors amounting to P=7,677,677.
The main considerations for impairment assessment include whether any payments are overdue
or if there are any known difficulties in the cash flows of the counterparties. The Group
assesses impairment into two areas: individually assessed allowances and collectively assessed
allowances.

59
The Group determines allowance for each significant receivable on an individual basis. Among
the factors that the Group considers in assessing impairment is the inability to collect from the
counterparty based on the contractual terms of the receivables. The Group also considers the
fair value of the real estate collateralized in computing the impairment of the receivables.
Receivables included in the specific assessment are those receivables under the installment
contracts receivable accounts.
For collective assessment, allowances are assessed for receivables that are not individually
significant and for individually significant receivables where there is no objective evidence of
individual impairment. Impairment losses are estimated by taking into consideration the age of
the receivables, past collection experience and other factors that may affect collectability.
Liquidity risk
Liquidity risk is defined as the risk that the Group would not be able to settle or meet its
obligations on time or at a reasonable price. The Group’s objective is to maintain a balance between continuity of funding and flexibility
through the use of commercial papers. The table below summarizes the maturity analysis of the Group’s financial liabilities as of March 31, 2018:
Up to One Year Above One Year Total
Accounts payable and accrued expenses* P=286,991,687 P=64,229,335 P=351,221,022
Notes and contracts payable** 1,311,128,769 – 1,311,128,769 P=1,598,120,456 P=64,229,335 P=1,662,349,791
* Excludes statutory liabilities amounting to P=5,053,174.
** Includes interest expense amounting to P=15,928,769.
Fair Values
The following tables provide fair value hierarchy of the Group’s financial assets, financial
liabilities and investment properties, other than those with carrying amounts which are
reasonable approximations of fair values: Date of Valuation: March 31, 2018 Fair value
Level 1 Level 2 Level 3
Assets measured at fair value
Available-for-sale financial assets P=1,586,842 P=– P=–
Assets for which fair values are disclosed
Investment properties* – – 4,170,534,400 *Last valuation date is December 31, 2017.
The following method and assumptions were used to estimate the fair value of each class of
financial instruments and investment properties, for which it is practicable to estimate such
value.
Cash and cash equivalents, short-term cash investments, installment contracts receivable, notes
receivable, other receivables, accounts payable and accrued expenses and notes and contracts
payable
Due to the short-term nature of the transactions, the fair values of cash and cash equivalents,
short-term cash investments, notes receivable, other receivables, accounts payable and accrued
expenses and notes and contracts payable approximate their carrying amounts. The fair values of
notes receivable and installment contracts receivable approximate its carrying amount as they
carry interest rates that approximate the interest rates for comparable instruments in the market.

60
Financial assets at FVPL and available-for-sale financial assets
Financial assets at FVPL and available-for-sale financial assets are stated at fair value based on
quoted market prices.
Investment properties
The fair value of certain investment properties is determined using sales comparison. Sales
comparison approach considers the sales of similar or substitute properties and other related
market data had the investment properties been transacted in the market. The significant
unobservable inputs used in determining the fair value are the sales price per square meter of
similar or substitute property, location, size, shape of lot and the highest and best use.
Another method used in determining the fair value of other land properties is based on the
market data approach. The value of land is based on sales and listings of comparable property
registered within the vicinity. This requires adjustments of comparable property by reducing
reasonable comparative sales and listings to a common denominator by adjusting the difference
between the subject property and those actual sales and listings regarded as comparables. The
comparison is premised on the factors of location; size and shape of the lot; time element and
others.
The fair value of the investment properties as of December 31, 2017 and 2016 approximates and
represents the highest and best use of the said properties.
29. Business Segments
The Group derives its revenues primarily from the sale and lease of real estate properties and
pension plan operations. These are the operating segments classified as business groups which
are consistent with the segments reported to the BOD, its Chief Operating Decision Maker
(CODM).
Segment revenues and expenses:
March 31, 2018 March 31, 2017
Sales of real estate P=438,971,310 84.38% P=338,674,657 82.86%
Rent income 30,092,354 5.79% 27,261,482 6.67%
Others 51,159,089 9.83% 42,785,906 10.47%
P=520,222,753 100.00% P=408,722,045 100.00%
Except for expenses directly relating to the leasing and pension plan operations, operating
expenses pertain primarily to the real estate sales.
30. Contingencies
The Group is contingently liable for certain lawsuits or claims filed by third parties which are
either pending decisions by the courts or are under negotiation, the outcomes of which are not
presently determinable. In the opinion of management and its legal counsel, the eventual
liability under these lawsuits or claims, if any, will not have a material effect on the consolidated
financial statements.

61
CITYLAND DEVELOPMENT CORPORATION AND SUBSIDIARIES
SUPPLEMENTARY SCHEDULE OF
FINANCIAL SOUNDNESS INDICATORS
Financial Ratios
March 31, 2018
(Unaudited)
December 31, 2017
(Audited)
March 31, 2017
(Unaudited)
Earnings per share* P=0.15 P=0.12 P=0.11
Return on equity* (%) 8.36 % 7.20 % 6.08 %
Solvency ratio* 0.39 0.30 0.19
Interest rate coverage ratio 63.55 84.00 83.64
Asset-to-liability ratio 5.35 4.93 4.28
Asset-to-equity ratio 1.41 1.44 1.49
Debt-to-equity ratio 0.19 0.22 0.23
Current ratio 2.22 2.42 2.46
Acid-test ratio 1.51 1.69 1.71 *Annualized for the period of March 31, 2018 and March 31, 2017
Manner of Calculation:
Earnings per share =
Net Income after Tax
Outstanding shares
Return on equity
ratio =
Net Income after Tax
Equity
Solvency ratio
=
Net Income after Tax + Depreciation Expense
Total Liabilities
Interest rate
coverage ratio =
Net Income Before Tax + Depreciation Expense + Interest Expense
Interest Expense
Asset-to-liability
ratio
=
Total Assets / Total Liabilities
Asset-to-equity ratio
=
Total Assets
Total equity (net of net changes in fair value of available-for-sale
financial assets and accumulated re-measurement on defined benefit
plan)
Debt-to-equity ratio
=
Notes and Contracts Payable
Total equity (net of net changes in fair value of available-for-sale
financial assets and accumulated re-measurement on defined benefit
plan)
Current ratio
=
Total Current Assets / Total Current Liabilities
Acid-test ratio
=
Cash and Cash Equivalents + Short-term Cash Investments +
Installment Contracts Receivable, current + Notes Receivable, current +
Other Receivables, current + Available-for-sale Financial Assets
Total Current Liabilities

62
CITYLAND DEVELOPMENT CORPORATION
SCHEDULE OF GROSS AND NET PROCEEDS OF COMMERCIAL PAPERS ISSUED
As of March 31, 2018
SEC-MSRD Order No. 32, Series of 2017 dated November 6, 2017
A. As stated in the Final Prospectus (November 6, 2017 to November 5, 2018)
Gross Proceeds Php 1,350,000,000
Less: Expenses
Documentary Stamps Tax 6,750,000
Registration Fees 719,625
Printing Costs 67,500
Legal and Accounting Fees 30,000
Publication Fees 30,000 7,597,125
Net Proceeds Php 1,342,402,875
Use of Proceeds
Project-related Costs 671,500,000
Payment of Maturing Notes 654,297,875
Interest Expense 16,605,000
Total Php 1,342,402,875
B. Use of Proceeds (November 6, 2017 to March 31, 2018)
Gross Proceeds Php 1,602,100,000
Less: Expenses
Documentary Stamps Tax 2,276,236
Registration Fees 719,625
Publication Fees 30,000
Legal and Accounting Fees 30,000
Printing Costs 21,150 3,077,011
Total Net Proceeds Php 1,599,022,989
Less: Use of Proceeds
Payment of Maturing Notes 1,362,554,254
Project-related Costs 233,192,050
Interest Expense 3,276,685 1,599,022,989
Balance of Proceeds as of March 31, 2018 Php -
C. Outstanding Commercial Papers as of March 31, 2018:
SEC-MSRD Order No. 32 Series of 2017 dated November 6, 2017
Php
971,500,000

63
CITY & LAND DEVELOPERS, INCORPORATED
SCHEDULE OF GROSS AND NET PROCEEDS OF COMMERCIAL PAPERS ISSUED
As of March 31, 2018
SEC-MSRD Order No. 33, Series of 2017 dated November 6, 2017
A. As stated in the Final Prospectus (November 6, 2017 to November 5, 2018)
Gross Proceeds Php 400,000,000
Less: Expenses
Documentary Stamps Tax 2,000,000
Registration Fees 366,125
Legal and Accounting Fees 30,000
Publication Fees 30,000
Printing Costs 20,000 2,446,125
Net Proceeds Php 397,553,875
Use of Proceeds
Project-related Costs 375,600,000
Payment of Maturing Notes 17,033,875
Interest Expense 4,920,000
Total Php 397,553,875
B. Use of Proceeds (November 6, 2017 to March 31, 2018)
Gross Proceeds Php 489,450,000
Less: Expenses
Documentary Stamps Tax 785,830
Registration Fees 366,125
Legal and Accounting Fees 30,000
Publication Fees 30,000
Printing Costs 12,200 1,224,155
Net Proceeds Php 488,225,845
Less: Use of Proceeds
Payment of Maturing Notes 272,950,000
Project-related Costs 100,909,875
Interest Expense 663,484 374,523,359
Balance of Proceeds as of March 31, 2018 Php 113,702,486
C. Outstanding Commercial Papers as of March 31, 2018:
SEC-MSRD Order No. 33, Series of 2017 dated November 6, 2017 Php 313,700,000
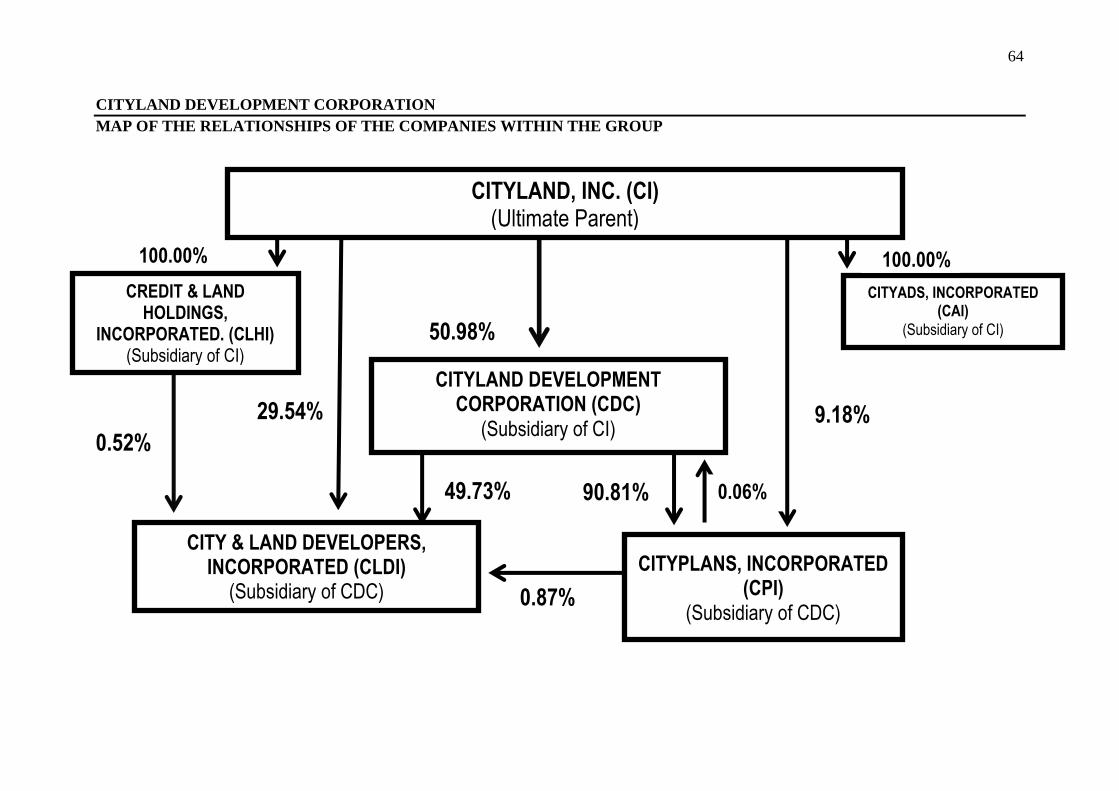
64
CITYLAND DEVELOPMENT CORPORATION
MAP OF THE RELATIONSHIPS OF THE COMPANIES WITHIN THE GROUP
0.52%
CITYLAND, INC. (CI) (Ultimate Parent)
CITYADS, INCORPORATED (CAI)
(Subsidiary of CI)
CITYLAND DEVELOPMENT CORPORATION (CDC)
(Subsidiary of CI)
50.98%
CREDIT & LAND HOLDINGS,
INCORPORATED. (CLHI) (Subsidiary of CI)
100.00% 100.00%
CITYPLANS, INCORPORATED (CPI)
(Subsidiary of CDC)
CITY & LAND DEVELOPERS, INCORPORATED (CLDI)
(Subsidiary of CDC)
29.54% 9.18%
49.73% 90.81%
0.87%
0.06%

CIIYLANDDEVELOPMENT
CORPORATION
I hereby certify that the foliowing Directors and Executive Officers of CitylandDevelopment Corporation are not elected as public servants. nor appointees, nor employees of anygoverrrment agency.
Directors:1. Dr. Andrew I. Liuson2. Stephen C. Roxas3. Grace C. Liuson4. Josef C. Gohoc5. Atty. Sabino R. Padilla".lr.6. Peter S. Dee
7. George Edwin Y. S1,Cip
8. Alice C. Gohoc9. Helen C. Roxas
Executive Officers:1. Emma A. Choa2. Rudy Go
3. Melita M. Rer,.uelta
4. Romeo E.Ng5. Melita L. Tan6. Rosario D. Perez
7. Winefreda R. Go8. Atty" Emma G. Jularbal9. Catherine Grace T. Wong
Certified by:
ATTY.Corporate
SUBSCRIBED AND SWORN TO befbre me, a Notary Public for and;nf';ls l'iif f-3{ this
ffiFR g O t&18 atfiant exhibiting to me her Social Security System-oiher
competent er,idence of identification.43383-5 and
CIryLAND
Given thi, &flfi 2 o ?$fi$i .
Doc" No. 4O ,
Pase No. meo-ot Xo.S:Series of 20i8.
r&'rr"y.
I.tsrlF.{ilt lrr0.: {47;,g {
IBL j.*,,. ll$$+rli,retr r*lt iq u na
,Tf;Tl .:_ilot5sori];_ii:r_;i0.inlMani ta5:f i-51'i {lL.:;nrii; rui.iil,..,, t.1O TOWERI, 156 H.V. DELAE'OSTA2i F CITYLAN D coN DoM I N I u M ilO*fi i:'i ;u * v B[iA't'osh s EEf 'lilXrnriil zzo
Ptr. S*&fr4ps;
P0. BOX 5000 MAKATI 1290, TEL. # : 893-60-60 FAX # ; 892-7656 www.cityland,net

OFFICIAL RECEIPTRepublic of the philippines
DEPARTMENT OF FINANCESECURITIES & EXCHANGE COMMISSION
SEC Building, EDSA, GreenhillsCity of Mandaluyong, 1554
Accountable Form No, 51Revised 2006
]ORIGINAL
DATE
;1r';.-, I r;T.. .';lli ,,:: ii'i j.-! : i; ii_jjl
No. 1651504
NorE: write the number and date of this receipt on the back of treasurywarrant, check or money order received.
TOTAL i,ijr' ?,.I?I
iiijilr :ixxljiti{: i jui. r;jijiji;ii: iiiji:i:li
f-l TreasuryWanant
f] ctrecr[-l Money order
ii* *=\i,:i,"i=:,i1,:
of Treasury Warrant,
i j i i.ii jir }iiiil.xti: ii'il t.Uijf iliiii I i ijijiiili:fti; iji ii
LF;i iiii;rii]i
liii;ilri"L$iii*Li"i