Embed Size (px)
Citation preview
C M Y CM MY CY CMY K

C M Y CM MY CY CMY K

C M Y CM MY CY CMY K
REPORT ON THE TEN YEAR HUMAN RESOURCE
DEVELOPMENT IN AGRICULTURAL GRADUATE
OUTPUTS IN SAQA ACCREDITED HIGHER
EDUCATION INSTITUTIONS
C M Y CM MY CY CMY K
Publish by:
Department of Agriculture
2006
Design and layout by:
Department of Agriculture
Obtainable from:
Resource Centre
Private Bag X250
Pretoria
0001
Printed in the Republic of South Africa
ISBN 1-8687-185-4
For further information contact
Directorate: Agricultural Information Services
Private bag X15
Pretoria
0001
Tell (012) 319-8455/8071
Fax (012) 379-8077/8131

C M Y CM MY CY CMY K
TABLE OF CONTENTS
FOREWORD BY THE DIRECTOR GENERAL 5
EXECUTIVE SUMMARY 6
1 Objectives of the project 6
2 Shape and distribution of agricultural graduate output 6
3 Analysis of demand and supply of agricultural graduates 8
4 Factors affecting the enrolment and graduation of students in agricultural fields:
admissions policy, bursaries available, and costs of study 12
5 Recommendations 16
INTRODUCTION 20
i. Background 20
ii. Objectives of the project 20
iii. Structure of this report 20
iv. Mergers of higher education institutions 21
v. References 21
METHODOLOGY 22
i. Introduction 22
ii. Main data sourcing activities 22
iii. Conditions affecting data gathering 26
iv. References 27
CHAPTER 1: THE MACRO CONTEXT 29
1.1 The context of this analysis 29
1.2 Future skills needs in the agricultural sector 29
1.3 Current and future skills needs 32
1.4 References 32
CHAPTER 2: THE STRUCTURE OF AGRICULTURAL EDUCATION PROGRAMMES IN HIGHER
AND FURTHER EDUCATION INSTITUTIONS IN SOUTH AFRICA 36
2.1 Introduction 36
2.2 Curriculum policy in South Africa 36
2.3 Institutions offering agricultural qualifications 37
2.4 Curriculum orientation of the institutions 42
2.5 Curriculum continuity in institutions offering agricultural curricula leading to qualifications 43
2.6 The agricultural programme in the FET Colleges 43
2.7 Learning programmes in the Colleges of Agriculture 45
2.8 Differences between agriculture programmes offered in Further Education and Higher Education 46
2.9 Agriculture programmes offered in Universities of Technology 47
2.10 Agriculture programmes offered in universities 49

C M Y CM MY CY CMY K
2.11 Other forms of qualification offered at the FET and HET levels 50
2.12 Flows between agricultural programmes 51
2.13 References 53
CHAPTER 3: AGRICULTURAL GRADUATE ENROLMENTS AND THROUGHPUTS FROM HIGHER
AND FURTHER EDUCATION INSTITUTIONS 56
3.1 Introduction 56
3.2 Analysis of higher education data 56
3.3 Agriculture and Renewable Natural Resources (ARNR) enrolments in higher education between
1994 and 2003 57
3.4 ARNR graduations from 1994 to 2003 59
3.5 ARNR throughput rates from 1994 to 2003 60
3.6 Race and gender equity in ARNR enrolments, graduations and throughput between 1994 and 2003 61
3.7 Gender 64
3.8 Analysis of enrolments, graduations and throughput by study field
(ARNR Second Order CESM category) from 1994 to 2003 66
3.9 Analysis of ARNR enrolments, graduations and throughput by qualification type from 1994 to 2003 69
3.10 Output of Agricultural Colleges 71
3.11 Output of FET Colleges affected by sectoral and sub-sectoral factors 73
3.12 Conclusion 75
3.13 References 75
CHAPTER 4: ENROLMENT, GRADUATION AND THROUGHPUT OF AGRICULTURAL
GRADUATES IN HIGHER EDUCATION ACCORDING RACE, GENDER
AND FIELD OF STUDY FROM 2000 TO 2003 78
4.1 Introduction 78
4.2 Summary tables of enrolments and graduations by race and gender 79
4.3 Analysis by agricultural study field 85
4.4 Summary 116
4.5 References 116
CHAPTER 5: THE INFLUENCE OF ADMISSIONS POLICY AND COSTS ON ACCESS TO
AGRICULTURAL EDUCATION PROGRAMMES IN HIGHER AND FURTHER EDUCATION 119
5.1 Introduction 119
5.2 Admissions policy: FET Colleges 120
5.3 Admissions policy: Colleges of Agriculture 120
5.4 Admissions policy: Technikons 121
5.5 Admissions policy: Universities 123
5.6 The cost of study 127
5.7 How higher education costs are presented to students 128
5.8 Comparison of full cost of study in higher education - projections for 2005 129
5.9 Costs in the Colleges of Agriculture and FET Colleges 131
5.10 Summary: Cost of study analysis 132
5.11 References 132

C M Y CM MY CY CMY K
CHAPTER 6: FINANCING HIGHER AND FURTHER EDUCATION STUDENTS IN THE FIELD
OF AGRICULTURE 136
6.1 Introduction 136
6.2 Background to the public provision of financial aid in South Africa since 1990 136
6.3 NSFAS funding of higher education studies in Agriculture 138
6.4 Funding of higher education studies in Agriculture outside of the NFSAS 141
6.5 Bursaries in the Colleges of Agriculture 145
6.6 Financial support for higher degree research 145
6.7 Comments 146
6.8 References 146
CHAPTER 7: DEMAND FOR INTERMEDIATE TO HIGH-LEVEL SKILLS WITHIN THE
SOUTH AFRICAN AGRICULTURAL SECTOR 150
7.1 Introduction 150
7.2 Employment of people with intermediate to high-level skills in the agricultural sector 150
7.3 Broad overview of the structure of the South African agricultural sector 153
7.4 Formal skills distribution within the agricultural sector 156
7.5 Current employment and demand for agricultural skills 158
7.6 General skills demand characteristics of the agriculture sector 178
7.7 References: 180
CHAPTER 8: INTERACTION BETWEEN THE DEMAND FOR, AND SUPPLY OF, AGRICULTURAL
GRADUATES WITH INTERMEDIATE TO HIGH-LEVEL SKILLS 184
8.1 Introduction 184
8.2 An overview of agricultural skills supply 184
8.3 Comparison of the quantitative data on supply and demand for intermediate to high-level
agricultural skills 186
8.4 Key features of skills demand in the agriculture sector 187
8.5 The interaction of supply and demand for agricultural qualifications 189
8.6 Conclusion 194
8.7 References 195
CHAPTER 9: RECOMMENDATIONS 198
9.1 Improving the sourcing and use of HRD information in the agricultural sector 198
9.2 Generating greater interest in agricultural careers 198
9.3 Emphasising opportunities for career-pathing in agricultural fields 198
9.4 Sustaining the quality and focus of intermediate to higher education programmes 199
9.5 Strategically targeting scarce skills 200
9.6 Support for stronger cooperation between training providers and employers 200
9.7 Fostering inter-governmental collaboration 201
9.8 Using research to understand how young people make education – career path choices 201

C M Y CM MY CY CMY K
APPENDICES
Appendix 1: Definitions used in this project 202
Appendix 2: Chapter 2 204
Appendix 3: Chapter 3 205
Appendix 4: Chapter 5 219
Appendix 5: Chapter 4 225
Appendix 6: Chapter 7 227
ACKNOWLEDGEMENTS
The project team would like to thank all the contact persons of the various institutions who provided information in
support of this research as requested. The project team would also like to thank all the respondents from the various
enterprises, organisations, associations and instituions who participated in the telephonic interview undertaken
during this research, for giving both of their time and their expertise. Finally, personal thanks are due to Professor
Leopoldt van Huysteen of the University of Stellenbosch for his interest in the project and for giving of his time and
his own documentation in support.

C M Y CM MY CY CMY K
5
Foreword by the Director General
It is my pleasure to present to you the Ten Year Human Resource Development(HRD) Review on Agriculture. It is a fact that human capital development isone of the cornerstones of a democratic South Africa.
The Department of Agriculture has made strides towards enhancing humancapital development for the entire agricultural sector by the development of theAgricultural Education and Training (AET) strategy of 2005. The strategy indicatesa need to match the supply of agricultural graduates with the market demandsin the sector. A study on throughput rates of agricultural students in the variousagricultural fields is necessary to address the concern on supply and demand.One of the tools to address this concern and towards implementing the AETStrategy is the Ten Year HRD Review on Agriculture.
The shortage of skills has long been a feature of the South African economy.The Agriculture sector is faced with a challenge of oversupply of certain skillsin one hand and a shortage of certain critical and scarce skills in another. Theprincipal, but not the only cause of the persistent shortage of skills in some
agricultural categories, has been the dual systems and skewed provision of agricultural education and training by theapartheid government.
An informed understanding and knowledge of the demand and supply of agricultural skills for the sector is thereforeessential for future planning and the Review is intended to provide this information. We can no longer afford to ignorethe disparities in skills provisioning in the sector, hence the review is aimed at assisting all the stakeholders involvedin agricultural education and training provisioning at intermediate and high levels to start engaging on the possiblelong term interventions on the supply of skills which will contribute to higher growth in the sector.
The State of Skills in South Africa Report of 2003 indicates that the demand for unskilled and low skilled people in theagriculture sector has declined, while the demand for skilled and highly skilled workforce has been increasing significantly.This Review therefore serves as an important tool for us to design viable and sustainable intervention strategies to balancethe supply and demand of skills that will bring about social change and economic empowerment for the agriculture sector.
The Ten Year Review is intended to examine various factors relating to agricultural graduate outputs in the Furtherand Higher Education and Training institutions and the employment of these graduates in the labour market. It alsoprovides the link between the supply of graduates with intermediate to high-level agricultural qualifications anddemand condit ions. The Ten Year HRD Review on Agriculture incorporates the fol lowing:
• An analysis of the shape and distribution of graduate outputs in all higher Education and Further Educationinstitutions offering agricultural programmes
• Analysis of demand and supply of agricultural graduates• Analysis of the factors affecting enrollments and throughput rates of agricultural students in the Further and
Higher Education institutions• Trends in the interaction between demand and supply of agricultural graduates.
We believe that the findings of this review will initiate a dialogue between various stakeholders in agriculture to buildthe skills base in the Further and Higher Education sector towards the realization of the vision of a united andprosperous agriculture sector.
I wish to thank the Human Science Research Council for the review and hope that the Ten Year HRD Review onAgriculture will prove valuable in sharing the information.
DIRECTOR-GENERALMasiphula Mbongwa
C M Y CM MY CY CMY K
6
Executive Summary
1 Objectives of the project
Agricultural education is an important tool that development planners can use to bring about social change and
economic empowerment. There is concern about the co-existence of shortages of skilled agricultural workers with
unemployed agricultural graduates. The Department required a service provider to conduct research and write a
report on agricultural graduate outputs that can assist in accelerating human capital development in agriculture.
The project was intended to examine various factors relating to the output of graduates in the agricultural field from
higher and further education and training institutions and their employment in the labour market. More specifically,
the objectives were:
• To analyse the shape and distribution of these graduate outputs in the targeted institutions,
• To develop an analysis of demand and supply of agricultural graduates, and
• To investigate factors affecting the enrolment and graduation of students in agricultural fields with reference
to: admissions policy, bursaries available, and costs of study.
Each of these objectives is addressed in the same order below. This is followed by a set of recommendations for
consideration.
2. Shape and distribution of agricultural graduate output
The educational institutions that contribute to skilling in agriculture in further and higher education are: ordinary high
schools, Agricultural High Schools, Further Education and Training Colleges, Agricultural Colleges and higher
education institutions.
High Schools
A large cohort of high school learners - 60 112 in 2003 - pass the subject Agricultural Science in the Senior Certificate
Examination anually but the number who qualify to study further and accumulate higher agricultural skills is unknown.
Also, the character of the Senior Certificate qualification is generalist and formative rather than vocational. Therefore,
this group of graduates is noted but not drawn further into the analysis.
Agricultural High Schools
There are forty-two Agricultural High Schools which offer a learning programme up to Senior Certificate level which
includes the same Agricultural Science (HG)/ (SG) subject offered in ordinary high schools as well as five other
Agricultural subjects from which students may select. An estimated number of 548 learners enrolled with at least
one agricultural subject in these schools in 2003. However, not all Agricultural High schools offer the full range of
Agricultural subjects and some students may take only one or no agricultural subjects. These schools therefore do
not necessarily offer a standardized vocationally focused agricultural qualification. The graduates from these schools
is noted but not incorporated into the supply side analysis.
Further Education and Training (FET) Colleges
Ten Further Education and Training (FET) Colleges provide a vocationally oriented curriculum ranging from N1 to
N6 in agriculture. In 2004, 161 people graduated across the different levels from N1 to N6, with the majority completing
qualifications in the N4 to N6 range. This study takes into account graduates of complete qualifications.
However, the semester-based structure provided by the FET Colleges allows learners to enroll for a once-off
instructional offering because this meets a particular need they have for specific skills. Therefore, to assess the
C M Y CM MY CY CMY K
7
flow of qualified personnel from the FET Colleges only through completed qualifications will lead to underestimation
of the full contribution of the Colleges to skilling agricultural workers. The data on the FET Colleges obtained from
the National Department of Education was not provided with race breakdowns. However, in terms of gender, females
constitute less than 20% of the graduate population.
Colleges of Agriculture
There are eleven Colleges of Agriculture entitled to offer qualifications in the HET band up to the BTech degree
level. In 2004, 1000 students passed the examinations in the Colleges, but the total number of graduates completing
the Higher Certificate (2 years) and the Diploma (3 years) from the Colleges for Agriculture who are considered as
labour market entrants numbered 624. Overall, between 1999 and 2004, African students were the largest group
of graduates (59%) followed by White students (39%). Male graduates consistently outnumber female graduates
on a ratio of about 5 to 2.
Technikons and Universities
(NOTE: This analysis refers to data from the higher education system before the phase of mergers)
In 2003, nineteen technikons and universities offered qualifications in agriculture and the graduation ‘output’ from
these programmes, for universities and technikons combined, rose from 967 in 1994 to 1765 graduates in 2003.
The agriculture share of total enrolment in higher education rose from 1.32% in 1994 to 1.56% in 2003. In real terms,
1 721 more students enrolled in 2003 than in 1994. Agriculture programme graduation numbers as a share of total
graduations in higher education increased from 1.30% to 1.61% between 1994 and 2003. This suggests that relatively,
the eff iciency of agriculture programmes increased sl ightly against the national average.
Consistently more students enrolled for agriculture programmes in technikons than universities, the share of
enrolments in the favour of the former on a 3:2 basis. The main feature of changing enrolment patterns in both
universities and Technikons was a significant increase in African enrolments from 42% in 1996 to 62% in 2003. In
the period under review, agriculture enrolments were consistently higher for men who accounted for 58% and 63%
of enrolments at universities and Technikons respectively in 2003.
In universities, the fields with the largest share of enrolment in 2003 were: Agricultural Economics (25%), Animal
Sciences (18%), Plant Sciences (14%) and Soil Sciences (7%). In Technikons, the fields with the largest share of
enrolment in 2003 were: Animal Sciences (29%), Horticulture (14%), and Plant Sciences (12%). Across higher
education four key fields shared the bulk of registration in 2003: Animal Sciences (25%), Agricultural Economics
(14%), Plant Sciences (13%), and Horticulture (10%).
In universities, post-graduate enrolment comprised 38% of all Agriculture enrolment, with a particularly large proportion
of enrolment at the Masters Degree level. There was relatively low enrolment of students at post-graduate levels
within Technikons at only 2% of agriculture enrolment.
In the universities, there was a wide range in the distribution of Africans by study field across the agriculture study
fields from 100% to 14% of enrolments. In other words, in some fields only Africans were enrolled while in other
fields, Africans constituted only 14% of enrolments. In the technikons, the proportions of African enrolment across
the study fields ranged from 75% to 5% for enrolments. This suggests that the distribution of African students across
different fields of study was more uneven in the universities than in the Technikons. Practically, this meant that
Africans were enrolled in greater numbers in fields such as Renewable Natural Resources, and Agricultural Extension
and in smaller numbers in courses l ike Agricultural Technology, Horticulture and Wildl i fe.
The low African enrolment in a technological subject such as Agricultural Food Technology can be partly understood
in relation to small numbers of African learners completing Senior Certificate with Mathematics and Science. Yet,
at the same time, African student enrolment in Agricultural Economics is relatively high which suggests that the

C M Y CM MY CY CMY K
8
gateway subjects of Mathematics and Science cannot be the only reason for low enrolment in particular study fields.
Easier admission criteria for Agricultural Extension programmes – which generally do not specify high levels of
mathematics skills – can partially explain why enrolment of African students in that field is so high. In some instances
there is a particular pattern of enrolment in subjects by race and gender. For example, low numbers of Africans are
enrolled for Agricultural Food Technology, and this is coupled with high female representation of 72%, which implies
that the majority group enrolled is white females.
When the pattern of enrolments is compared with graduations in the universities, there are certain fields in which
the graduation figures of Africans are markedly lower than their enrolment figures: Agricultural Food Technology
(16% lower), Plant Sciences (13% lower) and Agricultural Economics (11% lower).
It should also be noted that the representation of persons classified as ‘Coloured’ and ‘Indian’ is very low across
all agricultural fields which raises the question as to why this is the case.
3 Analysis of demand and supply of agricultural graduates
Summary of supply of intermediate to high-level skills in agriculture
The table below summarises the total number of graduates with vocational or professionally specific agricultural
training in intermediate to high slevel kills who were in a position to enter the labour market.
In 2003/2004, the number of people who were eligible to be absorbed in the labour market was 2 550. Not all of
this group would seek work (eg: some would elect to study further).
Analysis of the Labour Force Survey of 2004 suggests that there were between 33 000 and 42 000 workers in the
labour force who held degrees, diplomas and certificates in agriculture and who worked in the sector. If the 2550
graduate output is calculated as a percentage of the number of workers in agriculture who have intermediate and
high-level skills in agriculture, we arrive at a figure of between 6.1% and 7.7% (2 550/42 000 = 6.1% or 2 550/33
000 = 7.7%). In other words, this estimate suggests that the graduate output of 2003/2004 could compensate for
annual losses – or replacement demand - of skilled individuals in the sector to the magnitude of between 6.1% and
7.7%.
Output of intermediate to high-level skills graduates from agricultural education institutions in 2003/04
E
D
C
B
A
Curriculum type
Professional and
vocational
Vocational Education
General & vocational
Subject choice in
General education
Institution
Technikons and Universities
Agricultural Colleges
FET Colleges
Agricultural High Schools
Ordinary High Schools
offering Agricultural Science
Year data was
collected
2003
2004
2004
2003
2003
Graduates
1 765
624
161
548
60 112
Employment
2550
Intermediateskills
High skills

C M Y CM MY CY CMY K
9
Changes in rate of employment among workers with intermediate to high-level agriculture skills
Analysis of the South African Labour Force Survey of 2004 suggests that there were between 33 000 and
42 000 workers in the labour force who held degrees, diplomas and certificates in agriculture and who worked
in the sector. This data provides the best estimate of the total size of the agricultural workforce with intermediate
to high skills but because it is a ‘snapshot’ it cannot tell us whether gross employment is increasing or
decreasing.
Agriculture share of total employment
Employment data reveals that the agricultural labour force is in long-term decline, a trend that is attributed to general
shifts in economic activity away from primary activities towards manufacturing and services. Counter to this long-
term trend, recent evidence suggests that there has been a slight increase in agriculture’s share of total employment,
from 12% in 1995 to 13% in 2002. In real terms, employment within the sector grew by a substantial 24.7% over
the same period (Bhorat, 2003, 6). Simultaneously, there are strong signs of growth in certain agricultural sub-
sectors, especially those which are servicing export markets (eg: wine & rooibos tea).
Skilled workers share of agricultural employment
Apart from size, the skills composition of the agricultural labour force is of importance. Data on the ‘agriculture
hunting, forestry and fishing’ sector shows how unskilled workers’ share of employment declined while the share
of semi-skilled workers increased by almost the same margin between 1995 and 2002. In addition, the proportion
of skilled workers doubled – although from a very small base (Bhorat, 2003, 6). This suggests that, regardless of
whether agricultural employment is increasing or decreasing, the demand for high-level skills is likely to be higher
than for intermediate and low-level skills.
Success in finding employment
It is not unusual to find unemployment coexisting with skills shortages in a particular economic sector on account
of disequilibrium of demand and supply. Apart from the size of the unemployed group and their skills levels, a key
issue is whether unemployment is episodic or structural. Data from the Labour Force Survey of 2004 reveals that
even under the expanded definition of unemployment, unemployed persons with degrees, diplomas and certificates
from within the agricultural field of study is less than 10 000. Further empirical evidence from Moleke (2005) is
reassuring in showing that 61.6% of agricultural graduates obtained employment immediately and a further 31.%
obtained employment within one to six months. Thus only 7% of agricultural graduates did not obtain employment
within the first six months after graduation. In contrast, around 20% of graduates in ‘humanities and arts’ and ‘law’
did not find employment within six months. Those responsible for supporting employment in the South African
agricultural economy will no doubt argue that evidence of a relatively small proportion of unemployed in agriculture
is no reason for self-congratulation. Indeed, it is crucial to establish more clearly the skills profile of this unemployed
group.
Specific observations on changing skills demands in agriculture
While estimating the overall size of the supply and demand of intermediate to high-level skilled workforce is useful,
it is important to obtain insight into the current skills demand in fields of agriculture related economic activity.
To address this information need, telephonic interviews were conducted with a purposive sample of industry players
and stakeholders according to a framework that distinguished between different types of agriculture related activities
(eg: primary and secondary agriculture; supply of inputs such as seed and fertilizer; vehicles, machinery and
equipment supply; governance and support; consulting etc.).

C M Y CM MY CY CMY K
10
For the purposes of discussion, we must distinguish between general demand characteristics of the labour market
and the specific identification of scarce skills. The observations made below refer mainly to where and how demand
for skilled workers, and for workers with even higher skills, are surfacing.
The basis of the interview methodology was not robust enough to make empirically grounded observations about
the exact size of skills shortages or even to identify all occupations that are suffering shortages. Where shortages
are indicated, these must be read responsibly in relation only to the institution that the respondent is representing.
General trends in the requirement for agricultural skills are as follows:
• Managers of farms owned by corporations and commercial farmers (owner-managers) are finding themselves
under increasing pressure to obtain formal qualifications, which equip them with a range of skills and
knowledge to succeed in a somewhat volatile sector. Where corporate farms are linked to secondary
agricultural activities, the demand for agricultural qualifications is almost exclusively for the primary agricultural
aspects of their business.
• There were low levels of demand for general agricultural qualifications within secondary agriculture. Two
subsectors will suffice as examples. Demand in the food and beverage, and fibre processing portions of the
secondary agricultural sector is small - with the single exception of the production of wine. Skills that are
required are predominantly in food technology and process/industrial engineering.
Likewise among the suppliers of inputs into secondary agricultural activities (eg: chemical preservatives,
supplements and detergents) there was virtually no requirement for agricultural qualifications. Qualifications
required include organic-, inorganic- and bio-chemistry, chemical engineering, bio-technology and food
technology.
This means that the agricultural sector contributes to demand for skills and occupational competencies that
are normally considered outside of the range of agricultural occupations.
• For sales positions related to agricultural products (whether locally manufactured or imported), enterprise
recruitment policies are increasingly oriented to consider mainly graduates. This is evidence that skills
requirements are going to increase over time in sales and marketing positions. (Eg: large fertiliser companies
intend to “only recruit people in future who have the minimum N. Dip. Agric”. )
• Demand for agricultural skills arises out of the vertical integration of product value chains. The skills of
agricultural graduates and diplomates are required by the large retail organisations. These corporations
establish preferred or sole-provider agreements with their suppliers of fresh produce as a means of improving
and standardising product quality. Agricultural qualifications are required within the retail organisations to
provide farmer support around issues of crop production, the use of fertilizers and international best-practice
benchmarking, as well as for general fresh produce procurement.
• There are a large number of industry organisations, associations and societies that bring together stakeholders
within the agricultural sector in pursuit of improved sustainability of the industry or activity. These organisations
work in specific interest groups such as: professional (Soil Science Society of South Africa), producer (South
African Avocado Growers Association), service (Field Guides Association) or consumer bodies (South African
Meat Industry Company). This research reveals that these organisations are growing in importance both as
platforms for spreading information about skills and for offering specific skills training. In short, these
organisations are contributing to rising demand for skills and increasing consciousness about the value of
skills to business. In the future, industry associations may become critical players in gathering and communicating
information about skills needs and skills supply, as well as becoming training providers in their own right.
• There is growing interest among private enterprises in supporting more R&D activities in order to raise the
quality of processes and products. At the same time, within the parastatal Agricultural Research Council
C M Y CM MY CY CMY K
11
there are concerns that capabilities within the institution are being eroded. Certain of the twelve research institutes
within the organisation are struggling to the source high level of skills required within their areas of speciality.
More specific skills needs at the occupational level or level of field of study are as follows:
• Respondents in a number of large animal feed production companies observed that they struggle to fill posts
in which Animal Nutrition is a requirement – such as for the post of ‘Feed Formulator’.
• In the group of enterprises providing inputs to primary agriculture, there are strong demands among seed
manufacturers for ‘Seed Scientists’
• The specialised field of veterinary services is suffering a serious shortage of skills. This shortage is particularly
acute in government, although it is difficult to assess shortages among private veterinary practices. For
example, of all the government veterinary posts (at National, Provincial and Laboratory Level) only 59% are
currently filled (185 out of 314). Similarly only 74% of government posts for Animal Health Technicians (1,055
out of 1,423) are currently filled.
• Government as an employer experiences shortages of key knowledge specialists, especially at the high-
level qualifications requirements. Scarcity is noted for the following qualification types: agricultural economics;
agricultural engineering; hydrology; aqua-culture; horticulture; soil science; agronomy; animal science;
veterinarians; and crop protection.
• Agricultural Science is offered as a subject in Grade 12 in 2 645 high schools but it is known that not all
teachers of the subject hold these qualifications.
Respondents made the following observations regarding generic skills requirements:
• Enterprises complained that apart from the qualification itself, skilled agricultural workers required additional
competencies defined as the combination of qualification, life-skills and the ability to get the job done, that
were alleged to be in short supply.
• Respondents complained that many people apply for advertised vacancies, but lack of working experience
(especially among EE candidates) limits the employability of applicants.
• Respondents alleged that there is a ‘poor standard’ of graduates emerging from certain institutions that limits
the pool of possible candidates.
• It was generally argued, that the poor image of Agriculture as a career option is compounding the issue of
skills shortages. This is seen to be deterring really bright, ambitious and determined young people from
entering agriculture-based professions.
Key findings on the nature of demand for agricultural skills
The key findings are given below:
• Relative demand for agricultural qualifications is higher in the primary agriculture sector than in the secondary
agriculture sector
• Demand for agricultural qualifications is not restricted to primary and secondary agricultural activities, but
is also evident among firms that provide various inputs to the agricultural producers
• There is strong demand for agricultural qualifications among the organisations and institutions that provide
governance and support to agricultural activities
• Demand for agricultural qualifications within government remains critically important
There were also cross-cutting observations:
• Demand in the sector applies to highly specialised agricultural qualifications as well as to general agricultural
qualifications
• Demand for specific agricultural qualifications displays geographical variability due to the impact of climate
on the sector

C M Y CM MY CY CMY K
12
Trends in the interaction between demand and supply
This study has also identified a number of key trends which assist our understanding of how demand and supply
factors mutually interact to produce employment and unemployment trends in the agriculture sector. These trends
are given below:
• The agricultural sector is characterised by intra-sector mobility of skilled workers
• The extent of labour market demand is hidden by qualification substitution
• Demand for skills in the marketplace is mediated by employers who provide forms of focused but informal
in-service training
• Not all individuals with the same agricultural qualifications are perceived to be equally desirable candidates
for employment
• BEE and Employment Equity (EE) requirements compound the problem of scarce skills
• The pattern of supply of agricultural qualifications shows rural-urban and socio-economic bias
• The presence of regional ‘clusters’ of agricultural activity impact on the supply and demand of specific
agricultural qualifications
• Higher private sector wages draw skills away from the public sector
• The poor image of the sector is discouraging young and motivated individuals from pursuing a career in
agriculture
• Lack of adequate labour-market information contributes to sector skills imbalances
• Increasing formalisation of the relationships between role-players within the agricultural sector appears to
be driving demand for formal training
This Executive Summary has discussed the key findings of this research on the link between the supply of graduates
with intermediate to high-level agricultural qualifications and demand conditions. It now turns to examine the factors,
such as admissions policy, costs of study and availability of funding which influence student access to agricultural
programmes.
4 Factors affecting the enrolment and graduation of students in agricultural fields: admissionspolicy, bursaries available, and costs of study
The influence of admissions policy and costs on access
Admission requirements are set by an education institution in accordance with the level of difficulty of a programme
of learning in order to ensure that candidates possess the required skills and capacity to complete the prospective
course of study.
Admission requirements for FET colleges are specified for each year from N1 to N6, and are uniformly applied in
all of these institutions. In the Agricultural Colleges, uniform minimum entrance requirements are stated, but there
are several Colleges that apply additional criteria (eg: senior certificate subjects relevant to agriculture).
In general, admissions policy at the institutions:
• is more stringent as qualifications rise up the NQF levels and increasingly extends beyond common standard
requirements
• is more complex for entry at higher qualifications levels (eg: where institutions apply many different criteria
that become difficult to compare)
Only at the university level was the subject ‘Agricultural Science’ specified explicitly as a part requirement for
admission to programmes. In the Colleges, it was a recommendation rather than a requirement to have Agricultural
Science in Matric. Clearly there is no explicit advantage in getting entry to a programme for an applicant holding a

C M Y CM MY CY CMY K
13
Matric with the subject ‘Agricultural Science’. Therefore a student who took Agricultural Science instead of Mathematics
or Science or even Biology at Matric level could well be disadvantaged in her attempts to access agricultural study
opportunities in higher education.
The analysis of admission requirements across the institutions revealed that for programmes which are presented in
almost exactly the same way across institutions, where each programme contains a limited number of courses, and where
students have a limited number of options, it should be feasible to compare the effects of admissions policy on outcomes
(eg: FET Colleges programmes). However, in the case of higher education and especially universities, investigating the
impact of admissions criteria across institutions and across programmes is not possible. This is because in the universities
the following conditions apply: each programme (eg: BSc Animal Science) will involve a different set of courses in each
institution, and because there will be a variety of options, students can select individualised combinations of courses.
This means that degree programmes differ across institutions and even students taking the same degree will have different
emphases. For these reasons, student achievement is not strictly comparable unless at a highly aggregated level (eg:
type of degree such as BSc or broad field of study such as animal health).
In addition we must take into account admissions criteria that are not comparable. The different institutions each
set different criteria for admission to studies leading to a degree. For example, requirements for admission to
BScAgric programmes in the universities show quite wide variation beyond the basic Matriculation exemption. The
problem is that the variations between admission requirements stipulated by the institutions are difficult to equate
(eg: is a rule stating that a student must have a E symbol in Biology (HG) more – or less - restrictive than a rule
stating that a student must have a D symbol in English (SG)?).
Some institutions use a so-called M-Score to equate school leaver eligibility. Essentially the simple M-Score measures
overall performance of Matriculants across all Senior Certificate subjects. If the institutions involved translated their
specifications into an M-Score format, this would enable a more standardized and reliable approach to comparing
admissions policy between different degree programmes and comparing admissions policy between universities
offering the same degree programme. Nevertheless, this score in any case does not replace the specification of
other criteria. Many institutions refer to their prerogative to subject students to an ‘evaluation process’ which involves
particular tests the nature of which are unstated. The main point here is that if these processes – which are vaguely
stated - are applied, then the outcome of admissions cannot be the product only of the stated criteria. Interpretation
of the admission requirements is therefore not an exact process.
Ultimately, analyzing the impact of admission requirements must be undertaken within specific programmes and
within specific student groups. For example, the degree with the lowest admission requirement among the Bachelor
level programmes reviewed is the BInstAgric offered at the University of Pretoria. Noteably, there are no requirements
with respect to science-related subjects. Also the requirement is restricted only to a language, English, where the
cut-off off mark is Higher Grade 40%. This particular requirement could be interpreted as a strategy to attract second
language English speakers and to accommodate students from formerly disadvantaged population groups. Even
though this degree is accredited with the HEQC and is offered by a credible university, the first question is: what
prospects for employment does the degree provide? The second question is about the quality of instruction and
support within the programme: to what extent does the programme and its structure enable access (eg: through
bridging), provide support and build students in the process of their studies? Therefore, we must consider examining
particular programmes and the prospects for employment and contribution in the market place that they generate.
This is analytically feasible whereas a survey approach across general admission criteria will not provide answers.
Costs of study
Cost of studying is an important factor that affects access to study opportunities. Unless costs of studying are very
low, they constitute a serious barrier to students who wish to enroll and who qualify academically for admission but
do not have access to sufficient financial resources to meet fee requirements and other financial needs. The cost
of study is the barrier below which students who cannot raise this amount, are excluded.

C M Y CM MY CY CMY K
14
Any comparative analysis of this barrier is problematic because institutions do not levy fees in a consistent way.
There is a range of categories of fees that are charged separately by some and not other institutions. Some institutions
will not explicitly charge particular costs separately, but will bundle these costs together with other charges. Where
an institution levies these various costs separately, the amount charged for academic fees may appear lower than
the fees charged by an institution which bundles these costs together. Consequently high degrees of accuracy in
this level of detail are difficult to obtain, since institutions provide their costs in different forms and in different
documents. In addit ion, there is no off ic ial requirement for standard report ing of costs.
Another complication is that institutions build costs on the basis of courses that a student chooses rather than on
a whole programme. The actual fees payable by a student will depend on the specific modules taken during the
year, and what is compulsory and what is elective will affect the full fee debt. Annual fees will also differ according
to whether a student is part time or full time. Finally, tuition fees will differ according to the year for which the student
is registered. At many universities, first degrees in particular - but also many post graduate diplomas, and BEd
degrees - are charged per course. This means that the undergraduate degree costs are dependent on the student’s
choice of curriculum and course options.
For these reasons, it was necessary to obtain data from a source that used a consistent method of capturing cost
information. The data – for 2005 - used below was sourced from the NSFAS, which monitors study costs in higher
education as the basis for allocating financial aid.
Around the average of R12 191 for all South African higher education institutions, academic fees ranged in price
from R5 900 at Border Technikon to R20 787 at the University of Cape Town. Registration fees ranged from nil to
R1 380 at University of Venda (registration at MEDUNSA is R4 400 but this is an outlier). The average registration
fee across all institutions was R770. The lowest average residence fees of R11 437 are levied at Cape Technikon
and the highest are R23 726 at University of Pretoria. The average residence fee across all higher education
institutions is R18 227.
In those institutions that offer agriculture, the institution with the lowest average academic fees was Fort Hare
University (R7 124) and the institution with the highest average academic fees was the University of Stellenbosch
(R17 238). Overall, the Technikons/Universities of Technology that offer agriculture programmes generally set much
lower academic and registration fees than do the universities that offer similar programmes. There is however a
much smaller difference in residence fees between the institutional types.
Cost information provided by the Colleges is difficult to bring into comparison because the Colleges independently
structure their fees and bundle their costs in different ways. The average costs of study for one year across the
different qualifications offered in the Colleges could be R 15 000 consisting of R1 000 registration, R7 000 Tuition
fees, and R7 000 residence fees. In the FET Colleges, the costs of the more popular N4 and N5 (one year) and
N6 (1 year) are R3 150, R3 000 and R6 650 respectively. Variations in the scale of costs between FET Colleges
do exist.
As can be seen, there is a wide range of study costs across the three institutional types. Over and above these
institutional cost parameters, the cost of access (in respect to travel and transport) is another financial barrier that
could not be taken into account.
Funding for students studying in agricultural fields
Funding availability for study in agriculture is discussed under three headings: public funds available, private funding,
and R&D funding.

C M Y CM MY CY CMY K
15
Public funds
In 2004, 1 372 students in Agricultural fields were awarded R12 348 million rands by the National Student Financial
Aid Scheme. Between 1998 and 2002, the percentage of agriculture students who received financial aid was greater
than their share of enrolment. However, in 2003 agriculture students comprised 1.56% of all students enrolled in
higher education and only 1.5% of those who received NSFAS funding which is a slight decline that should be
monitored. In 2003, the average amount received by agriculture students was R7 946, which was 14% less than
the national average.
Within the group of students registered to study agriculture, the proportions who are recipients of NSFAS financial
assistance provides some sense of the extent of the financial ‘safety-net’ that is extended to Agriculture students.
The proportions of agriculture students who were recipients of NSFAS assistance was at its highest in 2000 at 15.7%
and then declined to 13.1% in 2003 - which means that in 2003, 13 in every 100 agriculture students received
NSFAS assistance. This raise the important question as to what other sources of financial aid is available to agriculture
students.
Data for all students receiving NSFAS support suggests that the overwhelming majority of recipients - 85% to 90%
between 1996 and 2001 - were African. Financial support in the Colleges of Agriculture is set to improve as the
NSFAS begins to offer support for students enrolled in these institutions. The qualification breakdown of NSFAS
grants within agriculture shows that the proportion of diplomates has increased from 36% in 2000 to 48% in 2004,
while recipients registered for degrees declined from 64% to 51.3% in the same period.
The Department of Agriculture provided funds to the NSFAS to the value of R5.3 million and R5.7 million in 2004
and 2005 respectively. It is a matter of concern that the full amount of funds made available by the Department of
Agriculture and ring-fenced for agricultural study was not spent in the 2004 year. The reason for this was the difficulty
in finding sufficient numbers of young people to enroll in the study fields for which there was funding available. The
Department of Agriculture has also put in place its Agricultural Bursary Scheme in order to “increase the number
of agricultural scientists in designated groups” and “to increase the number of farmers from designated groups at
commercial level”.
Private funding
A survey of sixty privately provided bursaries (eg: business, community, international donor organisations etc.),
which included agriculture as a field of study eligible for support, was conducted. Of the bursaries obtained in this
sample, 56% were dedicated specifically to agriculture or a sub-field within agriculture. In the balance of cases,
students from one or more fields other than agriculture were also eligible to compete for the bursary on offer. The
value of the bursaries ranged from R400 to R25 000 with an average value of R6 928. Private bursaries tend to
be offered in Universities and Technikons, with Colleges being specified in only 23.4% of the cases.
R & D
Support of research and higher degrees in agriculture is of critical importance in all fields to replenish the stock of
R&D personnel so that this country can maximize innovation for agricultural development. Respondents from several
different agricultural sectors expressed rising interest in R&D. Given that funding for higher degree study is specialized
and that these studies are frequently more expensive than undergraduate study in the natural sciences, the sources
of financial support are critical. The National Research Foundation supplies a range of funding opportunities. It is
necessary to establish the extent to which such funds are available to agriculture graduates through these sources
and through the Agricultural Research Council.
C M Y CM MY CY CMY K
16
5 Recommendations
Improve dissemination and use of HRD information in the private and public sector labour markets
• Improve dissemination of both supply and demand data to all role-players within the agricultural sector.
• Improve collection and use of information on mission critical agricultural skills needs in national and provincialdepartments of agriculture.
• Generate knowledge of and opportunities to pursue agricultural careers
• Market the agricultural sector’s broad range of agricultural career possibilities not only in schools, but also to the general public.
• The Department of Agriculture should discuss with the Department of Education how to make it possible forstudents who take agriculture as a subject at school to also take the key gateway subjects of mathematics and science.
• Sustain the quality and focus of agricultural study programmes
• There are clear gender and race differentials in the extent to which enrolment, graduations and throughput are distributed. In collaboration with the educational institutions, investigate such patterns and plan supportinterventions to ameliorate the causes.
• Graduates from rurally based and previously disadvantaged institutions are currently being negatively impactedby perceived differences between their education and those graduates from urban-based and historically white institutions. Research can be undetaken to establish what factors these perceptions are being basedupon.
• Investigate the possibility of supporting rural-based agricultural training institutions, such as Colleges and universities to obtain staff with the appropriate qualifications.
• Provision needs to be made for alternative paths of entry for individuals who do not meet direct requirementsin targeted study fields (eg: alternative admissions and bridging courses).
• In co-operation with the Department of Education, reinforce the importance of general life and workplace skills (eg: communication and language skills, teamwork skills; ability to work independently; ability to use computers) and integrate opportunities to learn these skills as part of the curriculum.
• Encourage education institutions offering qualifications in agriculture to integrate ‘Agriculture as Business’ skills (eg:. finance, business skills and project management skills) in curricula.
• The Department of Agriculture should focus on facilitating particular career and study pathways. Particular plans of action can be undertaken in collaboration with relevant education institutions and employer role-players to facilitate the flow of cohorts of students towards the goal of obtaining employment in occupationsthat have scarce skills needs.
• Support the capability of public education institutions to respond to industry needs in respect of particular programmes, subject to quality requirements.
Strategically targeting scarce skills
• Target a set of key occupations that are known to be in short supply and conduct an analysis of the likely future demand for these occupations over a five to ten year period (eg: seed scientists etc.).

C M Y CM MY CY CMY K
17
• Encourage an increase in the number of graduates obtaining higher level agricultural and research qualificationsat the M.Sc and PhD levels to support national agricultural R&D.
• Set aside funding for ‘bursaries’ to international institutions for particular specialised qualifications, which arenot offered locally.
• Investigate the possibility of implementing a scarce skills allowance and rural allowance that applies to particular scarce skills (eg: such as veterinarians) in the public service.
Support for stronger cooperation between training providers and employers
• Consider ways of supporting industry organisations (eg: sub-sectoral bodies such as in the sugar industry or professional associations) which through their activities improve the training and skills development culture,act as networking hubs for skills related information, and sometimes themselves engage in training.
• Contracting a research agency to conduct skills needs analysis for particular targeted agricultural sub-sectors.If a trustworthy empirical analysis were undertaken of the value system of a particular industry to show skillsneeds, employers would be more likely to invest in training.
• Seek ways of supporting higher education-industry linkages that involve the development of curricula and programmes to meet niche industry needs in either the public or the private sector.
• Foster a strong relationship with the new AGRISETA to support the accreditation of intermediate to high-levelskills that are developed in the form of Learnerships at the appropriate NQF levels.
• Conduct case studies of agriculture industry organisations that have established relationships with educationproviders (eg: higher education institutions, agricultural colleges etc.) to identify best practise models of curriculum development in key fields of agriculture.
Foster intergovernmental collaboration
• The Department of Agriculture should pursue discussion with the Department of Education with the aim of assisting to shape the future of the Agricultural High Schools. Data from the research suggests that AgriculturalHigh Schools are becoming more strongly generalist and losing their original mission focus.
• The Department of Agriculture may wish to engage with the Minister of Education and provincial Departmentsof Agriculture in defining the mission of the Agricultural Colleges. There is evidence that certain provinces aim to shift the higher education mandate of Colleges towards farmer support (e.g.: Mpumalanga province).Plans to shift the mission of these institutions towards local needs may produce a gap in the national productionof high skilled human resources.
Understand how young people make education and career path choices
• Conduct tracer studies to follow the career choices of young people: in the year of their first major career oriented subject choice in Grade 9, and in the critical periods when they make decisions regarding higher education studies and occupational choice.
• Monitor the distribution of bursaries from NASFAS, and recipients of ‘scarce skills bursaries’ to assess the extent to which these schemes are contributing to building the human resource base of the agriculture sector,and to career advancement of ‘scarce skills’ bursary recipients.

C M Y CM MY CY CMY K

C M Y CM MY CY CMY K

C M Y CM MY CY CMY K
20
Introduction
i. Background
In South Africa’s democratic era, government is faced with many challenges, among which are the issues of generating
equity and social and economic development. Agricultural education is an important tool that development planners
can use to bring about social change and economic empowerment.
There is pressure on agricultural education and training in South Africa, not only in terms of aggregate demand but
also in terms of its nature and focus. It has to respond to the Key Result Area given in the DoAs 2003 Strategic plan:
“Optimising growth, remunerative job opportunities and income in agriculture “and “To increase remunerative
opportunities in the agricultural supply chain” (Department of Agriculture, 2003, 19).
The Department of Agriculture developed the “Agricultural Education and Training Strategy” to address human
capital in agriculture. There is concern about the co-existence of shortages of skilled agricultural workers with
unemployed agricultural graduates.
The Department required a service provider to conduct research and write a report on agricultural graduate outputs
that can assist in “accelerating human capital development in agriculture in the right direction and ensuring a
sustainable agriculture”.
ii. Objectives of the project
The project was intended to examine various factors relating to the output of graduates in the agricultural field from
higher and further education and training institutions and their employment in the labour market.
More specifically, the objectives were:
• to obtain data on graduate outputs and analyse the shape and distribution of these outputs in the targeted
institutions. The research was to take into account graduates in SAQA accredited programmes of agricultural
study in the higher and further education fields
• to investigate factors affecting the enrolment and graduation of students in agricultural fields with reference
to: admissions policy, bursaries available, and costs of study
• to develop an analysis of demand and supply of agricultural graduates
iii. Structure of this report
Following after a description of the methodology used in this study, the report will have the following chapters:
• Chapter 1:
The macro context
• Chapter 2:
The structure of agricultural education programmes in higher and further education institutions in South Africa
• Chapter 3:
Agricultural graduate enrolments and outputs from higher and further education institutions
C M Y CM MY CY CMY K
21
• Chapter 4:
Enrolment, graduation and throughput of agriculture graduates in higher education according to race, gender
and field of strudy from 2000 to 2003
• Chapter 5:
The influence of admissions policy and costs on access to agricultural education programmes in higher and
further education
• Chapter 6:
Financing higher and further education students in the study field of agriculture
• Chapter 7:
Demand for intermediate to high-level skills within the South Africa agricultural sector
• Chapter 8:
Interaction of demand and supply of agricultural graduates with intermediate to high-level skills
• Chapter 9:
Recommendations
• Appendices
Appendix 1: Definitions used in this project
Appendix 2: Chapter 2
Appendix 3: Chapter 3
Appendix 4: Chapter 5
Appendix 5: Chapter 7
iv. Mergers of higher education institutions
It should be noted that institutional mergers have been undertaken in the higher education sector. This means that
the former universities and technikons have been reconfigured in a process of creating: universities, comprehensive
universities, and universities of technology. Where data is reported on before 2004, the data refers to the former
universities and technikons.
v. References
National Department of Agriculture (2002) Strategic plan for South African agriculture
Accessed at: http://www.nda.agric.za/docs/sectorplan/sectorplanE.htm
Date accessed: 29/07/2003
National Department of Agriculture (2003) Strategic plan for the Department of Agriculture: 2003 – 2006 Pretoria,
Department of Agriculture.

C M Y CM MY CY CMY K
22
Methodology
i. Introduction
This chapter provides an overview of the methodology utilised in this study. The first section provides an overview
of how data gathering feeds into analysis through the project process. The second section considers the four main
data sourcing methods and activities. The last section of this chapter, unpacks some challenges that were confronted
in the access, generation and analyis of the data used in this study.
The methodologies chosen were considered to be the most appropriate to the objectives of the study, as outlined
below:
• To analyse the shape and distribution of agricultural graduate outputs in the targeted institutions
• To develop an analysis of demand and supply of agricultural graduates, and
• To investigate factors affecting the enrolment and graduation of students in agricultural fields with reference
to: admissions policy; bursaries available; and costs of study
Accordingly, the activities required to meet each of the above objectives is briefly sketched.
A Achieving A above required:
a) Obtaining data on enrolments and graduates with intermediate to high-level agricultural skills from intermediate
and higher education instituions which fall into the categories: FET Colleges; Agricultural Colleges; Technikons;
and Universities. The student graduates of high schools offering agricultural subjects were not analysed in
depth as they do not provide whole programmes leading to specific agricultural qualifications.
b) From this data, throughput rates were calculated.
B Achieving B above required
c) Obtaining data on the size, employment status and other characteristics of persons holding intermediate and
high-level agriculture qualifications in the labour market
d) Comparing the findings from (a) above with (c) to assess what replacement need in the labour market could
be accounted for by the graduate output of the institutions
e) Conducting a number of targeted telephonic interviews with academic leaders from HET and FET Agriculture
Faculties involved with graduate supply, as well as with key employers in the agricultural sector.
f) Integrating the findings from (v) with data from (iii) to obtain an overview of the relationship between supply
and demand of skills in the agricultural sector
C Achieving C required:
g) Obtaining data about: admission requirements and fee requirements from the institutions themselves; National
Student Financial Aid Scheme financing of higher education students from the NSFAS itself; and various
bursary and other scholarship opportunities from private and NGO information sources
h) Analysing this data to develop an understanding of the factors that impact on the number and demography
of those students who successfully register for agricultural programs and those who eventually graduate
ii. Main data sourcing activities
From the overview presented above of the procedures followed to address each objective, the main data sourcing
activities (which related directly to the numbered activities above) were:
a Obtaining data on enrolments and graduations

C M Y CM MY CY CMY K
23
c Obtaining data on the size, employment status and other characteristics of persons holding intermediate and
high-level agriculture qualifications in the labour market.
e Conducting a number of targeted telephonic interviews with role players in the sector to establish key skills
needs and training initiatives, and
g Obtaining data: about admission requirements, fee requirements, financing and bursaries
These are outlined in detail below.
a. Obtaining data on enrolments and graduations
Contributions to intermediate and high-level agricultural skills within the labour market are made by tertiatary education
insitituions which fall into the categories: FET Colleges, Agricultural Colleges, Technikons and Universities. The
student graduates of high schools offering agricultural subjects were not analysed in depth as they do not provide
whole programmes leading to specific agricultural qualifications.
The number of enrolments and graduates produced by each of these insitituitons was calculated. In the case of
Technikons and Universities this was done for the period 1994 to 2003. In the case of FET Colleges and Agricultural
Colleges, this scale of historical data was not available. Data for these institutions was analysed for the period 2000
to 2004 where data was available.
Throughput
Throughput is a key indicator of efficiency of educational institutions and reveals the extent to which students
complete the programmes for which they enrolled in the optimal allocated time. The graduation rate remains the
best proxy for measuring throughput in South Africa. Throughput is defined as the number of years students take
to complete the learning programme for the qualification for which they registered. Unfortunately, there is currently
no available accurate means of calculating throughput rate in South Africa. This would require cohort studies which
trace a group of students from first-year to graduation and is thus not possible to calculate from the data that can
be obtained from the two relevant data sources: the South African Post Secondary Education (SAPSE) database
or the Higher Education Management Information Systems (HEMIS) database. The graduation rate, which is used
as a proxy, is officially defined as the number of graduations divided by the total number of enrolments within the
entire programme in the same year (Subotzky, 2003). The graduation rate is therefore a measure of the rate at
which students graduate from these institutions and suffers large fluctuations on an annual basis depending upon
fluctuations in headcount enrolments in a particular year, as well as numbers of repeaters, drop-outs, conversions
to other courses etc.
Throughput, in the form of graduation rates, was calculated only for the Technikons and Universities.
CESM categories
National data on student enrolments and graduations is organised according to Classification of Education Subject
Matter or CESM classification. This system provides a single, standardised scheme that facilitates the recording,
reporting and comparing of data about subject matter. The development of this standard classification of subject
matter facilitated compliance with the statutory reporting requirements for various educational agencies and institutions
and expedited communication and information exchange about subject matter regardless of the type of the organisation
providing instruction.
The CESM classification enables inter-institutional data comparisons, as institutions’ data systems involve the use
of CESM for a number of purposes. While institutions have their own internal management units such as faculties
and Departments, for funding purposes as well as monitoring performance, CESM and its current categories will
need to be retained.
C M Y CM MY CY CMY K
24
The following links exist in the HEMIS database:
• CESM categories are directly linked to Courses in the “COURSE FILE” table.
• Courses are directly linked to Qualifications in a separate table, “COURSE REGISTRATION FILE”.
• The field ‘Course’ in both tables mentioned above, creates an indirect link between CESM categories and
Qualifications.
CESM categories include information on students enrolled in other programmes/qualifications who chose an
Agricultural subject as an elective. This information is included within the 2nd order Agricultural CESM categories,
which all fall under the 1st order CESM category of ‘Agriculture and Renewable Natural Resources’. In other words,
2nd order Agricultural CESM categories do not distinguish between students enrolled in Agricultural programmes
and those students enrolled in other degree/diploma programmes with an Agricultural elective.
HEMIS only provides information at the highest level and does not have information on the curriculum of institutions.
The qualification codes, course names and course codes in the HEMIS database are unique to the institution;
however, the CESM categories are standard across the system.
The institutions are supposed to confer generic qualifications. Only Technikons use generic qualifications, which
are standardised across the system, while individual universities structure their own qualifications, which differ among
institutions. Notably, from 2005 Technikons will also be able to structure their own qualifications.
While it was possible to extract information from HEMIS according to CESM categories, an attempt was made to
independently obtain data from the institutions at the qualification level. The following was observed:
• The information that the HE institutions were able to provide by qualification level was drawn from the same
data source supplied to the HEMIS directorate
• Some institutions kept their data in different formats before uploading into the required HEMIS format.
However, this information could not be used since it varied from institution to institution in how it was coded,
captured and formatted, as this was designed to suit their own purposes
• It could not be established whether information obtained directly from the faculties was more or less accurate
than the data contained in the HEMIS CESM categories. In the end, the HEMIS data on the basis, of itd
being standardized and quality assured, was considered the best option
b. Obtaining data on the size, employment status and other characteristics of persons holding intermediate
and high-level agriculture qualifications in the labour market.
Data indicating the size, employment status and other characteristics of persons holding intermediate and high-level
agriculture qualifications was obtained using the Labour Force Survey (LFS) for March 2004. From the LFS data
the overall size of the agricultural labour force, and the proportions thereof with intermediate to highlevel skills, was
extracted. Analysis entailed reference to the distribution of agricultural workers, and the distribution of workers with
intermediate and high-level agriculture qualifications, by occupation (SOC), sector (SIC), and income levels.
c. Conducting targeted telephonic interviews with role players in the sector to establish key skills needs
and training initiatives
Once the researchers had explored the labour force data, contact was also made with a number of organisations
involved directly in economic activities in the agricultural sector. Information was obtained regarding the nature of
these employers’ requirements for agricultrual qualifications among their employees. Outside of the request for
micro-level – at level of organisation or enterprise - quantitative information, disucssions regarding the availability
of such agricultural skills, as well any indications of changing skills demands within the sector, were also undertaken.

C M Y CM MY CY CMY K
25
The process of preparation for the interviews was:
Phase I: Internet based and general documentary research into the structure and skills demands of the South African
agricultural sector was undertaken to identify the various skill-absorbing role-players within the industry as well as
the relationship between these. From this information, the schematic representation of the sector outlined in Table
5 in Chapter 7 was developed.
Phase II: Using Table 5 as a basis for selection, a cross-section of larger individual firms, organisations, institutions
and government departments operating within the various areas of the sector (A-E in Table 5) were contacted
telephonically in order to obtain information regarding their demand for agricultural qualifications.
Individual firms and organisations were approached with a particular focus intended to minimise the effort to these
respondents. ‘Agricultural qualifications’ were explained as inclusive of all agriculture-focussed qualifications from
the Diploma level upwards (including Agricultural Economics but excluding Veterinary and related fields) without
reference to any other specific subject specialisation.
Contact with firms and organisations were intended to fulfil two purposes. Firstly, information on the numbers of
current employees with agricultural qualifications as well as the vacancies for such employees was requested,
although this latter aspect was not always available. Secondly, discussions around recruitment issues i.e. trends
in internal skill requirements versus external availability, succession planning and internal training, were initiated
with respondents where possible.
Based on this data gathering it was planned to integrate the findings with the quantitative data in order to provide
an overview of the key trends in demand and supply of agricultural qualifications.
d. Obtaining data about admission requirements, fee requirements, financing and bursaries
Information on bursaries
Apart from government co-ordinated financial support for students, there is a range of agencies that provide financial
support on their own initiative. The grouping of sources of student financial assistance can be described as follows:
• National Student Financial Aid Scheme (NSFAS)
• Institutions of education at the Further and Higher Education levels
• Other sources:
- Trust funds (eg: various small to large philanthropic trusts)
- Industry bodies (eg: South African Sugar Industry)
- Enterprises (eg: as part of their corporate social responsibility commitment)
Data on financial assistance for students in South Africa at the Further Education and Higher Education and Training
levels is not available from a central information resource. This is to be expected since, apart from the NSFAS, the
various bodies elect to provide this support and to advertise its availability in their own right.
A complete view of all financial aid provided by the NFSAS was available from the NFSAS offices and is analysed
separately. While there is no central source of information on other providers, there are two third party organisations
that bring together information on financial assistance for students. The two main organisations operating in this
field are as follows:
• The Bursary Register publishes a hard copy resource that provides information on bursaries available from
various agencies in South Africa.
• Careers.co.za publishes “Career Mentor” which is a computer based Career Guidance and Information
System available on CD. It consists of a database of careers, bursaries and study information for South
Africa.

C M Y CM MY CY CMY K
26
Both of the above resources were obtained for the purposes of this research. However, even though these sources
make claims to providing fairly exhaustive information, these claims could not be verified without undertaking a
special purpose survey to actually uncover all sources of student financial aid. Such a task was not within the time
or budget bounds of this project.
The data from each source was analysed separately, since the precise methodology adopted by each of the data
providers differed eg: in terms of what information was collected and how it was collected.
In addition to the above sources, the project team also searched the Internet for possible sources of bursaries.
Bearing in mind that the aim was to investigate bursary availability in the field of agriculture only, there was hardly
any information on the Internet beyond what was provided in the two publications given above.
Bursary information for the 2004 and 2005 years only were used, as this information changes annually.
Information on entrance requirements, and fees and fee structures
Information on entrance requirements was obtained from the following resources:
• The relevant institutions themselves
• The Bursary Register, which publishes a hard copy resource
• Careers.co.za, which publishes “Career Mentor” - computer based Career Guidance and Information System
available on CD
These three sources were used in order to obtain a standard report of entrance requirements for all institutions in
the higher education band that offer agriculture related courses. This information was verified through spot-checking
data with a sample of institutions.
This information on entrance requirments, and fee and fee structures is based on the rules applying in the 2003/2004
academic year.
iii. Conditions affecting data gathering
A number of condit ions affected the data gathering process. These are out l ined below:
Mergers
The mergers in progress physically disrupted access to data. This was due to a couple of key compounding factors:
Firstly, older datasets were not easily accessible from the merged institutions; and secondly, people who were in
management and in contral of data prior to the merger are currently no longer in charge. Complicating the process
of data analysis is the actual mergers themselves, as well as the fact that some progress has been made with the
rationalization of courses for the 2004 and 2005 academic years. As this latter is sill ongong, data relating to
reformulated programme is difficult to finalise.
Recency of data
The latest data available on enrolment and graduations in the universities and technikons is for 2003, because the
HEMIS system is still in the process of validating the 2004 data. This means that the enrolment and graduation
figures reports on the last year when the technikons and universities were separate – i.e. before the mergers. It is
thus difficult to match this data with reference to the current programme-based data.

C M Y CM MY CY CMY K
27
Data for the Agricultural Colleges was difficult to obtain
There was a problem obtaining standardized validated data on the Agricultural Colleges. When the proposal was
submitted, the HSRC was in contact with Dr Alvin van Niekerk of AvN CONSULTING who indicated that he could
provide the relevant college student records for 1999-2002. However, Mr Van Niekerk emigrated and the database
was not passed on to the Association of Principles of Agriculture Colleges (APAC). This data had to be sourced
directly from the institutions and from APAC. The Department of Education was approached to ascertain whether
data on the Colleges was available via the FETMIS. The FETMIS system is currently under development in that
Department, and this was thus not possible.
Data on the FET Colleges
The Examination data for the FET Colleges was obtained from the DoE’s website. However, it was discovered that
exam results would be insufficient to obtain a picture of graduations and the records of FET College certification
was requested from the DoE. Institutions frequently did not have the data readily available. In very few instances
was data going back into the early nineties available.
Additional data requested
The HSRC was requested to obtain data on scarce skills categories of personnel, such as veterinary surgeons and
agricultural engineers. Specific contact was made with the Veterinary Science Faculty of the University of Pretoria
at Onderstepoort in order to obtain information on veterinarians. Addtionally, the management of HEMIS were
requested specially to provide the datasets to enable extraction of the agricultural engineers’ data as this CESM
does not fall under agriculture.
iv. References
Committee of Technikon Principals (CTP) (2002) A policy document on the requirements for admission to a Technikon
November 2002 Pretoria, CTP
Accessed at: www.nu.ac.za/ieasa/EntranceRequirements.PDF
Date accessed: 14 March 2005
Department of Education (DoE) (2004) Further Education and Training (FET) college examinations report: 2004
Pretoria
Accessed at:
28b-12-04%20Final.doc
Date accessed: 14 March 2005
Labour Market Skills Development Programme (LMSDP) (2002) Understanding the South African Skills Development
System: A reference source Pretoria, Department of Labour.
Accessed at: www.trainingsupport.co.za/Docs/NQF%20QUICK%20Ref.pdf -
Date accessed: 15 March 2005
South Africa, Government of (1995) Act No.27 of 1995 Technikons Amendment Act No. 159. 21 July 1995.
South African qualifications Authority (SAQA) (2004) Criteria and Guidelines for Short Courses and Skills Programmes:
Guideline document Pretoria, SAQA
Accessed at: http://www.uovs.ac.za/support/chesd/03/Part%201.pdf
Date accessed: 16 March 2005
Strydom, J.F. (2002) Access to Higher Education: A research project for the FOTIM and FSHFETT Johannesburg,
FOTIM/FSHFETT.
Accessed at: http://www.fotim.ac.za/docs/accessstrydomreport1102.doc
Date accessed: 04 March 2005

C M Y CM MY CY CMY K

C M Y CM MY CY CMY K
29
CHAPTER 1
The macro context
1.1 The context of this analysis
The Department of Agriculture is concerned about the flows of people with agricultural skills into the labour market.
This is because of the co-existence of numbers of unemployed agricultural graduates, with shortages of agricultural
graduates in particular occupational categories (eg: agricultural engineers, agricultural economists and veterinarians)
in the labour market. Furthermore, the Department is aware that globalization and associated technological advances
are producing changes in national and international markets for agricultural products. As part of the process of
strategically positioning the South African agricultural sector to address national developmental goals as well as
global pressures, the Department of Agriculture wants to obtain a picture of what the future skills needs of the sector
are likely to be.
1.2 Future skills needs in the agricultural sector
In analysing the relationship between agricultural growth and development, on the one hand, and human resource
needs on the other, Barry (1995,133) observes that we need to understand the “integrated nature of the effects of
industrialization and their relationships to social goals for consumers, agriculture, natural resources and rural areas”.
Nevertheless, it is necessary for the purpose of analysis to separate out the range of influences on the future skills
needs of the agricultural sector, which has been done as follows. Each of the themes below will be treated in turn:
• Macro-economic factors
• South Africa’s participation in national and international agricultural markets
• International trade implications for government regulation
• National government policies
• Technology in the agriculture value chain
• High-level management and strategic skills needs in the agricultural sector
1.2.1 Macro-economic factors
Currently, the South African government has created a favourable economic environment in which the macro-
economic fundamentals such as low interest rates, strong currency, limited inflation pressure, and above inflation
wage growth (DoA, 2005,5) have been achieved. Naturally, this favourable environment cannot be viewed in isolation
and is also subject to external changes and shocks such as: changes in the oil price; relative strength of major
currencies such as the dollar; and the general shape of the world economy, and also regional economic blocs such
as Europe, emerging Asian countries, China, India, the USA and Sub-Saharan Africa in terms of real GDP growth.
The impact of these external factors is complex, as they can create contradictory pressures on the agricultural sector.
For example, the strong Rand makes it possible for agricultural producers to replace capital equipment, but drives
down prices and reduces the competitiveness of agricultural exports (DoA, 2005, 8).
Furthermore these factors will, in combination, have general and specific effects on the intensity of growth or decline
across different agricultural subsectors which will have human resources implications. The actual dimensions of
changing human resources needs cannot be clearly identified at such a high level.
1.2.2 South African enterprise participation in national and international agricultural markets
The evolution of global and national markets for primary agricultural and agro-processed products is obviously

C M Y CM MY CY CMY K
30
conditioned by the broader economic climate. However, growth in the size and output of the agricultural sector of
a particular country is not determined entirely by the macro-economic environment. Also vital is the extent to which
enterprises, entrepreneurs and industry bodies (eg: Grain SA, Capespan Group, National Wool Grower’s Association,
SA Flower Growers Association) in agriculture are pro-active in developing and improving products and in targeting
markets both internal and external.
Government is a key player in respect to the opening of markets through securing trade agreements. For example,
growth in agricultural exports from developing countries is dependent on WTO agreements on agricultural export
subsidies and reductions in trade distorting domestic support in agriculture (AgriNews, 2004, 6). Then there are
specific multilateral agreements that can encourage trade such as the Trade, Development and Cooperation
Agreement (TDCA) with the European Community entered into in 2000, which provides incentives for all agro-
processing industries, but which South African SMEs have not fully capitalised on (Groenewald, 2005a, 4-9). More
targeted bi-lateral trade agreements are negotiated between countries such as between South Africa and China
which is a major new market for SA (AgriNews, 2004, 3). Hardy (2004a, 4) quotes Mbongwa on the potential role
of government in marketing as follows: “Another important issue is the role of government in agricultural marketing
and the appropriate institutional structure to achieve this role”.
There are various dimensions of trade that must be identified at the industry and the value-chain level to make it
possible to isolate the particular skills and human resources dimensions at stake. In South Africa, further research
and analysis needs to be undertaken that links shifts in international trade and their underlying human resources
requirements.
1.2.3 International trade implications for government functioning
Enhancements in trade especially internationally will produce requirements on government to regulate various
aspects of trade interactions, which will in turn produce increased human resources requirements. These include:
• Personnel in the South African Food and Quarantine Inspection Services (Department of Agriculture, 2004,25)
and directorates under national regulatory services
• Veterinary services to deal with transboundary (animal to human) diseases and to control disease outbreaks
in the animal population (Hardy,2004b,3)
• International imposition of regulations also requires local personnel to implement them. One reason for this
is that, international trade is increasingly subject to greater controls against risks of importing exotic pests
into a domestic biosphere. For example the International Standard for Phytosanitary Measures No.15
“Guidelines for regulating wood packaging material in international trade”, which aims to reduce risk and
spread of quarantine pests associated with wood packaging, has just been promulgated and will need
personnel to implement (Groenewald,2005b,5).
1.2.4 National policy
In the process of policy development, the South African Department of Agriculture may generate human resources
needs. New policies or amended policies, which indicate new strategic directions or changes in direction of the
governance of the domain of agriculture, can generate new skills needs. The following are examples of this possibility:
• The launch of the Agricultural BEE policy refers to ‘skills and knowledge’ needs (Swanepoel et al 2004) of
beneficiaries in various fields of agriculture especially at technical and management levels
• The policy to push for biodiversity as a key to food security (Groenewald,2004,1-2) produces needs for
scientists to explore ways of sustaining biodiverse agricultural practices
• The commitment through SADC and NEPAD to support research to assist with the revitalisation of African
Agriculture (Mulaudsi,2005,8) has high-level research skills implications
• Bi-lateral and multi-lateral trade agreements directed by government can facilitate growth in particular sectors
of agriculture
As can be seen, government policy can create the conditions within which particular human resource needs arise.

C M Y CM MY CY CMY K
31
New policy can create skills needs within the Department which must implement the policy. New policy also can
create opportunities for the private sector, but the private sector will have to obtain skills in order to capitalise on
the opportunities.
1.2.5 Technology and the agricultural value chain
It is important to view the contribution of agriculture to the national economy not just with reference to the value of
primary products that it generates in their ‘raw’ form. Value chain analysis enables us to understand the full range
of activities that contribute to the delivery of value in the form of a product to the consumer. It accounts for the fact
that agricultural products are linked in a chain of processing and other value-adding activities before the product is
ultimately purchased by the consumer. This means that increasingly, the agricultural producer must contribute as
an active participant in the process of value-adding to the final product according to consumer requirements whether
the consumer is local or global.
This means that even though the contribution of Agriculture to South Africa’s Gross Domestic Product (GDP) is in
the region of 4% - 5% and it directly provides for about 10% of the country’s jobs, in reality the sector make a far
larger contribution. Taking upstream processing and related activities and linkages into account, agriculture creates
employment for an estimated 16% of the workforce across other sectors such as manufacture and food and
beverages. Sub-sectors of manufacture and food and beverages contribute one quarter of manufacturing’s 37%
share of the South African GDP (Agriculture and Agro-processing Working Group, 1998, 4-5).
If it is assumed that primary agricultural producers do not merely supply raw materials into agro-processing, then
we understand that the activities associated with primary production are integrally part of the entire agro-processing
chain. As such we must look imaginatively both downstream and upstream at ways in which technology and improved
producer practices can yield efficiencies and better quality of product and service in the local and global marketplaces.
Possibilities for technology applications include (Agriculture and Agro-processing Working Group, 1998, 5-7):
• Breeding technologies: Extended production systems that link with on-farm production lifecycles which can
impact positively on industrial processing quality
• Biotechnologies: Applied to augment or supplant traditional breeding techniques thereby improving crops
and animals, or to diversify the product base through developing new genetic materials
• Natural resource management and resource utilisation knowledge: Applied to support sustainable utilisation
of natural resources (eg: water saving technologies) and waste management
• Processing technologies: Lead to improved product packaging, handling and preservation which provide for
higher quality and extended ‘shelf-life’ that in turn make products more competitive locally and globally
• Integration and adaptation of information and communication technologies (ICT): As a general purpose
technology this can contribute to various technical processes associated with each of the points above,
thereby enhancing competitiveness. The importance of ICT is that currently technologies can exist without
any awareness of their potential application inside agro-processing (eg: odour sensors or ‘electronic noses’
may be used in beer manufacturing but not in dog food manufacturing)
Any of the above potential areas may be identified as an opportunity for future development. This may be decided at the
level of an enterprise or an industry, or government can decide that it wants to apply subsidies or other measures to
encourage growth in an area of agro-technology. However, this means that government and industry players must be
aware of the implications of such decisions for the supply of appropriately trained personnel from higher education.
1.2.6 Management and strategic skills needs
In addition to the kinds of interventions noted above that impact specifically on agricultural value chains, there is a
set of important managerial capacities that must be fostered in South African agriculture so that an enabling
environment is created for sustainable growth and market development to take place in as many agricultural sub-
C M Y CM MY CY CMY K
32
sectors and markets as possible:
• Appropriate economic and socio-economic research and analysis undertaken
• Information delivery to participants at all levels (eg: workers, employers, entrepreneurs, government planners
and legislators)
• Systems modelling and risk management capability to assist in macro-strategic decision making
• Technology transfer which is considered to be extremely important in assisting less developed agricultural
sectors. The key issue here will be in the prior identification and selection of technologies appropriate to do
the job
• Climate and early warning systems for decision making
These kinds of high-level skills are essential in the private and public sector to ensure sustainable growth in agriculture.
However, they may not be available in the right numbers for deployment in the national economy.
1.3 Current and future skills needs
The discussion above showed how the drivers of skills demand in the agricultural sector are extremely varied.
Knowledge of policy and industry trends can assist us to some extent in identifying current and future areas of skills
need.
This report will explore the possible links between agricultural economic activity and skills needs on the one hand,
and skills supply on the other. The following chapters will set out the supply side through a review of the public
institutions engaged in agricultural education and training in South Africa. This will be followed by a review of demand
side factors and the policy recommendations which flow directly from the researach findings.
1.4 References
Agriculture and Agro-processing Working Group (1998) Foresight Agriculture Report National Research and
Technology Foresight Project
Accessed at:
TURE%20REPORT.doc
Date of access: 15 March 2005
AgriNews (2004a) “China major new market for SA” October No.9 p.3.
AgriNews (2004b) “Fewer commercial farms more competitive” October No.9 p.5.
AgriNews (2004c) “WTO agreement means progress” October No.9 p.6.
AgriNews (2005) “TUT opens agricultural skills centre” January/February No.1, p.16.
Barry, P.J. (1995) Industrialisation of U.S. Agriculture: Policy, research, and education needs Agricultural and Resource
Economics Review 24(1) 128-135.
Department of Agriculture (2004a) Strategic Plan for the Department of Agriculture, 2004 Pretoria, Department of
Agriculture.
Department of Agriculture (2004b) Trends in the Agricultural Sector 2003 Pretoria, Department of Agriculture.
Department of Agriculture (2005) Quarterly Agricultural Economic Review and Forecast: October to December 2004

C M Y CM MY CY CMY K
33
Volume 2 Number 4.
Groenewald,S. (2004) Biodiversity key to achieving food security AgriNews No.10 pp.1-2.
Groenewald, S. (2005a) Import and export incentives aimed at all agro-processing industries AgriNews No.1 pp.4-
9.
Groenewald, S. (2005b) Wood packaging regulations implemented from 1 January AgriNews No.1 p.5.
Hardy, Y. (2004a) Mbongwa on future of agriculture AgriNews October No.9 p.4.
Hardy, Y. (2004b) Government concerned about veterinary services AgriNews October No.10 p.3.

C M Y CM MY CY CMY K

C M Y CM MY CY CMY K

C M Y CM MY CY CMY K
36
Chapter 2
The structure of agricultural education programmes in higher and further educationinstitutions in South Africa
2.1 Introduction
Most education systems produce a variety of qualifications that are relevant to existing agricultural occupations and
to the broad shape of the agricultural sector. These qualifications are associated with a range of programmes dealing
with agriculture related forms of knowledge - and difficulty levels - such as those identified in Table 1 below
Table 1: Typical range of qualifications offered across an education system
• Post-doctoral research degrees
• Doctorates
• Masters degrees - Masters Certificates & Masters Diplomas
• Professional Qualifications
• Honours degrees - Postgraduate Certificates & Postgraduate Diplomas
• National first degrees
• Higher diplomas
• National diplomas
• National certificates
Typically, in different countries such qualifications are offered by different institutions, from schools to higher education
institutions. Such qualifications envisage different skill and knowledge outcomes that may range from the vocational
to the purely theoretical. Curriculum intentions may include certain attitudinal and motivational attributes regarding
agriculture. Also, the various qualification are sometimes linked to each other suggesting that a student can progress
through various steps in building her knowledge and skills in the field (eg: from certificate to degree to post-graduate
qualification). Understanding these characteristics helps us to understand the overall structure of agricultural qualifications
in a particular country. The aim of this chapter is to understand the shape of South Africa’s qualifications structure.
2.2 Curriculum policy in South Africa
In order to understand how the South African qualifications structure in the field of agriculture works, we need to
refer to the general policy framework established for the curriculum in South Africa.
Policy change in the South African education system has far reaching effects on the provision of agricultural education
and training. The generation of policy has touched on virtually all aspects of educational activity but has given
particular attention to: curriculum development, generating equitable access to education, and to integrating education
and training (Department of Education, 1995a, 1995b, 1996a, 1996b, 1996c, 1997a, 1997b, 1998a, 1998b, 1998c).
Central to these aims is the South African National Qualifications Framework (NQF) which is intended to facilitate
linkages between multiple qualifications that are located in various Education and Training pathways in order to
facilitate learning as a lifelong process (Table 2). The NQF is still very much an evolving system, where the linkages
between qualifications and pathways in some fields are well developed while in others, pathways must still be
‘opened’ or ‘created’. The basic structure of the NQF consists of the General Education and Training (GET), Further
Education and Training (FET) and Higher Education and Training (HET) bands. With ten years of free and compulsory
education for all, the end of the GET becomes the first possible exit point from the formal education system. The
FET is designed: to provide intermediate to higher level skills and competencies, to promote the integration of
education and training, and to enhance learner mobility and progression at the critical point between GET, entry to
HET and the workplace.

C M Y CM MY CY CMY K
37
Table 2: National Qualifications Framework
NQFLevel
8
7
6
5
4
3
2
1
Band
HigherEducation and Training Band
FurtherEducation and Training Band
GeneralEducation And Training Band
Types of Qualification and Certificates
Doctorate / Further Research Degree
Higher Degree / Professional Qualifications
First Degree / Higher Diplomas
Diplomas / Occupational Certificates
School / College / Training Certificate
Gr.12
Gr.11
Gr.10
Senior Phase
Intermediate Phase
Foundation Phase
Pre-school
Gr.9
Gr.8
to
Gr.1
ABET Level 4
ABET Level 3
ABET Level 2
ABET Level 1
The post 1994 period of policy development produced Outcomes Based Education and Training (OBET) which
seeks to emphasise a learner centered rather than teacher centered approach, and problem solving and
transfer of skills rather than memorisation of content in the classroom. In developing these curriculum goals,
OBET seeks to recast the social relationships of the classroom. This has important implications for all curriculum
areas. These innovations are congruent with international changes in perceptions of learning in agricultural
education which involve adopting a more learner centered, experiential learning and interdisciplinary approach.
Critically, the policy on OBET brings to our attention the importance of considering the quality of learning –
the ‘how’ of learning and not just the ‘what’ - that takes place inside of particular qualifications and inside
particular institutions. Although this research cannot address the issue of quality of learning as may be reflected
by the graduation of qualified and competent individuals from the various institutions, it is important to bear
this dimension in mind when considering the absorption of graduates into the labour market.
2.3 Institutions offering agricultural qualifications
Even though this chapter focuses on the agricultural curriculum at intermediate to high skills levels – which
is largely based in post school institutions - we must recognise that it is through earlier school experiences
that young people are equipped with the foundations of knowledge, skills and interest sufficient to pursue
agriculture at a higher qualification level. In the primary school already, learners are exposed to concepts that
have relevance to agriculture, although at this level there is a cross-curriculum rather than subject-based
approach to learning. It is in the high schools and Colleges in the Further Education and Training (FET) band
(Grade 10 to Grade 12/NQF Levels 2, 3 & 4) that Agriculture as a subject/learning area is introduced.
Therefore we briefly describe the flows between all the main institutions providing agricultural education in
South Africa from FET through to the Higher Education and Training (HET) band.
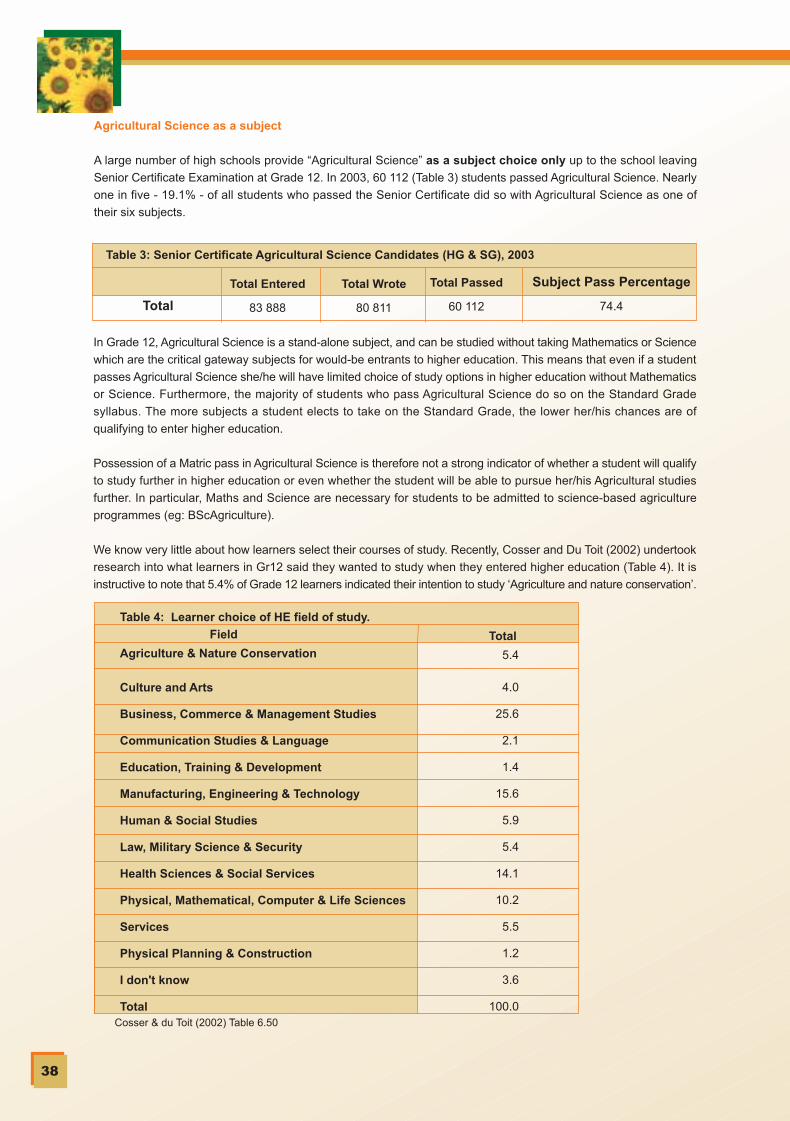
C M Y CM MY CY CMY K
38
Agricultural Science as a subject
A large number of high schools provide “Agricultural Science” as a subject choice only up to the school leaving
Senior Certificate Examination at Grade 12. In 2003, 60 112 (Table 3) students passed Agricultural Science. Nearly
one in five - 19.1% - of all students who passed the Senior Certificate did so with Agricultural Science as one of
their six subjects.
Table 3: Senior Certificate Agricultural Science Candidates (HG & SG), 2003
Total Entered
83 888
Total Wrote
80 811
Total Passed
60 112
Subject Pass Percentage
74.4Total
In Grade 12, Agricultural Science is a stand-alone subject, and can be studied without taking Mathematics or Science
which are the critical gateway subjects for would-be entrants to higher education. This means that even if a student
passes Agricultural Science she/he will have limited choice of study options in higher education without Mathematics
or Science. Furthermore, the majority of students who pass Agricultural Science do so on the Standard Grade
syllabus. The more subjects a student elects to take on the Standard Grade, the lower her/his chances are of
qualifying to enter higher education.
Possession of a Matric pass in Agricultural Science is therefore not a strong indicator of whether a student will qualify
to study further in higher education or even whether the student will be able to pursue her/his Agricultural studies
further. In particular, Maths and Science are necessary for students to be admitted to science-based agriculture
programmes (eg: BScAgriculture).
We know very little about how learners select their courses of study. Recently, Cosser and Du Toit (2002) undertook
research into what learners in Gr12 said they wanted to study when they entered higher education (Table 4). It is
instructive to note that 5.4% of Grade 12 learners indicated their intention to study ‘Agriculture and nature conservation’.
Table 4: Learner choice of HE field of study.
Field
Agriculture & Nature Conservation
Culture and Arts
Business, Commerce & Management Studies
Communication Studies & Language
Education, Training & Development
Manufacturing, Engineering & Technology
Human & Social Studies
Law, Military Science & Security
Health Sciences & Social Services
Physical, Mathematical, Computer & Life Sciences
Services
Physical Planning & Construction
I don't know
Total
Total
5.4
4.0
25.6
2.1
1.4
15.6
5.9
5.4
14.1
10.2
5.5
1.2
3.6
100.0Cosser & du Toit (2002) Table 6.50

C M Y CM MY CY CMY K
39
In terms of gender, 6.2% of male learners and 4.6% of female learners respectively noted ‘Agriculture and Nature
Conservation’ as their choice of field of study. The field with the highest choice rating was ‘Business, commerce &
management studies with 24.2% and 27.0% for males and females respectively indicated. More African students
than White, Coloured or Indian students indicated Agriculture as their choice field of study (Table 5). Whether
students arrived in agriculture programmes in higher education in these proportions is unknown. Naturally, learners
would not all have gone into the courses of study that they wanted to when at school. Some would have changed
their minds and others would have been forced to select different options because their school academic results
precluded them from registration.
Field of study
Business, Commerce & Management Studies
Manufacturing, Engineering & Technology
Health Sciences & Social Services
Physical, Mathematical, Computer & Life Sciences
Human & Social Studies
Services
Law, Military Science & Security
Agriculture & Nature Conservation
Culture & Arts
I don't know
Communication Studies & Language
Education, Training & Development
Physical Planning & Construction
Total
African
26.2
16.4
13.9
9.8
6.5
5.4
5.3
5.8
3.7
2.7
2.1
1.0
1.1
100.0
Coloured
24.9
14.3
16.4
10.0
3.8
5.6
8.5
2.1
4.2
5.1
2.0
1.5
1.7
100.0
Indian
24.9
13.4
21.2
13.7
2.8
3.5
4.1
1.9
2.8
7.5
1.1
2.0
1.1
100.0
White
24.1
10.0
11.3
12.1
2.0
7.6
5.9
3.7
6.8
8.9
2.0
4.3
1.5
100.0
Total
25.9
15.7
14.1
10.2
5.9
5.5
5.4
5.3
3.9
3.5
2.1
1.3
1.2
100.0
Table 5: Learner choice of field of study, by population group.
Cosser & du Toit (2002) Table 6.55.
Even though large numbers of students take Agricultural Science to the Grade 12 school leaving level, the character
of the Senior Certificate qualification is generalist and formative rather than vocational. It must be stressed that this
is a subject choice for learners out of a minimum of six subjects in total. None of the other subjects need necessarily
be related to agriculture and this subject alone therefore does not constitute an agricultural qualification in its own
right.
Cohorts of school leavers who complete Agricultural Science can be assumed to contribute in as yet unknown ways
to the subsequent accumulation of higher agricultural skills levels, but in the short term they do not directly feed
into the supply of intermediate skills in the agricultural labour market because their academic background is still
too general.
Agricultural High Schools
There are forty two Agricultural High Schools that offer a learning programme up to Grade 12 or Senior Certificate
level which includes the same Agricultural Science (HG)/ (SG) subject offered in ordinary high schools as well as
five other Agricultural subjects from which students may select (See Table 6). However, not all of the schools offer
the full range of Agricultural subjects. In addition, students may choose to enroll for other non-agricultural subjects
that are also offered in these schools. In the end, some students may take only one or no agricultural subjects. The
Agricultural High Schools therefore do not offer a standardized agricultural curriculum. For these reasons, the
graduates of these schools cannot be said to have completed a vocationally focused agricultural qualification. The
estimated number of 548 learners enrolled with at least one agricultural subject in these schools, in 2003 will be
noted but will not be taken into account in the analysis of direct flows of graduates into the labour market.
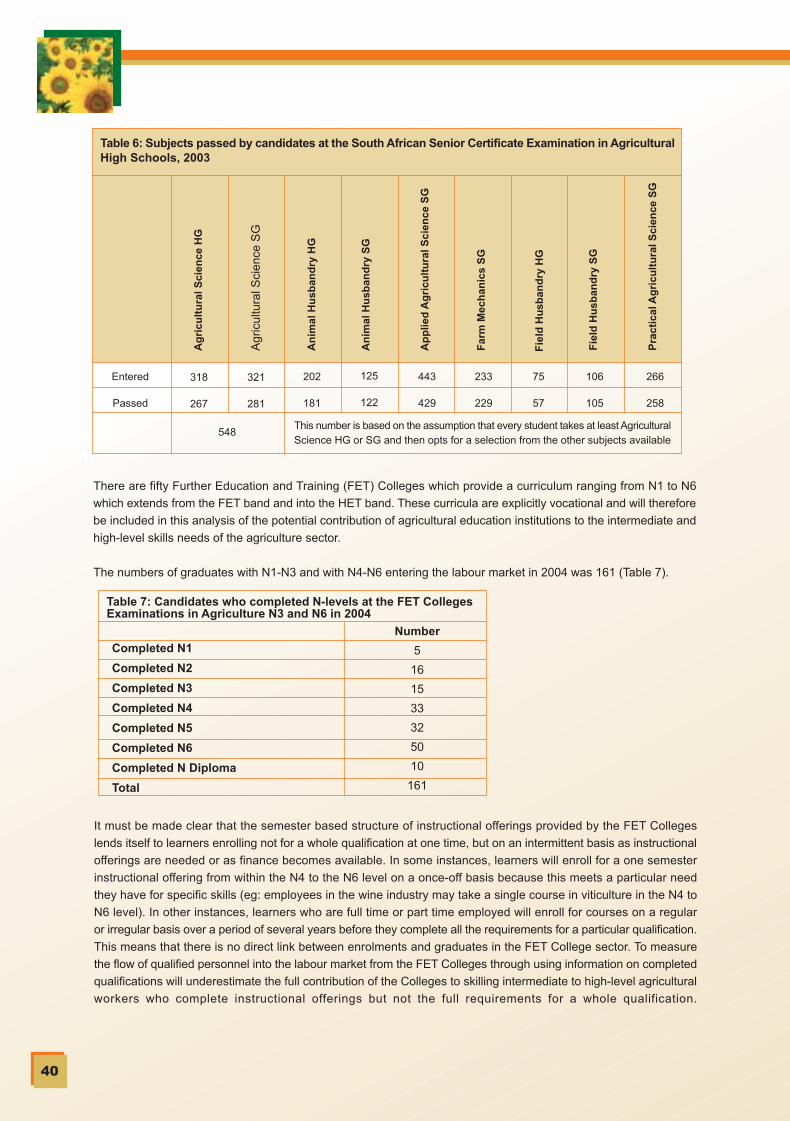
C M Y CM MY CY CMY K
40
Table 6: Subjects passed by candidates at the South African Senior Certificate Examination in AgriculturalHigh Schools, 2003
Pra
ctic
al A
gri
cult
ura
l Sci
ence
SG
Fie
ld H
usb
and
ry S
G
Fie
ld H
usb
and
ry H
G
Far
m M
ech
anic
s S
G
Ap
plie
d A
gri
cult
ura
l Sci
ence
SG
An
imal
Hu
sban
dry
SG
An
imal
Hu
sban
dry
HG
Agr
icul
tura
l Sci
ence
SG
Ag
ricu
ltu
ral S
cien
ce H
G
266
258
106
105
75
57
233
229
443
429
125
122
202
181
321
281
318
267
Entered
Passed
548This number is based on the assumption that every student takes at least AgriculturalScience HG or SG and then opts for a selection from the other subjects available
There are fifty Further Education and Training (FET) Colleges which provide a curriculum ranging from N1 to N6
which extends from the FET band and into the HET band. These curricula are explicitly vocational and will therefore
be included in this analysis of the potential contribution of agricultural education institutions to the intermediate and
high-level skills needs of the agriculture sector.
The numbers of graduates with N1-N3 and with N4-N6 entering the labour market in 2004 was 161 (Table 7).
Completed N1
Completed N2
Completed N3
Completed N4
Completed N5
Completed N6
Completed N Diploma
Total
Table 7: Candidates who completed N-levels at the FET CollegesExaminations in Agriculture N3 and N6 in 2004
Number
5
16
15
33
32
50
10
161
It must be made clear that the semester based structure of instructional offerings provided by the FET Colleges
lends itself to learners enrolling not for a whole qualification at one time, but on an intermittent basis as instructional
offerings are needed or as finance becomes available. In some instances, learners will enroll for a one semester
instructional offering from within the N4 to the N6 level on a once-off basis because this meets a particular need
they have for specific skills (eg: employees in the wine industry may take a single course in viticulture in the N4 to
N6 level). In other instances, learners who are full time or part time employed will enroll for courses on a regular
or irregular basis over a period of several years before they complete all the requirements for a particular qualification.
This means that there is no direct link between enrolments and graduates in the FET College sector. To measure
the flow of qualified personnel into the labour market from the FET Colleges through using information on completed
qualifications will underestimate the full contribution of the Colleges to skilling intermediate to high-level agricultural
workers who complete instructional offerings but not the full requirements for a whole qualification.

C M Y CM MY CY CMY K
41
Table 8: Candidates who passed in the Agricultural Colleges Examinations in 2004
Year 1
Year 2
Year 3
Certificate
Higher Certificate
Diploma
Enrolled
327
370
202
899
Higher Education
In 2003, there were nineteen Technikons and Universities offering qualifications ranging through the HET band
from undergraduate degrees and certificates to Doctoral degrees. Cumulatively, graduates from these institutions
in 2003 numbered 1765 (Table 9). Technikons were entitled to offer qualifications ranging throughout the post FET
band from undergraduate degrees and certificates to Doctoral degrees. Universities were entitled to offer qualifications
ranging throughout the post FET band from undergraduate degrees and certificates to Doctoral degrees.
To capture the discussion above the various qualifications on offer by these institutions are represented in Table 9
below.
Colleges of Agriculture
There are eleven Colleges of Agriculture entitled to offer qualifications that are located in the HET band up to the
BTech degree level.
The Colleges have responded to the needs of their environments in at least two main directions. First, some have
adapted their curriculum offerings, and some have begun to work in partnership with other institutions. For example,
Colleges have attempted to design their programmes to suit the skills requirements of the particular agricultural
industry in their locality (eg: wine farming in the Western Cape or forestry in the Lowveld).
Others have begun to work in collaboration with other local education institutions. For example, Elsenberg College
is linked with the University of Stellenbosch in providing a degree programme related to local industrial needs in
the Western Cape. The Taung College of Agriculture is in a form of partnership with the North West Province’s
Vuselela FET College, specifically its branch in Pudimoe, Taung. Under their agreement, the College is teaching
the FET College N1-N6 programme having started with the first N1 group in 2003. The concept is for students to
begin with the N1 to N3 programmes and then feed into the traditional Agricultural College programmes based on
the Certificate, Higher Certificate and Diploma levels. All students at Taung who are doing FET courses are counted
in the FET dataset operated by the National Department of Education.
Second, some Colleges are working hard to provide support for small and emerging farmers in the province in which
they are located. These two factors have brought about marked differentiation between the Colleges in their
programme mix.
In 2004, 899 students passed the examinations in the Colleges (Table 8). For the purposes of analysis, the output
of qualified people who have begun job seeking will be based on those completing the Higher Certificate and the
Diploma only (572), because the first year leads directly onto the Higher Certificate year
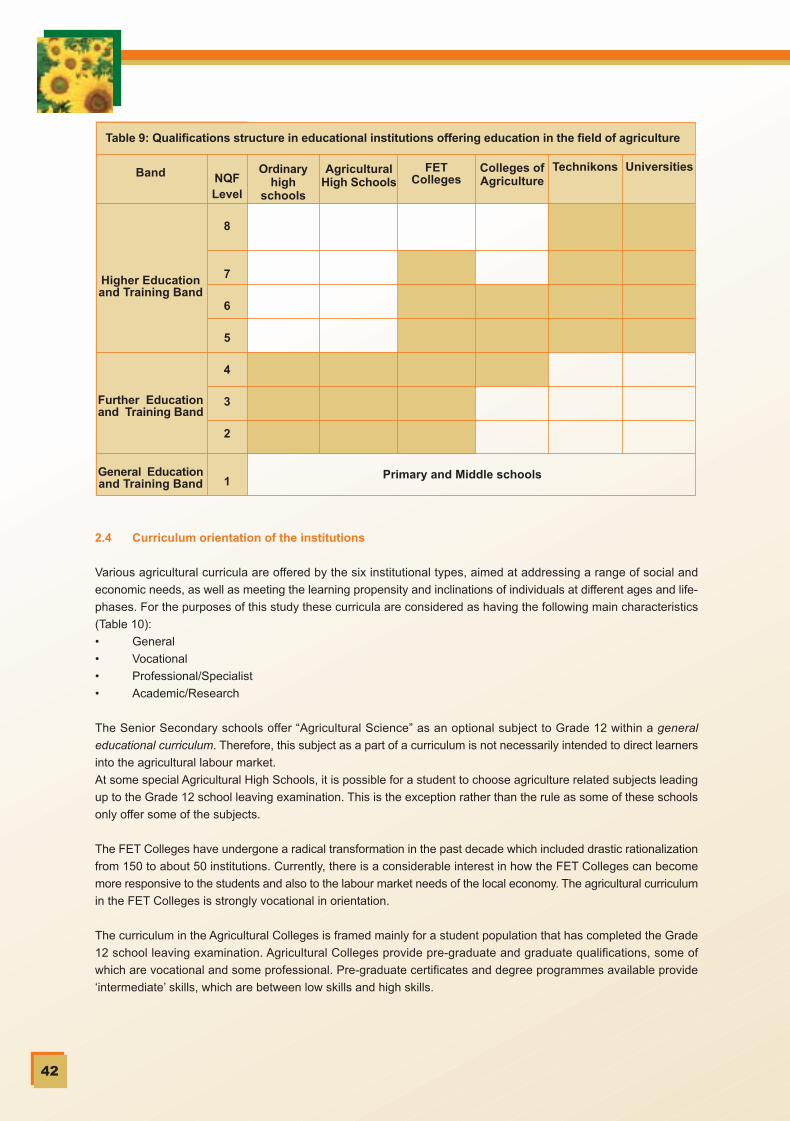
C M Y CM MY CY CMY K
42
Ordinaryhigh
schools
NQFLevel
8
7
6
5
4
3
2
1
Band
Higher Educationand Training Band
Further Educationand Training Band
General Educationand Training Band
Primary and Middle schools
AgriculturalHigh Schools
FETColleges
Colleges ofAgriculture
Technikons Universities
Table 9: Qualifications structure in educational institutions offering education in the field of agriculture
2.4 Curriculum orientation of the institutions
Various agricultural curricula are offered by the six institutional types, aimed at addressing a range of social and
economic needs, as well as meeting the learning propensity and inclinations of individuals at different ages and life-
phases. For the purposes of this study these curricula are considered as having the following main characteristics
(Table 10):
• General
• Vocational
• Professional/Specialist
• Academic/Research
The Senior Secondary schools offer “Agricultural Science” as an optional subject to Grade 12 within a general
educational curriculum. Therefore, this subject as a part of a curriculum is not necessarily intended to direct learners
into the agricultural labour market.
At some special Agricultural High Schools, it is possible for a student to choose agriculture related subjects leading
up to the Grade 12 school leaving examination. This is the exception rather than the rule as some of these schools
only offer some of the subjects.
The FET Colleges have undergone a radical transformation in the past decade which included drastic rationalization
from 150 to about 50 institutions. Currently, there is a considerable interest in how the FET Colleges can become
more responsive to the students and also to the labour market needs of the local economy. The agricultural curriculum
in the FET Colleges is strongly vocational in orientation.
The curriculum in the Agricultural Colleges is framed mainly for a student population that has completed the Grade
12 school leaving examination. Agricultural Colleges provide pre-graduate and graduate qualifications, some of
which are vocational and some professional. Pre-graduate certificates and degree programmes available provide
‘intermediate’ skills, which are between low skills and high skills.

C M Y CM MY CY CMY K
In the Technikons, agricultural education in the last decade focused more strongly on professional and specialist
training, and de-emphasised intermediate level programmes. This change can be ascribed to a growing trend for
students to choose more professional and specialist courses, but it may also be reflective of policy on the part of
the Technikons to move in this direction. Significantly, the Technikons have begun to develop their capacity to provide
research training in the field of agriculture.
Universities have provided the bulk of academic and research training in the period under study. They have also
provided access to professional and specialist training across a range of agriculture fields.1
43
The Council on Higher Education recognises that it is important for higher education institutions to offer academic/research
and professional/specialist streams of training (Appendix 1).
Table 10: The curriculum orientation of institutions included in this study
Type of curriculumoffered
General
Vocational
Professional/Specialist
Academic/ Research
High Schools FET Colleges AgriculturalColleges
Technikon
Strong
Strong
Strong
Improving
Strong
To some degree
Strong
The synopsis given above is aimed at providing a broad understanding of the different curriculum emphases across
the institutions involved. To some extent this analysis does mask variation in academic and research capacity within
the university and Technikon categories. However, a discussion of these issues is not within the scope of this project.
2.5 Curriculum continuity in institutions offering agricultural curricula leading to qualifications
It is important to identify what forms of agricultural knowledge are contained in the curriculum programmes on offer
in the various institutions. This is because we need to know if the respective institutions are purveying knowledge
that is relevant to the needs of the agriculture industry. In addition, we need to establish whether there are common
core themes across curricula offered in the different institutions. There needs to be continuity between the forms
of knowledge offered in the different institutions. By the same token, lack of shared focus on core fields would create
disjuncture between programmes and prevent progression. In the latter case, students seeking to improve their
qualifications would encounter lack of continuity in the required knowledge and skills between particular fields at
the different kinds of institution. For example, a student who studies Vine Production at N3 level in a FET College
should be able to progress further to advanced programmes in Viticulture that are available in at least one higher
education institution.
The analysis that will follow does not constitute an in-depth audit of all agricultural curriculum programmes. The
main aim of this analysis is to establish whether there is some broad continuity between the curricula offered at the
institutions that have been referred to.
2.6 The agricultural programme in the FET Colleges
This analysis will begin by referring to the curriculum structure of the agriculture programmes offered in the FET
Colleges. Table 11 below shows that in the FET Colleges, the four main streams in the curriculum for N1 to N3 (NQF
levels 2, 3 and 4) are:
• Courses related to farming as a form of business practice
• Courses dealing with farming mechanics
• Courses focused on crop production

C M Y CM MY CY CMY K
44
N1
Farming Communication
N (OR)
Farming Business
Practice N1
Farming Mechanics N1
Crop Production N1
Animal Production N1
N2
Farming Business Practice
N2
Farming Mechanics N2
Crop Production N2
Animal Production N2
Dairy Production N2
Beef Cattle Production N2
Cereal Production N2
Vegetable Production N2
Poultry N2
N3
Farming Business
Management N3
Farming Mechanics N3
Crop Production N3
Animal Production N3
Dairy Production N3
Beef Cattle Production
N3
Fruit Production N3
Vine Production N3
Mutton Production N3
Pig Production N3
N4
Management: Farming
N4
Financial Management:
Farming N4
Data Management:
Farming N4
Maintenance Management:
Farming N4
N5
Management: Farming
N5
Financial Management:
Farming N5
Data Management:
Farming N5
Maintenance
Management:Farming N5
N6
Management: Farming
N6
Financial Management:
Farming N6
Data Management:
Farming N6
Human Resource
Management: Farming N6
The grey shading highlights the fundamental curse components at the N1 to N3 levels.
Table 11: Instructional offerings at FET Colleges
• Courses focused on animal production
In the phase N4 to N6, the focus is more strongly on management issues with courses offered in the following:
• Farming management
• Financial management
• Data management
• Maintenance management
• Human resources management
Capturing the knowledge fields in this discussion is important as it reflects what is considered as relevant knowledge
at the FET level - notably human resources management (given the centrality of labour relations and training issues
in the post-1994 agricultural workforce) and data management (given the increased application of information
technology solutions to agricultural challenges).
The curriculum offered in the FET Colleges is nationally specified and the same programme can therefore be found
in all FET Colleges. This makes it possible to recognise and understand the shape and focus of the curriculum in
the full knowledge that the same – or very similar – approach will be followed across institutions.

C M Y CM MY CY CMY K
2.7 Learning programmes in the Colleges of Agriculture
Unlike the FET Colleges, the Colleges of Agriculture do not provide highly standardized programmes. There is
flexibility because the Colleges of Agriculture orient their courses towards supporting the agricultural activities that
are practiced in their region. For example: Cedara focuses on forestry and horticulture; Lowveld focuses on sugar
cane, tobacco and horticulture (while offering cotton to attract students from other regions); Potchefstroom focuses
on mixed farming as carried out in the Highveld and adjacent regions; and Elsenberg has set itself the aim of
specializing in agribusiness.
Even though the curriculum in the Colleges of Agriculture is not highly standardized as in the FET Colleges, a survey
of courses reveals that the Agricultural Colleges present programmes that cover the same broad fields of knowledge
present in the FET College curriculum: plant production, animal production, agricultural management and agricultural
engineering (Table 12).
45
General
Courses
Plant
Production
Animal
production
Agricultural
Engineering
Agricultural
Management
Environmental
management
Other
Courses covering specific
sub-fields
Agronomy (Grain crops)
Crop production
Horticulture
Soil science
Animal breeding
Animal nutrition
Animal production
Animal health
Hydraulics/Hydraulic systems
Agricultural implements
Mechanisation planning
Electrical apparatus/motors
Surveying
Marketing
Farm management
Community development
Financial management
Economics
Game ranching
Veld management
More specialized courses
within sub-fields
Crop protection
Pasture Management
Artificial insemination
Animal husbandry
Feedlot management
Small stock production
Large stock production
Irrigation and drainage
systems
Office administration
Land use planning
Farm accounting
Production factors
IT applications
Entrepreneurial skills
Problem animal control
Farm safety
Specific product courses
include:
Eg:
Vegetable, fruit production,
viticulture, sugar cane etc.
Also: green house
management,Forestry
Eg:
Beef cattle, dairy cattle, fish,
mutton, pig, poultry, wool etc.

C M Y CM MY CY CMY K
46
Agricultural Colleges offer courses to a more advanced level than in the FET Colleges, as would be expected for
programmes in the post FET NQF Levels 5 and 6. For example, within the knowledge field of animal production,
more advanced courses such ‘Artificial Insemination’ are offered. Likewise, in crop production more advanced
courses like ‘Greenhouse Management’ are available. Furthermore, what is called the “Farm Mechanics” of the FET
College Curriculum is taken to a more advanced level in the form of “Agricultural Engineering” at the Agricultural
Colleges. Also, agricultural management at Colleges includes higher-level courses in agricultural economics that
are not presented in the FET Colleges. Finally, a knowledge domain not found in the FET College curriculum deals
with Environmental Management, conservation and game farming.
The balance of theoretical to practical in the College programmes is considered important. Broadly across the
curriculum there is a 55-60% theoretical component with the rest given to practical application. Is this not necessarily
the case for higher education?
Some Colleges also offer non-formal training programmes; typically short courses for the further education and
training (FET) sector (APAC, 2004, 6). But these do not constitute whole qualifications and therefore do not form
part of this study.
2.8 Differences between agriculture programmes offered in Further Education and Higher Education
As may be expected, agriculture programmes in universities and Technikons are different to those of FET Colleges
and Colleges of Agriculture in a number of dimensions. Some of these differences have to do with institutional and
or curriculum boundaries which limit the choice of students as to what they can study.
The Agricultural College is the only institutional type that exclusively offers agricultural programmes. This means
that student choice of courses is strictly bounded by what is offered inside the institution.
Although the FET Colleges provide programmes across a wide range of fields from business to technology to
services and of course agriculture, the agriculture programme in the FET Colleges is strictly defined and students
may only choose from within the stipulated agriculture curriculum. The fact that other types of knowledge are
presented in the FET Colleges is immaterial to the student registered in an FET agriculture programme. Therefore,
FET Colleges and Colleges of Agriculture are similar because student choice is defined by the boundaries of the
institution or by the limits of the programme.
There is further similarity between FET Colleges and Colleges of Agriculture because their agriculture programmes
are based on a relatively straightforward progression of students between curriculum levels. In the case of the FET
Colleges, a student enters at N1 and progresses over three years to N3, and in the Agricultural Colleges, a student
progresses from the two year National Higher Certificate to the one year National Diploma. In each case the
completion of a strictly defined three year programme leads to a single qualification.
In contrast, universities and Technikons offer many varieties of programmes within a single qualification (See
Appendix 2). This does not mean that each programme is unique. The different programmes will frequently require
students to register for common fundamental courses. But there will be flexibility for students to select from a wide
range of options even outside of the Faculty or Department of Agriculture (which the FET College curriculum does
not allow and which the College of Agriculture does not offer).
From this we can see that the programmes in the FET Colleges and Colleges of Agriculture offer relatively ‘closed’
programmes, whereas the universities and increasingly the Technikons offer more open programmes which admit
greater variety. This means that it is possible for university and Technikon programmes to support higher levels of
specialisation than in the FET Colleges and the Colleges of Agriculture. This is a necessary form of programme
diversif icat ion within a national system of knowledge del ivery in the f ield of agriculture.

C M Y CM MY CY CMY K
47
Because of the clearly defined shape of the agricultural programmes offered at FET Colleges and at Colleges of
Education, and because these programmes differ only slightly within each institutional type, it was possible to
describe the actual curriculum within each programme. Furthermore, because FET College and Agricultural College
programmes are each relatively standardized, it was not necessary to describe programmes on an institution to
institution basis.
This approach is not applicable in the case of universities and Technikons because there are so many programmes
that lead to many different diploma and degree specialties (Appendix 2).
2.9 Agriculture programmes offered in Universities of Technology
The institutional merger process that is currently under way requires the reconfiguration of hitherto independent
higher education entities. This means that the location, size, capacity, curriculum and enrolment of agricultural
departments and faculties across the country are likely to change in the ensuing period. The effects of these changes
on agricultural programmes in higher education will have to be closely monitored.
In contrast to the Colleges of Agriculture and the FET Colleges, the various universities provide a wide range of
programmes that present multiple ways of acquiring a similar qualification level. Logically, it would be impossible
for each university to offer all of these courses at the same time, as this would create an unsustainable staff to
student ratio. Therefore it is important to consider which institutions concentrate on which programmes.
Analysis makes it possible to assess the relative emphasis on particular programmes within the broad agriculture
field and also to see which institutions offer a wider range of programmes to students. First, the programmes offered
at the Universities of Technology will be described – although the overview given in Table 13 is indicative only
because these institutions are engaged in the process of mergers.
At the NDip and HDip level, the two programmes offered across the largest number of institutions were the NDip
in Agricultural Management (in three sites) and the NDip in Nature Conservation (in three sites).
At the BTech programme level, the emphasis on management and nature conservation is repeated with BTech
Agricultural Management and BTech Nature Conservation being offered by five and four institutions each. The
institution offering the widest range of programmes is Tswane University of Technology (TUT). It is notable that TUT
does not seem to offer Diploma programmes (Table 13).
The number of institutions offering a particular programme does not tell us how many students are actually enrolled
and graduating. However, the number and location of institutions offering particular programmes will limit the
opportunities for entry into the field especially where students need funding for travel, accommodation and living
expenses. This question is equally relevant in the universities which are considered next.
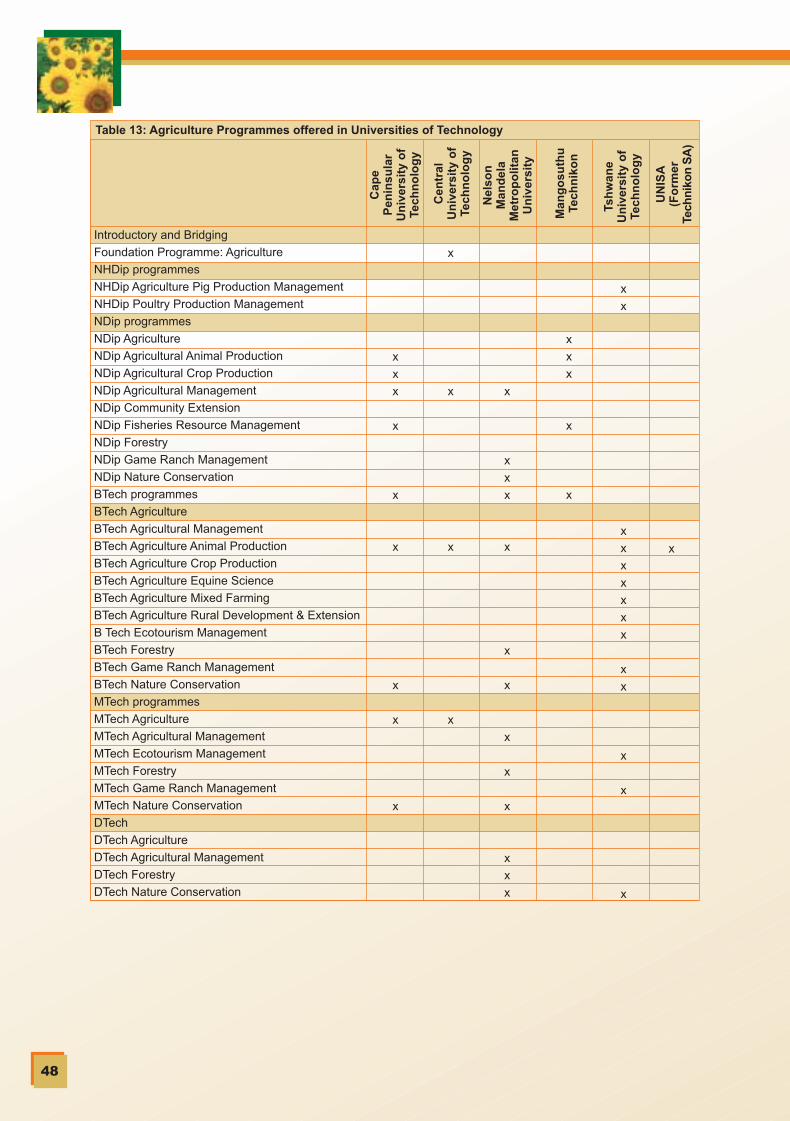
C M Y CM MY CY CMY K
48
Introductory and Bridging
Foundation Programme: Agriculture
NHDip programmes
NHDip Agriculture Pig Production Management
NHDip Poultry Production Management
NDip programmes
NDip Agriculture
NDip Agricultural Animal Production
NDip Agricultural Crop Production
NDip Agricultural Management
NDip Community Extension
NDip Fisheries Resource Management
NDip Forestry
NDip Game Ranch Management
NDip Nature Conservation
BTech programmes
BTech Agriculture
BTech Agricultural Management
BTech Agriculture Animal Production
BTech Agriculture Crop Production
BTech Agriculture Equine Science
BTech Agriculture Mixed Farming
BTech Agriculture Rural Development & Extension
B Tech Ecotourism Management
BTech Forestry
BTech Game Ranch Management
BTech Nature Conservation
MTech programmes
MTech Agriculture
MTech Agricultural Management
MTech Ecotourism Management
MTech Forestry
MTech Game Ranch Management
MTech Nature Conservation
DTech
DTech Agriculture
DTech Agricultural Management
DTech Forestry
DTech Nature Conservation
Cap
eP
enin
sula
rU
niv
ersi
ty o
fTe
chn
olo
gy
Cen
tral
Un
iver
sity
of
Tech
no
log
y
Nel
son
Man
del
aM
etro
po
litan
Un
iver
sity
Man
go
suth
uTe
chn
iko
n
Tsh
wan
eU
niv
ersi
ty o
fTe
chn
olo
gy
UN
ISA
(Fo
rmer
Tech
nik
on
SA
)
x
x
x
x
x
x
x
x
x
Table 13: Agriculture Programmes offered in Universities of Technology
x
x
x
x
x
x
x
x
x
x
x
x
x
x
x
x
x
x
x
x
x
x
x
x
x
x
x
x
x
x
x
x
x
x
x
x
x
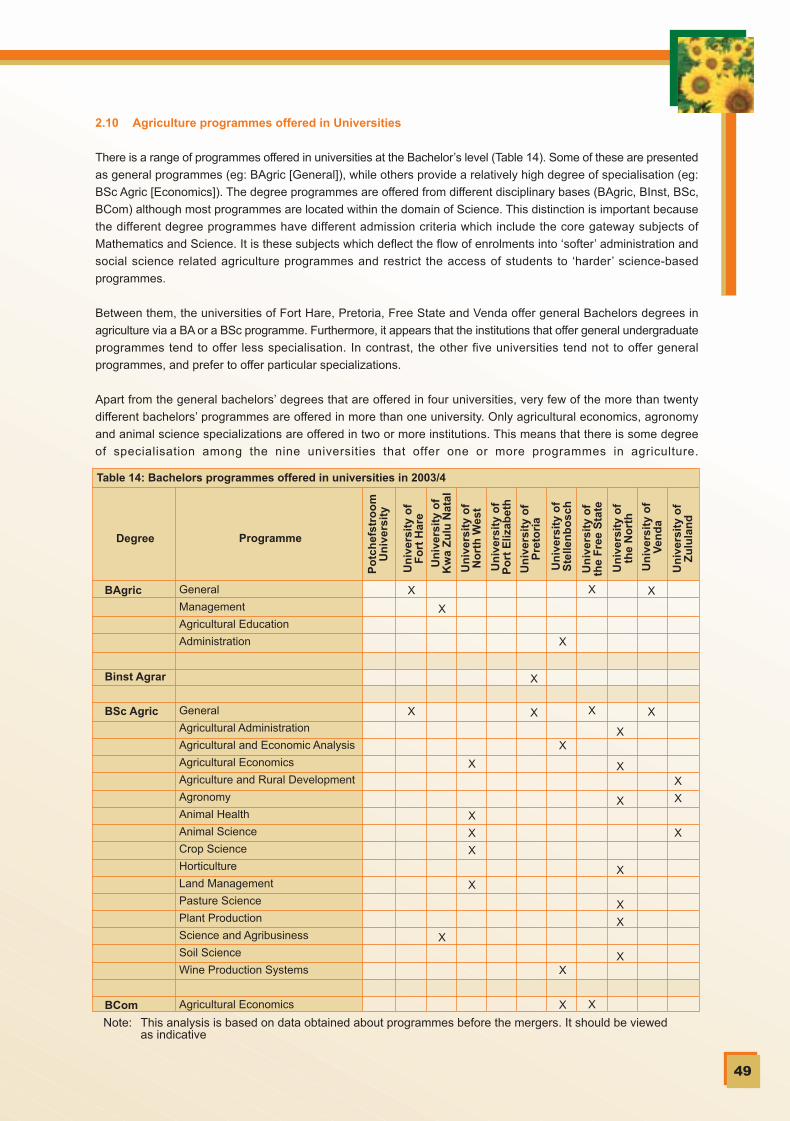
C M Y CM MY CY CMY K
49
2.10 Agriculture programmes offered in Universities
There is a range of programmes offered in universities at the Bachelor’s level (Table 14). Some of these are presented
as general programmes (eg: BAgric [General]), while others provide a relatively high degree of specialisation (eg:
BSc Agric [Economics]). The degree programmes are offered from different disciplinary bases (BAgric, BInst, BSc,
BCom) although most programmes are located within the domain of Science. This distinction is important because
the different degree programmes have different admission criteria which include the core gateway subjects of
Mathematics and Science. It is these subjects which deflect the flow of enrolments into ‘softer’ administration and
social science related agriculture programmes and restrict the access of students to ‘harder’ science-based
programmes.
Between them, the universities of Fort Hare, Pretoria, Free State and Venda offer general Bachelors degrees in
agriculture via a BA or a BSc programme. Furthermore, it appears that the institutions that offer general undergraduate
programmes tend to offer less specialisation. In contrast, the other five universities tend not to offer general
programmes, and prefer to offer particular specializations.
Apart from the general bachelors’ degrees that are offered in four universities, very few of the more than twenty
different bachelors’ programmes are offered in more than one university. Only agricultural economics, agronomy
and animal science specializations are offered in two or more institutions. This means that there is some degree
of specialisation among the nine universities that offer one or more programmes in agriculture.
General
Management
Agricultural Education
Administration
General
Agricultural Administration
Agricultural and Economic Analysis
Agricultural Economics
Agriculture and Rural Development
Agronomy
Animal Health
Animal Science
Crop Science
Horticulture
Land Management
Pasture Science
Plant Production
Science and Agribusiness
Soil Science
Wine Production Systems
Agricultural Economics
Table 14: Bachelors programmes offered in universities in 2003/4
Po
tch
efst
roo
mU
niv
ersi
ty
Un
iver
sity
of
Fo
rt H
are
Un
iver
sity
of
Kw
a Z
ulu
Nat
al
Un
iver
sity
of
No
rth
Wes
t
Un
iver
sity
of
Po
rt E
lizab
eth
Un
iver
sity
of
Pre
tori
a
Un
iver
sity
of
Ste
llen
bo
sch
Un
iver
sity
of
the
Fre
e S
tate
Un
iver
sity
of
the
No
rth
Un
iver
sity
of
Ven
da
Un
iver
sity
of
Zu
lula
nd
ProgrammeDegree
BAgric
Binst Agrar
BSc Agric
BCom
X
X
X
X
X
X
X
X
X
X
X
X
X
X
X
X
X
X
X
X
X
X
X
X
X
X
X
X
X
X
Note: This analysis is based on data obtained about programmes before the mergers. It should be viewed as indicative

C M Y CM MY CY CMY K
50
It is important to observe that the universities provide for a relatively wide range of choice in their degree programmes
- more so even than the Universities of Technology until recently. This means that students in agriculture programmes
have the opportunity within the rules of their programme to do optional or elective courses in cognate fields or in
underly ing academic f ie lds that support agr icul ture. These include (as examples only):
• Biology
• Botany
• Business subjects (eg: marketing)
• Chemistry
• Ecology
• Economics
• Environmental management
• Genetics
• Human Resources Management
• Information Technology
• Microbiology
• Oenology
• Personnel Management
• Rural Sociology
Students at university have greater latitude to construct their own degree programmes. Upon graduation two students
who graduate with the same qualification (eg: BSc Animal Health) may have obtained different sub-specialisations
dependent on the mix of courses they have chosen to make up the programme leading to their degree. Naturally,
not all students elect to move outside of a standard type of programme, and their choice is restricted to the extent
that options are available. The point here is that it is difficult to analytically categorise degree programmes offered
in the universities where variation in the internal structure of such programmes can differ substantially.
Lastly, the graduate output of programmes in higher education is complex. If all courses in a programme were
compulsory and students had no options, outputs would be easy to analyse. However, this is seldom the case, since
there is often a wide choice of options for students. Because of this, the full range of courses that a faculty can offer
is usually larger than what courses are actually in operation at a given time. The difficulty is to track courses that
are not compulsory, those that are offered on a regular basis on a cycle (such as every alternate year), and those
that are offered only when the number of students willing to register rises above the critical threshold which makes
a course viable to run. These factors make a programme by programme analysis of student enrolment and graduation
on an annual basis, a very cumbersome task to perform – a task beyond the brief of this project.
2.11 Other forms of qualification offered at the FET and HET levels
This research project was intended to investigate graduate outputs in SAQA accredited higher and further education
institutions. However, it is important to point out that outside of these higher education and public FET institutions,
there are additional opportunities for obtaining agricultural qualifications in South Africa, through the SETA system.
In 2001 the Primary Agriculture Education and Training Authority (PAETA) expressed the intention to launch the
following Learnerships for which business plans were developed:
• Farm Operator: Horticulture, NQF level 1
• Farm Operator: Agronomy, NQF level 1
• Farm Operator: Animal Husbandry, NQF level 1
• Farm Owner: Horticulture, NQF level 1
• Farm Owner: Agronomy, NQF level 1
• Farm Owner: Animal Husbandry, NQF level 1
• Junior Farm Manager: NQF level 4
• Senior Farm Manager: NQF level 5
• Farm management for Farm owners: NQF level 5
• Land Care Expert: NQF level 5
C M Y CM MY CY CMY K
51
In 2004, SETASA registered the following Learnerships (SETASA, 2004):
• National Certificate in Sugar Technology NQF level 5
• Learnership in Grain Handling Management NQF level 5
• Learnership in Specialist Agricultural Machinery Technician NQF level 5
• Learnership in Agri Sales and Services NQF level 4
• National Certificate in Tobacco Services NQF level 4
• National Certificate in Cigarette Filter Rod Production Technology NQF level 4
• National Certificate in Cigarette Production Technology NQF level 4
• FETC: Seed Marketing: Execute Seed Trials NQF level 4
• FETC: Seed Research and Development: Certify a Seed Unit NQF level 4
• FETC: Seed Research and Development: Conduct a Field Inspection of a Seed Unit NQF level 4
• FETC: Seed Processing and Packaging Control NQF level 4
• FETC: Sugar Processing NQF level 4
PAETA and its sister body SETASA (Secondary Agriculture Education and Training Authority) were set to be
amalgamated by mid-2005 into the AGRI-SETA as decided by the Minister of Labour amid concerns regarding the
performance of these two SETAs. Even though the Learnerships envisaged by the AGRI-SETA have not all been
brought into existence, it is worth noting that the intention is to introduce Learnerships at the NQF 4 and NQF 5
levels, which is the equivalent of FET and post-FET intermediate qualifications.
These developments may present valuable contributions to the flow of qualified people into the agricultural economy
in general. This aspect is noted here but will not be analysed further being outside the brief of this project. Also,
the Learnership system in the agriculture sector is still in a relatively early stage of development.
2.12 Flows between agricultural programmes
To summarise the foregoing analysis and to represent the qualification structures and the flows between them in a
diagrammatic form, Figure 1 represents the various sources of agricultural education and training in South Africa
in 2005.
What it shows is that a large numbers of young people exit ordinary high schools some with Agricultural Science
and others without the subject. This is an important distinction, because even though having Agricultural Science
as a subject is a recommendation in some Agricultural Colleges or higher education institutions, it is nowhere a pre-
requisite. On the other hand, learners without Agricultural Science who Matriculate with Mathematics and Science
as subjects are qualified to enter BTech and BSc Agriculture programmes in universities and universities of technology.
The analysis in this chapter has focused in the main on the relationship between programmes at the undergraduate
levels. Post-graduate flows are more difficult to capture since coursework programmes at the Masters and PhD
levels tend to be smaller and highly specialized. Also, those students who elect to register for higher degrees via
writing a dissertation or thesis cannot be captured within an analysis of learning programmes.
Tracing the flows of students between the different institutions and programmes would require a separate study that
involves tracing a cohort of learners through the system. Such an undertaking is not within the scope of this study.
However, Chapter 5 and Chapter 6 will examine the institutional factors such as admission criteria and fees charged
for courses and programme which impact on student access.
An analysis of enrolment and graduation numbers by field of study – rather than per institution - is presented in the
next Chapter - Chapter 3. Field of study is an important decider of student chances of obtaining employment upon
completion of their programme
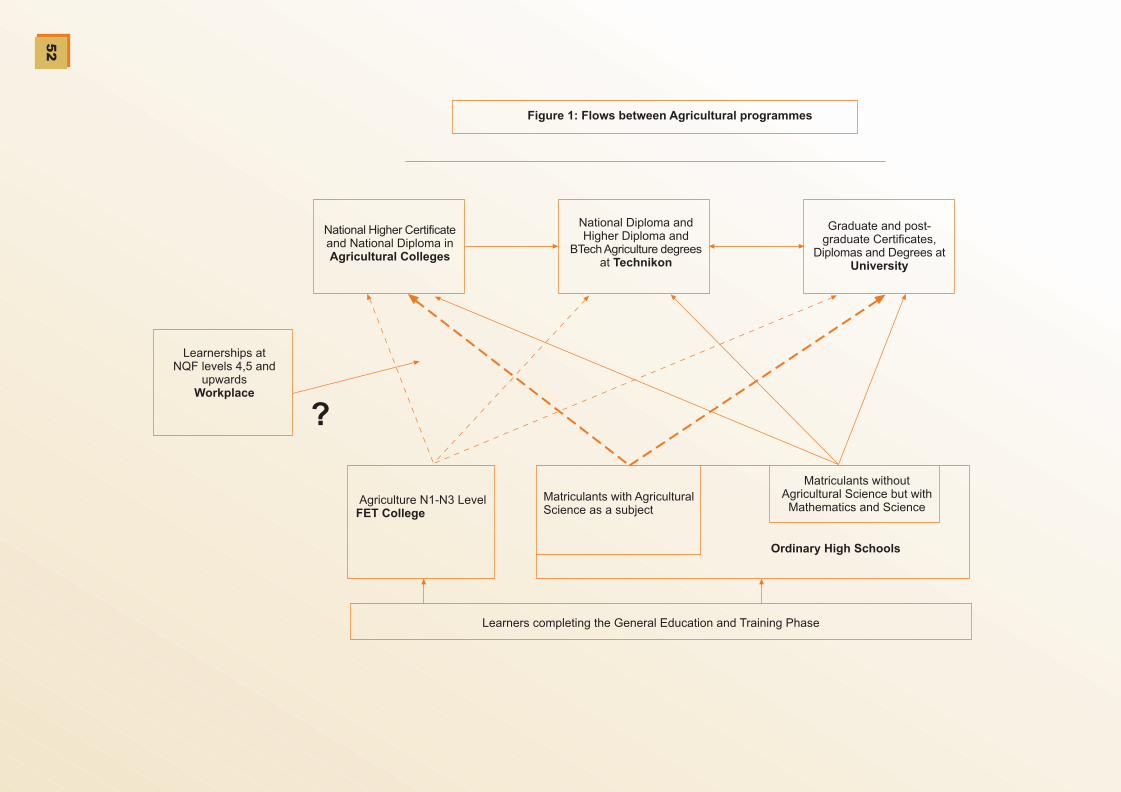
CM
YCM
MY
CY
CMY
K
52
Learners completing the General Education and Training Phase
Ordinary High Schools
Matriculants withoutAgricultural Science but withMathematics and Science
Matriculants with AgriculturalScience as a subject
Agriculture N1-N3 LevelFET College
Learnerships atNQF levels 4,5 and
upwardsWorkplace
National Higher Certificateand National Diploma inAgricultural Colleges
National Diploma andHigher Diploma and
BTech Agriculture degreesat Technikon
Graduate and post-graduate Certificates,
Diplomas and Degrees atUniversity
Figure 1: Flows between Agricultural programmes
?

C M Y CM MY CY CMY K
53
2.13 References
APAC (Association of Principals of Agricultural Colleges) (2004) APAC Business Plan.
Cosser, M. with du Toit, J. (2002). From School to Higher Education? Factors Affecting the Choices of Grade 12
Learners. Cape Town: HSRC Publishers.
Department of Education (1995a) White Paper on Education and Training No.1 Education and Training in a Democratic
South Africa. Government Gazette Vol.357 (16312) Pretoria, Government Printer.
Department of Education (1995b) South African Qualifications Authority Act Government Gazette Vol.364 (16725)
Cape Town, Government Printer.
Department of Education (1996a). National Education Policy Act Government Gazette Vol.370 (17118) Cape Town,
Government Printer.
Department of Education (1996b) South African Schools Act Government Gazette Vol.377 (17579) Pretoria,
Government Printer.
Department of Education (1997a). Curriculum 2005 Discussion Document, Pretoria, Government Printer.
Department of Education (1997b) Education White Paper 3 A Programme for the Transformation of Higher Education
Government Gazette Proclamation No.1196 Pretoria, Department of Education.
Department of Education (1998a) Education White Paper 4 A Programme for the Transformation of Further Education
and Tra in ing Government Gazet te Vol .399(19281) Pretor ia , Depar tment o f Educat ion.
Department of Education (DoE) (2004) Further Education and Training (FET) college examinations report: 2004
Pretoria.
Accessed at:
8b-12-04%20Final.doc
Date accessed: 14 March 2005
SETASA (2004) Registered Learnerships
Accessed at: http://www.setasa.co.za/downloads/registered_learnerships20040927.pdf
Date accessed: 22 March 2005

C M Y CM MY CY CMY K

C M Y CM MY CY CMY K
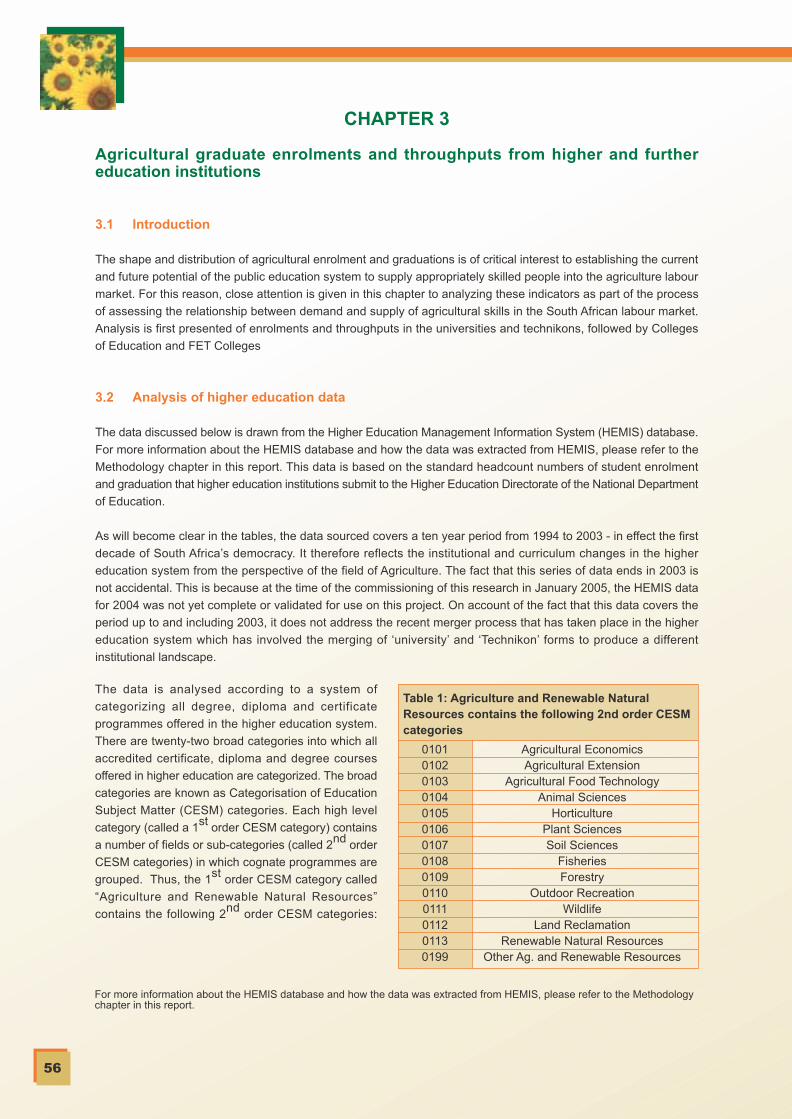
C M Y CM MY CY CMY K
56
CHAPTER 3
Agricultural graduate enrolments and throughputs from higher and furthereducation institutions
3.1 Introduction
The shape and distribution of agricultural enrolment and graduations is of critical interest to establishing the current
and future potential of the public education system to supply appropriately skilled people into the agriculture labour
market. For this reason, close attention is given in this chapter to analyzing these indicators as part of the process
of assessing the relationship between demand and supply of agricultural skills in the South African labour market.
Analysis is first presented of enrolments and throughputs in the universities and technikons, followed by Colleges
of Education and FET Colleges
3.2 Analysis of higher education data
The data discussed below is drawn from the Higher Education Management Information System (HEMIS) database.
For more information about the HEMIS database and how the data was extracted from HEMIS, please refer to the
Methodology chapter in this report. This data is based on the standard headcount numbers of student enrolment
and graduation that higher education institutions submit to the Higher Education Directorate of the National Department
of Education.
As will become clear in the tables, the data sourced covers a ten year period from 1994 to 2003 - in effect the first
decade of South Africa’s democracy. It therefore reflects the institutional and curriculum changes in the higher
education system from the perspective of the field of Agriculture. The fact that this series of data ends in 2003 is
not accidental. This is because at the time of the commissioning of this research in January 2005, the HEMIS data
for 2004 was not yet complete or validated for use on this project. On account of the fact that this data covers the
period up to and including 2003, it does not address the recent merger process that has taken place in the higher
education system which has involved the merging of ‘university’ and ‘Technikon’ forms to produce a different
institutional landscape.
Table 1: Agriculture and Renewable NaturalResources contains the following 2nd order CESMcategories
01010102010301040105010601070108010901100111011201130199
Agricultural EconomicsAgricultural Extension
Agricultural Food TechnologyAnimal Sciences
HorticulturePlant SciencesSoil Sciences
FisheriesForestry
Outdoor RecreationWildlife
Land ReclamationRenewable Natural Resources
Other Ag. and Renewable Resources
The data is analysed according to a system of
categorizing all degree, diploma and certificate
programmes offered in the higher education system.
There are twenty-two broad categories into which all
accredited certificate, diploma and degree courses
offered in higher education are categorized. The broad
categories are known as Categorisation of Education
Subject Matter (CESM) categories. Each high level
category (called a 1st order CESM category) contains
a number of fields or sub-categories (called 2nd order
CESM categories) in which cognate programmes are
grouped. Thus, the 1st order CESM category called
“Agriculture and Renewable Natural Resources”
contains the following 2nd order CESM categories:
For more information about the HEMIS database and how the data was extracted from HEMIS, please refer to the Methodologychapter in this report.
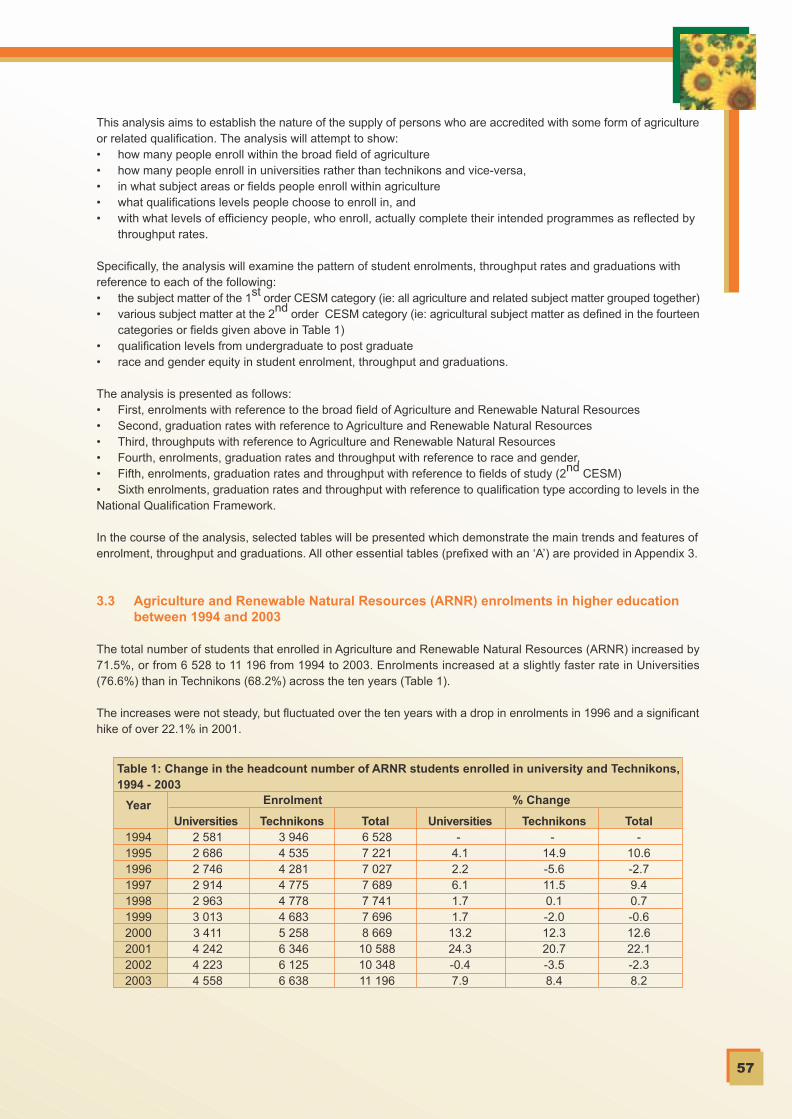
C M Y CM MY CY CMY K
57
This analysis aims to establish the nature of the supply of persons who are accredited with some form of agricultureor related qualification. The analysis will attempt to show:• how many people enroll within the broad field of agriculture• how many people enroll in universities rather than technikons and vice-versa,• in what subject areas or fields people enroll within agriculture• what qualifications levels people choose to enroll in, and• with what levels of efficiency people, who enroll, actually complete their intended programmes as reflected by
throughput rates.
Specifically, the analysis will examine the pattern of student enrolments, throughput rates and graduations withreference to each of the following:• the subject matter of the 1st order CESM category (ie: all agriculture and related subject matter grouped together)• various subject matter at the 2nd order CESM category (ie: agricultural subject matter as defined in the fourteen
categories or fields given above in Table 1)• qualification levels from undergraduate to post graduate• race and gender equity in student enrolment, throughput and graduations.
The analysis is presented as follows:• First, enrolments with reference to the broad field of Agriculture and Renewable Natural Resources• Second, graduation rates with reference to Agriculture and Renewable Natural Resources• Third, throughputs with reference to Agriculture and Renewable Natural Resources• Fourth, enrolments, graduation rates and throughput with reference to race and gender,• Fifth, enrolments, graduation rates and throughput with reference to fields of study (2nd CESM)• Sixth enrolments, graduation rates and throughput with reference to qualification type according to levels in theNational Qualification Framework.
In the course of the analysis, selected tables will be presented which demonstrate the main trends and features ofenrolment, throughput and graduations. All other essential tables (prefixed with an ‘A’) are provided in Appendix 3.
3.3 Agriculture and Renewable Natural Resources (ARNR) enrolments in higher education between 1994 and 2003
The total number of students that enrolled in Agriculture and Renewable Natural Resources (ARNR) increased by71.5%, or from 6 528 to 11 196 from 1994 to 2003. Enrolments increased at a slightly faster rate in Universities(76.6%) than in Technikons (68.2%) across the ten years (Table 1).
The increases were not steady, but fluctuated over the ten years with a drop in enrolments in 1996 and a significanthike of over 22.1% in 2001.
Table 1: Change in the headcount number of ARNR students enrolled in university and Technikons,1994 - 2003
Year
1994199519961997199819992000200120022003
Universities 2 581 2 686 2 746 2 914 2 963 3 013 3 411 4 242 4 223 4 558
Technikons 3 946 4 535 4 281 4 775 4 778 4 683 5 258 6 346 6 125 6 638
Total 6 528 7 221 7 027 7 689 7 741 7 696 8 669
10 588 10 348 11 196
Universities-
4.12.26.11.71.7
13.224.3-0.47.9
Technikons-
14.9-5.611.50.1-2.012.320.7-3.58.4
Total-
10.6-2.79.40.7-0.612.622.1-2.38.2
Enrolment % Change

C M Y CM MY CY CMY K
58
It is necessary to clarify whether enrolments in ARNR changed in proportion to enrolments in higher education asa whole. Although gross enrolments within ARNR increased by 71,5%, this was more or less in line with increasesacross the higher education system. As can be seen from Table 2, the ARNR share of total enrolment in highereducation rose from 1.32% in 1994 to 1.56% in 2003. If the ARNR percentage share of all higher education enrolmentshad remained constant between 1994 and 2003 (ie: had remained at 1.32%) enrolment would have been only 9475 in 2003. But the enrolment share of all students in universities and technikons increased to 1.56% or 11 196students in 2003. Even though enrolment in ARNR appeared to increase only slightly in percentage terms 1 721more students enrolled in 2003 in comparison with 1994. Enrolments grew faster in the natural sciences than inthe social sciences between 1993 and 2001 (CHE,2004,196) which to some extent explains the higher rate ofincrease in Agriculture - which encompasses mainly natural science - than the average for all entolments.
The data shows that ARNR enrolment as a proportion of enrolment differed between universities and Technikons.By 2003, in universities ARNR enrolment approached one per cent (0.93%) whereas in Technikons, enrolmentapproached three per cent (2.89%). The share of ARNR enrolment in Technikons declined between 1994 and 1999but recovered to above the 1994 levels in 2001. In universities, there was a steady increase in the ARNR share oftotal enrolment from 1996 onwards.
Table 2: Comparison of headcount number of students enrolled in ARNR in university and Technikoncompared to total enrolment in each institutional type, 1994 - 2003
Year
1994199519961997199819992000200120022003
AgricultureEnrolment
2 581 2 686 2 746 2 914 2 963 3 013 3 411 4 242 4 223 4 558
TotalEnrolment 347 568 368 845 375 615 370 680 362 746 356 818 387 361 428 094 460 470 487 741
% of Total
0.740.730.730.790.820.840.880.990.920.93
AgricultureEnrolment
3 946 4 535 4 281 4 775 4 778 4 683 5 258 6 346 6 125 6 638
TotalEnrolment 147 780 170 257 189 540 197 992 197 819 197 646 202 792 224 327 214 690 230 052
AgricultureEnrolment
6 528 7 221 7 027 7 689 7 741 7 696 8 669
10 588 10 348 11 196
Universities Technikons Total
% of Total
2.672.662.262.412.422.372.592.832.852.89
TotalEnrolment 495 348 539 102 565 155 568 672 560 565 554 464 590 153 652 421 675 160 717 793
% ofTotal1.321.341.241.351.381.391.471.621.531.56
There is a consistent pattern of numerically larger enrolments in ARNR in Technikons than universities. Table 3 belowdemonstrates that over the last decade, the share of enrolments has been in the favour of Technikons on a 3:2 basis.
Table 3: Headcount number of students enrolled in ARNR and the percentage share per year inuniversities and Technikons, 1994 - 2003
Year
1994199519961997199819992000200120022003
Universities 2 581 2 686 2 746 2 914 2 963 3 013 3 411 4 242 4 223 4 558
Technikons 3 946 4 535 4 281 4 775 4 778 4 683 5 258 6 346 6 125 6 638
Total 6 528 7 221 7 027 7 689 7 741 7 696 8 669
10 588 10 348 11 196
Universities40373938383939404141
Technikons60636162626161605959
Total100100100100100100100100100100
Enrolment % Share

C M Y CM MY CY CMY K
59
3.4 ARNR graduations from 1994 to 2003
The annual graduation ‘output’ from ARNR programmes, for universities and Technikons combined, rose from 967to 1765 graduates between 1994 and 2003. In crude terms, this represents an increase of 82.5% (Table 4).
However, it is preferable to analyse graduation numbers over a specified period rather than on a year-to-year basisbecause of the potential for wide annual fluctuations in this measure. This is because graduation numbers areaffected by inter alia: when enrolments take place, in what numbers students enroll in a particular year, the lengthof programmes for which students enroll (eg: from one year upwards to five or more years), the numbers of studentswho drop-out or return to study.
Although there was a nominal difference in growth in graduations, the following table shows how universities produceda larger percentage share of graduate output than Technikons on a relatively consistent basis, even though Technikonshad higher enrolments in the same period (Table 6). This finding is best discussed with reference to the conceptof ‘throughput’ which is the subject of the section below.
Table 4: Change in the headcount number of students graduated in ARNR from universities andTechnikons, 1994 - 2003
Year
1994199519961997199819992000200120022003
Universities 612 556 582 669 778 762 907 745 802 904
Technikons 355 584 630 598 679 624 627 703 811 862
Total 967
1 140 1 213 1 267 1 457 1 386 1 534 1 448 1 614 1 765
Universities
-9.24.7
14.916.2-2.019.0-17.97.8
12.6
Technikons
64.57.9-5.213.6-8.10.4
12.215.46.2
Total
17.96.34.5
15.0-4.910.6-5.611.59.4
Enrolment % Change
For the reasons given above, an annual average was calculated for graduations in the five year period 1994 – 1998,which is compared with an annual average for the five year period 1999 – 2003. Based on this method of averagingover a five year period, a more realistic picture of changes in graduation outputs is obtained. The data shows thatthere was no substantial difference between these institutional types in the extent to graduate output increased overthe two periods (Table 5).
Table 5: Comparison of annual average ARNR graduation numbersin universities and Technikons for two five year periods, 1994 - 2003
Range of years
UniversitiesTechnikonsTotal
1994 – 1998
639569
1209
1999 - 2003
824725
1549
Increase over thetwo periods
29%27%28%

C M Y CM MY CY CMY K
60
ARNR programme graduation numbers as a share of total graduations in higher education increased from 1.30%to 1.61% between 1994 and 2003 (Table A1 All tables referred to with the prefix ‘A’ are located in the Appendix andare numbered sequentially, viz: A1, A2, A3 etc. ). This suggests that relatively, the efficiency of agriculture programmesincreased slightly against the national average.
3.5 ARNR throughput rates from 1994 to 2003
Throughput is a measure of the efficiency of the institution and of the programme in bringing students from enrolmentto graduation. Throughput can be defined as the average number of years that a cohort of students takes to completethe learning programme for the qualification for which they registered. Throughput rates are calculated on the lengthof time the cohort spends in the system, and the proportion of drop-outs and/or repetitions, that delay or preventgraduations taking place. Throughput rates are affected by a variety of factors or characteristics that inhere in thestudent or in the institution. These include inter alia:• Admission policy of the institution• Quality of students seeking enrolment• The socio-economic context and household resources of students, especially disadvantaged students• Quality of instruction and facilities offered by the institution, etc.
Currently there is no available accurate means of calculating the throughput rate in South African higher educationinstitutions. This would require cohort studies that trace a group of students from first-year to graduation.
The South African higher education system calculates a ‘graduation rate’ as a proxy for throughput. The officialdefinition of the graduation rate is the number of graduations divided by the number of enrolments for the same year(Subotzky, 2003). The through-put rate is expressed as a ratio or in this case as a percentage so as to facilitatecomparisons.
Clearly this is a rough measure because it does not calculate the actual ‘throughput’ for any specific cohort ofstudents who enrolled for the same programme together. As such, this average measure is affected by the timingof sudden changes in enrolment in a particular year. For example, a sharp rise in enrolment in a particular year canforce the ‘graduation rate’ down while a sharp drop in enrolment can make the ‘graduation rate’ appear healthier.
Although the measure to be applied here is called the ‘graduation rate’ locally - and is in effect only a proxy forthroughput - we will refer to it as the throughput rate in order to avoid confusion in discussion of graduation numbers.
While the Technikon throughput rate was relatively stable over time, the throughput rate for universities rose to apeak in 2000 at 27% and then plunged sharply to begin slowly recovering between 2001 and 2003 (Table 7). Overall,throughput rate for Technikons was consistently lower than the rate for universities throughout the period underdiscussion.
Table 6: Change in the headcount number of students from universities and Technikons graduatingin ARNR, 1994 - 2003
Year
1994199519961997199819992000200120022003
Universities 612 556 582 669 778 762 907 745 802 904
Technikons 355 584 630 598 679 624 627 703 811 862
Total 967
1 140 1 213 1 267 1 457 1 386 1 534 1 448 1 614 1 765
Universities63494853535559515051
Technikons37515247474541495049
Total100100100100100100100100100100
Enrolment % Share
All tables referred to with the prefix ‘A’ are located in the Appendix and are numbered sequentially, viz: A1, A2, A3 etc.
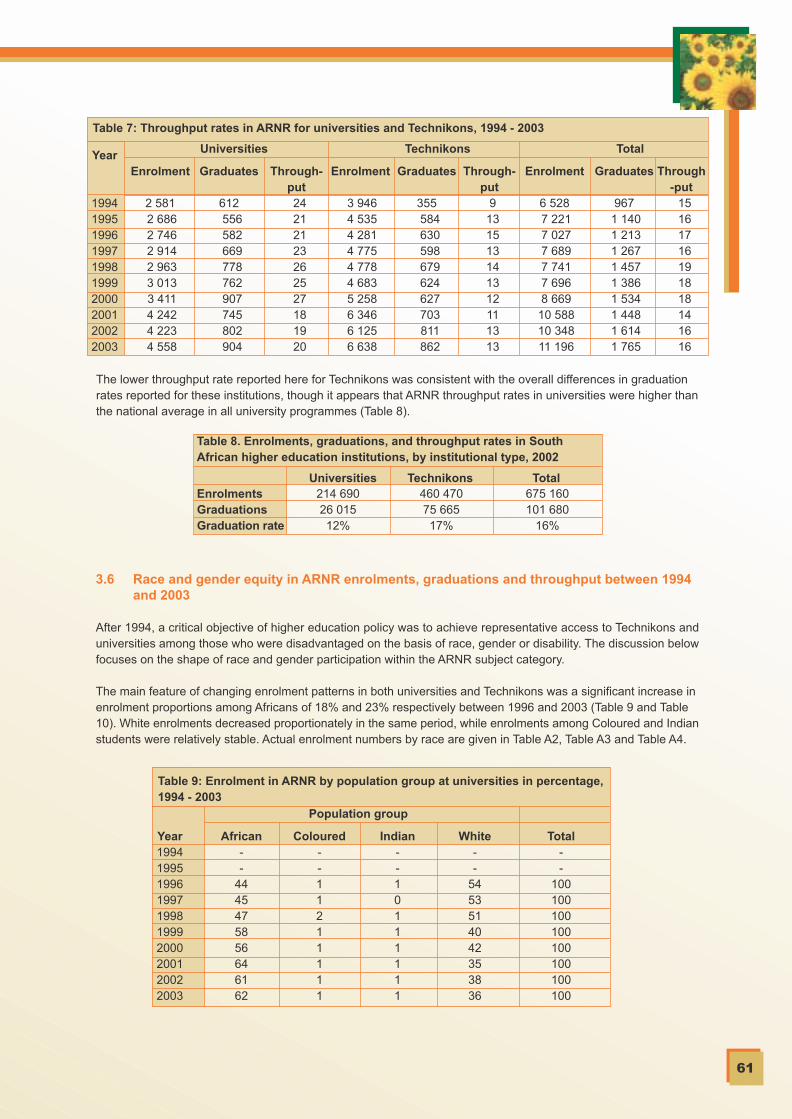
C M Y CM MY CY CMY K
61
The lower throughput rate reported here for Technikons was consistent with the overall differences in graduationrates reported for these institutions, though it appears that ARNR throughput rates in universities were higher thanthe national average in all university programmes (Table 8).
Table 7: Throughput rates in ARNR for universities and Technikons, 1994 - 2003
Year
1994199519961997199819992000200120022003
Enrolment
2 581 2 686 2 746 2 914 2 963 3 013 3 411 4 242 4 223 4 558
Graduates
612 556 582 669 778 762 907 745 802 904
Through-put 24 21 21 23 26 25 27 18 19 20
Enrolment
3 946 4 535 4 281 4 775 4 778 4 683 5 258 6 346 6 125 6 638
Graduates
355 584 630 598 679 624 627 703 811 862
Enrolment
6 528 7 221 7 027 7 689 7 741 7 696 8 669
10 588 10 348 11 196
Universities Technikons Total
Through-put 9
13 15 13 14 13 12 11 13 13
Graduates
967 1 140 1 213 1 267 1 457 1 386 1 534 1 448 1 614 1 765
Through-put 15 16 17 16 19 18 18 14 16 16
Table 8. Enrolments, graduations, and throughput rates in SouthAfrican higher education institutions, by institutional type, 2002
EnrolmentsGraduationsGraduation rate
214 69026 01512%
460 47075 66517%
675 160101 680
16%
Universities Technikons Total
3.6 Race and gender equity in ARNR enrolments, graduations and throughput between 1994 and 2003
After 1994, a critical objective of higher education policy was to achieve representative access to Technikons anduniversities among those who were disadvantaged on the basis of race, gender or disability. The discussion belowfocuses on the shape of race and gender participation within the ARNR subject category.
The main feature of changing enrolment patterns in both universities and Technikons was a significant increase inenrolment proportions among Africans of 18% and 23% respectively between 1996 and 2003 (Table 9 and Table10). White enrolments decreased proportionately in the same period, while enrolments among Coloured and Indianstudents were relatively stable. Actual enrolment numbers by race are given in Table A2, Table A3 and Table A4.
Table 9: Enrolment in ARNR by population group at universities in percentage,1994 - 2003
Year1994199519961997199819992000200120022003
African--
4445475856646162
Coloured--11211111
Indian--10111111
White--
5453514042353836
Total--
100100100100100100100100
Population group
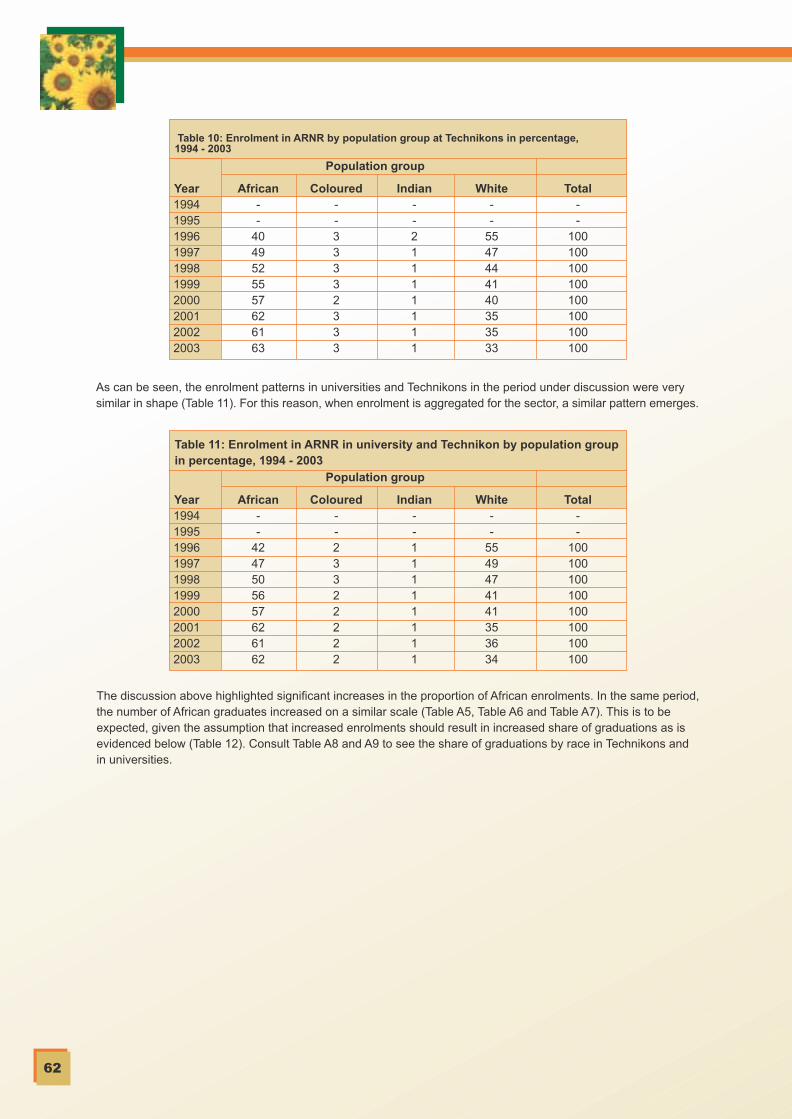
C M Y CM MY CY CMY K
62
The discussion above highlighted significant increases in the proportion of African enrolments. In the same period,the number of African graduates increased on a similar scale (Table A5, Table A6 and Table A7). This is to beexpected, given the assumption that increased enrolments should result in increased share of graduations as isevidenced below (Table 12). Consult Table A8 and A9 to see the share of graduations by race in Technikons andin universities.
As can be seen, the enrolment patterns in universities and Technikons in the period under discussion were verysimilar in shape (Table 11). For this reason, when enrolment is aggregated for the sector, a similar pattern emerges.
Table 10: Enrolment in ARNR by population group at Technikons in percentage,1994 - 2003
Year1994199519961997199819992000200120022003
African--
4049525557626163
Coloured--33332333
Indian--21111111
White--
5547444140353533
Total--
100100100100100100100100
Population group
Table 11: Enrolment in ARNR in university and Technikon by population groupin percentage, 1994 - 2003
Year1994199519961997199819992000200120022003
African--
4247505657626162
Coloured--23322222
Indian--11111111
White--
5549474141353634
Total--
100100100100100100100100
Population group
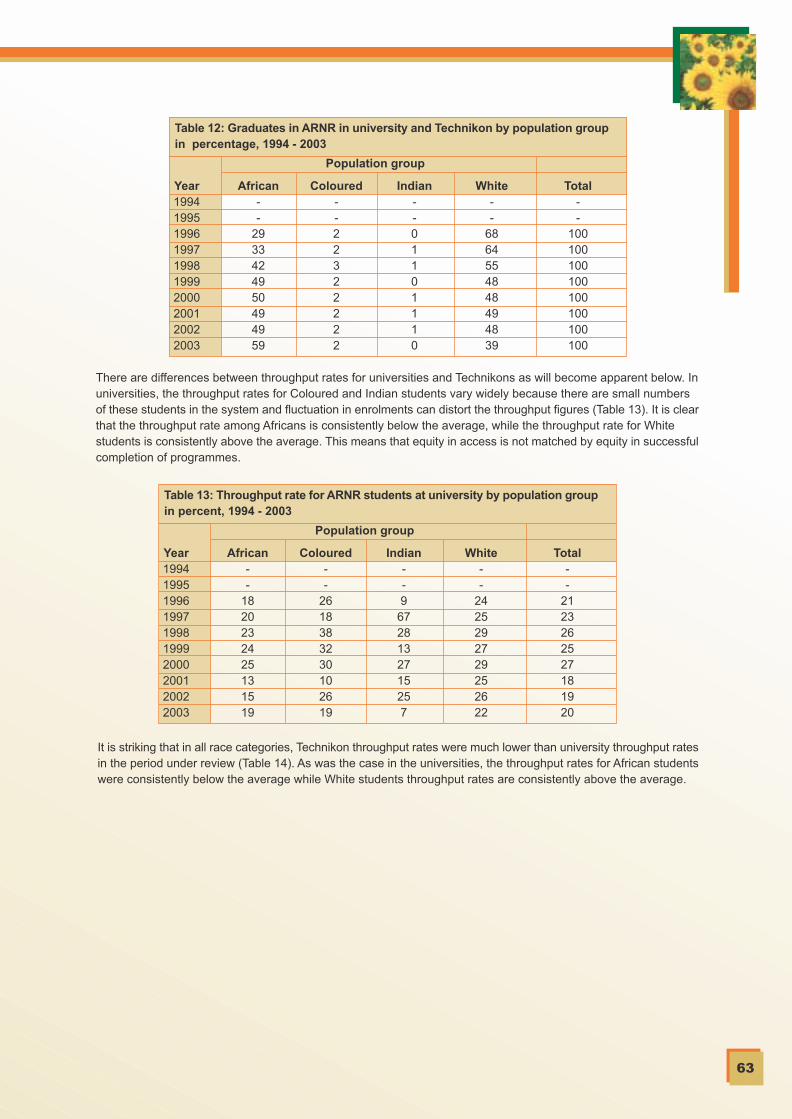
C M Y CM MY CY CMY K
63
It is striking that in all race categories, Technikon throughput rates were much lower than university throughput ratesin the period under review (Table 14). As was the case in the universities, the throughput rates for African studentswere consistently below the average while White students throughput rates are consistently above the average.
Table 12: Graduates in ARNR in university and Technikon by population groupin percentage, 1994 - 2003
Year1994199519961997199819992000200120022003
African--
2933424950494959
Coloured--22322222
Indian--01101110
White--
6864554848494839
Total--
100100100100100100100100
Population group
There are differences between throughput rates for universities and Technikons as will become apparent below. Inuniversities, the throughput rates for Coloured and Indian students vary widely because there are small numbersof these students in the system and fluctuation in enrolments can distort the throughput figures (Table 13). It is clearthat the throughput rate among Africans is consistently below the average, while the throughput rate for Whitestudents is consistently above the average. This means that equity in access is not matched by equity in successfulcompletion of programmes.
Table 13: Throughput rate for ARNR students at university by population groupin percent, 1994 - 2003
Year1994199519961997199819992000200120022003
African--
1820232425131519
Coloured--
2618383230102619
Indian--9
6728132715257
White--
2425292729252622
Total--
2123262527181920
Population group
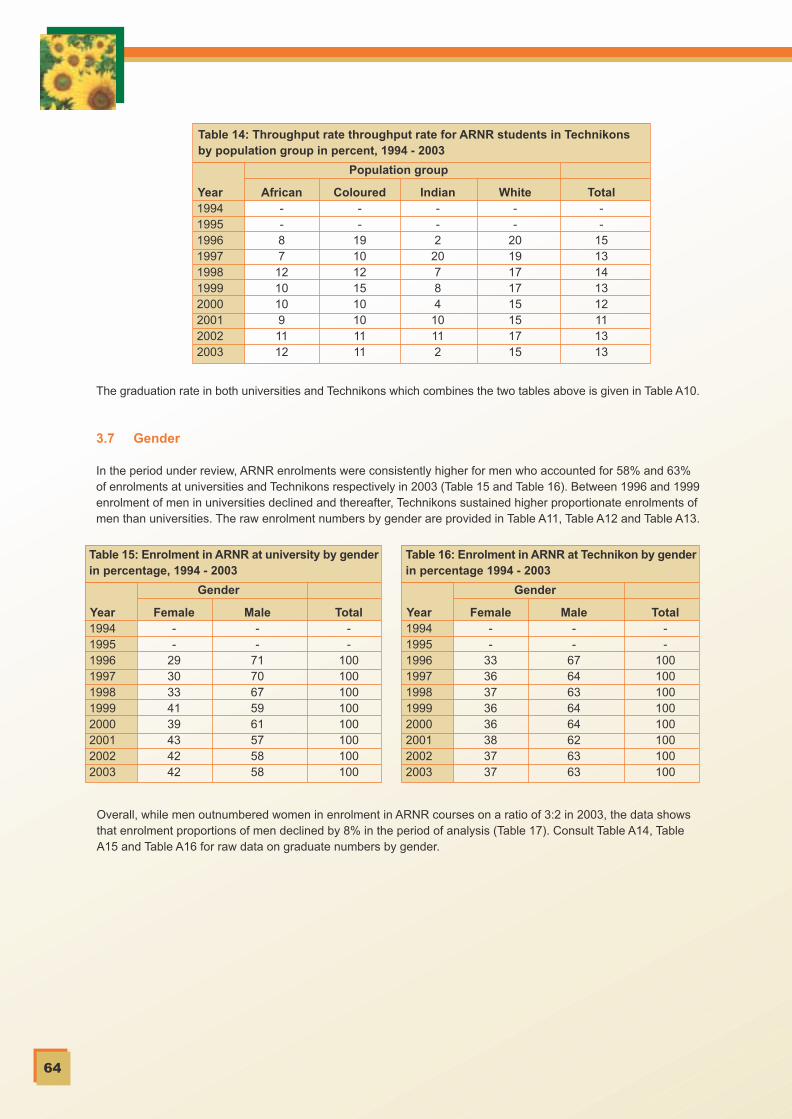
C M Y CM MY CY CMY K
64
The graduation rate in both universities and Technikons which combines the two tables above is given in Table A10.
3.7 Gender
In the period under review, ARNR enrolments were consistently higher for men who accounted for 58% and 63%of enrolments at universities and Technikons respectively in 2003 (Table 15 and Table 16). Between 1996 and 1999enrolment of men in universities declined and thereafter, Technikons sustained higher proportionate enrolments ofmen than universities. The raw enrolment numbers by gender are provided in Table A11, Table A12 and Table A13.
Overall, while men outnumbered women in enrolment in ARNR courses on a ratio of 3:2 in 2003, the data showsthat enrolment proportions of men declined by 8% in the period of analysis (Table 17). Consult Table A14, TableA15 and Table A16 for raw data on graduate numbers by gender.
Table 14: Throughput rate throughput rate for ARNR students in Technikonsby population group in percent, 1994 - 2003
Year1994199519961997199819992000200120022003
African--87
12101091112
Coloured--
1910121510101111
Indian--2
20784
10112
White--
2019171715151715
Total--
1513141312111313
Population group
Table 15: Enrolment in ARNR at university by genderin percentage, 1994 - 2003
Year1994199519961997199819992000200120022003
Female--
2930334139434242
Male--
7170675961575858
Total--
100100100100100100100100
Gender
Table 16: Enrolment in ARNR at Technikon by genderin percentage 1994 - 2003
Year1994199519961997199819992000200120022003
Female--
3336373636383737
Male--
6764636464626363
Total--
100100100100100100100100
Gender

C M Y CM MY CY CMY K
65
Table 17: Enrolment in ARNR in university andTechnikon by gender in percentage, 1994 - 2003
Year1994199519961997199819992000200120022003
Female--
31343538374039
Male--
69666562636061
Total--
100100100100100100100
Gender
Table 18: Graduates in ARNR in university andTechnikon by gender in percentage, 1994 - 2003
Year1994199519961997199819992000200120022003
Female--
2828333936374042
Male--
7272676164636058
Total--
100100100100100100100100
Gender
When the gender proportions of enrolments are compared with the gender proportions of graduates, the datasuggests that there was a steady decrease in the proportion of male graduates (Table 18). Table A17 and A18describe the gender breakdown of graduates at the level of the university and the Technikon respectively whichunderly Table 18 below.
But this observation must be tested by an examination of the throughput rates that will follow. Analysis has revealedthat throughput rates clearly differ between universities and Technikons in all dimensions. Tables A19 and A20 showthis also to be the case when looking at gender.
The data on throughput rates overall in universities and Technikons between 1996 and 2003 (Table 19) revealsrelatively small differences between females and males, but hints toward a dip in male throughput rates from 2001to 2003.
Table 19: Throughput rates in ARNR in universityand Technikon by gender in percentage 1994 - 2003
Year1994199519961997199819992000200120022003
Female--
1514181817131617
Male--
1818191818141515
Total--
1717191818141616
Gender

C M Y CM MY CY CMY K
66
3.8 Analysis of enrolments, graduations and throughput by study field (ARNR Second Order CESM category) from 1994 to 2003
Having analysed the dimensions of student enrolment, graduates and throughput from an institutional perspective,it is necessary to examine these dimensions from within the knowledge sub-fields of ARNR.
Such analysis will reveal patterns in the enrolment, graduation and throughput rates within particular sub-fields.Analysis at this level is important, since the choice of study field, and the choice of qualification level in combinationwith throughput rates will directly affect the distribution of entrants to the labour market with expertise in particularfields of agriculture.
Enrolment
Enrolment will be discussed at the institutional level first with reference to proportionate share by sub-field ofagriculture. (Actual enrolment numbers are presented in Table A21, Table A22 and Table A23).
In universities, the fields with the largest share of enrolment in 2003 were: Agricultural Economics (25%), AnimalSciences (18%), Plant Sciences (14%) and Soil Sciences (7%) (Table 20). It is observable that enrolment in AgriculturalEconomics showed an upward trend, while Animal Sciences enrolment fluctuated widely, and Plant Sciences declinedbetween 1999 and 2003.
Table 20: Enrolment in 2nd order CESM category/sub field in Universities by percentage, 1994 - 2003
2nd order CESM category
0101 Agricultural Economics0102 Agricultural Extension0103 Agricultural Food Technology0104 Animal Sciences0105 Horticulture0106 Plant Sciences0107 Soil Sciences0108 Fisheries0109 Forestry0110 Outdoor Recreation0111 Wildlife0112 Land Reclamation0113 Renewable Natural Resources0199 Other Ag. and Renewable ResourcesTotal
1994--------------
100
% Share
1995--------------
100
1996--------------
100
1997--------------
100
1998--------------
100
1999 18 5 6
17 5
17 70 2 0 30 4
18 100
2000 24 9 5
20 4
19 90 2 0 20 0 5
100
2001 20 13 4
28 3
15 70 2 0 20 0 5
100
2002 20 9 5
24 3
16 80 2 0 30 5 6
100
2003 25 11 4
18 4
14 70 1 0 20 7 6
100
In Technikons, the fields with the largest share of enrolment in 2003 were: Animal Sciences (29%), Horticulture(14%), and Plant Sciences (12%) (Table 21). It is observable that enrolment in Animal Sciences and also AgriculturalEconomics (6%) showed upward trends between 1999 and 2003.
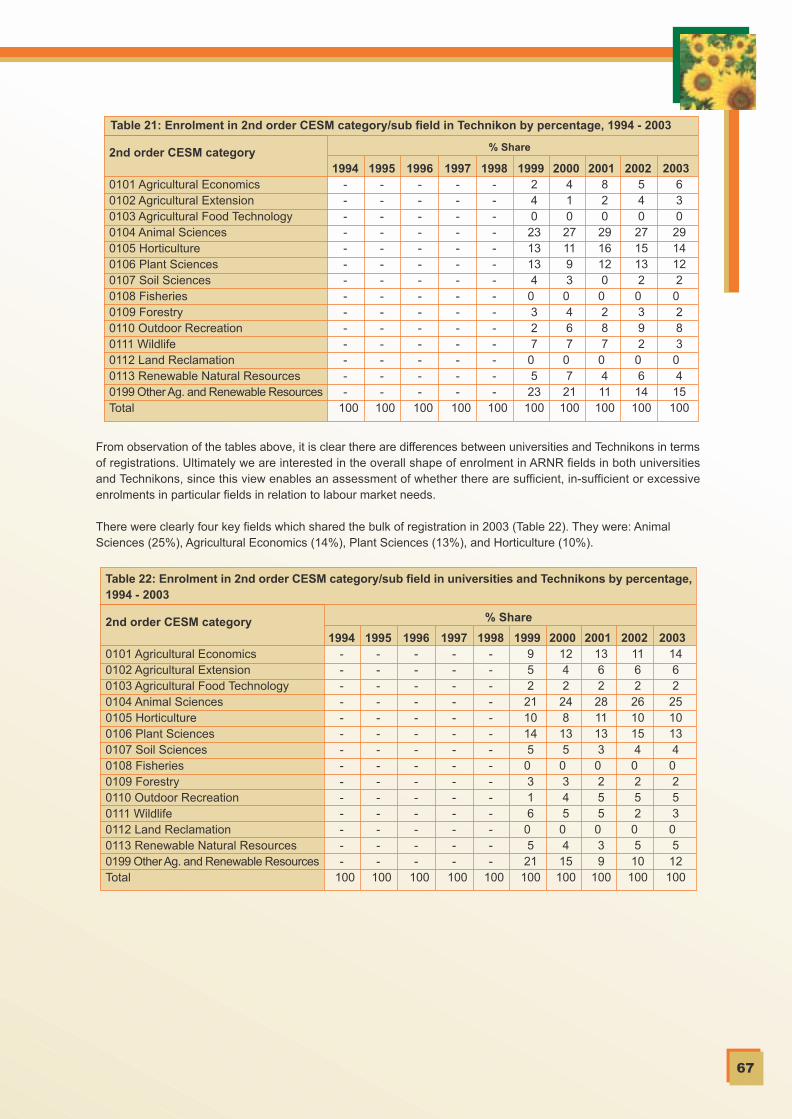
C M Y CM MY CY CMY K
67
Table 21: Enrolment in 2nd order CESM category/sub field in Technikon by percentage, 1994 - 2003
2nd order CESM category
0101 Agricultural Economics0102 Agricultural Extension0103 Agricultural Food Technology0104 Animal Sciences0105 Horticulture0106 Plant Sciences0107 Soil Sciences0108 Fisheries0109 Forestry0110 Outdoor Recreation0111 Wildlife0112 Land Reclamation0113 Renewable Natural Resources0199 Other Ag. and Renewable ResourcesTotal
1994--------------
100
% Share
1995--------------
100
1996--------------
100
1997--------------
100
1998--------------
100
1999 2 4 0
23 13 13 40 3 2 70 5
23 100
2000 4 1 0
27 11 9 30 4 6 70 7
21 100
2001 8 2 0
29 16 12 00 2 8 70 4 11
100
2002 5 4 0
27 15 13 20 3 9 20 6
14 100
2003 6 3 0
29 14 12 20 2 8 30 4
15 100
Table 22: Enrolment in 2nd order CESM category/sub field in universities and Technikons by percentage,1994 - 2003
2nd order CESM category
0101 Agricultural Economics0102 Agricultural Extension0103 Agricultural Food Technology0104 Animal Sciences0105 Horticulture0106 Plant Sciences0107 Soil Sciences0108 Fisheries0109 Forestry0110 Outdoor Recreation0111 Wildlife0112 Land Reclamation0113 Renewable Natural Resources0199 Other Ag. and Renewable ResourcesTotal
1994--------------
100
% Share
1995--------------
100
1996--------------
100
1997--------------
100
1998--------------
100
1999 9 5 2
21 10 14 50 3 1 60 5
21 100
2000 12 4 2
24 8
13 50 3 4 50 4
15 100
2001 13 6 2
28 11 13 30 2 5 50 3 9
100
2002 11 6 2
26 10 15 40 2 5 20 5
10 100
2003 14 6 2
25 10 13 40 2 5 30 5
12 100
From observation of the tables above, it is clear there are differences between universities and Technikons in termsof registrations. Ultimately we are interested in the overall shape of enrolment in ARNR fields in both universitiesand Technikons, since this view enables an assessment of whether there are sufficient, in-sufficient or excessiveenrolments in particular fields in relation to labour market needs.
There were clearly four key fields which shared the bulk of registration in 2003 (Table 22). They were: AnimalSciences (25%), Agricultural Economics (14%), Plant Sciences (13%), and Horticulture (10%).
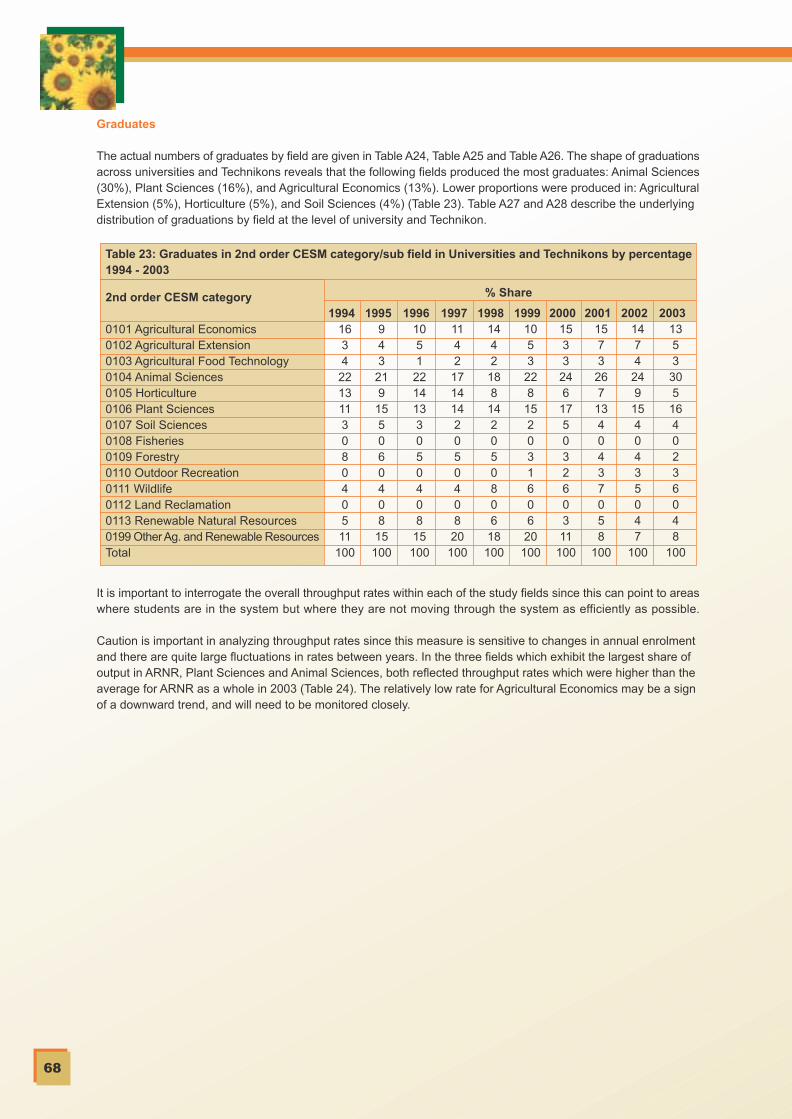
C M Y CM MY CY CMY K
68
It is important to interrogate the overall throughput rates within each of the study fields since this can point to areaswhere students are in the system but where they are not moving through the system as efficiently as possible.
Caution is important in analyzing throughput rates since this measure is sensitive to changes in annual enrolmentand there are quite large fluctuations in rates between years. In the three fields which exhibit the largest share ofoutput in ARNR, Plant Sciences and Animal Sciences, both reflected throughput rates which were higher than theaverage for ARNR as a whole in 2003 (Table 24). The relatively low rate for Agricultural Economics may be a signof a downward trend, and will need to be monitored closely.
Graduates
The actual numbers of graduates by field are given in Table A24, Table A25 and Table A26. The shape of graduationsacross universities and Technikons reveals that the following fields produced the most graduates: Animal Sciences(30%), Plant Sciences (16%), and Agricultural Economics (13%). Lower proportions were produced in: AgriculturalExtension (5%), Horticulture (5%), and Soil Sciences (4%) (Table 23). Table A27 and A28 describe the underlyingdistribution of graduations by field at the level of university and Technikon.
Table 23: Graduates in 2nd order CESM category/sub field in Universities and Technikons by percentage1994 - 2003
2nd order CESM category
0101 Agricultural Economics0102 Agricultural Extension0103 Agricultural Food Technology0104 Animal Sciences0105 Horticulture0106 Plant Sciences0107 Soil Sciences0108 Fisheries0109 Forestry0110 Outdoor Recreation0111 Wildlife0112 Land Reclamation0113 Renewable Natural Resources0199 Other Ag. and Renewable ResourcesTotal
1994 16 3 4
22 13 11 3 0 8 0 4 0 5 11
100
% Share
1995 9 4 3
21 9
15 5 0 6 0 4 0 8
15 100
1996 10 5 1
22 14 13 3 0 5 0 4 0 8
15 100
1997 11 4 2
17 14 14 2 0 5 0 4 0 8
20 100
1998 14 4 2
18 8
14 2 0 5 0 8 0 6
18 100
1999 10 5 3
22 8
15 2 0 3 1 6 0 6
20 100
2000 15 3 3
24 6
17 5 0 3 2 6 0 3 11
100
2001 15 7 3
26 7
13 4 0 4 3 7 0 5 8
100
2002 14 7 4
24 9
15 4 0 4 3 5 0 4 7
100
2003 13 5 3
30 5
16 4 0 2 3 6 0 4 8
100
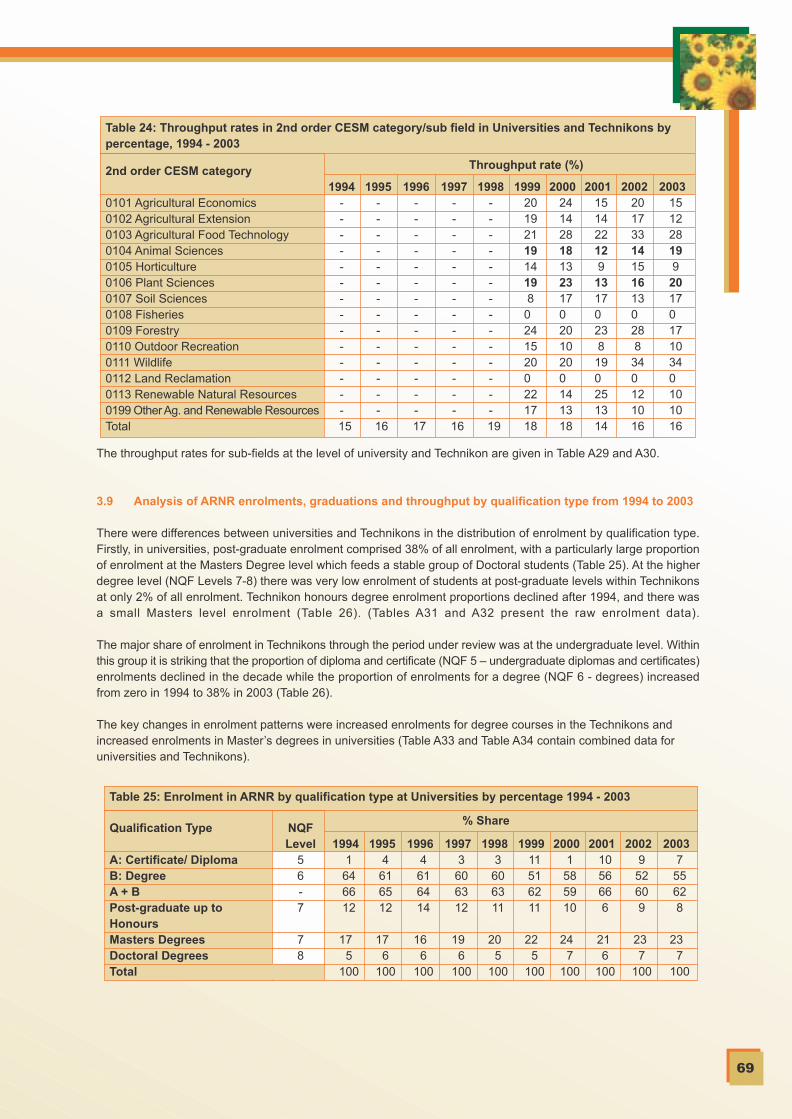
C M Y CM MY CY CMY K
69
The throughput rates for sub-fields at the level of university and Technikon are given in Table A29 and A30.
3.9 Analysis of ARNR enrolments, graduations and throughput by qualification type from 1994 to 2003
There were differences between universities and Technikons in the distribution of enrolment by qualification type.Firstly, in universities, post-graduate enrolment comprised 38% of all enrolment, with a particularly large proportionof enrolment at the Masters Degree level which feeds a stable group of Doctoral students (Table 25). At the higherdegree level (NQF Levels 7-8) there was very low enrolment of students at post-graduate levels within Technikonsat only 2% of all enrolment. Technikon honours degree enrolment proportions declined after 1994, and there wasa small Masters level enrolment (Table 26). (Tables A31 and A32 present the raw enrolment data).
The major share of enrolment in Technikons through the period under review was at the undergraduate level. Withinthis group it is striking that the proportion of diploma and certificate (NQF 5 – undergraduate diplomas and certificates)enrolments declined in the decade while the proportion of enrolments for a degree (NQF 6 - degrees) increasedfrom zero in 1994 to 38% in 2003 (Table 26).
The key changes in enrolment patterns were increased enrolments for degree courses in the Technikons andincreased enrolments in Master’s degrees in universities (Table A33 and Table A34 contain combined data foruniversities and Technikons).
Table 24: Throughput rates in 2nd order CESM category/sub field in Universities and Technikons bypercentage, 1994 - 2003
2nd order CESM category
0101 Agricultural Economics0102 Agricultural Extension0103 Agricultural Food Technology0104 Animal Sciences0105 Horticulture0106 Plant Sciences0107 Soil Sciences0108 Fisheries0109 Forestry0110 Outdoor Recreation0111 Wildlife0112 Land Reclamation0113 Renewable Natural Resources0199 Other Ag. and Renewable ResourcesTotal
1994--------------
15
Throughput rate (%)
1995--------------
16
1996--------------
17
1997--------------
16
1998--------------
19
1999 20 19 21 19 14 19 80
24 15 200
22 17 18
2000 24 14 28 18 13 23 170
20 10 200
14 13 18
2001 15 14 22 12 9
13 170
23 8
190
25 13 14
2002 20 17 33 14 15 16 130
28 8
340
12 10 16
2003 15 12 28 19 9
20 17
0 17 10 34
0 10 10 16
Table 25: Enrolment in ARNR by qualification type at Universities by percentage 1994 - 2003
Qualification Type
A: Certificate/ DiplomaB: DegreeA + BPost-graduate up toHonoursMasters DegreesDoctoral DegreesTotal
1994 1
64 66 12
17 5
100
% Share
1995 4
61 65 12
17 6
100
1996 4
61 64 14
16 6
100
1997 3
60 63 12
19 6
100
1998 3
60 63 11
20 5
100
1999 11 51 62 11
22 5
100
2000 1
58 59 10
24 7
100
2001 10 56 66 6
21 6
100
2002 9
52 60 9
23 7
100
2003 7
55 62 8
23 7
100
NQFLevel
56-7
78

C M Y CM MY CY CMY K
70
The combined output of graduates from universities and Technikons who enter the labour market shows that thelargest proportion of ARNR graduates (44%) entered the market with a diploma or certificate (NQF 5) qualification,followed by 32% with an under-graduate degree (NQF 6) and 24% with a post-graduate qualification (NQF 7 – 8)(Table 27). (Tables A35, A36, A37, A38 and A39 present the data for universities and Technikons separately).
Throughput rates are affected by a number of factors such as the quality of school preparation that undergraduatesbring with them and the quality of programmes and support provided to post-graduates. Additionally, the length ofthe course impacts significantly on throughputs rates, with shorter courses having generally higher rates and longercourses having generally lower rates. This is due to the way in which the rate is derived from dividing the totalnumber of graduates per year, by the total number of students (over all academic years) enrolled for that course.This provides an explanation for the exceptionally high thorughput rate of 55% in 2003 for the one-year Honourslevel progamme (Table 28). Factors other than course duration must however account for the different throuhputrates of the certificate and basic degree progammes, as both are generally 3 years in duration. (Underlying data isin Table A40 and Table A41).
Table 27: Graduates in ARNR by qualification type at Universities and Technikons in percentage, 1994 -2003
Qualification Type
A: Certificate/ DiplomaB: DegreeA + BPost-graduate up toHonoursMasters DegreesDoctoral DegreesTotal
1994 33 35 68 21
8 2
100
% Share
1995 45 30 75 17
7 1
100
1996 47 25 72 21
5 1
100
1997 45 32 77 15
7 2
100
1998 41 38 79 12
8 2
100
1999 42 35 77 13
8 1
100
2000 31 45 76 13
9 1
100
2001 37 41 78 10
10 2
100
2002 45 32 77 10
11 2
100
2003 44 32 76 11
9 4
100
NQFlevel
56-7
78
Table 26: Enrolment in ARNR by qualification type in Technikons by percentage 1994 - 2003
Qualification Type
A: Certificate/ DiplomaB: DegreeA + B: Under-graduatesPost-graduate up toHonoursMasters DegreesDoctoral DegreesTotal
1994 95 0
95 5
0 0
100
% Share
1995 95 1
96 4
0 0
100
1996 94 4
98 2
0 0
100
1997 91 7
99 1
0 0
100
1998 91 9
99 0
1 0
100
1999 86 13 99 0
1 0
100
2000 65 34 99 0
1 0
100
2001 55 43 98 0
2 0
100
2002 62 36 98 0
2 0
100
2003 60 38 98 0
2 0
100
NQFlevel
56-7
78
Table 28: Through-put rate by qualification type and year in Universities and Technikons
Qualification Type
A: Certificate/ DiplomaB: DegreeA + BPost-graduate up toHonoursMasters DegreesDoctoral DegreesTotal
1994 8
21 12 39
17 18 15
Through-put rate (%)
1995 12 21 14 40
17 10 16
1996 14 17 15 56
14 10 17
1997 13 20 15 47
15 13 17
1998 14 25 17 51
18 16 19
1999 13 23 17 54
17 11 18
2000 14 19 16 59
17 9
18
2001 14 12 12 53
15 11 14
2002 17 12 14 39
18 12 16
2003 18 11 14 55
14 18 16
NQFlevel
56-7
78

C M Y CM MY CY CMY K
71
3.10 Output of Agricultural Colleges
The graduate output data covers the years 1999 to 2004 and shows that the total output of graduates at years 1,2 and 3 ranged from a low of 794 in 2001 to 1000 in 2004. This variation reflects the pattern of enrolments and ofproportions of students completing in time or over a longer period than expected for each qualification – the Certificate,the Higher Certificate and the Diploma years respectively.
In terms of gender, male graduates consistently outnumber female graduates on a ratio of about 2.5 to 1. But thislargely reflects the fact that more males enroll at the Colleges. It is interesting to note that in the universities, theenrolment of females is much more on a par with male enrolments.
Analysis of graduates on the basis of race shows that African and White males are the dominant groups in theColleges. Overall, between 1999 and 2004, African students were the largest group of graduates (59%) followedby White students (39%).
The enrolment data in the Colleges shows a consistent level of registrations between 1200 and 1600 from 1999 to2003.
Graduates from Agricultural Colleges 2000 – 2004
Total5325
100%
White209039%
Indian8
0%
Coloured78
1%
African314959%
GraduatesPercentage

C M Y CM MY CY CMY K
72
Table 29: Graduate output of Agricultural Colleges 2000 to 2004
Male Female
2004
2003
2002
2001
2000
1999
CertificateHigher CertDiplomaTotal
CertificateHigher CertDiplomaTotal
CertificateHigher CertDiplomaTotal
CertificateHigher CertDiplomaTotal
CertificateHigher CertDiplomaTotal
CertificateHigher CertDiplomaTotal
African11913181
331
12711068
305
1098599
293
9247
101240
5265
222339
10178
120299
Coloured12
23
17
2327
1113
262
10
1326
671
14
Indian1001
1001
1001
1001
0022
0000
White136141
71348
1379862
297
1319968
298
1339958
290
10211561
278
8012797
304
Total268274155697
267211132610
242185168595
228152161541
155183287625
187212218617
African747588
237
675756
180
5366
102221
774287
206
3751
170258
7038
132240
Coloured2103
1203
2103
2103
2204
4105
Indian0000
0000
1001
0000
0101
0000
White32201163
26141252
29161257
10141034
1516
536
1313
733
Total108
9699
303
947368
235
8583
114282
895797
243
5470
175299
8752
139278
Total376370254
1000
361284200845
327268282877
317209258784
209253462924
274264357895

C M Y CM MY CY CMY K
73
3.11 Output of FET Colleges affected by sectoral and sub-sectoral factors
Of the fifty FET Colleges, only ten offer agricultural programmes. The current enrolment in agricultural instructionalofferings of less than 1% constitutes a small proportion of the entire enrolment of students in all the FET Collegesacross all programmes. Cumulatively, in 2004 students completed 625 instructional offerings in the field of agriculture.Each instructional offering is a component within a programme leading to a qualification. Therefore, the actualnumber of graduates will be considerably lower than these totals.
The data on rates of completion of the FET qualifications, which are N1 to N6 and the Diploma, show that between2000 and 2004 overall between 119 and 161 people graduated across the different levels (Table 31 below).
It is clear that the main source levels at which students complete is N4 to N6 which indicates that prospectivestudents are more interested in the post –N3 level programmes. These programmes have a required practicalcomponent which means that those enrolled are likely to be either working in an agricultural business environmentor are themselves small business owners.
The data on the FET Colleges obtained from the National Department of Education was not provided with racebreakdowns. However, in terms of gender, there is a visible pattern in which females constitute generally less than20% of the graduate population
All FET Instructional Offerings
FET Instructional Offerings in Agriculture
Agricultural Instructional Offerings as a %of all FET Instructional Offerings
Registered185 626266 488
1 255990
0.68%0.37%
Wrote166 261222 938
727751
0.44%0.34%
Passed108 331140 755
290335
0.27%0.24%
Table 30: Comparison of registration of students for all FET and only for Agriculture related instructionalofferings, 2004
JunNovJunNovJunNov

C M Y CM MY CY CMY K
74
Notes:1. The data for 2002 has to be checked with SITA2. The data for the Diploma was provided as a grand total 50 graduates for all years between 2000 and 2004. This was proportionately allocated to each year so as to obtain an average output of the system. SITA has been approached to obtain the actual annual breakdown.
Table 31: Graduate output from FET Collees with N1 to N6 and Diploma from 2000 to 2004
2000 2001 2002 2003 2004
QualificationN1N2N3N4N5N6DiplomaTotal
M35
31303136
136
F39
1
13
Total 6 14 31 31 31 36
10159
M6
1332412020
132
F1
126411
25
Total 7
25 38 45 21 21
10167
M
821202713
89
F
1739
20
Total -
9 28 23 36 13
10119
M96
23402611
115
F132
1231
22
Total 10
9 25 52 29 12
10147
M4
1010222137
104
F165
111113
47
Total 5
16 15 33 32 50
10161
C M Y CM MY CY CMY K
75
It is clear that the semester-based structure of instructional offerings provided by the FET Colleges lends itself tolearners enrolling not for a whole qualification at one time, but on an intermittent basis. In some instances, learnerswill enroll for a one semester instructional offering from the N4 to the N6 level on a once-off basis because thismeets a particular need they have for specific skills (eg: employees in the wine industry may take a single coursein viticulture in the N4 to N6 level). In other instances, learners who are full time or part time employed will enrollfor courses on an intermittent basis over a period of several years before they complete all the requirements for aparticular qualification.
3.12 Conclusion
The annual graduation ‘output’ from agriculture programmes, for universities and Technikons combined, rose from967 in 1994 to 1765 graduates in 2003. The agriculture share of total enrolment in higher education rose from 1.32%in 1994 to 1.56% in 2003. Even though enrolment in ARNR appeared to increase only slightly in percentage terms,1 721 more students enrolled in 2003 in comparison with 1994. Agriculture programme graduation numbers as ashare of total graduations in higher education increased from 1.30% to 1.61% between 1994 and 2003. This suggeststhat relatively, the efficiency of agriculture programmes increased slightly against the national average.
There is a consistent pattern of numerically larger enrolments in ARNR in Technikons than universities. Over thelast decade, the share of enrolments has been in the favour of Technikons on a 3:2 basis. The main feature ofchanging enrolment patterns in both universities and Technikons was a significant increase in African enrolmentsfrom 42% in 1996 to 62% in 2003. In the period under review, agriculture enrolments were consistently higher formen who accounted for 58% and 63% of enrolments at universities and Technikons respectively in 2003.
In universities, the fields with the largest share of enrolment in 2003 were: Agricultural Economics (25%), AnimalSciences (18%), Plant Sciences (14%) and Soil Sciences (7%). In Technikons, the fields with the largest share ofenrolment in 2003 were: Animal Sciences (29%), Horticulture (14%), and Plant Sciences (12%). Across highereducation there were four key fields which shared the bulk of registration in 2003. They were: Animal Sciences(25%), Agricultural Economics (14%), Plant Sciences (13%), and Horticulture (10%).In universities, post-graduate enrolment comprised 38% of all enrolment, with a particularly large proportion ofenrolment at the Masters Degree level. At the higher degree level, there was very low enrolment of students at post-graduate levels within Technikons at only 2% of all enrolment.
In the Agricultural Colleges, the graduate outputs ranged from a low of 794 in 2001 to 1000 in 2004. In terms ofgender, male graduates consistently outnumber female graduates on a ratio of about 2.5 to 1. Overall, between1999 and 2004, African students were the largest group of graduates (59%) followed by White students (39%).
Rates of completion of the FET qualifications, which are N1 to N6 and the Diploma, show that between 2000 and2004, overall between 119 and 161 people graduated across the different levels. It is clear that the levels at whichmost students complete is N4 to N6, which indicates that students are more interested in the post–N3 levelprogrammes. The data on the FET Colleges obtained from the National Department of Education was not providedwith race breakdowns. However, in terms of gender, there is a visible pattern in which females constitute less than20% of the graduate population.
3.13 References
Subotsky, G. (2003) “Private Higher Education and Training” In: Human Sciences Research Council Human ResourcesDevelopment Review, 2003 Pretoria, HSRC.

C M Y CM MY CY CMY K
C M Y CM MY CY CMY K

C M Y CM MY CY CMY K
78
CHAPTER 4
Enrolment, graduation and throughput of agricultural graduates in highereducation according race, gender and field of study from 2000 to 2003
4.1 Introduction
In South Africa, creating equality of access, opportunity and outcomes in education is a critically important missionfor the public education system. This is a particularly important challenge given the historical background of Apartheidwhich involved state sponsored discrimination against people on the basis of race. Furthermore, educational issuesare central to the transformation of the agriculture sector, given the history of land dispossession, racial demarcationof occupations in the agricultural sector and relegation of the agriculture curriculum in black schools to low-skillsactivities under Apartheid and colonialism.
It is thus important to monitor the patterns of access to the agriculture field in higher education as the study fieldstaken up by students from previously disadvantaged communities, can contribute to black economic empowerment,and gender parity in the sector.
This chapter therefore provides an intensive analysis of the race and gender proportions of enrolments, graduatesand throughput in the fields of study associated with the broad category of Agriculture and Renewable NaturalResources (ARNR) created according to the Classification of Education Subject Matter (CESM) system employedin South Africa’s higher education system.
The chapter will procede as follows: first, a set of summary tables is presented to show the overall race and genderdistribution of enrolments and graduates for each ARNR study field (2nd Order CESM Category). In this set of tablesas in all other tables in this chapter, the data is presented separately for universities and for technikons.
Following the presentation of data by field, each table is sorted in order to show highest to lowest representationof Africans per study field. The tables are also sorted to show highest to lowest representation of females per studyfield.
Then, the data for each field is presented separately to reveal shifts in student distributions by race and gender. Inorder to make the information more user friendly, each study-field is presented with:• a list of sub-fields that it contains• an example of at least one core occupation associated with the field• tables describing distributions by race and gender for enrolments, graduations and throughput (universities
and technikons separately)• a table showing which institutions offered instruction in the field
Where appropriate, commentary is provided.
It is important to acknowledge that the data only covers a four year period – 2000 to 2003. Over such a short period,it may not be possible to discern clear trends. The data is only available from 2000 onwards because the HEMISsystem was able to generate enrolment and graduation head-counts by field of study but not by the race and genderidentity of students before that year. The data for 2004 has not been released by the Department of Education.
It should be noted that the numbers cited here include all qualification levels from undergraduate to post-graduatein order to show the overall pattern of access to each field.

C M Y CM MY CY CMY K
79
4.2 Summary tables of enrolments and graduations by race and gender
This section will first compare the overall distribution of enrolment and graduation in the universities with the overalldistribution of enrolment and graduation in the technikons.
In the universities, the data shows that there was an equally wide range in the distribution of Africans across theagriculture study fields from 100% to 14% for enrolments, and from 100% to 11% for graduations. In other words,in some fields only Africans were enrolled while in other fields, Africans constituted only 14% of enrolments (Table1 and Table 2).
Differences in gender representation were less extreme, showing that the proportions of female students rangedfrom 72% to 17% and from 74% to 13% among enrolments and graduations respectively. Put differently, in somefields about three quarters of students enrolled were women and in other fields the proportion of women was lessthan one-in-five (Table 1 and Table 2). Despite the fact that the overall proportion of men in universities was 58%in 2003, it is clear that there are a few courses where women dominate enrolments (Table 15 Chapter 3).
Table 1: Race and gender share of University enrolments in Agriculture and RenewableNatural Resources between 2000 and 2003
TotalN
36133091761
3737599
26161248
6261
0385
0530890
African69894464405449
10051-
14-
9246
Coloured102013103-2-11
Indian102111103-1-33
White301052355843490
44-
83-5
50
Female324872473841326717-
37-
4740
Male685228536259683383-
63-
5360
Race % Gender %
0101 Agricultural Economics0102 Agricultural Extension0103 Agricultural Food Technology0104 Animal Sciences0105 Horticulture0106 Plant Sciences0107 Soil Sciences0108 Fisheries0109 Forestry0110 Outdoor Recreation0111 Wildlife0112 Land Reclamation0113 Renewable Natural Resources0199 Other Ag. and Renewable Resources
2nd order CESM Category or Study field
TotalN
720219213748150691271
4610
1540
25124
African58952860304151
10042-
11-
9170
Male685326546357622587-
53-
4863
Female324774463743387513-
47-
5237
White404
67397056480
54-
86-9
29
Indian102111202-1-01
Coloured102003002-2-00
Table 2: Race and gender share of University graduates in Agriculture and RenewableNatural Resources between 2000 and 2003
Race % Gender %
0101 Agricultural Economics0102 Agricultural Extension0103 Agricultural Food Technology0104 Animal Sciences0105 Horticulture0106 Plant Sciences0107 Soil Sciences0108 Fisheries0109 Forestry0110 Outdoor Recreation0111 Wildlife0112 Land Reclamation0113 Renewable Natural Resources0199 Other Ag. and Renewable Resources
2nd order CESM Category or Study field

C M Y CM MY CY CMY K
80
In the technikons, the proportions of Africans across the study fields ranged from 75% to 5% for enrolments, andfrom 70% to 11% for graduations. This suggests that the distribution of African university students across the fieldsof study was more uneven than in the Technikons, bearing in mind that overall proportions of Africans in universitiesand technikons were close at 62% and 63% respectively (Table 9 and Table 10 in Chapter 3). In some courses inthe universities (eg: Renewable Natural Resources 92% and Agricultural Extension 89%) Africans experiencedhigher levels of representation than in the technikons.
In the technikons, differences in gender representation were less extreme between enrolments and graduationsshowing that the presence of female students ranged from 58% to 11%, and from 55% to 19% respectively (Table3 and Table 4) Overall, in technikons, enrolment of women in 2003 stood at 63% (Table 16 in Chapter 3). In termsof graduations, females at best barely outnumbered males in two fields and achieved lower rates in the balance ofstudy fields. In comparison with universities, the technikons appeared to afford less opportunity for women, in thatthere were less courses where female enrolments outnumbered male enrolments.
TotalN
1395666
068753182255141210
68418831169
013153655
African7275-
675362575
565535
4866
Male5850-
6161696659894264
6575
Female4250-
3939313441115836
3525
White2524-
3140354195404064
4528
Indian00-02010120
02
Coloured31-25310320
73
Table 3: Race and gender share of Technikon enrolments in Agriculture andRenewable Natural Resources between 2000 and 2003
Race % Gender %
0101 Agricultural Economics0102 Agricultural Extension0103 Agricultural Food Technology0104 Animal Sciences0105 Horticulture0106 Plant Sciences0107 Soil Sciences0108 Fisheries0109 Forestry0110 Outdoor Recreation0111 Wildlife0112 Land Reclamation0113 Renewable Natural Resources0199 Other Ag. and Renewable Resources
2nd order CESM Category or Study field
TotalN
145106
0827265268
?2
149167188
0227373
African6669-
7034401411482624
3257
Male6645-
6561688667814960
6579
Female3455-
3539321433195140
3521
White2931-
2954568689497176
6341
Indian10-02000120
00
Coloured40-111300310
61
Table 4: Race and gender share of Technikon graduates in Agriculture andRenewable Natural Resources between 2000 and 2003
Race % Gender %
0101 Agricultural Economics0102 Agricultural Extension0103 Agricultural Food Technology0104 Animal Sciences0105 Horticulture0106 Plant Sciences0107 Soil Sciences0108 Fisheries0109 Forestry0110 Outdoor Recreation0111 Wildlife0112 Land Reclamation0113 Renewable Natural Resources0199 Other Ag. and Renewable Resources
2nd order CESM Category or Study field

C M Y CM MY CY CMY K
81
The analysis will now examine more closely how enrolments and graduations are distributed across the differentstudy fields.
It should also be noted that the representation of persons classified as ‘Coloured’ and ‘Indian’ is very low acrossall agricultural fields. For this reason, discussion will focus mainly on the proportionate share of enrolments betweenAfrican and White students. This does not detract from the question: why do Coloured and Indian students showlow levels of interest in agriculture, which would require investigation beyond the scope of this study.
In the universities, the study fields with the highest proportions of African students were Renewable Natural Resources(92%) and Agricultural Extension (89%), whereas the lowest proportionate share of registration was in AgriculturalFood Technology (44%), Horticulture (40%) and Wildlife (14%). The low enrolment in a technological subject suchas Agricultural Food Technology can be partly understood in relation to small numbers of African learners completingSenior Certificate with Mathematics and Science. Yet, at the same time, African student enrolment in AgriculturalEconomics is relatively high which suggests that the gateway subjects of Mathematics and Science subjects cannotbe the only reason for low enrolment in particular study fields. Easier admission criteria for Agricultural Extension– which generally do not specify high levels of Mathematics skills – can partially explain why enrolment of Africanstudents in that field is so high.
In some instances there is a particular pattern of enrolment in subjects by race and gender. For example, we havealready shown that low numbers of Africans are enrolled for Agricultural Food Technology, and this is coupled withhigh female representation of 72%, which implies that the majority group enrolled is white females.
The following discussion focuses on comparing the enrolment share with the graduation share obtained by thedifferent race groups. Of particular interest is where a race group has a lower share of graduations than its shareof enrolments, or the other way round. In the former situation, where the proportionate share of graduations is muchlower than enrolments this must be taken as a matter of concern.
When the pattern of enrolments is compared with graduations in the universities, there are certain fields in whichthe graduation figures of Africans are markedly lower than their enrolment figures: Agricultural Food Technology(16% lower), Plant Sciences (13% lower) and Agricultural Economics (11% lower).
Table 5: Share of University enrolments in Agriculture and Renewable Natural Resourcesby race and ranked by highest African share of 2nd order CESM Category orStudy field from 2000 to 2003 (%)
0108 Fisheries0113 Renewable Natural Resources0102 Agricultural Extension0101 Agricultural Economics0104 Animal Sciences0106 Plant Sciences0109 Forestry0107 Soil Sciences0199 Other Ag. and Renewable Resources0103 Agricultural Food Technology0105 Horticulture0111 Wildlife0112 Land Reclamation0110 Outdoor Recreation
N6
53030913613373726162611248890761599385
00
2nd order CESM Category or Study field
African1009289696454514946444014--
Coloured010103311212--
Indian030111313211--
White05
10303543444950525883--
Race share %Total

C M Y CM MY CY CMY K
82
In the universities, female students tended to fare better academically than male students. There was only one field,Forestry, in which the graduation rate of female students was lower than their enrolment rate. In six other fields,the decline in graduation rates was among male students (Table 8).
N7616
30913737530
2616890599385
3613124826100
Female726748474741403837323217--
Male283352535359606263686883--
Table 6:Share of University enrolments in Agriculture and RenewableNatural Resources by gender and ranked by 2nd order CESM
Categoryor Study field category from 2000 to 2003 (%)
Gender share %
0103 Agricultural Food Technology0108 Fisheries0102 Agricultural Extension0104 Animal Sciences0113 Renewable Natural Resources0106 Plant Sciences0199 Other Ag. and Renewable Resources0105 Horticulture0111 Wildlife0101 Agricultural Economics0107 Soil Sciences0109 Forestry0112 Land Reclamation0110 Outdoor Recreation
Total2nd order CESM Category or Study field
N4
21925
12474872021327161
691150154
00
African1009591706058285142413011--
Coloured000001202302--
Table 7: Share of University graduates in Agriculture and Renewable Natural Resourcesby race and ranked by 2nd order CESM Category or Study field from 2000 to 2003 (%)
Gender share %
0108 Fisheries0102 Agricultural Extension0113 Renewable Natural Resources0199 Other Ag. and Renewable Resources0104 Animal Sciences0101 Agricultural Economics0103 Agricultural Food Technology0107 Soil Sciences0109 Forestry0106 Plant Sciences0105 Horticulture0111 Wildlife0110 Outdoor Recreation0112 Land Reclamation
Total2nd order CESM Category or Study field
Indian000111222111--
White049
293940674854567086--

C M Y CM MY CY CMY K
83
In the Technikons, the subject field with the biggest proportion of African students was Agricultural Extension (75%)followed by Agricultural Economics (72%).
N4
21325
2191547486912711501247206100
Female757452474746433837373213--
Male252648535354576263636887--
Table 8: Share of University enrolments in Agriculture and RenewableNatural Resources by gender and ranked by 2nd order CESMCategory or Study field from 2000 to 2003 (%)
Gender share %
0108 Fisheries0103 Agricultural Food Technology0113 Renewable Natural Resources0102 Agricultural Extension0111 Wildlife0104 Animal Sciences0106 Plant Sciences0107 Soil Sciences0105 Horticulture0199 Other Ag. and Renewable Resources0101 Agricultural Economics0109 Forestry0110 Outdoor Recreation0112 Land Reclamation
Total2nd order CESM Category or Study field
N687536552551412684
18833182131511691000
African6766625756555348355--
Coloured2331325700--
Table 9: Share of Technikon enrolments in Agriculture and Renewable Natural Resourcesby race and ranked by 2nd order CESM Category or Study field from 2000 to 2003 (%)
Gender share %
0104 Animal Sciences0199 Other Ag. and Renewable Resources0106 Plant Sciences0107 Soil Sciences0109 Forestry0110 Outdoor Recreation0105 Horticulture0113 Renewable Natural Resources0111 Wildlife0108 Fisheries0103 Agricultural Food Technology0112 Land Reclamation
Total2nd order CESM Category or Study field
Indian0201122000--
White31283541404040456495--

C M Y CM MY CY CMY K
84
In the technikons there were several fields where African students suffered a significant slump between their sharesof enrolments as compared with graduations such as in: Outdoor Recreation (29% down), Plant Sciences (22%down) and Horticulture (19% down). This is of concern particularly in the latter fields where African enrolment washigh.
It is remarkable that whereas in universities, the performance of women is stronger than men, this is reversed inthe technikons. In only three fields: Forestry (+8%), Wildlife (+4%) and Plant Sciences (+1%) did females manageto increase their share of graduations over their enrolments.
N1883666
139510
6875318211691315412
25513655684
00
Female585042413939363534312511--
Male425058596161646566697589--
Table 10: Share of technikon enrolments in Agriculture and RenewableNatural Resources by gender and ranked by 2nd order CESMCategory or Study field from 2000 to 2003 (%)
Gender share %
0110 Outdoor Recreation0102 Agricultural Extension0101 Agricultural Economics0108 Fisheries0104 Animal Sciences0105 Horticulture0111 Wildlife0113 Renewable Natural Resources0107 Soil Sciences0106 Plant Sciences0199 Other Ag. and Renewable Resources0109 Forestry0103 Agricultural Food Technology0112 Land Reclamation
Total2nd order CESM Category or Study field
N827106145373149268265227167188
?200
African706966574840343226241411--
Coloured1041331161000--
Table 11: Share of Technikon graduates in Agriculture and Renewable Natural Resourcesby race and ranked by 2nd order CESM Category or Study field from 2000 to 2003 (%)
Gender share %
0104 Animal Sciences0102 Agricultural Extension0101 Agricultural Economics0199 Other Ag. and Renewable Resources0109 Forestry0106 Plant Sciences0105 Horticulture0113 Renewable Natural Resources0110 Outdoor Recreation0111 Wildlife0107 Soil Sciences0108 Fisheries0103 Agricultural Food Technology0112 Land Reclamation
Total2nd order CESM Category or Study field
Indian001010202000--
White293129414956546371768689--

C M Y CM MY CY CMY K
85
4.3 Analysis by agricultural study field
The data summarized above will now be presented and analysed by study field, according to the Classification ofEducation Subject Matter (CESM) categories given by the Department of Education (ie: each 2nd Order CESMCategory is taken as a ‘study field’).
Three difficulties present themselves for this analysis. First, the short time-series over which the data is availablemakes long term trends difficult to discern. It will be useful to track the data in the longer term to confirm the trendsthat are apparent in this series. Second, it is important to bear in mind that where enrolment and/or graduationnumbers are small, when these numbers are converted to percentages they are not analytically useful. Third, thetables showing throughput rates are most difficult to ‘read’ in a straightforward way because changes in throughputcan fluctuate dramatically from year to year.
In order to take these difficulties into account, in each table, enrolment, graduates and throughput data over theperiod 2000 to 2003 are averaged. The analysis will mainly refer to these averages, which present a more stableand reliable picture of race and gender access.
4.3.1 Agricultural Economics
N1883666
139510
6875318211691315412
25513655684
00
Female585042413939363534312511--
Male425058596161646566697589--
Table 10: Share of technikon enrolments in Agriculture and RenewableNatural Resources by gender and ranked by 2nd order CESMCategory or Study field from 2000 to 2003 (%)
Gender share %
0110 Outdoor Recreation0102 Agricultural Extension0101 Agricultural Economics0108 Fisheries0104 Animal Sciences0105 Horticulture0111 Wildlife0113 Renewable Natural Resources0107 Soil Sciences0106 Plant Sciences0199 Other Ag. and Renewable Resources0109 Forestry0103 Agricultural Food Technology0112 Land Reclamation
Total2nd order CESM Category or Study field
Agricultural AppraisalAgricultural Credit and financeAgricultural MarketingAgricultural OranisationsAgricultural suppliesEconomic development and international tradeFarm managementPublic policy and AgricultureOther agricultural economics (specify)
0101 Agricultural Economics
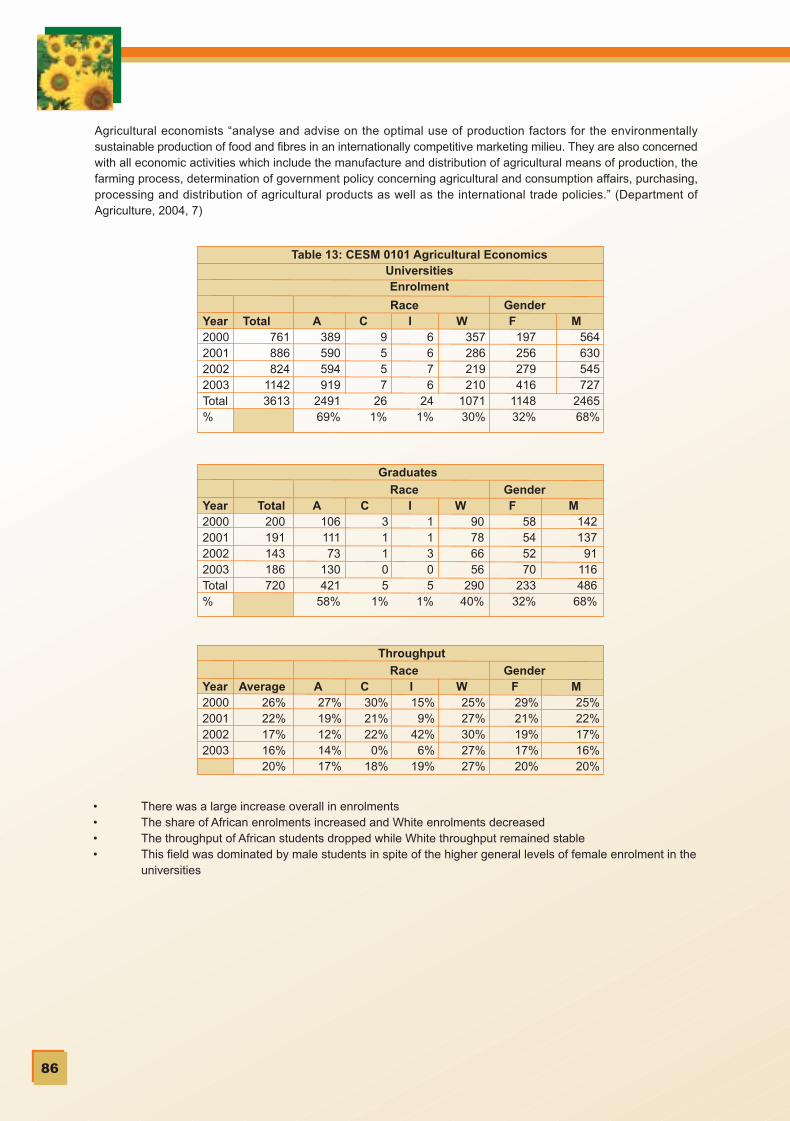
C M Y CM MY CY CMY K
86
Agricultural economists “analyse and advise on the optimal use of production factors for the environmentallysustainable production of food and fibres in an internationally competitive marketing milieu. They are also concernedwith all economic activities which include the manufacture and distribution of agricultural means of production, thefarming process, determination of government policy concerning agricultural and consumption affairs, purchasing,processing and distribution of agricultural products as well as the international trade policies.” (Department ofAgriculture, 2004, 7)
• There was a large increase overall in enrolments• The share of African enrolments increased and White enrolments decreased• The throughput of African students dropped while White throughput remained stable• This field was dominated by male students in spite of the higher general levels of female enrolment in the
universities
Race GenderYear2000200120022003Total%
Total761886824
11423613
A389590594919
249169%
C9557
261%
I6676
241%
W357286219210
107130%
F197256279416
114832%
M564630545727
246568%
Table 13: CESM 0101 Agricultural EconomicsUniversitiesEnrolment
Race GenderYear2000200120022003Total%
Total200191143186720
A10611173
130421
58%
C31105
1%
I11305
1%
W90786656
29040%
F58545270
23332%
M142137
91116486
68%
Graduates
Race GenderYear2000200120022003
Average26%22%17%16%20%
A27%19%12%14%17%
C30%21%22%
0%18%
I15%
9%42%
6%19%
W25%27%30%27%27%
F29%21%19%17%20%
M25%22%17%16%20%
Throughput

C M Y CM MY CY CMY K
87
• Agricultural economics enrolments are larger in the universities• African proportions in this field in technikons are marginally higher than in universities• The African share of graduates is slightly lower than the share of enrolment
Race GenderYear2000200120022003Total%
Total199488314394
1395
A173375208244
100072%
C2
14121543
3%
I21115
0%
W229992
133346
25%
F88
204126162581
42%
M111284188231814
58%
Table 14: CESM 0101 Agricultural EconomicsTechnikonsEnrolment
Race GenderYear2000200120022003Total%
Total37263745
145
A10632
21271696
66%
C00235
4%
I10102
1%
W457
2642
29%
F13
7131749
34%
M2419252896
66%
Graduates
Race GenderYear2000200120022003
Average18%
5%12%11%10%
A18%
6%13%
7%10%
C11%0%
17%20%12%
I55%
0%80%
0%39%
W18%
5%8%
20%12%
F15%
3%10%10%
9%
M22%
7%13%12%12%
Throughput

C M Y CM MY CY CMY K
88
Agricultural extension is defined as: “The provision of information to farmers on agricultural production technologiesdesigned to increase production, protect natural resources and the environment, or achieve some other objective”(), or as: “the application of scientific research and new knowledge to agricultural practices through farmer education”(http://en.wikipedia.org/wiki/Agricultural_extension)
98570716
12
Cape TechnikonPretoria TechnikonTechnikon SA Witwatersrand TechnikonUniversities
University of Fort HareUniversity of NatalUniversity of the NorthUniversity of the Free StateUniversity of StellenboschUniversity of ZululandVista UniversityUniversity of TranskeiUniversity of North WestUniversity of Venda
Institution295394646824317
7013
588
410
Enrolments at institutions where Agricultural Economics(0101) was offered between 2000 – 2003:
Institution
Technikons
4.3.2 Agricultural Extension
0102 Agricultural Extension No subfields specified
Race GenderYear2000200120022003Total%
Total891
1323391486
3091
A879
1299275300
275389%
C2325
120%
I1138
130%
W1020
112173314
10%
F420672166220
147848%
M471651226265
161352%
Table 15: CESM 0102 UniversitiesEnrolment
Race
Race GenderYear2000200120022003Total%
Total34507955
219
A30457855
20895%
C10001
0%
I01001
0%
W44119
4%
F10224624
10347%
M24283331
11653%
Graduates

C M Y CM MY CY CMY K
89
• Overall enrolment in this field was unstable which affects throughput rate calculations• African enrolment proportions were high and throughput was positive• White enrolment increased significantly from a small base
• Agricultural extension enrolments at technikons were smaller than at universities• African enrolments dominated but to a slightly lesser extent than universities• African students’ share of graduations was 6% smaller than their share of enrolments
Race GenderYear2000200120022003
Average4%4%
20%11%7%
A3%3%
28%18%
8%
C25%
0%0%0%4%
I0%
43%0%0%4%
W38%19%
1%0%3%
F2%3%
28%11%7%
M5%4%
15%12%
7%
Throughput
Race GenderYear2000200120022003Total%
Total67
155252192666
A29
112197164501
75%
C11306
1%
I00000
0%
W37435228
15924%
F2089
120102330
50%
M4767
13291
33650%
Table 16: CESM 0102 Agricultural ExtensionTechnikonsEnrolment
Race GenderYear2000200120022003Total%
Total14451929
106
A4
34112473
69%
C00000
0%
I00000
0%
W101184
3331%
F5
28131358
55%
M9
177
1648
45%
Graduates
Race GenderYear2000200120022003
Average21%29%
8%15%16%
A14%30%
6%15%15%
C0%
25%0%0%4%
I0%0%0%0%0%
W26%25%16%16%21%
F22%32%11%13%18%
M20%25%
5%17%14%
Throughput

C M Y CM MY CY CMY K
90
The food technologist is “concerned with aspects pertaining to the production, preservation and development ofhigh-quality foods. They also manage processing plants and quality assurance laboratories. They are charged withmonitoring of food-quality standards by government bodies (namely SABS)” (Department of Agriculture, 2004, 21).
81333
71181
Cape TechnikonMangosuthu TechnikonPort Elizabeth TechnikonPretoria Technikon
University of Fort HareUniversity of the NorthUniversity of the Free StateUniversity of PretoriaUniversity of ZululandUniversity of North WestUniversity of Venda
Institution291
5611
7882722
1897
Enrolments at institutions where Agricultural Extension(0102) was offered between 2000 – 2003:
Institution
Technikons
301303308309
Code
Universities
103106107110117120121
Code
Dairy TechnologyFruit TechnologyMeat TechnologyVegetable TechnologyWine TechnologyOther agricultural food technoloy (specify)
0103 Agricultural Food Technology
4.3.3 Agricultural Food Technology
Race GenderYear2000200120022003Total%
Total177183207195761
A74849780
33544%
C3226
142%
I3446
172%
W9693
104103396
52%
F127132150143552
72%
M50515752
21028%
Table 17: CESM 0103 Agricultural Food Technology UniversitiesEnrolment
Race GenderYear2000200120022003Total%
Total50416754
213
A12
8301160
28%
C20035
2%
I30205
2%
W35333541
14367%
F33305144
15774%
M1711171156
26%
Graduates

C M Y CM MY CY CMY K
91
NOTE: The Department of Education HEMIS data showed no students in the Technikons enrolled or graduating inthe study field “CESM 0103 Agricultural Food Technology”
4.3.4 Animal Sciences
Animal scientists are “involved in research and development and give advice to the livestock industry concerningthe production of animals and their products. These scientists focus areas include: animal nutrition, breeding, geneticsand meat science, as well as various production systems with regard to a variety of farm animals.”(Department ofAgriculture, 2004, 14).
Race GenderYear2000200120022003
Average28%22%33%28%28%
A16%
9%31%13%18%
C45%16%
0%49%35%
I83%
0%50%
0%27%
W36%35%34%40%36%
F26%23%34%30%28%
M35%22%30%21%27%
Throughput
• Enrolments were stable but there are disparities in access and achievement between race groups• African enrolment was relatively low with a low success rate as measured in the difference between
enrolment and graduation proportions• The share of graduations among White students was higher than their share of enrolment• Disparities in access and achievement of graduation share suggests that African students need
support
676
430184
66
University of NatalUniversity of the Free StateUniversity of PretoriaUniversity of StellenboschUniversity of Venda
Enrolments at institutions where Agricultural FoodTechnology (0103) was offered between 2000 – 2003:
Institution
Universities
105107110114121
Code
Animal anatomy physioloy and biochemistryAnimal or animal products selection and evaluationAnimal diseases parasites and insectsAnimal genetics and reproductionAnimal health and careAnimal management and productionAnimal nutritionOther animal sciences (specify)
0104 Animal Sciences

C M Y CM MY CY CMY K
92
• This is an important field especially because the overall enrolment is large• Of concern was the fluctuation in African enrolment• African participation was relatively strong – although graduation proportions were slightly under enrolment
rates
Race GenderYear2000200120022003Total%
Total695
12021000
8403737
A360867644509
238064%
C3244
140%
I768
1031
1%
W325327344317
131335%
F307590476393
176647%
M388612524447
197153%
Table 18: CESM 0104 Animal Sciences UniversitiesEnrolment
Race GenderYear2000200120022003Total%
Total185169165229748
A105
9981
162447
60%
C10203
0%
I00134
1%
W00134
1%
F817576
116347
46%
M105
9489
113401
54%
Graduates
Race GenderYear2000200120022003
Average27%14%16%27%20%
A29%11%13%32%19%
C39%
0%39%
0%20%
I0%5%9%
34%14%
W24%21%24%20%22%
F26%13%16%29%20%
M27%15%17%25%20%
Throughput
Race GenderYear2000200120022003Total%
Total13841860167519556875
A979
121011051311460567%
C13292862
1322%
I4574
190%
W389616533579
211731%
F511714674815
271339%
M874
114610011140416161%
Table 19: CESM 0104 Animal SciencesTechnikonsEnrolment

C M Y CM MY CY CMY K
93
• Enrolment of African and White students in Animal Sciences grew between 2000 and 2004• African students constituted just over two thirds of enrolments• The share of graduations among African students was higher than their share of enrolments
Race GenderYear2000200120022003Total%
Total193211118305827
A132142
81226580
70%
C02147
1%
I11002
0%
W61673674
23829%
F656535
127292
35%
M128146
83178535
65%
Graduates
Race GenderYear2000200120022003
Average14%11%7%
16%12%
A13%12%
7%17%13%
C0%5%5%7%5%
I26%20%
0%0%
11%
W16%11%7%
13%11%
F13%
9%5%
16%11%
M15%13%
8%16%13%
Throughput
104189161351935
1290148
231379
157
University of Fort HareUniversity of NatalUniversity of the NorthUniversity of the Free StateUniversity of PretoriaUniversity of South AfricaUniversity of StellenboschUniversity of ZululandVista UniversityUniversity of North WestUniversity of Venda
Institution
Universities
103105106107110113114117118120121
Code
2801118432245
27912003
5
Cape TechnikonMangosuthu TechnikonTechnikon Free StatePort Elizabeth TechnikonPretoria TechnikonTechnikon SAVaal Triangle Technikon
Enrolments at institutions where Animal Science(0104) was offered between 2000 – 2003:
Institution
Technikons
301303306308309310311
Code
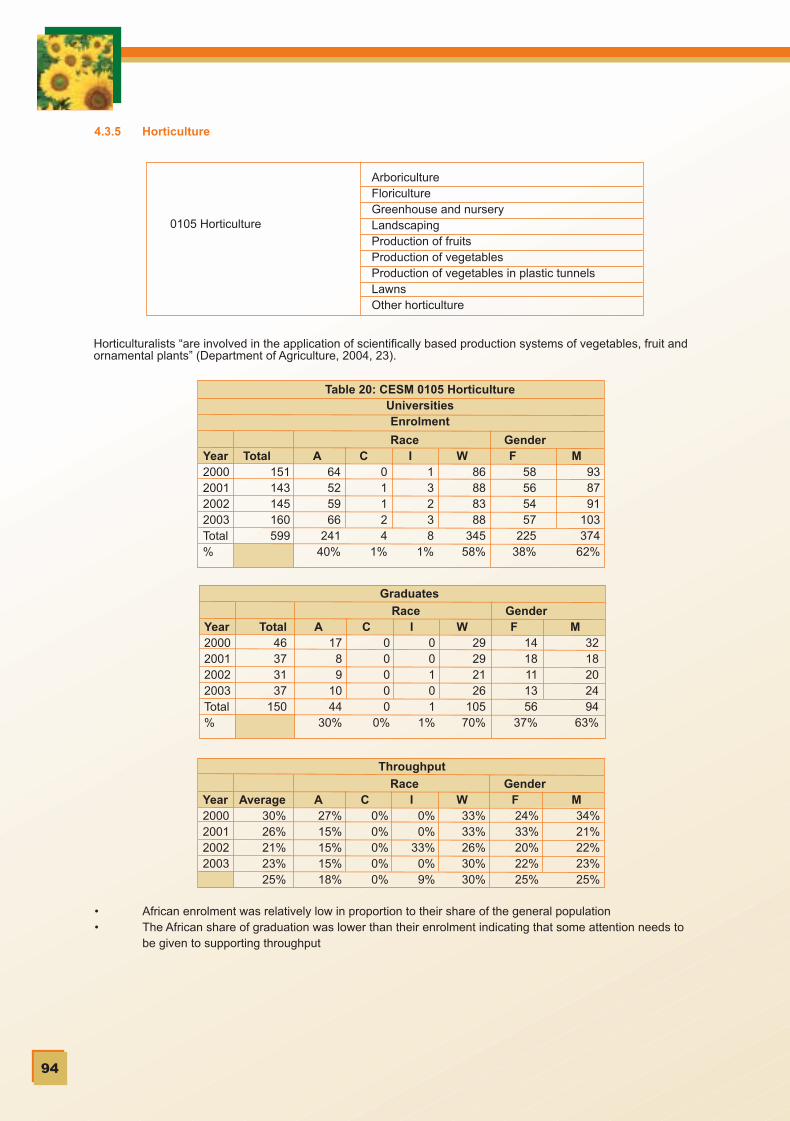
C M Y CM MY CY CMY K
94
4.3.5 Horticulture
Horticulturalists “are involved in the application of scientifically based production systems of vegetables, fruit andornamental plants” (Department of Agriculture, 2004, 23).
• African enrolment was relatively low in proportion to their share of the general population• The African share of graduation was lower than their enrolment indicating that some attention needs to
be given to supporting throughput
ArboricultureFloricultureGreenhouse and nurseryLandscapingProduction of fruitsProduction of vegetablesProduction of vegetables in plastic tunnelsLawnsOther horticulture
0105 Horticulture
Race GenderYear2000200120022003Total%
Total151143145160599
A64525966
24140%
C01124
1%
I13238
1%
W86888388
34558%
F58565457
22538%
M938791
103374
62%
Table 20: CESM 0105 HorticultureUniversitiesEnrolment
Race GenderYear2000200120022003Total%
Total46373137
150
A17
89
1044
30%
C00000
0%
I00101
1%
W29292126
10570%
F1418111356
37%
M3218202494
63%
Graduates
Race GenderYear2000200120022003
Average30%26%21%23%25%
A27%15%15%15%18%
C0%0%0%0%0%
I0%0%
33%0%9%
W33%33%26%30%30%
F24%33%20%22%25%
M34%21%22%23%25%
Throughput
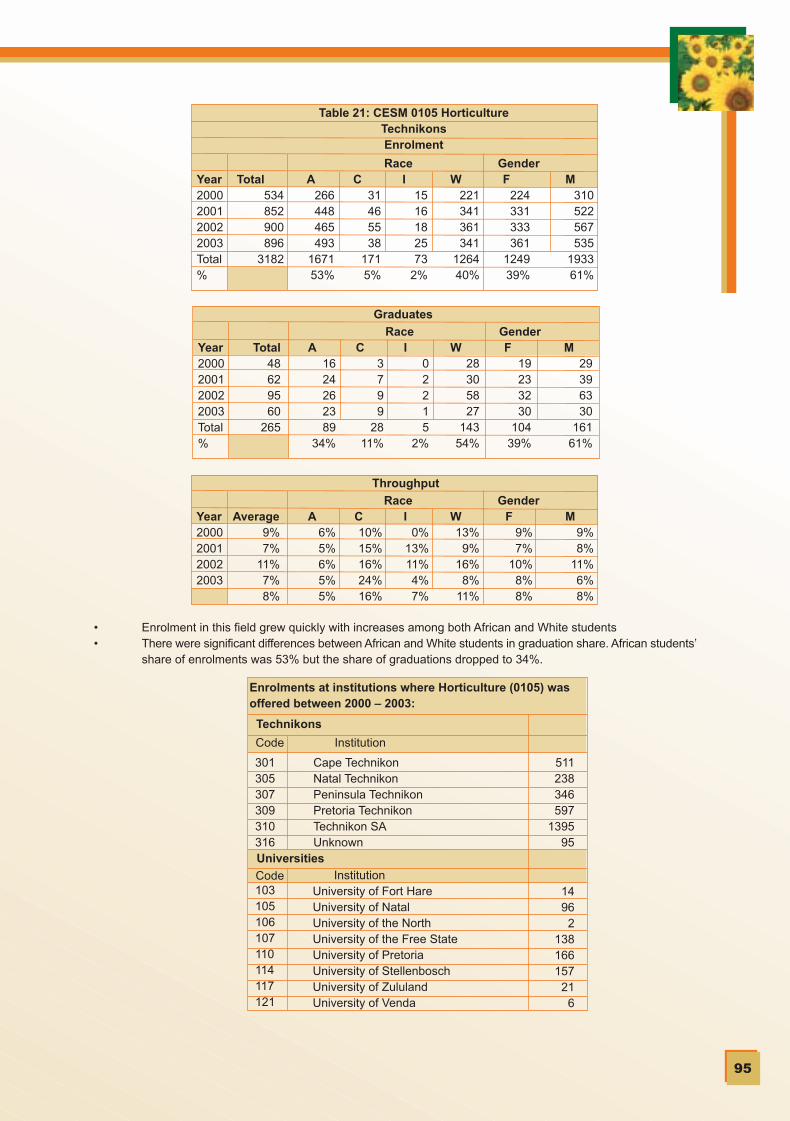
C M Y CM MY CY CMY K
95
• Enrolment in this field grew quickly with increases among both African and White students• There were significant differences between African and White students in graduation share. African students’
share of enrolments was 53% but the share of graduations dropped to 34%.
Race GenderYear2000200120022003Total%
Total534852900896
3182
A266448465493
167153%
C31465538
1715%
I1516182573
2%
W221341361341
126440%
F224331333361
124939%
M310522567535
193361%
Table 21: CESM 0105 HorticultureTechnikonsEnrolment
Race GenderYear2000200120022003Total%
Total48629560
265
A1624262389
34%
C3799
2811%
I02215
2%
W28305827
14354%
F19233230
10439%
M29396330
16161%
Graduates
Race GenderYear2000200120022003
Average9%7%
11%7%8%
A6%5%6%5%5%
C10%15%16%24%16%
I0%
13%11%4%7%
W13%
9%16%
8%11%
F9%7%
10%8%8%
M9%8%
11%6%8%
Throughput
511238346597
139595
Cape TechnikonNatal TechnikonPeninsula TechnikonPretoria TechnikonTechnikon SAUnknown
University of Fort HareUniversity of NatalUniversity of the NorthUniversity of the Free StateUniversity of PretoriaUniversity of StellenboschUniversity of ZululandUniversity of Venda
Institution1496
2138166157
216
Enrolments at institutions where Horticulture (0105) wasoffered between 2000 – 2003:
Institution
Technikons
301305307309310316
Code
Universities
103105106107110114117121
Code

C M Y CM MY CY CMY K
96
Agronomists “are responsible for the successful growing of corn, maize, grain sorghum, groundnuts, sunflower,cotton, sugar cane, potatoes and forage crops. Agronomists must develop and implement production systems withthe aim to have optimal economic production without harm to the environment” (Department of Agriculture, 2004,10).
Plant pathologists “are scientists concerned with the understanding of the dynamic process involved in plant health.Their work is more research orientated” (Department of Agriculture, 2004, 28).
The pasture/grassland scientist “answers questions such as how often, how severe and at what time of the yeargrazing plants should be defoliated, how many animals can be kept on a certain pasture and why it is necessaryto put up fences and make camps” (Department of Agriculture, 2004, 30).
Work in the field of weed science involves “searching for natural enemies of invasive plants in the weed’s countryof origin and studying the natural enemies in quarantine to determine whether they have potential in controlling theinvasive plant, and whether they are host-specific” (Department of Agriculture, 2004,47).
4.3.6 Plant Sciences
Plant anatomy physiology and microbiologyPlant genetics and reproductionPlantPlant insects and plant insect control
Plant management and production
Plant nutritionPlant pathogens and preventionPlant or plant products selection and evaluationWeed controlOther plant sciences (specify)
0106 Plant SciencesProduction of field cropsProduction of pasturesProduction of speciality crops
Race GenderYear2000200120022003Total%
Total641637690648
2616
A367334361338
140054%
C2019191168
3%
I6743
201%
W249277306296
112843%
F257271292262
108341%
M384366398386
153459%
Table 22: CESM 0106 Plant SciencesUniversitiesEnrolment
Race GenderYear2000200120022003Total%
Total201134175180691
A97475185
28041%
C5286
203%
I21316
1%
W9885
11389
38556%
F89628267
30043%
M1127293
114390
57%
Graduates

C M Y CM MY CY CMY K
97
• African enrolments in this field of study show no growth while White enrolments have increased slightly• The graduation rate of African students was 13% lower than their enrolment rate, whereas the graduation
rate of white students was 13% higher than their enrolment rate
• Enrolment of African students in this field grew quickly• There were significant differences between African and White students in graduation share. African students’
share of enrolments was 62% but the share of graduations was 40%.• The conversion rate of African students requires support
Race GenderYear2000200120022003
Average31%21%25%28%26%
A26%14%14%25%20%
C27%
8%40%51%29%
I25%11%76%21%29%
W39%31%37%30%34%
F35%23%28%25%28%
M29%20%23%29%25%
Throughput
Race GenderYear2000200120022003Total%
Total487458807799
2551
A251303514512
158062%
C1717172273
3%
I32116
0%
W217137274265892
35%
F163135258234791
31%
M323324549564
176169%
Table 23: CESM 0106 Plant SciencesTechnikonsEnrolment
Race GenderYear2000200120022003Total%
Total615249
106268
A24141160
10840%
C23138
3%
I01001
0%
W35353743
15056%
F1515124385
32%
M46373763
18368%
Graduates
Race GenderYear2000200120022003
Average13%11%6%
13%10%
A10%
5%2%
12%7%
C10%15%
8%13%12%
I0%
67%0%0%
17%
W16%25%14%16%17%
F9%
11%5%
18%11%
M14%12%
7%11%10%
Throughput

C M Y CM MY CY CMY K
98
195231180331507640107385
41
University of Fort HareUniversity of NatalUniversity of the NorthUniversity of the Free StateUniversity of PretoriaUniversity of StellenboschUniversity of ZululandUniversity of North WestUniversity of Venda
Institution
Universities
103105106107110114117120121
Code
446917439
305913658
26
Cape TechnikonMangosuthu TechnikonTechnikon Free StatePeninsula TechnikonPort Elizabeth TechnikonPretoria TechnikonTechnikon SAVaal Triangle Technikon
Enrolments at institutions where Plant Sciences(0106) was offered between 2000 – 2003:
Institution
Technikons
301303306307308309310311
Code
4.3.7 Soil Sciences
Race GenderYear2000200120022003Total%
Total317300317314
1248
A157135160156609
49%
C2334
121%
I2532
111%
W155157151153616
49%
F107
9694
106402
32%
M210205223209846
68%
Table 24: CESM 0107 Soil SciencesUniversitiesEnrolment
Soil CemistrySoil classificationSoil chemistry and land useSoil fertilitySoil PhysicsSoil textureOther soil sciences (specify)
0107 Soil Sciences
Soil scientists specialise “in the development of soil, profile differentiation and morphology. (They are) (a) alsoconcerned with soil fertility, classification and chemistry. The various divisions with focus areas of specialisationcomprise the following: soil survey and analyses; soil physicists and hydrologists; soil chemists and fertility specialistsand soil biologists” (Department of Agriculture, 2004, 32).
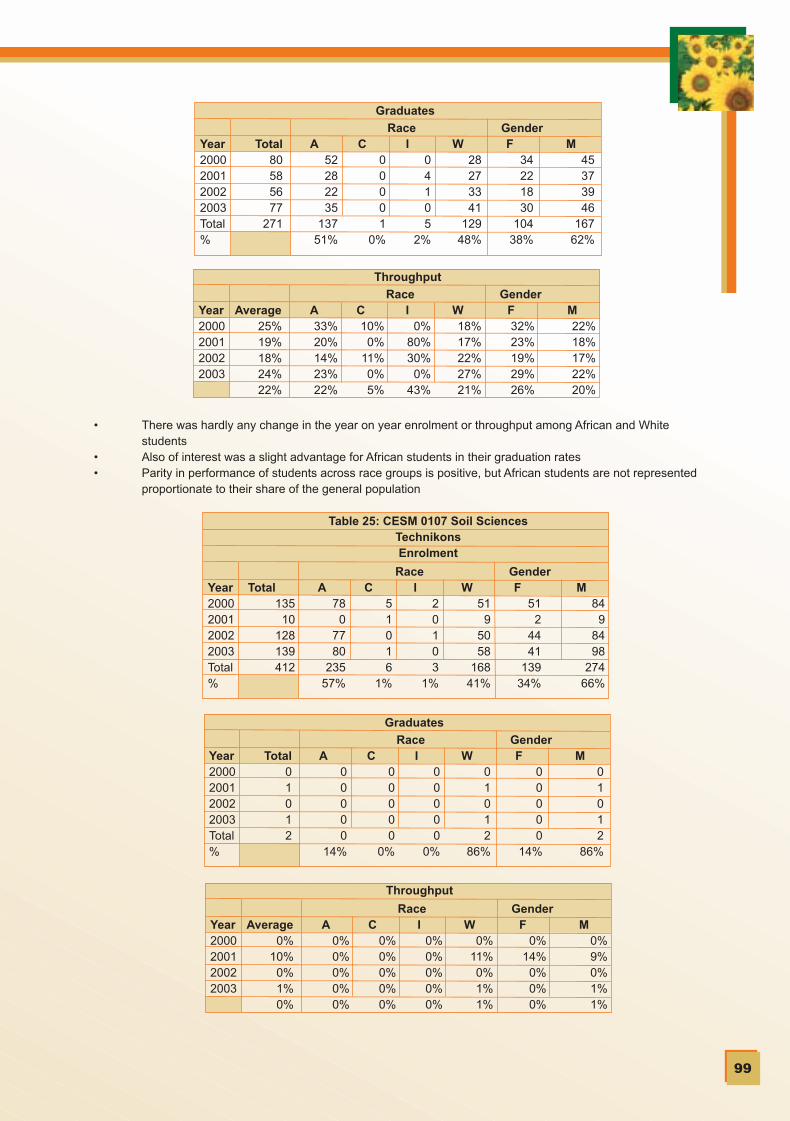
C M Y CM MY CY CMY K
99
• There was hardly any change in the year on year enrolment or throughput among African and White students
• Also of interest was a slight advantage for African students in their graduation rates• Parity in performance of students across race groups is positive, but African students are not represented
proportionate to their share of the general population
Race GenderYear2000200120022003Total%
Total80585677
271
A52282235
13751%
C00001
0%
I04105
2%
W28273341
12948%
F34221830
10438%
M45373946
16762%
Graduates
Race GenderYear2000200120022003
Average25%19%18%24%22%
A33%20%14%23%22%
C10%
0%11%0%5%
I0%
80%30%
0%43%
W18%17%22%27%21%
F32%23%19%29%26%
M22%18%17%22%20%
Throughput
Race GenderYear2000200120022003Total%
Total135
10128139412
A78
07780
23557%
C51016
1%
I20103
1%
W51
95058
16841%
F51
24441
13934%
M84
98498
27466%
Table 25: CESM 0107 Soil SciencesTechnikonsEnrolment
Race GenderYear2000200120022003Total%
Total01012
A00000
14%
C00000
0%
I00000
0%
W01012
86%
F00000
14%
M01012
86%
Graduates
Race GenderYear2000200120022003
Average0%
10%0%1%0%
A0%0%0%0%0%
C0%0%0%0%0%
I0%0%0%0%0%
W0%
11%0%1%1%
F0%
14%0%0%0%
M0%9%0%1%1%
Throughput

C M Y CM MY CY CMY K
100
4.3.8 Fisheries
A fishery is defined as: “an organized effort by humans to catch fish or other aquatic species Generally, a fisheryexists for the purpose of providing human food, although other aims are possible (such as sport or recreationalfishing), or obtaining ornamental fish or fish products such as fish oil. Industrial fisheries are fisheries where thecatch is not intended for direct human consumption” (http://en.wikipedia.org/wiki/Fisheries). The work of fisheriesincludes: using artificial or natural water environments to improve fish stocks through methods such as: breeding,hatching and rearing certain kinds of fish species.(http://www.practicalfishkeeping.co.uk/pfk/pages/glossary.php?entry_name=Fisheries). Aspects of fishery workincludes obtaining and analysing available fish stock information to advise policy on stock levels and strategies formanagement.
• The data for technikon soil science graudates may not be strickly reliable on account of data problems combined with small numbers
• For the above reasons throughput data is also unreliable
Cape TechnikonMangosuthu TechnikonTechnikon Free StatePeninsula TechnikonPretoria TechnikonTechnikon SAVaal Triangle Technikon
University of Fort HareUniversity of NatalUniversity of the NorthUniversity of the Free StateUniversity of PretoriaUniversity of StellenboschUniversity of ZululandVista UniversityUniversity of Venda
Institution176154
55353165265
538
20
Enrolments at institutions where Soil Sciences (0107) wasoffered between 2000 – 2003:
Institution
Technikons
301303306307309310311
Code
Universities
103105106107110114117118121
Code
1712
12265112
4
0108 Fisheries
Fisheries biologyFisheries management Other fisheries (specify)
Commercial fisheriesNon-edible water lifeSport fisheries

C M Y CM MY CY CMY K
101
Race GenderYear2000200120022003Total%
Total00246
A00246
100%
C00000
0%
I00000
0%
W00000
0%
F00134
67%
M00112
33%
Table 26: CESM 0108 FisheriesUniversitiesEnrolment
Race GenderYear2000200120022003Total%
Total000
1010
A00011
5%
C00000
0%
I00000
0%
W00099
95%
F00044
41%
M00066
59%
Table 27: CESM 0108 FisheriesTechnikonsEnrolment
Race GenderYear2000200120022003Total%
Total00022
A00000
11%
C00000
0%
I00000
0%
W00022
89%
F00011
33%
M00022
67%
Graduates
Race GenderYear2000200120022003Total%
Total00044
A00044
100%
C00000
0%
I00000
0%
W00000
0%
F00033
75%
M00011
25%
Graduates
Race GenderYear2000200120022003
Average0%0%0%
100%67%
A0%0%0%
100%67%
C0%0%0%0%0%
I0%0%0%0%0%
W0%0%0%0%0%
F0%0%0%
100%75%
M0%0%0%
100%50%
Throughput
• Fisheries enrolment numbers are very low• Although equity is always an issue, the question is whether the numbers studying in this field is
adequate to the industry needs
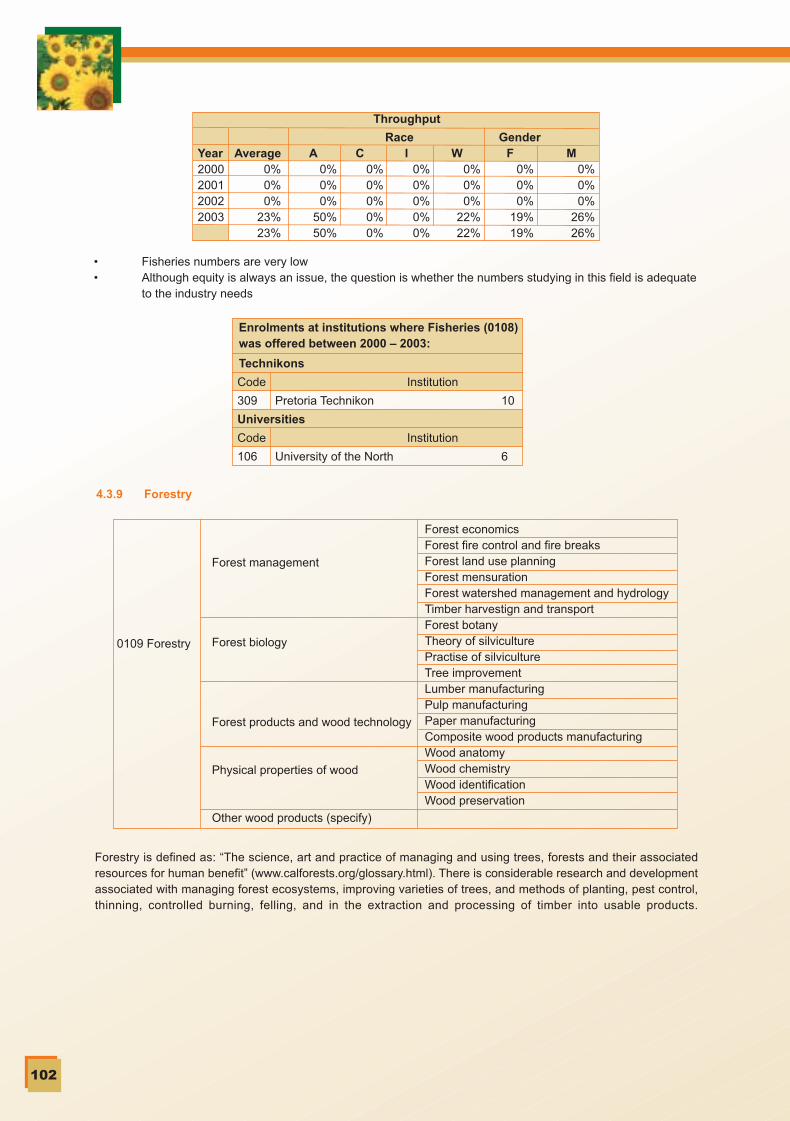
C M Y CM MY CY CMY K
102
4.3.9 Forestry
Forestry is defined as: “The science, art and practice of managing and using trees, forests and their associatedresources for human benefit” (www.calforests.org/glossary.html). There is considerable research and developmentassociated with managing forest ecosystems, improving varieties of trees, and methods of planting, pest control,thinning, controlled burning, felling, and in the extraction and processing of timber into usable products.
Race GenderYear2000200120022003
Average0%0%0%
23%23%
A0%0%0%
50%50%
C0%0%0%0%0%
I0%0%0%0%0%
W0%0%0%
22%22%
F0%0%0%
19%19%
M0%0%0%
26%26%
Throughput
• Fisheries numbers are very low• Although equity is always an issue, the question is whether the numbers studying in this field is adequate
to the industry needs
309 Pretoria Technikon 10
106 University of the North 6
Enrolments at institutions where Fisheries (0108)was offered between 2000 – 2003:
Technikons
Code Institution
Universities
Code Institution
0109 Forestry
Forest management
Forest biology
Forest products and wood technology
Physical properties of wood
Other wood products (specify)
Forest economicsForest fire control and fire breaksForest land use planningForest mensurationForest watershed management and hydrologyTimber harvestign and transportForest botanyTheory of silviculturePractise of silvicultureTree improvementLumber manufacturingPulp manufacturingPaper manufacturingComposite wood products manufacturingWood anatomyWood chemistryWood identificationWood preservation
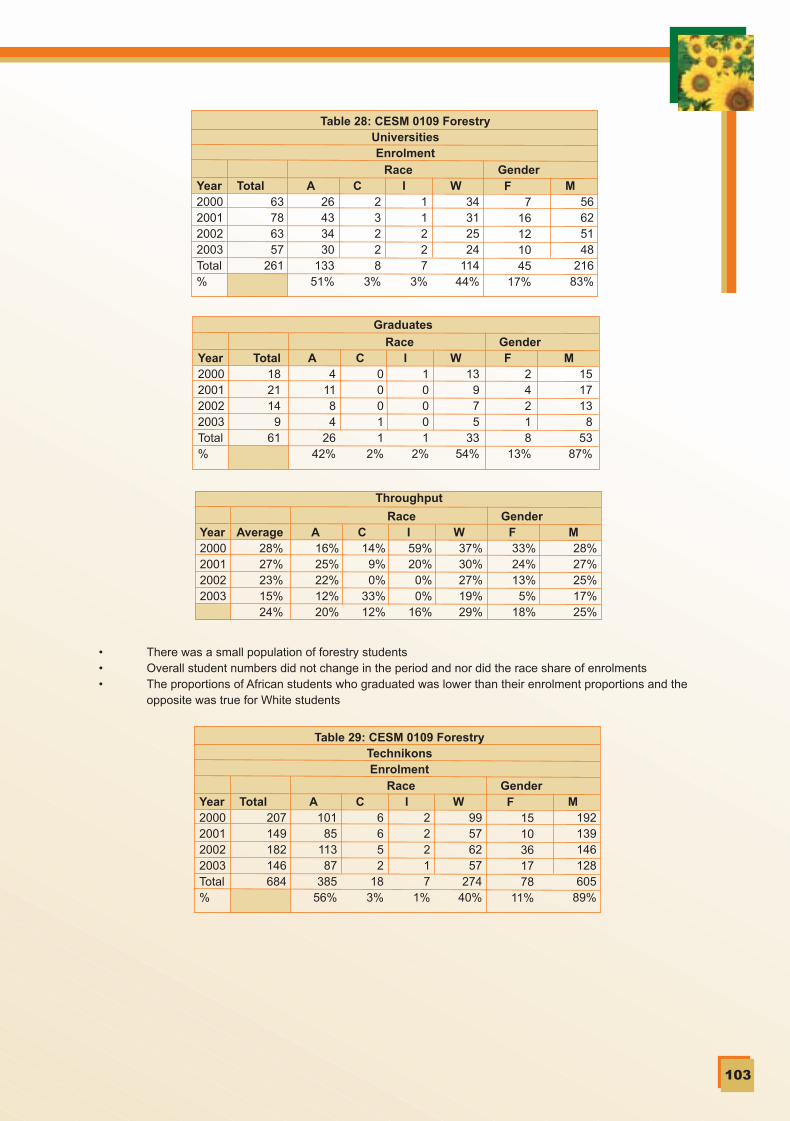
C M Y CM MY CY CMY K
103
• There was a small population of forestry students• Overall student numbers did not change in the period and nor did the race share of enrolments• The proportions of African students who graduated was lower than their enrolment proportions and the
opposite was true for White students
Race GenderYear2000200120022003Total%
Total63786357
261
A26433430
13351%
C23228
3%
I11227
3%
W34312524
11444%
F7
16121045
17%
M56625148
21683%
Table 28: CESM 0109 ForestryUniversitiesEnrolment
Race GenderYear2000200120022003Total%
Total182114
961
A4
1184
2642%
C00011
2%
I10001
2%
W13
975
3354%
F24218
13%
M1517138
5387%
Graduates
Race GenderYear2000200120022003
Average28%27%23%15%24%
A16%25%22%12%20%
C14%
9%0%
33%12%
I59%20%
0%0%
16%
W37%30%27%19%29%
F33%24%13%
5%18%
M28%27%25%17%25%
Throughput
Race GenderYear2000200120022003Total%
Total207149182146684
A101
8511387
38556%
C6652
183%
I22217
1%
W99576257
27440%
F1510361778
11%
M192139146128605
89%
Table 29: CESM 0109 ForestryTechnikonsEnrolment

C M Y CM MY CY CMY K
104
Outdoor recreation studies aim to enable students to become competent and successful recreation managers inthe public or the commercial sector. The recreation industry requires people who can: manage recreational serviceprovision in local government, provide professional services as recreation consultants, facilitate outdoor recreationprogrammes (eg: adventure tourism, corporate teambuilding), and provide guiding services in recreational tourism.To achieve this, expertise in or knowledge of the following is needed: Commercial Recreation Management, Leisureand Tourism, Outdoor Recreation, Sport Didactics and Coaching, Amenity Horticulture, and Community RecreationManagement.
• Enrolment in the field was higher at technikons than in universities• Enrolment was unstable in the period• African students were not as successful as white students in converting their share of enrolments into a
similar share of graduates
Race GenderYear2000200120022003Total%
Total35345625
149
A1414341072
48%
C32004
3%
I00101
1%
W1919201573
49%
F33
222
2919%
M32313423
12081%
Graduates
Race GenderYear2000200120022003
Average17%22%31%17%22%
A13%16%30%12%19%
C45%25%
6%0%
24%
I0%0%
50%0%
15%
W19%33%33%26%26%
F20%25%60%11%37%
M17%22%23%18%20%
Throughput
Enrolments at institutions where Forestry (0109)was offered between 2000 – 2003
Technikons
Code Institution
UniversitiesCode Institution
308 Pretoria Technikon 650310 Technikon SA 32311 Vaal Triangle Technikon 2
105 University of Natal 39114 University of Stellenbosch 214121 University of Venda 8
4.3.10 Outdoor Recreation
0110 Outdoor Recreation No subfields specified
NOTE: The Department of Education HEMIS data showed no students in the Universities enrolled or graduatingin the study field “CESM 0110 Outdoor Recreation”

C M Y CM MY CY CMY K
105
Race GenderYear2000200120022003Total%
Total298474553558
1883
A116256325336
103455%
C7
11131344
2%
I86
141745
2%
W167201201192760
40%
F153269337339
109958%
M145205216219784
42%
Table 30: CESM 0110 Outdoor RecreationTechnikonsEnrolment
Race GenderYear2000200120022003Total%
Total30414155
167
A6
108
1943
26%
C00011
1%
I00404
2%
W24312935
11971%
F9
19233485
51%
M2122182182
49%
Graduates
Race GenderYear2000200120022003
Average10%
9%7%
10%9%
A5%4%2%6%4%
C0%0%0%8%2%
I0%0%
29%0%9%
W14%15%14%18%16%
F6%7%7%
10%8%
M14%11%8%
10%10%
Throughput

C M Y CM MY CY CMY K
106
• The numbers of African students enrolling increased producing a share of 55%• The proportion of African students who graduated was 29% less than the proportion who enrolled• The throughput rate of African students must be supported
302304308309310312316
Northern Gauteng TechnikonM.L. Sultan TechnikonPort Elizabeth TechnikonPretoria TechnikonTechnikon SA Witwatersrand TechnikonUnknown
229
1581
791103
88
Enrolments at institutions where Outdoor Recreation(0110) was offered between 2000 – 2003:
TechnikonsCode Institution
4.3.11 Wildlife
0111 Wildlife Wildlife biologyWildlife managementOther wildlife (specify)
The wildlife subject area deals with wild animals in their natural environment such as wildlife ranching or naturereserves as well as in environments created by humans (eg: zoo enclosures) and deals with management, biology,ecology, scientific and philosophical and ethical issues regarding interaction with wildlife. Coursework may include:animal population dynamics, wildlife management techniques and nutrition, wildlife capture and diseases, rangeevaluation of ecological capacity, wildlife ecology, vegetation classification and dynamics, soil classification andsocial anthropology. In addition, practical aspects of wildlife study include: wildlife counts, age determination, ageand sex ratios, translocation of animals, chemical immobilisation, mechanical capture techniques, transport of wildlife,land-use, predator control and predator-prey studies.
Race GenderYear2000200120022003Total%
Total7796
106106385
A1013171555
14%
C22238
2%
I20002
1%
W64818688
31983%
F27374138
14437%
M50596568
24263%
Table 31: CESM 0111 WildlifeUniversitiesEnrolment
Race GenderYear2000200120022003Total%
Total36424035
154
A4481
1711%
C11103
2%
I20002
1%
W29383133
13286%
F1419211973
47%
M2223201681
53%
Graduates

C M Y CM MY CY CMY K
107
Race GenderYear2000200120022003
Average
47%44%38%33%40%
A39%26%46%
8%30%
C83%55%34%10%40%
I100%
0%0%
100%100%
W46%47%36%38%41%
F52%52%50%50%51%
M44%40%30%24%34%
Throughput
• Enrolments in Wildlife are small and have increased slightly• Access is very skewed towards White students
Race GenderYear2000200120022003Total%
Total375451119224
1169
A121202
2364
41035%
C13004
0%
I11013
0%
W252245
96159752
64%
F135173
4464
41636%
M240278
76160753
64%
Table 32: CESM 0111 WildlifeTechnikonsEnrolment
Race GenderYear2000200120022003Total%
Total5359
076
188
A5
100
3146
24%
C00000
0%
I00000
0%
W4849
045
14276%
F2027
02875
40%
M3332
048
11360%
Graduates
Race GenderYear2000200120022003
Average
14%13%
0%34%16%
A4%5%0%
48%11%
C0%0%0%0%0%
I0%0%0%0%0%
W19%20%
0%28%19%
F15%16%
0%44%18%
M14%12%
0%30%15%
Throughput
• Enrolments in this field were unstable though cumulatively larger in the universities• African students share of enrolment was relatively low and compounded by a low throughput rate

C M Y CM MY CY CMY K
108
201149
22180178
6
Enrolments at institutions where Wildlife(0110) was offered between 2000 – 2003:
TechnikonsCode Institution
Port Elizabeth TechnikonPretoria Technikon
InstitutionUniversity of NatalUniversity of PretoriaUniversity of StellenboschUniversity of Venda
308309Universities
Code105110114121
4.3.12 Land Reclamation
0112 Land Reclamation No subfields specified
Human settlements and population movements have historically affected the landscape. Land has been used formultiple purposes, and converted for different types of land use which has had adverse effect on ecosystems. Thereis constantly increasing pressure on the use of land with the concomitant need to ensure conservation of existingecosystems and for land restoration. Land reclamation and restoration is an important focus of activity for scientists,professionals and practitioners in a range of disciplines, from engineering through archaeology and biology to thesocial sciences.
NOTE: The Department of Education HEMIS data showed no students in the Universities or the Technikons enrolledor graduating in the study field “CESM 0112 Land Reclamation”
0113 Renewable NaturalResources No subfields specified
4.3.13 Renewable Natural Resources
Sustainable utilization of renewable natural resources among communities and the incorporation of nature conservationin development programmes has become more important in developing countries. This may include strategies forprotected area management (PAM) which a society may apply to defend against the loss of renewable resourcesincluding natural heritage and genetic resources. Study in this field emphasises the theory and practice of maintainingbiological diversity ('biodiversity') through conservation biology, the sustainable utilization of renewable naturalresources and the contribution of renewable natural resources to the livelihoods of communal area households.
Race GenderYear2000200120022003Total%
Total2
12205311530
A2
12195278487
92%
C00134
1%
I001
1516
3%
W008
1624
5%
F07
94149249
47%
M2
576111162280
53%
Table 33: CESM 0113 Renewable Natural ResourcesUniversitiesEnrolment

C M Y CM MY CY CMY K
109
Race GenderYear2000200120022003Total%
Total000
2525
A000
2323
91%
C00000
0%
I00000
0%
W00022
9%
F000
1313
52%
M000
1212
48%
Graduates
Race GenderYear2000200120022003
Average
0%0%0%8%5%
A0%0%0%8%5%
C0%0%0%0%0%
I0%0%0%0%0%
W0%0%0%
14%9%
F0%0%0%9%5%
M0%0%0%7%4%
Throughput
• Renewable Natural Resources enrolment increased rapidly in enrolment off a small base• Enrolment was majority African with Indian and White minorities evident

C M Y CM MY CY CMY K
110
• The technikon share of enrolment in this field was higher than that of the universities African students share of enrolmentwas 48% while their share of graduates dropped to 32% which means that throughput was lower than for Whites
Throughput
2000
2001
2002
2003
A C I W F MYear Average
GenderRace
14%
26%
18%
13%
17%
6%
18%
12%
10%
11%
15%
10%
19%
19%
14%
0%
0%
0%
0%
0%
18%
39%
24%
19%
24%
18%
23%
17%
10%
17%
12%
28%
18%
15%
17%
Graduates
2000
2001
2002
2003
Total
%
A C I W F MYear Total
GenderRace
53
72
62
39
227
8
23
22
19
72
32%
5
3
4
2
13
6%
0
0
0
0
0
0%
41
46
37
19
142
63%
19
26
23
11
79
35%
35
47
39
28
148
65%
Enrolment
A C I W F MYear Total
GenderRace
Table 34: CESM 0113 Renewable Natural ResourcesTechnikons
2000
2001
2002
2003
Total
%
389
278
350
298
1315
134
127
179
192
633
48%
30
32
19
8
89
7%
2
0
0
0
2
0%
223
118
152
98
592
45%
106
111
138
110
465
35%
282
167
212
188
850
65%
Enrolments at institutions where Renewable NaturalResources (0113) was offered between 2000 – 2003:
Technikons
Universities
Institution
Institution
Code
301
303
306
308
309
310
311
Cape Technikon
Mangosuthu Technikon
Technikon Free State
Port Elizabeth Technikon
Pretoria Technikon
Technikon SA
Vaal Triangle Technikon
306
323
255
92
223
111
5
Code
105
106
107
115
118
120
University of Natal
University of the North
University of the Free State
University of Western Cape
Vista University
University of North West
7
367
24
47
2
83

C M Y CM MY CY CMY K
111
4.3.14 Other Agricultural and Renewable Natural Resources
0199 Other Ag. andRenewable NaturalResources (Specify)
No subfields specified
Throughput
2000
2001
2002
2003
A C I W F MYear Average
GenderRace
32%
12%
14%
4%
14%
37%
20%
17%
8%
21%
0%
0%
0%
0%
0%
40%
10%
0%
0%
6%
19%
8%
13%
2%
8%
34%
13%
13%
1%
13%
31%
12%
14%
7%
15%
Graduates
2000
2001
2002
2003
Total
%
A C I W F MYear Total
GenderRace
56
25
31
13
124
46
16
14
10
86
70%
0
0
0
0
0
0%
1
1
0
0
2
1%
8
8
17
3
36
29%
23
11
11
1
46
37%
33
14
20
12
78
63%
Enrolment
A C I W F MYear Total
GenderRace
Table 35: CESM 0199 Other Agricultural and Renewable NaturalResources Universities
2000
2001
2002
2003
Total
%
172
200
222
295
890
125
81
85
122
412
46%
1
3
2
3
10
1%
3
5
7
11
25
3%
44
111
128
159
442
50%
67
89
78
122
355
40%
106
112
144
173
535
60%
This category contains a range of study fields which must be separately identified for further analysis

C M Y CM MY CY CMY K
112
Enrolments at institutions where Animal Science(0104) was offered between 2000 – 2003:
Technikons
Code
301
303
306
308
309
310
Universities
Cape Technikon
Mangosuthu Technikon
Technikon Free State
Port Elizabeth Technikon
Pretoria Technikon
Technikon SA
Institution
Institution
8
212
146
286
969
2034
Code
103
105
106
107
110
117
118
121
University of Fort Hare
University of Natal
University of the North
University of the Free State
University of Pretoria
University of Zululand
Vista University
University of Venda
3
135
60
316
298
46
6
27
Throughput
2000
2001
2002
2003
A C I W F MYear Average
GenderRace
10%
13%
6%
12%
10%
8%
10%
5%
13%
9%
4%
35%
4%
2%
5%
0%
8%
0%
3%
2%
14%
24%
10%
14%
15%
7%
6%
6%
16%
9%
11%
16%
7%
11%
11%
Graduates
2000
2001
2002
2003
Total
%
A C I W F MYear Total
108
91
54
120
373
GenderRace
55
49
27
83
214
57%
1
2
2
1
6
1%
0
1
0
1
2
0%
53
40
24
35
151
41%
26
11
9
34
80
21%
82
81
45
86
293
79%
Enrolment
A C I W F MYear Total
GenderRace
Table 36: CESM 0199 Other Agricultural and Renewable NaturalResources Technikons
2000
2001
2002
2003
Total
%
1120
687
844
1004
3655
726
510
529
664
2429
66%
12
6
45
51
114
3%
9
6
26
38
79
2%
373
166
242
251
1032
28%
389
169
155
211
924
25%
730
518
689
793
2730
75%

C M Y CM MY CY CMY K
113
Year
1994
1995
1996
1997
1998
1999
2000
2001
2002
2003
2004
Female
35
35
43
44
39
36
43
50
41
47
55
Male
56
44
52
46
43
42
54
31
39
25
27
%
Female
38.5
44.3
45.3
48.9
47.6
46.2
44.3
61.7
51.3
65.3
67.1
%
Male
61.5
55.7
54.7
51.1
52.4
53.8
55.7
38.3
48.7
34.7
32.9
Table 38: Bachelor of Veterinary Science graduates by gender from1994 to 2003
1994
1995
1996
1997
1998
1999
2000
2001
2002
2003
Total
%
African
1
1
1
3
0.7
Coloured
1
1
1
3
6
0.7
Indian
1
4
2
5
7
19
2.2
White
91
79
94
90
81
78
91
77
72
64
817
96.7
Total
91
79
95
90
82
78
97
81
80
72
845
100
Table 37: Bachelor of Veterinary Science graduates by racefrom 1994 to 2003
4.3.15 Veterinary Science
Veterinary Science No subfields specified
Veterinarians “provide services to farmers, pet owners, breeders, animal welfare organisations, game reserves zoos, etc. At government level they are involved in regulatory services, ie: diagnostic services, control of diseases,prevention of disease introduction into the country and eradication of diseases. They are also concerned with smalland large animal practice and the conducting of research” (Department of Agriculture, 2004, 36).
The degree of Bachelor of Veterinary Science is now offered only at the University of Pretoria’s Faculty of VeterinaryScience. The number of people graduating with the BVSc degree has not increased largely because the facultydoes not have sufficient laboratory and other infrastructure to offer this programme to a larger group.
• The annual number of veterinarians graduating each year has declined since 2000 which is worrying giventhe shortage of these professionals
• The group of students graduating with this degree is still overwhelmingly White. This is slowly beginning to change only over the last four years
There is an evident decline in the proportion of white males who are graduating with a BVSc. Clearly, White femalesare the dominant group enrolling and graduating for this qualification
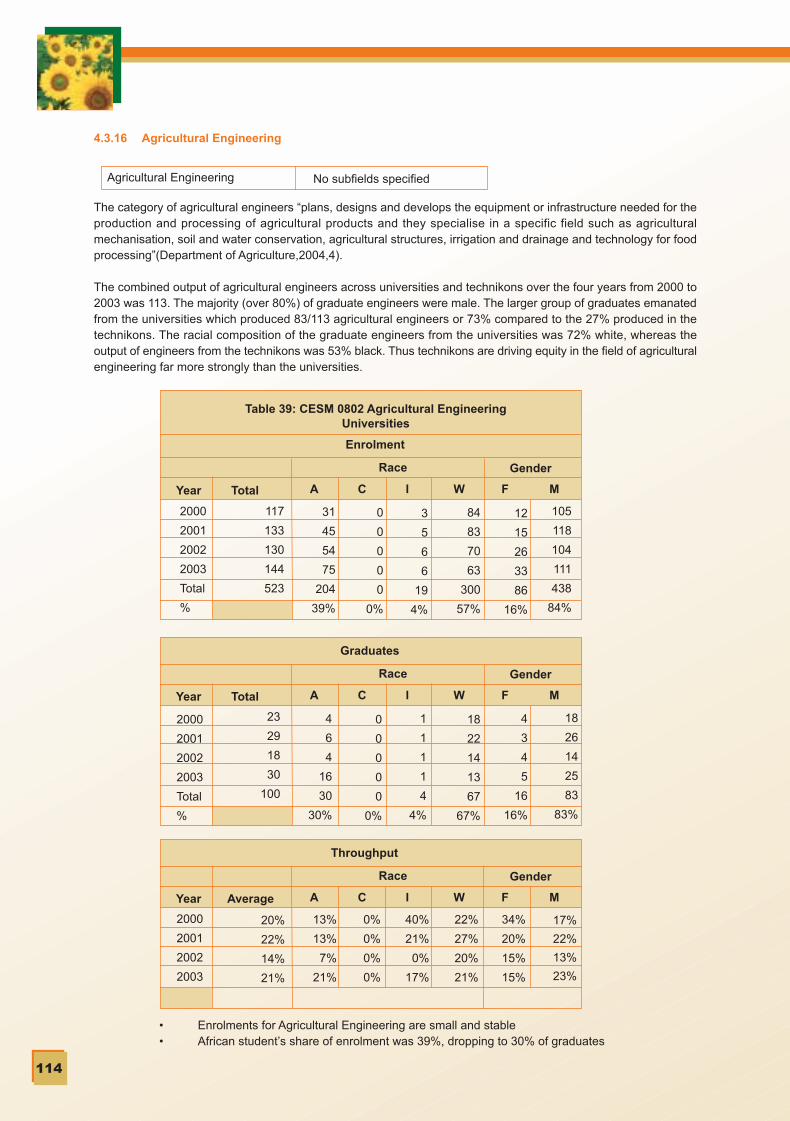
C M Y CM MY CY CMY K
114
4.3.16 Agricultural Engineering
Agricultural Engineering No subfields specified
The category of agricultural engineers “plans, designs and develops the equipment or infrastructure needed for theproduction and processing of agricultural products and they specialise in a specific field such as agriculturalmechanisation, soil and water conservation, agricultural structures, irrigation and drainage and technology for foodprocessing”(Department of Agriculture,2004,4).
The combined output of agricultural engineers across universities and technikons over the four years from 2000 to2003 was 113. The majority (over 80%) of graduate engineers were male. The larger group of graduates emanatedfrom the universities which produced 83/113 agricultural engineers or 73% compared to the 27% produced in thetechnikons. The racial composition of the graduate engineers from the universities was 72% white, whereas theoutput of engineers from the technikons was 53% black. Thus technikons are driving equity in the field of agriculturalengineering far more strongly than the universities.
Throughput
A C I W F MYear Average
GenderRace
2000
2001
2002
2003
20%
22%
14%
21%
13%
13%
7%
21%
0%
0%
0%
0%
40%
21%
0%
17%
22%
27%
20%
21%
34%
20%
15%
15%
17%
22%
13%
23%
Graduates
A C I W F MYear Total
GenderRace
2000
2001
2002
2003
Total
%
23
29
18
30
100
4
6
4
16
30
30%
0
0
0
0
0
0%
1
1
1
1
4
4%
18
22
14
13
67
67%
4
3
4
5
16
16%
18
26
14
25
83
83%
Enrolment
A C I W F MYear Total
GenderRace
Table 39: CESM 0802 Agricultural EngineeringUniversities
117
133
130
144
523
2000
2001
2002
2003
Total
%
31
45
54
75
204
39%
0
0
0
0
0
0%
3
5
6
6
19
4%
84
83
70
63
300
57%
12
15
26
33
86
16%
105
118
104
111
438
84%
• Enrolments for Agricultural Engineering are small and stable• African student’s share of enrolment was 39%, dropping to 30% of graduates

C M Y CM MY CY CMY K
115
Throughput
2000
2001
2002
2003
A C I W F MYear Average
38%
20%
18%
32%
15%
12%
133%
0%
0%
200%
0%
67%
26%
31%
40%
0%
13%
14%
38%
22%
21%
GenderRace
Graduates
2000
2001
2002
2003
Total
%
A C I W F MYear Total
0
6
11
8
25
0
1
6
4
11
44%
0
1
0
0
1
4%
GenderRace
0
1
1
1
3
12%
0
3
4
3
10
40%
0
0
2
2
4
16%
0
6
9
6
21
84%
Enrolment
2000
2001
2002
2003
Total
%
A C I W F MYear Total
GenderRace
CESM 0802 Agricultural Engineering Technikons
36
16
56
43
151
24
3
40
34
102
67%
2
1
3
0
6
4%
0
1
0
2
2
1%
9
12
13
8
42
28%
8
0
16
14
38
25%
28
16
40
29
113
75%
• Technikons have a far smaller enrolment than universities• In contrast to the universities African student share of enrolment is two thirds in relation to one third
White students• Of concern is that 44% of African students graduated which is 23% lower than enrolments, whereas
White student’s share of graduations increased• This suggests that access to this programme is available to African students but attention to supporting
African students is needed
Table 40: Agricultural Engineering graduation trend by level of qualification at universities
First Degree
Post Graduate Diploma
Honours Degree
Masters Degree
Doctoral Degree
Total
1992
11
0
6
3
0
20
1993
8
0
6
0
0
14
1994
7
0
2
0
0
9
1995
18
0
4
3
1
26
1996
15
0
2
1
0
18
1997
15
0
0
2
1
18
1998
11
0
2
3
1
17
1999
5
0
6
5
0
16
2000
11
0
0
3
0
14
2001
8
0
2
4
0
14
Total
109
0
30
24
3
166

C M Y CM MY CY CMY K
116
• The number of agricultural engineers graduating with first degrees has remained consistently low between 1992 and 2004
• There is no discernable increase in the number of post-graduate agricultural engineering degrees
Institutions where Agricultural Engineering was offeredfrom 2000 – 2003:
Technikons
Code
306
308
309
312
Universities
Code
107
108
110
116
Technikon Free State
Port Elizabeth Technikon
Pretoria Technikon
Technikon Witwatersrand
Institution
Institution
University of the Free State
University of Port Elizabeth
University of Pretoria
University of Witwatersrand
-
-
-
-
-
-
-
-
4.4 Summary
This chapter has shown that there are clear gender and race differentials in the extent to which enrolment, graduationsand throughput are distributed. The data provided here reveals patterns that occur between institutions and, asimportantly, between different study fields. However, the data in itself does not provide sufficient information as tothe full background and causes of the differential patterns of access and of achievement. Further analysis needsto be undertaken to address the situation.
4.5 References
Department of Agriculture (2004) Careers in Agriculture Pretoria, Department of Agriculture.Accessed at: http//www.nda.agric.za/docs/ET/ET.htmDate accessed: 10 August 2005
South African Qualifications Authority (2004) Trends in Public Higher Education in South Africa 1992 – 2001 Analysisof the National Learner Records Database Report 1 Pretoria, SAQA.
C M Y CM MY CY CMY K
C M Y CM MY CY CMY K

C M Y CM MY CY CMY K
119
CHAPTER 5
The influence of admissions policy and costs on access to agricultural educationprogrammes in higher and further education
5.1 Introduction
Providing access to education in South Africa is a challenge for government, business and the society at large. It
is important to create the conditions in which young people who qualify to enroll for study beyond the compulsory
education phase (NQF 1 or Grade 9) have the opportunity to do so for two main reasons. First, so that young people
can exercise their ability and interests to develop and fulfill themselves and second, so that they can apply their
skills and contribute to economic and social development.
In the context of globalization, all economies are striving to increase the skills and knowledge base of the labour
force so as to remain competitive. Skills and knowledge are essential in the effort to produce services and products
that will compete on global markets. These pressures are no less strong in the agricultural sector of the South
African economy. In addition, it is important in South Africa to address the need for equity and redress arising out
of the discriminatory history of access to education.
Strydom (2002, 7) writing about higher education points to the following policy imperatives:
• The need for increased academic access to higher education cannot be over emphasised.
• The quality of academic access can be improved if access initiatives are in harmony with notions of equity and redress.
• Increasing participation should ultimately contribute to the social interests, the economic needs, the technological
developments and the overall advancement of the country.
• The issue of student admission and selection is still complicated by the lack of clarity surrounding the criteria
used to admit students in a way that would recognise prior learning and acknowledge other further education
certificates besides matriculation endorsement.
• Language is earmarked as one of the priorities in the academic access debate.
• Student financial aid can help advance the cause of increased participation.
• Academic access for historically disadvantaged learners should not culminate in a revolving door syndrome,
but should be structured to achieve the desired throughput rates.
From the set of wide ranging issues raised above, we can see that there are four main dimensions that influence
whether students can access intermediate and higher education opportunities. The first dimension is based on the
characteristics of the would-be student herself and her household circumstances:
• The financial resources in the household to support her further study
• The quality of her school based academic foundations
• Her access to adequate career guidance and information to facilitate her decision making
• The geographic location of her home and proximity to the institution
• Cultural and language dimensions affecting her choice of course of study and her sense of belonging in the
institution (adapted from: Strydom,2002, 14-16):
The next two dimensions affect student access and are decided by the management and policy makers of the education
institution. These are: institutional policy on admissions, and institutional policy on costs to be levied. The last dimension concerns
the extent to which financial assistance is accessible to would-be students and whether the sources of this financial assistance
are: government; the institution itself; the business sector; or other agencies such as international development and funding
organisations.
The personal and household circumstances and characteristics of students are important in understanding who gets access
to further education opportunities at intermediate and higher education levels. However, this study does not permit an exploration
of the social context in which access to agricultural education is achieved. The aim for this research project is
to focus on the institutional factors affecting student access to intermediate and higher education.
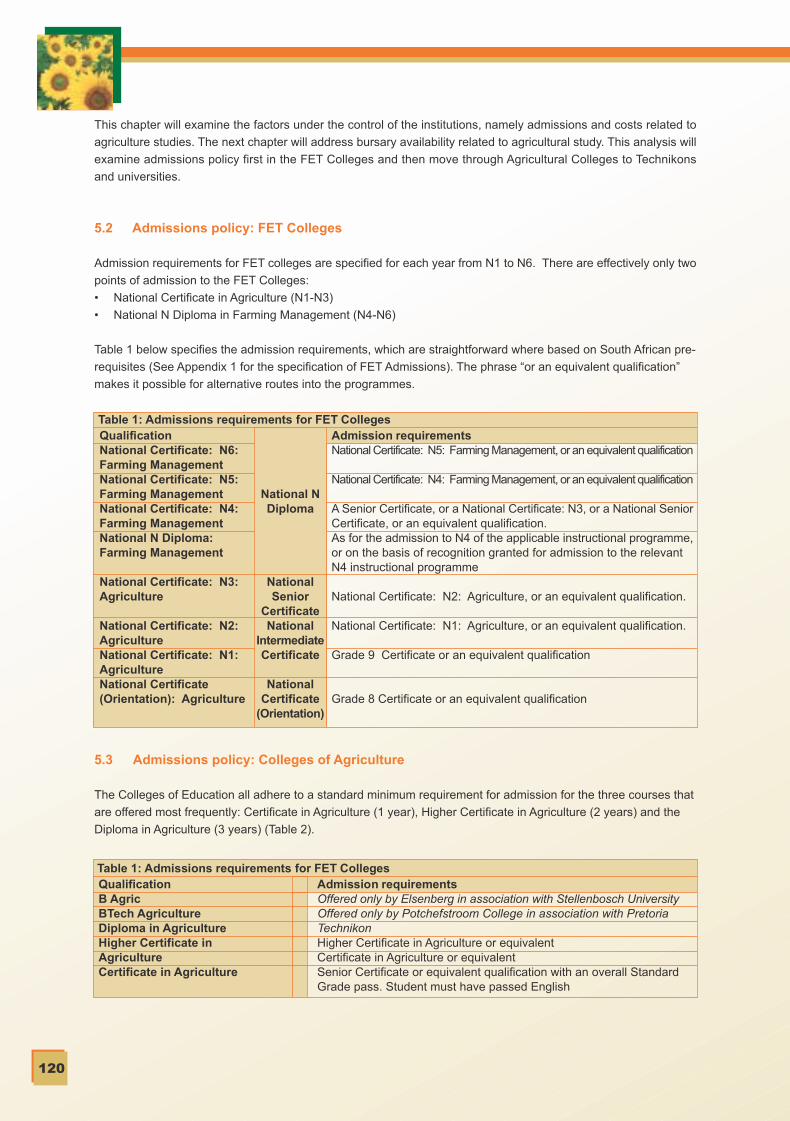
C M Y CM MY CY CMY K
120
This chapter will examine the factors under the control of the institutions, namely admissions and costs related to
agriculture studies. The next chapter will address bursary availability related to agricultural study. This analysis will
examine admissions policy first in the FET Colleges and then move through Agricultural Colleges to Technikons
and universities.
5.2 Admissions policy: FET Colleges
Admission requirements for FET colleges are specified for each year from N1 to N6. There are effectively only two
points of admission to the FET Colleges:
• National Certificate in Agriculture (N1-N3)
• National N Diploma in Farming Management (N4-N6)
Table 1 below specifies the admission requirements, which are straightforward where based on South African pre-
requisites (See Appendix 1 for the specification of FET Admissions). The phrase “or an equivalent qualification”
makes it possible for alternative routes into the programmes.
Table 1: Admissions requirements for FET CollegesQualificationNational Certificate: N6:Farming ManagementNational Certificate: N5:Farming ManagementNational Certificate: N4:Farming ManagementNational N Diploma:Farming Management
National Certificate: N3:Agriculture
National Certificate: N2:AgricultureNational Certificate: N1:AgricultureNational Certificate(Orientation): Agriculture
Admission requirementsNational Certificate: N5: Farming Management, or an equivalent qualification
National Certificate: N4: Farming Management, or an equivalent qualification
A Senior Certificate, or a National Certificate: N3, or a National SeniorCertificate, or an equivalent qualification.As for the admission to N4 of the applicable instructional programme,or on the basis of recognition granted for admission to the relevantN4 instructional programme
National Certificate: N2: Agriculture, or an equivalent qualification.
National Certificate: N1: Agriculture, or an equivalent qualification.
Grade 9 Certificate or an equivalent qualification
Grade 8 Certificate or an equivalent qualification
National NDiploma
NationalSenior
CertificateNational
IntermediateCertificate
NationalCertificate
(Orientation)
5.3 Admissions policy: Colleges of Agriculture
The Colleges of Education all adhere to a standard minimum requirement for admission for the three courses that
are offered most frequently: Certificate in Agriculture (1 year), Higher Certificate in Agriculture (2 years) and the
Diploma in Agriculture (3 years) (Table 2).
Table 1: Admissions requirements for FET CollegesQualificationB AgricBTech AgricultureDiploma in AgricultureHigher Certificate inAgricultureCertificate in Agriculture
Admission requirementsOffered only by Elsenberg in association with Stellenbosch UniversityOffered only by Potchefstroom College in association with PretoriaTechnikonHigher Certificate in Agriculture or equivalentCertificate in Agriculture or equivalentSenior Certificate or equivalent qualification with an overall StandardGrade pass. Student must have passed English

C M Y CM MY CY CMY K
121
In a number of Agricultural Colleges, the minimum entrance requirement is the first step towards admission. There
are several examples of how individual Colleges apply additional criteria. At Cedara it is recommended that students
have a “fair working knowledge” of at least two Grade 12 subjects from: Biology, Physical Science, Mathematics
and Geography (Cedara College). At Lowveld College, it is stated that subjects relevant to agriculture such as
Mathematics, Science, Biology, Geography, and Accountancy “will count in the favour of an applicant”.
Taung College indicated a preference to entrants who had done Agricultural Science as part of their Senior Certificate.
Other Colleges like Glen College emphasis that there is “strict screening” of candidates and that selection is carried
out “solely on academic achievement”. At Grootfontein College a preference is indicated for candidates with higher
education qualifications and/or experience in farming.
In a different way, Cedara College of Agriculture also has a points system in which points are awarded according
to the school subjects passed: English, Mathematics and Physical Science have highest weightings followed by
Biology, Geography, Home Economics and Agricultural Science.
Colleges such as Elsenberg offer extra Mathematics and Science classes in order to support students, which indicate
that Elsenberg is making an effort to assist students to deal with the harder science elements of the curriculum.
This strategy means that admissions policy can be slightly more forgiving on students who do not have a strong
background in the gateway subjects.
Also, in what appears to be a more recent innovation, the Elsenberg College is offering a BAgric in association with
the University of Stellenbosch, and the Potchefstroom College is offering a BTech Agriculture in association with
the Pretoria Technikon. These are examples where some Colleges are collaborating with other higher education
institutions in offering NQF level 6 qualifications.
Overall, it appears that the minimum admission requirements offered by the Colleges are the same across all these
institutions, but there are instances where certain additional criteria are imposed on an ad-hoc basis. The situation
with Technikons and universities is more complex as the following sections will reveal.
5.4 Admissions policy: Technikons
The basis of admissions policy for Technikons was set out in the 2002 document: “Minimum admission requirements
based on South African school, technical and other examinations approved by CTP in November 2002. The core
policy (summarized below) specified that no person should be registered in an instructional programme in a Technikon
unless he/she had:
• “obtained a Senior Certificate” or an equivalent qualification
• provided that “the subjects passed (minimum of 5) in obtaining the Senior Certificate or a certificate contemplated
in the said section of the Act, are subjects passed on the Higher Grade or the Standard Grade or a combination
of subjects on the Higher Grade and the Standard Grade; or that the person has obtained the Senior Certificate
with a minimum of four subjects (which may not include more than two of the official languages) passed on the
Higher Grade or the Standard Grade, and provided further that the remaining subject(s) passed on the Lower
Grade subject shall not be a prerequisite for the proposed instructional programme” and also
• “Provided he/she can prove communicative competence in the particular technikon’s language of instruction…”
This basic specification is extended in a variety of different ways in the Technikons to suit their specific needs and
curriculum structure. This is evident at each of the three different undergraduate qualifications levels offered by
Technikons (Table 3 below).
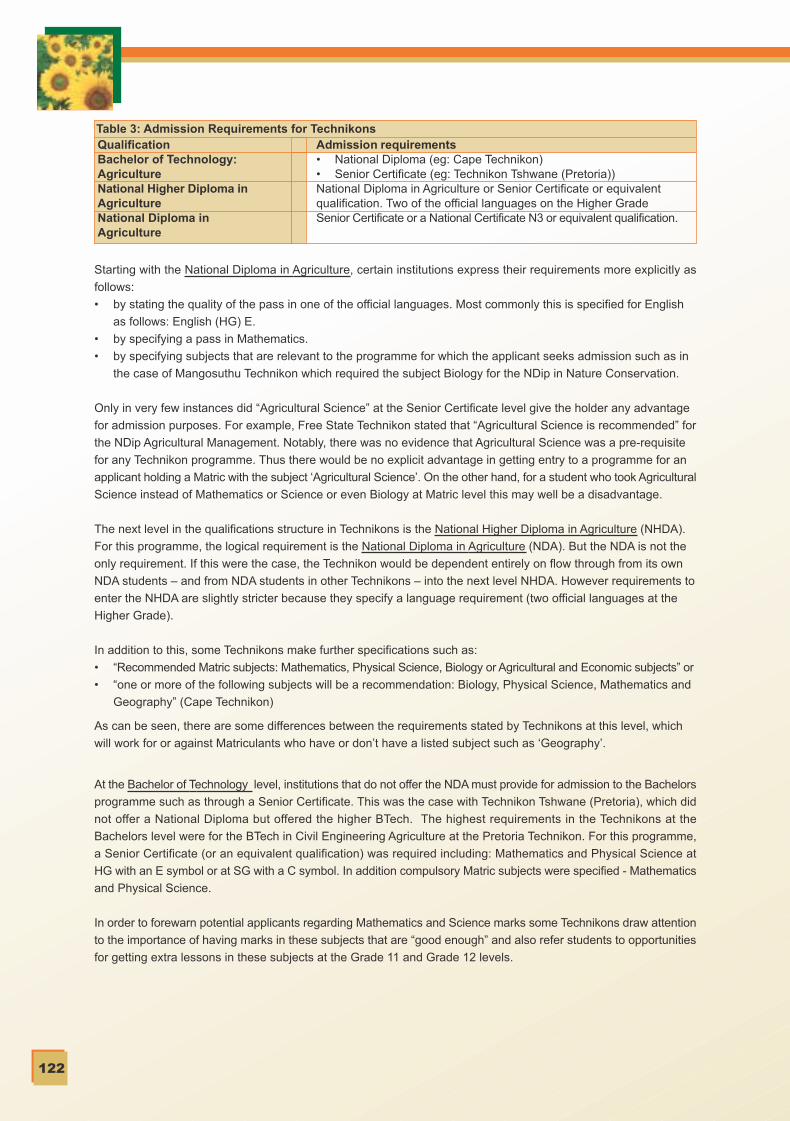
C M Y CM MY CY CMY K
122
Starting with the National Diploma in Agriculture, certain institutions express their requirements more explicitly as
follows:
• by stating the quality of the pass in one of the official languages. Most commonly this is specified for English
as follows: English (HG) E.
• by specifying a pass in Mathematics.
• by specifying subjects that are relevant to the programme for which the applicant seeks admission such as in
the case of Mangosuthu Technikon which required the subject Biology for the NDip in Nature Conservation.
Only in very few instances did “Agricultural Science” at the Senior Certificate level give the holder any advantage
for admission purposes. For example, Free State Technikon stated that “Agricultural Science is recommended” for
the NDip Agricultural Management. Notably, there was no evidence that Agricultural Science was a pre-requisite
for any Technikon programme. Thus there would be no explicit advantage in getting entry to a programme for an
applicant holding a Matric with the subject ‘Agricultural Science’. On the other hand, for a student who took Agricultural
Science instead of Mathematics or Science or even Biology at Matric level this may well be a disadvantage.
The next level in the qualifications structure in Technikons is the National Higher Diploma in Agriculture (NHDA).
For this programme, the logical requirement is the National Diploma in Agriculture (NDA). But the NDA is not the
only requirement. If this were the case, the Technikon would be dependent entirely on flow through from its own
NDA students – and from NDA students in other Technikons – into the next level NHDA. However requirements to
enter the NHDA are slightly stricter because they specify a language requirement (two official languages at the
Higher Grade).
In addition to this, some Technikons make further specifications such as:
• “Recommended Matric subjects: Mathematics, Physical Science, Biology or Agricultural and Economic subjects” or
• “one or more of the following subjects will be a recommendation: Biology, Physical Science, Mathematics and
Geography” (Cape Technikon)
As can be seen, there are some differences between the requirements stated by Technikons at this level, which
will work for or against Matriculants who have or don’t have a listed subject such as ‘Geography’.
At the Bachelor of Technology level, institutions that do not offer the NDA must provide for admission to the Bachelors
programme such as through a Senior Certificate. This was the case with Technikon Tshwane (Pretoria), which did
not offer a National Diploma but offered the higher BTech. The highest requirements in the Technikons at the
Bachelors level were for the BTech in Civil Engineering Agriculture at the Pretoria Technikon. For this programme,
a Senior Certificate (or an equivalent qualification) was required including: Mathematics and Physical Science at
HG with an E symbol or at SG with a C symbol. In addition compulsory Matric subjects were specified - Mathematics
and Physical Science.
In order to forewarn potential applicants regarding Mathematics and Science marks some Technikons draw attention
to the importance of having marks in these subjects that are “good enough” and also refer students to opportunities
for getting extra lessons in these subjects at the Grade 11 and Grade 12 levels.
Table 3: Admission Requirements for TechnikonsQualificationBachelor of Technology:AgricultureNational Higher Diploma inAgricultureNational Diploma inAgriculture
Admission requirements• National Diploma (eg: Cape Technikon)• Senior Certificate (eg: Technikon Tshwane (Pretoria))National Diploma in Agriculture or Senior Certificate or equivalentqualification. Two of the official languages on the Higher GradeSenior Certificate or a National Certificate N3 or equivalent qualification.

C M Y CM MY CY CMY K
123
This survey of the admission requirements for programmes in the Technikons highlighted another dimension of
admissions. In addition to some variation between institutions with respect to their formally stated requirements,
various institutions state that candidates may be subjected to an additional selection process. This is stated variously
as follows:
• “Admission is subject to an evaluation process based on academic potential.”
• “Applicants will be invited to undergo (a) series of tests to determine their potential…”
• “Evaluation: Admission is based on potential tests.”
The documentation is in some instances somewhat vague on the nature of the ‘evaluation process’ and in other
instances it refers to particular tests the nature of which is unstated. It is possible that academic departments only
resort to these forms of selection when the demand for places exceeds supply. Alternatively, these tests may well
be applied for the purposes of screening for quality candidates. There are two important points arising from the
stipulation of additional selection processes over and above the setting of explicit admission criteria. First, the
differences in admission criteria between institutions can be compared if those criteria are publicly stated. But where
tests or other processes are implemented, further differences in the application of admission criteria in the institutions
are hidden from public view. Second, the existence of such additional criteria makes sustained comparison of
admission criteria un-useful in obtaining a full picture.
The overall tendency seems for prerequisites to become gradually more stringent as the programmes become more
senior. But there is no easily identifiable change because of slight variations between institutions.
5.5 Admissions policy: Universities
Admissions policy in agricultural faculties and departments differs (a) between the various Bachelors degree
programmes (eg: between BAgric and BInstAgric) and (b) between departments at different universities offering
the same degree programme. This will become clear as we compare the admission requirements for selected
universities in the following agricultural degree types: BAgric, BScAgric, BAgricAdmin and BInstAgric.
BAgric
Within the group of universities that offer the BAgric programme, all specify the basic Matriculation exemption, but
they differ how they extend their requirements. The University of Venda expects candidates to have a Higher Grade
(HG) pass with an ‘F’ symbol, whereas the University of the Free State states that it will accept any pass in Standard
Grade (SG) Mathematics which represents a lower benchmark. The University of Venda further raises the requirement
by specifying a pass in two other school subjects: Agriculture or Biology.
BAgricUniversity offering degreeUniversity of Venda
University of the Free State
University of Fort Hare
Admission requirementsMatriculation Exemption with Mathematics HG F and a pass inAgriculture or Biology.Senior Certificate with Matriculation Exemption. Maths SG or Dipl Agric(1st year) with certain modules.Senior Certificate with Matriculation Exemption. Contact Universityregarding Faculty requirements.
Duration3 years
3 years
3 years
It is interesting that only at the university level has the subject ‘Agricultural Science’ been specified as a part
requirement – rather than as a recommendation. Also of interest is that the University of the Free State requires
that students can possess a Diploma in Agriculture (with certain modules) as an alternative to the Matriculation
exemption. This means that this agricultural department or faculty sees the opportunity to attract students from other
programmes or institutions – such as Agricultural Colleges - into the BAgric programme. Here we see part of another
programme – in this instance the first year of a Diploma that may be offered in the institution or elsewhere – acting
as a form of bridging course which allows students to enter the BAgric programme if they did not satisfy the
requirements with their senior certificate results.

C M Y CM MY CY CMY K
124
A step up in difficulty is required by the University of Fort Hare, which requires a pass in Mathematics. This is a
requirement with higher difficulty because so few Matriculants have a pass in Mathematics. Presumably the agriculture
faculty at Fort Hare consider mathematics a better predictor of coping skills or success than language, or on the
basis of policy the Faculty do not want to disadvantage any second language English/Afrikaans speaker who will
almost always be African. The next step up is to be found in the qualifications requirements given by the University
of the Free State. Here, the actual grade of the Mathematics pass is specified.
The most stringent admission requirements were stipulated by the University of Venda which not only required a
HG pass with an ‘E’ symbol for both Mathematics and Physical Science. Venda also specified a pass in either
Biology or Agriculture. Thus, in effect this faculty/department placed three layers of requirements viz:
• layer one Mathematics
• layer two Physical Science and
• layer three (Biology or Agriculture)
We conclude the discussion of requirements at the BScAgric programme level by pointing out that the University
of the Free State includes the completion of the first year in another course (BAgric) as part of its requirements for
BScAgric first year. This is another instance where that faculty or department has made it possible for a student
who, based on his/her Senior Certificate results, could not go straight into the BScAgric programme, to have a
second chance by converting after completing the first year of another course that had a lower entry requirement.
BAgricAdmin
From the examples of admission requirements given for BAgricAdmin, three observations can be made. First,
admission requirements differ, with Stellenbosch indicating an additional requirement in the form of a mimimun
aggregate of 50%. Second, Stellenbosch provides a more detailed specification that enables a student without
Physical Science but with Biology to qualify. Third, Stellenbosch put in place particular requirement for a specialist
programme (Viticulture) within the BAgricAdmin degree.
BSc AgricUniversity offering degreeUniversity of Venda
University of the Free State
University of PretoriaUniversity of Fort Hare
Admission requirementsMatriculation Exemption with HG E in Mathematics and PhysicalScience and a pass in either Biology or Agriculture.Senior Certificate with Matriculation Exemption. Maths HG or SG Eor BAgric (1st year) 60%.Matriculation Exemption with Afr or Eng HG 50%Senior Certificate with Matriculation Exemption. Pass in Matric Maths.
Duration4 years
4 years
4 years4 years
BScAgric
Requirements for admission to BScAgric programmes in four universities seem to show quite wide variation beyond
the basic Matriculation exemption. The agriculture faculty or department at the University of Pretoria requires a 50%
pass in the Afrikaans or English languages. This suggests that academics are chiefly concerned with ensuring basic
language skills to cope with the programme. As such the University of Pretoria requirements are the most modest
of this group.
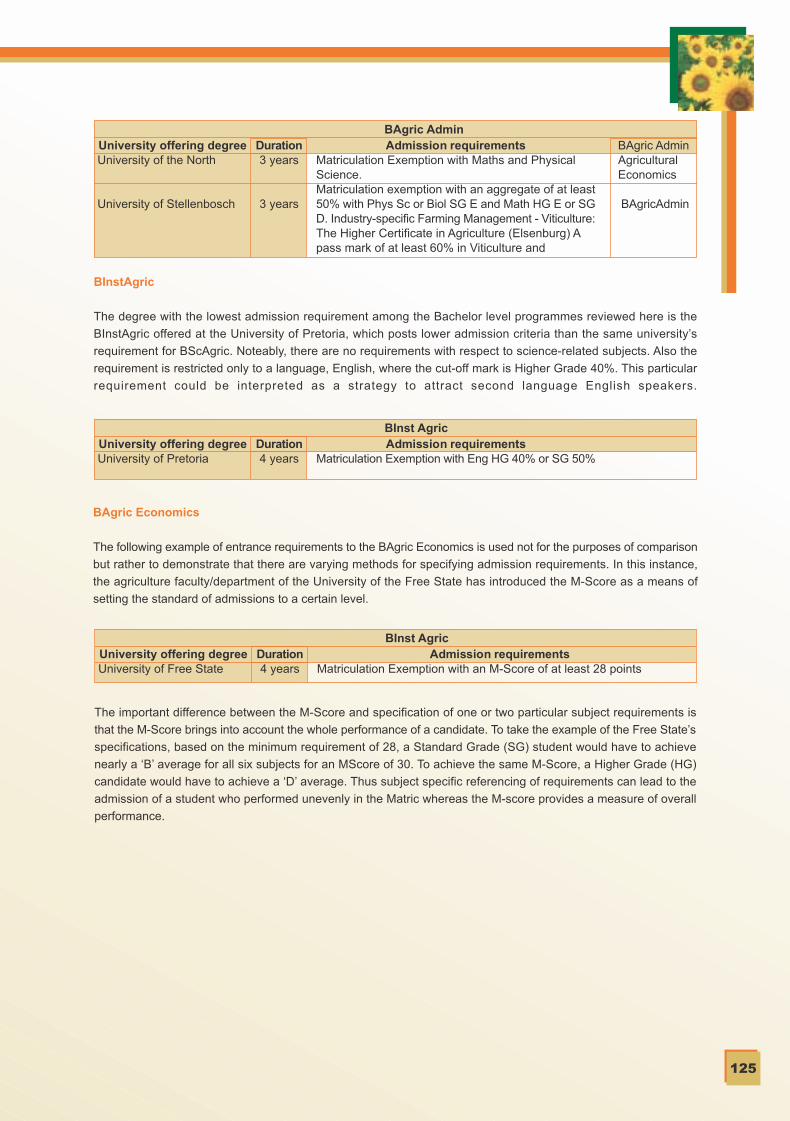
C M Y CM MY CY CMY K
125
BAgric AdminUniversity offering degreeUniversity of the North
University of Stellenbosch
Admission requirementsMatriculation Exemption with Maths and PhysicalScience.Matriculation exemption with an aggregate of at least50% with Phys Sc or Biol SG E and Math HG E or SGD. Industry-specific Farming Management - Viticulture:The Higher Certificate in Agriculture (Elsenburg) Apass mark of at least 60% in Viticulture and
Duration3 years
3 years
BAgric AdminAgriculturalEconomics
BAgricAdmin
BInst AgricUniversity offering degreeUniversity of Pretoria
Admission requirementsMatriculation Exemption with Eng HG 40% or SG 50%
Duration4 years
BInstAgric
The degree with the lowest admission requirement among the Bachelor level programmes reviewed here is the
BInstAgric offered at the University of Pretoria, which posts lower admission criteria than the same university’s
requirement for BScAgric. Noteably, there are no requirements with respect to science-related subjects. Also the
requirement is restricted only to a language, English, where the cut-off mark is Higher Grade 40%. This particular
requirement could be interpreted as a strategy to attract second language English speakers.
BAgric Economics
The following example of entrance requirements to the BAgric Economics is used not for the purposes of comparison
but rather to demonstrate that there are varying methods for specifying admission requirements. In this instance,
the agriculture faculty/department of the University of the Free State has introduced the M-Score as a means of
setting the standard of admissions to a certain level.
BInst AgricUniversity offering degreeUniversity of Free State
Admission requirementsMatriculation Exemption with an M-Score of at least 28 points
Duration4 years
The important difference between the M-Score and specification of one or two particular subject requirements is
that the M-Score brings into account the whole performance of a candidate. To take the example of the Free State’s
specifications, based on the minimum requirement of 28, a Standard Grade (SG) student would have to achieve
nearly a ‘B’ average for all six subjects for an MScore of 30. To achieve the same M-Score, a Higher Grade (HG)
candidate would have to achieve a ‘D’ average. Thus subject specific referencing of requirements can lead to the
admission of a student who performed unevenly in the Matric whereas the M-score provides a measure of overall
performance.

C M Y CM MY CY CMY K
126
M-Scores Calculation
M-Scores are calculated in terms of the table below. This is based on the symbol obtained in Grade 12. The
symbol for each subject (by grade) is converted into a score. These scores are added up for each subject. For
example a student who gets an ‘A’ symbol in Higher Grade for a subject earns 8 points
For each of a candidate's official languages - which have to include either English or Afrikaans - a bonus point
may be added, on condition that the languages have been passed with a D symbol on HG.
This is also known as the “Swedish Scale” points rating system.
Symbol
Higher Grade points
Standard Grade points
A
8
6
B
7
5
C
6
4
D
5
3
E
4
2
F
3
1
FF
2
0
G
0
0
Summary: Admissions policy analysis
Admission requirements are set by an education institution in accordance with the level of difficulty of a programme
of learning in order to ensure that candidates possess the required skills and capacity to complete the prospective
course of study.
Admission requirements for FET colleges are specified for each year from N1 to N6, and are uniformly applied in
all of these institutions. In the Agricultural Colleges, uniform minimum entrance requirements are stated, but there
are several Colleges that apply additional criteria (eg: senior certificate subjects relevant to agriculture).
In general, admissions policy at the institutions:
• is more stringent as qualifications rise up the NQF levels and increasingly extends beyond common standard
requirements
• is more complex for entry at higher qualifications levels (eg: where institutions apply many different criteria that
become difficult to compare)
Only at the university level was the subject ‘Agricultural Science’ specified explicitly as a part requirement for
admission to programmes. In the Colleges, it was a recommendation rather than a requirement to have Agricultural
Science in Matric. Clearly there is no explicit advantage in getting entry to a programme for an applicant holding a
Matric with the subject ‘Agricultural Science’. Therefore a student who took Agricultural Science instead of Mathematics
or Science or even Biology at Matric level could well be at a disadvantage.
The analysis of admission requirements across the institutions revealed that for programmes which are presented
in almost exactly the same way across institutions, where each programme contains a limited number of courses
and where students have a limited number of options, it should be feasible to compare the effects of admissions
policy on outcomes (eg: FET Colleges programmes). However, in the case of higher education and especially
universities, investigating the impact of admissions criteria across institutions and across programmes is not possible.
This is because in the universities the following conditions apply: each programme (eg: BSc Animal Science) will
offer a different set of courses in each institution, and because there will be a variety of options students can select
individual combinations of courses. This means that degree programmes differ across institutions and even students
taking the same degree will have different emphases. For these reasons, comparison of student achievement is
not strictly comparable unless at a highly aggregated level (eg: type of degree such as BSc or broad field of study
such as animal health).

C M Y CM MY CY CMY K
127
In addition we must take into account admissions criteria that are not comparable. The different institutions each
set different criteria for admission to studies leading to a degree (eg: BScAgric). For example, requirements for
admission to BScAgric programmes in the universities show quite wide variation beyond the basic Matriculation
exemption. The difficulty is that variations between institutions are difficult to equate (eg: is a rule stating that a
student must have a E symbol in Biology (HG) more – or less - restrictive than a rule stating that a student musts
have a D symbol in English (SG)?). Some institutions use a so-called M-Score to equate students’ eligibility.
Essentially the simple M-Score provides a score that measures overall performance of the students across all
subjects. If the institutions involved translated their specifications into an M-Score format, this would enable a more
standardized and reliable approach to comparing admissions policy between different degree programmes and
comparing admissions policy between universities offering the same degree programme. But this score in any case
cannot replace the specification of other criteria.
Interpretation of the admission requirements is therefore not an exact process. In addition, many institutions refer
to their prerogative to subject students to an ‘evaluation process’ and in other instances refers to particular tests
the nature of which is unstated. The main point here is that if these processes – which are vaguely state - are
applied, then the outcome of admissions cannot be the product only of the stated criteria.
Ultimately, analysing the impact of admission requirements must be undertaken within specific programmes and
within specific student groups. For example, the degree with the lowest admission requirement among the Bachelor
level programmes reviewed is the BInstAgric offered at the University of Pretoria, which posts lower admission
criteria than the same university’s requirement for BScAgric. Noteably, there are no requirements with respect to
science-related subjects. Also the requirement is restricted to only to a language, English, where the cut-off mark
is Higher Grade 40%. This particular requirement could be interpreted as a strategy to attract second language
English speakers in order to accommodate students from formerly disadvantaged population groups. Even though
this degree is accredited with the HEQC and is offered by a credible university, the question is: what prospects for
employment does the degree provide? The second question is about the quality of instruction and support within
the programme: to what extent does the programme and its structure enable access (eg: through bridging), support
and build students in the process of their studies? Therefore, we must consider examining particular programmes
and the prospects for employment and contribution in the market place. This is analytically feasible whereas a survey
approach across admission criteria will not provide answers.
5.6 The cost of study
Cost of studying is an important factor that affects access to study opportunities. Unless costs of studying are very
low, usually as a result of heavy state subsidies, they constitute a serious barrier to students who wish to enroll and
who qualify academically for admission but do not have access to sufficient financial resources to meet fee
requirements and other financial needs. For this reason, the cost of study must be taken into account since this is
the barrier below which students who cannot raise this amount are excluded.
How institutions set out their fees structure is a complex and strategic process, which must balance income with
operational expenditure. The calculation of fees is affected by the proportionate income from several sources: state
subsidy, income from research activities, support from philanthropic foundations, the institution’s own investments,
and finally student fees. In South Africa, at higher education levels, there is no rule that sets the same fees across
all institutions. This means that the various institutions are in competition with each other in attempting to maximize
the quality of education they provide while holding direct costs to the individual student or her/his household to a
minimum.
The calculation of fees is also subject to other influences. First, the costs of programmes within institutions will differ
with each other. For example, medical and high technology related programmes tend to be more expensive on
account of equipment, laboratory and other expenses. Second, institutions or faculties/departments may seek to
cross-subsidise expensive programmes – those with small classes but studying high profile disciplines - with other
programmes which generate more income.

C M Y CM MY CY CMY K
128
Also, the academic reputations of institutions and faculties– whether well earned or not – will influence their fee
setting. Lastly, the location of an institution and the wealth of the client populations that are resident in the same
locality will also affect how the institution’s managers set fee structures.
All these factors will to some extent inform the setting of fees for agricultural studies, but will not be addressed in
any detail. The discussion now turns to specific analysis of the costs themselves.
5.7 How higher education costs are presented to students
In order to calculate and compare study costs, a critical starting point is to consider which costs to include in the
calculation. This is problematic because institutions do not levy fees in a consistent way. Even if we take the three
basic cost categories: registration, academic and residence fees, we can see that some institutions do not levy
registration fees while others do (Table 5). This means that if we were to leave registration fees out of the calculation,
because some institutions do not charge these fees, we would obtain data that is biased against those that levy
low or no registration fees or which bundle their fees in different ways.
There is a range of categories of fees that are charged separately by some and not other institutions. Where an
institution levies these various costs separately, the amount required for academic fees may be proportionately
reduced. Examples of the costs identified separately by institutions include:
Cost categoryLibrary access card feeLibrary subscriptionsField tripsAdministration Services FeeLearning centre tutorial levyStudents Representative Council LevyInformation and learning for publication (on submissionof dissertation for examination)
Books
Equipment levy
Example of amount(s) givenR45
R amount not statedR amount not stated
R330R100R225R275
Massive cost variation possible depending onprogramme and whether the institution providesits own reading materials
R varied
High degrees of accuracy in this level of detail are difficult to obtain, since institutions provide their costs in different
forms and in different documents. In addition, because there is no official requirement, there is no standard means
of reporting these costs.
In a number of universities, first degrees in particular - but also many post graduate diplomas, and BEd degrees -
are charged per course, whereas fees are somewhat simpler at higher degree level where Honours, Masters and
Doctoral degrees are still charged per qualification. This means that the undergraduate degree costs are dependent
on the student’s choice of curriculum and course options.
The actual fees payable by a student will depend on the specific modules taken during the year. Therefore what
is compulsory and what is elective will affect fees. Annual fees will also differ according to whether a student is part
time or full time. Finally, tuition fees will differ per year within a programme such as shown in the example below
from the University of Venda (Table 4):

C M Y CM MY CY CMY K
129
Table 4: Academic fees in the School of Agriculture, Rural Development and Forestry, University ofVenda, 2005 (ZAR)
BAgricBAgBMBScFor
MScAgrBSc (Hons) AgricPhD(Agr)
Undergraduate
Bachelor of AgricultureBachelor of Agribusiness ManagementBachelor of Science in ForestryPostgraduate
Master of Science in AgricultureBachelor of Agric HonoursDoctor of Philosophy in Agriculture
First year
9 1008 010
10 230First year
8 8908 8909 880
Secondyear
104509 6807 860
Second year
4 4804 4804 910
Thirdyear
82308100
10560Thirdyear
---
Fourthyear106901204010690
Fourthyear
---
Based on this discussion, it is clear that an attempt to define full costs of study and affordability of study across
agriculture programmes would require further in-depth data gathering and analysis.
The analysis below will therefore focus on institutional level costs as in academic fees, registration fees and residence
fees to produce an indication of the full cost of study. It is important to include residence fees because agricultural
programmes are not offered in all higher education institutions, and a sizeable proportion of agriculture students
will probably have to seek accommodation at the specific institutions that do.
5.8 Comparison of full cost of study in higher education - projections for 2005
The following discussion is based on cost of study projections in academic fees, registration and residence fees
for all higher education institutions in South Africa. In Table 5 below, a list of 28 institutions have been given, which
reflects the fact that a number of institutions are still in the process of mergers and in the interim are still levying
fees independently.
This brief comparison across all institutions is necessary to establish whether the institutions that offer agriculture
related programmes are overall more or less expensive than the mean. Furthermore, it should be noted that the
cost parameters given below are averages generated for each institution across all faculties/departments. These
figures may be sufficient, as a strarting point for comparison, as long as there is no large variation in fees applied
between schools/faculties/departments within institutions.
Nevertheless, Table 5 shows that around the average of R12 191 over all institutions, academic fees range in price
from R5 900 at Border Technikon to R20 787 at the University of Cape Town. Registration fees range from nil to
R4 400 at MEDUNSA although this institution’s registration fees are an outlier, the next highest being R1380 at
University of Venda. The average registration fee across all institutions is R770.
The lowest average residence fees of R11 437 are levied at Cape Technikon and the highest are R23 726 at
University of Pretoria. The average residence fee across all higher education institutions is R18 227.

C M Y CM MY CY CMY K
130
InstitutionBORDER TechCAPE TechCAPE TOWN, Univ ofCENTRAL Univ of TechDURBAN Inst of TechEASTERN CAPE TechFORT HARE, Univ ofFREE STATE, Univ ofKZN, Univ ofMANGOSUTHU TechMEDUNSANORTH WEST UnivNORTH, Univ ofPENINSULA TechPORT ELIZABETH TechPORT ELIZABETH, Univ ofPRETORIA, Univ ofRAND AFRIKAANS UnivRHODES UnivSTELLENBOSCH UnivTRANSKEI UnivTSHWANE Univ of TechVAAL Univ of TechVENDA UnivWESTERN CAPE, Univ of theWITWATERSRAND TechWITWATERSRAND, Univ of theZULULAND, Univ ofTotalAverage
Academic Fees 5 900
10 414 20 787 11 232 9 443 6 138 7 12411 963
15 352 12 112 18 438 15 227 11 528 8 736 8 694
11 788 16 805 12 657 18 118 17 238 11 214 9 259 8 945
12 711 11 154 11 620 15 404 11 333
R 341 335R 12 191
Registration
100
248 660 263 946 535 250
4 400 650
1 165 518 200 380
350
450 320 320
1 380 500
1 360
1 172R 16 167
R 770
Residence Fees 11 790 11 437 23 360 19 732 20 576 12 760 18 154 19 870 19 659 14 619 22 976 13 498 13 130 21 680 17 372 16 812 23 726 22 548 20 966 18 248 20 376 15 192 20 044 19 070 19 748 20 565 15 286 17 178
R 510 372R 18 228
Full Cost of Study 17 690 21 951 44 147 31 212 30 679 19 161 26 224 32 368 35 261 26 731 45 815 29 375 25 823 30 934 26 266 28 980 40 531 35 556 39 084 35 486 32 040 24 771 29 309 33 161 31 401 33 545 30 689 29 683
R 867 874R 31 188
Table 5: Full Cost of Study projections for 2005 in South African higher education (ZAR)
Source: NSFAS Personal Communication (2005)
Note: This table does not contain reference to University of South Africa (incorporating the former TechnikonSA),
which is a distance institution.
In the next table, we include only those institutions that offer agriculture in our analysis. The institution with the
lowest average academic fees is Fort Hare University (R7 124) and the institution with the highest average fees is
the University of Stellenbosch (R17 238). Overall, the Technikons/Universities of Technology that offer agriculture
programmes generally set much lower academic fees and registration fees than the universities that offer agriculture.
There is a much smaller difference in residence fees between the institutions.
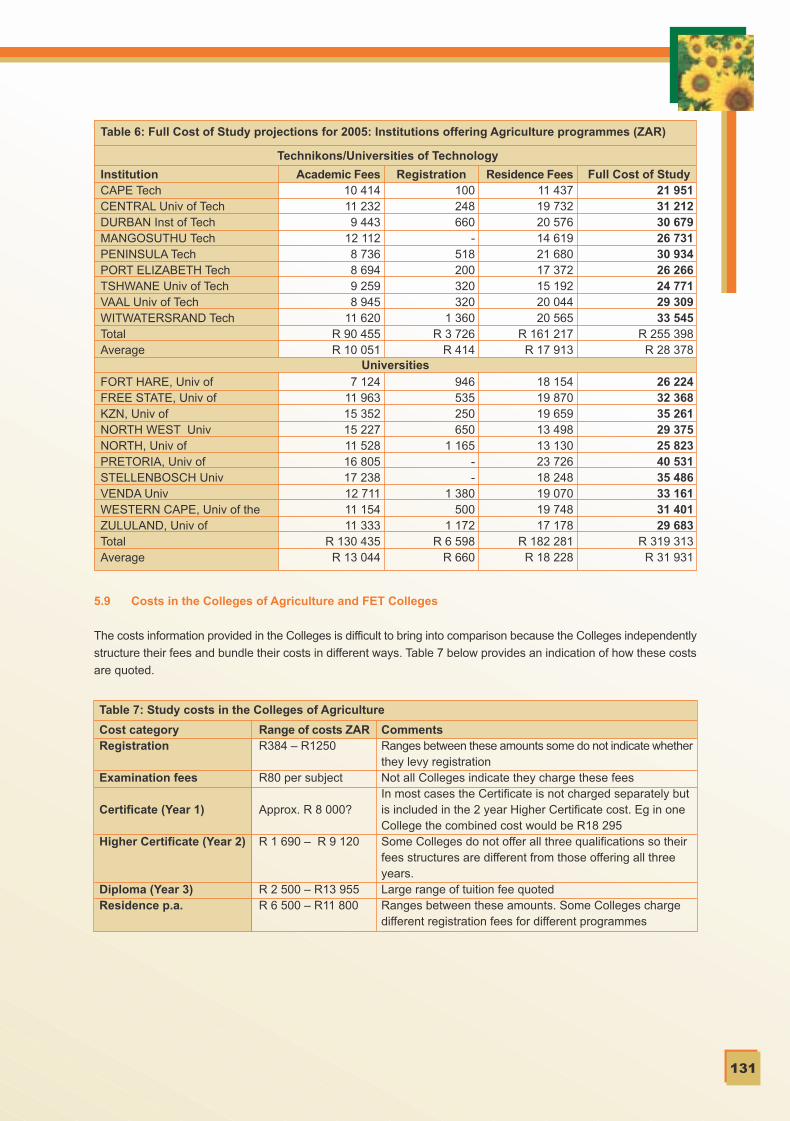
C M Y CM MY CY CMY K
131
InstitutionCAPE TechCENTRAL Univ of TechDURBAN Inst of TechMANGOSUTHU TechPENINSULA TechPORT ELIZABETH TechTSHWANE Univ of TechVAAL Univ of TechWITWATERSRAND TechTotalAverage
FORT HARE, Univ ofFREE STATE, Univ ofKZN, Univ ofNORTH WEST UnivNORTH, Univ ofPRETORIA, Univ ofSTELLENBOSCH UnivVENDA UnivWESTERN CAPE, Univ of theZULULAND, Univ ofTotalAverage
Academic Fees 10 414 11 232 9 443
12 112 8 736 8 694 9 259 8 945
11 620R 90 455R 10 051
7 124 11 963 15 352 15 227 11 528 16 805 17 238 12 711 11 154 11 333
R 130 435R 13 044
Registration 100 248 660
- 518 200 320 320
1 360R 3 726
R 414
946 535 250 650
1 165--
1 380 500
1 172R 6 598
R 660
Residence Fees 11 437 19 732 20 576 14 619 21 680 17 372 15 192 20 044 20 565
R 161 217R 17 913
18 154 19 870 19 659 13 498 13 130 23 726 18 248 19 070 19 748 17 178
R 182 281R 18 228
Full Cost of Study 21 951 31 212 30 679 26 731 30 934 26 266 24 771 29 309 33 545
R 255 398R 28 378
26 224 32 368 35 261 29 375 25 823 40 531 35 486 33 161 31 401 29 683
R 319 313R 31 931
Technikons/Universities of Technology
Universities
Table 6: Full Cost of Study projections for 2005: Institutions offering Agriculture programmes (ZAR)
5.9 Costs in the Colleges of Agriculture and FET Colleges
The costs information provided in the Colleges is difficult to bring into comparison because the Colleges independently
structure their fees and bundle their costs in different ways. Table 7 below provides an indication of how these costs
are quoted.
Table 7: Study costs in the Colleges of Agriculture
Cost categoryRegistration
Examination fees
Certificate (Year 1)
Higher Certificate (Year 2)
Diploma (Year 3)Residence p.a.
Range of costs ZARR384 – R1250
R80 per subject
Approx. R 8 000?
R 1 690 – R 9 120
R 2 500 – R13 955R 6 500 – R11 800
CommentsRanges between these amounts some do not indicate whetherthey levy registrationNot all Colleges indicate they charge these feesIn most cases the Certificate is not charged separately butis included in the 2 year Higher Certificate cost. Eg in oneCollege the combined cost would be R18 295Some Colleges do not offer all three qualifications so theirfees structures are different from those offering all threeyears.Large range of tuition fee quotedRanges between these amounts. Some Colleges chargedifferent registration fees for different programmes
C M Y CM MY CY CMY K
132
Based on the above indications, the average costs of study for one year across the different qualifications given
above could be R 15 000 consisting of R1 000 registration, R7 000 Tuition fees, and R7 000 residence fees. Although
this is only an approximate amount, it does tally for overall costs of completing both the Certificate and the Higher
Certificate of R28 000 quoted by one College.
The FET Colleges have a standard fee structure with some variations. Currently the progression through from N1
to N6 is not taught in every college. The costs of the more popular N4 and N5 (one year) and N6 (1 year) are R3
150, R3 000 and R6 650 respectively. Variations in the scale of costs between FET Colleges do exist. Most of the
FET Colleges levy a registration of about R200. Books for a full programme cost about R1 200 per year, and Practical
Courses bear costs of approximately R1 000 per year. The South Cape FET Colleges offers an Agriculture Learnership
over 32 weeks (rather than courses from N1 to N6) which receives funding from the AGRISETA to the amount of
about R8 000 per employed learner and R15 000 per unemployed learner. This funding is drawn from the skills
development levies that employers are obliged to pay and is not paid by the learners themselves. Other Colleges
such as Lovedale also offer Learnerships.
5.10 Summary: Cost of study analysis
For the sake of discussion, we could calculate the cost of study as the amount required to study a particular course
at a particular institution. This amount could be compared with the average income of households – either in the
local area or in the whole country - to generate an understanding of how many households could in theory be able
to support one member studying in an institution.
However, there are a large number of factors that contribute to how the affordability of educational opportunity is
measured in a household. People differ in the extent to which they will consider education affordable on the basis
of the culture and social class. Many poor households will spend a much higher proportion of their disposable income
on education than better earning households. Therefore a student might have access to funds that are more or less
adequate for registration at a higher education institution, but not enough to register for the programme of her/his
first choice.
In effect the decision of a student to enroll for an agriculture course may be a complex compromise between: which
institution to attend, which programme she would like to enroll for, which is the closest institution, which institution
is perceived to have the best reputation and which faculty (say of agriculture) is perceived to be the best. The best
overall institution does not necessarily have the best agriculture faculty or department across all institutions.
Ultimately, the costs levied by the higher education institution are not the final measure of total costs of study.
Students who do not live in residence have to meet costs such as: accommodation, food, and travel. In addition
there are, of course, personal expenses according to the lifestyle that the student’s budget can support. Excluding
the direct and unavoidable registration and academic fees, there is wide variation possible in the way in which
students can apportion or conserve their finances, especially with respect to living costs where they live away from
home.
5.11 References
Committee of Technikon Principals (CTP) (2002) A policy document on the requirements for admission to a Technikon
November 2002 Pretoria, CTP.
Accessed at: www.nu.ac.za/ieasa/EntranceRequirements.PDF
Date accessed: 14 March 2005
Department of Education (DoE) (2004) Further Education and Training (FET) college examinations report: 2004
Pretoria.
Accessed at:
8b-12-04%20Final.doc
Date accessed: 14 March 2005
C M Y CM MY CY CMY K
133
Labour Market Skills Development Programme (LMSDP) (2002) Understanding the South African Skills Development
System: A reference source Pretoria, Department of Labour.
Accessed at: www.trainingsupport.co.za/Docs/NQF%20QUICK%20Ref.pdf -
Date accessed: 15 March 2005
South Africa, Government of (1995) Act No.27 of 1995 Technikons Amendment Act No. 159. 21 July 1995.
South African qualifications Authority (SAQA) (2004) Criteria and Guidelines for Short Courses and Skills Programmes:
Guideline document Pretoria, SAQA.
Accessed at: http://www.uovs.ac.za/support/chesd/03/Part%201.pdf
Date accessed: 16 March 2005
Strydom,J.F. (2002) Access to Higher Education: A research project for the FOTIM and FSHFETT Johannesburg,
FOTIM/FSHFETT.
Accessed at: http://www.fotim.ac.za/docs/accessstrydomreport1102.doc
Date accessed: 04 March 2005

C M Y CM MY CY CMY K

C M Y CM MY CY CMY K

C M Y CM MY CY CMY K
136
CHAPTER 6
Financing higher and further education students in the field of agriculture
6.1 Introduction
The availability of various forms of financial assistance is of critical importance to ensuring that adequate numbers
of students access the opportunity to study at various levels of the education system. These opportunities are
provided through various vehicles such as loans, bursaries and scholarships.
As in other fields of study, students who seek to pursue studies in the agriculture field at the further and higher
education levels can seek financial assistance from a range of providers:
• the National Student Financial Aid Scheme (NSFAS) a statutary body
• government agencies such as the NRF which provide post-graduate funding for research degrees
• government departments which seek to improve services by supporting students who enroll in particular fields
and occupations
• enterprises and industry sectors which aim to improve human resources in their sphere of operations
• corporate social investment sources
• foreign government aid agencies
• local and international philanthropic foundations
• commercial banks which offer student loans at preferential interest rates
• other funders
It is clear that there is a range of potential financing sources from which students in general could seek financial
support. However, it should not be assumed that financial support will necessarily be equally available irrespective
of study field. The analysis that follows will consider the extent to which students in the Agriculture field have recourse
to a proportionate share of financial aid resources, and the conditions that apply to the granting of financial aid.
6.2 Background to the public provision of financial aid in South Africa since 1990
It is necessary to provide a brief background to the provision of financial support to higher education students in
South Africa in order to understand the data more clearly.
Until the 1990s South Africa did not have a government driven financial aid scheme for students. Post-school
institutions had to raise funds to support students who needed such assistance. In general institutions appealed
to local and international donors for assistance and allocated part of their general operating budgets to student
financial aid. Then in 1991 the Tertiary Education Fund of South Africa (TEFSA) was established as a non profit
making company to administer a national scheme of student bursaries and loans, in particular to support historically
disadvantaged students with academic ability to embark on tertiary study.
However, the fragile financial situation at tertiary institutions was aggravated with student fee debt rising from R89
million in 1992 to R137 million in 1993. In 1995 the Minister of Education appointed the National Commission on
Higher Education (NCHE) to investigate this situation. The Commission found that TEFSA was in the position to
support a comprehensive, nationwide financial aid scheme and received the mandate to manage the government's
National Student Financial Aid Scheme (NSFAS) in 1996. In 1999, the National Student Financial Aid Scheme Act
(No 56 of 1999) was passed. From 2000, TEFSA became a statutory agency - with a board - called the NSFAS.
The NSFAS functions as an income-contingent loan and bursary scheme, where recipients start repayments once
they are employed and earn above a sub-minimum threshold. Students receive 100% loans between R2 000 and
R25 000. Up to 40% of the loan is converted into a bursary (which does not have to be repayed) depending on the
student’s academic results. (CHE, 2004, 194).

C M Y CM MY CY CMY K
137
NSFAS works in partnership with institutions. It allocates funding to higher education institutions on the basis of a
formula that factors in the number of students, student needs and cost of study. Students are assessed on basis
of need and merit to determine the size of awards (Ngomane, 2004). Because the awards are made at the institutional
level it is important to assess whether students in agriculture overall receive an equitable share of the opportunities
to access funding in this scheme.
As can be seen from Table 1 below, in addition to government, contributions are made to the NSFAS by the higher
education institutions themselves, and also by foreign donors and the South African private sector. This suggests
that certain foreign donors and local private sector funders see the value of making their contribution through the
infrastructure of the NSFAS rather than by administering their own bursaries. As a result, the funding flowing through
other channels will presumably be smaller than the NSFAS. The value of funding made available to higher education
other than through the NSFAS is however difficult to quantify as will become clear below.
Table 1: Amount and source of NSFAS funding, 1991- 2002 (in R000)
FinancialYear
1991/921992/931993/941994/951995/961996/971997/981998/991999/002000/012001/022002/03TOTAL
IDT &KagisoTrust21.525.030.030.020.016.048.2
-----
190.7
ForeignDonors
-14.039.037.076.018.571.937.919.235.07.2
19.5365.2
SAPrivateSector
-------
4.64.95.05.61.3
21.4
HigherEducationInstitutions
-----
15.030.326.717.724.132.944.4
191.1
RecoveredFunds
------
2.023.114.29.3
146.6147.9343.1
State
---
10.557.1
283.8198.3296.5384.9437.4439.9506.7
2615.1
Other
-------
5.5--
2.813.521.8
TOTAL
21.539.059.077.5
153.1333.3350.9394.5441.0510.8635.0733.4
3749.0
Source: CHE (2004, 197)
The data shows that government is increasing its commitment to supporting students financially through NSFAS
from R10.5 million to R506, 7 million between 1994 and 2002. This produces a challenge for administrators of the
funding at the national level in NSFSA as well as in the higher education institutions:
“the challenge to institutions in the administration of financial aid is to try and balance
several factors which are to some extent contradictory: on the one hand what we are
trying to do is to assist financially needy students. On the other hand we have to
ensure that the funds are given to students who have the potential to succeed, to
people who have the capacity to acquire degrees and to find employment so that they
can pay back.” (Ngara, 2003, 2)
In addition, the administrators of NSFAS must consider how funding can be focused – eg: by targeting particular
fields or occupations - so as to direct the flow of students into occupations and economic sectors that are important
in ensuring growth and development in the country. In this regard, Ngomane (2004) of the Financial Aid Practitioners
society of South Africa (FAPSA) who represent managers of financial aid in higher education institutions commented
recently on the “(L)ack of a strategy (in FAPSA) to address the human resource needs of our country.”
The analysis that follows will be presented in two separate sections. In the first section, the NSFAS will be addressed.
Thereafter, the nature of other funding will be considered.
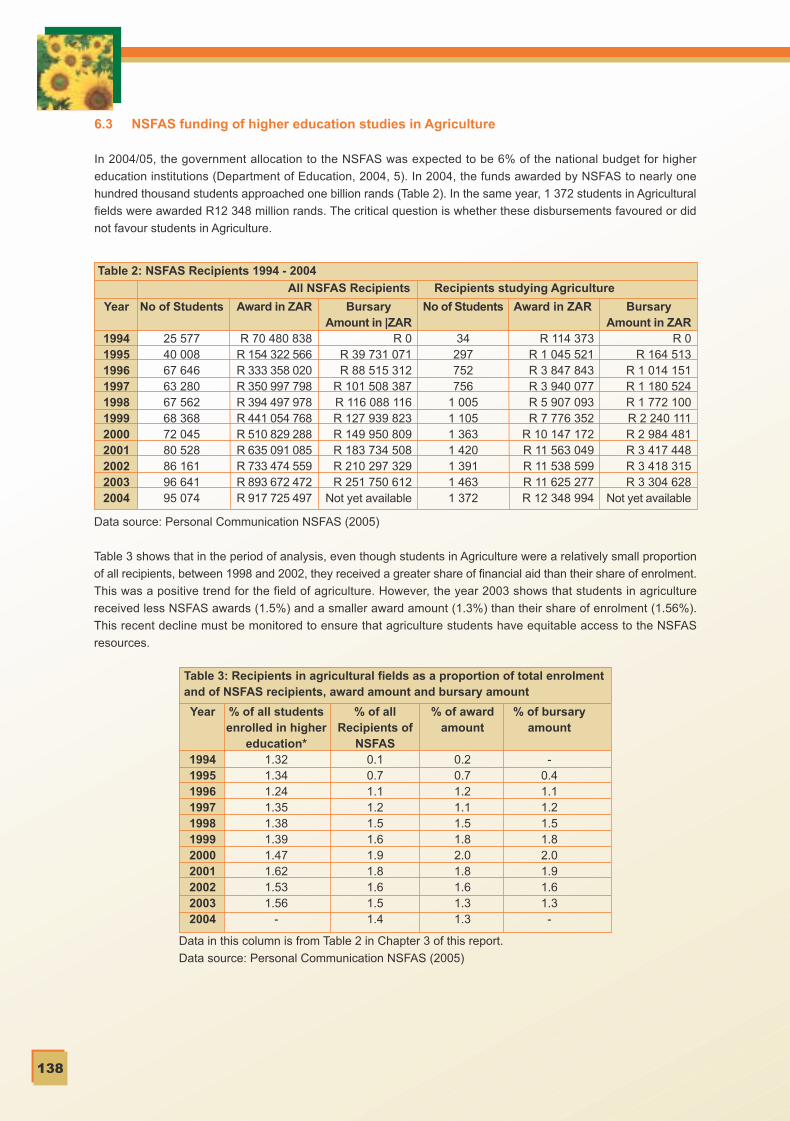
C M Y CM MY CY CMY K
138
6.3 NSFAS funding of higher education studies in Agriculture
In 2004/05, the government allocation to the NSFAS was expected to be 6% of the national budget for higher
education institutions (Department of Education, 2004, 5). In 2004, the funds awarded by NSFAS to nearly one
hundred thousand students approached one billion rands (Table 2). In the same year, 1 372 students in Agricultural
fields were awarded R12 348 million rands. The critical question is whether these disbursements favoured or did
not favour students in Agriculture.
Table 2: NSFAS Recipients 1994 - 2004
Year
19941995199619971998199920002001200220032004
No of Students
25 57740 00867 64663 28067 56268 36872 04580 52886 16196 64195 074
Award in ZAR
R 70 480 838R 154 322 566R 333 358 020R 350 997 798R 394 497 978R 441 054 768R 510 829 288R 635 091 085R 733 474 559R 893 672 472R 917 725 497
BursaryAmount in |ZAR
R 0R 39 731 071R 88 515 312
R 101 508 387R 116 088 116R 127 939 823R 149 950 809R 183 734 508R 210 297 329R 251 750 612
Not yet available
No of Students
34297752756
1 0051 1051 3631 4201 3911 4631 372
Award in ZAR
R 114 373R 1 045 521R 3 847 843R 3 940 077R 5 907 093R 7 776 352
R 10 147 172R 11 563 049R 11 538 599R 11 625 277R 12 348 994
BursaryAmount in ZAR
R 0R 164 513
R 1 014 151R 1 180 524R 1 772 100R 2 240 111R 2 984 481R 3 417 448R 3 418 315R 3 304 628
Not yet available
All NSFAS Recipients Recipients studying Agriculture
Data source: Personal Communication NSFAS (2005)
Table 3 shows that in the period of analysis, even though students in Agriculture were a relatively small proportion
of all recipients, between 1998 and 2002, they received a greater share of financial aid than their share of enrolment.
This was a positive trend for the field of agriculture. However, the year 2003 shows that students in agriculture
received less NSFAS awards (1.5%) and a smaller award amount (1.3%) than their share of enrolment (1.56%).
This recent decline must be monitored to ensure that agriculture students have equitable access to the NSFAS
resources.
Table 3: Recipients in agricultural fields as a proportion of total enrolmentand of NSFAS recipients, award amount and bursary amount
Year
19941995199619971998199920002001200220032004
% of all studentsenrolled in higher
education*1.321.341.241.351.381.391.471.621.531.56
-
% of allRecipients of
NSFAS0.10.71.11.21.51.61.91.81.61.51.4
% of awardamount
0.20.71.21.11.51.82.01.81.61.31.3
% of bursaryamount
-0.41.11.21.51.82.01.91.61.3-
Data in this column is from Table 2 in Chapter 3 of this report.
Data source: Personal Communication NSFAS (2005)

C M Y CM MY CY CMY K
139
In Table 4 below, the average award to students in agriculture is compared to the average award to all NSFAS
recipients in 2003. This shows that, on average agriculture students received R7 946, which was 14% less than
the national average. Likewise, the average bursary amount for agricultural students was 13% less than the average
of all NSFAS recipients. These averages are affected the proportions of students who take undergraduate and post
graduate courses in each group as well as their academic performance in determining the bursary amount. Therefore
the differences shown here may not necessarily reflect a bias against agriculture students. Further investigation is
necessary to understand these patterns more completely.
Table 4: Comparison of the value of NSFAS disbursements to all students with disbursements toagriculture students in 2003
Year
All NSFASStudents
AgricultureStudents
Number
96 641
1 463
Total awardin ZAR
R 893 672 472
R 11 625 277
Total bursarymount in |ZARR 251 750 612
R 3 304 628
Average awardin ZAR9247
7946
14% less
Average bursaryamount in ZAR
2605
2259
13% lessDifference
It is equally important to monitor the proportion of agriculture students who are recipients of NSFAS financial
assistance. This provides some sense of the extent of the financial ‘safety-net’ that is extended to Agriculture students.
As can be seen, the proportions of agriculture students who were recipients of NSFAS assistance was at its highest
in 2000 and then declined to 13.1% in 2003 (Table 5). In effect, this means that 13 in every 100 agriculture students
received assistance.
Table 3: Recipients in agricultural fields as a proportion of total enrolmentand of NSFAS recipients, award amount and bursary amount
Year
19941995199619971998199920002001200220032004
Total enrolment inhigher education
in agriculturalfields6 5287 2217 0277 6897 7417 6968 669
10 58810 34811 196
-
Students enrolledin Agricultureand NSFASrecipients
34297752756
1 0051 1051 3631 4201 3911 4631 372
Agriculture student recipients of NSFAS as a proportion of total enrolment in Agriculture
%
0.54.1
10.79.8
13.014.415.713.413.413.1
-
Data source: Personal Communication NSFAS (2005)
Within the overall levels of access to financial assistance, it is necessary to consider the distribution of support onthe basis of race, given the history of disadvantage suffered by black people in South Africa. The NSFAS does notcurrently supply data on the racial breakdown of recipients at the level of study field, such as agriculture. However,data for all students receiving NSFAS support suggests that the overwhelming majority of recipients by 2001 wereAfrican (Table 6). Given this pattern, it is likely that the shape of access among agriculture students was similar.

C M Y CM MY CY CMY K
140
* This is a data error, and the group allocated as ‘unknown’ is assumed to be majority
African Source: CHE (2004,197)
Currently, the NSFAS data does not enable analysis of the share of support between university and technikon
students disaggregated to study field. At the aggregate level, we know that in 2002, university students received
59% of NSFAS expenditure, while technikons received 41% of expenditure (CHE, 2004, 197).
We are able to describe the breakdown of grants within agriculture by the qualification for which they were registered
(Table 7 and Table 8). Within the group of recipients who were registered for a degree or an under-graduate diploma,
a shift has occurred over the decade in which the proportion of diplomates has increased from 36% in 2000 to 48%
in 2004, while recipients registered for degrees declined from 64.0% to 51.3% in the same period (Table 8).
Table 1: Amount and source of NSFAS funding, 1991- 2002 (in R000)
Year199519982001
Year199519982001
African37 28063 80020 335
African858422
Coloured2 3672 063
524
Coloured531
Indian1 3621 144
365
Indian320
White196
1 563397
White020
Unknown2 6647 197
71 916
Unknown69
77*
Total43 86975 76793 537
Total100100100
(b) Students receiving awards in percent (%)
Table 7: Number of NSFAS recipients in agriculture by qualification level, 1994 - 2004
QualificationDiplomaDegreePost Grad DiplomaHonoursMastersDoctorateTotal
19943
31-- --
34
1996255497
- - - -
752
1997309447
- - - -
756
1995114183
-- - -
297
1998344661
- - - -
1005
1999404701
- - - -
1105
2000491872
- - - -
1363
2001599821
- - - -
1420
2002620770
- - - 1
1391
2003662800
1- - -
1463
2004658704
- 73-
1372
Data source: Personal Communication NSFAS (2005)
Evidently, the NSFAS awards were not targeted at post-graduate levels – or post-graduate students did not apply
for assistance - until very recently. From 2002, evidence suggests that the rates of post-graduate applications are
increasing (Table 7 and Table 8). This will need to be monitored. Some coordination may be appropriate to establish
that post-graduate students are supported by the appropriate funding body, given that the National Research
Foundation is also a source of post-graduate research funding.
Table 8: NSFAS recipients in agriculture by qualification level in percentage, 1994 - 2004
QualificationDiplomaDegreeHonoursPost Grad DiplomaMastersDoctorateTotal
19948.80.2----
100
199633.966.1
----
100
199740.959.1
----
100
199538.461.6
----
100
199834.265.8
----
100
199936.663.4
----
100
200036.064.0
----
100
200142.257.8
----
100
200244.655.4
---
0.1100
200345.254.70.1---
100
200448.051.3
-0.50.2-
100

C M Y CM MY CY CMY K
141
Table 9: Share of NSFAS award amounts to Agriculture by qualification level in percentage, 1994 - 2004
Qualification
Diploma
Degree
Post Grad Diploma
Honours
Masters
Doctorate
Total
1994
7.6
92.4
-
-
-
-
100
1996
24.6
75.4
-
-
-
-
100
1997
27.3
72.7
-
-
-
-
100
1995
25.1
74.9
-
-
-
-
100
1998
28.0
72.0
-
-
-
-
100
1999
32.3
67.7
-
-
-
-
100
2000
32.2
67.8
-
-
-
-
100
2001
36.7
63.3
-
-
-
-
100
2002
39.8
60.1
-
-
-
0.1
100
2003
45.5
54.4
0.1
-
-
-
100
2004
50.7
48.4
-
0.6
0.3
-
100
Data source: Personal Communication NSFAS (2005)
The share of award amounts shifted to a similar extent between diploma and degree levels (Table 9). This suggests
that the value of financial awards between diploma and degree levels is similar in size.
Data source: Personal Communication NSFAS (2005)
6.4 Funding of higher education studies in Agriculture outside of the NFSAS
There is a wide range of institutions that offer financial assistance to students in higher education. In order to obtain
an overview of the characteristics of financial assistance offered other than through the NSFAS, three sources of
bursary information were used: the “Bursary Register” editions for 2004 and 2005, a hard copy book that is widely
used and recommended as a source, the website www.careers.co.za (continuously updated), and “Career Mentor”
(2005 edition). The latter is a computer based Career Guidance Information System available on CD that consists
of a database of careers, bursaries and study information in South Africa. This is a competitive product available
on the market and on this basis was considered to provide reasonably comprehensive and reliable information. For
further details on sources, please refer to the Methodology section at the beginning of this report.
The data from Career Mentor and the other two sources were searched using key words to reveal a set of 60 bursary
opportunities in the field of agriculture. Just over half of all the bursaries obtained in this sample were dedicated
specifically to agriculture or a sub-field within agriculture (Table 10). In the other cases, students from one or more
fields other than agriculture were also eligible to compete for the bursary on offer. Therefore it cannot be assumed
that agriculture students would automatically qualify and receive the award.
Table 10: Fields of study for which bursaries are offered, 2004 - 2005
FieldAgriculture onlyAgriculture and 1 other fieldAgriculture and 2 other fieldsAgriculture and 3 other fieldsAgriculture and 4 other fieldsAgriculture and 5 other fieldsAgriculture and 6 – 10 other fieldsAgriculture and more than 10 other fields
N347613162
%56.711.710.01.75.01.7
10.03.4
Note: Percentage may not add up to 100 because of rounding
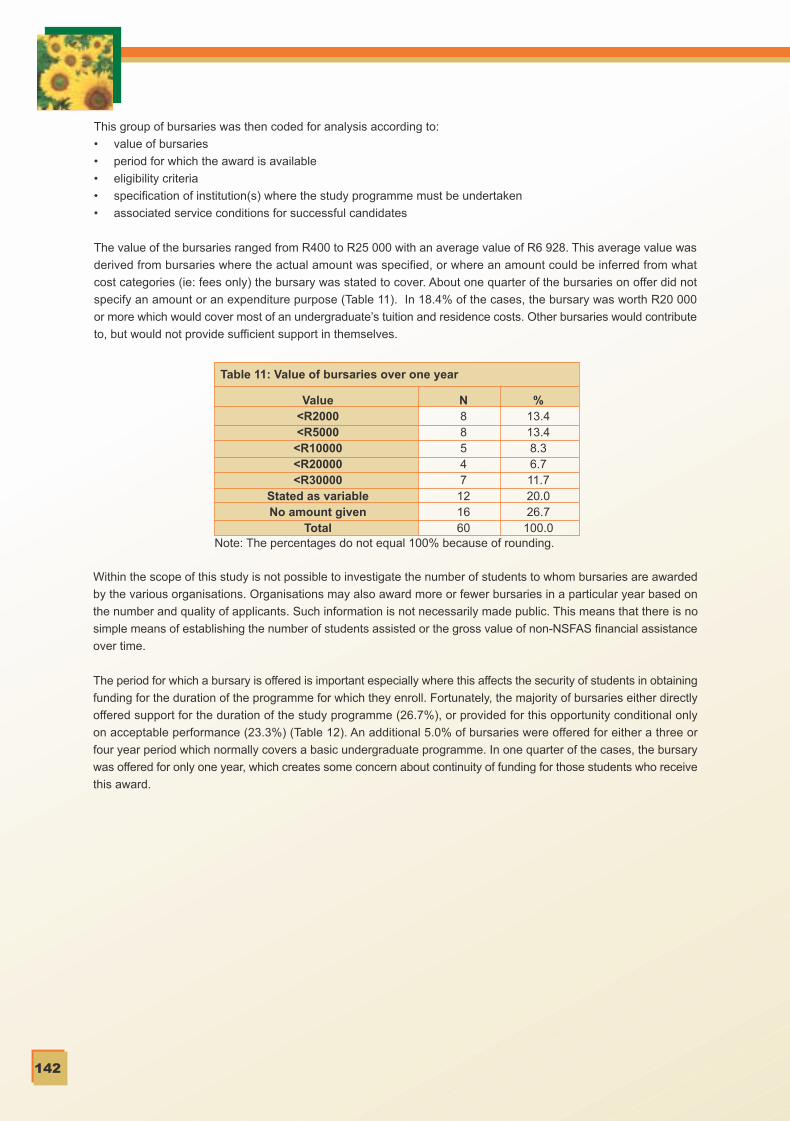
C M Y CM MY CY CMY K
142
This group of bursaries was then coded for analysis according to:
• value of bursaries
• period for which the award is available
• eligibility criteria
• specification of institution(s) where the study programme must be undertaken
• associated service conditions for successful candidates
The value of the bursaries ranged from R400 to R25 000 with an average value of R6 928. This average value was
derived from bursaries where the actual amount was specified, or where an amount could be inferred from what
cost categories (ie: fees only) the bursary was stated to cover. About one quarter of the bursaries on offer did not
specify an amount or an expenditure purpose (Table 11). In 18.4% of the cases, the bursary was worth R20 000
or more which would cover most of an undergraduate’s tuition and residence costs. Other bursaries would contribute
to, but would not provide sufficient support in themselves.
Within the scope of this study is not possible to investigate the number of students to whom bursaries are awarded
by the various organisations. Organisations may also award more or fewer bursaries in a particular year based on
the number and quality of applicants. Such information is not necessarily made public. This means that there is no
simple means of establishing the number of students assisted or the gross value of non-NSFAS financial assistance
over time.
The period for which a bursary is offered is important especially where this affects the security of students in obtaining
funding for the duration of the programme for which they enroll. Fortunately, the majority of bursaries either directly
offered support for the duration of the study programme (26.7%), or provided for this opportunity conditional only
on acceptable performance (23.3%) (Table 12). An additional 5.0% of bursaries were offered for either a three or
four year period which normally covers a basic undergraduate programme. In one quarter of the cases, the bursary
was offered for only one year, which creates some concern about continuity of funding for those students who receive
this award.
Table 11: Value of bursaries over one year
Value<R2000<R5000
<R10000<R20000<R30000
Stated as variableNo amount given
Total
N88547
121660
%13.413.48.36.711.720.026.7
100.0Note: The percentages do not equal 100% because of rounding.

C M Y CM MY CY CMY K
143
Table 12: Period for which the bursary available
DurationOne YearThree YearsFour YearsDuration of the study programmeRenewable subject to acceptable performanceNo period specifiedTotal
N1421
16141360
%23.33.31.7
26.723.321.7
100.0
Organisations that offer bursaries apply a variety of conditions, which are intended to focus the opportunity on
particular students. The list of conditions given in Table 13 is arrayed in ascending order. Some bursaries included
several conditions and others specified no conditions. Clearly, academic merit is an important requirement because
organisations wish to maximize the chance that their contribution will support students with the greatest likelihood
of successfully completing their academic programmes. In 38.3% of cases, demonstrated academic merit was a
condition.
The focus was also on undergraduate students: undergraduate students were mentioned in 37.8% of the bursaries,
while first year students and second year students were mentioned in 8.9% and 10% of the bursaries respectively.
By offering their bursary in the second year only, organisations appear to be attempting to reduce the risk associated
with high attrition among first year students.
Conditions for bursary eligibility that focus on disadvantaged populations were also evident. Reference was made
specifically to black students, students from rural areas, and students with financial need in 5.0%, 8.3% and 31.7%
of the bursaries respectively. In the agricultural related bursaries, there were no opportunities that focused specifically
on female students.
Table 13: Bursary is offered subject to the following conditions or student characteristics:
DescriptionFor post-graduate studentsFor Black studentsFor first year studentsFor students from rural areasFor full time studentsFor students prepared to work in a particular industryFor students resident in a particulararea (eg: Province, Town etc.)For second year studentsFor students with financial needFor undergraduate studentsFor students who demonstrate academic meritOther
N334558
12
161917235
%5.05.06.78.38.3
13.320.0
26.731.728.338.38.3
Note: Many bursaries were offered on the basis of a number of conditions. The percentageindicates how often a particular condition was specified out of the 60 bursaries that wereincluded in this survey.

C M Y CM MY CY CMY K
144
In some instances bursaries were tied to enrolment in particular education institutions. Not all bursaries specified
a particular institution by name, but sometimes institutions in a particular area. Also where a student is committed
to a particular programme, the fact that such a programme – in a particular field or with a particular qualification -
will only be offered in particular institutions, therefore limits her/his selection where bursaries are only offered in
particular institutions. The following institutional types were referred to in a certain percentage of the bursaries: any
College (13%), any FET institution (17.7%) any Technikon (17.8%) or any university (31%) (Table 14).
There were ten Technikons and nine Universities offering courses in Agriculture. But where an institution was referred
to by name as the preferred place of study, Technikons were named six times and Universities are named 35 times.
This means that universities are advantaged by the specification of institution.
From Table 13 above, there is evidence that 13.3% of bursaries attempt to attract students to obtaining qualifications
in a particular industrial sector. This is an indirect way of drawing human capital into a sector because it does not
involve any compulsory link with the sector via an employment contract. Organisations utilize bursaries to supplement
their own human resources and recruitment strategy by offering bursaries on condition that the successful candidate
will work for the organisation for a specified period. This was the case with nearly one fifth of the bursaries offered
(Table 15).
Table 14: Specification of institution at which bursary is tenable:
DescriptionAt a particular Agricultural CollegeAt one of the higher education institutions in a particularprovinceAt any Agricultural CollegeAt a particular TechnikonAt any FET institutionAt any TechnikonAt any UniversityAt a particular University
Total45
1062
101735
%6.78.3
16.710.03.3
16.728.358.3
Note: The percentage indicates how often a particular institution was specified out of the 60bursaries that were included in this survey.
Table 15: Bursary conditional on a service contract
Service contract provisionsNo service contract conditionsService contract requiredTotal
N491160
%81.718.3
100.0
C M Y CM MY CY CMY K
145
6.5 Bursaries in the Colleges of Agriculture
Financial support in the Colleges of Agriculture is set to improve as the NSFAS begins to offer support for students
enrolled in these institutions. However, non-NSFAS bursaries tend to be offered in Universities and Technikons, with
Colleges being specified in only 23.4% of the cases. This suggests a lack of bursary support in these institutions,
which may help to explain in part why the enrolment of Colleges appears to be in decline.
In some Colleges, bursaries are offered by provincial Departments of Agriculture, as is the case with Cedara in
KwaZulu Natal where five bursaries were offered recently, and Glen College in the Free State. In other instances,
sectoral bodies such as the Sugar Industry Trust offer Bursaries for students registered at the Lowveld and Owen
Sithole Colleges of Agriculture.
6.6 Financial support for higher degree research
The support of research and higher degrees in South Africa is of critical importance in all fields to replenish the stock
of personnel in R&D so that this country can maximize innovation for economic development. For this reason, in
addition to the financial support provided by government and private bodies for standard agricultural qualifications,
it is important to consider support for studies at higher degree levels that involve training in research.
The NRF offers the following categories of scholarships in the natural, social and human sciences, engineering and
technology to meet national priorities and global challenges:• Free-standing scholarships for full-time honours study (DoL scarce skills scholarships)• Free-standing scholarships for full-time Master’s and doctoral study in South Africa (DoL scarce skills scholarships)• Free-standing postdoctoral fellowships for research in South Africa (DoL scarce skills fellowships)• Free-standing scholarships for full-time honours, Master’s and doctoral study in South Africa as well as postdoctoral
fellowships for research in South Africa for students that are physically challenged (disabled) (DoL scarce
skills scholarships)• Free-standing prestigious scholarships for full-time Master’s and doctoral study in South Africa as well as doctoral
study abroad• Free-standing equity scholarships for full-time Master’s and doctoral study in South Africa as well as doctoral
study abroad• Free-standing postdoctoral fellowships for research, either in South Africa or abroad• Free-standing scholarships in targeted areas for full-time Master’s and doctoral study in South Africa in metallurgy,
biochemistry, laser and optical physics as well as engineering (NLC/NRF laser research scholarships)• The Cambridge Commonwealth Trust (CCT) and the NRF joint funding of five (5) South African doctoral scholars• DAAD In-country Scholarships
Research, especially in the natural sciences, can be an expensive undertaking. Support for the research process
itself and the related costs beyond basic tuition fees is therefore important. Based on strategic areas in the national
research system, the National Research Foundation (NRF) provides support through the Thuthuka Programme to
build the research support environment, improve the qualifications, and accelerate the progression of designated
groups, (NRF, 2004). Funding is provided for: research running costs; research instrumentation; conference
attendance; and costs of mentorship and supervision leading to a Doctoral degree and writing a publication. Sub-
programmes include:• Women In Research• Research Development Initiative for Black Academics• Research in Training
It was not possible in the constraints of this project to gather information on agricultural students who successfully
applied for the different forms of NRF scholarships, but this would be important to assess the extent to which
enrolment in agriculture at the graduate and immediate post-graduate levels actually converts to high level training
and skilling at the Masters, Doctoral and post-Doctoral levels.

C M Y CM MY CY CMY K
146
6.7 Comments
In the discussion above, evidence was presented of increases in overall government support for the NSFAS scheme.
This can be broken down according to the source departments or tiers of government. Most significant for this
analysis is the appearance of specific support from the Department of Agriculture of R5.3million and R5.7million in
2004 and 2005 respectively. It is a matter of concern that the full amount of funding made available by the Department
of Agriculture and ring-fenced for agricultural study was not spent in the 2004 year. The reason why this money was
not allocated to students needs to be followed up.
Table 7: Number of NSFAS recipients in agriculture by qualification level, 1994 - 2004
Department of EducationDepartment of LabourDepartment of AgricultureProvincial GovernmentsTotal from State Sources
199410,3
000
10,3
1996283,8
000
283,8
1997197,7
000
197,7
199557,1
000
57,1
1999390
000
390
2000444
000
444
2001450
000
450
2002500
220
14536
2003545106
015
666
2004578
735.321
677.3
200586416.9
5.722.6
909.2
1998296,5
000
296,5
NSFAS (2005)
The Department of Agriculture has also put in place its Agricultural Bursary Scheme in order to contribute towards
human resource development in the agricultural sector. It seeks to “mobilise learners at pre-tertiary level in order
to identify and nurture potential at an early stage and to have more agricultural scientists at the highest level, relevant
to the present and future market needs of the sector and the economy.” At the same time, it seeks to: “increase the
number of agricultural scientists in designated groups, and, consequently, to increase the number of farmers from
designated groups at commercial level.”(Department of Agriculture, 2003, 1). It will be important for the Department
to track students who were awarded these bursaries as they progress through their studies and into their careers
that will hopefully remain in agriculture or cognate fields.
6.8 References
Department of Agriculture (2003) External bursary scheme policies and procedures Pretoria, Department of Agriculture.
Council for Higher Education (2004) “Chapter 11: Financing” In: South African higher education in the first decade
of democracy Council for Higher Education, Pretoria.
Department of Education, South Africa (2004) A new funding framework: How government grants are allocated to
public higher institutions February 2004 Pretoria
National Research Foundation (NRF) (2004) Thuthuka Programme Manual for 2005: ‘Developing and Advancing
Excellence in Researchers’ National Research Foundation, Pretoria.
Ngara,E. (2003) Opening Address Financial Aid Practitioners of South Africa FAPSA 2003 Conference and AGM
University of Natal 11 June
Ngcobo,R. (2004) “National imperatives and the micro-politics of higher education change” Council on Higher
Education Colloquium 11 November
Accessed at:
_HE-Change.pdf
C M Y CM MY CY CMY K
147
Ngomane, Rev.J. (2004) “Ten Years of Progress” Financial Aid Practitioners of South Africa Conference
NSFAS (2005) “Higher Education Funding” Report Presented at the Education Portfolio Committee Meeting 08
March 2005
Accessed at: http://www.pmg.org.za/viewminute.php?id=5595
South Africa (1999) “National Student Financial Aid Scheme Act No.56 of 1999” Government Gazette No.20652
19 November 1999.
C M Y CM MY CY CMY K

C M Y CM MY CY CMY K

C M Y CM MY CY CMY K
150
CHAPTER 7
Demand for intermediate to high-level skills within the South African agriculturalsector
7.1 Introduction
Different activities across the South African agricultural sector require particular agricultural skills or qualifications.
Together these requirements constitute the demand for intermediate to high-level agricultural qualifications in the
labour market. The demand for skills is not static, but is dependent on the interplay of various global, national and
intra-sectoral pressures. Thus while on the one hand it is important to establish overall demand trends for intermediate
and high-level agricultural qualifications from data sources such as the Labour Force Survey, on the other hand it
is even more important to gain a clearer understanding of the dynamic nature of demand for agricultural qualifications
at the meso and micro levels within the agricultural sector and the ways in which the various forces acting on and
within the sector are shaping these demands.
This chapter aims firstly to present the available macro-level data on the demand for intermediate to high-level
agricultural skills. Secondly, it aims to identify and understand the various types of activities requiring agricultural
skills within the agricultural sector. Finally, it aims to identify the pressures that are influencing the sector’s demand
for skills over time.
The basic structure of this chapter is as follows: A macro-level overview of the demand for intermediate to high-
level agricultural qualifications within the South African labour market is derived from Labour Force Survey March
2004 data. In moving towards understanding the structure of the sector and how this impacts on potential skill
requirements, the macro level analysis is followed by the generation of a schematic map representing a broad
structural overview of the South African agricultural sector as it pertains to specific activities. This broad level
identification of possible skill-demanding activities within the sector is expanded upon through an overview of the
distribution of the full range of formal skills requirements within the sector.
The main body of this chapter comprises an extensive analysis of information about current employment and skills
needs that was gathered from enterprises, organisations, institutions and other key role-players operating within
the sector. These findings span: primary agricultural activities; secondary agricultural activities; activities involved
in generating agricultural sector-specific input needs (eg: seeds); non sector-specific inputs (eg: information
technology); and governance and support activities.
7.2 Employment of people with intermediate to high-level skills in the agricultural sector
An analysis of the data from the Labour Force Survey March 2004 provides macro-level employment information,
which while unable to provide a specific figure, allows for the emergence of a picture of the overall employment of
individuals with intermediate to high-level agricultural qualifications. The data analysis refers to overall employment
levels within the South African agriculture sector; employment levels within occupational and industrial categories
associated with agriculture; and within the group of people who hold agricultural qualifications. Income levels (which
generally related to presence or absence of skills) are used as an additional indicator to triangulate across datasets.
7.2.1 Overall employment in the agriculture sector
It is necessary to contextualize employment patterns within the agricultural sector in relation to the whole economy.
Table 1 below shows that 1,271 million people were employed in agriculture in early 2004, a figure which constituted
just over 10% of all people employed. Agriculture as a sector has the fifth largest share of formal employment, but
has the second largest share of informal employment such as subsistence or small scale farming. The majority of
those employed in agriculture - 73.4% - were however located in the commercial sector. It is likely that most graduates
with intermediate to high-level skills will find employment in the commercial sector. However, it cannot be ruled out
that people with these skills are active in subsistence and small scale farming activities.
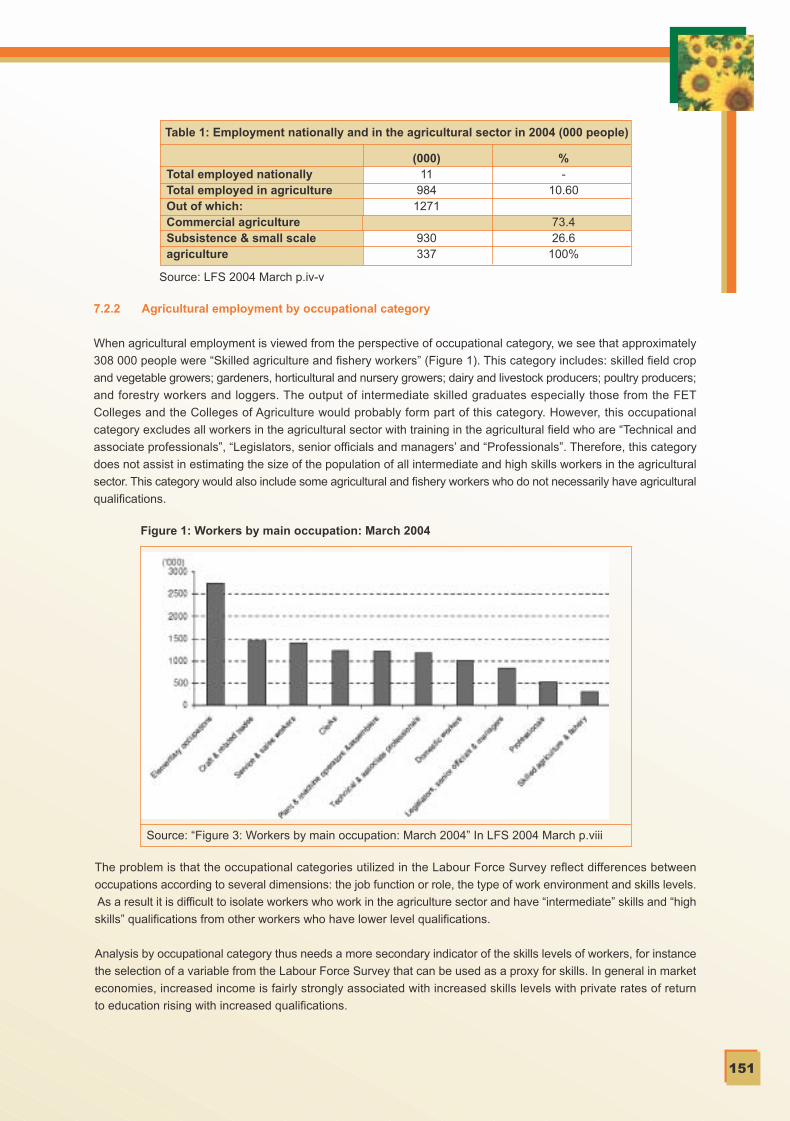
C M Y CM MY CY CMY K
151
Table 1: Employment nationally and in the agricultural sector in 2004 (000 people)
Total employed nationallyTotal employed in agricultureOut of which:Commercial agricultureSubsistence & small scaleagriculture
(000)11
9841271
930337
%-
10.60
73.426.6
100%
Source: LFS 2004 March p.iv-v
7.2.2 Agricultural employment by occupational category
When agricultural employment is viewed from the perspective of occupational category, we see that approximately
308 000 people were “Skilled agriculture and fishery workers” (Figure 1). This category includes: skilled field crop
and vegetable growers; gardeners, horticultural and nursery growers; dairy and livestock producers; poultry producers;
and forestry workers and loggers. The output of intermediate skilled graduates especially those from the FET
Colleges and the Colleges of Agriculture would probably form part of this category. However, this occupational
category excludes all workers in the agricultural sector with training in the agricultural field who are “Technical and
associate professionals”, “Legislators, senior officials and managers’ and “Professionals”. Therefore, this category
does not assist in estimating the size of the population of all intermediate and high skills workers in the agricultural
sector. This category would also include some agricultural and fishery workers who do not necessarily have agricultural
qualifications.
Figure 1: Workers by main occupation: March 2004
Source: “Figure 3: Workers by main occupation: March 2004” In LFS 2004 March p.viii
The problem is that the occupational categories utilized in the Labour Force Survey reflect differences between
occupations according to several dimensions: the job function or role, the type of work environment and skills levels.
As a result it is difficult to isolate workers who work in the agriculture sector and have “intermediate” skills and “high
skills” qualifications from other workers who have lower level qualifications.
Analysis by occupational category thus needs a more secondary indicator of the skills levels of workers, for instance
the selection of a variable from the Labour Force Survey that can be used as a proxy for skills. In general in market
economies, increased income is fairly strongly associated with increased skills levels with private rates of return
to education rising with increased qualifications.

C M Y CM MY CY CMY K
152
For the purposes of the ensuing analysis, monthly income will be used as the proxy for skills levels. The data from
the Labour Force Survey provides four broad income categories. This discussion will employ the two highest
categories: ‘earning R2 501 – R8 000 per month’ (or R30 000p.a. to R96 000p.a.) and ‘earning R8 001 and more
per month’ (above R96 000p.a.). We will assume that most – though not necessarily all – workers with intermediate
and high-level skills earn at these levels.
To demonstrate, we apply this approach to the “skilled agricultural and fishery worker” occupational category where
we can see that there are 18 000 and 11 000 workers in the’ R2 501 – R8 000’ and ‘R8 001 and more’ categories
respectively (Table 2). This data suggests that there are 29 000 workers in the “skilled agriculture and fishery workers”
occupational category with intermediate to high-level skills. But we must recall that this excludes workers involved
in the agriculture sector who are in the ‘professional’, ‘management’ and ‘associate professional’ occupational
categories. Therefore we can assume that the actual number of intermediate and high skilled agricultural workers
in South Africa is higher than 29 000 workers.
Table 2: Workers by main occupation and monthly income
Field of studyTotal employmentSkilled agriculture andfishery workersTotal employmentSkilled agriculture andfishery workers
None277178
23.1%57.8%
R2501- R80002943
18
24.7%5.8%
Source: LFS 2004 March p.30
R2500 or less6968
88
58.1%28.6%
R8001 or more1004
11
8.4%3.6%
Total11984
308
100%100%
LFS2004Mar
• Total includes “Don’t know” “Refused” or “Unspecified Income”• Figures in 000
7.2.3 Employment in the ‘agricultural, hunting, forestry & fishing’ industry category
Other than ‘occupational category’, another approach to capture the number of intermediate to high skills workers
is to look at employment by industry category. The category relevant to this analysis is the “agriculture, hunting,
forestry and fishing industry”. When we cross-tabulate the same income categories with employment numbers in
that industry, a total of 47 000 and 20 000 are given in the ‘R2 501 to R80 00’ and the ‘R8 001 and above’ income
categories (Table 3). However, this total figure of 67 000 captures all workers in the agricultural sector in the relevant
income range and will therefore include people who work in the sector but who do not have agricultural qualifications.
It also, by definition, includes hunting, fishing and forestry workers. Therefore, we assume that the number of
intermediate and high skills workers with agricultural qualifications who work in the agriculture, hunting, fishing and
forestry industries will be less than the total number working in this sector who earns more than R2 500 per month.
Table 3: Workers by main industry and monthly income in 2004 (000 workers)
Total employmentAgriculture huntingforestry and fishingTotal employmentAgriculture huntingforestry and fishing
None277184
23.1%14.5%
R2501- R80002 943
4724.7%
3.7%
Source: LFS 2004 March p.29
R2500 or less6 968
99258.1%78.1%
R8001 or more1 004
208.4%1.6%
Total11 9841 271100%100%
LFS2004Mar
• Total includes “Don’t know” “Refused” or “Unspecified Income”• Figures in 000

C M Y CM MY CY CMY K
153
7.2.4 The presence of agricultural qualifications in the South African labour force
Having established that the number of agricultural workers with intermediate to high-level skills is probably higher
than 29 000 but lower than 67 000, it is possible to utilize another variable available from the Labour Force Survey
to test this assumption. The Labour Force Survey collected data on the number of “workers with degrees diplomas
and certificates by field of study”. The reference to ‘degrees, diplomas and certificates’ corresponds fairly closely
with qualifications in the FET and HET levels as defined for the purpose of this work:
• diploma/certificate with less than Grade 12/Std 10 (this group will include people below intermediate skills level)
• diploma/certificate with Grade 12/Std 10
• degree
• postgraduate degree or diploma
The number of workers who have degrees in the disciplinary field of “agriculture and nature conservation” was cross-
tabulated with monthly income. According to this method, there are 33 000 (19 000 plus 14 000) workers in the
economy within the salary ranges that we have taken to equate to intermediate and high skills levels in the ‘agriculture
and nature conservation’ field (Table 4). However, the data suggests that the actual number of workers with “degrees,
diplomas and certificates” in agriculture is 42 000. This implies that a number of workers with these qualifications
– about 21.4% - earn below R2 500, but because this number is under 10 000, it cannot be reliably specified.
Table 4: Workers with degrees diplomas and certificates by field of study and monthly income
Field of studyTotal employmentAgriculture and natureconservationTotal employmentAgriculture and natureconservation
None*-
--
R2501- R8000925
19
46.1%45.2%
Source: LFS 2004 March p.28
R2500 or less221
*
0.11%*
R8001 or more594
14
29.6%33.4%
Total2006
42
100%100%
LFS2004Mar
• Total includes “Don’t know” “Refused” or “Unspecified Income”• For all values of 10 000 or lower (see *) the sample size is too small for reliable estimates• Figures in 000
7.2.5 Summary of macro economic data on employment of agriculture qualifications
In summary, the Labour Force Survey of 2004 suggests that there are between 33 000 and 42 000 workers in the
labour force who hold degrees, diplomas and certificates in Agriculture and who work in the sector. This data provides
the best estimate available for establishing the total size of the agricultural workforce with intermediate to high skills.
While this estimation of the overall size of the intermediate to high-level skilled workforce is useful, we need to
understand more about how skilled workers are distributed within this workforce and what the current skills needs
are. The following section addresses these issues by examining data obtained at the enterprise level that reveals
the skills needs associated with particular agricultural activities.
7.3 Broad overview of the structure of the South African agricultural sector
In order to picture the variety of skills required to support the South African agricultural sector at the meso and micro
levels, as well as develop an understanding of the absorption of workers with intermediate to high-level agricultural
qualifications into the sector, it is necessary to understand the basic structure of the agricultural industry. Table 5
As with any attempt to simplify a large system that is characterised by multiple relationships and inter-relationships
between the various role-players, this schematic representation is a simplified model of the agricultural sector.

C M Y CM MY CY CMY K
154
Although it presents all major links adequately, it cannot capture all possible relationships: For example while seeds
are a direct input into the Plant Production group of activities, seed production is in itself a plant production activity,
with ‘Seeds’ being the output of this activity. Additionally, while the focus of animal production may be for a specific
purpose, dual outputs often result: e.g. meat and feathers in the case of Ostriches; and meat, wool and leather in
the case of sheep. Finally, a by-product of ‘Animal Production’ – manure – may be sold as a fertiliser input into Plant
Production activities, while the by-products of sugar-milling go into animal feed production. Despite these problems,
this representation of the broader agricultural sector provides some way of qualitatively tackling an analysis of the
requirements for skills within the sector. below provides a schematic representation of the sources of demand for
such skills in relation to the various areas of activity within the agricultural sector.
*4 As with any attempt to simplify a large system that is characterised by multiple relationships and inter-relationships betweenthe various role-players, this schematic representation is a simplified model of the agricultural sector. Although it presents all majorlinks adequately, it cannot capture all possible relationships: For example while seeds are a direct input into the Plant Productiongroup of activities, seed
Table 5: A Schematic Representation of the Agricultural Sector
D. NON SECTOR-SPECIFICINPUTS
• Specialist equipment, machinery & engineeringservices
• Water and Electricity
• Specialist packaging andlabelling suppliers
• Specialist transportation, logistics & storage services
• Specialist software and technology
C. SECTORSPECIFIC INPUTS
SeedsFertilizersCrop-Protection
Feeds Veterinary-ServicesAnimal HealthProducts
Chemicalpreservatives,supplements,detergents
PlantProduction
AnimalProductionincl. Aquiculture
B.
Basic Food &BeverageProcessing
FibreProcessing
Feed &SupplementProduction
Fruit & NutsGrains and OilseedsVegetables & HerbsTea & CoffeeOrnamental Plants & FlowersTobaccoCommercial ForestryFor CarcassFor By-Product (feathers, eggs, milk,honey, wool etc)For Conservation & TourismFish Hatcheries/FarmsB. SECONDARY AGRICULTUREFruit & NutsVegetables & HerbsGrains and OilseedsRed Meat, Poultry & FishDairyTea & CoffeeWoolCotton & FlaxLeatherWood
For Animal Production & Pets
• National & Provincial Government Departments & Institutions• Training & Skills Development• R&D• Specialist Financial Services• Agricultural Product Sales and Marketing Organisations• Retail Sector• Private Consulting Companies• Product & Industry Regulatory Boards and Quality Assurance Organisations
Professional, Consumer and Producer Associations and Societies
A. PRIMARY AGRICULTURE
E. GOVERNANCE AND SUPPORT SERVICES

C M Y CM MY CY CMY K
155
Thus the activities requiring formal skills may be associated with:
A. Primary Agricultural Activities - production of plants and animals
B. Secondary Agr icul tural Act iv i t ies – basic processing of pr imary agr icul tural products
C. Generating, Producing and Supplying Sector-Specific Inputs
D. Generating, Producing and Supplying Non Sector-Specific Inputs
E. Participation in Governance and Support Services
In Table 5 agricultural activities are presented in the large column on the right, under the headings ‘A. Primary
Agriculture’ and ‘B. Secondary Agriculture’. Primary agricultural activities can broadly be sub-divided into the
categories of ‘Plant Production’ and ‘Animal Production’, with activities within each of these broad categories e.g.
grain production. Secondary agricultural or basic processing activities, which feed directly off the primary agricultural
activities, can broadly be grouped into ‘Basic Food and Beverage Processing’, ‘Fibre Processing’ and ‘Feed and
Supplement Production’.
All forms of primary and secondary agriculture will require sector-specific inputs (presented in Column C.). For
instance, in the primary agricultural sector, plant production requires seeds, fertilizers and crop protection agents
while animal production requires feeds, supplements, veterinary services (including vaccines) and animal health
products. Within the secondary agricultural sector, specific inputs include chemical preservatives, supplements and
detergents.
Each agricultural activity also requires a set of other inputs, which while not necessarily specific to the industry, often
have developed specialised fields to support the agricultural sector (Column D). Such inputs include:
• Water and electricity services
• Specialist equipment, machinery and engineering services
• Specialist packaging and labelling services
• Specialist transportation, logistics and storage services
• Specialist information and communication technology service
Numerous institutions provide the governance and support services to the sector (Column E). While this group
consists of a large number of institutions often with overlapping functions, these can roughly be classified as:
• National and Provincial Government Departments and Institutions
• Training and Skills Development
• R&D
• Specialist Financial Services
• Agricultural Product Sales and Marketing Organisations
• Retail Sector entities
• Private Consulting Companies
• Product and Industry Regulatory Boards and Quality Assurance Organisations
• Professional, Consumer and Producer Associations and Societies
production is in itself a plant production activity, with ‘Seeds’ being the output of this activity. Additionally, while the focus of animalproduction may be for a specific purpose, dual outputs often result: e.g. meat and feathers in the case of Ostriches; and meat,wool and leather in the case of sheep. Finally, a by-product of ‘Animal Production’ – manure – may be sold as a fertiliser inputinto Plant Production activities, while the by-products of sugar-milling go into animal feed production. Despite these problems,this representation of the broader agricultural sector provides some way of qualitatively tackling an analysis of the requirementsfor skills within the sector.

C M Y CM MY CY CMY K
156
7.4 Formal skills distribution within the agricultural sector
Table 5 above provides a schematic representation of the agricultural sector including the main forms of interaction
between the various segments. Table 6 below provides an overview of the range of formal skills requirements based
on the categories and relationships identified in Table 5.
As skills tend to be ‘packaged’ within qualifications, the table below draws attention not only to the range of
qualifications but also to the knowledge areas associated with particular qualifications. As can be seen, while there
is certainly some overlap, each area of activity – ‘Primary Agriculture’ and ‘Secondary Agriculture’, ‘Sector Specific
Inputs’ and ‘Non-Specific Inputs’, as well as the activities around ‘Governance, Regulation and Support’ – tends to
have its own ‘group’ of knowledge field requirements.
The outline presented below reveals, first, that the intermediate and high-level skills required to support the agricultural
sector are not limited to those classified as ‘Agricultural’. Second, related qualifications such Zoology, Botany,
Entomology, Microbiology etc. are also required in the primary agricultural production group of activities. Notably,
these skills are also necessary to conduct activities within other parts of the agriculture sector. Third, non-agricultural
qualifications ranging from Engineering, Food Processing and Chemistry, to Finance and Management are equally
critical to the sector.
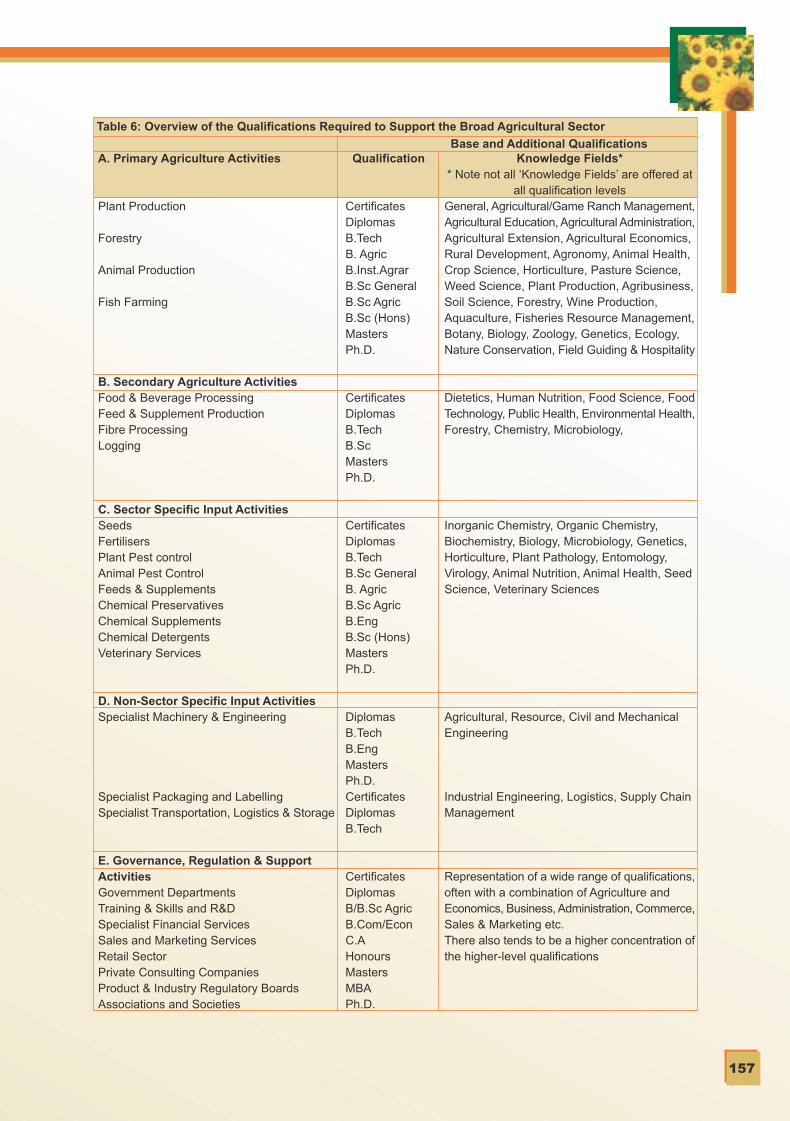
C M Y CM MY CY CMY K
157
Table 6: Overview of the Qualifications Required to Support the Broad Agricultural Sector
Base and Additional QualificationsA. Primary Agriculture Activities
Plant Production
Forestry
Animal Production
Fish Farming
B. Secondary Agriculture ActivitiesFood & Beverage ProcessingFeed & Supplement ProductionFibre ProcessingLogging
C. Sector Specific Input ActivitiesSeedsFertilisersPlant Pest controlAnimal Pest ControlFeeds & SupplementsChemical PreservativesChemical SupplementsChemical DetergentsVeterinary Services
D. Non-Sector Specific Input ActivitiesSpecialist Machinery & Engineering
Specialist Packaging and LabellingSpecialist Transportation, Logistics & Storage
E. Governance, Regulation & SupportActivitiesGovernment DepartmentsTraining & Skills and R&DSpecialist Financial ServicesSales and Marketing ServicesRetail SectorPrivate Consulting CompaniesProduct & Industry Regulatory BoardsAssociations and Societies
Qualification
CertificatesDiplomasB.TechB. AgricB.Inst.AgrarB.Sc GeneralB.Sc AgricB.Sc (Hons)MastersPh.D.
CertificatesDiplomasB.TechB.ScMastersPh.D.
CertificatesDiplomasB.TechB.Sc GeneralB. AgricB.Sc AgricB.EngB.Sc (Hons)MastersPh.D.
DiplomasB.TechB.EngMastersPh.D.CertificatesDiplomasB.Tech
CertificatesDiplomasB/B.Sc AgricB.Com/EconC.AHonoursMastersMBAPh.D.
Knowledge Fields** Note not all ‘Knowledge Fields’ are offered at
all qualification levelsGeneral, Agricultural/Game Ranch Management,Agricultural Education, Agricultural Administration,Agricultural Extension, Agricultural Economics,Rural Development, Agronomy, Animal Health,Crop Science, Horticulture, Pasture Science,Weed Science, Plant Production, Agribusiness,Soil Science, Forestry, Wine Production,Aquaculture, Fisheries Resource Management,Botany, Biology, Zoology, Genetics, Ecology,Nature Conservation, Field Guiding & Hospitality
Dietetics, Human Nutrition, Food Science, FoodTechnology, Public Health, Environmental Health,Forestry, Chemistry, Microbiology,
Inorganic Chemistry, Organic Chemistry,Biochemistry, Biology, Microbiology, Genetics,Horticulture, Plant Pathology, Entomology,Virology, Animal Nutrition, Animal Health, SeedScience, Veterinary Sciences
Agricultural, Resource, Civil and MechanicalEngineering
Industrial Engineering, Logistics, Supply ChainManagement
Representation of a wide range of qualifications,often with a combination of Agriculture andEconomics, Business, Administration, Commerce,Sales & Marketing etc.There also tends to be a higher concentration ofthe higher-level qualifications

C M Y CM MY CY CMY K
158
Fourth, there are multiple sites of application of skills and qualifications in the sector. Individuals with necessary
qualifications have the ability to move about relatively freely between the various activities within the sector and
even the ability to move between the agricultural and other sectors within the South African economy.
Based on the foregoing analysis and the frameworks represented in Table 5 and Table 6, a more detailed discussion
of the range of skills requirements needed to support various agricultural activities will now be presented. This is
based an intensive phase of data gathering in which documentary information and interviews with representatives
of a large number of selected enterprises were undertaken. Please refer to the section on Methodology for further
background on the methodology utilised in this chapter.
The information obtained from the various telephonic interviews served to confirm and refine the schematic map
(Table 5) of the various areas of skill-requirements within the industry. Exploratory micro- and meso-level qualitative
and quantitative demand-side findings obtained from the individual interviews are presented below as examples
or case-studies of skills demands within the various areas of the domestic agricultural industry.
7.5 Current employment and demand for agricultural skills
This discussion regarding the demand for agricultural qualifications within the labour market will follow the outline
below (as presented in Table 5):A. Primary Agricultural ActivitiesB. Secondary Agricultural ActivitiesC. Sector-Specific InputsD. Non Sector-Specific InputsE. Governance and Support Activities
Each sub-section will briefly describe the extent of the activities which are included, and where possible refer to
examples of requirements for agricultural qualifications.
A. PRIMARY AGRICULTURE ACTIVITIES
In line with its diverse climate, South Africa has a diverse primary agricultural sector, which includes both intensive
as well as extensive farming, and large commercial as well as small subsistence farming operations. Table 7 below
provides a broad overview of the main areas of primary agricultural production:
Table 7: Overview of South African Primary Agricultural OutputsAnimal Production Plant Production
General LivestockAlpacasGoatsSheep – MuttonSheep – WoolBeefDairyPorkPoultryHorsesDonkeysOstrichesGameBeekeepingSnailsRabbitsRabbits - WoolAquacultureCrocodiles
MaizeWheatOatsBarleySorghumDry BeansS u n f l o w e r sCanolaGroundnutsS u g a r c a n eTobaccoHempFlax and SisalCottonChicoryCoffeeTeaWineNuts
HerbsFodder CropsForestry and TimberGeneral HorticultureCut Flowers & Ornamental PlantsFynbosIndigenous Medicinal PlantsDeciduous FruitBananasMangoesAvocadosCitrus FruitOlivesGeneral VegetablesPotatoesTomatoesOnionsPaprikaGarlic
Source: National Agricultural Directory 2004/5

C M Y CM MY CY CMY K
159
Primary production of plants and animals takes place mainly on farms. The people who manage these facilities may
either be farm owners, managers or foremen. The Census of Commercial Agriculture (2002) reveals that within the
nine provinces of South Africa there were 35 538 farm-owners who farm themselves, as well as a further 23 747
farm managers and foremen. Thus the total number of owners and managers employed within the primary production
of agricultural products was 59 285. This number excludes all family members involved in farming operations, full-
time farm workers and casual and seasonal workers, a portion of whom may also have formal agricultural skills.
The distribution of formal agricultural qualifications within the groups of farm-owners and farm-managers is difficult
to ascertain. Various respondents suggested that the distribution of formal qualifications is likely to be higher in the
group of managers and foremen than in the group of farm-owners. Although farming specific work-experience
remains key, the formalized nature of the employment of farm managers and foremen is generally associated with
a requirement for some form a qualification. On the other hand, farm-owners who have often inherited the land are
more likely to have acquired the necessary skills from a parent mentor.
The proportion of formal qualifications appears likely to increase within both groups into the future. Educators within
the Agricultural Colleges suggest that due to uncertainty over the long-term prospects of the sector as a stable and
desirable working environment as well as increasing demands on the efficiency of production, more farmers are
insisting that their inheriting children receive some form of agricultural qualification.
As a result of increased competition due to market deregulation as well as the tendency towards mechanisation,
large commercial farming operations are also indicating that their recruitment strategies have recently changed to
employ the minimum qualification of N.Dip.Agric into their manager and foremen positions.
In order to gain some understanding of the requirements for agricultural qualifications among large-scale commercial
producers, three case-studies were undertaken (see below). From these, it seems that there is an increasing
tendency for large agricultural enterprises to become vertically integrated as quality and productivity improvements
in the supply-chain are pursued. As such they are involved in both the production as well as the primary processing
of agricultural products (i.e. primary and secondary agricultural activities). However, even though these enterprises
engage in secondary agricultural activities, it is important to observe that the agricultural qualification requirements
within these enterprises are almost exclusively required for the primary agricultural portion of their activities.
Case Study: Rainbow Chickens
Rainbow Chickens has three main areas of production: Pietermartizburg/Durban (50 farms); Worcester (37 farms)
and the Highveld (40 farms) i.e. 127 in total. Each of these farms requires a ‘Farmer’ as well as a ‘Senior
Poultryman’ and a ‘Poultryman’. In addition to this, one ‘Senior Farmer’ will oversee around 5-6 ‘Farmers’, and
will in turn report to one company ‘Breeding Manager’ and one company ‘Agricultural Manager’. While all
employees from ‘Senior Farmer’ upward have agricultural qualifications, the firm estimates that currently around
60% of ‘Farmers’, 40% of ‘Senior Poultrymen’ and 20% of ‘Poultrymen’ have got agricultural qualifications.
Yet the firm is struggling to find suitably qualified and experienced ‘Farmers’, particularly in the Western Cape
and KZN, with 10 vacancies at present. The Highveld region appears less affected due to the proximity of other
large Poultry Producers in the area (Early Bird, Sangiro, Chubby-Chick, Henwell and Daybreak).
In attempt to ensure more effective succession, the firm’s future strategy is for all people recruited into the
‘Poultryman’ position to have a minimum of a N.Dip.Agric (Animal Production), so that with experience and
additional courses, these people may be developed into ‘Farmers’. Thus without taking the firm’s potential growth
into account – the demand for formal agricultural qualifications will increase from the current 175 to a figure of
404 over the short to medium term future.
C M Y CM MY CY CMY K
160
Summary
There is clearly a high demand for agricultural qualifications at the level of primary agriculture, although exact levels
of high skills, particularly among the group of farm-owners who farm themselves, is very difficult to determine due
to the fragmented nature of this group. Among commercial farms, our case studies suggest an increasing demand
for formal agricultural qualifications to a minimum level of N.Dip.Agric. Agribusiness employers see the speciality
within an agriculture qualification (i.e. Animal Production versus Plant Production) as increasingly important.
B. SECONDARY AGRICULTURE ACTIVITIES
Secondary agriculture is defined as the primary stage of processing of agricultural products and while these activities
can be distinguished from manufacturing, the line is often not precise. Thus taking a broader view of what might
be included as secondary agriculture, a number of companies were contacted to obtain their input regarding the
needs for agricultural qualifications.
Leather
Refined leather manufacturing firms such as Automotive Leather Company, Hannitan Leathers, Gringo Leathers
and Seton source raw material from tanneries such as Bader SA, EAC Tannery and Hidskin. These firms process
the leather from the wet-blue stage, which they obtain from abattoirs. Neither of these levels of leather-manufacturing
firms require any agricultural qualifications. The ‘International School of Tanning Technology’ based in Grahamstown
in the Eastern Cape, supplies the tanning industry’s important skills requirements. This institution offers the Higher
National Certificate in Leather Technology, which covers all aspects of leather-making.
Case Study: Bull Brand Foods and Karan Beef
Both these firms have large feedlots with activities that span Animal Procurement, Animal Production, Animal
Health, Abattoir, Meat Processing, Marketing and Logistics. At Karan Beef only one of the six feedlot managers
has an agricultural qualification, while a similar picture emerges for the five middle managers at Bull Brand Foods.
Bull Brand Foods reports that its strategy is to replace these positions only with people who have agricultural
qualifications (Animal Production), and that it is increasing its involvement in skills development through offering
students practical holiday experience. Furthermore the firm reports that it is attempting to form recruitment
relationships with Universit ies for direct acquisit ion of the skil ls they require in future.
Karan Beef on the other hand, is more concerned about the lack of Abattoir managers and those with meat
processing skills, with a focus on internal Learnerships taking place at present. Recruitment for additional key
skills will apparently continue to be via the local newspaper, with experience rather qualifications the main
requirement.
Case Study: McCains Vegetables
The South African portion of this multi-national organisation sources the produce that it processes both from its
own farms as well as from privately owned farms. The McCains Agricultural Team consists of over 40 people
with agricultural qualifications, predominantly with a focus on Plant Production and Horticulture. The team is
divided into a Farming Section (farm managers and assistant managers +/- 20) and a Procurement Section
(agricultural extension off icers +/- 15, procurement and supply-chain managers +/- 5).
Assistant managers may be promoted up from the ranks within the organisation and will be assisted in gaining
the minimum N.Dip.Agric (Plant Production) that is required. Recruitment for positions is generally via national
newspapers, although very high-level agricultural skills are recruited via a private recruitment agent (Marianne
van der Laarse from SA Veg). The firm reports to having problems in meeting EE requirements in respect of its
agricultural appointments, particularly at the higher levels.
C M Y CM MY CY CMY K
161
Qualifications are awarded through PE Technikon with external examination obtained from University College
Northampton in the UK. The abattoirs, which in essence provide the primary stage of leather processing - harvest
to wet-blue - also do not require any agricultural qualifications. This is the case for all forms of leather: bovine, sheep
and ostrich. Skills shortages in this sector were however noted in respect of abattoir managers as well as graduates
from the Grahamstown based ‘Tanning School’.
Wool Processing
Firms such at the Stucken Group and Cape of Good Hope Wool Combers both report that they have no agricultural
qualifications requirements. New employees require a mix of basic skills and on-the-job training in order to develop
specific wool and mohair knowledge. Employers argue that the problem in terms of skills for the industry does not
relate to a lack of specific qualifications, but rather that the poor image of the industry – as non-dynamic and
contracting – is preventing young people with vision and motivation from entering the industry at all.
Cotton Processing
Clark Cotton, which has the capacity to process around 50% of South Africa’s raw cotton, reports that it has no need
for agricultural qualifications. Skills are acquired on-the-job, with formal Learnerships not in place yet. The most
urgent formal skills requirements relate to mechanical and process engineering.
Tea Processing
The South African Honeybush Tea Association (SAHTA) reports that while the farmers who own 50% of the association
may indeed have agricultural qualifications, there is no need for such qualifications among the employees at the
tea-processing factory. This production facility requires Food Technology qualifications as well as production
management skills. All necessary research is outsourced to large specialist agricultural research organisations.
Fruit and Vegetable Processing
SAD Foods, which specialises in dried fruit and vacuum-packed fresh salads, employs around 680 people with only
nine of these involved in research and development activities. The vast majority of these have Food Technology
qualifications rather than a formal agricultural qualification. Ceres, the producer of fresh fruit juices, reports a similar
lack of need for agricultural qualifications within its processing facility.
Herb Processing
Ina Paarman Kitchens employs Food Technology and not agricultural qualifications within their Cape Town based
operation of over 100 people. Similarly Robertson’s Herbs and Spices, a division of Unilever, does not employ any
specific agricultural skills.
Milk Processing
Clover and Parmalat both report that milk processing requires only Food Technology qualifications for both production
as well as quality assurance. While Clover admits that it does indeed have a few employees with formal agricultural
qualifications who are working as Field Officers in managing the productivity of collection routes, these qualifications
are incidental, with B.Com graduates generally filling these positions. Neither of these companies provides direct
farmer support; however they do refer farmers to private consulting firms who are able to assist with problems.

C M Y CM MY CY CMY K
162
Sugar Milling
Tongaat Hulett Sugar reported that the sugar milling process does not require any employees with agricultural
qualifications, being instead a highly industrial process dominated by engineering skills requirements. As milled
sugar cane is sold on to sugar refineries, the demand for Food Technologists resides at these firms rather than at
the mills. Interestingly, Tongaat Hulett Sugar is a vertically integrated company. In addition to its milling operations,
it owns a number of sugar-producing farms as well as an animal feed production division (Voermol Feeds), both
of which do require the input of agricultural graduates.
Animal Feed and Supplement Production
The feed manufacturing companies contacted indicated that they did have a requirement for people with agricultural
qualifications, a finding which is unsurprising given that the output from this activity is a major input into the primary
agricultural sector. The skills requirements of the Animal Feed and Supplement Production sub-sector will be
discussed in the section on sector-specific inputs below.
Wine
The production of wine is in many instances vertically integrated with or closely related to, the production of wine-
grapes. Formal qualifications in Viticulture provide the specialised agricultural qualifications required for both activities,
with this only offered at a few selected tertiary institutions in the Western Cape rather than as part of the general
agricultural qualifications presented through the majority of agriculturally focussed institutions.
Summary
Clearly the demand for agricultural qualifications within the basic food and beverage processing and fibre processing
portions of the secondary agricultural sector is small, with the single exception of the production of wine. The skills
required by the secondary agricultural sector involved in basic food and beverage processing are predominantly
Food Technology and Process/Industrial Engineering. Only the latter group of skills are required in the sub-sector
involved in fibre processing, with the evidence suggesting that at the moment more of their specific skills requirements
are being developed through in-house training or through attendance at specialised niche training institutions.
C. SECTOR-SPECIFIC INPUTS
In trying to understand the formal skills requirements of the various players who provide sector-specific inputs into
the primary and secondary agricultural sectors, large and well-established companies operating within the main
groups of activities were contacted and the findings generated from this research are presented below.
Seeds
The South African National Seed Organisation (SANOR) represents 66 seed manufacturing companies who in total
employ around 3 000 employees. The National Agricultural Directory 2004/5 lists a further 40 companies who are
involved in seed and seedling production, bringing the total number of firms in this sub-sector to over one hundred.
The qualification needs of two of the larger companies involved in these activities, Pannar Seed and Syngenta, are
presented in Table 8 below. Pannar Seed is a locally owned company that has a large global export focus while
Syngenta is a multi-national company focussed mainly on crop protection, but which also has a seed division. The
ownership and primary market focus of these two companies determines to a large extent their skill requirements
within South Africa: Panner has a large locally based R&D division and is producing locally for export (large local
skills demand), while Syngeta SA draws to a large extent from R&D done internationally and is focussed mainly
on production for the local market (smaller local skills demand).

C M Y CM MY CY CMY K
163
What is clear is that the agricultural skills requirement of these companies is generally high and with Pannar’s new
recruitment policy of only bringing agricultural graduates into its sales positions, the requirements are going to
increase over time. While the company reported that they did not generally struggle to find the relevant qualifications
(outside of Seed Scientists), adequate competencies, which they defined as the combination of qualification, skills
and the ability to get the job done, were however in short supply.
Fertilizers
Five of the largest fertiliser companies within the 14-member Fertiliser Society of South Africa (FSSA) were contacted
to determine their requirements for agriculturally qualified personnel (See Table 9 below). This exercise revealed
that only firms within the fertilizer industry that deal directly with end-user clients (i.e. farmers), require people with
agricultural qualifications.
Requirements generally fall into three categories: Marketing Managers, Agronomists and Sales Agents, with
qualifications mainly at the level of N.Dip/B.Tech/B.ScAgric with a focus on Plant Production or Soil Science. While
not all people currently employed as Sales Agents have these qualifications, all four firms noted their intentions to
only recruit people in future who have the minimum N.Dip.Agric. It is clear that the focus is on moving towards
recruitment of formal qualifications as a baseline with subsequent upgrading the average level of skill within these
organisations. However, it is notable that all companies mentioned the importance of employees within their
organisations passing the ‘Fertilizer Advisor’s Training Course’ which the FSSA has developed in co-operation with
the Tshwane University of Technology (TUT).
Table 8: Overview of the Distribution of Agricultural Qualifications within Pannar Seed Ltd. and SyngentaSeed Division
Board ofDirectors
R&DMarketing &Sales Agents
ExportProduction
ProcessingFactoryTOTAL
Division
Pannar5
601633
(16)10/20
10
64
160
Syngenta0
3100023
18
N.Dip Agric to Ph.D.
M.Sc to Ph.D.B.Sc / B.Tech / B.AgricN.Dip.AgricMatric only at presentAgricultural EconomicsN.Dip.Agric to M.Sc. AlsoB.Eng (Agric)N.Dip.AgricN.Dip.Agric
Positions RequiringAgricultural
Qualifications
With recruitment focused on Graduates,the qualifications at the top level will alsogradually increase over timeDifficult to find experienced Seed ScientistsWhile only 25% of the Pannar sales teamare currently agricultural graduates thestrategy is to only recruit Graduates in futureOther 10/20 are B.Com graduates
Total Demand Figure
Range of AgriculturalQualifications
Comments
Table 9: Requirements for Agricultural Qualifications in Four Large Local Fertilizer Companies
WithQualifications
0
180
391516
Comments
Does not deal with ‘end-users’ butsells chemicals to other companiesSuspect that all sales agents havequalifications, but not sure
Total0
172
6210063
WithoutQualifications
0
0
106544
Sales Agents
368
CompanyFoskor
Sasol Nitro
OmniaKynnochProfertTOTAL
MarketingManagers
0
6
521
12
Agronomy0
6
8182
36

C M Y CM MY CY CMY K
164
Crop Protection
An overview of the requirements for agricultural qualifications within the plant health divisions of two of the large
companies operating in the sector, Syngenta and Beyer, (see Table 10) reveals that the demand in this area of the
market is large as well as diverse. At sales agent level, which through an informal national network appears to serve
the majority of producer firms within the agrochemicals industry, the entry-level qualification is now a B.Tech.Agric,
while for management, R&D, technical or production positions within the agrochemical producer firms themselves,
the minimum entry requirement is even higher.
Animal Health
The South African Animal Health Association (SAAHA) has 15 member organisations, although a further 11 companies
are also involved in this business in South Africa. While the most important qualification required by these organisations
is Veterinary Science, a number of people with agricultural qualifications do find employment as sales agents.
Agricultural qualifications with Animal Health specialisation are however part of a basket of qualifications accepted
for this position by these firms, as all SAAHA members are required to have their sales gents pass the Association
of Veterinary and Crop Associations of South Africa (AVCASA) Animal Health course developed in co-operation
with, and presented by, the Tshwane University of Technology (TUT).
The administrators of the AVCASA Animal Health course at TUT report that a total of 320 people have received the
certificate and are now working as sales agents within the Animal Health sector. TUT do not unfortunately collect
information on graduates’ previous qualifications and were thus unable to indicate the numbers of those who enrolled
who held agricultural qualifications. Afrivet, one of the companies operating in the sector, however estimated that
around 20% of their Sales Agents had agricultural qualifications, while Beyer Animal Health estimated the figure to
be around 35%. As these qualifications are incidental rather than required, this number would not necessarily
contribute to the overall demand for agricultural qualifications within the South African labour market.
Animal Feed and Supplement Production
The Animal Feeds Manufacturing Association (AFMA) has 22 full members and a further 19 associate members.
A number of non-member companies are also involved in the Animal Feeds sector in South Africa. Figures from
three of the full-member companies, Epol, Meadow Feeds and Bokomo Feeds provide some indication of the
requirements for agricultural qualifications within the sector. Most notably, people with B.Sc.Agric in Animal Nutrition
are required to fulfil three key functions within these firms: sales agents; feed formulators; and technical managers.
Table 10: Distribution of Agricultural Qualifications in the Plant Pest Control Divisions ofBeyer and Syngenta
Syngenta
6
139001038
Comments
Does not deal with ‘end-users’ but sells chemicals toother companiesSuspect that all sales agents have qualifications, butnot sure
While the older employees among this group do nothave formal qualifications, minimum entry level iscurrently B.Tech. Agric
Beyer Crop Sciences
-15206358
57
Agricultural QualificationsDivision
DirectorsR&DTechnicalMarketingExportProductionSales MangersTOTALSales Agents atagrochemicalsdealer network
750
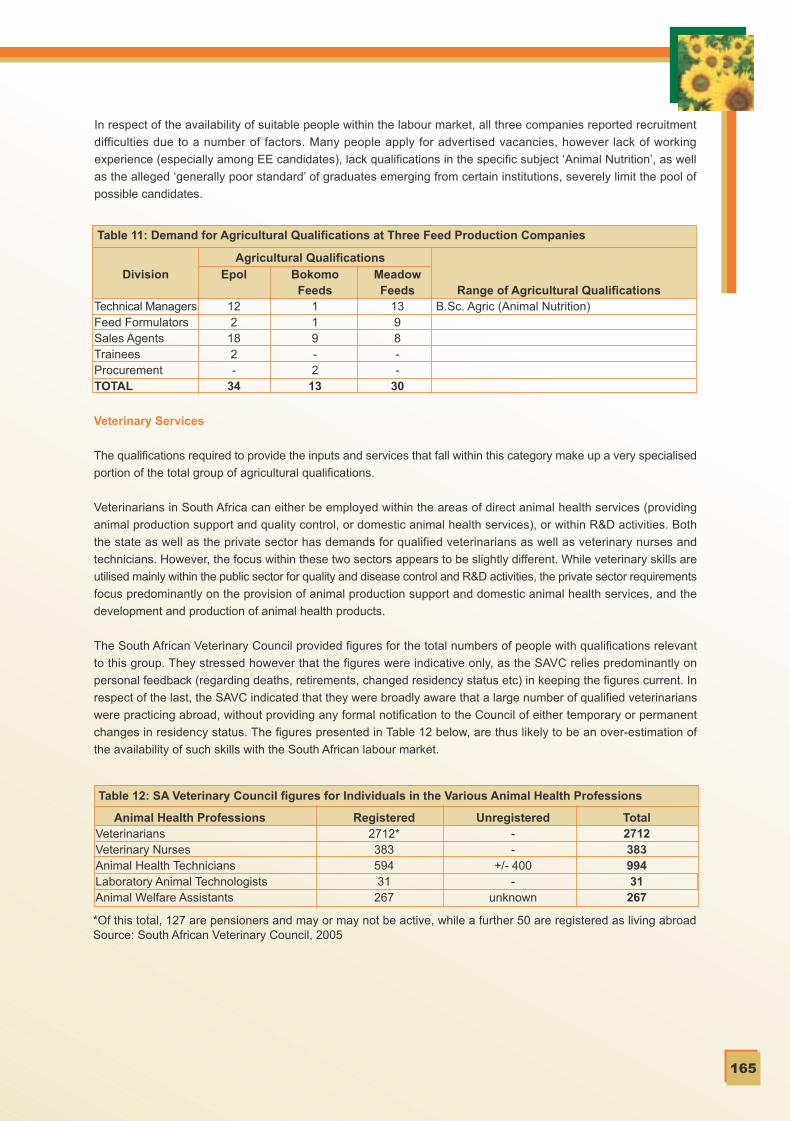
C M Y CM MY CY CMY K
165
In respect of the availability of suitable people within the labour market, all three companies reported recruitment
difficulties due to a number of factors. Many people apply for advertised vacancies, however lack of working
experience (especially among EE candidates), lack qualifications in the specific subject ‘Animal Nutrition’, as well
as the alleged ‘generally poor standard’ of graduates emerging from certain institutions, severely limit the pool of
possible candidates.
Table 11: Demand for Agricultural Qualifications at Three Feed Production Companies
Epol
122182-
34
Range of Agricultural QualificationsB.Sc. Agric (Animal Nutrition)
BokomoFeeds
119-2
13
Agricultural QualificationsDivision
Technical ManagersFeed FormulatorsSales AgentsTraineesProcurementTOTAL
MeadowFeeds
1398--
30
Veterinary Services
The qualifications required to provide the inputs and services that fall within this category make up a very specialised
portion of the total group of agricultural qualifications.
Veterinarians in South Africa can either be employed within the areas of direct animal health services (providing
animal production support and quality control, or domestic animal health services), or within R&D activities. Both
the state as well as the private sector has demands for qualified veterinarians as well as veterinary nurses and
technicians. However, the focus within these two sectors appears to be slightly different. While veterinary skills are
utilised mainly within the public sector for quality and disease control and R&D activities, the private sector requirements
focus predominantly on the provision of animal production support and domestic animal health services, and the
development and production of animal health products.
The South African Veterinary Council provided figures for the total numbers of people with qualifications relevant
to this group. They stressed however that the figures were indicative only, as the SAVC relies predominantly on
personal feedback (regarding deaths, retirements, changed residency status etc) in keeping the figures current. In
respect of the last, the SAVC indicated that they were broadly aware that a large number of qualified veterinarians
were practicing abroad, without providing any formal notification to the Council of either temporary or permanent
changes in residency status. The figures presented in Table 12 below, are thus likely to be an over-estimation of
the availability of such skills with the South African labour market.
Table 12: SA Veterinary Council figures for Individuals in the Various Animal Health Professions
Registered2712*38359431
267
Unregistered--
+/- 400-
unknown
Animal Health ProfessionsVeterinariansVeterinary NursesAnimal Health TechniciansLaboratory Animal TechnologistsAnimal Welfare Assistants
Total271238399431
267
*Of this total, 127 are pensioners and may or may not be active, while a further 50 are registered as living abroadSource: South African Veterinary Council, 2005

C M Y CM MY CY CMY K
166
Demand-side data for the private sector was not possible to obtain, however the data from a recent study (April
2005) commissioned by the Department of Agriculture on the demand for veterinary qualifications within the
government system (see Table 13 below) reveals that the supply of suitable skills is substantially below demand
within the various government departments. For example, of all the government veterinary posts (at National,
Provincial and Laboratory Level) only 59% are currently filled (185 out of 314). Similarly only 74% of government
posts for Animal Health Technicians (1,055 out of 1,423) are currently filled. Total government demand, including
veterinary, administrative, technical and auxiliary animal health staff, is reported to be 2 358 positions with a large
number (564) of unfilled positions.
As veterinary and related qualifications are required to support the agricultural sector not only through the government
system, but also via their R&D inputs into animal health product development and the teaching of Animal Health
as a subject at both Colleges and Universities, a shortage of these skills is likely to have substantial negative impacts
on the domestic agricultural sector as a whole.
Chemical Preservatives, Supplements and Detergents
There does not appear to be any requirement for agricultural qualifications within the firms that supply the sector
with input products such as chemical preservatives, supplements and detergents. Qualifications required here
however include Organic-, Inorganic- and Bio-Chemistry, Chemical Engineering, Bio-Technology and Food Technology.
Summary
The analysis reveals that there is a relatively high demand for formal agricultural qualifications among the firms that
produce and provide primary agriculture sector-specific input products and services. While some of these firms are
very explicit in their requirements (e.g. B.Sc.Agric (Animal Nutrition) for Feed Producing firms), other firms such as
those in seed production require a large basket of skills within the wider grouping of natural sciences, of which
agricultural skills form only a part. Enterprises involved in producing specific inputs required for the secondary
agricultural sector (eg: chemical preservatives, supplements and detergent manufacturers) have no apparent
requirements for agricultural skills.
D. NON SECTOR-SPECIFIC INPUTS
Non sector-specific inputs into agriculture can be classified into three key groups:
• Equipment, services and information that relate to resource use and management
• Machinery and vehicles; and
• Infrastructure, tools and technology.
Table 14 provides a summary of the input types that fall under each of the three main categories, as well as the
numbers of enterprises involved in the provision of each (as outlined within the National Agricultural Directory
2004/2005).
Table 13: Government Demand for Animal Health Personnel
ServiceNationalProvincialLaboratoryTotalPercentage
Filled
1714820
18559%
Veterinary Posts Administrative Posts Technical Posts Border & Redline PostsVacant
328017
12941%
Total
4922837
314100%
Filled
2524338
30682%
Vacant
9451367
18%
Total
3428851
373100%
Filled
2395181
105574%
Vacant
2230838
36826%
Total
451259119
1423100%
Filled
0248
0248
100%
Vacant
0000
0%
Total
0248
0248
100%

C M Y CM MY CY CMY K
167
The diversity and scope of the firms that fall into this group is large. A full survey of the skills needs of these enterprises
would have been necessary to understand the overall demand within this portion of the sector and was not within
the scope of this study. However, certain deductions regarding their agricultural skills requirements were made:
• Companies that are involved in direct end-user sales or services across the three categories are likely to require
a certain number of agricultural qualifications to provide a professional and knowledgeable interface with farmer
clients.
• The requirement for Engineering qualifications is likely to be high, particularly in companies that design and
produce equipment locally rather than merely import and distribute equipment. The extent to which the need
for engineering skills is restricted to Agricultural Engineering as opposed to Mechanical or Civil Engineering is
uncertain.
• The very generalized market focus of some of these inputs (cars, bakkies, tyres and lubricants), as well as the
level of specialization within others (solar and bio-energy, weather and climate, and software technology),
suggests that for certain areas there is relatively small need for any agricultural qualifications despite the
importance of these inputs to the sector.
• While certain jobs within this range of activities may not specifically require formal agricultural qualifications, it
is likely that interest in agriculture (referred to in job advertisements as either attendance at an Agricultural High
School, or previous agricultural experience) may give certain applicants an advantage over others for positions
(see Appendix 5).
E. GOVERNANCE AND SUPPORT ACTIVITIES
NATIONAL & PROVINCIAL GOVERNMENT DEPARTMENTS AND INSTITUTIONS
National and Provincial government demand
Department of Agriculture (DoA) as well as the nine Provincial Departments of Agriculture (PDA) are collectively
large employers of people with agricultural qualifications. Data on employment and demand for such qualifications
in 2005 is presented in Table 15 and 16 below.
The largest requirement for agricultural qualifications is within the line function directorates, which provide direct
support to the agricultural sector (see job descriptions in Table 16). Agricultural qualifications also reside within the
various management structures of Departments. As people are promoted into more senior management positions,
this fuels demand through the creation of vacancies at lower levels which then need to be filled by employees with
the necessary qualifications.
Table 14: SA Veterinary Council figures for Individuals in the Various Animal Health Professions
1715
101255
358
1153
3556151715
836
Equipment Services & InfoRelated to Resource Use and
ManagementSolar EnergyElectricityBio-EnergyWater StorageBoreholes & WindmillsIrrigationHydroponicsFertigationWater ManagementSoilBiodiversityWeather and Climate
Machinery and Vehicles
Tractors, Combines and BalersImplements and TrailersMotor Cars, Bakkies and 4x4’sTrucks and Heavy MachineryTyresFuels and LubricantsFleet Maintenance & Spares
Infrastructure tools andTechnology
PackagingFencingStructure & Building SupplyCovered GrowingLivestock RelatedTools & Power ToolsPumps & GeneratorsMiscellaneousAgric Software TechnologyGISPrecision Farming ManagementSystems
2513222725193335171210
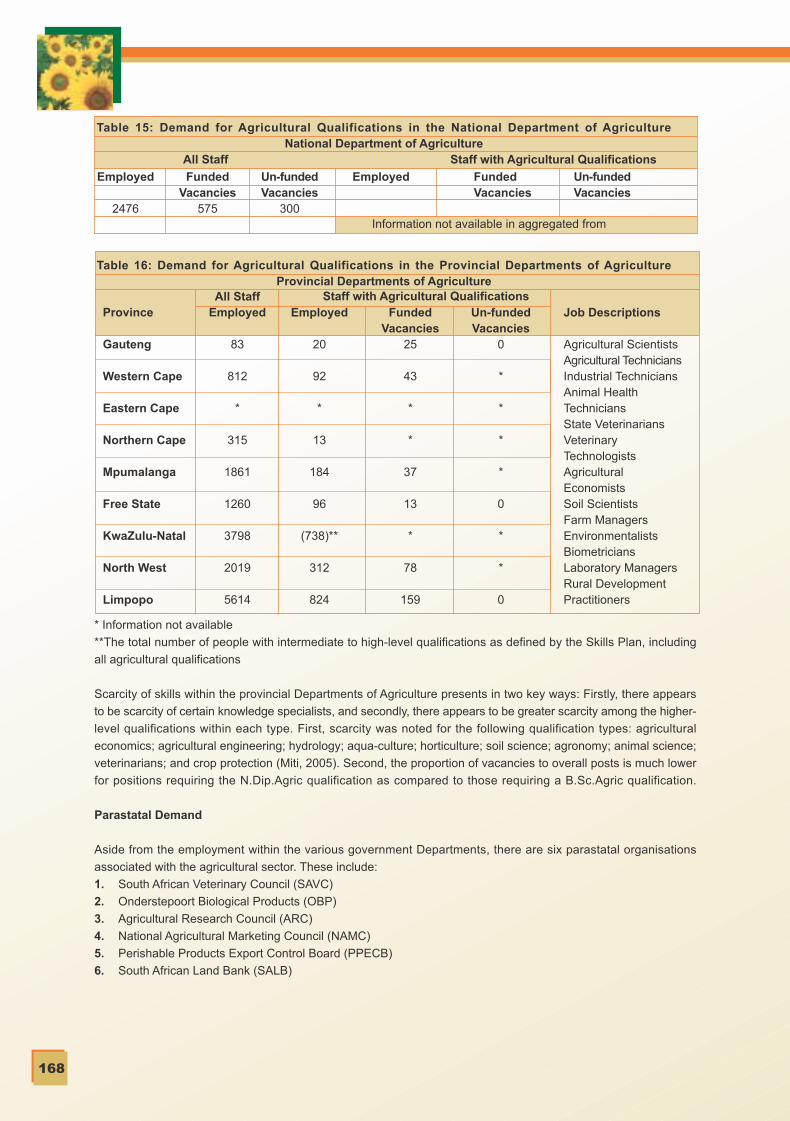
C M Y CM MY CY CMY K
168
Table 15: Demand for Agricultural Qualifications in the National Department of AgricultureNational Department of Agriculture
All Staff Staff with Agricultural Qualifications
Employed
2476
FundedVacancies
575
Un-fundedVacancies
300
Employed FundedVacancies
Un-fundedVacancies
Information not available in aggregated from
Province
Gauteng
Western Cape
Eastern Cape
Northern Cape
Mpumalanga
Free State
KwaZulu-Natal
North West
Limpopo
All StaffEmployed
83
812
*
315
1861
1260
3798
2019
5614
Employed
20
92
*
13
184
96
(738)**
312
824
FundedVacancies
25
43
*
*
37
13
*
78
159
Un-fundedVacancies
0
*
*
*
*
0
*
*
0
Job Descriptions
Agricultural ScientistsAgricultural TechniciansIndustrial TechniciansAnimal HealthTechniciansState VeterinariansVeterinaryTechnologistsAgriculturalEconomistsSoil ScientistsFarm ManagersEnvironmentalistsBiometriciansLaboratory ManagersRural DevelopmentPractitioners
Table 16: Demand for Agricultural Qualifications in the Provincial Departments of AgricultureProvincial Departments of Agriculture
Staff with Agricultural Qualifications
* Information not available
**The total number of people with intermediate to high-level qualifications as defined by the Skills Plan, including
all agricultural qualifications
Scarcity of skills within the provincial Departments of Agriculture presents in two key ways: Firstly, there appears
to be scarcity of certain knowledge specialists, and secondly, there appears to be greater scarcity among the higher-
level qualifications within each type. First, scarcity was noted for the following qualification types: agricultural
economics; agricultural engineering; hydrology; aqua-culture; horticulture; soil science; agronomy; animal science;
veterinarians; and crop protection (Miti, 2005). Second, the proportion of vacancies to overall posts is much lower
for positions requiring the N.Dip.Agric qualification as compared to those requiring a B.Sc.Agric qualification.
Parastatal Demand
Aside from the employment within the various government Departments, there are six parastatal organisations
associated with the agricultural sector. These include:
1. South African Veterinary Council (SAVC)
2. Onderstepoort Biological Products (OBP)
3. Agricultural Research Council (ARC)
4. National Agricultural Marketing Council (NAMC)
5. Perishable Products Export Control Board (PPECB)
6. South African Land Bank (SALB)

C M Y CM MY CY CMY K
169
Onderstepoort Biological Products notes that while it currently does employ a number of people with agricultural
qualifications with an Animal Health speciality, the employment of these skills is incidental and would not be accepted
if sufficient people with veterinary technician qualifications could be sourced. Thus despite the fact that the institution
is employing people with agricultural qualifications as a second best option, in the absence of sufficient veterinary
technicians, this is contributing to a form of substitution demand for agricultural qualifications in the labour market
demand, which will last for as long as the first-choice skills are in short supply.
The South African Veterinary Council employs only six people, all performing administrative functions. None of these
have agricultural qualifications. Specific demand for agricultural qualifications exists at all the remaining parastatal
organisations. An overview of this demand is provided in Table 17 below, however further discussion of these
organisations can be found below as they engaged in various service activities (e.g. for ARC see section on Demand
for Qualifications at R&D Institutions).
Table 17: Requirements for Agricultural Qualifications within the Parastatal Organisations
ParastatalOrganisationARCLand BankNAMCPPEBCOPBSA Vet CouncilTOTALS
Total PermanentEmployment
267065021332206
63885
Vacancies for Agricultural QualificationsEmployees with
AgriculturalQualifications
734355
257
1031
Funded20302
35
Un-funded0000
0
EDUCATION & SKILLS DEVELOPMENT
While these institutions and organisations are key to the supply-side of any skills analysis, the organisations
themselves, in terms of their staffing requirements, are an important source of demand for high-level skills. Included
in this group are:
• Schools offering the subjects Agricultural Science, Animal Husbandry, Field Husbandry, and/or Farm Mechanics
• FET Colleges offering Agricultural Courses
• Agricultural Colleges
• Universities and Universities of Technology offering Agricultural Qualifications
• Private Enterprises or NGO’s Offering Training for the Agricultural Sector
Demand for agricultural qualifications among teachers at schools
As discussed in the supply-side section of this report, there are a large number of general high schools that offer
Agricultural Science as a subject in addition to the 42 specialised Agricultural High Schools across South Africa. In
2003 a total of approximately 60 660 pupils took Agricultural Science as a subject in Grade 12 in 2 645 high schools
offering the subject.
Based on the ideal assumption that every high school offering Agricultural Science will have at least one qualified
teacher providing instruction in this subject, the minimum demand for Agriculturally qualified teaching staff would
be 2 645. In respect of this rough estimation it is also well known that not all teachers of Agricultural Science in
South African high schools are qualified to teach the subject and level that they do. Further analysis of the numbers
of staff at High Schools who have agricultural qualifications and are teaching the subject may be worthwhile.

C M Y CM MY CY CMY K
170
Demand for agricultural qualifications among staff at agricultural colleges
Due to the smaller number of Agricultural Colleges, it was possible to obtain exact data for the staffing requirements
at these institutions. The findings are presented in Table 18 below, which reveals a current total figure of 271 people
with agricultural qualifications employed within these institutions. There are currently 42 funded vacancies for
permanent staff with agricultural qualifications.
Table 18: Demand for Agricultural Qualifications at Agricultural Colleges
CollegeCedaraOwen SitholeFort CoxGlenElsenburgGrootfonteinLowveldMadzivhandilaTompi SelekaPotechefstoomTaung
ProvinceKwaZulu-NatalKwaZulu-NatalE CapeFree StateW CapeN CapeMpumalangaLimpopoLimpopoNorth WestNorth West
Teaching1618161324571723202011
235
Funded33220324
1742
42
Un-funded00025
3030001
41
Vacancies
Management22615633143
36
Staff with Agricultural Qualifications
271 83TOTALS
Aside from overall skills demand within these institutions, information was also obtained on the spread of skills within
and across the Colleges as well as the difficulty (or not) of obtaining suitably qualified staff. In respect of the staff
involved in the practical teaching of students (referred to as Technicians), findings indicated that the general level
of qualification was the N.Dip. Teaching staff qualifications ranged from N.Dip through to Ph.D level, however the
average level of teaching staff qualification varied significantly between Colleges. For instance, Elsenburg stated
that the majority of its teaching staff had M.Sc qualifications, while Taung reported a 50:50 split between N.Dip and
B.Sc qualifications. Unsurprisingly the larger Colleges reported greater numbers of teaching staff at the Ph.D level,
with this undoubtedly impacting on the range of specialisations that the individual Colleges are able to offer students.
In respect of staff acquisition and retention, a number of the more rurally based Colleges remarked that their location
counted against them in attracting highly qualified staff and that this led to higher staff turnover. Respondents at
many Colleges complained that higher salaries in the private sector and better perks in government employ detracted
from their ability to attract suitably qualified staff. Finally, respondents referred to laxity in and uncertainty surrounding
the process of advertising vacant posts as another issue contributing to the number of funded vacancies.
It is clear from these findings that schools and Colleges are themselves contributing substantially to the demand
for agricultural qualifications within the labour market, and that for a number of reasons, demand is currently exceeding
supply of suitably qualified and willing individuals.
Demand for agricultural qualifications among staff at Universities
There are four Universities of Technology and 11 academic universities that offer agricultural qualifications and
require agriculturally qualified teaching and research staff. Some of these institutions have relatively small agriculture
departments, while others have large departments. Employment of people with agricultural qualifications at these
institutions would be 485 if all posts were filled (Table 19). There are 472 current staff members as well as 13 funded
vacancies. Clearly, as a group, these institutions are notable contributors to the demand for agricultural qualifications
within the labour market.
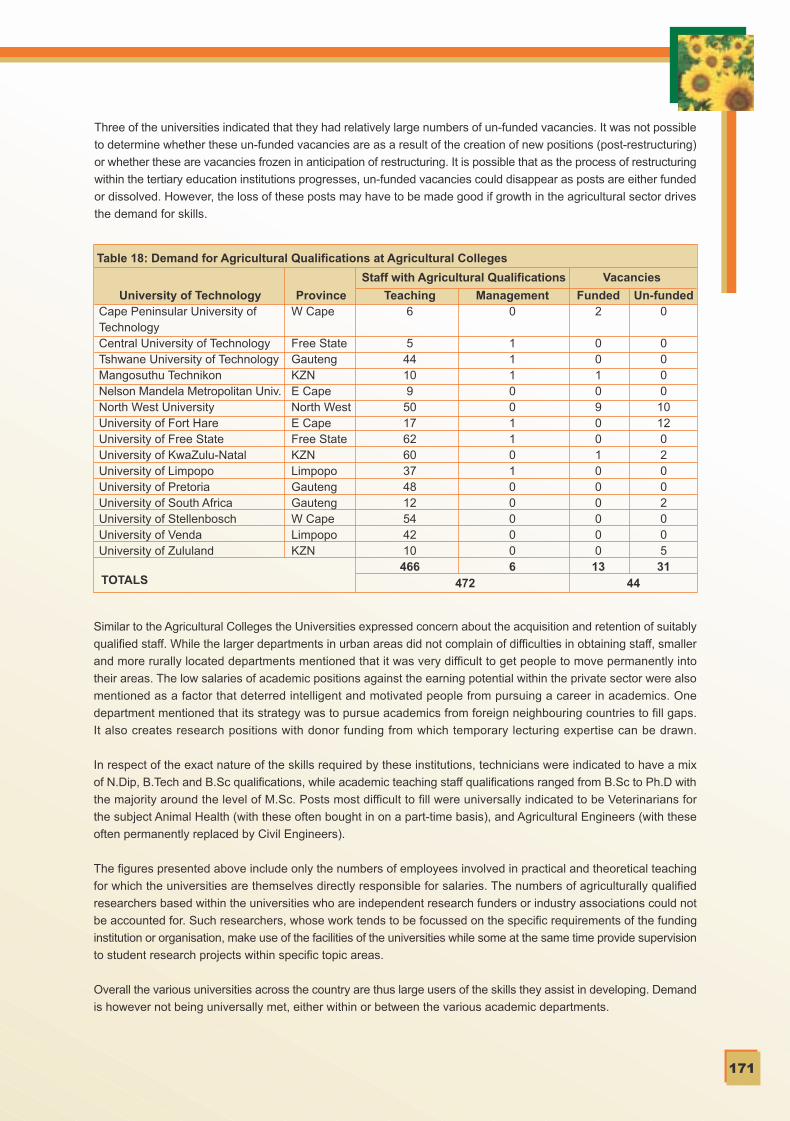
C M Y CM MY CY CMY K
171
Three of the universities indicated that they had relatively large numbers of un-funded vacancies. It was not possible
to determine whether these un-funded vacancies are as a result of the creation of new positions (post-restructuring)
or whether these are vacancies frozen in anticipation of restructuring. It is possible that as the process of restructuring
within the tertiary education institutions progresses, un-funded vacancies could disappear as posts are either funded
or dissolved. However, the loss of these posts may have to be made good if growth in the agricultural sector drives
the demand for skills.
Table 18: Demand for Agricultural Qualifications at Agricultural Colleges
University of TechnologyCape Peninsular University ofTechnologyCentral University of TechnologyTshwane University of TechnologyMangosuthu TechnikonNelson Mandela Metropolitan Univ.North West UniversityUniversity of Fort HareUniversity of Free StateUniversity of KwaZulu-NatalUniversity of LimpopoUniversity of PretoriaUniversity of South AfricaUniversity of StellenboschUniversity of VendaUniversity of Zululand
ProvinceW Cape
Free StateGautengKZNE CapeNorth WestE CapeFree StateKZNLimpopoGautengGautengW CapeLimpopoKZN
Teaching6
544109
50176260374812544210
466
Funded2
00109001000000
13
Un-funded0
0000
101202002005
31
Vacancies
Management0
111001101000006
Staff with Agricultural Qualifications
472 44TOTALS
Similar to the Agricultural Colleges the Universities expressed concern about the acquisition and retention of suitably
qualified staff. While the larger departments in urban areas did not complain of difficulties in obtaining staff, smaller
and more rurally located departments mentioned that it was very difficult to get people to move permanently into
their areas. The low salaries of academic positions against the earning potential within the private sector were also
mentioned as a factor that deterred intelligent and motivated people from pursuing a career in academics. One
department mentioned that its strategy was to pursue academics from foreign neighbouring countries to fill gaps.
It also creates research positions with donor funding from which temporary lecturing expertise can be drawn.
In respect of the exact nature of the skills required by these institutions, technicians were indicated to have a mix
of N.Dip, B.Tech and B.Sc qualifications, while academic teaching staff qualifications ranged from B.Sc to Ph.D with
the majority around the level of M.Sc. Posts most difficult to fill were universally indicated to be Veterinarians for
the subject Animal Health (with these often bought in on a part-time basis), and Agricultural Engineers (with these
often permanently replaced by Civil Engineers).
The figures presented above include only the numbers of employees involved in practical and theoretical teaching
for which the universities are themselves directly responsible for salaries. The numbers of agriculturally qualified
researchers based within the universities who are independent research funders or industry associations could not
be accounted for. Such researchers, whose work tends to be focussed on the specific requirements of the funding
institution or organisation, make use of the facilities of the universities while some at the same time provide supervision
to student research projects within specific topic areas.
Overall the various universities across the country are thus large users of the skills they assist in developing. Demand
is however not being universally met, either within or between the various academic departments.
C M Y CM MY CY CMY K
172
Demand for agricultural qualifications in private enterprises or NGO’s offering training to the agricultural
sector
Outside of the public education and training institutions already discussed, there exist a number of training service
providers who are either: independent, NGO’s focussed on new-farmer development, or are affiliated to member-
funded industry associations. These providers fulfil training needs that are not adequately being addressed by the
larger education institutions, either because of clients’ geographical location, the costs involved or the specific nature
of the training required. It is likely that many such private service providers will in future be registered with the newly
formed AGRI-SETA. At this stage however, data of registered service providers obtained from the SETA does not
provide an accurate overview of the numbers of private enterprises involved in training in the agricultural sector. A
determination of the demand for qualifications within this segment of the labour market is therefore not possible at
this stage.
There are also association-affiliated training enterprises and programmes, including the South African Sugar
Association’s Ushukela Training Centre, which offers practical training to growers and farm workers, and the National
Emergent Red Meat Producers’ Youth Agribusiness Entrepreneurial Development Programme. The requirements
for agricultural qualifications at these associations in order to provide this training will be discussed in more detail
under the section on industry associations below.
RESEARCH AND DEVELOPMENT (R&D)
There are a number of R&D institutions and organisations that support the domestic agricultural sector. These
organisations assist in the development of technologies and processes that impact on the activities of the industry
(e.g. farms and firms) as well as those providing the industry with various inputs and service (e.g. universities, and
providers of products and services). They are themselves large sources of demand for high-level agricultural
qualifications.
R&D institutions are located in the public and the private sector. Within the public sector R&D occurs at three key
levels: the National Department of Agriculture; Provincial Departments of Agriculture; and the parastatal organisation,
the Agricultural Research Council (ARC). While neither the National, nor any of the Provincial Departments of
Agriculture were able to provide figures for the numbers of people they employed in respect of R&D specifically,
the data obtained from the ARC is instructive. Table 20 below provides a breakdown of the ARC research programmes
and the provincial distribution of affiliated research stations, while Table 21 outlines the profile of agricultural
qualifications among employees at the organisation. Clearly this parastatal organisation contributes significantly
to overall demand for high-level agricultural qualifications in the labour-market.

C M Y CM MY CY CMY K
173
Table 20: ARC Research Institutes and Provincial Distribution of Affiliated Research Stations
Research Programmes
Institute for Tropical & Subtropical CropsVegetable & Ornamental Plant InstituteInfuitec-NietvoorbijRange & Forage InstituteAnimal Nutrition & Animal Products InstituteAnimal Improvement InstituteOnderstepoort Veterinary InstituteSmall Grain InstituteInstitute for Industrial CropsInstitute for Soil, Climate & WaterPlant Protection Research InstituteInstitute for Agricultural Engineering
Affiliated research stations in provinces
1129
122
1046
10762
Tota
l nu
mb
er
x
xxxx
xxx
Gau
ten
g
x
x
Lim
po
po
x
x
x
Mp
um
alan
ga
x
x
No
rth
Wes
t
xx
x
x
Fre
e S
tate
x
x
xx
xxx
KZ
N
x
x
x
xx
E C
ape
x
xxxx
N C
ape
xxxxxx
xxxxx
W C
ape
Table 21: Employment of Agricultural Qualifications at the Agricultural Research Council
Positions Requiring AgriculturalQualifications
Research Technicians ResearcherSenior Researcher and SpecialistsTotal Agric skills employedTotal ARC employment
Numbers Employed
24412979
137145734
2670
Qualification Range
N.Dip (Agric)B. Agric/B.Sc (Agric)B.Sc (Hons) (Agric)M.Sc AgricPh.D
From within the ARC there are concerns that capabilities within the institution are being eroded. Certain of the twelve
research institutes within the organisation are struggling to source high level skills required within their areas of
speciality. Increased pressure for self-funding of the organisation has resulted in increased workloads and stresses
on individual researchers, with concomitant migration into private sector R&D institutions. The private sector, however,
only funds research that is in its own interests. There is thus a need to continue public good research that is critical
to the sector and this implies that the appropriate skills base within the ARC needs to be sustained.
Within the private sector, research and development tends either to be undertaken by: R&D divisions within large
organisations; institutions supported by member-funded industry-associations; or NGO’s. In all instances the R&D
activities are specific to the interests of the organisation, association or NGO.
In respect of R&D within large organisations, examples discussed earlier include Syngenta SA (Seeds and Crop
Protection), Beyer Crop Science and Pannar Seeds. These firms have relatively large numbers of employees with
agricultural qualifications in their R&D divisions at figures of 16, 15 and 60 respectively.
Industry-associations with R&D interests include the South African Sugar Association’s SASRI (South African
Sugarcane Research Institute); Capespan’s Experico; the Citrus Growers Association of Southern Africa’s CRI
(Citrus Research International); and the Deciduous Fruit Producers Trust’s DFPT R&D Division (Table 22). While
most of these entities have their own research facilities, there is also a trend where they outsource these needs
by employing researchers who use the facilities of other R&D organisations such as the universities. For example,
the CRI has its own research facilities but also has researchers based at the Universities of Stellenbosch and
Pretoria, while the DFPT focuses all its R&D activity at university facilities.
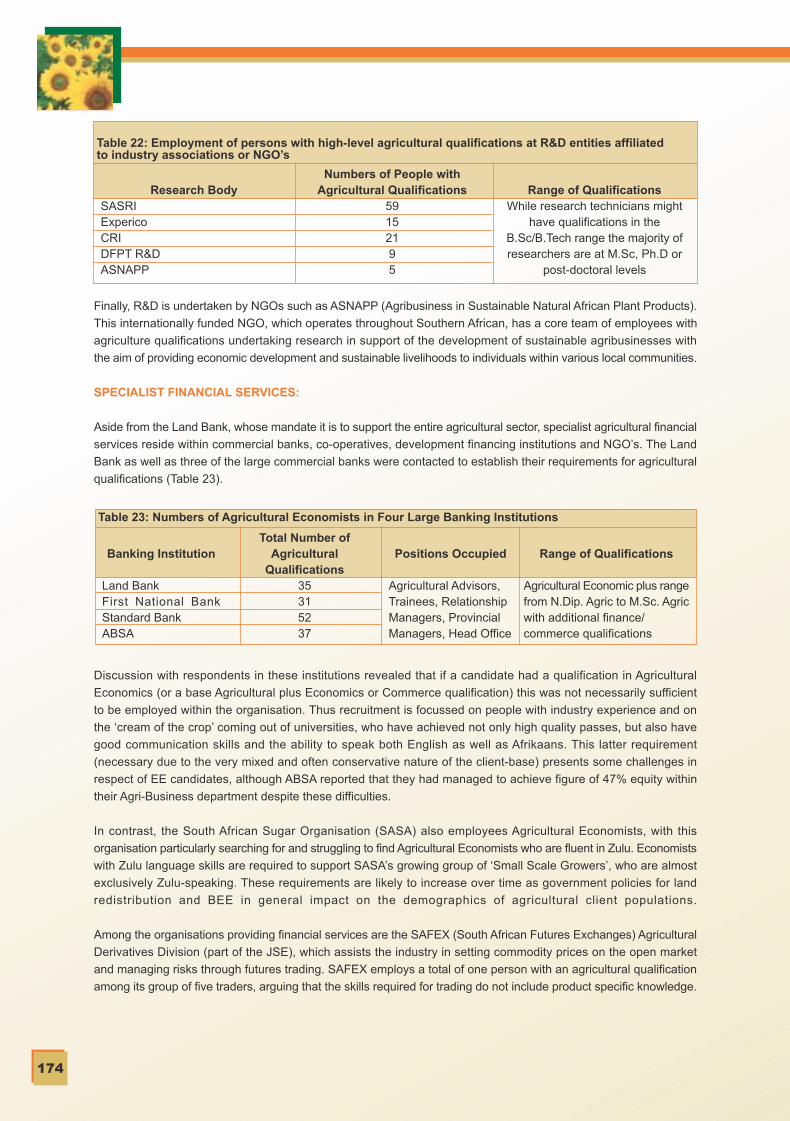
C M Y CM MY CY CMY K
174
Table 22: Employment of persons with high-level agricultural qualifications at R&D entities affiliatedto industry associations or NGO’s
Research BodySASRIExpericoCRIDFPT R&DASNAPP
Numbers of People withAgricultural Qualifications
59152195
Range of QualificationsWhile research technicians might
have qualifications in theB.Sc/B.Tech range the majority ofresearchers are at M.Sc, Ph.D or
post-doctoral levels
Finally, R&D is undertaken by NGOs such as ASNAPP (Agribusiness in Sustainable Natural African Plant Products).
This internationally funded NGO, which operates throughout Southern African, has a core team of employees with
agriculture qualifications undertaking research in support of the development of sustainable agribusinesses with
the aim of providing economic development and sustainable livelihoods to individuals within various local communities.
SPECIALIST FINANCIAL SERVICES:
Aside from the Land Bank, whose mandate it is to support the entire agricultural sector, specialist agricultural financial
services reside within commercial banks, co-operatives, development financing institutions and NGO’s. The Land
Bank as well as three of the large commercial banks were contacted to establish their requirements for agricultural
qualifications (Table 23).
Table 23: Numbers of Agricultural Economists in Four Large Banking Institutions
Banking Institution
Land BankFirst National BankStandard BankABSA
Total Number ofAgricultural
Qualifications35315237
Range of Qualifications
Agricultural Economic plus rangefrom N.Dip. Agric to M.Sc. Agricwith additional finance/commerce qualifications
Positions Occupied
Agricultural Advisors,Trainees, RelationshipManagers, ProvincialManagers, Head Office
Discussion with respondents in these institutions revealed that if a candidate had a qualification in Agricultural
Economics (or a base Agricultural plus Economics or Commerce qualification) this was not necessarily sufficient
to be employed within the organisation. Thus recruitment is focussed on people with industry experience and on
the ‘cream of the crop’ coming out of universities, who have achieved not only high quality passes, but also have
good communication skills and the ability to speak both English as well as Afrikaans. This latter requirement
(necessary due to the very mixed and often conservative nature of the client-base) presents some challenges in
respect of EE candidates, although ABSA reported that they had managed to achieve figure of 47% equity within
their Agri-Business department despite these difficulties.
In contrast, the South African Sugar Organisation (SASA) also employees Agricultural Economists, with this
organisation particularly searching for and struggling to find Agricultural Economists who are fluent in Zulu. Economists
with Zulu language skills are required to support SASA’s growing group of ‘Small Scale Growers’, who are almost
exclusively Zulu-speaking. These requirements are likely to increase over time as government policies for land
redistribution and BEE in general impact on the demographics of agricultural client populations.
Among the organisations providing financial services are the SAFEX (South African Futures Exchanges) Agricultural
Derivatives Division (part of the JSE), which assists the industry in setting commodity prices on the open market
and managing risks through futures trading. SAFEX employs a total of one person with an agricultural qualification
among its group of five traders, arguing that the skills required for trading do not include product specific knowledge.

C M Y CM MY CY CMY K
175
It was generally argued, that the poor image of agriculture as a career option is compounding the issue of skills
shortages. This is seen to be deterring really bright, ambitious and determined young people from entering the
profession, and has negative effects on responsiveness and dynamism within the profession.
AGRICULTURAL PRODUCT SALES AND MARKETING ORGANISATIONS:
Firms involved in agricultural sales and marketing range from small to large, and operate across a range of product
services. The smaller organisations focus on direct sales and could not be investigated, but their existence and
potential qualifications needs are noted as contributing to the overall demand for formal skills within the sector.
Among the organisations the larger organisations is the National Agricultural Marketing Council (NAMC), which is
mandated to provide advice on agricultural marketing issues to both government and stakeholder groups. This
orgnaisation employs 5 employees with agricultural qualifications out of a total of 21. Some of the large industry
associations also perform primarily a marketing and exporting function. An example here is Capespan, a citrus
exporting association who market the brands ‘Cape’, ‘Outspan’, Bella Nova’ and ‘Goldland’ internationally. Out of
a total employment figure of 315, around 95 employees have agricultural qualifications. Some of these employees
are involved in the control of fruit quality from planting to harvesting, which involves providing technical support.
Others are required to manage the control of fruit quality through the logistical supply chain by means of auditing,
and providing advice and assistance at various points en-route such as depots, pack-houses and ports. Finally,
agriculturally qualified employees are also involved in the finance and direct marketing divisions due to their product
specific knowledge.
THE RETAIL SECTOR:
The skills of agricultural graduates and diplomats are required by the large retail organisations. This is because
these corporations establish preferred or sole-provider agreements with their suppliers of fresh produce as a means
of improving and standardising product quality. Agricultural qualifications are required within the retail organisations
to provide farmer support around issues of crop production, the use of fertilizers and international best-practice
benchmarking, as well as for general fresh produce procurement. Table 24 below outlines the requirements among
the four largest South African retailers.
Table 24: Employment of Agricultural and Horticultural Qualifications at Four Large Retailers
Retail OrganisationWoolworthsPick ‘n PayShoprite-CheckersSparTOTAL
Total Employment195
107
41
Qualifications RequiredB.Tech/ B.Sc Agric/Agrar (PlantProduction)B.Sc Horticulture
Of four retailers listed, the requirements demand by Woolworths are most comprehensive, with this company stating
that it requires 10 years of experience for recruits into positions that provide farmer support. In an effort to overcome
the problems that this poses for EE, Woolworths have developed trainee positions for two individuals, with recruitment
into these positions crit ically dependent on the individual’s abil i ty to integrate information.
Of the 56 positions Woolworths has for Food Technologists, only eight are currently being filled by Agricultural Food
Technologists, with the remainder being filled by general Food Technologists, due the difficulty in obtaining graduates
with the former qualification. This example suggests that there is a shortage of Agricultural Food Technologists;
however only in this instance did the respondent distinguish between agricultual and general food technology skills.
This possibly deserves more attention.

C M Y CM MY CY CMY K
176
PRIVATE CONSULTING COMPANIES:
Due to the diversity within the range of companies providing private consultation into the agricultural sector (e.g.
financial, management, legal, labour relations, resource use, inputs, production methods etc) it was not possible
to provide an overview of the number of companies offering these services, or the total number of agriculturally
qualified individuals they employ. Their existence as contributing towards the total demand for agricultural qualifications
within the labour market is noted.
PRODUCT AND INDUSTRY QUALITY ASSURANCE REGULATORY BOARDS AND ORGANISATIONS
As a large proportion of agricultural products become food for humans, quality assurance in support of public health
is critical to the success of the industry. International markets often have very specific quality standards that must
be met by any potential supplier of agricultural products. Quality standards currently applicable to the agricultural
sector in South Africa include:
• ISO 9000: An international standard in quality management for manufacturing and services
• ISO 14001: An international environmental management system standard
• OHSAS 18000: An international standard for occupational health and safety
• HACCP: (Hazard Analysis and Critical Control Point) An internationally recognised food safety
management system
• EUROGAP: The European Good Agricultural Practices standard
• SABS Mark Scheme: a domestically recognised general standard of quality
The South African Bureau of Standards (SABS) undertakes accreditation for these nationally and internationally
recognised quality standards in South Africa. SABS currently employs 10 people with agricultural qualifications to
perform auditing in support of these standards. As part of the accreditation process, agri-trials are undertaken by
the organisation on various products. Here the expertise of entomologists and horticulturalists, rather than
agriculturalists, is required.
The Perishable Products Export Control Board (discussed above under parastatal demand) also falls under this
group of organisations in terms of its industry support focus. Of the total staff of 332 people, the PPECB employs
roughly 250 people with agricultural qualifications as quality inspectors based throughout the country.
The end-stage quality assurance testing, as undertaken by SABS and the PPECB, is often preceded by testing that
individual organisations or producers undertake in order to provide early warning of potential problems. This allows
time for rectification of problems prior to SABS or PPECB tests. The various divisions of the ARC as well as a
number of association-affiliated and private laboratories provide such pre-final quality assurance testing. The skills
requirements of the ARC were discussed in detail above. Other than a general indication by industry stakeholders
that the level of qualification demanded by the private laboratories is high (and is often made up of ex-ARC
employees), it is not possible to get any clear idea of the volume of demand.
PROFESSIONAL, CONSUMER & PRODUCER ASSOCIATIONS & SOCIETIES
There are a large number of industry organisations, associations and societies that bring together various groups
of stakeholders within the agricultural sector. The driving force behind the formation of these organisations has
generally been the pursuit of improved sustainability of the industry or activity, with this mission being met through
a variety of mechanisms. The range of these activities also determines the skills requirements of the particular
group.
These groups work in specific interest areas such as: professional (e.g. Soil Science Society of South Africa),
producer (South African Avocado Growers Association), service (Field Guides Association) or consumer bodies
(South African Meat Industry Company). (For a full list of these organisations, see Appendix 5).

C M Y CM MY CY CMY K
177
The activities undertaken by the various groups are in many ways overlapping. Most are oriented to improving the
influence or sustainability of their particular industry or stakeholder group by: networking; marketing; R&D or human
resources development. Producer associations will undertake activities such as: the organisation of agricultural
shows, auctions and conferences; the undertaking and dissemination of market and scientific research; and the
provision and/or support of technical and strategic training. (Case Study: South African Sugar Association is presented
in the box below as an example of a highly active and influential industry association).
Professional societies generally (although not exclusively) are member-run, with workforces thus largely made up
of volunteers (outside of possibly one or two administrators). Societies thus generally do not of themselves contribute
to the demand for agricultural qualifications within the market place, despite being made up of large groups of people
who have such qualifications.
Industry organisations and associations on the other hand, who generally do have employees with agricultural
qualifications, are extremely mixed in terms of their demand (Table 25). The requirement for specific agricultural
qualifications among industry associations is dependent on three key factors:
• The level of member voluntary involvement
• The scope of activities undertaken by the organisation or association, with direct marketing and R&D being most
demanding of specific agricultural skills; and
The level of fees paid by members and whether these are in the form of an industry-wide product levy or individual
membership fees.
Case Study: South African Sugar Association
One of the most highly organised and widely focussed associations within the agricultural sector is the South
African Sugar Association (SASA). This association manages on paper, all transactions of sugarcane in South
Africa, with core funding being obtained from the levies generated per ton of produce sold. In addition to this,
funding is obtained from the various user-pay services offered by the association. SASA provides its sub-sector
with industry production and marketing statistics; markets the nutritional and health benefits of the product to
general consumers; undertakes and publishes scientific research through its R&D division, SASRI (South African
Sugarcane Research Institute); organises industry-specific networking events; provides quality assurance testing
services; and promotes the development of human resources within the industry through extension services, the
provision of bursaries for education at tertiary training institutions, and via the development and provision of
industry-specific short-courses and Learnerships.
In respect specifically of the skills development focus of the association, training and development is provided
through two key divisions: SASRI and the uShukela Training Centre. While all forms of training fall under the
category of user-pay services at SASA, this is subsidised by the association’s core-funding, with the training
divisions additionally accessing funding through the SETA.
SASRI is the primary overseer of extension services provided to the sugar-growing industry, a system that leads
to a close and self-sustaining feedback mechanism between R&D, practical growing techniques in the field and
the content of the courses offered. SASRI offers two predominantly technical and management focussed theoretical
courses, which are aimed at farm managers, farm foreman, PDA extension officers, graduates from the Cedara
and Owen Sithole Colleges of Agriculture who are intending to specialise in sugar growing, as well as individuals
from within the whole of the SADC region. These courses are well respected within the industry and are currently
in the process of being aligned to SAQA’s NQF system.
Outside of the formal courses offered, SASRI has experimented with different means of supporting its extension
services through disseminating knowledge and information to its members. One such project involves the
dissemination of very specific irrigation advice via SMS to all ‘Small-Scale Growers’. Preliminary findings have
been very positive, revealing improved productivity, reduction in the waste of scarce water resources as well as
improved quality of soil through a reduction in leaching.
The uShukela Training Centre provides predominantly practical skills-based courses that are presented on farms
within the various sugar growing regions at the appropriate times within the sugarcane growing cycle. The Centre
has developed 18 unit standards (aligned to NQF Levels 2 & 3), presented as short courses, which all count
towards a sugar-focussed Plant Production Learnership qualification. The training offered by uShukela is aimed
at farm workers, small scale growers, new emerging farmers and free-hold growers.
Source: Personal communication & www.sasa.org.za

C M Y CM MY CY CMY K
178
Table 25: Demand for agricultural qualifications in industry associations and organisations
Organisation or Association
Deciduous Fruit Producers TrustNational Emergent Red Meat Producers OrganisationNational Wool Growers Association of SACape WoolsFeed Manufacturers Association of SAGrain SADry Bean Producers OrganisationSA Plant Breeders AssociationCapespanSouth African Sugar AssociationSouth African Cane Growers Association
Total PermanentEmployment
22103262
2560
3151000
42
Agricultural Qualifications
642520910958214
Although the skill requirements of associations are moderate, and influenced by the range and depth of services
offered, the growth in activity - including training activities - of industry associations reflects an increase in the levels
of organisation of sub-sectors in the agricultural sector. In the future, industry associations may become critical
players in gathering and communicating information about skills needs and skills supply, as well as becoming training
providers in their own right.
7.6 General skills demand characteristics of the agriculture sector
The broad characterises of demand for agricultural qualifications are visible from the findings presented. These are
listed, and then each is discussed in more detail below:
• Relative demand for agricultural qualifications is higher in the primary agriculture sector than in the secondary
agriculture sector
• Demand for agricultural qualifications is not restricted to primary and secondary agricultural activities, but is also
evident among firms that provide various inputs to agricultural producers
• There is strong demand for agricultural qualifications among the organisations and institutions that provide
governance and support to the agricultural sector
• Demand for agricultural qualifications within government remains critical
• Demand is evident for highly specialised agricultural qualifications as well as for general agricultural qualifications
• Demand for agricultural qualifications displays geographical variability due to the impact of climate and
spatial factors
• Demand for agricultural qualifications across the agricultural sector is dynamic and is affected by sectoral and
sub-sectoral factors
Demand for agricultural qualifications is relatively higher in the primary agriculture sector that in the
secondary agriculture sector: The findings reveal that while the demand for agricultural qualifications within the
secondary agricultural sector is relatively low in comparison, a clear demand for agricultural qualifications is expressed
within the group of activities that make up primary agricultural production. This is with the exception of a few producer
sectors that are strongly vertically integrated such as the case of grape and wine production.
Demand for agricultural qualifications is not restricted to primary and secondary agricultural activities, but
is also evident among firms that provide various inputs to the agricultural producers: Demand is highest
in firms providing direct sector-specific inputs into the primary agricultural sector (e.g. seeds) and virtually absent
in firms providing direct sector specific inputs into the secondary agricultural sector (e.g. producers of chemical
preservatives). Demand within the diverse group of firms providing non-sector specific inputs into the agricultural
sector is also highly variable, depending to a large extent on the nature of the input provided (e.g. relatively strong
demand may be expected firms specialising in fertigation equipment and advice, and insignificant demand may be
expected from firms manufacturing tractor tyres).

C M Y CM MY CY CMY K
179
There is strong demand for agricultural qualifications among the organisations and institutions that provide
governance, regulation and support to the agricultural sector: Activities such as education and training, R&D,
quality assurance, technical support, marketing and regulation present strong demand for specific, generally higher-
level, agricultural qualifications.
Demand for agricultural qualifications within government is critical: Despite the fact that the importance of
the private sector is increasing in respect of its requirements for formal agricultural skills, the demand from the public
sector including government departments, research institutions, parastatal organisations and higher education
remains key. This is not only because of the sheer numbers employed within this group, but also because of the
foundational role they play in the long-term sustainability of the sector.
Demand in the sector applies to highly specialised agricultural qualifications as well as to general agricultural
qualifications: Certain employment positions within the agricultural sector require very specific qualifications (e.g.
veterinary science in order to practice as a vet). Simultaneously, other employment positions within the sector are
substantially more flexible in terms of the level and specialisation of their agricultural skills requirements (e.g. farm
managers, sales agents, research technologists). This means that in certain areas of the sector the specific nature
of the agricultural qualifications are at times only loosely related to the area in which an individual may work and
the activities they are ultimately involved in. Employers are also mindful of the fact that the skills required to work
productively within the sector can be gained through a number of means: by acquiring formal qualifications, self-
study, by attending additional short courses, by receiving appropriate mentoring, through networking or through on-
the-job experience (Table 25).
Demand for agricultural qualifications displays geographical variability due to the impact of climate on
certain agricultural activity: The fact that the physical geography and climate of the country impacts on the nature
of productive activity within a particular region, means that the demand for specific agricultural skills is also spatially
variable. For instance there is not likely to be any real demand for viticulture qualifications in KwaZulu-Natal while
there is not likely to be any real demand for specialists in sugarcane production in the Western Cape. Thus it is no
co-incidence that the two tertiary education institutions offering viticulture are based in the Western Cape where
the vast majority of wine-grape and wine production takes place, and that the South African Sugar Institute and its
respective training divisions, is based in KwaZulu-Natal, where the vast majority of sugarcane production and milling
takes place.
Demand for agricultural qualifications is dynamic and is affected by sectoral and sub-sectoral conditions:
The demand for agricultural qualifications within the agricultural sector (total demand as well as demand for
specialisation) changes over time in response to a number of forces acting on and within the sector. The combination
of these forces is driving an increase in the requirement for higher-level agricultural skills and thus also formal
agricultural qualifications within certain sub-sectors.
• Increased global and local market demand for quality and productivity results in increased demand among
primary producers for appropriately trained employees who have the capabilities to understand and can assist
in responding appropriately to these pressures
• Pressures for improved quality and productivity result in increased mechanisation or the adoption of new
technologies in different sub-sectors. This shifts the balance in requirements towards skilled and away from
unskilled workers. Thus, where it was possible for an employer to develop employee skills through on-the-job
training, this is no longer the case and minimum qualification requirements are introduced
• Increasing skills within one sub-sector have a direct impact on the need to increase skills within another sub-
sector: When increasing numbers of primary producers expect their employees to have agricultural qualifications,
enterprises providing services must be able to offer their clients a higher level of service - necessitating increases
in skills requirements among agricultural product sales agents and extension officers for example
• A reduction of the perceived value of a particular qualification may also lead to requirements for higher-level
qualifications. Regardless of the validity of perceptions, if an employer believes that the standard of a particular
qualification has dropped, she is likely to increase her minimum employment requirement to a higher level of a
degree, thus fuelling the demand for higher level skills
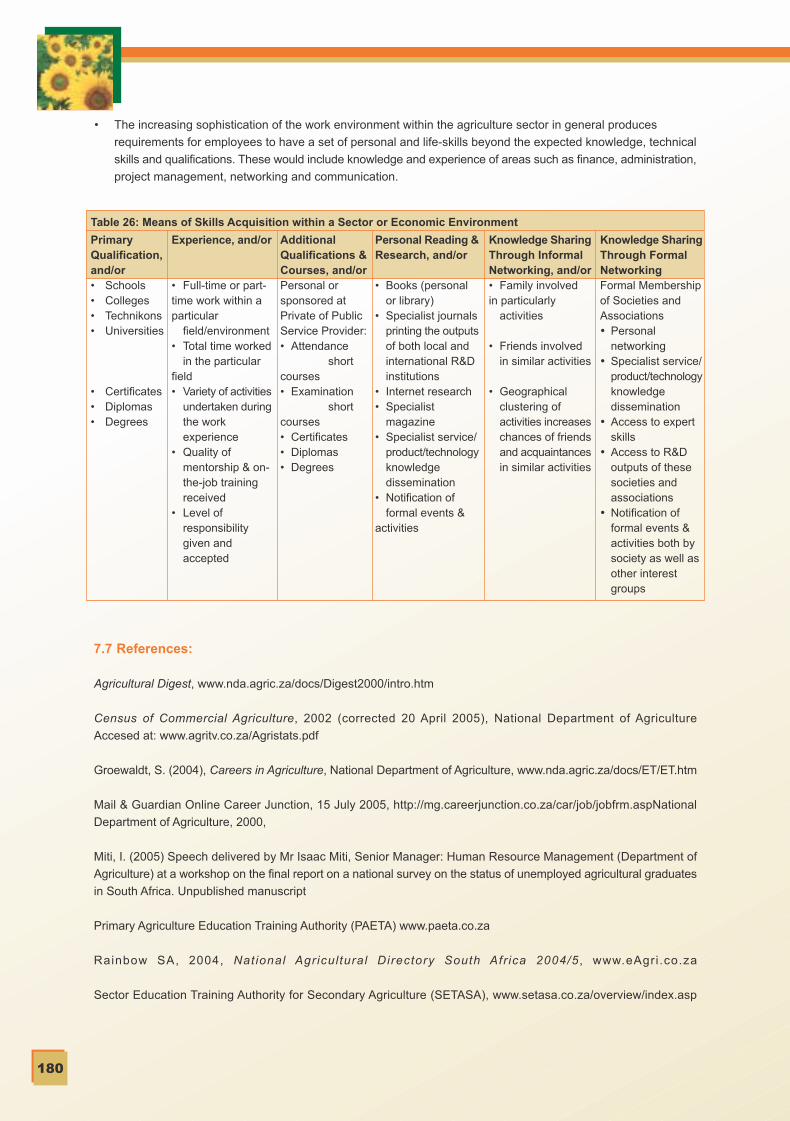
C M Y CM MY CY CMY K
180
• The increasing sophistication of the work environment within the agriculture sector in general produces
requirements for employees to have a set of personal and life-skills beyond the expected knowledge, technical
skills and qualifications. These would include knowledge and experience of areas such as finance, administration,
project management, networking and communication.
Table 26: Means of Skills Acquisition within a Sector or Economic Environment
PrimaryQualification,and/or• Schools• Colleges• Technikons• Universities
• Certificates• Diplomas• Degrees
Experience, and/or
• Full-time or part-time work within a particular
field/environment• Total time worked
in the particular field• Variety of activities
undertaken duringthe work experience
• Quality of mentorship & on-the-job trainingreceived
• Level ofresponsibility given and accepted
AdditionalQualifications &Courses, and/orPersonal orsponsored atPrivate of PublicService Provider:• Attendance
shortcourses• Examination
shortcourses• Certificates• Diplomas• Degrees
Personal Reading &Research, and/or
• Books (personal or library)
• Specialist journalsprinting the outputsof both local and international R&D institutions
• Internet research• Specialist
magazine• Specialist service/
product/technologyknowledge dissemination
• Notification of formal events &
activities
Knowledge SharingThrough InformalNetworking, and/or• Family involved in particularly
activities
• Friends involved in similar activities
• Geographical clustering of activities increaseschances of friendsand acquaintancesin similar activities
Knowledge SharingThrough FormalNetworkingFormal Membershipof Societies andAssociations• Personal
networking• Specialist service/
product/technologyknowledge dissemination
• Access to expert skills
• Access to R&D outputs of thesesocieties andassociations
• Notification offormal events &activities both bysociety as well asother interestgroups
7.7 References:
Agricultural Digest, www.nda.agric.za/docs/Digest2000/intro.htm
Census of Commercial Agriculture, 2002 (corrected 20 April 2005), National Department of Agriculture
Accesed at: www.agritv.co.za/Agristats.pdf
Groewaldt, S. (2004), Careers in Agriculture, National Department of Agriculture, www.nda.agric.za/docs/ET/ET.htm
Mail & Guardian Online Career Junction, 15 July 2005, http://mg.careerjunction.co.za/car/job/jobfrm.aspNational
Department of Agriculture, 2000,
Miti, I. (2005) Speech delivered by Mr Isaac Miti, Senior Manager: Human Resource Management (Department of
Agriculture) at a workshop on the final report on a national survey on the status of unemployed agricultural graduates
in South Africa. Unpublished manuscript
Primary Agriculture Education Training Authority (PAETA) www.paeta.co.za
Rainbow SA, 2004, National Agricultural Directory South Afr ica 2004/5 , www.eAgri .co.za
Sector Education Training Authority for Secondary Agriculture (SETASA), www.setasa.co.za/overview/index.asp

C M Y CM MY CY CMY K
181
Organisations (not included in Appendix 5):
International School of Tanning Technology, www.tanschool.co.za
Agribusiness in Sustainable Natural Plant Products, www.asnapp.org
Please Note: For a comprehensive list of all individuals contacted telephoncally for the purposes of this
research, please see Appendix 5

C M Y CM MY CY CMY K

C M Y CM MY CY CMY K

C M Y CM MY CY CMY K
184
CHAPTER 8
Interaction between the demand for, and supply of, agricultural graduates withintermediate to high-level skills
8.1 Introduction
This chapter brings together the preceding analysis regarding the supply of intermediate to high-level agriculturalskills with the analysis regarding the demand for such skills in the South African labour market.
The chapter begins with a brief overview of the supply of agricultural skills into the South African labour market, asdiscussed in Chapter 3 which established the numbers of graduates emerging from the various national institutionswith intermediate to high-level agricultural qualifications. This is followed by a short recapitulation of the best estimatesof the size of the workforce with intermediate to high-level agricultural qualifications, as determined in Chapter 7.It is then possible to generate an estimate of annual skill replacement needs.
Having looked at the annual supply of agricultural skills, as well as the broad shape of current demand, the followingsection looks more closely at the intersection of supply and demand of agricultural qualifications. First, it examinesthe available quantitative data on the absorption of agricultural skills into the labour market. Second, it discussesthe key trends in respect of the intersection between micro-level demand for agricultural skills and ground-levelperceptions of available supply, providing insights as to the possible reasons for disequilibrium between the supplyand demand of agricultural qualifications.
8.2 An overview of agricultural skills supply
This section provides an overview of the supply of agricultural skills into the labour market, looking at the annualoutput from General and Agricultural High Schools, general FET and Agricultural Colleges, and Higher EducationInstitutions.
8.2.1 Agricultural Science as a subject at Senior Certificate level and at Agricultural High Schools
We observed in Chapter 2 that even though a large number of learners (60 112 in 2003) passed the subjectAgricultural Science at Matric this is not a strong indicator of whether a student will qualify to study further in highereducation or even whether the student will be able to pursue her/his agricultural studies further. Furthermore, thecharacter of the Senior Certificate qualification is generalist and formative rather than vocational. Therefore, cohortsof school leavers who complete Agricultural Science can be assumed to contribute in as yet unknown ways to thesubsequent accumulation of higher agricultural skills levels.
The 42 Agricultural High Schools offer a learning programme up to Senior Certificate level which includes the sameAgricultural Science (HG)/(SG) subject offered in ordinary high schools as well as five other Agricultural subjectsfrom which students may select. An estimated number of 548 learners enrolled with at least one agricultural subjectin these schools in 2003. However, not all Agricultural High Schools offer the full range of Agricultural subjects andsome students may take only one or no agricultural subjects. These schools do not all offer a standardized vocationallyfocused agricultural qualification. The graduates from these schools will therefore not be taken into account in theanalysis of direct flows of graduates into the labour market.
8.2.2 Further Education and Training Colleges
The 50 Further Education and Training (FET) Colleges provide a vocationally oriented curriculum ranging from N1to N6 which extends from the FET band and into the HET band. The numbers of graduates with N1-N3 and withN4-N6 qualifications in 2004 was 161 (see Table 1), a figure that, for a number of reasons, does not relate directlyto the number of qualified persons entering the labour market.

C M Y CM MY CY CMY K
185
Completed N1Completed N2Completed N3Completed N4Completed N5Completed N6Completed N DiplomaTotal
Number5161533325010161
Table 1: Candidates who completed N-levels at the FET CollegesExaminations in Agriculture N3 and N6 in 2004
The semester-based structure of instructional offerings provided by the FET Colleges lends itself to learners enrollingnot for a whole qualification at one time, but on an irregular basis. In some instances, learners will enroll for a onesemester instructional offering from the N4 to the N6 level on a once-off basis because this meets a particular needthey have for specific skills (eg: employees in the wine industry may take a single course in viticulture in the N4 toN6 levels).
In other instances, learners who are full time or part time employed will enroll for courses on an intermittent basisover a period of several years before they complete all the requirements for a particular qualification. This meansthat there is no direct link between enrolments and graduates in the FET College sector. As such, to measure theflow of qualified personnel into the labour market from the FET Colleges through using information on completedqualifications is to underestimate the full contribution of the Colleges to skilling agricultural workers.
8.2.3 Colleges of Agriculture
The 11 Colleges of Agriculture are entitled to offer qualifications that are located in the HET band up to the BTechdegree level. In 2004, 899 students passed the examinations in the Colleges (Table 2). For the purposes of thisanalysis, the number taken to have begun job-seeking will be based on those completing the Higher Certificate andthe Diploma only, because the first Certificate year leads directly onto the Higher Certificate year. Thus the totalnumber of graduates from the Colleges of Agriculture who are considered as labour market entrants was 572.
Year 1Year 2Year 3To t a l
CertificateHigher CertificateDiploma
Enrolled
376370254
1000
Table 2: Candidates who passed in the Agricultural Colleges Examinations in 2004
Entering LabourMarket
-370254624
8.2.4 Higher education institutions
In 2003, 19 Technikons and Universities offered qualifications ranging throughout the HET band, from undergraduatedegrees and certificates to Doctoral degrees. Cumulatively, graduates from these institutions in 2003 numbered 1765 (Table 3).
Table 3: Students graduating in Agriculture and Renewable Natural Resources fromUniversities and Technikons in 2003
Year2003
Technikons 862
Universities904
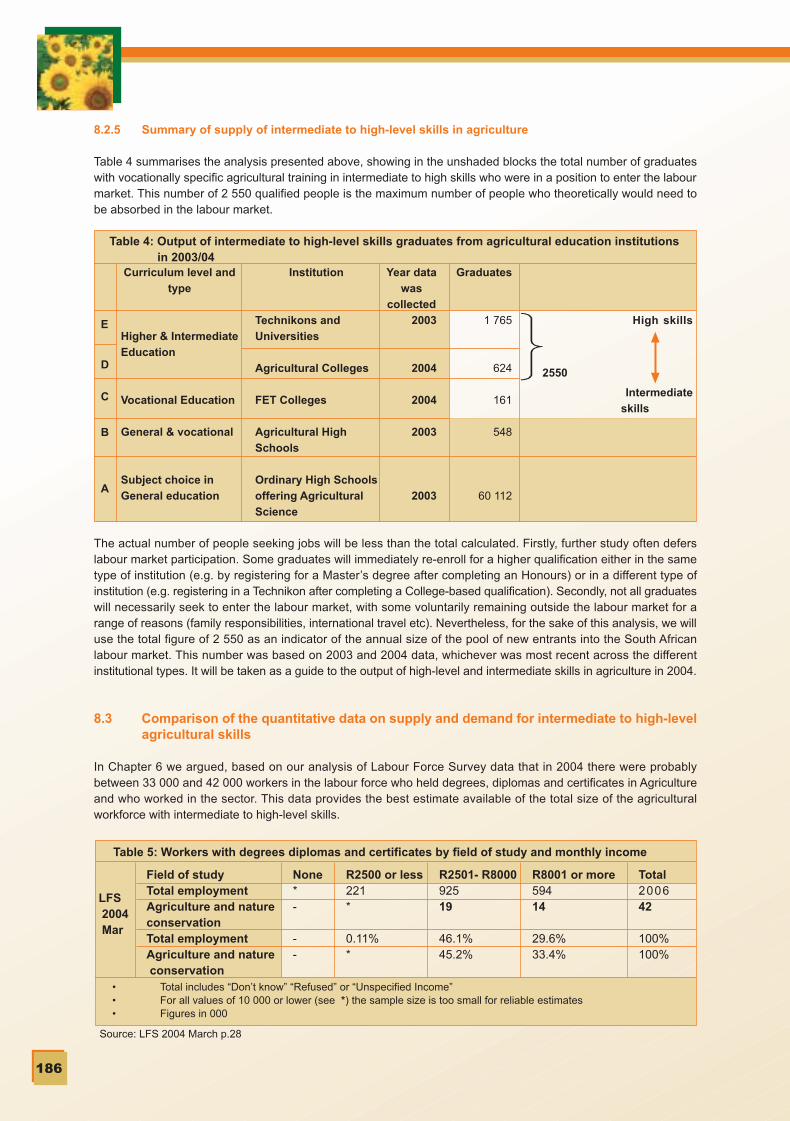
C M Y CM MY CY CMY K
186
8.2.5 Summary of supply of intermediate to high-level skills in agriculture
Table 4 summarises the analysis presented above, showing in the unshaded blocks the total number of graduateswith vocationally specific agricultural training in intermediate to high skills who were in a position to enter the labourmarket. This number of 2 550 qualified people is the maximum number of people who theoretically would need tobe absorbed in the labour market.
Employment
High skills
2550
Intermediate
skills
Table 4: Output of intermediate to high-level skills graduates from agricultural education institutions in 2003/04
E
D
C
B
A
Curriculum level and
type
Higher & Intermediate
Education
Vocational Education
General & vocational
Subject choice in
General education
Institution
Technikons and
Universities
Agricultural Colleges
FET Colleges
Agricultural High
Schools
Ordinary High Schools
offering Agricultural
Science
Year data
was
collected
2003
2004
2004
2003
2003
Graduates
1 765
624
161
548
60 112
The actual number of people seeking jobs will be less than the total calculated. Firstly, further study often deferslabour market participation. Some graduates will immediately re-enroll for a higher qualification either in the sametype of institution (e.g. by registering for a Master’s degree after completing an Honours) or in a different type ofinstitution (e.g. registering in a Technikon after completing a College-based qualification). Secondly, not all graduateswill necessarily seek to enter the labour market, with some voluntarily remaining outside the labour market for arange of reasons (family responsibilities, international travel etc). Nevertheless, for the sake of this analysis, we willuse the total figure of 2 550 as an indicator of the annual size of the pool of new entrants into the South Africanlabour market. This number was based on 2003 and 2004 data, whichever was most recent across the differentinstitutional types. It will be taken as a guide to the output of high-level and intermediate skills in agriculture in 2004.
8.3 Comparison of the quantitative data on supply and demand for intermediate to high-levelagricultural skills
In Chapter 6 we argued, based on our analysis of Labour Force Survey data that in 2004 there were probablybetween 33 000 and 42 000 workers in the labour force who held degrees, diplomas and certificates in Agricultureand who worked in the sector. This data provides the best estimate available of the total size of the agriculturalworkforce with intermediate to high-level skills.
• Total includes “Don’t know” “Refused” or “Unspecified Income”• For all values of 10 000 or lower (see *) the sample size is too small for reliable estimates• Figures in 000
Source: LFS 2004 March p.28
Table 5: Workers with degrees diplomas and certificates by field of study and monthly income
LFS 2004 Mar
Field of studyTotal employmentAgriculture and natureconservationTotal employmentAgriculture and nature conservation
None*-
--
R2500 or less221*
0.11%*
R2501- R800092519
46.1%45.2%
R8001 or more59414
29.6%33.4%
Total200642
100%100%

C M Y CM MY CY CMY K
187
Using the above estimate of the total size of the agriculturally skilled labour-force, alongside the figure for the poolof new graduates in 2004, it is possible to generate an annual overall skills-replacement rate. If we express graduateoutputs (shown above to be approximately 2 550 FET and HET graduates in 2004) as a percentage of the numberof workers in agriculture who have intermediate and high-level skills in agriculture, we arrive at a figure of between6.1% and 7.7% (2 550/42 000 = 6.1% or 2 550/33 000 = 7.7%). In other words, our rough estimates suggest thatthe current graduate output can compensate for annual losses of skilled individuals – or replacement demand - inthe sector to the magnitude of between 6.1% and 7.7%.
Replacement demand is the term used to describe the demand for skills that arises from the need to compensatefor losses of existing skilled workers within a sector i.e. the demand that will need to be met in order to keep allcurrent jobs within the sector filled. Replacement demand at the sectoral level will result from the sum of replacementdemand for all occupations that are represented in that sector.
Unfortunately, aggregated sectoral data – for intermediate to high-skilled workers - cannot tell us how work-seekerswith particular qualifications enter specific occupations within the sector. Analysis of the replacement demand forskills must therefore be undertaken at the level of occupation, as occupational vacancies at the high skills level areusually linked to specific qualifications. For example an individual with a National Certificate in Agriculture cannotfill a vacated post demanding an individual with a degree in veterinary science, despite the former contributing tooverall sectoral replacement supply and the latter contributing to overall sectoral replacement demand.
Replacement demand at the occupational level arises mainly as a consequence of the following occupation-specificfactors:• age and gender structure of incumbents• rates of outflow from the group on account of:
o Retiremento Net migrationo Inter-occupational mobility, ando In-service mortality
To quantify replacement demand for occupations requiring intermediate and high skills qualifications in agriculturewould therefore require information on all of the above factors, by occupation. This information is currently unavailable.
In summary, this analysis has demonstrated that in 2004 the supply of intermediate to high-level skills into the SouthAfrican labour market could compensate for losses in the existing workforce up to the magnitudes of between 6.1%and 7.7%. Whether this level of supply was sufficient to meet the replacement demands of the sector is unknown.This is because overall sectoral replacement demand could not be disaggregated to the particular occupationalgroups within the sector. This does not however mean that we have no way of understanding the relationship betweendemand and supply in the agricultural sector. The following sections will provide analysis on the shape of demandwithin sub-sectors of the agricultural economy.
8.4 Key features of skills demand in the agriculture sector
The discussion that follows will set out the key current features of the demand landscape for intermediate to high-level agricultural skills in the agricultural sector. This section will also show that outside of the need to meet‘replacement’ demand for intermediate to high-level skills, the dynamic nature of the sector and its potential togenerate ‘new’ demand, needs to be taken into account.
8.4.1 Current skills demand characteristics of the agricultural sector
The micro-level analysis of the demand for agricultural qualifications undertaken for this research and presentedin detail in Chapter 7 provides some insights into the demand for agricultural qualifications among the various groupsof activities that make up the agricultural sector. These are given below:• Relative demand for agricultural qualifications is higher in the primary agriculture sector that in the secondary
agriculture sector

C M Y CM MY CY CMY K
188
• Demand for agricultural qualifications is not restricted to primary and secondary agricultural activities, butis also evident among firms that provide various inputs to the agricultural producers
• There is strong demand for agricultural qualifications among the organisations and institutions that providegovernance and support to agricultural activities
• Demand for agricultural qualifications within government remains critically important
Chapter 7 also revealed a number of cross-cutting issues in respect of the demand for agricultural qualificationswithin the various sub-sectors of the agricultural industry. These are that:• Demand in the sector applies to highly specialised agricultural qualifications as well as to general agricultural
qualifications• Demand for specific agricultural qualifications displays geographical variability due to the impact of climate
on the sector• Demand for agricultural qualifications across the agricultural sector is dynamic and is affected by sectoral
and sub-sectoral factorsThe last of these points, that demand for agricultural qualifications is not static, but is affected by a number of externaland internal driving forces, is supported by additional evidence to be discussed below.
8.4.2 Demand arising out of changing labour market conditions
All attempts to calculate demand figures for skilled workers, whether in the aggregate or by particular occupationalcategories, must take into account the potential impact of changing economic conditions. In respect of the agriculturalsector, changing national, sectoral or sub-sectoral economic conditions may result in:• Aggregate increases in labour demand• Aggregate decreases in labour demand
Employment data reveals that the agricultural labour force is in long-term decline, a trend that has been attributedto a gradual general shift in economic activity away from primary activities towards manufacturing and services.Counter to this long-term trend, recent evidence suggests that there has been a slight increase in agriculture’sshare of employment, with a shift from 12% in 1995 to 13% in 2002. In real terms, employment within the sectorgrew by a substantial 24.7% over the same period. (Bhorat,2003,6). Simultaneously, there are clear signs of growthin certain agricultural sub-sectors, especially those which are servicing export markets (eg: wine & rooibos tea).Thus despite the long-term trend of declining employment within the sector, medium-term fluctuations in responseto changing market conditions are likely to have notable impacts on the overall demand for agricultural qualificationswithin the agricultural sector.
8.4.3 Changing skills composition of the workforce
Within the overall pattern of increasing – or decreasing – aggregate demand for labour (as determined by thebalance of the increases and decreases at the levels of individual sub-sectors) there may be shifts in the skill oroccupational composition of the labour force. These sift may be on account of:
• shifts in the balance of skill needs (i.e. between high, medium and low) within a particular workforce• absolute decline in the need for a particular skill or qualification• emergence of demand for a new type of skill or qualification
Recent analyses have shown that even though the overall size of the agriculture labour force has been shrinkingover the long-term, skills levels have shifted upwards. Data on the ‘agriculture hunting, forestry and fishing’ sectorshows how unskilled workers’ share of employment declined while the share of semi-skilled workers increased byalmost the same margin between 1995 and 2002. In addition, the proportion of skilled workers doubled – thoughfrom a very small base.

C M Y CM MY CY CMY K
189
Table 6: Skills breakdown of employment in the Agriculture, hunting,forestry and fishing sector for 1995 and 2002 in %
SkilledSemi-skilledUnskilledTotal
1995
1.022.077.0100
2002
2.046.052.0100
Change
+1+24-25-
This shift towards a greater proportion of skilled and semi-skilled workers supports the qualitative findings of thisresearch. The driving forces behind this change in workforce skills composition have been ascribed to increasedinvestment in mechanical and technological upgrading in the production processes, itself a response to the increasedpressures for quality and productivity associated with globalisation and open markets. South Africa is however notalone, with this trends of decline in the employment of un-skilled agricultural workers and increases in the employmentof semi-skilled and skilled agricultural workers occurring to a smaller or larger degree in all globally-integratedeconomies.
8.5 The interaction of supply and demand for agricultural qualifications
Having looked at the annual supply of agricultural skills, as well as the broad shape of current demand, this sectionlooks more closely at the intersection of supply and demand of agricultural qualifications. This is done in two ways:Firstly, we examine data from the Labour Force Survey to reveal characteristics of the absorption of agriculturalskills into the labour market.
Second, key trends in respect of the intersection between micro-level demand for agricultural skills and perceptionsof respondents regarding available supply are discussed, providing insights as to the possible reasons for disequilibriumbetween the supply and demand of agricultural qualifications.
8.5.1 Labour market absorption as an indicator of skills supply-demand co-ordination
An important indicator of the capacity of the labour market to absorb particular sets of skills is the level of unemploymentamong individuals with that particular skills set. High levels of unemployment in particular skills bands suggest thatthere is an over-supply of these skills.
It is well known that unemployment affects people with intermediate to high-level qualifications in South Africa acrossa range of fields. The existence of unemployed graduates constitutes a waste of resources expended on trainingpeople in skills that they cannot practice because they are – or may become – unemployed over a long period oftime.
How large is this problem in the field of agriculture? Detailed information regarding unemployment among agriculturalgraduates is not readily available. Table 7 below presents the numbers of unemployed persons as given in theLabour Force Survey of 2004. The figure represents data according to the ‘official’ and the ‘expanded’ definitionsof unemployment Statistics South Africa (Stats SA) uses the following definition of unemployment as its officialdefinition. The unemployed are those people within the economically active population who: (a) did not work duringthe seven days prior to the interview, (b) want to work and are available to start work within two weeks of the interview,and (c) have taken active steps to look for work or to start some form of self-employment in the four weeks prior tothe interview. The expanded definition of unemployment excludes criterion (c). Among those who are included inthe expanded but not the official definition of unemployment will be discouraged job seekers (those who said theywere unemployed but had not taken active steps to find work in the four weeks prior to the interview) (StatisticsSouth Africa, 2004a, xiii; Statistics South Africa, 2004b, 66-67).
Note: ‘Skilled’ refers to ISOC 1-3, ‘Semi-skilled’ refers to ISOC 4-8, and ‘unskilled’ refers to ISOC 9.
Source: Bhorat and Oosthuizen (2005) Table 10 p.24

C M Y CM MY CY CMY K
190
The national unemployment rate is 27.8% in terms of the official definition and 41.2% in terms of the expandeddefinition. As can be seen from the data provided, even under the expanded definition, unemployed persons withdegrees, diplomas and certificates from within the agricultural field of study is less than 10 000.
Table 7: Unemployed persons (10 000) with degrees, diplomas and certificates by field of study, definitionof unemployment and sex
Field of study for degree,diploma or certificateTotal
Communication studies and language
Education, training and development
Manufacturing, engineering and technology
Human and social studies
Law, military service and security
Health sciences and social services
Agriculture and nature conservation
Culture and arts
Business, commerce and management studies
Physical, mathematical, computer and life sciences
Services
Physical planning and construction
Don’t know/unspecified
Total217
*
45
25
*
*
17
*
*
62
23
*
*
*
Male90
*
16
16
*
*
*
*
*
26
*
*
*
*
Female128
*
29
*
*
*
14
*
*
35
16
*
*
*
Total289
*
58
34
11
12
21
*
*
85
32
*
*
*
Male111
*
19
22
*
*
*
*
*
33
*
*
*
*
Female178
*
39
13
*
*
18
*
*
52
22
*
*
*
Official definition Expanded definition
Source: Statistics South Africa, (2004a) p.57 “Unemployed persons with degrees, diplomas and certificates by field of study,
definition of unemployment and sex”
It is preferable to have controlled low levels of unemployment across the economy, and it is therefore useful toestablish whether the level of unemployment among agricultural graduates is proportionately higher than levels ofunemployment among graduates in other sectors. For instance, there is a very high number of unemployed persons(58 000 teachers) who have a degree, diploma or certificate in education. But as the teaching profession is muchlarger than the size of the intermediate to high-level skilled agriculture workforce, direct comparison of unemploymentfigures is not useful. It will therefore be more meaningful therefore to track changes in this indicator over time toobserve trends in the equilibrium between supply and demand of particular qualifications, or for particular occupations.
Supplementary empirical evidence on the matter of graduate unemployment, and patterns of obtaining employmentamong graduates in South Africa, is provided by Moleke (2005). Moleke’s work is valuable because it is reportedon the basis of academic field of study and therefore affords comparison between the employment potential ofgraduates who have studied in different fields. Moleke’s data was obtained via a survey in 1999/2000 of about2500 former university students who graduated between 1994 and 1998, and shows that there was a relatively lowproportion of agricultural graduates who experienced a period of unemployment in comparison with other fields ofstudy (Table 8).
* Statistics South Africa (Stats SA) uses the following definition of unemployment as its official definition. The unemployed are
those people within the economically active population who: (a) did not work during the seven days prior to the interview, (b) want
to work and are available to start work within two weeks of the interview, and (c) have taken active steps to look for work or to
start some form of self-employment in the four weeks prior to the interview. The expanded definition of unemployment excludes
criterion (c). Among those who are included in the expanded but not the official definition of unemployment will be discouraged
job seekers (those who said they were unemployed but had not taken active steps to find work in the four weeks prior to the
interview) (Statistics South Africa, 2004a, xiii; Statistics South Africa, 2004b, 66-67).
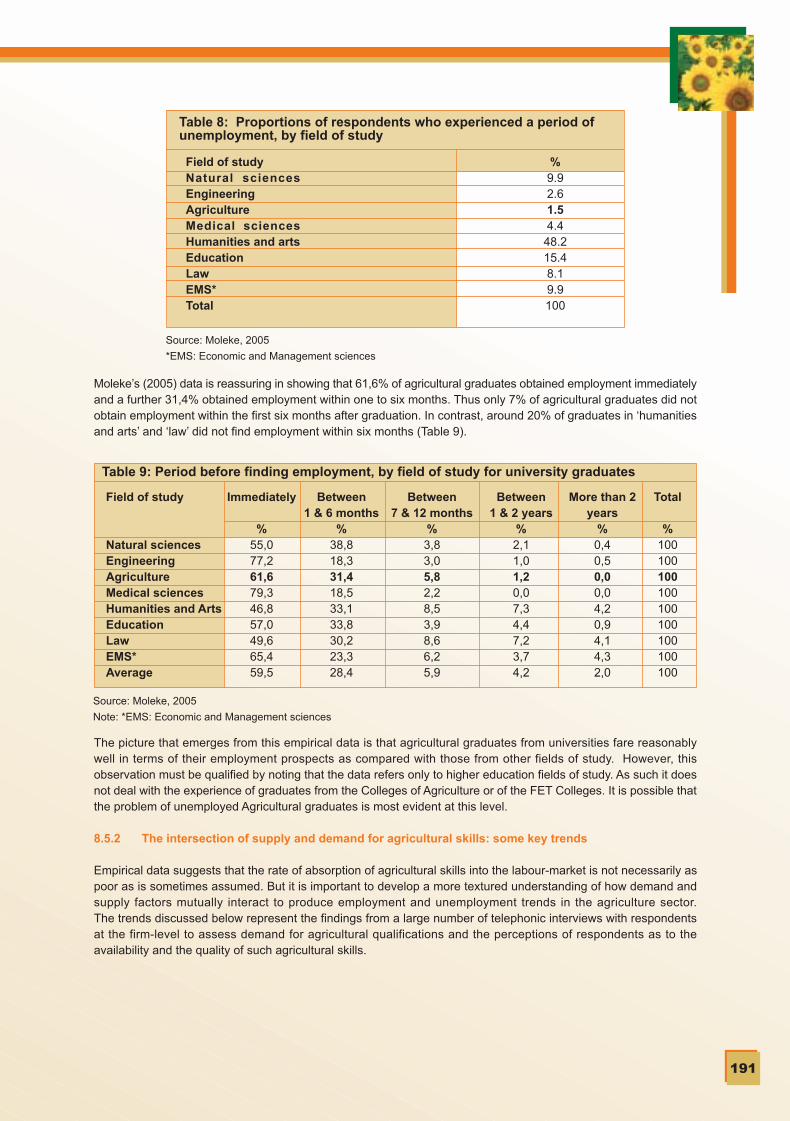
C M Y CM MY CY CMY K
191
Table 8: Proportions of respondents who experienced a period ofunemployment, by field of study
Field of studyNatural sciencesEngineeringAgricultureMedical sciencesHumanities and artsEducationLawEMS*Total
%9.92.61.54.4
48.215.48.19.9100
Source: Moleke, 2005
*EMS: Economic and Management sciences
Moleke’s (2005) data is reassuring in showing that 61,6% of agricultural graduates obtained employment immediatelyand a further 31,4% obtained employment within one to six months. Thus only 7% of agricultural graduates did notobtain employment within the first six months after graduation. In contrast, around 20% of graduates in ‘humanitiesand arts’ and ‘law’ did not find employment within six months (Table 9).
Table 9: Period before finding employment, by field of study for university graduates
Field of study
Natural sciencesEngineeringAgricultureMedical sciencesHumanities and ArtsEducationLawEMS*Average
Immediately
%55,077,261,679,346,857,049,665,459,5
Between1 & 6 months
%38,818,331,418,533,133,830,223,328,4
Between7 & 12 months
%3,83,05,82,28,53,98,66,25,9
Between1 & 2 years
%2,11,01,20,07,34,47,23,74,2
More than 2years
%0,40,50,00,04,20,94,14,32,0
Total
%100100100100100100100100100
Source: Moleke, 2005
Note: *EMS: Economic and Management sciences
The picture that emerges from this empirical data is that agricultural graduates from universities fare reasonablywell in terms of their employment prospects as compared with those from other fields of study. However, thisobservation must be qualified by noting that the data refers only to higher education fields of study. As such it doesnot deal with the experience of graduates from the Colleges of Agriculture or of the FET Colleges. It is possible thatthe problem of unemployed Agricultural graduates is most evident at this level.
8.5.2 The intersection of supply and demand for agricultural skills: some key trends
Empirical data suggests that the rate of absorption of agricultural skills into the labour-market is not necessarily aspoor as is sometimes assumed. But it is important to develop a more textured understanding of how demand andsupply factors mutually interact to produce employment and unemployment trends in the agriculture sector.The trends discussed below represent the findings from a large number of telephonic interviews with respondentsat the firm-level to assess demand for agricultural qualifications and the perceptions of respondents as to theavailability and the quality of such agricultural skills.

C M Y CM MY CY CMY K
192
These trends are listed below and each one in turn is then discussed extensively:• The agricultural sector is characterised by intra-sector mobility of skilled workers• The extent of labour market demand is hidden by qualification substitution• Demand for skills in the marketplace is mediated by employers who provide forms of focused but informal
in-service training• Not all individuals with the same agricultural qualifications are perceived to be equally desirable candidates
for employment• BEE and Employment Equity (EE) requirements compound the problem of scarce skills• The pattern of supply of agricultural qualifications shows rural-urban and socio-economic bias• The presence of regional ‘clusters’ of agricultural activity impact on the supply and demand of specific
agricultural qualifications• Higher private sector wages draw skills away from the public sector• The poor image of the sector is discouraging young and motivated individuals from pursuing a career in
agriculture• Lack of adequate labour-market information contributes to sector skills imbalances• Increasing formalisation of the relationships between role-players within the agricultural sector appears
to be driving demand for skills as well as an increased supply of formal training
The agricultural sector is characterised by intra-sector mobility of skilled workers: Many skilled employmentopportunities within the agricultural sector do not necessarily require a specific agricultural qualification. Individualswith agricultural qualifications thus have the ability to move between the various sub-sections of the industry relativelyeasily. This is particularly so for individuals with some work experience and higher levels of organisation, administrationand management skills. Individuals who have dual qualifications, or are willing to undertake cross-disciplinary trainingcan also move more freely between various sectors of the economy.
The extent of labour market demand is hidden by qualification substitution: Qualification substitution refersto instances where in the absence of finding candidates with preferred agricultural qualifications, employers arewilling to draw prospective candidates from a wider pool of possible qualifications. For example a firm wanting anAgricultural Engineer may eventually settle for a Civil Engineer, while a firm wanting an Agricultural Economist mayeventually settle for a B.Com student with the intention of providing the necessary extra training. As substitutioneliminates the original demand, true demand for a particular agricultural qualification is masked.
Demand for skills in the marketplace is mediated by employers who provide forms of focused but informalin-service training: Some employers argue that the specific nature of the formal qualification is irrelevant and thatno theoretical learning will equip a candidate to be able to be immediately productive within a specific job environment.Thus to these employers, who consider on-the-job training and experience as critical, the base qualification isincidental and only useful in so far as it provides an indication of the individual’s ability to learn, with other factorssuch as communication, inter-personal and organisational skills thus more important.
An example of this is provided by the unique occupational requirements of the processing of wool and mohairindustry, where economies of scale do not justify the development of a formal high-level qualification, and skills andtacit knowledge are currently developed through hands-on training and individual mentoring. As it is not viable todevelop formal courses for every niche area in which South African agriculture participates, providing support forlocal individuals to access internationally available formal training (e.g. in Australia or New Zealand in the case ofwool) could provide the most cost-effect means of supporting the skills needs of the smaller areas of the localagricultural sector.
Not all individuals with the same agricultural qualifications are perceived to be equally desirable candidatesfor employment: A number of respondents noted that job candidates with formal qualifications were not automaticallyperceived as being ‘competent to perform the tasks required’. This issue was presented in two different ways: Firstlysome employers regard with suspicion the quality of the qualifications available from certain tertiary institutions. Thisplaces individuals who have obtained qualifications from these particular institutions at a disadvantage.
Secondly, employers raised concerns regarding individuals’ soft-skills. Increasingly, individual competencies suchas a general understanding of the sector, as well as communication, presentation and language skills, are regardedas critical to succeed within the industry.
C M Y CM MY CY CMY K
193
Thus while for certain agricultural qualifications and specialisation areas there appears to be a real shortage of skills(e.g. M.Sc in Seed Science), in respect of other qualifications and specialisation areas (e.g. N.Dip.Agric in CropProduction) the issue of scarcity appears to have more to do with lack of competencies among graduates than theactual number of job candidates available.
BEE and Employment Equity (EE) requirements further compound the problem of scarce skills:The requirement to meet BEE and employment equity targets compounds the problem of obtainingcompetently qualified skills. Respondents stressed that in respect of certain skills (most notably AgriculturalEconomics and Agricultural Engineering) it was difficult enough to find any suitably qualified candidate,let alone candidates from a previously disadvantaged background. As a consequence, negative cyclesof ‘skills poaching’ often developed.
The supply of agricultural qualifications shows rural-urban and socio-economic bias: The socio-economic geography of the county appears to have an impact on the supply of agricultural qualifications.There appears to be a clear rural urban divide in terms of the availability of particular agriculturalqualifications, with higher-level qualifications more accessible to firms and organisations within the urbanareas than those in the rural areas. Respondents at rurally-based Colleges and Universities particularly,argued that their inability to attract suitable qualified high-level staff was because people did not wantto accept the quality of life associated with rural areas. Thus, while organisations in urban areas maypick employees from a relatively large pool, organisations in rural areas will often be forced to takewhomever they can get, with the impact of this pattern on rurally based teaching institutions a likelycontributor to this cycle of inequality.
Regional ‘clusters’ of agricultural activity impact on the supply and demand landscape of specific agriculturalqualifications: Clusters of agricultural activity develop within certain geographical regions. A cluster may createits own regionalised labour market of particular skills, leading to heightened demand for particular specialisationsor sub-specialisations and these thus being offered at local education institutions. Firms falling outside of this regionalcluster who are involved in this same activity will find it substantially more difficult to have their skills requirementsmet, than those falling within the geographical cluster. For instance, Rainbow Chickens farms the Worcester areaof the Western Cape, where there are virtually no other poultry producers, finds it substantially more difficult to attractsuitably qualified employees than do the firm’s operations based on the Highveld, where a large number of poultryproducing organisations (Rainbow Chickens, Early Bird, Sangrina, Chubby-Chick, Henwell and Daybreak) togetherform a geographical cluster. The impact that this cluster had on the course content at Potchefstoom College ofAgriculture provides an example of the impact of clusters on the supply of skills: Since 1999 the College has includedin their undergraduate N.Dip.Agric curriculum a course on poultry production which was first developed as a short-course in 1995 in response to local industry requests.
Higher private sector wages draw skills away from the public sector: Disparities in wages and perks betweenthe public and the private sector heighten the scarcity of skills within the former. Public sector organisations in ruralareas are most strongly affected in terms of their ability to obtain and retain highly qualified individuals. The publicsector tends to bear a large part of the responsibility for generating the skills and knowledge required to sustainagriculture in the long-run. Furthermore, the practice of agriculture is still to a large extent based in rural areas wherepoverty is highest and livelihood creation most urgent, and the continuation of this trend has potentially detrimentaleffects both to public sector delivery (e.g. state veterinarian and technical extension services) as well as the nationaldevelopment objectives.
The poor image of the sector is discouraging young and motivated individuals from pursuing a career inagriculture: This particular concern was raised by a number of respondents in relation to all areas of the sectorand has relevance not only to the number of people who choose to study agriculture, but also on the retention ratewithin the industry of people with such qualifications. This is also because other sectors within the economy provideopportunity for motivated and skilled individuals to enter, regardless of the specific nature of their formal qualification.
Lack of adequate labour-market information among employers and work-seekers contributes to sector skillsimbalances: The availability of information regarding the general as well as specific areas of demand for agriculturalqualifications within the agricultural sector is critical to approaching an equilibrium between supply and demand.
C M Y CM MY CY CMY K
194
This is because knowledge of where the demand is – by occupation or sector - would not only direct work-seekersto suitable employers, but also stimulate supply through encouraging individuals who want to be assured of futureemployment opportunities to study in particular fields. Lack of adequate information may be contributing to theexistence of surplus skills in some agricultural qualification specialisations, when under-supply exists in other regions,sub-sectors or organisations.
Increasing formalisation of the relationships between sectoral role-players within the agricultural sectorappears to be driving demand for skills: There is some evidence that where closer and more formalised relationshipsexist between the role-players within an agricultural sub-sector, there is also greater demand for agriculturalqualifications. Examples are evident where there is vertical integration of operations within certain companies (e.g.McCains, Rainbow Chickens etc); in certain sub-sectors (e.g. wine-grape and wine production); and in certainformalised producer/buyer relationships (e.g. between Woolworths and Capespan, and their receptive suppliers).
Horizontal industry organisation also leads to formalisation of the relationships between various role-players. Thisis evidenced through the various large producer organisations and associations such as the Citrus Growers Associationand the South African Sugar Association. Reasons for this include: improved cost-effectiveness of launching purpose-driven sub-sector specific high-level qualifications due to economies of scale; increased demand through increasedproductivity requirements; or simply increased information-sharing resulting in an increased general awareness ofthe availability and ability of individuals with the respective formal qualifications.
Increasing formalisation of the relationships between sectoral role-players appears to be contributingtowards an increased supply of formal training: Organisation of role-players within the various sub-sectors ofthe industry into associations, societies and organisations appears to have positive effects on formal skills developmentin support of that particular sub-sector. This is evident by the number of associations and their related institutionsthat provide opportunities to individuals to obtain formal qualifications through the provision of various bursary andfinancial support schemes. Additionally, associations, societies and organisations have been key in the developmentof certain industry-specific training material. Such training is presented either through association-affiliated traininginstitutions or in co-operation with public or private formal education and training institutions. Examples of this lattermeans of contribution to the development of formal industry-relevant skills as highlighted in this research includethe South African Animal Health Association’s ‘AVCASA Animal Health Course’ offered by the Tshwane Universityof Technology (TUT); the Fertilizer Society of South Africa’s ‘Fertiliser Advisor’s Course’ also offered through TUT;the South African Sugar Association’s uShukela Training Centre and SASRI short-courses; and finally the NationalHigher Certificate in Tanning Technology offered by the International School of Tanning Technology in Grahamstown.
8.6 Conclusion
In this chapter we reiterated that the total number of agricultural graduates entering the labour force on an annualbasis at the present time is in the region of 2 550. With a total pool of agriculturally qualified individuals within thelabour force of between 33 000 and 42 000, this annual pool of graduates can compensate for annual losses ofskilled workers within the sector to the magnitude of between 6.1% and 7.7%. Whether this supply is able to satisfythe demand arising from the need to replace skills within the sector combined with the need arising from ‘new’demand associated with sub-sectoral growth and skills compositional changes is however uncertain due to the lackof information about the factors impacting on occupational replacement and new demand within the sector.
Further evidence from Moleke (2005) suggests that 93% of graduates from the higher education institutions aresucceeding in finding employment within six months of graduation. As this study does not include information aboutgraduates from the FET and Agricultural Colleges, this may however be presenting a somewhat skewed picture ofthe overall situation.
C M Y CM MY CY CMY K
195
A large number of telephone interviews were undertaken with a industry representatives regarding their requirementsand efforts to secure intermediate to high-level agricultural qualifications. Key findings included: many agriculturalqualifications permit mobility between a wide array of occupational opportunities, employers are substituting neededskills with second best qualifications, or are providing in-service training to compensate for skills needs, spatiallocation and industry clustering creates localised labour markets outside of which sourcing skills is difficult, lack ofadequate labour-market information exacerbates skills-jobs mismatches, and increasing formalisation of therelationships between role-players through vertical integration and industry associations is driving both demand forhigh-levels skills as formal training.
Based on the findings emerging from this and the previous chapters, the final chapter of this report presents theauthors’ recommendations as to how to facilitate a greater level of equilibrium between the supply and demand foragricultural qualifications in the South African labour market.
8.7 References
Bhorat, H. (2003) “The post-apartheid challenge: Labour demand trends in the South African labour market, 1995-1999” Development Policy Research Unit Working Paper 03/82 August 2003.
Bhorat, H. and Oosthuizen, M. (2005) “The post-apartheid South African Labour Market” Development PolicyResearch Unit Working Paper 05/93 DPRU, University of Cape Town April 2005.
Cosser, M. with du Toit, J. (2002). From School to Higher Education? Factors Affecting the Choices of Grade 12Learners. Cape Town: HSRC Publishers.
Moleke, P. (2005) Finding work: Employment experiences of South African graduates Pretoria, HSRC Press.
Statistics South Africa (2004b) Labour Force Survey March 2004 Pretoria.
Statistics South Africa (2004b) Metadata P0210 Labour Force Survey March 2004 Pretoria.
Statistics South Africa (2004c) Census of Commercial Agriculture 2002 (Summary) Pretoria
Woolard, I., Kneebone, P, & Lee, D. (2003) Forecasting the demand for scarce skills, 2001 – 2006 In: HumanSciences Research Council (2003) Human Resources Development Review 2003: Education, Employment andSkills in South Africa Cape Town: HSRC Press.
Vass, J. (2003) The impact of HIV/AIDS In: HSRC (eds) Human Resources Development Review 2003: Education,Employment and Skills in South Africa Cape Town HSRC Press.

C M Y CM MY CY CMY K

C M Y CM MY CY CMY K

C M Y CM MY CY CMY K
198
CHAPTER 9
Recommendations
9.1 Improving the sourcing and use of HRD information in the agricultural sector
Increase collection and use of information on mission critical agricultural skills needs in national and provincial departments of agriculture. Improve data collection on agricultural qualifications at national andprovincial government level. The Department of Agriculture may encourage Human Resources (HR), Training and Finance departments to collaborate in making data on skills needs, skills gaps and training expenditure available to line managers. It may also encourage HR line managers to keep job descriptionsand vacant posts as recent as possible and to capture and track data on the advertisement of posts in thenational and provincial departments of agriculture.
Improve the distribution of both supply and demand data to all role-players within the agricultural sector. The Department of Agriculture may consider organising an annual workshop/conference/event that bringstogether training practitioners, HR and Training managers from government, private enterprises, the professions, industry coordinating bodies with training activities, and education institutions. In this way cross-sectoral and inter-institutional collaboration can be facilitated.
Information regarding the demand for and supply of agricultural skills must be disseminated systematicallythrough public media available to the National Department of Agriculture. The Department may use itswebsite to make information available to any person or enterprise with access to the internet. Such aninformation portal created for the sector will need to be marketed on a national level. This strategic optionwill not replace marketing and information dissemination aimed at improving the image of the sector to people who do not have access to the internet.
9.2 Generating greater interest in agricultural careers
Market the agricultural sector’s broad range of career possibilities to the general public. This must be donenot only in schools. Marketing needs to transform the view that agriculture qualifications lead only to jobsas farmers, farm managers or farm workers. As a starting point, the excellent “Careers in Agriculture” booklet produced by the Directorate of Education and Training can be distributed widely. This publication can be updated on an annual basis.
9.3 Emphasising opportunities for career-pathing in agricultural fields
The Department of Agriculture should discuss with the Department of Education how to make it possible for students who take agriculture as a subject at school to also take the key gateway subjects of Mathematicsand Science. For instance, this may involve investigating which schools and how many schools offer Agricultural Science at the Higher Grade (even though this grading is being phased out), and of these schools how many also offer Mathematics and Science.This is especially important because learners fromformerly disadvantaged groups have historically received limited opportunities and exposure in the domainsof Mathematics and Science education.
As part of a strategy designed to improve the flow of scarce skills into the agricultural sector, the Departmentof Agriculture should not depend only on graduates with Agriculture qualifications. For example, graduateswith B.Sc qualifications will also possess key skill-sets which are critical to the sustainability of the agriculturalsector. By recruiting B.Sc graduates into agricultural degree programmes at the Honours, Masters and PhDlevels, the pool of agriculturally focussed post-graduate students can be enlarged. This approach can be driven through bursary allocations for example.

C M Y CM MY CY CMY K
199
9.4 Sustaining the quality and focus of intermediate to higher education programmes
It is necessary to investigate why students who obtain access to agricultural programmes are not equallysuccessful in completing their courses and graduating. There are clear gender and race differentials in theextent to which enrolment, graduations and throughput are distributed. These patterns occur between institutions and between different study fields. The Department of Agriculture may consider monitoring these patterns more closely so as to identify and ameliorate the causes.
In co-operation with the Department of Education, the Department of Agriculture needs to promote qualitybenchmarks that are applicable to equivalent agricultural qualifications across the institutions offering courses on the same NQF level. This can promote the equitable absorption - and success - of graduatesfrom rurally-based and previously disadvantaged institutions into the labour-market. Graduates from rurally based and previously disadvantaged institutions are currently being negatively impacted by perceived aswell as real quality differences between their education and those graduates from urban-based and historically white institutions.
Over and above issues of ‘quality’ of programmes, it is important that students admitted at the entry-levelare supported to deal with the content and pedagogical relationships that are very different at higher education institutions than at school or in the FET band. Higher education institutions should ensure that there is provision being made for alternative paths of entry for individuals who do not meet direct requirementsin the first instance. One such alternative is the provision of bridging courses of which there are examplesfrom which to absorb best practises.
Institutions which aim to support access to particular programmes need to creatively seek alternative meansof bringing students in, who might on first application not meet the set criteria. For example, it is possible to leverage successful completion of the first-year of a lower level agriculture related/relevant qualificationas evidence of individual capability. The Agriculture Department at the University of the Free State, for instance, has an entry-policy in place where students who do not meet the direct entry requirements for a B.Sc.Agric are considered upon passing the first year of the B.Agric.
The Department of Agriculture should investigate the possibility of supporting rural-based agricultural training institutions, such as Colleges and universities to obtain staff with the appropriate qualifications.
In co-operation with the Department of Education, the Department of Agriculture needs to reinforce the importance of general life and workplace skills such as: communication and language skills; teamwork skills; ability to work independently; ability to use computers in the workplace etc. This is important for students of agriculture in high schools as well as in higher education to appreciate because these attributesincrease employability over and above the actual qualification achieved. A small-scale investigation into how higher education agriculture curricula take account of the need for life skills could be undertaken.
Areas of knowledge addressing ‘Agriculture as Business’ are becoming increasingly important within the industry i.e. finance, business skills and project management skills. Education institutions offering qualifications in agriculture must be encouraged to ensure these forms of knowledge are included in curricula.
The Department of Agriculture has recently emphasised the importance of integrating education and trainingprogrammes to facilitate progression and career pathing. The NQF is an important mechanism or structurethat supports such an aim. The complexity of relationships between programmes in different higher educationinstitutions makes it unfeasible to attempt to bring about integration of all programmes, qualifications andlevels. It is preferable to focus on facilitating particular career and study pathways leading either to specificqualifications or specific occupations. The Department of Agriculture may target particular career paths orstudy programmes and put in place a plan of action to facilitate the flow of cohorts of students towards thegoal of obtaining employment in occupations that have scarce skills needs. This can be undertaken in collaboration with relevant education institutions, funders and employer role-players.
C M Y CM MY CY CMY K
200
9.5 Strategically targeting scarce skills
Shortage of particular skills sets creates bottlenecks in the productivity of both public and private sectors.The Department of Agriculture should select a set of key occupations that are known to be in short supplyand conduct an analysis of the likely future demand for these occupations over a five to ten year period (eg: veterinarians, seed scientists etc.).
The need for personnel in the agricultural R&D field is substantial and growing. The Department of Agricultureshould encourage an increase in the number of graduates obtaining higher level agricultural and researchqualifications at the M.Sc and PhD levels.
The Department of Agriculture should consider setting aside funding for ‘bursaries’ to international institutionsfor particular qualifications, which are not offered locally and are not likely to be offered soon (eg: Wool industry qualifications not available in South Africa but offered in Australia). This will assist in sustaining the skills base of small agricultural sub-sectors. At the same time these opportunities could promote equalityof access to financial support across different sub-sectors.
The Department of Agriculture should investigate the possibility of implementing a scarce skills allowanceand rural allowance that applies to particular scarce skills in the public service (eg: such as veterinarians).This strategy may assist in restoring the capacity of the Department of Agriculture to provide services in areas where there are large numbers of vacant posts.
9.6 Support for stronger cooperation between training providers and employers
This research showed how various industry bodies are supporting training. The Department of Agricultureshould consider ways of supporting industry organisations (eg: sub-sectoral bodies such as in the sugar industry or professional associations) which through their activities improve the training and skills developmentculture, act as networking hubs for skills related information, and sometimes themselves engage in training.
The Department of Agriculture may consider contracting a research agency to conduct skills needs analysisfor particular agricultural sub-sectors. Such studies have been undertaken by sub-sectors such as the Viticulture industry. Employers are generally reluctant to invest money in training but if a trustworthy empiricalanalysis were undertaken of the value system of a particular industry to show skills needs, employers wouldbe more likely to invest in training.
The importance of cooperation between public sector, private sector and higher education is strongly evident. The Department of Agriculture should seek ways of supporting higher education-industry linkagesthat involve the development of curricula and programmes to meet niche industry needs in either the publicor the private sector. This research encountered several examples of valuable collaboration between institutions and enterprises in establishing sector specific programmes to meet particular skills needs.
The Department of Labour has recently restructured the agriculture based SETAs to create the new AGRISETA. The former SETAs had already registered a number of industry-specific and generally oriented Learnerships. These initiatives should be taken forward with the support of the Department of Agriculture.
Various bodies are involved in providing training at the intermediate to higher education level, but these training courses are not necessarily accredited. The Department of Agriculture may consider consolidatinga stronger relationship with the new AGRISETA to support the accreditation of intermediate to high-level skills that are developed in the form of Learnerships and other Skills Programmes at the appropriate levels.
The Department of Agriculture may consider commissioning case studies of organised sub-sectors withinthe agriculture sector which have established relationships with education providers (eg: higher educationinstitutions, agricultural colleges etc.) to identify best practise models of curriculum development in key fields of agriculture.

C M Y CM MY CY CMY K
201
9.7 Fostering inter-governmental collaboration
The research suggests that Agricultural High Schools are becoming more strongly generalist and losing their original mission focus. The Department of Agriculture may open discussion with the Department of Education with the aim of assisting to shape the future of the Agricultural High Schools. Most importantly,those schools that have a campus where agricultural practices can be undertaken should be utilised specifically for the purpose of generating skills for the sector.
The Minister of Education has been tasked with driving the South African Human Resources Developmentstrategy. The Department of Agriculture may wish to engage with the Minister of Education with respect to defining the mission of the Agricultural Colleges. There is evidence that certain provinces aim to shift the higher education mandate of Colleges towards farmer support (e.g.: Mpumalanga province). The intention here is not to dispute the right of provinces to take such decisions. Rather, the generally important issue is to ensure that there is a sustainable infrastructure of institutions of higher education that can supply the agricultural sector with its skills needs. If it is considered that the Colleges of Agriculture are fulfilling an important higher education purpose, then a shift away from their intended mission will need to be compensated.
9.8 Using research to understand how young people make education – career path choices
Conduct tracer studies to follow the career choices of young people: in the year of their first major careeroriented subject choice in Grade 9, and in the critical periods when they make decisions regarding higher education studies and occupational choice. This will assist the Department in understanding the motives that drive learners to choose or not to choose an agriculture career.
Monitor and track the development and career advancement of ‘scarce skills’ bursary recipients. This is important to ensure that investments in bursary recipients are contributing not only to the career advancementand productivity of the individuals, but also to the strengthening of the agricultural sector, which needs suchskills and qualifications.
Appendices
Appendix 1 Definitions used in this project
Appendix 2 Chapter 2
Appendix 3 Chapter 3
Appendix 4 Chapter 5
Appendix 5 Chapter 7

C M Y CM MY CY CMY K
202
APPENDIX 1
DEFINITIONS USED IN THIS PROJECT
• ‘Qualification’ represents a planned combination of learning outcomes which has a defined purpose or purposes, and which is intended to provide qualifying learners with applied competence and a basis for further learning. It is characterised by the following: the qualification is achieved. (LMSDP, 2002)
• ‘Qualification’ is the degree, diploma or certificate which an institution awards to a student on the successfulcompletion of a programme of studies.
• ‘Course’ is a component within a programme of study for a qualification. It has these characteristics: (a) It is an identifiable teaching/learning component that may be undertaken in more than a year, in a yearor semester or shorter period. (b) Student performance in the component is assessed and recorded in the central record system. (c) The component has a unique identifying "course code" which is assigned to it in the institution's centralrecord system.A course may be a component undertaken as coursework, or as a project, or as a thesis, or as a dissertation,or as a practicum, or as a mixture of such types.
• ‘Course’ refers to the content of the short learning programme whereby learners may progressively attainthe applied knowledge as described in unit standards and/or qualifications. An outcome is the demonstrableand assessable end products of a learning process. An exit-level outcome has the same meaning, but is expressed as the overall result of learning for a qualification. (SAQA, 2004)
• ‘Curriculum’ defines how the teaching-learning opportunities and experiences of learners will take shapefor a particular qualification, i.e. the content and process of learning. It integrates theory and practice. Curricula may differ from provider to provider for the same unit standard or qualification as long as the outcomes of the unit standard or qualification are met. (LMSDP, 2002)
• ‘Programme’ means a coherent set of courses, leading to a certain qualification (SAQA, 2000:5).(SAQA, 2004)
• ‘Learning programme’ details how learners should achieve the outcomes of particular unit standards andqualifications. A learning programme indicates how the standards will be combined and sequenced acrossdifferent modules, and across workplace learning and institutional learning in order to achieve the outcomesof a qualification. ETQAs may issue criteria which learning programmes should meet, or further guidelines.(LMSDP, 2002)
• ‘Senior Certificate’ means a school leaving certificate awarded by the South African Certification Council.(CTP, 2002)
• ‘Unit standard’ is a nationally agreed and registered, and internationally comparable statement of specificoutcomes and their associated assessment criteria, written in a standard format and registered on the NQFat a defined level. A unit standard is the building block of a unit standards-based qualification.(LMSDP, 2002)
• ‘Unit standard’ is a description of the outcomes of learning for which the learner will receive credit.(SAQA, 2004)
• National Qualifications Framework (NQF) - The NQF was established in terms of the SAQA Act 58 of 1995. It is a framework on which national standards and qualifications offered at schools, institutions andin the workplace are registered. (LMSDP, 2002)
• Further Education and Training (FET) - FET is all learning and training programmes leading to qualificationsfrom levels 2 to 4 on the National Qualifications Framework (known as the FET band). These levels are above general education and training but below higher education and training. (LMSDP, 2002)
• Further Education and Training (FET) Institution - A FET institution is any institution that provides furthereducation and training on a full-time, part-time or distance basis and which is:o established or regarded as having been established as a public further education and training
institution under the Further Education and Training Act 98 of 1998o declared as a public further education and training institution under this Acto registered or conditionally registered as a private further education and training institution under
this Act. (LMSDP, 2002)• Higher Education and Training (HET) - HET is all learning and training programmes leading to qualifications
from levels 5 to 8 of the National Qualifications Framework (known as the HET band). These levels are above further education and training. (LMSDP, 2002)
C M Y CM MY CY CMY K
203
• ‘Accreditation’ means the certification, usually for a particular period of time, of a person, a body or an institution as having the capacity to fulfil a particular function in the quality assurance system set up by SAQA in terms of the Act (No. 58 of 1995). (SAQA, 2004)
References
Committee of Technikon Principals (CTP) (2002) A policy document on the requirements for admission to a TechnikonNovember 2002 Pretoria, CTPAccessed at: www.nu.ac.za/ieasa/EntranceRequirements.PDFDate accessed: 14 March 2005
Department of Education (DoE) (2004) Further Education and Training (FET) college examinations report: 2004PretoriaAccessed at:28b-12-04%20Final.docDate accessed: 14 March 2005
Labour Market Skills Development Programme (LMSDP) (2002) Understanding the South African Skills DevelopmentSystem: A reference source Pretoria, Department of Labour.Accessed at: www.trainingsupport.co.za/Docs/NQF%20QUICK%20Ref.pdf -Date accessed: 15 March 2005
South Africa, Government of (1995) Act No.27 of 1995 Technikons Amendment Act No. 159. 21 July 1995.
South African qualifications Authority (SAQA) (2004) Criteria and Guidelines for Short Courses and Skills Programmes:Guideline document Pretoria, SAQAAccessed at: http://www.uovs.ac.za/support/chesd/03/Part%201.pdfDate accessed: 16 March 2005
Strydom, J.F. (2002) Access to Higher Education: A research project for the FOTIM and FSHFETT Johannesburg,FOTIM/FSHFETT.Accessed at: http://www.fotim.ac.za/docs/accessstrydomreport1102.docDate accessed: 04 March 2005

C M Y CM MY CY CMY K
204
APPENDIX 2: CHAPTER 2
ResearchMaster’sDegree
(120 @ Pg3)
BachelorHonoursdegree
(120 @ Pg1)
General Bacherlor’s Degree(120 @ 7)
General Diploma(90@ 6)
FETC(72 @ 4)
StructuredMaster’sDegree
(60 @Pg3)
Master’sDiploma
(120 @ Pg2)
GeneralPostgraduate
Diploma(120 @ Pg1)
StructuredMaster’sDegree
(120 @Pg3)
Master’sDiploma
(120@ Pg2)
Advanced Careerfocused
Bachelor’s Degree(e.g. B. Tech)(120 @Pg1)
StructuredMaster’sDegree
(60 @Pg3)
ProfessionalMaster’sDegree
(180@ Pg2)
Career focusedPostgraduate
Diploma(120 @Pg1)
Career-focused Bachelor’s Degree(120 @ 7)
Career-focused Diploma(90 @ 6)
Career-focused Certificate(72 @ 5)
FETC(72 @ 4)
NQF
8
8
8
8
7
6
5
4
HESub-levels
PG 4
PG 3
PG 2
PG 1
(Cumulativemin totals) &min credits
perqualification
(1020)360
(660)180
(600)180/120
(480)480/120
(360)360/120
(240)240
(120)120
(120)120
GeneralVertical articulation
Doctor of Philosophy(360 @ Pg4)
Career-focusedVertical articulation
Doctor of philosophy,Professional Doctorate
(360 @ Pg4)
ArticulationHorisontal &Diagonalarticulation
Master’sCertificate(72 @Pg2)(articulation
credits)
Master’sCertificate(72 @Pg2)(articulation
credits)
GraduateCertificate(72 @ 7 )
(articulationcredits)
(articulationcredits)
FoundationCertificate(72 @ 5)
BridgingCertificate(72 @ 4 )
Source: Council for Higher Education (2003)
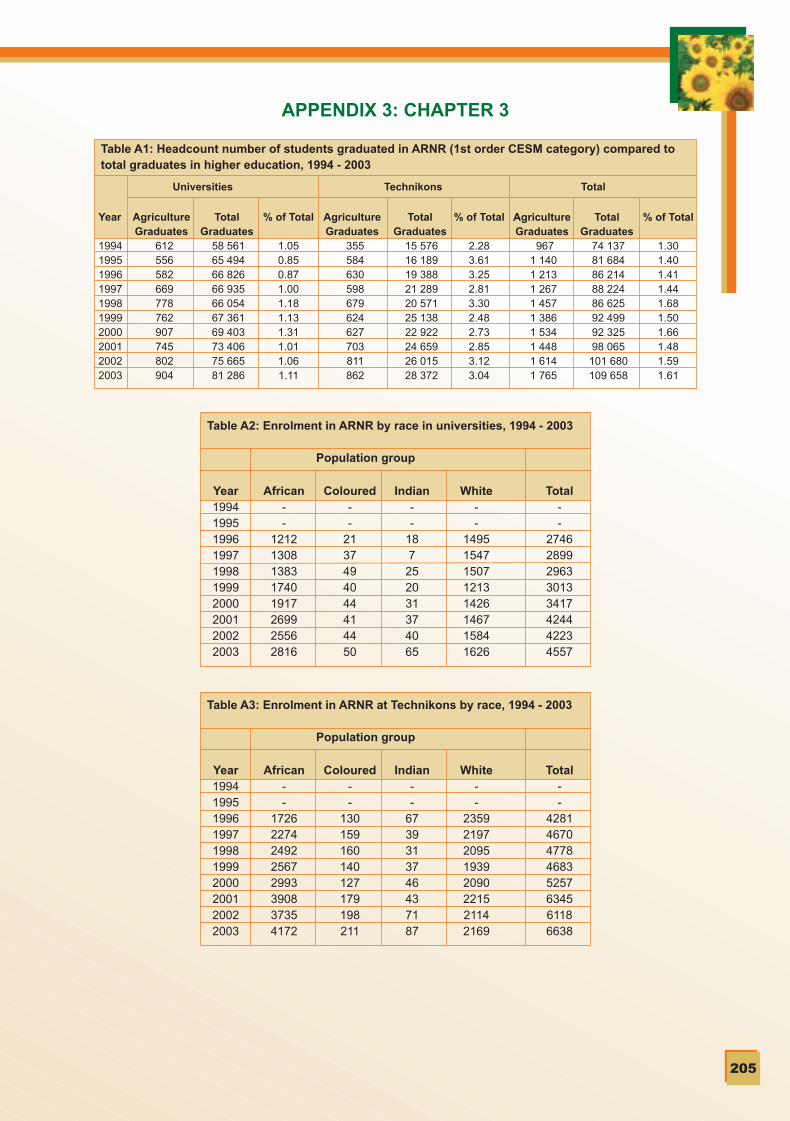
C M Y CM MY CY CMY K
205
APPENDIX 3: CHAPTER 3
Table A1: Headcount number of students graduated in ARNR (1st order CESM category) compared tototal graduates in higher education, 1994 - 2003
Universities Technikons Total
Year
1994199519961997199819992000200120022003
AgricultureGraduates
612 556 582 669 778 762 907 745 802 904
% of Total
1.050.850.871.001.181.131.311.011.061.11
TotalGraduates
58 561 65 494 66 826 66 935 66 054 67 361 69 403 73 406 75 665 81 286
AgricultureGraduates
355 584 630 598 679 624 627 703 811 862
TotalGraduates
15 576 16 189 19 388 21 289 20 571 25 138 22 922 24 659 26 015 28 372
% of Total
2.283.613.252.813.302.482.732.853.123.04
AgricultureGraduates
967 1 140 1 213 1 267 1 457 1 386 1 534 1 448 1 614 1 765
TotalGraduates
74 137 81 684 86 214 88 224 86 625 92 499 92 325 98 065 101 680 109 658
% of Total
1.301.401.411.441.681.501.661.481.591.61
Table A2: Enrolment in ARNR by race in universities, 1994 - 2003
Population group
Year1994199519961997199819992000200120022003
African--
12121308138317401917269925562816
Indian--
187
252031374065
Coloured--
2137494044414450
White--
14951547150712131426146715841626
Total--
27462899296330133417424442234557
Table A3: Enrolment in ARNR at Technikons by race, 1994 - 2003
Population group
Year1994199519961997199819992000200120022003
African--
17262274249225672993390837354172
Indian--
6739313746437187
Coloured--
130159160140127179198211
White--
23592197209519392090221521142169
Total--
42814670477846835257634561186638

C M Y CM MY CY CMY K
206
Table A4: Total ARNR enrolment in universities and Technikonsby race, 1994 - 2003
Population group
Year1994199519961997199819992000200120022003
African--
29373582387543074910660762916988
Indian--
844756577880110152
Coloured--
152196209180171221242261
White--
38543744360131523516368236993795
Total--
70277569774176968675
105891034111195
Table A5: Graduates in ARNR by race in universities, 1994 - 2003
Population group
Year1994199519961997199819992000200120022003
African--
215267315424473364375529
Indian--257395
105
Coloured--57
19131341110
White--
360391437323412371406360
Total--
582669778762907745802904
Table A6: Graduates in ARNR from technikons by race, 1994 - 2003
Population group
Year1994199519961997199819992000200120022003
African--
141152299261289344417512
Indian--18232582
Coloured--
2416192213182223
White--
465422359339323337364325
Total--
630598679624627703810862

C M Y CM MY CY CMY K
207
Table A7: Graduations in ARNR by race in universities andTechnikons, 1994 - 2003
Population group
Year1994199519961997199819992000200120022003
African--
356419614685762707792
1041
Indian--3
13961110187
Coloured--
3022373426223332
White--
825813796662736708770685
Total--
12131267145713861534144816131765
Table A9: Graduates in ARNR by race at Technikons in percentage, 1994 - 2003
Population group
Year1994199519961997199819992000200120022003
African--
2225444246495159
Indian--01000110
Coloured--43332333
White--
7471535452484538
Total--
100100100100100100100100
Table A8: Graduates in ARNR by race at universities inpercentage, 1994 - 2003
Population group
Year1994199519961997199819992000200120022003
African--
3740415652494759
Indian--01101111
Coloured--11221111
White--
6258564245505140
Total--
100100100100100100100100

C M Y CM MY CY CMY K
208
Table A10: Total ARNR graduation by race from universities and Technikons in percentage, 1994 - 2003
Population group
Year1994199519961997199819992000200120022003
African--
1212161616111315
Indian--3
2817101412164
Coloured--
2011181915101412
White--
2122222121192118
Total--
1717191818141616
Table A11: Enrolment in ARNR at universities bygender, 1994 - 2003
Gender
Year1994199519961997199819992000200120022003
Female--
786878972
12311330183017591918
Total--
27462899296330133417424442234558
Male--
19592020199117822087241424642640
Table A12: Enrolment in ARNR at universities bygender, 1994 - 2003
Gender
Year1994199519961997199819992000200120022003
Female--
14221666177116731877240322662471
Total--
42814670477846825258634661256638
Male--
28593004300730093381394438594167

C M Y CM MY CY CMY K
209
Table A13: Total enrolment at universities andTechnikons by gender, 1994 – 2003
Gender
Year1994199519961997199819992000200120022003
Female--
22082544274429043207423340254388
Total--
70277569774176958676
105901034811196
Male--
48195024499847915468635863236807
Table A14: Graduates in ARNR at university bygender, 1994 - 2003
Gender
Year1994199519961997199819992000200120022003
Female--
162185266326359314367400
Total--
582669778762907745802904
Male--
420484512436548430435504
Table A15: Graduates in ARNR from Technikons bygender, 1994 - 2003
Gender
Year1994199519961997199819992000200120022003
Female--
178171218211191227284339
Total--
630598679624627703811862
Male--
453427461414436476527523

C M Y CM MY CY CMY K
210
Table A16: Total ARNR graduates at universitiesand Technikons by gender, 1994 - 2003
Gender
Year1994199519961997199819992000200120022003
Female--
340356484536550542651739
Total--
12131267145713861534144816141765
Male--
873911973850984906963
1027
Table A17: Graduates in ARNR from university bygender in percentage, 1994 - 2003
Gender
Year1994199519961997199819992000200120022003
Female--
2828344340424644
Total--
100100100100100100100100
Male--
7272665760585456
Table A18: Graduates in ARNR from Technikons by gender in percentage, 1994 - 2003
Gender
Year1994199519961997199819992000200120022003
Female--
2829323430323539
Total--
100100100100100100100100
Male--
7271686670686561
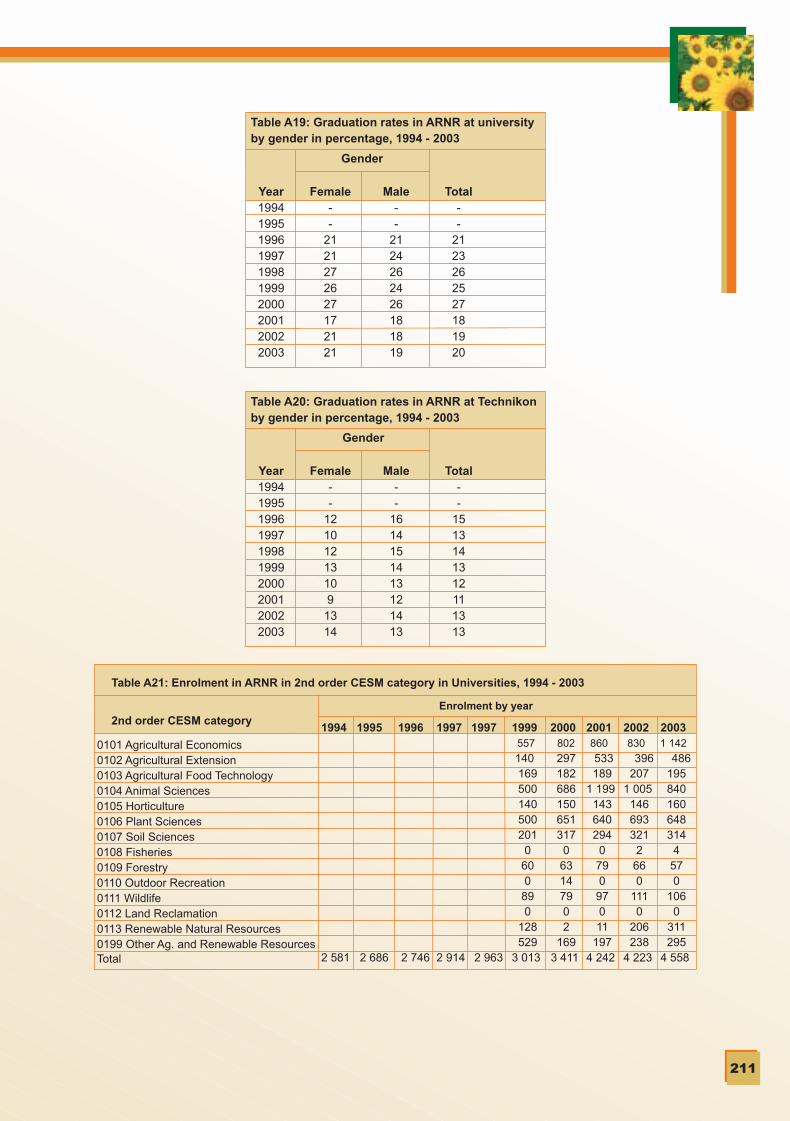
C M Y CM MY CY CMY K
211
Table A19: Graduation rates in ARNR at universityby gender in percentage, 1994 - 2003
Gender
Year1994199519961997199819992000200120022003
Female--
2121272627172121
Total--
2123262527181920
Male--
2124262426181819
Table A20: Graduation rates in ARNR at Technikonby gender in percentage, 1994 - 2003
Gender
Year1994199519961997199819992000200120022003
Female--
12101213109
1314
Total--
1513141312111313
Male--
1614151413121413
Table A21: Enrolment in ARNR in 2nd order CESM category in Universities, 1994 - 2003
Enrolment by year2nd order CESM category
0101 Agricultural Economics0102 Agricultural Extension0103 Agricultural Food Technology0104 Animal Sciences0105 Horticulture0106 Plant Sciences0107 Soil Sciences0108 Fisheries0109 Forestry0110 Outdoor Recreation0111 Wildlife0112 Land Reclamation0113 Renewable Natural Resources0199 Other Ag. and Renewable ResourcesTotal
1994
2 581
1995
2 686
1996
2 746
1997
2 914
1997
2 963
1999 557
140 169 500 140 500 201 0
60 0
89 0
128 529
3 013
2000 802
297 182 686 150 651 317
0 63 14 79 0 2
169 3 411
2001860
533 189
1 199 143 640 294
0 79 0
97 0 11
197 4 242
2002830
396 207 1 005 146 693 321
2 66 0
111 0
206 238 4 223
20031 142
486 195 840 160 648 314
4 57 0
106 0
311 295
4 558
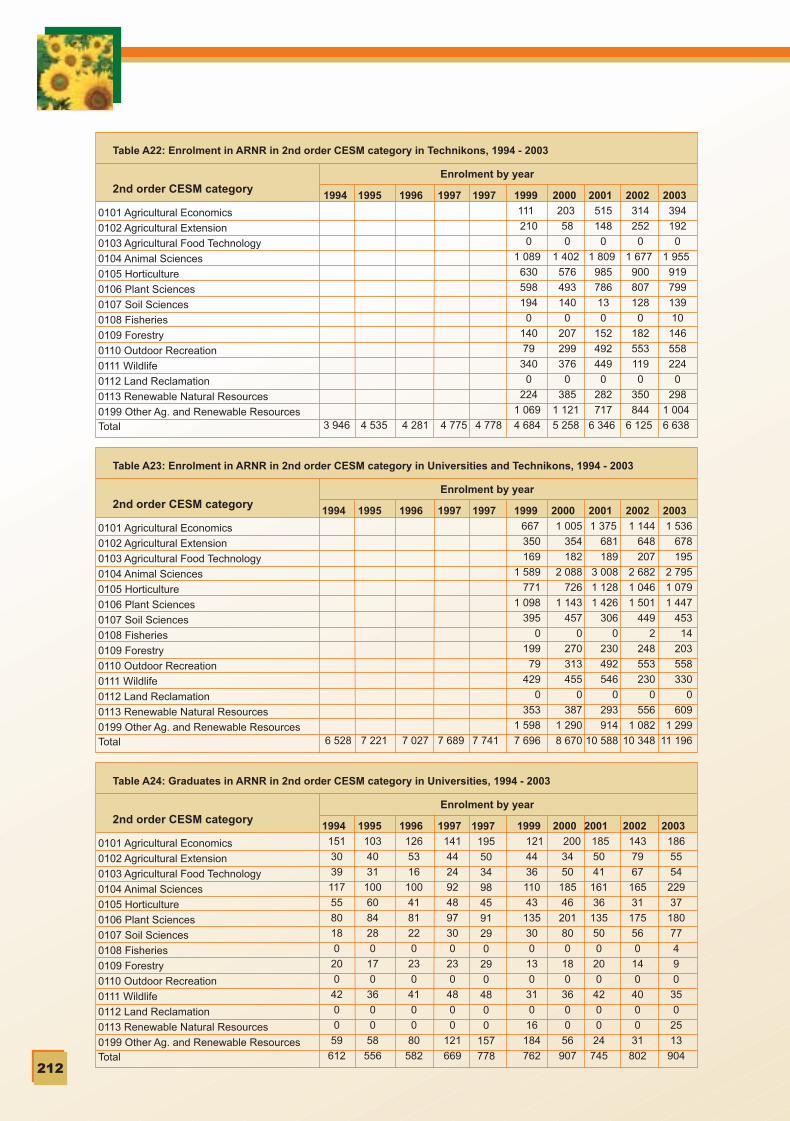
C M Y CM MY CY CMY K
212
Table A22: Enrolment in ARNR in 2nd order CESM category in Technikons, 1994 - 2003
Enrolment by year2nd order CESM category
0101 Agricultural Economics
0102 Agricultural Extension
0103 Agricultural Food Technology
0104 Animal Sciences
0105 Horticulture
0106 Plant Sciences
0107 Soil Sciences
0108 Fisheries
0109 Forestry
0110 Outdoor Recreation
0111 Wildlife
0112 Land Reclamation
0113 Renewable Natural Resources
0199 Other Ag. and Renewable ResourcesTotal
1994
3 946
1995
4 535
1996
4 281
1997
4 775
1997
4 778
1999
111
210
0
1 089
630
598
194
0
140
79
340
0
224
1 069
4 684
2000
203
58
0
1 402
576
493
140
0
207
299
376
0
385
1 121
5 258
2001
515
148
0
1 809
985
786
13
0
152
492
449
0
282
717
6 346
2002
314
252
0
1 677
900
807
128
0
182
553
119
0
350
844
6 125
2003
394
192
0
1 955
919
799
139
10
146
558
224
0
298
1 004
6 638
Table A23: Enrolment in ARNR in 2nd order CESM category in Universities and Technikons, 1994 - 2003
Enrolment by year2nd order CESM category
0101 Agricultural Economics
0102 Agricultural Extension
0103 Agricultural Food Technology
0104 Animal Sciences
0105 Horticulture
0106 Plant Sciences
0107 Soil Sciences
0108 Fisheries
0109 Forestry
0110 Outdoor Recreation
0111 Wildlife
0112 Land Reclamation
0113 Renewable Natural Resources
0199 Other Ag. and Renewable ResourcesTotal
1994
6 528
1995
7 221
1996
7 027
1997
7 689
1997
7 741
1999
667
350
169
1 589
771
1 098
395
0
199
79
429
0
353
1 598
7 696
2000
1 005
354
182
2 088
726
1 143
457
0
270
313
455
0
387
1 290
8 670
2001
1 375
681
189
3 008
1 128
1 426
306
0
230
492
546
0
293
914
10 588
2002
1 144
648
207
2 682
1 046
1 501
449
2
248
553
230
0
556
1 082
10 348
2003
1 536
678
195
2 795
1 079
1 447
453
14
203
558
330
0
609
1 299
11 196
Table A24: Graduates in ARNR in 2nd order CESM category in Universities, 1994 - 2003
Enrolment by year2nd order CESM category
0101 Agricultural Economics
0102 Agricultural Extension
0103 Agricultural Food Technology
0104 Animal Sciences
0105 Horticulture
0106 Plant Sciences
0107 Soil Sciences
0108 Fisheries
0109 Forestry
0110 Outdoor Recreation
0111 Wildlife
0112 Land Reclamation
0113 Renewable Natural Resources
0199 Other Ag. and Renewable ResourcesTotal
1994
151
30
39
117
55
80
18
0
20
0
42
0
0
59
612
1995
103
40
31
100
60
84
28
0
17
0
36
0
0
58
556
1996
126
53
16
100
41
81
22
0
23
0
41
0
0
80
582
1997
141
44
24
92
48
97
30
0
23
0
48
0
0
121
669
1997
195
50
34
98
45
91
29
0
29
0
48
0
0
157
778
1999
121
44
36
110
43
135
30
0
13
0
31
0
16
184
762
2000
200
34
50
185
46
201
80
0
18
0
36
0
0
56
907
2001
185
50
41
161
36
135
50
0
20
0
42
0
0
24
745
2002
143
79
67
165
31
175
56
0
14
0
40
0
0
31
802
2003
186
55
54
229
37
180
77
4
9
0
35
0
25
13
904
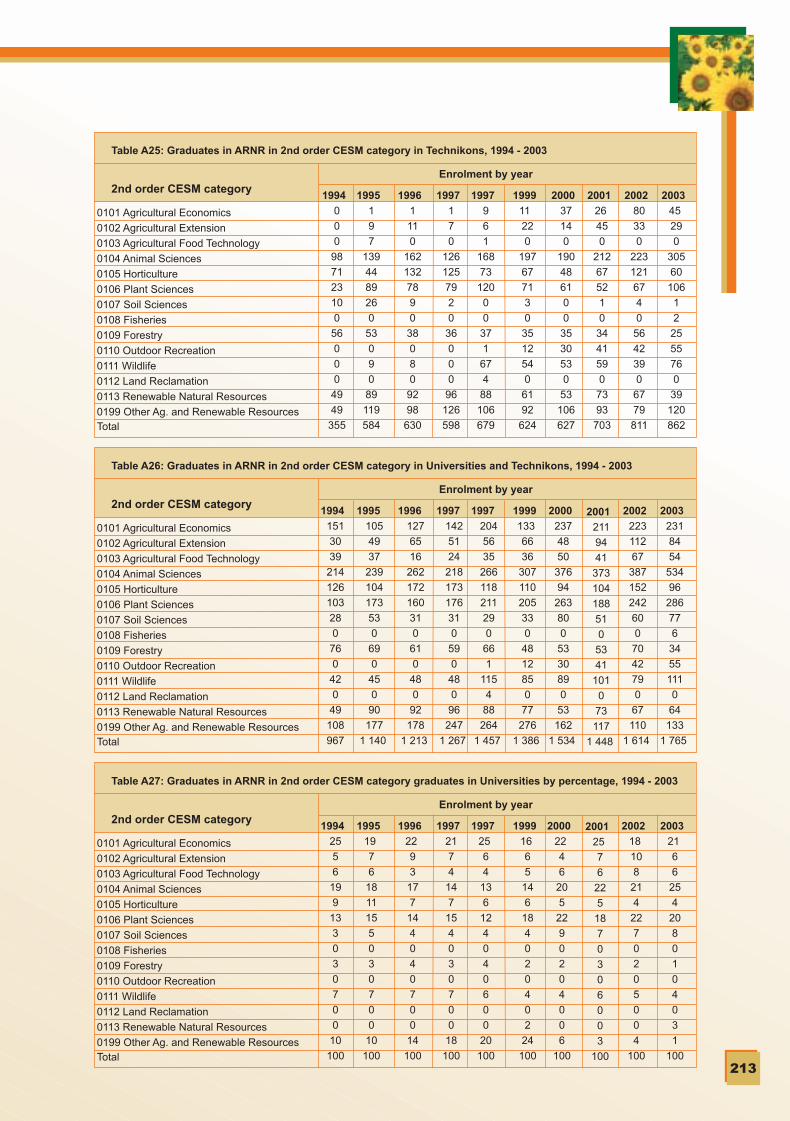
C M Y CM MY CY CMY K
213
Table A25: Graduates in ARNR in 2nd order CESM category in Technikons, 1994 - 2003
Enrolment by year2nd order CESM category
0101 Agricultural Economics
0102 Agricultural Extension
0103 Agricultural Food Technology
0104 Animal Sciences
0105 Horticulture
0106 Plant Sciences
0107 Soil Sciences
0108 Fisheries
0109 Forestry
0110 Outdoor Recreation
0111 Wildlife
0112 Land Reclamation
0113 Renewable Natural Resources
0199 Other Ag. and Renewable ResourcesTotal
1994
0
0
0
98
71
23
10
0
56
0
0
0
49
49
355
1995
1
9
7
139
44
89
26
0
53
0
9
0
89
119
584
1996
1
11
0
162
132
78
9
0
38
0
8
0
92
98
630
1997
1
7
0
126
125
79
2
0
36
0
0
0
96
126
598
1997
9
6
1
168
73
120
0
0
37
1
67
4
88
106
679
1999
11
22
0
197
67
71
3
0
35
12
54
0
61
92
624
2000
37
14
0
190
48
61
0
0
35
30
53
0
53
106
627
2001
26
45
0
212
67
52
1
0
34
41
59
0
73
93
703
2002
80
33
0
223
121
67
4
0
56
42
39
0
67
79
811
2003
45
29
0
305
60
106
1
2
25
55
76
0
39
120
862
Table A26: Graduates in ARNR in 2nd order CESM category in Universities and Technikons, 1994 - 2003
Enrolment by year2nd order CESM category
0101 Agricultural Economics
0102 Agricultural Extension
0103 Agricultural Food Technology
0104 Animal Sciences
0105 Horticulture
0106 Plant Sciences
0107 Soil Sciences
0108 Fisheries
0109 Forestry
0110 Outdoor Recreation
0111 Wildlife
0112 Land Reclamation
0113 Renewable Natural Resources
0199 Other Ag. and Renewable ResourcesTotal
1994
151
30
39
214
126
103
28
0
76
0
42
0
49
108
967
1995
105
49
37
239
104
173
53
0
69
0
45
0
90
177
1 140
1996
127
65
16
262
172
160
31
0
61
0
48
0
92
178
1 213
1997
142
51
24
218
173
176
31
0
59
0
48
0
96
247
1 267
1997
204
56
35
266
118
211
29
0
66
1
115
4
88
264
1 457
1999
133
66
36
307
110
205
33
0
48
12
85
0
77
276
1 386
2000
237
48
50
376
94
263
80
0
53
30
89
0
53
162
1 534
2001
211
94
41
373
104
188
51
0
53
41
101
0
73
117
1 448
2002
223
112
67
387
152
242
60
0
70
42
79
0
67
110
1 614
2003
231
84
54
534
96
286
77
6
34
55
111
0
64
133
1 765
Table A27: Graduates in ARNR in 2nd order CESM category graduates in Universities by percentage, 1994 - 2003
Enrolment by year2nd order CESM category
0101 Agricultural Economics
0102 Agricultural Extension
0103 Agricultural Food Technology
0104 Animal Sciences
0105 Horticulture
0106 Plant Sciences
0107 Soil Sciences
0108 Fisheries
0109 Forestry
0110 Outdoor Recreation
0111 Wildlife
0112 Land Reclamation
0113 Renewable Natural Resources
0199 Other Ag. and Renewable ResourcesTotal
1994
25
5
6
19
9
13
3
0
3
0
7
0
0
10
100
1995
19
7
6
18
11
15
5
0
3
0
7
0
0
10
100
1996
22
9
3
17
7
14
4
0
4
0
7
0
0
14
100
1997
21
7
4
14
7
15
4
0
3
0
7
0
0
18
100
1997
25
6
4
13
6
12
4
0
4
0
6
0
0
20
100
1999
16
6
5
14
6
18
4
0
2
0
4
0
2
24
100
2000
22
4
6
20
5
22
9
0
2
0
4
0
0
6
100
2001
25
7
6
22
5
18
7
0
3
0
6
0
0
3
100
2002
18
10
8
21
4
22
7
0
2
0
5
0
0
4
100
2003
21
6
6
25
4
20
8
0
1
0
4
0
3
1
100

C M Y CM MY CY CMY K
214
Table A28: Graduates in ARNR in 2nd order CESM category in Technikons by percentage, 1994 - 2003
Enrolment by year2nd order CESM category
0101 Agricultural Economics
0102 Agricultural Extension
0103 Agricultural Food Technology
0104 Animal Sciences
0105 Horticulture
0106 Plant Sciences
0107 Soil Sciences
0108 Fisheries
0109 Forestry
0110 Outdoor Recreation
0111 Wildlife
0112 Land Reclamation
0113 Renewable Natural Resources
0199 Other Ag. and Renewable ResourcesTotal
1994
0
0
0
27
20
6
3
0
16
0
0
0
14
14
100
1995
0
2
1
24
8
15
4
0
9
0
1
0
15
20
100
1996
0
2
0
26
21
12
1
0
6
0
1
0
15
16
100
1997
0
1
0
21
21
13
0
0
6
0
0
0
16
21
100
1997
1
1
0
25
11
18
0
0
5
0
10
1
13
16
100
1999
2
4
0
31
11
11
0
0
6
2
9
0
10
15
100
2000
6
2
0
30
8
10
0
0
6
5
8
0
8
17
100
2001
4
6
0
30
10
7
0
0
5
6
8
0
10
13
100
2002
10
4
0
27
15
8
0
0
7
5
5
0
8
10
100
2003
5
3
0
35
7
12
0
0
3
6
9
0
4
14
100
Table A29: Throughput rate in ARNR by 2nd order CESM category in Universities, 1994 - 2003
Enrolment by year2nd order CESM category
0101 Agricultural Economics
0102 Agricultural Extension
0103 Agricultural Food Technology
0104 Animal Sciences
0105 Horticulture
0106 Plant Sciences
0107 Soil Sciences
0108 Fisheries
0109 Forestry
0110 Outdoor Recreation
0111 Wildlife
0112 Land Reclamation
0113 Renewable Natural Resources
0199 Other Ag. and Renewable ResourcesTotal
1994
-
-
-
-
-
-
-
-
-
-
-
-
-
-
24
1995
-
-
-
-
-
-
-
-
-
-
-
-
-
-
21
1996
-
-
-
-
-
-
-
-
-
-
-
-
-
-
21
1997
-
-
-
-
-
-
-
-
-
-
-
-
-
-
23
1997
-
-
-
-
-
-
-
-
-
-
-
-
-
-
26
1999
22
31
21
22
30
27
15
-
22
-
34
-
13
35
25
2000
25
12
28
27
31
31
25
-
28
0
46
-
0
33
27
2001
22
9
22
13
25
21
17
-
25
-
44
-
0
12
18
2002
17
20
33
16
21
25
18
-
22
-
36
-
0
13
19
2003
16
11
28
27
23
28
24
-
15
-
33
-
8
4
20
Table A30: Throughput rate in ARNR by 2nd order CESM category in Technikons, 1994 - 2003
Enrolment by year2nd order CESM category
0101 Agricultural Economics
0102 Agricultural Extension
0103 Agricultural Food Technology
0104 Animal Sciences
0105 Horticulture
0106 Plant Sciences
0107 Soil Sciences
0108 Fisheries
0109 Forestry
0110 Outdoor Recreation
0111 Wildlife
0112 Land Reclamation
0113 Renewable Natural Resources
0199 Other Ag. and Renewable ResourcesTotal
1994
-
-
-
-
-
-
-
-
-
-
-
-
-
-
9
1995
-
-
-
-
-
-
-
-
-
-
-
-
-
-
13
1996
-
-
-
-
-
-
-
-
-
-
-
-
-
-
15
1997
-
-
-
-
-
-
-
-
-
-
-
-
-
-
13
1997
-
-
-
-
-
-
-
-
-
-
-
-
-
-
14
1999
10
11
-
18
11
12
2
-
25
15
16
-
27
9
13
2000
18
24
-
14
8
12
0
-
17
10
14
-
14
9
12
2001
5
30
-
12
7
7
8
-
22
8
13
-
26
13
11
2002
26
13
-
13
13
8
3
-
31
8
33
-
19
9
13
2003
11
15
-
16
7
13
1
23
17
10
34
-
13
12
13

C M Y CM MY CY CMY K
215
Table A31: Enrolment in ARNR by qualification type in universities, 1994 - 2003
Enrolment by yearQualification Type
A: Certificate/ Diploma
B: Degree
A + B
Post-graduate up to Honours
Masters Degrees
Doctoral Degrees
Total
1994
36
1 646
1 683
315
436
132
2 566
1995
92
1 601
1 693
319
453
145
2 610
1996
95
1 631
1 726
378
437
153
2 694
1997
73
1 737
1 810
359
543
168
2 880
1997
77
1 778
1 855
331
595
161
2 942
1999
339
1 506
1 845
325
649
160
2 978
2000
35
1 934
1 969
347
796
238
3 350
2001
433
2 352
2 785
266
899
271
4 220
2002
366
2 164
2 529
398
955
308
4 190
2003
293
2 483
2 775
355
1 029
335
4 494
NQF
level
5
6
-
7
7
8
Table A32: Enrolment in ARNR by qualification type in Technikons, 1994 - 2003
Enrolment by yearQualification Type
A: Certificate/ Diploma
B: Degree
A + B
Post-graduate up to Honours
Masters Degrees
Doctoral Degrees
Total
1994
3 731
0
3 731
208
8
0
3 946
1995
4 321
39
4 360
160
14
1
4 535
1996
4 020
165
4 184
79
16
2
4 281
1997
4 363
350
4 713
37
21
4
4 775
1997
4 329
409
4 738
8
28
3
4 776
1999
4 044
596
4 640
4
34
5
4 683
2000
3 402
1 785
5 186
2
62
7
5 257
2001
3 512
2 711
6 223
11
103
9
6 346
2002
3 799
2 211
6 010
4
100
11
6 125
2003
3 947
2 530
6 477
10
118
10
6 614
NQF
level
5
6
-
7
7
8
Table A33: Enrolment in ARNR by qualification type in Technikons, 1994 - 2003
Enrolment by yearQualification Type
A: Certificate/ Diploma
B: Degree
A + B
Post-graduate up to Honours
Masters Degrees
Doctoral Degrees
Total
1994
3 767
1 646
5 414
523
444
132
6 513
1995
3 767
1 646
5 414
523
444
132
6 513
1996
4 115
1 796
5 911
457
453
155
6 975
1997
4 436
2 087
6 523
396
564
172
7 655
1997
4 406
2 187
6 593
338
623
164
7 718
1999
4 383
2 102
6 485
329
683
165
7 662
2000
3 437
3 719
7 156
348
858
245
8 607
2001
3 945
5 063
9 008
277
1 002
280
10 567
2002
4 165
4 374
8 539
402
1 055
319
10 315
2003
4 239
5 012
9 252
365
1 147
345
11 108
NQF
level
5
6
-
7
7
8
Table A34: Enrolment in ARNR by qualification type in Universities and Technikons in percentage, 1994 - 2003
Enrolment by yearQualification Type
A: Certificate/ Diploma
B: Degree
A + B
Post-graduate up to Honours
Masters Degrees
Doctoral Degrees
Total
1994
58
25
83
8
7
2
100
1995
62
23
85
7
7
2
100
1996
59
26
85
7
6
2
100
1997
58
27
85
5
7
2
100
1997
57
28
85
4
8
2
100
1999
57
27
85
4
9
2
100
2000
40
43
83
4
10
3
100
2001
37
48
85
3
9
3
100
2002
40
42
83
4
10
3
100
2003
38
45
83
3
10
3
100
NQF
level
5
6
-
7
7
8
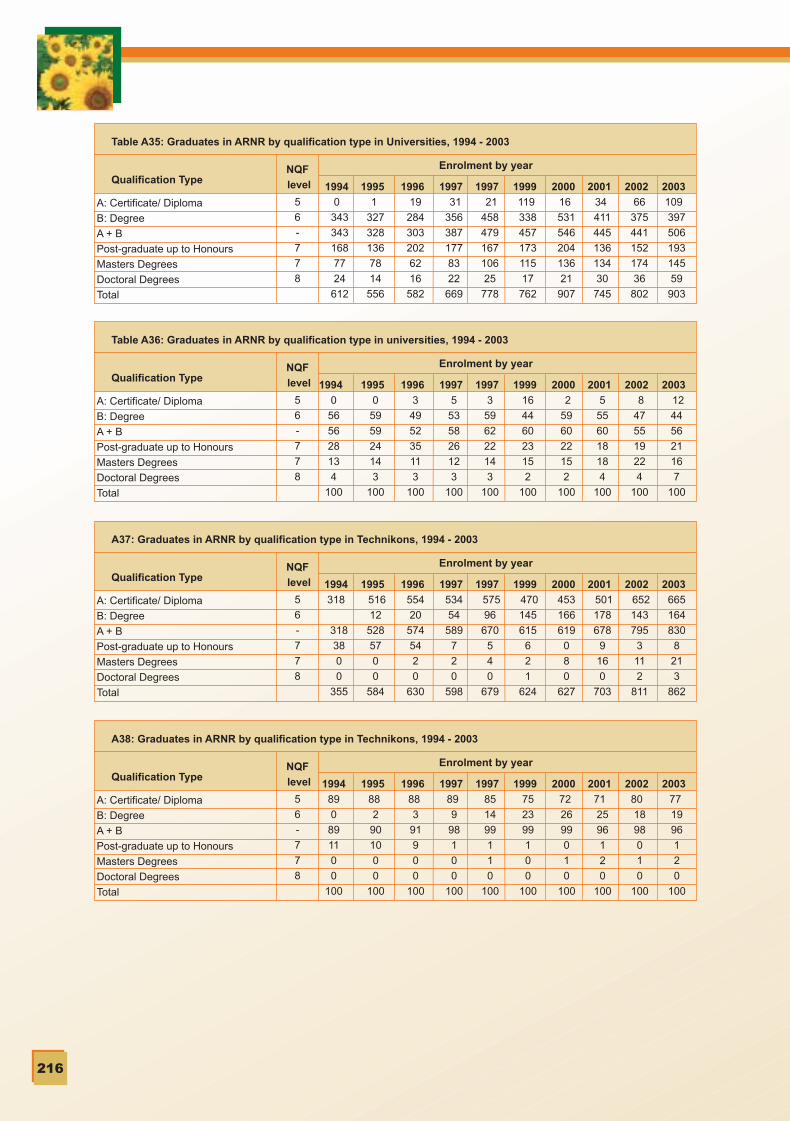
C M Y CM MY CY CMY K
216
Table A35: Graduates in ARNR by qualification type in Universities, 1994 - 2003
Enrolment by yearQualification Type
A: Certificate/ Diploma
B: Degree
A + B
Post-graduate up to Honours
Masters Degrees
Doctoral Degrees
Total
1994
0
343
343
168
77
24
612
1995
1
327
328
136
78
14
556
1996
19
284
303
202
62
16
582
1997
31
356
387
177
83
22
669
1997
21
458
479
167
106
25
778
1999
119
338
457
173
115
17
762
2000
16
531
546
204
136
21
907
2001
34
411
445
136
134
30
745
2002
66
375
441
152
174
36
802
2003
109
397
506
193
145
59
903
NQF
level
5
6
-
7
7
8
Table A36: Graduates in ARNR by qualification type in universities, 1994 - 2003
Enrolment by yearQualification Type
A: Certificate/ Diploma
B: Degree
A + B
Post-graduate up to Honours
Masters Degrees
Doctoral Degrees
Total
1994
0
56
56
28
13
4
100
1995
0
59
59
24
14
3
100
1996
3
49
52
35
11
3
100
1997
5
53
58
26
12
3
100
1997
3
59
62
22
14
3
100
1999
16
44
60
23
15
2
100
2000
2
59
60
22
15
2
100
2001
5
55
60
18
18
4
100
2002
8
47
55
19
22
4
100
2003
12
44
56
21
16
7
100
NQF
level
5
6
-
7
7
8
A37: Graduates in ARNR by qualification type in Technikons, 1994 - 2003
Enrolment by yearQualification Type
A: Certificate/ Diploma
B: Degree
A + B
Post-graduate up to Honours
Masters Degrees
Doctoral Degrees
Total
1994
318
318
38
0
0
355
1995
516
12
528
57
0
0
584
1996
554
20
574
54
2
0
630
1997
534
54
589
7
2
0
598
1997
575
96
670
5
4
0
679
1999
470
145
615
6
2
1
624
2000
453
166
619
0
8
0
627
2001
501
178
678
9
16
0
703
2002
652
143
795
3
11
2
811
2003
665
164
830
8
21
3
862
NQF
level
5
6
-
7
7
8
A38: Graduates in ARNR by qualification type in Technikons, 1994 - 2003
Enrolment by yearQualification Type
A: Certificate/ Diploma
B: Degree
A + B
Post-graduate up to Honours
Masters Degrees
Doctoral Degrees
Total
1994
89
0
89
11
0
0
100
1995
88
2
90
10
0
0
100
1996
88
3
91
9
0
0
100
1997
89
9
98
1
0
0
100
1997
85
14
99
1
1
0
100
1999
75
23
99
1
0
0
100
2000
72
26
99
0
1
0
100
2001
71
25
96
1
2
0
100
2002
80
18
98
0
1
0
100
2003
77
19
96
1
2
0
100
NQF
level
5
6
-
7
7
8

C M Y CM MY CY CMY K
217
Table A39: Graduates in ARNR by qualification type in Universities and Technikons, 1994 - 2003
Enrolment by yearQualification Type
A: Certificate/ Diploma
B: Degree
A + B
Post-graduate up to Honours
Masters Degrees
Doctoral Degrees
Total
1994
318
343
661
206
77
24
967
1995
517
339
856
192
78
14
1 140
1996
573
304
878
256
64
16
1 213
1997
565
411
976
185
85
22
1 267
1997
595
553
1 149
172
110
25
1 457
1999
589
483
1 072
179
117
18
1 386
2000
468
696
1 165
204
144
21
1 534
2001
535
588
1 123
145
150
30
1 448
2002
718
518
1 236
155
185
38
1 614
2003
774
561
1 335
201
166
62
1 764
NQF
level
5
6
-
7
7
8
Table A40: Throughput rate in ARNR by qualification type in Universities, 1994 - 2003
Enrolment by yearQualification Type
A: Certificate/ Diploma
B: Degree
A + B
Post-graduate up to Honours
Masters Degrees
Doctoral Degrees
Total
1994
0
21
20
53
18
18
24
1995
1
20
19
43
17
10
21
1996
20
17
18
53
14
10
22
1997
42
21
21
49
15
13
23
1997
27
26
26
51
18
16
26
1999
35
22
25
53
18
11
26
2000
44
27
28
59
17
9
27
2001
8
17
16
51
15
11
18
2002
18
17
17
38
18
12
19
2003
37
16
18
54
14
18
20
NQF
level
5
6
-
7
7
8
Table A41: Throughput rate in ARNR by qualification type in Technikons, 1994 - 2003
Enrolment by yearQualification Type
A: Certificate/ Diploma
B: Degree
A + B
Post-graduate up to Honours
Masters Degrees
Doctoral Degrees
Total
1994
9
-
9
18
0
-
9
1995
12
31
12
35
0
0
13
1996
14
12
14
68
13
0
15
1997
12
16
12
20
10
0
13
1997
13
23
14
67
14
0
14
1999
12
24
13
150
6
20
13
2000
13
9
12
0
13
0
12
2001
14
7
11
82
16
0
11
2002
17
6
13
75
11
18
13
2003
17
6
13
80
18
30
13
NQF
level
5
6
-
7
7
8

C M Y CM MY CY CMY K
21
8
Male Female Total
2004
2003
2002
2001
2000
1999
Certificate
Higher Cert
Diploma
Total
Certificate
Higher Cert
Diploma
Total
Certificate
Higher Cert
Diploma
Total
Certificate
Higher Cert
Diploma
Total
Certificate
Higher Cert
Diploma
Total
Certificate
Higher Cert
Diploma
Total
African108
8880
276
217217105539
252129
85466
188140127455
0140124204468
199237123559
Coloured1102
1244
20
421
429
712
322
01212
226
1717
135
Indian0000
1102
1102
002200011
0011
White136526
104
249248119616
279261128668
268253135656
0261187120568
326216180722
Total122154106382
479470228
1177
536412217
1165
463405267
11350
413323327
1063
542470305
1317
African905867
215
118114110342
13811971
328
11711988
3240
7786
177340
158200128486
Coloured0000
2103
2103
210301102
3003
Indian0000
0000
1001
000000000
0000
White4
163
23
34371485
20291665
33311579
03023
659
31221568
Total947470
238
154152124430
161149
87397
152108
53313
0108
6352
223
1387689
303
216228176620
633622352
1607
697561304
1562
615513320
1448
521386379
1286
680546394
1620
Table A43: Enrolments in Agricultural Colleges 2000 to 2004
Please note: Data on enrolments for 2005 not complete

C M Y CM MY CY CMY K
219
APPENDIX 4: CHAPTER 5
FET COLLEGE QUALIFICATIONS STRUCTURE AND ADMISSION REQUIREMENTS
INSTRUCTIONAL PROGRAMMES OFFERED AT FET COLLEGES
The National Certificates: NC(OR), N1, N2, N3, N4, N5, N6, National Intermediate Certificate (NIC), andNational Senior Certificate (NSC) in the General Field of Studies and the Natural Sciences Field of Studiesare national vocational qualifications applicable to specific trades in each field of studies, offered at FurtherEducation and Training (FET) Colleges and examined by the Department of Education. NC(OR), N1, N2, N4,N5, N6 are certified by the Department of Education..All the instructional programmes are listed, from the lowest [NC(OR) and N1] level to the highest (N6) level,in the National Policy document, Formal Technical College Instructional Programmes in the RSA, Report 191.Each instructional programme consists of prescribed instructional offerings, which could either all be compulsoryor some could be optional for the specific qualification.
Entry requirementsThe entry requirements for the National Certificate NC(OR) and National Certificate N1 instructionalprogrammes are Grade 8 and Grade 9 respectively, or equivalent qualifications.The entry requirements for the National Certificate N2 and National Certificate N3 instructional programmesare the relevant National Certificate N1 or Grade 10 and the relevant National Certificate N2 or Grade 11respectively, or equivalent qualifications.The entry requirements for the National Certificate N4, National Certificate N5 and National Certificate N6are the relevant N3, N4 and N5 National Certificates respectively or equivalent qualifications.
1.1 The duration of instructional programmes
The duration of instructional programmes is as follows:• National Certificates NC(OR) Agriculture, N1, N4, N5 and N6 in the General Field of Studies instructional
programmes are a semester;• National Certificates NC(OR), N1, N2, N3, N4, N5 and N6 in the Natural Sciences Field of Studies
instructional programmes are a trimester; and• National Certificates NC(OR) Art and Music, National Certificates N2, National Intermediate Certificates
(NIC) and National Senior Certificates (NSC) are one year.
1.2 FET College assessment regime
All the NC(OR), N1, N2, NIC, N4, N5 and N6 candidates may enrol for examinations in June and November. The N3 and NSC candidates may enrol for specified instructional offerings in June and for all instructionalofferings in November. There is also a supplementary N3/NSC examination in March. All the NaturalSciences Studies candidates can enrol for examinations in April, August and November. However, thereare identified Natural Sciences Studies instructional offerings that have a history of very low enrolmentnumbers. Therefore, for some instructional offerings candidates are enrolled only at request or otherinstructional offerings have a specified frequency of only one or two examinations per year.
1.3 Certification requirements
To qualify for a National Certificate: Orientation candidates must pass the instructional offerings as prescribedfor the specific instructional programme, i.e. for NC(OR): Music four compulsory and one of seven optionalpractical instructional offerings and for both NC(OR): Engineering and NC(OR): Agriculture five compulsoryinstructional offerings.

C M Y CM MY CY CMY K
220
In order to qualify for a National Certificate on the N1 to N6 levels General Studies candidates must passfour instructional offerings, according to the prescribed and/or compulsory offerings for the relevant course. Natural Sciences Studies candidates must pass at least three instructional offerings, according to theprescribed and/or compulsory offerings for the relevant course.
To qualify for a National Intermediate Certificate or National Senior Certificate candidates must pass therelevant N2 or N3 instructional programme and two languages, of which at least one must be on the FirstLanguage level and at least one must be a Business Language; or offer and sit for at least fouroptional/compulsory vocational instructional offerings and two languages, of which at least one must beon the First Language level, and at least one must be a Business Language; and pass both languages andat least three other instructional offerings, as prescribed for each specific instructional programmes.
DISTINCTIVE FEATURES OF INSTRUCTIONAL PROGRAMMES OFFERED AT FETCOLLEGES
This sector exhibits some unique characteristics that define the nature of the National Certificate qualifications.
1.1 General
Each National Certificate qualification is an instructional programme in its own right. The term 'instructionalprogramme' has the same meaning as the term 'course'. The term 'instructional offering' has the samemeaning as the term 'subject'.
Candidates can enrol for any number of instructional offerings of an instructional programme in a sittingper semester/year and as such the enrolment rates vary, depending both on the instructional programmeand the specific needs of the candidates. As such the reporting wil l be affected.
Currently the enrolments for the majority of instructional programmes are conducted twice a year dependingon the duration of the specific instructional programme.
1.2 National Certificates N1-N3
While candidates need to obtain a minimum aggregate to pass Grade 10, Grade 11 and Grade 12/SeniorCertificate, no aggregate is necessary for the National Certificates.All the NC(OR), N1, N2 and the N3 instructional offerings (subjects) are equivalent to Standard 7/Grade9, Standard 8/Grade 10 SG, the Standard 9/Grade 11 SG and the Standard 10/ Grade 12 SG schoolsubjects respectively.
The NIC and NSC qualifications are just as applicable as Grade 11 or Grade 12/Senior Certificatequalifications respectively. Candidates have to fulfil the same basic requirements, i.e. number of subjects(2 languages and 4 optional/compulsory subjects) and language requirements (2 languages of which atleast one as First Language). To obtain Grade 11 and Grade 12/Senior Certificates at a high school,candidates also offer two languages and 4 other optional and usually academic subjects of which theymust pass three.
The National Intermediate Certificate is thus equivalent to a Grade 11 qualification with all the instructionalofferings on the Standard Grade level.Umalusi issues the National Certificate N3, National Senior Certificateas well as the Grade 12/Senior Certificate. The National Senior Certificate is thus equivalent to a SeniorCertificate with all the instructional offerings on the Standard Grade level. The National Senior Certificatetherefore does not allow a candidate to study at a university for a degree since to obtain matriculationendorsement a specific number of instructional offerings must be passed on Higher Grade level. The N3and NSC qualifications allow candidates entry to tertiary studies.

C M Y CM MY CY CMY K
221
1.3 National Certificates N4-N6
The National Certificates N4, N5 and N6 are tertiary qualifications, which form part of the National NDiploma. The duration of the National N Diploma is a minimum of three years, including applicableexperiential training (two years in the Natural Sciences Field of Studies and 18 months in the General Fieldof Studies), after the candidate has entered the tertiary level.
According to the evaluation scale used in the civil service to evaluate qualifications of persons who do nothave an educator’s qualification, the National N Diploma is evaluated as RQV 13, i.e. Matric + 3 years.(DoE, 2004, 14-17)
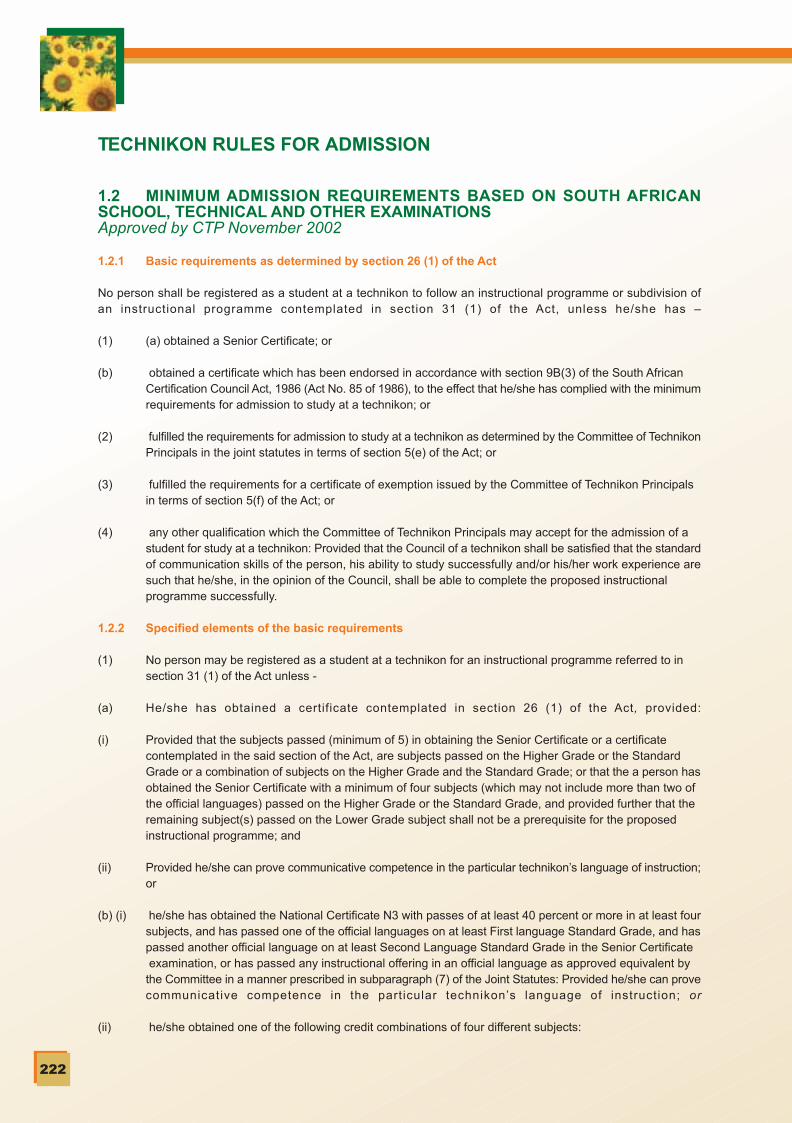
C M Y CM MY CY CMY K
222
TECHNIKON RULES FOR ADMISSION
1.2 MINIMUM ADMISSION REQUIREMENTS BASED ON SOUTH AFRICANSCHOOL, TECHNICAL AND OTHER EXAMINATIONSApproved by CTP November 2002
1.2.1 Basic requirements as determined by section 26 (1) of the Act
No person shall be registered as a student at a technikon to follow an instructional programme or subdivision ofan instructional programme contemplated in section 31 (1) of the Act, unless he/she has –
(1) (a) obtained a Senior Certificate; or
(b) obtained a certificate which has been endorsed in accordance with section 9B(3) of the South African Certification Council Act, 1986 (Act No. 85 of 1986), to the effect that he/she has complied with the minimumrequirements for admission to study at a technikon; or
(2) fulfilled the requirements for admission to study at a technikon as determined by the Committee of TechnikonPrincipals in the joint statutes in terms of section 5(e) of the Act; or
(3) fulfilled the requirements for a certificate of exemption issued by the Committee of Technikon Principals in terms of section 5(f) of the Act; or
(4) any other qualification which the Committee of Technikon Principals may accept for the admission of a student for study at a technikon: Provided that the Council of a technikon shall be satisfied that the standardof communication skills of the person, his ability to study successfully and/or his/her work experience aresuch that he/she, in the opinion of the Council, shall be able to complete the proposed instructional programme successfully.
1.2.2 Specified elements of the basic requirements
(1) No person may be registered as a student at a technikon for an instructional programme referred to in section 31 (1) of the Act unless -
(a) He/she has obtained a certificate contemplated in section 26 (1) of the Act, provided:
(i) Provided that the subjects passed (minimum of 5) in obtaining the Senior Certificate or a certificate contemplated in the said section of the Act, are subjects passed on the Higher Grade or the Standard Grade or a combination of subjects on the Higher Grade and the Standard Grade; or that the a person hasobtained the Senior Certificate with a minimum of four subjects (which may not include more than two of the official languages) passed on the Higher Grade or the Standard Grade, and provided further that the remaining subject(s) passed on the Lower Grade subject shall not be a prerequisite for the proposed instructional programme; and
(ii) Provided he/she can prove communicative competence in the particular technikon’s language of instruction;or
(b) (i) he/she has obtained the National Certificate N3 with passes of at least 40 percent or more in at least foursubjects, and has passed one of the official languages on at least First language Standard Grade, and haspassed another official language on at least Second Language Standard Grade in the Senior Certificate examination, or has passed any instructional offering in an official language as approved equivalent by the Committee in a manner prescribed in subparagraph (7) of the Joint Statutes: Provided he/she can provecommunicative competence in the particular technikon’s language of instruction; or
(ii) he/she obtained one of the following credit combinations of four different subjects:

C M Y CM MY CY CMY K
223
• Three Senior Certificate subjects on at least Standard Grade level and one National Certificate N3 subject; or
• Two Senior Certificate subjects on at least Standard Grade level and two National Certificate N3 subjects;or
• One Senior Certificate subject on at least Standard Grade level and three National Certificate N3 subjects,as well as passes with 40 percent or more in two official languages as prescribed in the first paragraph ofsubparagraph (b) above: Provided he/she can prove communicative competence in the particular technikon’slanguage of instruction: or
(c) he/she has obtained the National N4 Certificate with passes in at least four appropriate subjects, each attained with 50 percent or more: Provided that he/she can prove communicative competence in the technikon’s language of instruction; or
(d) he/she has fulfilled the requirements for admission to a technikon as determined by the Committee as contemplated in section 26 (1) (b) and (c) of the Act: Provided that the council shall be satisfied that the standard of this person’s communicative skills, his/her ability to study successfully and his/her work experience are such that he/she will, in the opinion of the council, be able to complete successfully the proposed instructional programme; and
(e) he/she meetssuch additionalrequirements as the council maydetermine for admission to a specific instructional programme as contemplated in section 26(2)(a) of the Act.
(2) To comply with the minimum entrance requirements in (1)(a) or (b) above, candidates who desire entry on grounds of a combination of subjects must achieve a minimum total of 720. To calculate the total, the percentages for each of the subjects (including the required languages)must be converted to marks out of 300 for Standard Grade or N3 passes and out of 400 for Higher Grade or N4 passes. Thereafter the marks must be summated.
(3) In terms of the equivalency of N3 and SG subjects; N4 and HG subjects; N4, HG and A-level subjects, thefollowing applies:
(a) It is accepted that N3-subjects are equivalent to or have the same status as Senior Certificate SG subjects.(b) It is accepted that N3 < (less than) HG < (less than) “A-level”.
1.3 PROVISIONAL ADMISSION
1.3.1 Provisional admission in respect of South African school and technical examinations:
(1) A person may, subject to subparagraph (1) (f) of Section 6 of the Joint Statutes, be provisionally admittedto a technikon for education and training if such person does not comply with all the requirements set outin subparagraph 6 (1) (a) of the Joint Statutes, and if
(a) such person lacks only one requirement: Provided that the subjects passed in the Senior Certificate examination or equivalent examination shall comply with the provisions of subparagraph 6 (1) (a) of the Joint Statutes: Provided further that the subjects passed shall include subjects required for the proposed instructional programme; and
(b) the council is satisfied that the standard of such person's communicative skills, his/her ability to study successfully and/or his/her work experience are such that he/she will, in the opinion of the council, be ableto complete successfully the proposed instructional programme.
(2) A person who is granted provisional admission to a technikon in terms of subparagraph (2) of Section 6 of the Joint Statutes, may be admitted to the second semester or year of study only if he/she has -
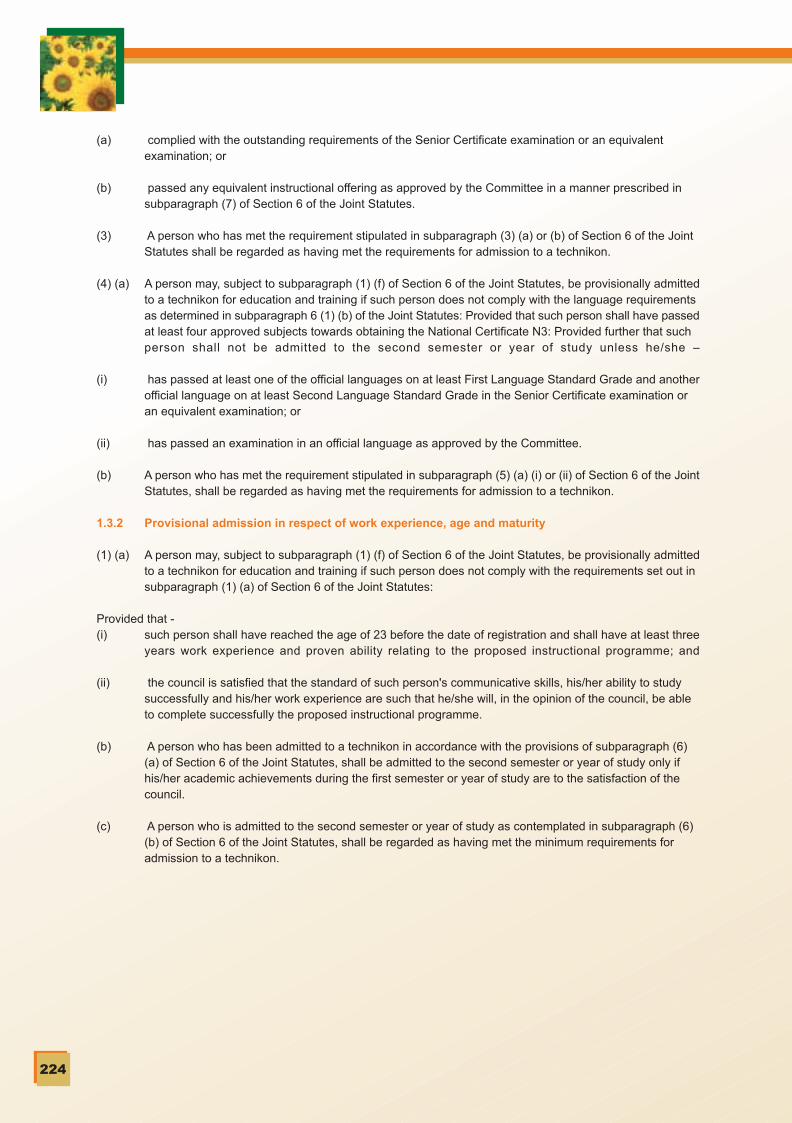
C M Y CM MY CY CMY K
224
(a) complied with the outstanding requirements of the Senior Certificate examination or an equivalent examination; or
(b) passed any equivalent instructional offering as approved by the Committee in a manner prescribed in subparagraph (7) of Section 6 of the Joint Statutes.
(3) A person who has met the requirement stipulated in subparagraph (3) (a) or (b) of Section 6 of the Joint Statutes shall be regarded as having met the requirements for admission to a technikon.
(4) (a) A person may, subject to subparagraph (1) (f) of Section 6 of the Joint Statutes, be provisionally admittedto a technikon for education and training if such person does not comply with the language requirements as determined in subparagraph 6 (1) (b) of the Joint Statutes: Provided that such person shall have passedat least four approved subjects towards obtaining the National Certificate N3: Provided further that such person shall not be admitted to the second semester or year of study unless he/she –
(i) has passed at least one of the official languages on at least First Language Standard Grade and anotherofficial language on at least Second Language Standard Grade in the Senior Certificate examination or an equivalent examination; or
(ii) has passed an examination in an official language as approved by the Committee.
(b) A person who has met the requirement stipulated in subparagraph (5) (a) (i) or (ii) of Section 6 of the JointStatutes, shall be regarded as having met the requirements for admission to a technikon.
1.3.2 Provisional admission in respect of work experience, age and maturity
(1) (a) A person may, subject to subparagraph (1) (f) of Section 6 of the Joint Statutes, be provisionally admittedto a technikon for education and training if such person does not comply with the requirements set out in subparagraph (1) (a) of Section 6 of the Joint Statutes:
Provided that -(i) such person shall have reached the age of 23 before the date of registration and shall have at least three
years work experience and proven ability relating to the proposed instructional programme; and
(ii) the council is satisfied that the standard of such person's communicative skills, his/her ability to study successfully and his/her work experience are such that he/she will, in the opinion of the council, be able to complete successfully the proposed instructional programme.
(b) A person who has been admitted to a technikon in accordance with the provisions of subparagraph (6) (a) of Section 6 of the Joint Statutes, shall be admitted to the second semester or year of study only if his/her academic achievements during the first semester or year of study are to the satisfaction of the council.
(c) A person who is admitted to the second semester or year of study as contemplated in subparagraph (6) (b) of Section 6 of the Joint Statutes, shall be regarded as having met the minimum requirements for admission to a technikon.

C M Y CM MY CY CMY K
225
APPENDIX 5: CHAPTER 4
NSFAS Loan recipients, 1994 - 2004
Agriculture Recipients All NSFAS Recipients
LoanYear1994199419951995199619961997199719981998199819981999199920002000200020012001200120012001200220022002200220022002200320032003200320032003200420042004200420042004
QualificationLevel
DegreeDiplomaDegreeDiplomaDegreeDiplomaDegreeDiplomaDegreeDiplomaHonoursMastersDegreeDiplomaDegreeDiplomaMastersDegreeDiploma
DoctorateHonoursMastersDegreeDiploma
DoctorateHonoursMasters
Post Grad DiplomaDegreeDiploma
DoctorateHonoursMasters
Post Grad DiplomaDegreeDiploma
DoctorateHonoursMasters
Post Grad Dipl
Agr_Students
313
183114497255447309661344
--
701404872491
-821599
---
770620
1---
800662
---1
704658
73-
Agr_Award
105661.228712.00
783276.17262244.91
2901449.89946393.52
2863895.781076181.504253991.741653100.83
--
5265318.352511034.076882113.123265058.59
-7321779.244241269.63
---
6937646.194592303.13
8650.00---
6325588.365291308.94
---
8380.005981666.116265243.00
-70803.7031281.50
-
Agr_Bursary
0.000.00
110360.7054151.99
767249.86246901.53843627.97336895.74
1239550.74532549.28
--
1515119.02724992.47
1973293.691011187.24
-2155955.021261493.30
---
2007749.201407106.20
3460.00---
1750620.151550655.93
---
3352.00------
All_Students
18 3577 220
29 84310 16544 66822 97839 95423 32639 87227 688
11
36 96631 40238 36233 681
241 68038 782
13728
44 73341 345
1363313
51 73944 582
11985863
49 25145 357
528231
148
All_Award
54 513 541.8315 967 296.20
126 784 244.2827 538 321.61
241 065 412.3292 292 607.58
253 223 395.6497 774 402.42
266 710 942.84127 767 935.08
7 000.0012 100.00
268 749 564.49172 305 203.92309 400 740.34201 418 577.97
9 970.00376 999 460.04257 599 156.84
4 930.00284 458.00203 080.00
429 510 882.27303 361 290.89
2 680.00289 240.00222 865.00
87 601.00524 362 235.82366 418 727.28
6 160.001 689 274.69
582 922.71613 151.00
503 911 600.60408 932 953.10
31 191.852 634 357.59
350 764.551 864 629.00
All_Bursary
0.000.00
33 767 374.135 963 697.05
64 068 878.5824 446 433.8472 468 657.8429 039 729.1279 166 791.2536 914 384.37
2 100.004 840.00
79 071 869.5148 867 953.8589 880 180.1060 067 107.86
3 521.33108 387 942.1475 218 069.65
0.0093 980.0034 516.40
122 011 386.0888 158 749.85
0.0072 697.1434 212.5420 283.07
148 571 730.15102 334 865.74
0.00499 004.18141 566.66203 445.66
------
Source: Personal Communication NSFAS (2005)
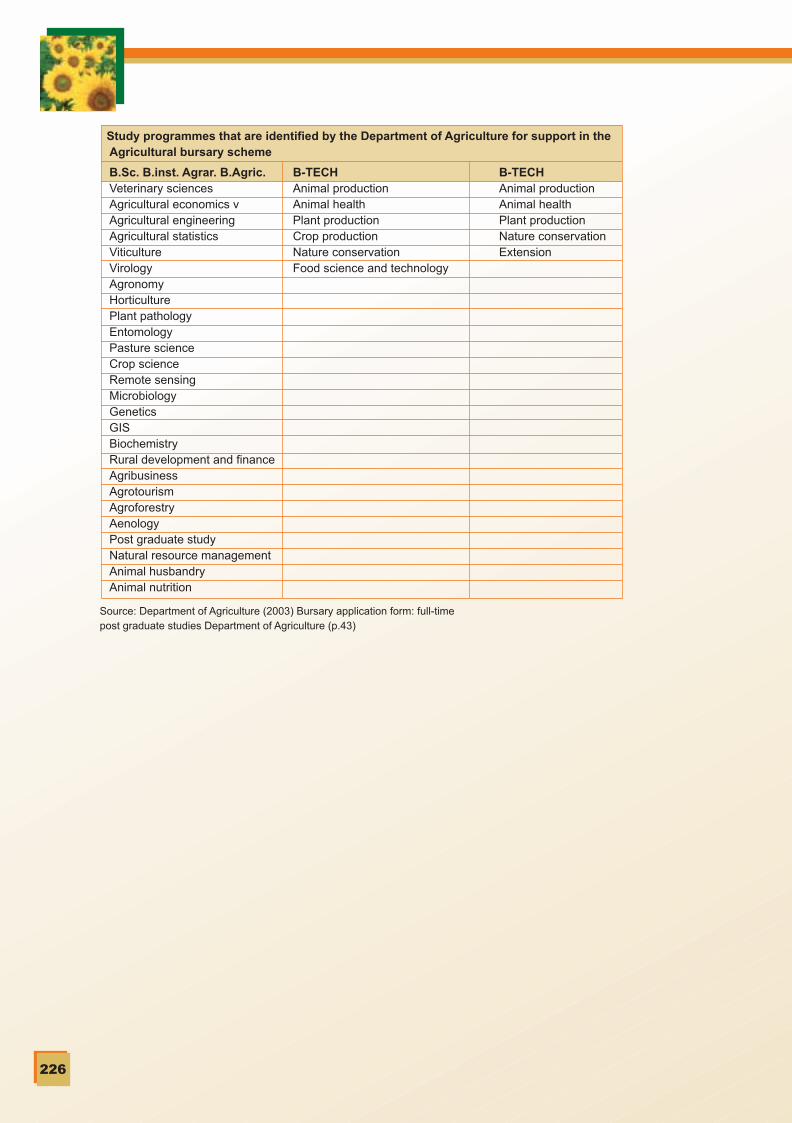
C M Y CM MY CY CMY K
226
Study programmes that are identified by the Department of Agriculture for support in the Agricultural bursary scheme
B-TECHAnimal productionAnimal healthPlant productionNature conservationExtension
B-TECHAnimal productionAnimal healthPlant productionCrop productionNature conservationFood science and technology
B.Sc. B.inst. Agrar. B.Agric.Veterinary sciencesAgricultural economics vAgricultural engineeringAgricultural statisticsViticultureVirologyAgronomyHorticulturePlant pathologyEntomologyPasture scienceCrop scienceRemote sensingMicrobiologyGeneticsGISBiochemistryRural development and financeAgribusinessAgrotourismAgroforestryAenologyPost graduate studyNatural resource managementAnimal husbandryAnimal nutrition
Source: Department of Agriculture (2003) Bursary application form: full-timepost graduate studies Department of Agriculture (p.43)

C M Y CM MY CY CMY K
227
APPENDIX 6: CHAPTER 7
National Department of AgricultureWestern Cape Department of AgricultureNorthern Cape Department of AgricultureEastern Cape Department of AgricultureFree State Department of AgricultureLimpopo Department of AgricultureKwaZulu-Natal Department ofAgriculture and Environmental AffairsGauteng Department of Agriculture,Conservation and Environmental AffairsNorth West Province Department of Agriculture,Conservation, Environment & TourismMpumalanga Department of Agriculture &Land Administration
Nangomso SongelwaHannetjie AggenbachGarreth van SchalkwykBuyiswa ManziMalusi MatlakoKwena LekgodiJanet McGladdery
Dean Hing
Bore Motshabi
Jeffrey Mubi
Table 2: Contacts at Parastatal Organisations:
South African Veterinary CouncilOnderstepoort Biological ProductsAgricultural Research CouncilNational Agricultural Marketing CouncilPerishable Products Export Control BoardLand Bank
Lynette HavengaAnnetjie van DykerLoraine MolopeJoyce SethuBeat r ix Mara isLindy Carabott
Table 3: Contacts at Colleges of Agriculture:
CedaraOwen SitholeFort CoxGlenElsenburgGrootfonteinLowveldMadzivhandilaTompi SelekaPotechefstoomTaung
Louie NaidooJoseph FoliAwonke SonandiJR van ZylJudi GerdenbachAmanda van RensburgJeanette SprinkhuizenM.C. TshisikuleN. MaloaCoen MeyerAbri van Heerden
Table 4: Contacts at Universities and Universities of Technology:
Cape Peninsular University of TechnologyCentral University of TechnologyTshwane University of TechnologyMangosuthu TechnikonNelson Mandela Metropolitan UniversityNorth West UniversityUniversity of Fort HareUniversity of Free StateUniversity of KwaZulu-NatalUniversity of LimpopoUniversity of PretoriaUniversity of South AfricaUniversity of Stellenbosch
University of VendaUniversity of Zululand
Irene van DykProf FreyProf SelalaLindi MadlalaMarie VogesProf SunnahProf RaatsThea van WykProf CookeProf MollelElmarie CronjeMaggie LiningtonProf Leopoldt van Huysteen(& Jos Liebenberg)Prof Ole-MeiludieProf Scogings
Table 1: Contacts at Government Departments:

C M Y CM MY CY CMY K
228
TABLE 5: CONTACTS AT PRIVATE COMPANIES AND INSTITUTIONS:
ABSABeyer Animal HealthBeyer Crop ProtectionBokomo FeedsBull Brand FoodsCape of Good Hope Wool CombersCeresClark CottonCloverDew CrispEpolEskom (Agrelek) Finlaar FoodsFirst National BankFoskorGringo LeathersKaran BeefKynnochMcCainsMeadow FeedsOmniaPaarman FoodsPannar SeedParmalatPick n’ PayProfertRainbow ChickensSABSSAD FoodsSAFEX: JSE AgriculturalDerivatives DivisionSasol NitroSetonShoprite CheckersSparStandard BankStucken GroupSyngentaTiger BrandsTongaat Hulett SugarUnileverWoolworths
www.absa.co.zawww.bayer.co.zawww.bayer.co.zawww.pioneerfoods.co.zawww.bullbrandfoods.com-www.ceres.co.zawww.clarkcotton.co.zawww.clover.co.za-www.epol.co.zawww.agrelek.co.za-www.fnb.co.zawww.foskor.co.za-www.karanbeef.co.za-www.mccain.co.zawww.meadowfeeds.co.zawww.omnia.co.zawww.paarman.co.zawww.pannarseed.co.zawww.parmalat.co.zawww.picknpay.co.za-www.rainbowchickens.co.za www.sabs.co.zawww.sadfoods.co.zawww.safex.co.za
www.sasol.comwww.setonleather.comwww.shoprite.co.zawww.spar.co.zawww.standardbank.co.zawww.stucken.co.zawww.syngenta.comwww.tigerbrands.co.zawww.huletts.co.zawww.unilever.co.zawww.woolworths.co.za
Ryan McMeekingErnie RobersteToby OosthuizenTania BothaSandra JoosteLucy BesterJan RysbergenMario le RouxLouwtjie NaudeMichael KaplanRheta Luddick
Terry MillerHannes ChenaskiZinhle MsanePierre van NiekerkDeon LoodtsJan RouxStuart WortleyIsabel MoolmanLelani LaagerGraham PaarmanGeorge NefdtMasika KhutsoneCindy JenksErina SteynTerry TaylorPieter HaasbroekJohan MaraisRod Gravelot-Blondin
Andre BoschJohn HenryJohan van DeventerPeter GohlGoosen LombardtHoward WarnekeKate TuckerSanta ConradiePat MogadiClive JardineJohn Ferreira
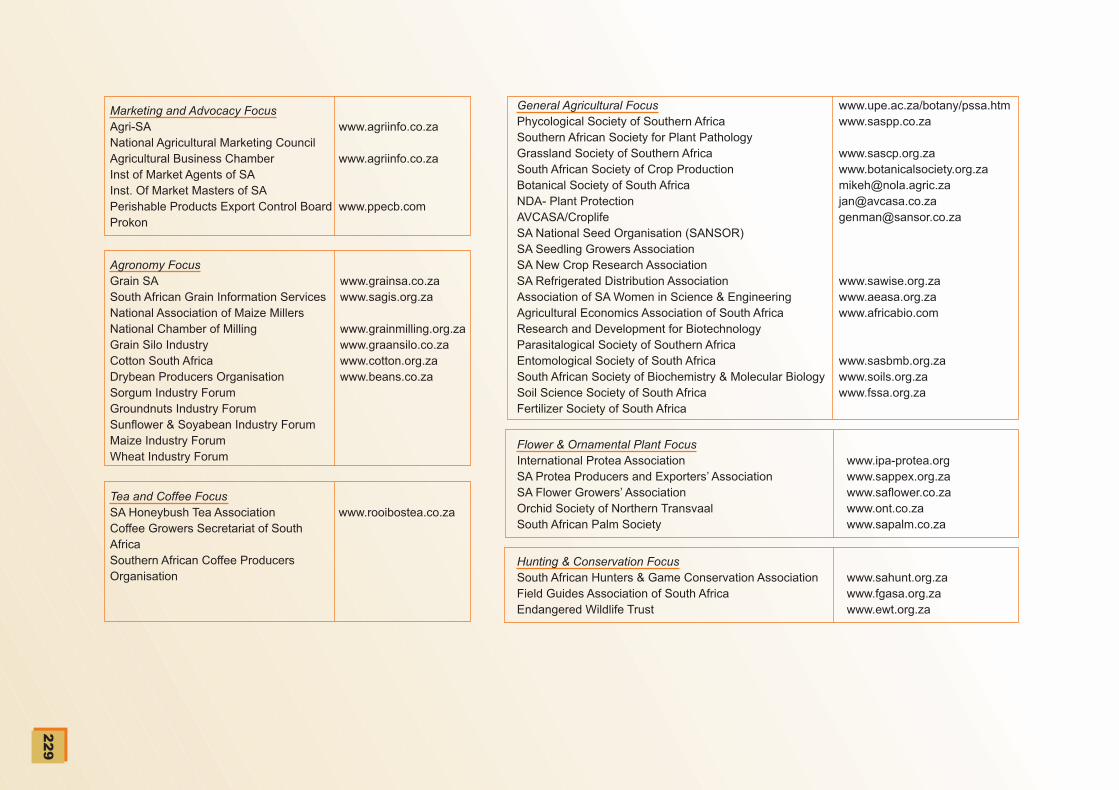
C M Y CM MY CY CMY K
22
9
Marketing and Advocacy FocusAgri-SANational Agricultural Marketing CouncilAgricultural Business ChamberInst of Market Agents of SAInst. Of Market Masters of SAPerishable Products Export Control BoardProkon
www.agriinfo.co.za
www.agriinfo.co.za
www.ppecb.com
General Agricultural FocusPhycological Society of Southern AfricaSouthern African Society for Plant PathologyGrassland Society of Southern AfricaSouth African Society of Crop ProductionBotanical Society of South AfricaNDA- Plant ProtectionAVCASA/CroplifeSA National Seed Organisation (SANSOR)SA Seedling Growers AssociationSA New Crop Research AssociationSA Refrigerated Distribution AssociationAssociation of SA Women in Science & EngineeringAgricultural Economics Association of South AfricaResearch and Development for BiotechnologyParasitalogical Society of Southern AfricaEntomological Society of South AfricaSouth African Society of Biochemistry & Molecular BiologySoil Science Society of South AfricaFertilizer Society of South Africa
www.upe.ac.za/botany/pssa.htmwww.saspp.co.za
www.sascp.org.zawww.botanicalsociety.org.zamikeh@[email protected]@sansor.co.za
www.sawise.org.zawww.aeasa.org.zawww.africabio.com
www.sasbmb.org.zawww.soils.org.zawww.fssa.org.za
Agronomy FocusGrain SASouth African Grain Information ServicesNational Association of Maize MillersNational Chamber of MillingGrain Silo IndustryCotton South AfricaDrybean Producers OrganisationSorgum Industry ForumGroundnuts Industry ForumSunflower & Soyabean Industry ForumMaize Industry ForumWheat Industry Forum
www.grainsa.co.zawww.sagis.org.za
www.grainmilling.org.zawww.graansilo.co.zawww.cotton.org.zawww.beans.co.za
Flower & Ornamental Plant FocusInternational Protea AssociationSA Protea Producers and Exporters’ AssociationSA Flower Growers’ AssociationOrchid Society of Northern TransvaalSouth African Palm Society
www.ipa-protea.orgwww.sappex.org.zawww.saflower.co.zawww.ont.co.zawww.sapalm.co.za
Hunting & Conservation FocusSouth African Hunters & Game Conservation AssociationField Guides Association of South AfricaEndangered Wildlife Trust
www.sahunt.org.zawww.fgasa.org.zawww.ewt.org.za
Tea and Coffee FocusSA Honeybush Tea AssociationCoffee Growers Secretariat of SouthAfricaSouthern African Coffee ProducersOrganisation
www.rooibostea.co.za
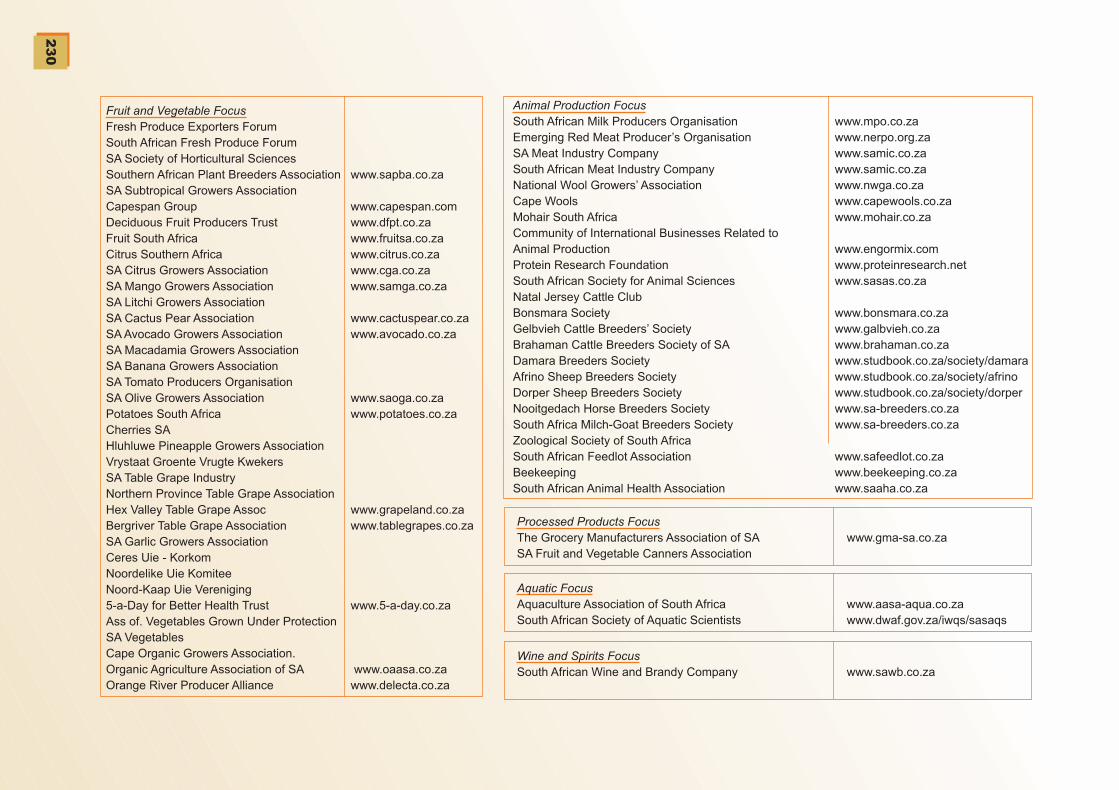
C M Y CM MY CY CMY K
23
0
Fruit and Vegetable FocusFresh Produce Exporters ForumSouth African Fresh Produce ForumSA Society of Horticultural SciencesSouthern African Plant Breeders AssociationSA Subtropical Growers AssociationCapespan GroupDeciduous Fruit Producers TrustFruit South AfricaCitrus Southern AfricaSA Citrus Growers AssociationSA Mango Growers AssociationSA Litchi Growers AssociationSA Cactus Pear AssociationSA Avocado Growers AssociationSA Macadamia Growers AssociationSA Banana Growers AssociationSA Tomato Producers OrganisationSA Olive Growers AssociationPotatoes South AfricaCherries SAHluhluwe Pineapple Growers AssociationVrystaat Groente Vrugte KwekersSA Table Grape IndustryNorthern Province Table Grape AssociationHex Valley Table Grape AssocBergriver Table Grape AssociationSA Garlic Growers AssociationCeres Uie - KorkomNoordelike Uie KomiteeNoord-Kaap Uie Vereniging5-a-Day for Better Health TrustAss of. Vegetables Grown Under ProtectionSA VegetablesCape Organic Growers Association.Organic Agriculture Association of SAOrange River Producer Alliance
www.sapba.co.za
www.capespan.comwww.dfpt.co.zawww.fruitsa.co.zawww.citrus.co.zawww.cga.co.zawww.samga.co.za
www.cactuspear.co.zawww.avocado.co.za
www.saoga.co.zawww.potatoes.co.za
www.grapeland.co.zawww.tablegrapes.co.za
www.5-a-day.co.za
www.oaasa.co.zawww.delecta.co.za
Animal Production FocusSouth African Milk Producers OrganisationEmerging Red Meat Producer’s OrganisationSA Meat Industry CompanySouth African Meat Industry CompanyNational Wool Growers’ AssociationCape WoolsMohair South AfricaCommunity of International Businesses Related toAnimal ProductionProtein Research FoundationSouth African Society for Animal SciencesNatal Jersey Cattle ClubBonsmara SocietyGelbvieh Cattle Breeders’ SocietyBrahaman Cattle Breeders Society of SADamara Breeders SocietyAfrino Sheep Breeders SocietyDorper Sheep Breeders SocietyNooitgedach Horse Breeders SocietySouth Africa Milch-Goat Breeders SocietyZoological Society of South AfricaSouth African Feedlot AssociationBeekeepingSouth African Animal Health Association
www.mpo.co.zawww.nerpo.org.zawww.samic.co.zawww.samic.co.zawww.nwga.co.zawww.capewools.co.zawww.mohair.co.za
www.engormix.comwww.proteinresearch.netwww.sasas.co.za
www.bonsmara.co.zawww.galbvieh.co.zawww.brahaman.co.zawww.studbook.co.za/society/damarawww.studbook.co.za/society/afrinowww.studbook.co.za/society/dorperwww.sa-breeders.co.zawww.sa-breeders.co.za
www.safeedlot.co.zawww.beekeeping.co.zawww.saaha.co.za
Processed Products FocusThe Grocery Manufacturers Association of SASA Fruit and Vegetable Canners Association
www.gma-sa.co.za
Aquatic FocusAquaculture Association of South AfricaSouth African Society of Aquatic Scientists
www.aasa-aqua.co.zawww.dwaf.gov.za/iwqs/sasaqs
Wine and Spirits FocusSouth African Wine and Brandy Company www.sawb.co.za
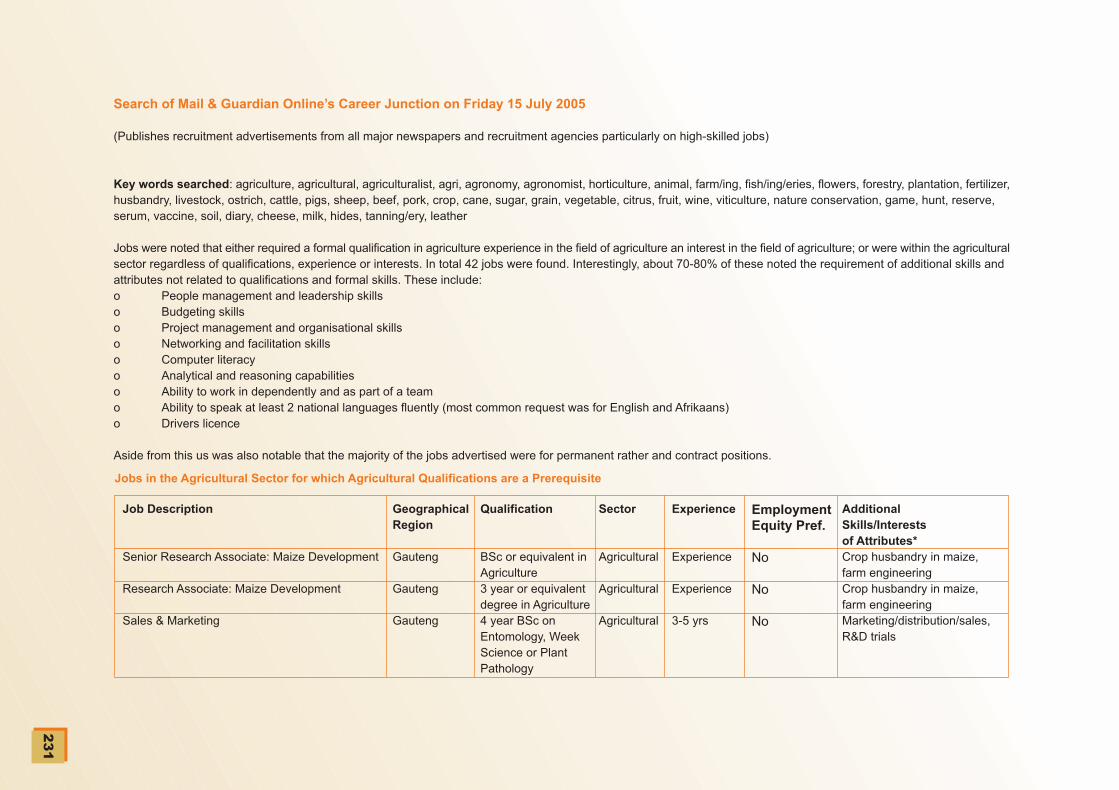
C M Y CM MY CY CMY K
23
1
Search of Mail & Guardian Online’s Career Junction on Friday 15 July 2005
(Publishes recruitment advertisements from all major newspapers and recruitment agencies particularly on high-skilled jobs)
Key words searched: agriculture, agricultural, agriculturalist, agri, agronomy, agronomist, horticulture, animal, farm/ing, fish/ing/eries, flowers, forestry, plantation, fertilizer,husbandry, livestock, ostrich, cattle, pigs, sheep, beef, pork, crop, cane, sugar, grain, vegetable, citrus, fruit, wine, viticulture, nature conservation, game, hunt, reserve,serum, vaccine, soil, diary, cheese, milk, hides, tanning/ery, leather
Jobs were noted that either required a formal qualification in agriculture experience in the field of agriculture an interest in the field of agriculture; or were within the agriculturalsector regardless of qualifications, experience or interests. In total 42 jobs were found. Interestingly, about 70-80% of these noted the requirement of additional skills andattributes not related to qualifications and formal skills. These include:o People management and leadership skillso Budgeting skillso Project management and organisational skillso Networking and facilitation skillso Computer literacyo Analytical and reasoning capabilitieso Ability to work in dependently and as part of a teamo Ability to speak at least 2 national languages fluently (most common request was for English and Afrikaans)o Drivers licence
Aside from this us was also notable that the majority of the jobs advertised were for permanent rather and contract positions.
Jobs in the Agricultural Sector for which Agricultural Qualifications are a Prerequisite
Job Description
Senior Research Associate: Maize Development
Research Associate: Maize Development
Sales & Marketing
GeographicalRegion
Gauteng
Gauteng
Gauteng
Qualification
BSc or equivalent inAgriculture3 year or equivalentdegree in Agriculture4 year BSc onEntomology, WeekScience or PlantPathology
Sector
Agricultural
Agricultural
Agricultural
Experience
Experience
Experience
3-5 yrs
EmploymentEquity Pref.
No
No
No
AdditionalSkills/Interestsof Attributes*Crop husbandry in maize,farm engineeringCrop husbandry in maize,farm engineeringMarketing/distribution/sales,R&D trials
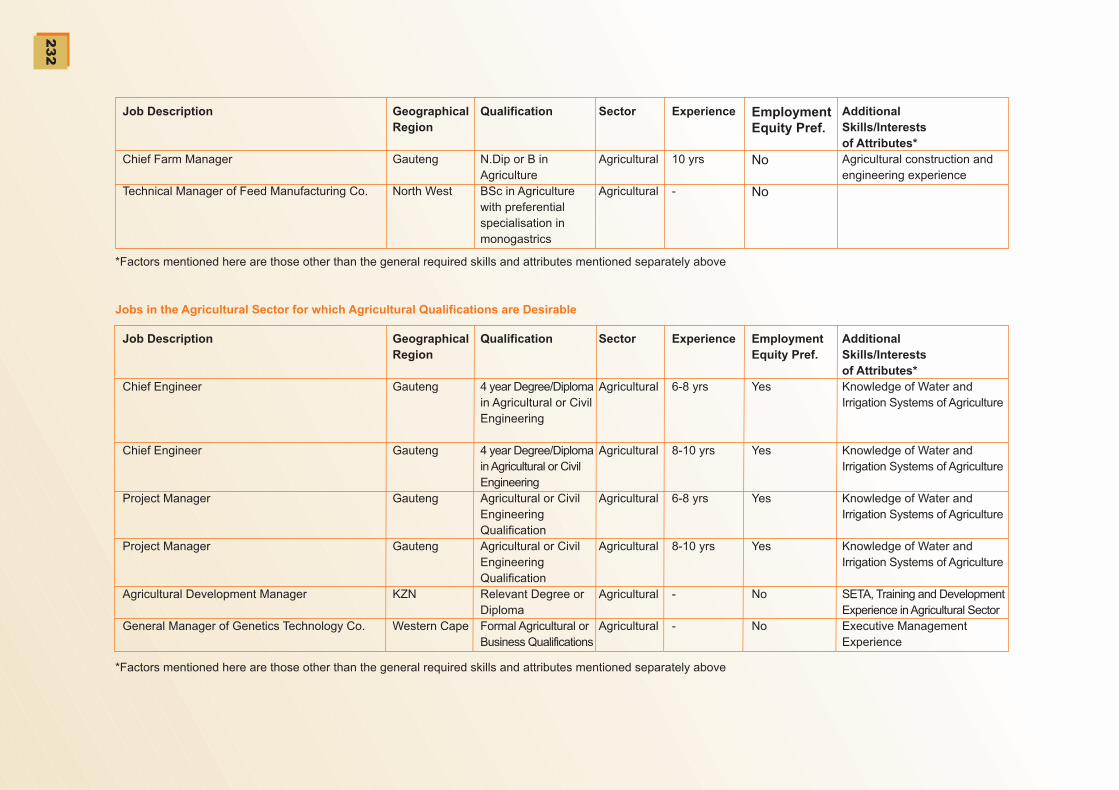
C M Y CM MY CY CMY K
23
2
Job Description
Chief Farm Manager
Technical Manager of Feed Manufacturing Co.
GeographicalRegion
Gauteng
North West
Qualification
N.Dip or B inAgricultureBSc in Agriculturewith preferentialspecialisation inmonogastrics
Sector
Agricultural
Agricultural
Experience
10 yrs
-
EmploymentEquity Pref.
No
No
AdditionalSkills/Interestsof Attributes*Agricultural construction andengineering experience
*Factors mentioned here are those other than the general required skills and attributes mentioned separately above
Jobs in the Agricultural Sector for which Agricultural Qualifications are Desirable
Job Description
Chief Engineer
Chief Engineer
Project Manager
Project Manager
Agricultural Development Manager
General Manager of Genetics Technology Co.
GeographicalRegion
Gauteng
Gauteng
Gauteng
Gauteng
KZN
Western Cape
Qualification
4 year Degree/Diplomain Agricultural or CivilEngineering
4 year Degree/Diplomain Agricultural or CivilEngineeringAgricultural or CivilEngineeringQualificationAgricultural or CivilEngineeringQualificationRelevant Degree orDiplomaFormal Agricultural orBusiness Qualifications
Sector
Agricultural
Agricultural
Agricultural
Agricultural
Agricultural
Agricultural
Experience
6-8 yrs
8-10 yrs
6-8 yrs
8-10 yrs
-
-
EmploymentEquity Pref.
Yes
Yes
Yes
Yes
No
No
AdditionalSkills/Interestsof Attributes*Knowledge of Water andIrrigation Systems of Agriculture
Knowledge of Water andIrrigation Systems of Agriculture
Knowledge of Water andIrrigation Systems of Agriculture
Knowledge of Water andIrrigation Systems of Agriculture
SETA, Training and DevelopmentExperience in Agricultural SectorExecutive ManagementExperience
*Factors mentioned here are those other than the general required skills and attributes mentioned separately above

C M Y CM MY CY CMY K
23
3
Jobs in the Agricultural Sector for which Agricultural Qualifications are Desirable
Job Description
General ManagerAssistant Director
Production Clerk
Farm Manager
Quality Controller
Secretary for Horticulture Company
General ManagerHR AssistantAgricultural Machinery After-Market Sales
Sales Rep for Pump Manufacturing Co.
Agricultural Sales Consultant for Diary Co
Sales Manager
Assistant Manager at Winetech
Book-keeper at Animal Nutrition CoIT Specialist at Animal Nutrition CoMechanical Technician at Animal Nutrition CoCall-Centre Operator at Animal Nutrition CoTele-Sales Operator at Animal Nutrition CoBook-keeper for WinefarmFinancial Manager for Shrimp Farming Company
GeographicalRegion
MpumalangaWestern Cape
Gauteng
Eastern Cape
Western Cape
Gauteng
GautengGautengZambia
Gauteng
Gauteng
Gauteng
Western Cape
GautengGautengGautengGautengGautengWestern CapeMozambique
Qualification
None specified4 year BSc orequivalentGrade 12 Maths,Pivot TablesMatric with Maths &Science/BiologyDip/Degree in NaturalSciences or FoodTechnologyB.Com or SecretarialQualificationNone SpecifiedHR Degree/DiplomaNone Specified
None Specified
None Specified
3 year B.Com/Diplomain MarketingRelated TertiaryQualificationRelated QualificationRelated QualificationRelated QualificationNone SpecifiedNone SpecifiedRelated Qualification4-6 yrs
Sector
AgriculturalAgricultural
Agricultural
Agricultural
Agricultural
Agricultural
AgriculturalAgriculturalAgricultural
Agricultural
Agricultural
Agricultural
Agricultural
AgriculturalAgriculturalAgriculturalAgriculturalAgriculturalAgriculturalAgricultural
Experience
3-5 yrs-
-
-
-
-
--3-5 yrs
3-5 yrs
-
4-6 yrs
4-5 yrs
-------
EmploymentEquity Pref.
NoNo
No
No
No
No
NoNoNo
No
No
No
No
NoNoNoNoNoNoNo
AdditionalSkills/Interestsof Attributes*-Research Experience andKnowledge of FisheriesData Capturing, AccountingSystem KnowledgeAnimal Husbandry andStockmanshipLaboratory Supervision, IntrinsicProduct Knowledge
Accounting
-Payroll, HR AdminKnowledge of Tractors andagricultural machinerySound Knowledge of Agriculturaland Industrial PumpsFarming Industry Knowledge /background or attendance atAgricultural High SchoolAgricultural Sales Knowledge
Experience in Agriculture ofWine Industry---Related ExperienceRelated ExperienceRelated ExperienceFluency in Portuguese
*Factors mentioned here are those other than the general required skills and attributes mentioned separately above
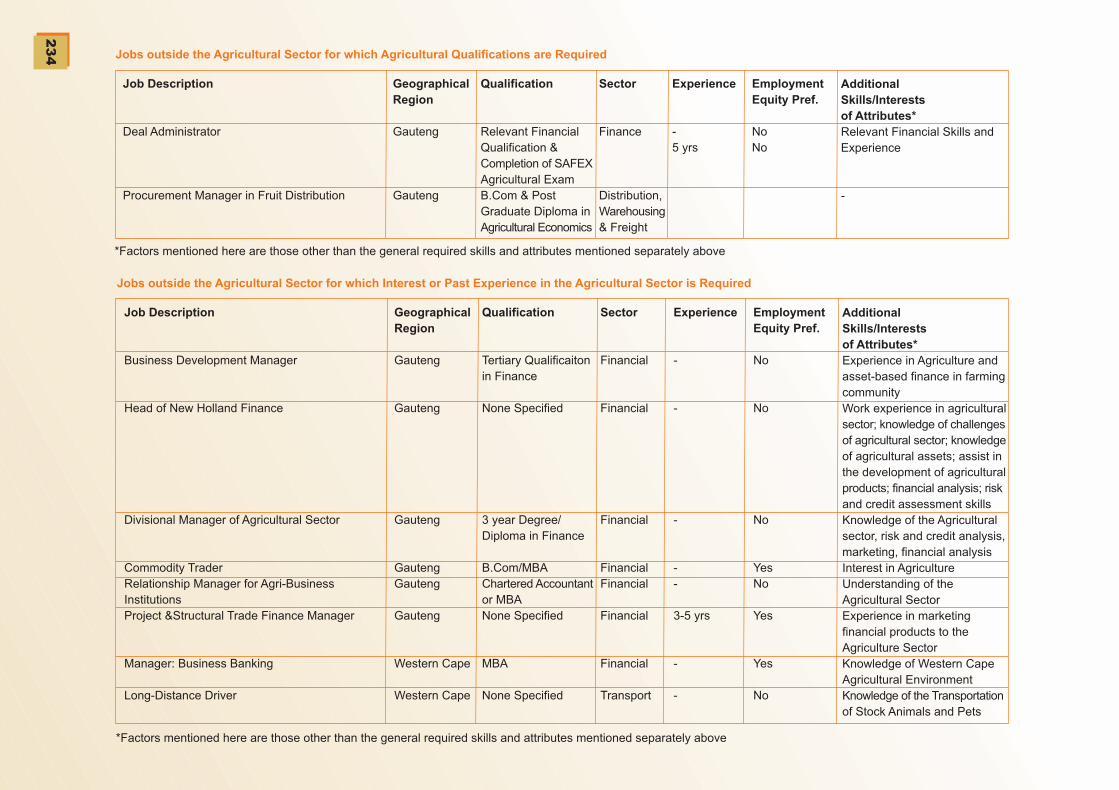
C M Y CM MY CY CMY K
23
4 Jobs outside the Agricultural Sector for which Agricultural Qualifications are Required
Job Description
Deal Administrator
Procurement Manager in Fruit Distribution
GeographicalRegion
Gauteng
Gauteng
Qualification
Relevant FinancialQualification &Completion of SAFEXAgricultural ExamB.Com & PostGraduate Diploma inAgricultural Economics
Sector
Finance
Distribution,Warehousing& Freight
Experience
-5 yrs
EmploymentEquity Pref.
NoNo
AdditionalSkills/Interestsof Attributes*Relevant Financial Skills andExperience
-
*Factors mentioned here are those other than the general required skills and attributes mentioned separately above
Jobs outside the Agricultural Sector for which Interest or Past Experience in the Agricultural Sector is Required
Job Description
Business Development Manager
Head of New Holland Finance
Divisional Manager of Agricultural Sector
Commodity TraderRelationship Manager for Agri-BusinessInstitutionsProject &Structural Trade Finance Manager
Manager: Business Banking
Long-Distance Driver
GeographicalRegion
Gauteng
Gauteng
Gauteng
GautengGauteng
Gauteng
Western Cape
Western Cape
Qualification
Tertiary Qualificaitonin Finance
None Specified
3 year Degree/Diploma in Finance
B.Com/MBAChartered Accountantor MBANone Specified
MBA
None Specified
Sector
Financial
Financial
Financial
FinancialFinancial
Financial
Financial
Transport
Experience
-
-
-
--
3-5 yrs
-
-
EmploymentEquity Pref.
No
No
No
YesNo
Yes
Yes
No
AdditionalSkills/Interestsof Attributes*Experience in Agriculture andasset-based finance in farmingcommunityWork experience in agriculturalsector; knowledge of challengesof agricultural sector; knowledgeof agricultural assets; assist inthe development of agriculturalproducts; financial analysis; riskand credit assessment skillsKnowledge of the Agriculturalsector, risk and credit analysis,marketing, financial analysisInterest in AgricultureUnderstanding of theAgricultural SectorExperience in marketingfinancial products to theAgriculture SectorKnowledge of Western CapeAgricultural EnvironmentKnowledge of the Transportationof Stock Animals and Pets
*Factors mentioned here are those other than the general required skills and attributes mentioned separately above

C M Y CM MY CY CMY K

C M Y CM MY CY CMY K


![C M Y CM MY CY CMY K - Unus International | DC motorsweb].pdf · Y CM MY CY CMY K. C M Y CM MY CY CMY K. QUALITY The Unus International Quality Assurance System is certified ISO 9001:2008](https://img.pdfslide.us/doc/110x75/5bd577fa09d3f27b3e8bb28f/c-m-y-cm-my-cy-cmy-k-unus-international-dc-webpdf-y-cm-my-cy-cmy-k-c.jpg)