Embed Size (px)
Citation preview

A N N U A L R E P O R T 2 0 1 3 / 2 0 1 4
C M H O L D I N G S P L C A N D I T S S U B S I D I A R I E S 1
Corporate Information
Notice of Meeting
Chairman’s Review
Directors Profiles
Annual Report of the Board of Directors
Corporate Governance
Audit Committee Report
Remuneration Committee Report
Independent Auditors’ Report
Statement of Financial Position
Statement of Comprehensive Income
Statement of Changes in Equity
Statement of Cash Flows
Notes to the Financial Statements
Share Information
Proxy Form
2
3 - 4
5
6-7
8-11
12-14
15-16
17
18-19
20
21
22-23
24
25-83
84-85
CONTENTS
A N N U A L R E P O R T 2 0 1 3 / 2 0 1 4
C M H O L D I N G S P L C A N D I T S S U B S I D I A R I E S2
CORPORATE INFORMATION
BOARD OF DIRECTORS Chairman A.Rajaratnam FCA
Deputy Chairman S.D.R. Arudpragasam FCMA (UK)
Managing Director R.M.M.J. Ratnayake MBA, FCMA (UK), CGMA
Directors J.M. Swaminathan LLB., LLM, M. Phil., Attorney-at-Law
A.M.de S. Jayaratne B.Sc.(Econ.), FCA
S. Rajaratnam B.Sc., CA
Anushman Rajaratnam B.Sc (Hons.), CPA, MBA
SECRETARIES Corporate Managers & Secretaries (Private) Limited
REGISTERED OFFICE 297, Union Place, Colombo 02.
LEGAL FORM Public Quoted Company with Limited Liability Domiciled in Sri Lanka
DATE OF INCORPORATION 09 July 1909
COMPANY NUMBER PQ 169
STOCK EXCHANGE LISTING The Ordinary Shares of the Company are Listed with the Colombo Stock Exchange of Sri Lanka.
BANKERS People’s Bank Hatton National Bank PLC Bank of Ceylon
LAWYERS Messrs Julius & Creasy
AUDITORS PricewaterhouseCoopers
A N N U A L R E P O R T 2 0 1 3 / 2 0 1 4
C M H O L D I N G S P L C A N D I T S S U B S I D I A R I E S 3
NOTICE OF MEETING
Notice is hereby given that the 102nd Annual General Meeting of C M Holdings PLC will be held at the Grand Oriental Hotel, No. 2, York Street, Colombo 1, on 29th August 2014 at 9.45 a.m. for the following purposes:
To receive and consider the Annual Report of the Board of Directors and the Statements of Accounts for the year ended 31st March, 2014 with the Report of the Auditors thereon.
To declare a First and Final Dividend of Rs. 3.00 per share for the year ended 31st March 2014 as recommended by the Directors.
To re - elect as a Director, Mr. Anushman Rajaratnam who retires in accordance with Article 95 of the Articles of Association.
To re-elect as a Director, Mr. S.D.R.Arudpragasam who retires in accordance with Articles 88 and 89 of the Articles of Association.
To reappoint Mr. A.M. de S. Jayaratne who is over seventy years of age as a Director. Special Notice has been received from a shareholder of the intention to pass a Resolution which is set out in the notes in relation to his reappointment (see Note No.4 on page 4).
To reappoint Mr. J.M. Swaminathan who is over seventy years of age as a Director. Special Notice has been received from a shareholder of the intention to pass a Resolution which is set out in the notes in relation to his reappointment (see Note No.5 on page 4).
To reappoint Mr. A. Rajaratnam who is over seventy years of age as a Director. Special Notice has been received from a shareholder of the intention to pass a Resolution which is set out in the notes in relation to his reappointment ( see Note No.6 on page 4).
To authorize the Directors to determine contributions to charities.
To reappoint as Auditors, Messrs PricewaterhouseCoopers and to authorize the Directors to determine their remuneration.
By Order of the BoardCorporate Managers & Secretaries (Private) LimitedSecretaries
Colombo.30th July 2014.
Note:
1. A member of the Company who is entitled to attend and vote at this meeting may appoint a proxy to attend and vote instead of him or her. A proxy need not be a member of the Company.
2. A Form of Proxy is enclosed in this Report.
3. The instrument appointing a proxy must reach the Registered Office of the Company’s Secretaries, Corporate Managers & Secretaries (Private) Limited, No. 8-5/2, Leyden Bastian Road, York Arcade Building, Colombo 01, not less than forty eight (48) hours before the time fixed for the meeting.
A N N U A L R E P O R T 2 0 1 3 / 2 0 1 4
C M H O L D I N G S P L C A N D I T S S U B S I D I A R I E S4
4. Special Notice has been received by the Company from a shareholder giving notice of the intention to move the following Resolution as an Ordinary Resolution at the Annual General Meeting.
Resolved-
“That Mr. A.M. de S. Jayaratne who is seventy four years of age be and is hereby reappointed a Director of the Company and it is further specially declared that the age limit of seventy years referred to in Section 210 of the Companies Act No.7 of 2007 shall not apply to the said Director, Mr. A.M. de S. Jayaratne.”
5. Special Notice has been received by the Company from a shareholder giving notice of the intention to move the following Resolution as an Ordinary Resolution at the Annual General Meeting:
Resolved –
“That Mr. J.M. Swaminathan who is seventy three years of age be and is hereby reappointed a Director of the Company and it is further specially declared that the age limit of seventy years referred to in Section 210 of the Companies Act No.7 of 2007 shall not apply to the said Director, Mr. J.M. Swaminathan.”
6. Special Notice has been received by the Company from a shareholder giving notice of the intention to move the following Resolution as an Ordinary Resolution at the Annual General Meeting:
Resolved –
“That Mr. A. Rajaratnam who is seventy three years of age be and is hereby reappointed a Director of the Company and it is further specially declared that the age limit of seventy years referred to in Section 210 of the Companies Act No. 7 of 2007 shall not apply to the said Director, Mr. A. Rajaratnam.”
A N N U A L R E P O R T 2 0 1 3 / 2 0 1 4
C M H O L D I N G S P L C A N D I T S S U B S I D I A R I E S 5
CHAIRMAN’S REVIEW
On behalf of the Board of Directors it is my pleasure to welcome you to the 102nd Annual General Meeting of C M Holdings PLC and present the Annual Report together with the Audited Financial Statements for the year ended 31st March 2014.
The group recorded a healthy turnover of Rs. 851.4 Mn in comparison to the previous year’s Rs. 795.5 Mn. The group gross profit increase from Rs. 206.9 Mn to Rs. 341 Mn was due to the increase in sales of spare parts and workshop repairs. Despite the restrictions for import of Motor Vehicles the performance of the motor vehicle segment had been encouraging. The Company achieved a net profit of Rs. 31.6 Mn from real estate and investment activities. The drop in revenue of the Company was due to the motor vehicle business being phased out and continued under its fully owned subsidiary Colonial Motors (Ceylon) Ltd.
Mr. Mohan Ratnayake was appointed as Managing Director of Colonial Motors (Ceylon) Limited during the year under review. Mr. Ratnayake will relinquish his position as Director of C M Holdings PLC at the conclusion of the Annual General Meeting.
The restructuring process undertaken during the financial year has been completed and C M Holdings PLC now functions as a Property Holding and Investment Company. The Company is formulating plans for the development of the Union Place property as a mixed development project which is expected to bring a regular revenue stream by way of commercial rents.
The Company’s main subsidiaries have their own Management Boards and functions independent of each other.
In conclusion on behalf of the Directors I take this opportunity to thank our customers and stakeholders for their continued support and patronage of our products and the employees for their dedication towards the Group and its success.
A. RajaratnamChairman
A N N U A L R E P O R T 2 0 1 3 / 2 0 1 4
C M H O L D I N G S P L C A N D I T S S U B S I D I A R I E S6
DIRECTORS PROFILES
A. Rajaratnam - Chairman FCA
Mr. A. Rajaratnam joined the Board in 1998 and was appointed Chairman in the year 2004. He serves as Chairman of The Colombo Fort Land & Building PLC (CFLB) and on the Boards of several listed and unlisted companies within the CFLB Group in addition to holding other Directorships within the Group.
S.D.R. Arudpragasam – Deputy Chairman FCMA (UK)
Mr. S.D.R. Arudpragasam joined the Board in 1999 and was appointed Deputy Chairman in November 2012. He serves as Chairman of several subsidiaries of The Colombo Fort Land & Building PLC (CFLB) and holds the position of Deputy Chairman on the Boards of The Colombo Fort Land & Building PLC and Lankem Ceylon PLC. Mr. Arudpragasam also functions as Managing Director of E.B. Creasy & Company PLC in addition to serving on the Boards of other companies within the CFLB Group.
R.M.M.J. Ratnayake – Managing DirectorMBA, FCMA (UK), CGMA
Mr. R.M.M.J. Ratnayake holds an MBA in Finance and is a Fellow Member of the Institute of Chartered Management Accountants U.K. and is also a Fellow Member of the Society of Certified Management Accountants. He has expertise in the fields of Tea Exports, Tea Plantations, Telecommunications and Motor Industry. Mr. Ratnayake joined the Company as Chief Executive Officer on 1st July 2008, was appointed to the Board as Director/Chief Executive Officer on 1st April 2010, and as Managing Director on 1st May 2010.
J.M. Swaminathan – DirectorAttorney-at –Law, LLB (Ceylon), LLMM.Phil. (Colombo)
Mr. J.M. Swaminathan was appointed to the Board in the year 2003. He holds LLB (Ceylon), LLM, M.Phil (Colombo) Degrees and is an Attorney-at-Law. He has been in the legal profession for over 40 years.
A N N U A L R E P O R T 2 0 1 3 / 2 0 1 4
C M H O L D I N G S P L C A N D I T S S U B S I D I A R I E S 7
He is the precedent partner of Messrs Julius & Creasy and was a Member of the Council for Legal Education. He is a Member of the Company Law Advisory Commission and Intellectual Property Law Advisory Commission and Law Commission of Sri Lanka. He is a Member of the Board of the Faculty of Law of the University of Colombo. He is also a Visiting Lecturer and an Examiner at the Faculty of Law, University of Colombo and a Lecturer at the Advanced Legal Studies Unit at the Sri Lanka Law College. He is also a Director of several public and private companies.
Mr. A. M. de S. Jayaratne – DirectorB.Sc.(Econ), FCA (Eng. and Wales), FCA(ICASL) Mr. A.M.de S. Jayaratne having joined the Board in 1981 was appointed Chairman in 1998. He resigned in the year 2003 and rejoined the Board in 2005. He is a former Chairman of Forbes & Walker Ltd, Colombo Stock Exchange, Ceylon Chamber of Commerce and The Finance Commission. He also served as Sri Lanka’s High Commissioner in Singapore. Mr. Jayaratne is a Director of several listed and unlisted companies.
Mr. S. Rajaratnam - DirectorB.Sc., CA
Mr. Sanjeev Rajaratnam was appointed to the Board in the year 2007. He holds a Bachelor of Science Degree in Business Administration from Boston College, U.S.A. and is a member of the Institute of Chartered Accountants in Australia. He has been associated with overseas companies in the field of Finance and currently holds the position of Deputy Managing Director of E.B. Creasy & Company PLC amongst other Directorships.
Anushman Rajaratnam - DirectorB.Sc (Hons.), CPA, MBA
Mr. Anushman Rajaratnam was appointed to the Board in October 2013. He has spent several years working overseas as a Consultant for a leading Accountancy Firm. He also serves on the Board of The Colombo Fort Land & Building PLC and functions as Managing Director, Lankem Ceylon PLC in addition to serving on the Boards of several subsidiaries of the Lankem Group.
A N N U A L R E P O R T 2 0 1 3 / 2 0 1 4
C M H O L D I N G S P L C A N D I T S S U B S I D I A R I E S8
ANNuAL REPORT OF THE BOARD OF DIRECTORS
The Board of Directors of C M Holdings PLC present their Report on the affairs of the Company together with the Audited Financial Statements for the year ended 31st March, 2014.
The details set out herein provide the pertinent information required by the Companies Act No.7 of 2007, and the Colombo Stock Exchange Listing Rules and are guided by recommended best practices
General
The Company was re-registered on 1st July, 2008 as required under the Companies Act No. 7 of 2007.
In the year under review, shareholder sanction was obtained to restructure the business activities of the Company by phasing out the motor vehicle business and restricting the business activities of the Company primarily of a property holding and investment company.
In keeping with the above and having obtained the required approvals, the name of the Company was changed from Colonial Motors PLC to C M Holdings PLC. The name change was effective from 4th October 2013.
Principal Activities / Business Review
The principal activities of the Company together with those of its subsidiary companies are given in Note 1 to the financial statements on page 25. A review of the Company’s business and its performance during the year with comments on financial results is contained in the Chairman’s Review which together with the financial statements reflect the state of affairs of the Company.
The Directors to the best of their knowledge and belief confirm that the Company has not engaged in any activities that contravene laws and regulations.
Financial Statements
The Financial Statements of the Company and the Group are given on pages 20 to 83.
Auditors’ Report
The Auditors’ Report on the Financial Statements is given on page 18 and 19.
Accounting Policies
The Accounting Policies adopted in the preparation of the Financial Statements are given on pages 26 to 43.
Interest Register
Directors’ Interest in transactions
The Directors have made general disclosures as provided for in Section 192(2) of the Companies’ Act No.7 of 2007. Arising from this, details of contracts in which they have an interest are disclosed in Note 32 to the financial statements on pages 79 to 82.
Directors’ Interest in Shares
The Directors of the Company who have an interest in the shares of the Company have disclosed their shareholdings and any acquisitions / disposals to the Board in compliance with Section 200 of the Companies Act.
A N N U A L R E P O R T 2 0 1 3 / 2 0 1 4
C M H O L D I N G S P L C A N D I T S S U B S I D I A R I E S 9
Details pertaining to Directors direct shareholdings are set out below: No. of No. ofName of Director Shares Shares as at as at 31.03.2014 31.03.2013Mr. A. Rajaratnam - 857Mr. S.D.R. Arudpragasam 50,500 50,500Mr. J.M. Swaminathan 561 561Mr. A.M. de S. Jayaratne 467 467Mr. S. Rajaratnam 28,571 28,571Mr. R.M.M.J. Ratnayake 185 611Mr. Anushman Rajaratnam - - (Appointed w.e.f. 08.10.2013)
Directors’ Remuneration
Key management compensation in respect of the Company and the Group for the financial year 2013/2014 is given in Note 24 to the financial statements on page 76.
Corporate Donations
No donations were made by the Company for the financial year 2013/2014. (2012/2013 - Rs. 85,068) Directorate
The names of the Directors who held office during the financial year are given below and their brief profiles appear on pages 6 and 7.
Mr.A. Rajaratnam - ChairmanMr. S.D.R. Arudpragasam - Deputy ChairmanMr. R.M.M.J. Ratnayake - Managing DirectorMr. J.M. Swaminathan - Director Mr. A.M. de S. Jayaratne - DirectorMr. S. Rajaratnam - DirectorMr. Anushman Rajaratnam - Director
Mr. Anushman Rajaratnam was appointed to the Board on 8th October 2013 and in terms of Article 95 of the Articles of Association he retires and being eligible offers himself for re-election.
In terms of Article Nos. 88 and 89 of the Articles of Association, Mr. S.D.R. Arudpragasam retires by rotation and being eligible offers himself for re-election.
Mr. A.M.de.S. Jayaratne, Director, being over seventy years of age retires and offers himself for reappointment under and by virtue of the Special Notice received from a shareholder of the Company which is referred to in the Notice of Meeting.
Mr. J.M. Swaminathan, Director, being over seventy years of age retires and offers himself for reappointment under and by virtue of the Special Notice received from a shareholder of the Company which is referred to in the Notice of Meeting.
Mr. A. Rajaratnam, Director, being over seventy years of age retires and offers himself for reappointment under and by virtue of the Special Notice received from a shareholder of the Company which is referred to in the Notice of Meeting.
Independent Auditors
The Financial Statements of the Company for the year have been audited by Messrs PricewaterhouseCoopers who were reappointed as Auditors at the Annual General Meeting held on 27th September 2013.
The remuneration payable by the Company and the Group to the Independent Auditors is given in Note 24 to the Consolidated Financial Statements on page 76.
A N N U A L R E P O R T 2 0 1 3 / 2 0 1 4
C M H O L D I N G S P L C A N D I T S S U B S I D I A R I E S10
The Directors are satisfied that based on written representations made by the Independent Auditors to the Board, the Auditors do not have any relationship or any interest with the Company and its subsidiaries that would impair their independence.
Revenue
The Revenue of the Group for the year was Rs. 851 Mn. (2012/2013 - Rs. 795 Mn)
Results
The Group made a loss before Tax of Rs. 71 Mn against a profit of Rs. 434 Mn in the previous year. The detailed results are given in the Statement of Comprehensive Income on page 21.
Dividends
The Directors are pleased to recommend the payment of a First and Final Dividend of Rs. 3.00 per share on the Ordinary Shares of the Company for the year ended 31st March, 2014 for approval by the Shareholders at the Annual General Meeting to be held on 29th August 2014. The Directors have confirmed that the Company satisfies the solvency test requirement under Section 56 of the Companies Act No. 07 of 2007 for the dividend proposed. A solvency certificate has been sought from the Auditors in respect of the aforementioned dividend.
Investments
Investments made by the Company and the Group are given in Notes 10 and 11 on pages 50 to 70.
Property, Plant & Equipment
During 2013/2014 the Group invested Rs.95,167,751 in Property, Plant & Equipment (2012/2013-Rs.437,117,110). Further your Directors are of the opinion that the net amounts at which Land and other Property, Plant & Equipment appear in the Balance Sheets are not greater than their market value as at 31st March, 2014.
Stated Capital
The Stated Capital of the Company as at 31st March, 2014 was Rs. 288,386,885/- and is represented by 15,200,000 issued and fully paid Ordinary Shares .
Reserves
The total reserves and their composition are set out in Note 17 on page 73 to the consolidated financial statements.
The movements are shown in the Statement of Changes in Equity in the Financial Statements.
Taxation
The Group’s liability to taxation has been computed in accordance with the provisions of the Inland Revenue Act No.10 of 2006 and subsequent amendments thereto.
Income Tax and other taxes paid and liable by the Group are disclosed in Note 27 on page 77.
Share Information
Information relating to earnings, dividend, net assets, market value per share and share trading is given on pages 84 and 85.
A N N U A L R E P O R T 2 0 1 3 / 2 0 1 4
C M H O L D I N G S P L C A N D I T S S U B S I D I A R I E S 11
Events Occurring after the Balance Sheet Date
Events occurring after the Balance Sheet date that would require adjustments to or disclosure are disclosed in Note 33 on page 83.
Capital Commitments and Contingent Liabilities
Capital commitments and contingent liabilities as at the Balance Sheet date are disclosed in Notes 34 and 35 on page 83.
Employment Policy
The Company does not employee any staff. The Company’s Secretaries Corporate Managers and Secretaries (Pvt) Ltd have also been appointed as Managers of the Company effective from 1st April 2014.
Shareholders
It is the Company’s policy to endeavour to ensure equitable treatment to its shareholders.
Statutory Payments
The Directors to the best of their knowledge and belief are satisfied that all statutory payments of the Company have been made.
Environmental Protection
The Company’s business activities can have direct and indirect effects on the environment. It is the Company’s policy to minimize any adverse effect its activities have on the environment and to promote co-operation and compliance with the relevant authorities and regulations. The Directors confirm that the Company has not undertaken any activities which have caused or are likely to cause detriment to the environment.
Internal Control
The Board of Directors takes overall responsibility for the Company’s internal control system. A separate Internal Audit section is to be set-up to review the effectiveness of the Company’s internal controls in order to ensure reasonable assurance that assets are safeguarded and all transactions are properly authorized and recorded. The Board reviews the recommendations of External Auditors and takes appropriate action to maintain an adequate internal control system.
Going Concern
The Board of Directors after making necessary inquiries and reviews including reviews of the Company’s budget for the subsequent year, capital expenditure requirements, future prospects and risks, cash flows and borrowing facilities have a reasonable expectation that the Company has adequate resources to continue its operations in the foreseeable future. Therefore the Going Concern basis has been adopted in the preparation of the financial statements.
For and on behalf of the Board
(Sgd) R M M J Ratnayake (Sgd) S D R ArudpragasamDirector Director
By Order of the Board
(Sgd) Corporate Managers & Secretaries (Private) Limited Secretaries
21st July 2014
A N N U A L R E P O R T 2 0 1 3 / 2 0 1 4
C M H O L D I N G S P L C A N D I T S S U B S I D I A R I E S12
CORPORATE GOVERNANCE
The business and affairs of the Company and its subsidiaries are managed and directed with the objective of balancing the attainment of corporate objectives with the alignment of corporate behaviour within the legal good governance framework of the industry and the country and also the accountability to shareholders and responsibility to other stakeholders. Board
Composition of the Board
The Directors are from varied business and professional backgrounds. Their expertise enables them to exercise independent judgement and their views carry substantial weight in decision making. The Board comprises of one Executive Director and six Non-Executive Directors of whom two are Independent. These Directors are listed below:
Mr. A. Rajaratnam - Chairman Non- ExecutiveMr. S.D.R. Arudpragasam - Deputy Chairman Non-ExecutiveMr.R. M.M.J. Ratnayake - Managing Director- ExecutiveMr. J.M. Swaminathan - Independent Non-Executive Mr. A.M. de S. Jayaratne - Independent Non-ExecutiveMr. S. Rajaratnam - Non ExecutiveMr. Anushman Rajaratnam - Non Executive(Appointed w.e.f. 08.10.2013)
The Non-Executive Directors have submitted their declarations of their Independence or Non Independence to the Board of Directors.
Mr. J.M. Swaminathan has served on the Board for more than nine years. He also serves on the Boards of the subsidiaries of C M Holdings PLC and a majority of the Directors of the Company are on the Boards of the subsidiary companies and other listed entities. However, the Board after taking into consideration all other circumstances listed in the Rules pertaining to the Criteria for
Defining Independence, is of the opinion that Mr. J.M. Swaminathan is nevertheless Independent.
Mr.A.M. de S. Jayaratne is a Director of the Parent Company. He has served on the Board of the Company and its Parent Company for more than nine years. He also serves on the Boards of the subsidiaries of C M Holdings PLC and a majority of the Directors of the Company are on the Boards of the subsidiary companies and other listed entities. However, the Board after taking into consideration all other circumstances listed in the Rules pertaining to the Criteria for Defining Independence, is of the opinion that Mr. A.M. de S. Jayaratne is nevertheless Independent.
Decision Making of the Board
The Board has met four times during the year under review. In addition to Board Meetings, matters are referred to the Board and decided by Resolutions in writing.
The Board is responsible for: Determining the strategic direction of the
Company and also setting corporate values.
Implementation and monitoring of business strategy of the Company.
Ensuring an effective internal control system and a proactive risk management system.
Ensuring compliance with ethical, legal, health, environment and safety standards.
Approval of Interim and Annual Financial Statements.
Approval of budgets, corporate plans, major capital investments, divestments and acquisitions
A N N U A L R E P O R T 2 0 1 3 / 2 0 1 4
C M H O L D I N G S P L C A N D I T S S U B S I D I A R I E S 13
Company Secretaries and Independent Professional Advice
The Company and all the Directors may seek advice from Corporate Managers & Secretaries (Private) Limited who are qualified to act as Secretaries as per the provisions of the Companies Act No. 07 of 2007. Advice is also sought from independent external professionals whenever the Board deems it necessary.
Independent Judgement
The Board is committed to exhibit high standards of integrity and independence of judgement. Each Director dedicates the time and effort necessary to carry out his responsibilities.
Financial Acumen
The Board includes six Finance Professionals who possess the knowledge and the competence to offer the Board the necessary guidance on matters of Finance.
Supply of Information
Directors are furnished with monthly reports on Performance comprising of Financial Statements.
Appointments to the Board
The Board as a whole decides on the appointments of Directors in accordance with the Articles of Association of the Company and in compliance with the rules on Governance.
The details of new appointments to the Board are made available to the shareholders by making announcements to the Colombo Stock Exchange.
Re-election of Directors
In terms of the Articles of Association any Director appointed by the Board holds office until the next Annual General Meeting at which he seeks re-election by the Shareholders.
The Articles of Association require one third or a number nearest to one third of the Directors in office to retire at each Annual General Meeting. The Directors to retire in each year are those who have been longest in office since their last election or appointment. Retiring Directors are eligible for re-election by the Shareholders.
A Director appointed to the office of Chairman, Managing or Joint Managing Director shall not whilst holding that office be subject to retirement by rotation.
Directors Remuneration
Remuneration Committee
The Remuneration Committee comprises of Mr. J.M. Swaminathan, Chairman, Mr. A.M. de S. Jayaratne, Independent Non-Executive Directors and Mr. S.D.R. Arudpragasam, Non-Executive Director.
The Remuneration Committee Report is set out on page 16 of this Report.
Disclosures
Aggregate remuneration paid to Directors is disclosed in Note 24 to the Financial Statements on page 76.
A N N U A L R E P O R T 2 0 1 3 / 2 0 1 4
C M H O L D I N G S P L C A N D I T S S U B S I D I A R I E S14
Relations with Shareholders
Constructive use of AGM / General Meetings
The Board considers the Annual General Meeting/ General Meetings an opportunity to communicate with shareholders and encourages their participation. Questions raised by the Shareholders are answered and an appropriate dialogue is maintained with them.
Others
The Company’s principal communicator with all its stakeholders are its Annual Report and Quarterly Financial Statements.
Accountability and Audit
Financial Reporting
The Board places emphasis on complete disclosure of financial and non-financial information within the bounds of commercial reality. This enables both existing and prospective shareholders to make fair assessment on the Company’s performance and future prospects. The Financial Statements are prepared in accordance with Sri Lanka Accounting Standards.
Disclosures
The Annual Report of the Board of Directors is given on pages 8 to 11 in this Report. The Auditor’s Report on the Financial Statements is given on pages 18 and 19 of the Report.
Going Concern
The Directors are of the belief that the Company is capable of operating in the foreseeable future after the adequate assessment of the Company’s Financial position and resources. Therefore the Going Concern principle has been adopted in the preparation of these Financial Statements.
Internal Control
The Board of Directors is responsible for the Company’s system of internal controls and for reviewing its effectiveness. The system is designed to safeguard assets against unauthorized use or disposal and to ensure that proper records are maintained . It includes all controls including financial, operational and compliance controls and risk management.
However any system can ensure only reasonable and not absolute assurance that errors and irregularities are prevented or detected within a reasonable time frame. Audit Committee
The Audit Committee Report is set out on page 15 of this Report.
A N N U A L R E P O R T 2 0 1 3 / 2 0 1 4
C M H O L D I N G S P L C A N D I T S S U B S I D I A R I E S 15
AuDIT COMMITTEE REPORT
The Audit Committee Report focuses on the activities of the Company for the year under review, which the Audit Committee has reviewed and monitored so as to provide an additional assurance on the reliability of the financial statements.
Composition
The Audit Committee comprises of three Non-Executive Directors of whom two are independent. The names of the members are set out below.
M. A. M de S. Jayaratne - Chairman Independent Non-Executive Director
Mr. J. M Swaminathan - Member Independent Non-Executive Director
Mr. S.D.R. Arudpragasam - Member Non-Executive Director
The Committee has a blend of experience in the commercial sector, audit exposure, corporate law and business acumen to carry out their role efficiently and effectively. The Committee consists of two finance professionals.
Role of Audit Committee
The Audit Committee acts as the advisory to the Board and its main objective is to assist the Board of Directors by giving recommendations to ensure that the Company follows best practices in line with best Corporate Governance practices. The Committee is responsible for ensuring a sound financial reporting system adhering to relevant accounting standards and principles, adequacy of
internal controls and risk control measures, efficient management reporting systems and adherence to other statutory requirements. In fulfilling this role the Audit Committee is empowered to examine the financial records of the Company and other communications as necessary in order to ensure that the Company adheres to accepted norms of ethical guidelines, rules and regulations. The Audit Committee recommends the appointment of external auditors ensuring independence and maintains a close professional relationship with them. The Committee also recommends the fees payable to external Auditors.
Meetings and Attendance
The Audit Committee has met on four occasions during the financial year ended 31 March 2014 and the attendance was as follows:
Mr. A. M. de S. Jayaratne - Chairman - 4/4Mr. J. M. Swaminathan - 4/4Mr. S. D. R. Arudpragasam - 4/4
The Company’s secretaries, Corporate Managers and Secretaries (Private) Limited functions as the secretaries to the Audit Committee.
Senior Management personnel of the Company are invited to the meetings as and when required. The proceedings of the Audit Committee are regularly reported to the Board.
A N N U A L R E P O R T 2 0 1 3 / 2 0 1 4
C M H O L D I N G S P L C A N D I T S S U B S I D I A R I E S16
External Audit
The Company has appointed Pricewaterhouse- Coopers as its external auditor for the financial year ended 31 March 2014 and the services provided by them are segregated between audit/ assurance services and other advisory services such as tax consultancy. PricewaterhouseCoopers has also issued a declaration as required by the Company’s Act No. 7 of 2007 that they do not have any relationship or interest in any of the Companies in the Group, which may have a bearing on the independence of their role as auditors.
The Committee after evaluating the independence and performance of the External Auditors has recommended to the Board the reappointment of Messrs PricewaterhouseCoopers for the financial year ending 31 March 2015 subject to the approval of the Shareholders at the Annual General Meeting of the Company.
(Sgd). A M de S. Jayaratne ChairmanAudit Committee
21st July 2014
A N N U A L R E P O R T 2 0 1 3 / 2 0 1 4
C M H O L D I N G S P L C A N D I T S S U B S I D I A R I E S 17
REMuNERATION COMMITTEE REPORT
The Remuneration Committee of C M Holdings PLC comprise of the following members:
Mr. J.M. Swaminathan - Chairman / Independent Non-ExecutiveMr. A.M.de S. Jayaratne - Independent Non-ExecutiveMr. S.D.R. Arudpragasam - Non-Executive
The main function of the Remuneration Committee is to assist the Board in developing and administering an equitable and transparent method for setting policy on the overall human resources strategy of the Group and the remuneration of Directors and senior management of the Group.
The key objective of the committee is to attract, motivate and retain qualified and experienced personnel throughout the Group and to ensure that the remuneration of executives at each level of management is competitive and are rewarded in a fair manner based on their performance.
(Sgd) Mr. J. M. Swaminathan ChairmanRemuneration Committee
21st July 2014
A N N U A L R E P O R T 2 0 1 3 / 2 0 1 4
C M H O L D I N G S P L C A N D I T S S U B S I D I A R I E S18
To the shareholders of C M Holdings PLC Report on the Financial Statements 1. We have audited the accompanying financial
statements of C M Holdings PLC, the consolidated financial statements of the Company and its subsidiaries, which comprise the statement of financial position as at 31 March 2014, the comprehensive income statement, statement of changes in equity and statement of cash flows for the year then ended, and a summary of significant accounting policies and other explanatory notes as set out on pages 25 to 83.
Management’s Responsibility for the Financial Statements
2. Management is responsible for the preparation and fair presentation of these financial statements in accordance with Sri Lanka Accounting Standards (SLFRSs). This responsibility includes: designing, implementing and maintaining internal controls relevant to the preparation and fair presentation of financial statements that are free from material misstatement, whether due to fraud or error; selecting and applying appropriate accounting policies; and making accounting estimates that are reasonable in the circumstances.
INDEPENDENT AuDITORS’ REPORT
Scope of Audit and Basis of Opinion
3. Our responsibility is to express an opinion on these financial statements based on our audit. We conducted our audit in accordance with Sri Lanka Auditing Standards. Those Standards require that we plan and perform the audit to obtain reasonable assurance whether the financial statements are free from material misstatement.
4. An audit includes examining, on a test basis, evidence supporting the amounts and disclosures in the financial statements. An audit also includes assessing the accounting principles used and significant estimates made by management, as well as evaluating the overall financial statement presentation.
5. We have obtained all the information and explanations which to the best of our knowledge and belief were necessary for the purposes of our audit. We therefore believe that our audit provides a reasonable basis for our opinion.
PricewaterhouseCoopers, P. O. Box 918, 100 Braybrooke Place, Colombo 2, Sri Lanka T: +94 (11) 771 9838, 471 9838, F: +94 (11) 230 3197, www.pwc.com/lk
Partners Y. Kanagasabai FCA, D.T.S.H. Mudalige FCA, C.S. Manoharan ACA, N.R. Gunasekera FCA, S. Gajendran FCA, Ms. S. Hadgie FCA, Ms. S. Perera ACA
PricewaterhouseCoopers is a member firm of PricewaterhouseCoopers International Limited, each member firm of which is a separate legal entity.
Independent Auditors Report Continued on page 19
A N N U A L R E P O R T 2 0 1 3 / 2 0 1 4
C M H O L D I N G S P L C A N D I T S S U B S I D I A R I E S 19
INDEPENDENT AuDITORS’ REPORT
To the shareholders of C M Holdings PLC
Report on the Financial Statements (Contd)
Opinion
6. In our opinion, so far as appears from our examination, the Company maintained proper accounting records for the year ended 31 March 2014 and the financial statements give a true and fair view of the Company’s state of affairs as at 31 March 2014 and of its profit and cash flows for the year then ended in accordance with Sri Lanka Accounting Standards.
7. In our opinion, so far as appears from our examination, the Group maintained proper accounting records for the year ended 31 March 2014, and the consolidated financial statements give a true and fair view of the Group’s state of affairs as at 31 March 2014 and of its result of financial performance and cash flows for the year then ended in accordance with Sri Lanka Accounting Standards, of the Company and its subsidiaries dealt with thereby, so far as concerns the members of the Company.
Report on Other Legal and Regulatory Requirements
8. These financial statements also comply with the requirements of sections 151 (2) and 153 (2) to 153 (7) of the Companies Act, No. 07 of 2007.
(Sgd) PricewaterhouseCoopers
CHARTERED ACCOUNTANTS
COLOMBO
24th July 2014
A N N U A L R E P O R T 2 0 1 3 / 2 0 1 4
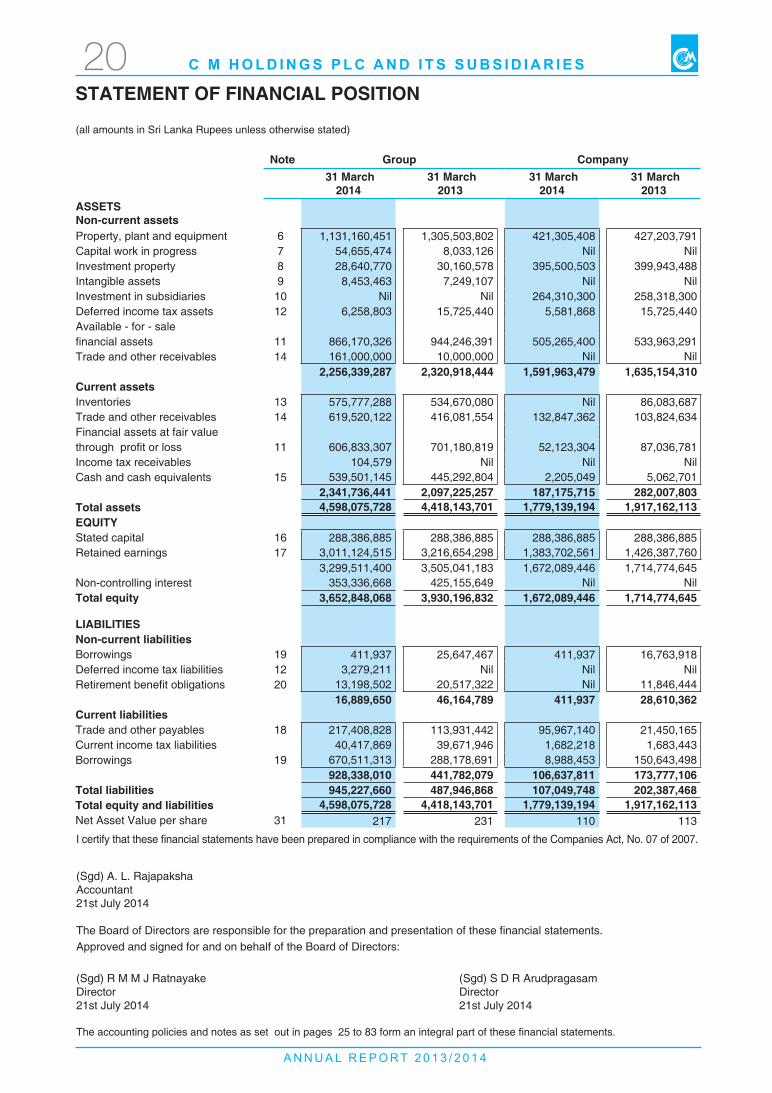
C M H O L D I N G S P L C A N D I T S S U B S I D I A R I E S20STATEMENT OF FINANCIAL POSITION
(all amounts in Sri Lanka Rupees unless otherwise stated)
Note Group Company 31 March
2014 31 March
2013 31 March
2014 31 March
2013ASSETS Non-current assets Property, plant and equipment 6 1,131,160,451 1,305,503,802 421,305,408 427,203,791 Capital work in progress 7 54,655,474 8,033,126 Nil Nil Investment property 8 28,640,770 30,160,578 395,500,503 399,943,488 Intangible assets 9 8,453,463 7,249,107 Nil Nil Investment in subsidiaries 10 Nil Nil 264,310,300 258,318,300 Deferred income tax assets 12 6,258,803 15,725,440 5,581,868 15,725,440 Available - for - sale financial assets 11 866,170,326 944,246,391 505,265,400 533,963,291 Trade and other receivables 14 161,000,000 10,000,000 Nil Nil
2,256,339,287 2,320,918,444 1,591,963,479 1,635,154,310 Current assetsInventories 13 575,777,288 534,670,080 Nil 86,083,687 Trade and other receivables 14 619,520,122 416,081,554 132,847,362 103,824,634 Financial assets at fair valuethrough profit or loss 11 606,833,307 701,180,819 52,123,304 87,036,781 Income tax receivables 104,579 Nil Nil Nil Cash and cash equivalents 15 539,501,145 445,292,804 2,205,049 5,062,701
2,341,736,441 2,097,225,257 187,175,715 282,007,803 Total assets 4,598,075,728 4,418,143,701 1,779,139,194 1,917,162,113 EQuITYStated capital 16 288,386,885 288,386,885 288,386,885 288,386,885 Retained earnings 17 3,011,124,515 3,216,654,298 1,383,702,561 1,426,387,760
3,299,511,400 3,505,041,183 1,672,089,446 1,714,774,645 Non-controlling interest 353,336,668 425,155,649 Nil NilTotal equity 3,652,848,068 3,930,196,832 1,672,089,446 1,714,774,645
LIABILITIESNon-current liabilitiesBorrowings 19 411,937 25,647,467 411,937 16,763,918 Deferred income tax liabilities 12 3,279,211 Nil Nil Nil Retirement benefit obligations 20 13,198,502 20,517,322 Nil 11,846,444
16,889,650 46,164,789 411,937 28,610,362 Current liabilitiesTrade and other payables 18 217,408,828 113,931,442 95,967,140 21,450,165 Current income tax liabilities 40,417,869 39,671,946 1,682,218 1,683,443 Borrowings 19 670,511,313 288,178,691 8,988,453 150,643,498
928,338,010 441,782,079 106,637,811 173,777,106 Total liabilities 945,227,660 487,946,868 107,049,748 202,387,468 Total equity and liabilities 4,598,075,728 4,418,143,701 1,779,139,194 1,917,162,113 Net Asset Value per share 31 217 231 110 113
I certify that these financial statements have been prepared in compliance with the requirements of the Companies Act, No. 07 of 2007.
(Sgd) A. L. Rajapaksha Accountant 21st July 2014
The Board of Directors are responsible for the preparation and presentation of these financial statements. Approved and signed for and on behalf of the Board of Directors:
(Sgd) R M M J Ratnayake (Sgd) S D R ArudpragasamDirector Director21st July 2014 21st July 2014
The accounting policies and notes as set out in pages 25 to 83 form an integral part of these financial statements.
A N N U A L R E P O R T 2 0 1 3 / 2 0 1 4
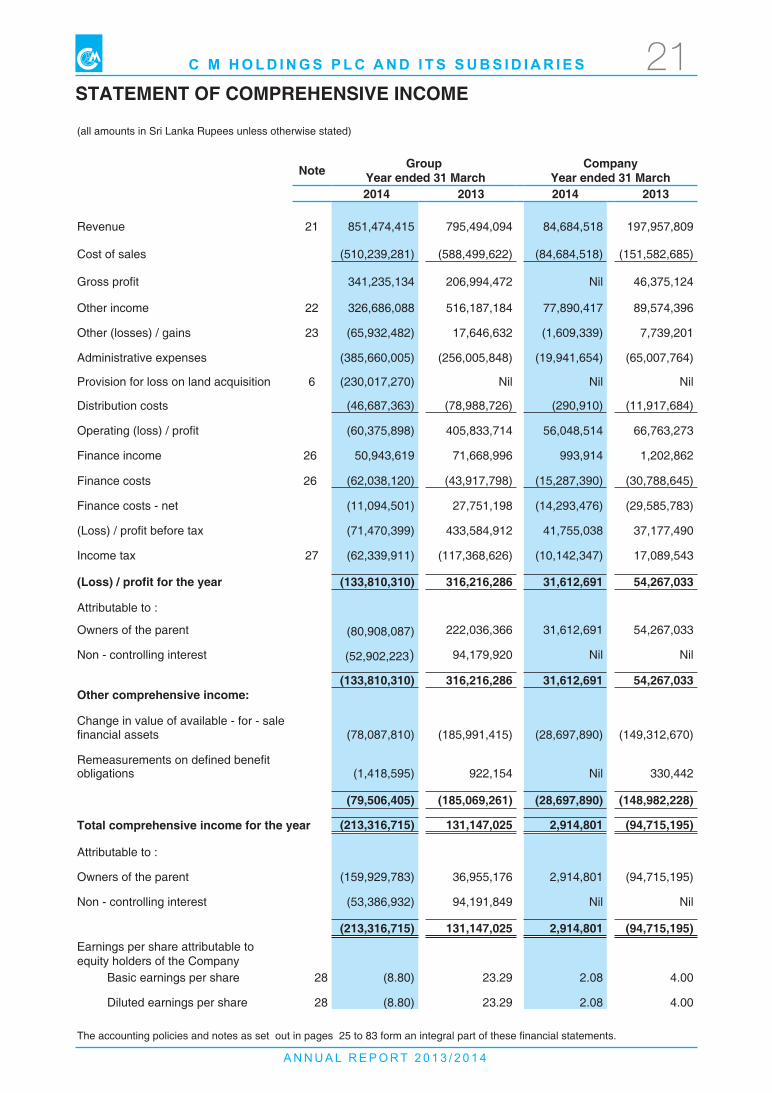
C M H O L D I N G S P L C A N D I T S S U B S I D I A R I E S 21STATEMENT OF COMPREHENSIVE INCOME
(all amounts in Sri Lanka Rupees unless otherwise stated)
Note Group Year ended 31 March
CompanyYear ended 31 March
2014 2013 2014 2013
Revenue 21 851,474,415 795,494,094 84,684,518 197,957,809
Cost of sales (510,239,281) (588,499,622) (84,684,518) (151,582,685)
Gross profit 341,235,134 206,994,472 Nil 46,375,124
Other income 22 326,686,088 516,187,184 77,890,417 89,574,396
Other (losses) / gains 23 (65,932,482) 17,646,632 (1,609,339) 7,739,201
Administrative expenses (385,660,005) (256,005,848) (19,941,654) (65,007,764)
Provision for loss on land acquisition 6 (230,017,270) Nil Nil Nil
Distribution costs (46,687,363) (78,988,726) (290,910) (11,917,684)
Operating (loss) / profit (60,375,898) 405,833,714 56,048,514 66,763,273
Finance income 26 50,943,619 71,668,996 993,914 1,202,862
Finance costs 26 (62,038,120) (43,917,798) (15,287,390) (30,788,645)
Finance costs - net (11,094,501) 27,751,198 (14,293,476) (29,585,783)
(Loss) / profit before tax (71,470,399) 433,584,912 41,755,038 37,177,490
Income tax 27 (62,339,911) (117,368,626) (10,142,347) 17,089,543
(Loss) / profit for the year (133,810,310) 316,216,286 31,612,691 54,267,033
Attributable to :
Owners of the parent (80,908,087) 222,036,366 31,612,691 54,267,033
Non - controlling interest (52,902,223) 94,179,920 Nil Nil
(133,810,310) 316,216,286 31,612,691 54,267,033 Other comprehensive income:
Change in value of available - for - salefinancial assets (78,087,810) (185,991,415) (28,697,890) (149,312,670)
Remeasurements on defined benefit obligations (1,418,595) 922,154 Nil 330,442
(79,506,405) (185,069,261) (28,697,890) (148,982,228)
Total comprehensive income for the year (213,316,715) 131,147,025 2,914,801 (94,715,195)
Attributable to :
Owners of the parent (159,929,783) 36,955,176 2,914,801 (94,715,195)
Non - controlling interest (53,386,932) 94,191,849 Nil Nil
(213,316,715) 131,147,025 2,914,801 (94,715,195)Earnings per share attributable to equity holders of the Company
Basic earnings per share 28 (8.80) 23.29 2.08 4.00
Diluted earnings per share 28 (8.80) 23.29 2.08 4.00
The accounting policies and notes as set out in pages 25 to 83 form an integral part of these financial statements.
A N N U A L R E P O R T 2 0 1 3 / 2 0 1 4
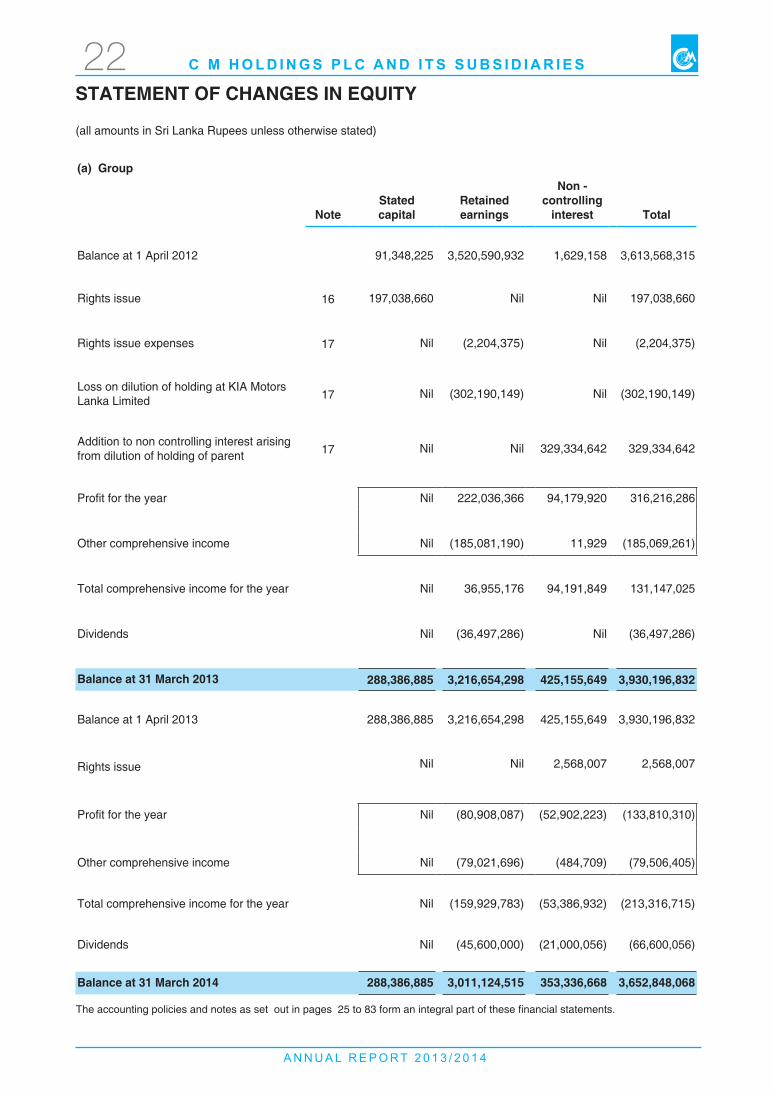
C M H O L D I N G S P L C A N D I T S S U B S I D I A R I E S22
(a) Group
NoteStatedcapital
Retainedearnings
Non -controlling
interest Total
Balance at 1 April 2012 91,348,225 3,520,590,932 1,629,158 3,613,568,315
Rights issue 16 197,038,660 Nil Nil 197,038,660
Rights issue expenses 17 Nil (2,204,375) Nil (2,204,375)
Loss on dilution of holding at KIA Motors Lanka Limited 17 Nil (302,190,149) Nil (302,190,149)
Addition to non controlling interest arising from dilution of holding of parent 17 Nil Nil 329,334,642 329,334,642
Profit for the year Nil 222,036,366 94,179,920 316,216,286
Other comprehensive income Nil (185,081,190) 11,929 (185,069,261)
Total comprehensive income for the year Nil 36,955,176 94,191,849 131,147,025
Dividends Nil (36,497,286) Nil (36,497,286)
Balance at 31 March 2013 288,386,885 3,216,654,298 425,155,649 3,930,196,832
Balance at 1 April 2013 288,386,885 3,216,654,298 425,155,649 3,930,196,832
Rights issue Nil Nil 2,568,007 2,568,007
Profit for the year Nil (80,908,087) (52,902,223) (133,810,310)
Other comprehensive income Nil (79,021,696) (484,709) (79,506,405)
Total comprehensive income for the year Nil (159,929,783) (53,386,932) (213,316,715)
Dividends Nil (45,600,000) (21,000,056) (66,600,056)
Balance at 31 March 2014 288,386,885 3,011,124,515 353,336,668 3,652,848,068
STATEMENT OF CHANGES IN EQuITY
(all amounts in Sri Lanka Rupees unless otherwise stated)
The accounting policies and notes as set out in pages 25 to 83 form an integral part of these financial statements.
A N N U A L R E P O R T 2 0 1 3 / 2 0 1 4
C M H O L D I N G S P L C A N D I T S S U B S I D I A R I E S 23
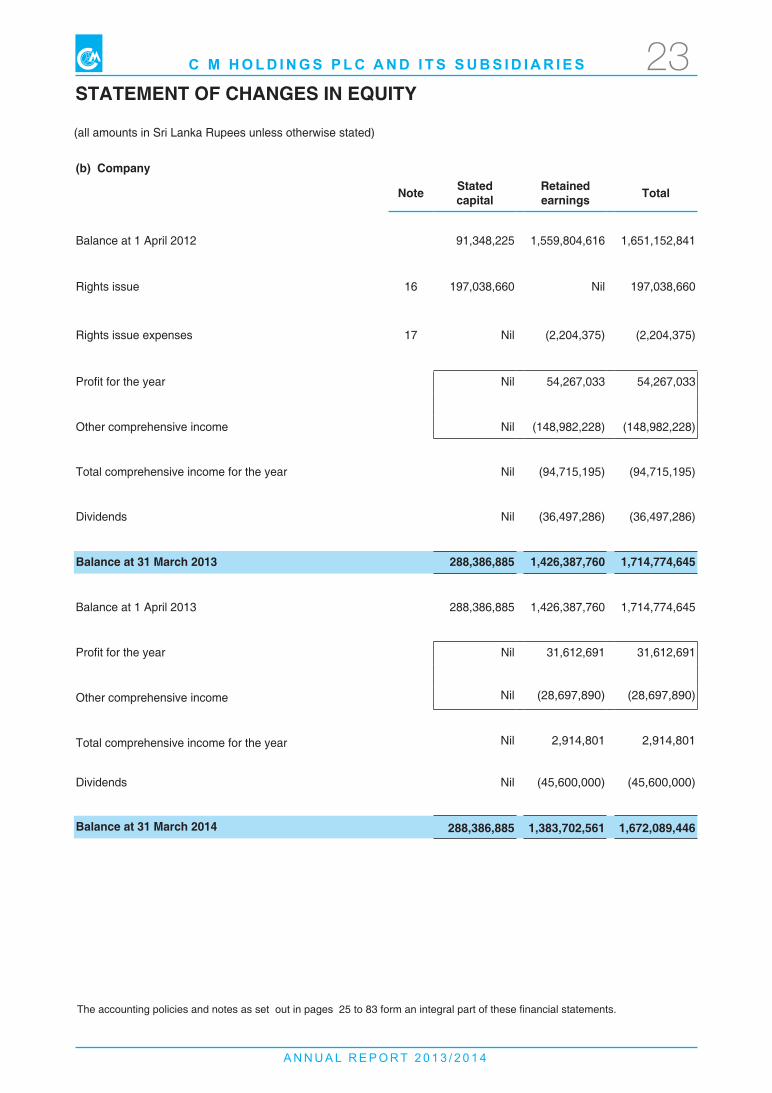
(b) Company
Note Statedcapital
Retainedearnings Total
Balance at 1 April 2012 91,348,225 1,559,804,616 1,651,152,841
Rights issue 16 197,038,660 Nil 197,038,660
Rights issue expenses 17 Nil (2,204,375) (2,204,375)
Profit for the year Nil 54,267,033 54,267,033
Other comprehensive income Nil (148,982,228) (148,982,228)
Total comprehensive income for the year Nil (94,715,195) (94,715,195)
Dividends Nil (36,497,286) (36,497,286)
Balance at 31 March 2013 288,386,885 1,426,387,760 1,714,774,645
Balance at 1 April 2013 288,386,885 1,426,387,760 1,714,774,645
Profit for the year Nil 31,612,691 31,612,691
Other comprehensive income Nil (28,697,890) (28,697,890)
Total comprehensive income for the year Nil 2,914,801 2,914,801
Dividends Nil (45,600,000) (45,600,000)
Balance at 31 March 2014 288,386,885 1,383,702,561 1,672,089,446
STATEMENT OF CHANGES IN EQuITY
(all amounts in Sri Lanka Rupees unless otherwise stated)
The accounting policies and notes as set out in pages 25 to 83 form an integral part of these financial statements.
A N N U A L R E P O R T 2 0 1 3 / 2 0 1 4
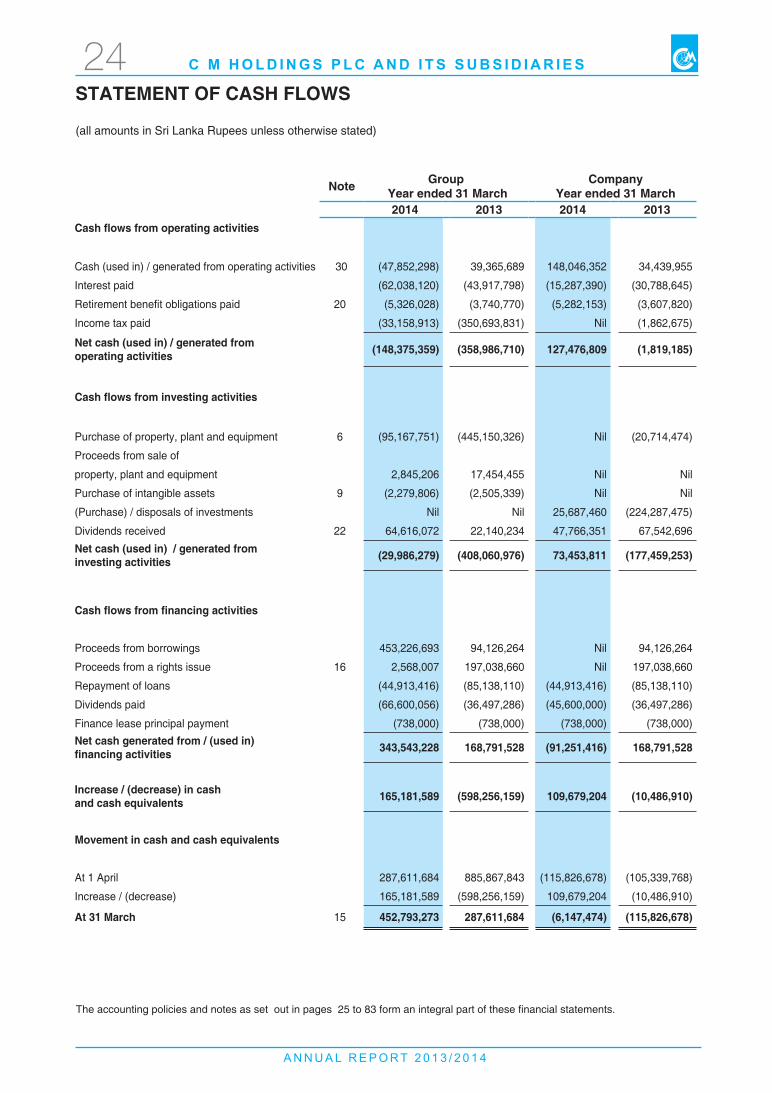
C M H O L D I N G S P L C A N D I T S S U B S I D I A R I E S24STATEMENT OF CASH FLOWS
Note Group Year ended 31 March
CompanyYear ended 31 March
2014 2013 2014 2013Cash flows from operating activities
Cash (used in) / generated from operating activities 30 (47,852,298) 39,365,689 148,046,352 34,439,955
Interest paid (62,038,120) (43,917,798) (15,287,390) (30,788,645)
Retirement benefit obligations paid 20 (5,326,028) (3,740,770) (5,282,153) (3,607,820)
Income tax paid (33,158,913) (350,693,831) Nil (1,862,675)
Net cash (used in) / generated from operating activities (148,375,359) (358,986,710) 127,476,809 (1,819,185)
Cash flows from investing activities
Purchase of property, plant and equipment 6 (95,167,751) (445,150,326) Nil (20,714,474)
Proceeds from sale of
property, plant and equipment 2,845,206 17,454,455 Nil Nil
Purchase of intangible assets 9 (2,279,806) (2,505,339) Nil Nil
(Purchase) / disposals of investments Nil Nil 25,687,460 (224,287,475)
Dividends received 22 64,616,072 22,140,234 47,766,351 67,542,696
Net cash (used in) / generated from investing activities (29,986,279) (408,060,976) 73,453,811 (177,459,253)
Cash flows from financing activities
Proceeds from borrowings 453,226,693 94,126,264 Nil 94,126,264
Proceeds from a rights issue 16 2,568,007 197,038,660 Nil 197,038,660
Repayment of loans (44,913,416) (85,138,110) (44,913,416) (85,138,110)
Dividends paid (66,600,056) (36,497,286) (45,600,000) (36,497,286)
Finance lease principal payment (738,000) (738,000) (738,000) (738,000)Net cash generated from / (used in)financing activities 343,543,228 168,791,528 (91,251,416) 168,791,528
Increase / (decrease) in cashand cash equivalents 165,181,589 (598,256,159) 109,679,204 (10,486,910)
Movement in cash and cash equivalents
At 1 April 287,611,684 885,867,843 (115,826,678) (105,339,768)
Increase / (decrease) 165,181,589 (598,256,159) 109,679,204 (10,486,910)
At 31 March 15 452,793,273 287,611,684 (6,147,474) (115,826,678)
(all amounts in Sri Lanka Rupees unless otherwise stated)
The accounting policies and notes as set out in pages 25 to 83 form an integral part of these financial statements.
A N N U A L R E P O R T 2 0 1 3 / 2 0 1 4
C M H O L D I N G S P L C A N D I T S S U B S I D I A R I E S 25NOTES TO THE CONSOLIDATED FINANCIAL STATEMENTS
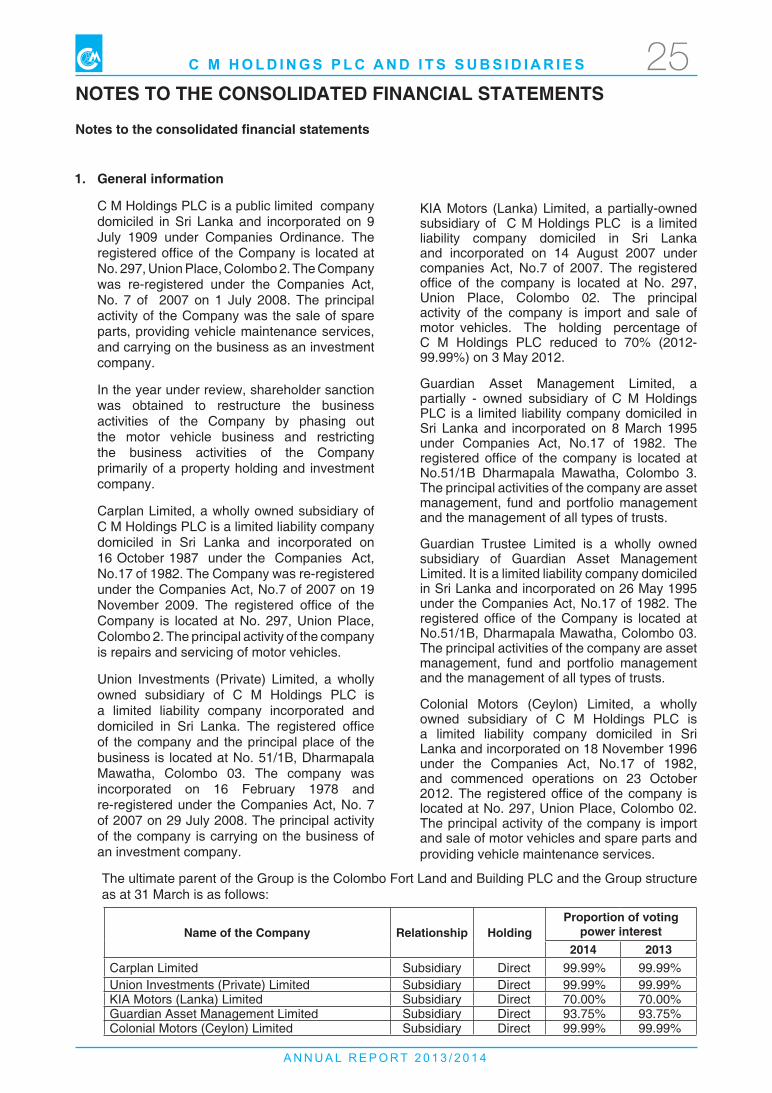
1. General information
C M Holdings PLC is a public limited company domiciled in Sri Lanka and incorporated on 9 July 1909 under Companies Ordinance. The registered office of the Company is located at No. 297, Union Place, Colombo 2. The Company was re-registered under the Companies Act, No. 7 of 2007 on 1 July 2008. The principal activity of the Company was the sale of spare parts, providing vehicle maintenance services, and carrying on the business as an investment company.
In the year under review, shareholder sanction was obtained to restructure the business activities of the Company by phasing out the motor vehicle business and restricting the business activities of the Company primarily of a property holding and investment company.
Carplan Limited, a wholly owned subsidiary of C M Holdings PLC is a limited liability company domiciled in Sri Lanka and incorporated on 16 October 1987 under the Companies Act, No.17 of 1982. The Company was re-registered under the Companies Act, No.7 of 2007 on 19 November 2009. The registered office of the Company is located at No. 297, Union Place, Colombo 2. The principal activity of the company is repairs and servicing of motor vehicles.
Union Investments (Private) Limited, a wholly owned subsidiary of C M Holdings PLC is a limited liability company incorporated and domiciled in Sri Lanka. The registered office of the company and the principal place of the business is located at No. 51/1B, Dharmapala Mawatha, Colombo 03. The company was incorporated on 16 February 1978 and re-registered under the Companies Act, No. 7 of 2007 on 29 July 2008. The principal activity of the company is carrying on the business of an investment company.
KIA Motors (Lanka) Limited, a partially-owned subsidiary of C M Holdings PLC is a limited liability company domiciled in Sri Lanka and incorporated on 14 August 2007 under companies Act, No.7 of 2007. The registered office of the company is located at No. 297, Union Place, Colombo 02. The principal activity of the company is import and sale of motor vehicles. The holding percentage of C M Holdings PLC reduced to 70% (2012- 99.99%) on 3 May 2012.
Guardian Asset Management Limited, a partially - owned subsidiary of C M Holdings PLC is a limited liability company domiciled in Sri Lanka and incorporated on 8 March 1995 under Companies Act, No.17 of 1982. The registered office of the company is located at No.51/1B Dharmapala Mawatha, Colombo 3. The principal activities of the company are asset management, fund and portfolio management and the management of all types of trusts.
Guardian Trustee Limited is a wholly owned subsidiary of Guardian Asset Management Limited. It is a limited liability company domiciled in Sri Lanka and incorporated on 26 May 1995 under the Companies Act, No.17 of 1982. The registered office of the Company is located at No.51/1B, Dharmapala Mawatha, Colombo 03. The principal activities of the company are asset management, fund and portfolio management and the management of all types of trusts.
Colonial Motors (Ceylon) Limited, a wholly owned subsidiary of C M Holdings PLC is a limited liability company domiciled in Sri Lanka and incorporated on 18 November 1996 under the Companies Act, No.17 of 1982, and commenced operations on 23 October 2012. The registered office of the company is located at No. 297, Union Place, Colombo 02. The principal activity of the company is import and sale of motor vehicles and spare parts and providing vehicle maintenance services.
Notes to the consolidated financial statements
Name of the Company Relationship HoldingProportion of voting
power interest2014 2013
Carplan Limited Subsidiary Direct 99.99% 99.99%Union Investments (Private) Limited Subsidiary Direct 99.99% 99.99%KIA Motors (Lanka) Limited Subsidiary Direct 70.00% 70.00%Guardian Asset Management Limited Subsidiary Direct 93.75% 93.75%Colonial Motors (Ceylon) Limited Subsidiary Direct 99.99% 99.99%
The ultimate parent of the Group is the Colombo Fort Land and Building PLC and the Group structure as at 31 March is as follows:
A N N U A L R E P O R T 2 0 1 3 / 2 0 1 4
C M H O L D I N G S P L C A N D I T S S U B S I D I A R I E S26
2. Summary of significant accounting policies
The financial statements are prepared in accordance with and comply with Sri Lanka Financial Reporting Standards issued by the Institute of Chartered Accountants of Sri Lanka. Sri Lanka Accounting Standards (SLASs) were revised to incorporate International Financial Reporting Standards (IFRSs) as issued by the International Accounting Standards Board, (IASB) which requires all entities to apply these standards effective for years beginning on or after 1 January 2012. The financial statements of the Group and Company have been prepared in accordance with Sri Lanka Accounting Standards, which comprise Sri Lanka Financial Reporting Standards (SLFRSs), Sri Lanka Accounting Standards (LKASs), relevant interpretations of the Standard Interpretations Committee (SIC) and International Financial Reporting Interpretations Committee (IFRIC) which are collectively referred to as SLFRSs. The Group and Company have consistently applied the accounting policies in the preparation of its financial statements throughout all periods presented, as if these policies had always been in effect.
These financial statements have been prepared under the historical cost convention except for financial assets and liabilities which are measured at fair value.
The preparation of financial statements in conformity with SLFRSs requires the use of certain critical accounting estimates. It requires management to exercise their judgment in the process of applying the Group and Company’s accounting policies. The areas where assumptions and estimates are significant to the Group’s and Company’s financial statements are disclosed in Note 4.
2.1 Changes in accounting policy and disclosures
New standards, amendments and interpretations issued but not effective for the financial year beginning after 1 January 2012 and not early adopted
SLFRS 10, Consolidated financial statements’ builds on existing principles by identifying the concept of control as the determining factor in whether an entity should be included within the consolidated financial statements of the parent company. The standard provides additional guidance to assist in the determination of control where this is difficult to assess. The Group and Company is yet to assess SLFRS 10’s full impact and intends to adopt SLFRS 10 no later than the accounting period beginning on 1 April 2014.
SLFRS 12, ‘Disclosures of interests in other entities’ includes the disclosure requirements for all forms of interests in other entities, including joint arrangements, associates, special purpose vehicles and other off balance sheet vehicles. The Group and Company is yet to assess SLFRS 12’s full impact and intends to adopt SLFRS 12 no later than the accounting period beginning on 1 April 2014.
SLFRS 13, ‘Fair value measurement’, aims to improve consistency and reduce complexity by providing a precise definition of fair value and a single source of fair value measurement and disclosure requirements for use across SLFRSs. The requirements, which are largely aligned between SLFRSs and relevant GAAP, do not extend the use of fair value accounting but provide guidance on how it should be applied where its use is already required or permitted by other standards within SLFRSs or relevant GAAP. The Group and Company is yet to assess SLFRS 13’s full impact and intends to adopt SLFRS 13 no later than the accounting period beginning on 1 April 2014.
SLFRS 9, ‘Financial instruments’, addresses the classification, measurement and recognition of financial assets and financial liabilities and replaces the areas of LKAS 39 which relate to classification and measurement of financial instruments. SLFRS 9 requires financial assets to be classified in to two measurement categories at initial recognition which are financial assets measured as at fair value and financial assets measured at amortised cost. The classification depends on the
Notes to the consolidated financial statements (Contd)
A N N U A L R E P O R T 2 0 1 3 / 2 0 1 4
C M H O L D I N G S P L C A N D I T S S U B S I D I A R I E S 27
entity’s business model for managing its financial instruments and the contractual cash flow characteristics of the instrument. For financial liabilities, the standard retains majority of the LKAS 39 requirements. The main change being the fair value option taken as financial liabilities, the part of a fair value change due to an entity’s own credit risk is recorded in other comprehensive income in the statement of comprehensive income, unless this creates an accounting mismatch. The Group and Company is yet to assess SLFRS 9’s full impact and intends to adopt SLFRS 9 no later than the accounting period beginning on 1st April 2015.
2.2 Consolidation
Subsidiaries
Subsidiaries are all entities (including special purpose entities) over which the Group has the power to govern the financial and operating policies generally accompanying a shareholding of more than one half of the voting rights. The existence and effect of potential voting rights that are currently exercisable or convertible are considered when assessing whether the Group controls another entity. Subsidiaries are fully consolidated from the date on which control is transferred to the Group. They are de-consolidated from the date that control ceases. The Group also assesses existence of control where it does not have more than 50% of the voting power but is able to govern the financial and operating policies by virtue of de-facto control. De-facto control may arise in circumstances where the size of the Group’s voting rights relative to the size and dispersion of holdings of other shareholders give the Group the power to govern the financial and operating policies, etc.
The Group applies the acquisition method to account for business combinations. The consideration transferred for the acquisition of a subsidiary is the fair values of the assets transferred, the liabilities incurred to the former owners of the acquiree and the equity interests issued by the Group. The consideration transferred includes the fair value of any asset or liability resulting from
a contingent consideration arrangement. Identifiable assets acquired and liabilities and contingent liabilities assumed in a business combination are measured initially at their fair values at the acquisition date.
Acquisition-related costs are expensed as incurred.
When initial accounting for a business combination is incomplete by the end of the reporting period in which the combination occurs, the Group reports in the financial statements provisional amounts for the items for which the accounting is incomplete. During the measurement period, the Group retrospectively adjusts the provisional amounts recognised at the acquisition date to reflect new information obtained about facts and circumstances that existed as of the acquisition date and, if known, would have affected the measurement of the amounts recognised as of that date. During the measurement period, the Group also recognises additional assets or liabilities if new information is obtained about facts and circumstances that existed as of the acquisition date and, if known, would have resulted in the recognition of those assets and liabilities as of that date. The measurement period ends as soon as the Group receives the information it was seeking about facts and circumstances that existed as of the acquisition date or learns that more information is not obtainable. The measurement period shall not exceed one year from the acquisition date.
If the business combination is achieved in stages, the acquisition date fair value of the acquirer’s previously held equity interest in the acquiree is remeasured to fair value at the acquisition date through the statement of comprehensive income.
Any contingent consideration to be transferred by the Group is recognised at fair value at the acquisition date. Subsequent changes to the fair value of the contingent consideration that is deemed to be an asset or a liability is recognised in accordance with LKAS 39, in the statement of comprehensive income. Contingent consideration that is classified as equity is not remeasured, and its subsequent
Notes to the consolidated financial statements
A N N U A L R E P O R T 2 0 1 3 / 2 0 1 4
C M H O L D I N G S P L C A N D I T S S U B S I D I A R I E S28
settlement is accounted for within equity.
Goodwill is initially measured as the excess of the aggregate of the consideration transferred and the fair value of non-controlling interest over the net identifiable assets acquired and liabilities assumed. If this consideration is lower than the fair value of the net assets of the subsidiary acquired in the case of a bargain purchase, the difference is recognised directly in the statement of comprehensive income.
Investments in subsidiaries are accounted for at cost less impairment. Cost is adjusted to reflect changes in consideration arising from contingent consideration amendments. Cost also includes directly attributable costs of investment.
Inter-company transactions, balances, income and expenses on transactions between Group companies are eliminated. Profits and losses resulting from inter-company transactions that are recognised in assets are also eliminated. Accounting policies of subsidiaries have been changed where necessary to ensure consistency with the policies adopted by the Group. The financial periods of the subsidiary undertakings are same as that of the Company.
When the Group ceases to have control any retained interest in the entity is re-measured to its fair value at the date when control is lost, with the change in carrying amount recognised in profit or loss in the statement of comprehensive income. The fair value is the initial carrying amount for the purposes of subsequently accounting for the retained interest as an associate, joint venture or financial asset. In addition, any amounts previously recognised as other comprehensive income in the statement of comprehensive income in respect of that entity are accounted for as if the Group had directly disposed of the related assets or liabilities. This may mean that amounts previously recognised in other comprehensive income are reclassified to profit or loss.
A listing of the Group’s principal subsidiaries is set out in note 1.
Change in ownership interest without change of control
KIA Motors (Lanka) Limited (“KIA”) made a right issue during the year where the Company’s investment was Rs.5,992,000. As a result, the holding percentage of C M Holdings PLC was maintained at 70% (2013-70%)
2.3 Foreign currencies
a) Functional and presentation currency
Items included in the financial statements of each of the Group’s entities are measured using the currency of the primary economic environment in which the entities operate (‘the functional currency’). The consolidated financial statements are presented in Sri Lankan Rupees, which is the Group’s and Company’s functional and presentation currency.
(b) Transactions and balances
Foreign currency transactions are translated into the functional currency using the exchange rates prevailing at the dates of the transactions or valuation where items are re-measured.
Foreign exchange gains and losses resulting from the settlement of such transactions and from the translation at year-end exchange rates of monetary assets and liabilities denominated in foreign currencies are recognised in the statement of comprehensive income.
Foreign exchange gains and losses that relate to borrowings and cash and cash equivalents are presented in the statement of comprehensive income within ‘Finance income or cost’.
2.4 Property, plant and equipment
Measurement
Property, plant and equipment are tangible items that are held for use in the production or supply of goods or services, for rental to others, or for administrative purposes and are expected to be used during more than one year.
Notes to the consolidated financial statements (Contd)
A N N U A L R E P O R T 2 0 1 3 / 2 0 1 4
C M H O L D I N G S P L C A N D I T S S U B S I D I A R I E S 29
All property, plant and equipment other than land and buildings are initially recorded at cost and stated at historical cost less depreciation. Historical cost includes expenditure that is directly attributable to the acquisition of the items and also includes the initial estimate of the costs of dismantling and removal of item as appropriate. The Group and Company elected the exemption to measure land and buildings recognised previously at revalued amounts as deemed cost with effect from 1 April 2011 in accordance with provisions of SLFRS 1 First time adoption of SLFRS (“SLFRS 1”). Accordingly, land and buildings are stated at cost less accumulated depreciation.
Subsequent costs are included in the asset’s carrying amount or recognised as a separate asset, as appropriate only when it is probable that future economic benefit associated with the item will flow to the Group and Company and the cost of the item can be measured reliably. The carrying amount of the replaced part is derecognised. All repairs and maintenance costs are charged to income statement during the financial period in which they are incurred.
Depreciation begins when an item of property, plant and equipment is available for use and will continue until it is derecognised, even if during that period the item is idle.
Each part of an item of property, plant and equipment with a cost that is significant in relation to the total cost of the item shall be depreciated separately.
Land is not depreciated. Depreciation on other assets is calculated using the straight-line method to allocate their cost to their residual values over their estimated useful lives of such assets, as follows:
%
Buildings 5
Plant, machineries and
other equipment 25
Motor vehicles 25
The assets’ residual values and useful lives are reviewed, and adjusted if appropriate, at each balance sheet date.
An asset’s carrying amount is written down immediately to its recoverable amount if the asset’s carrying amount is greater than its estimated recoverable amount.
Gains and losses on disposals are determined by comparing the proceeds with the carrying amount and are recognised in the Statement of Comprehensive Income.
Asset exchange transaction
Property plant and equipment may be acquired in exchange for a non-monetary asset or for a combination of monetary and non-monetary assets and is measured at fair value unless;
- the exchange transaction lacks commercial substance; or
- the fair value of neither the assets received nor the assets given up can be measured reliably.
The acquired item is measured in this way even if the Group and Company cannot immediately derecognise the assets given up. If the acquired item cannot be reliably measured at fair value, its cost is measured at the carrying amount of the asset given up.
Repairs and maintenance
Repairs and maintenance are charged to the profit or loss in the statement of comprehensive income during the period in which they are incurred. The cost of major renovations is included in the carrying amount of the asset when it is probable that future economic benefits in excess of the originally assessed standard of performance of the existing asset will flow to the Group and Company. This cost is depreciated over the remaining useful life of the related asset.
2.5 Investment property
Property that is held for long-term rental yields or for capital appreciation or both, is classified as investment property. Investment property also includes property that is being constructed or developed for future use as investment property. Land
Notes to the consolidated financial statements
A N N U A L R E P O R T 2 0 1 3 / 2 0 1 4
C M H O L D I N G S P L C A N D I T S S U B S I D I A R I E S30
held under operating leases is classified and accounted for by the Group and Company as investment property when the definition of investment property would otherwise be met. The operating lease is accounted for as if it were a finance lease.
Investment property is measured initially at its cost, including related transaction costs and (where applicable) borrowing costs After initial recognition, investment property is accounted for under the cost model. Subsequent expenditure is capitalised to the asset’s carrying amount only when it is probable that future economic benefits associated with the expenditure will flow to the Group and Company the cost of the item can be measured reliably. All other repairs and maintenance costs are expensed when incurred. When part of an investment property is replaced, the carrying amount of the replaced part is derecognised.
If an investment property becomes owner-occupied, it is reclassified as property, plant and equipment.
2.6 Impairment of non-financial assets
Assets are reviewed for impairment whenever events or changes in circumstances indicate that the carrying amount may not be recoverable. An impairment loss is recognised for the amount by which the asset’s carrying amount exceeds its recoverable amount. The recoverable amount is the higher of an asset’s fair value less costs to sell and value in use. For the purposes of assessing impairment, assets are grouped at the lowest levels for which there are separately identifiable cash flows (cash-generating units). Non-financial assets other than goodwill that suffered an impairment are reviewed for possible reversal of the impairment at each reporting date.
2.7 Intangible assets
(a) Goodwill
Goodwill arises on the acquisition of subsidiaries, associates and joint ventures and represents the excess of
the consideration transferred over the Company’s interest in net fair value of the net identifiable assets, liabilities and contingent liabilities of the acquiree and the fair value of the non-controlling interest in the acquiree, at the date of acquisition. Goodwill on acquisition of subsidiaries is included in intangible assets.
Goodwill impairment reviews are undertaken annually or more frequently if events or changes in circumstances indicate a potential impairment. The carrying value of goodwill is compared to the recoverable amount, which is the higher of value in use and the fair value less costs to sell. Any impairment is recognised immediately as an expense and is not subsequently reversed. Goodwill is allocated to cash-generating units (‘CGU’) for the purpose of impairment testing. Each CGU or a group of CGUs represents the lowest level within the Group at which goodwill is monitored for internal management purposes and which are expected to benefit from the synergies of the combination.
(b) Licenses
Acquired computer software licenses are capitalised on the basis of the costs incurred to acquire and bring to use the specific software. These costs are amortised over their estimated useful lives which does not exceed five years.
(c) Computer software
Costs associated with maintaining computer software programmes are recognised as an expense as incurred. Development costs that are directly attributable to the design and testing of identifiable and unique software products controlled by the Group and Company are recognised as intangible assets when the following criteria are met:
it is technically feasible to complete the software product so that it will be available for use;
management intends to complete the software product and use or sell it;
Notes to the consolidated financial statements (Contd)
A N N U A L R E P O R T 2 0 1 3 / 2 0 1 4
C M H O L D I N G S P L C A N D I T S S U B S I D I A R I E S 31
there is an ability to use or sell the software product;
it can be demonstrated how the software product will generate probable future economic benefits;
adequate technical, financial and other resources to complete the development and to use or sell the software product are available; and
the expenditure attributable to the software product during its development can be reliably measured.
Directly attributable costs that are capitalised as part of the software product include the software development employee costs and an appropriate portion of relevant overheads.
Other development expenditures that do not meet these criteria are recognised as an expense as incurred. Development costs previously recognised as an expense are not recognised as an asset in a subsequent period.
Computer software development costs recognised as assets are amortised over their estimated useful lives, which does not exceed three years.
2.8 Financial assets
2.8.1. Classification
The Group and Company classify its financial assets in the following categories: at fair value through profit or loss (‘FVTPL’), loans and receivables, available-for-sale (‘AFS’) and held-to-maturity (‘HTM’). The classification depends on the purpose for which the financial assets were acquired. Management determines the classification of its financial assets at initial recognition.
(i) Financial assets at FVTPL
Financial assets at fair value through profit or loss are financial assets held for trading. A financial asset is classified in this category if acquired principally for the purpose of selling in the short term. Derivatives are also categorised as held for trading unless
they are designated as hedges. Assets in this category are classified as current assets if expected to be settled within 12 months; otherwise, they are classified as non-current.
(ii) Loans and receivables
Loans and receivables are non-derivative financial assets with fixed or determinable payments that are not quoted in an active market. They are included in current assets, except for maturities greater than twelve (12) months after the end of the reporting period. These are classified as non-current assets.
(iii) AFS financial assets
AFS financial assets are non-derivatives that are either designated in this category or not classified in any of the other categories. They are included in non-current assets unless the investment matures or management intends to dispose of it within twelve (12) months from the end of the reporting period.
(iv) HTM financial assets
HTM financial assets are non-derivative financial assets with fixed or determinable payments and fixed maturities that the Group’s and Company’s management have the positive intention and ability to hold to maturity. If the Group and Company were to sell other than an insignificant amount of HTM financial assets, the whole category would be tainted and reclassified as AFS. HTM financial assets are included in non-current assets, except for those with maturities less than twelve (12) months from the end of the reporting period, which are classified as current assets.
2.8.2. Recognition and initial measurement
Regular purchases and sales of financial assets are recognised on the trade-date, the date on which the Group and Company commit to purchase or sell the asset.
Financial assets are initially recognised at fair value plus transaction costs for all financial assets not carried at FVTPL.
Notes to the consolidated financial statements (Contd)
A N N U A L R E P O R T 2 0 1 3 / 2 0 1 4
C M H O L D I N G S P L C A N D I T S S U B S I D I A R I E S32
Financial assets carried at FVTPL are initially recognised at fair value and transaction costs are expensed in the statement of comprehensive income.
2.8.3. Subsequent measurement - gains and losses
AFS financial assets and financial assets at FVTPL are subsequently carried at fair value. Loans and receivables and HTM financial assets are subsequently carried at amortised cost using the effective interest method.
Changes in the fair values of financial assets at FVTPL, including the effects of currency translation are recognised in the statement of comprehensive income in the period in which the changes arise. Changes in the fair value of AFS financial assets, including effects of currency translation are recognized through other comprehensive income.
2.8.4. Subsequent measurement - impairment of financial assets
(i) Assets carried at amortised cost
The Group and Company assess at the end of each reporting period whether there is objective evidence that a financial asset or group of financial assets is impaired. A financial asset or a group of financial assets is impaired and impairment losses are incurred only if there is objective evidence of impairment as a result of one or more events that occurred after the initial recognition of the asset (a ‘loss event’) and that loss event (or events) has an impact on the estimated future cash flows of the financial asset or group of financial assets that can be reliably estimated.
Evidence of impairment may include indications that the debtors or a group of debtors is experiencing significant financial difficulty, default or delinquency in interest or principal payments, the probability that they will enter bankruptcy or other financial reorganisation, and where observable data indicate that there is a measurable decrease in the estimated future cash flows, such as changes in arrears or economic conditions that correlate with defaults.
For loans and receivables category, the amount of the loss is measured as the difference between the asset’s carrying amount and the present value of estimated future cash flows (excluding future credit losses that have not been incurred) discounted at the financial asset’s original effective interest rate. The carrying amount of the asset is reduced and the amount of the loss is recognised in the statement of comprehensive income. If a loan or held-to-maturity investment has a variable interest rate, the discount rate for measuring any impairment loss is the current effective interest rate determined under the contract. As a practical expedient, the Group and Company may measure impairment on the basis of an instrument’s fair value using an observable market price.
If, in a subsequent period, the amount of the impairment loss decreases and the decrease can be related objectively to an event occurring after the impairment was recognised, the reversal of the previously recognised impairment loss is recognised in the statement of comprehensive income.
(ii) Assets classified as AFS
The Group and Company assess at the end of each reporting period whether there is objective evidence that a financial asset or a group of financial assets is impaired.
For debt securities, the Group and Company use criteria and measurement of impairment loss applicable for ‘assets carried at amortised cost’ above. If, in a subsequent period, the fair value of a debt instrument classified as AFS increases and the increase can be objectively related to an event occurring after the impairment loss was recognised in the statement of comprehensive income, the impairment loss is reversed through the statement of comprehensive income.
In the case of equity securities classified as AFS, in addition to the criteria for ‘assets carried at amortised cost’ above, a significant or prolonged decline in the fair value of the security below its cost is also considered as an indicator that the assets
Notes to the consolidated financial statements (Contd)
A N N U A L R E P O R T 2 0 1 3 / 2 0 1 4
C M H O L D I N G S P L C A N D I T S S U B S I D I A R I E S 33
are impaired. If any such evidence exists for AFS financial assets, the cumulative loss that had been recognised directly in equity is removed from equity and recognised in the statement of comprehensive income. The amount of cumulative loss that is reclassified to the statement of comprehensive income is the difference between the acquisition cost and the current fair value, less any impairment loss on that financial asset previously recognised in the statement of comprehensive income. Impairment losses recognised in the statement of comprehensive income on equity instruments classified as AFS are not reversed through the statement of comprehensive income.
2.8.5. Derecognition
Financial assets are de-recognised when the rights to receive cash flows from the investments have expired or have been transferred and the Group and Company have transferred substantially all risks and rewards of ownership.
2.8.6. Off - setting financial instruments
Financial assets and liabilities are offset and the net amount presented in the statement of financial position when there is a legally enforceable right to offset the recognised amounts and there is an intention to settle on a net basis, or realise the asset and settle the liability simultaneously.
2.9 Financial liabilities
The Group’s and Company’s financial liabilities include trade and other payables, bank loans and other borrowings, and obligations under finance leases. All other financial liabilities except for financial liabilities at FVTPL are recognised initially at their fair values and subsequently measured at amortised cost, using the effective interest method, unless the effect of discounting would be insignificant, in which case they are stated at cost.
2.9.1. Financial guarantee contracts
A financial guarantee contract is a contract that requires the issuer of the contract to make specified payments to reimburse the holder of the contract for a loss the holder
incurs because a specified debtor fails to make payment when due in accordance with the terms of a debt instrument. Financial guarantee contract is initially recognised as deferred income within trade and other payable at fair value (being the transaction price, unless the fair value can otherwise be reliably measured). Subsequently, it is measured at the higher of the amount initially recognised, less accumulated amortisation, and the amount of the provision, if any, that is required to settle the commitment at the end of the reporting period.
2.10. Leases
2.10.1 Accounting for leases where the Group and Company are the lessee
(i) Finance leases
Leases of property, plant and equipment where the Group and Company assumes substantially all the benefits and risks of ownership are classified as finance leases. Finance leases are capitalised at the inception of the lease at the lower of the fair value of the leased asset and the present value of the minimum lease payments. Each lease payment is allocated between the liability and finance charges so as to achieve a constant periodic rate of interest on the balance outstanding. The corresponding rental obligations, net of finance charges, are included in payables. The interest element of the finance lease is charged to the statement of comprehensive income as finance cost over the lease period so as to produce a constant periodic rate of interest on the remaining balance of the liability for each period.
Property, plant and equipment acquired under finance leases are depreciated over the estimated useful life of the asset in accordance with the annual rates stated in note 2.4 to the financial statements as mentioned above. Where there is no reasonable certainty that the ownership will be transferred to the Group and Company, the asset is depreciated over the shorter of the lease term or its estimated useful life.
Notes to the consolidated financial statements (Contd)
A N N U A L R E P O R T 2 0 1 3 / 2 0 1 4
C M H O L D I N G S P L C A N D I T S S U B S I D I A R I E S34
(ii) Operating leases
Leases of assets where a significant portion of the risks and rewards of ownership are retained by the lessor are classified as operating leases. Payments made under operating leases are charged as an expense to the statement of comprehensive income on a straight-line basis over the period of the lease.
2.11 Inventories
Inventories are stated at the lower of cost and net realisable value. In general, cost is determined on a weighted average basis and includes transport and handling charges. In the case of jobs-in-progress, cost includes contractor’s fees, material and labour. Net realisable value is the price at which the stocks can be sold in the normal course of business after allowing for all costs of realisation and, where appropriate, the cost of conversion from their existing state to a finished condition.
2.12 Trade receivables
Trade receivables are amounts due from customers for merchandise sold or services performed in the ordinary course of business. If collection is expected in one year or less (or in the normal operating cycle of the business if longer), they are classified as current assets. If not, they are presented as non-current assets. Trade receivables are recognised initially at fair value and subsequently measured at amortised cost using the effective interest method, less accumulated impairment losses.
2.13 Cash and cash equivalents
For the purpose of the statement of cash flows, cash and cash equivalents includes cash in hand, deposits held at call with banks, other short-term highly liquid investments.
2.14 Stated capital
Classification
Ordinary shares with discretionary dividends are classified as equity. Other shares are classified as equity or liability according to the economic substance of
the particular instrument. Distribution to holders of a financial instrument classified as an equity instrument is charged directly to equity.
Share issue Expenses
Incremental costs directly attributable to the issuance of new shares or options are shown in equity as a deduction, net of tax from the proceeds.
Dividend distribution
Dividend distribution to the Group’s and Company’s shareholders is recognised as a liability in the Group’s and Company’s financial statements in the period in which the dividends are approved by the Company’s shareholders.
2.15 Borrowings
Borrowings are recognised initially at fair value, net of transaction costs incurred. In subsequent periods, borrowings are stated at amortised cost using the effective interest method; any difference between proceeds (net of transaction costs) and the redemption value is recognised in the statement of comprehensive income over the period of the borrowings.
Interest, dividends, losses and gains relating to a financial instrument, or a component part, classified as a liability is reported within finance cost in the statement of comprehensive income.
Borrowings are classified as current liabilities unless the Group and Company have an unconditional right to defer settlement of the liability for at least twelve (12) months after the date of statement of financial position.
Identifiable interest costs on borrowing to finance the construction of property, plant and equipment are capitalised during the period of time that is required to complete and prepare the asset for its intended use.
2.16 Current and deferred tax
The tax expense for the period comprises current and deferred tax. Tax is recognised in the statement of comprehensive income,
Notes to the consolidated financial statements (Contd)
A N N U A L R E P O R T 2 0 1 3 / 2 0 1 4
C M H O L D I N G S P L C A N D I T S S U B S I D I A R I E S 35
except to the extent that it relates to items recognised directly in equity. In this case, the tax is recognised in equity. Management periodically evaluates positions taken in tax returns with respect to situations in which applicable tax regulations is subject to interpretation. Management establishes provisions where appropriate on the basis of amounts expected to be paid to the tax authorities.
Deferred tax is recognised using the liability method, on temporary differences arising between the tax bases of assets and liabilities and their carrying amounts in the financial statements. However, deferred tax liabilities are not accounted for if it arises from initial recognition of an asset or liability in a transaction other than a business combination that at the time of the transaction affects neither accounting nor taxable profit or loss. Deferred tax is determined using tax rates (and laws) that have been enacted or substantially enacted by the date of the statement of financial position and are expected to apply when the related deferred tax asset is realised or the deferred tax liability is settled.
Deferred tax assets are recognised to the extent that it is probable that future taxable profit will be available against which the temporary differences can be utilised.
Deferred tax is provided on temporary differences arising on investments in subsidiaries except where the timing of the reversal of the temporary difference is controlled by the Group and Company and it is probable that the temporary difference will not reverse in the foreseeable future.
2.17 Employee benefits
Defined benefit - gratuity
Defined benefit plan defines an amount of benefit that an employee will receive on retirement, usually dependent on one or more factors such as years of service and compensation. The defined benefit plan comprises the gratuity provided under the Act, No.12 of 1983.
The liability recognised in the statement of financial position in respect of defined benefit plan is the present value of the defined benefit obligation at the date of the statement of financial position. The defined benefit obligation is calculated annually by independent actuaries using the projected unit credit method. The present value of the defined benefit obligation is determined by discounting the estimated future cash outflows using appropriate interest rates by the actuarial valuer.
Past-service costs are recognised immediately in statement of comprehensive income.
Re-measurement arising from experience adjustments and changes in actuarial assumptions are recognised immediately in the statement of other comprehensive income.
The assumptions based on which the results of the actuarial valuation was determined, are included in note 20 to the financial statements.
Defined contribution
All executive and clerical staff of the Company are members of the Company’s private provident fund and all other employees of the Group are members of the Employees’ Provident Fund. All employees are members of the Employees’ Trust Fund. The Company contributes 15 % to the Provident Fund (subsidiary companies 12 %) and 3% to the Trust Fund, of such employees’ basic wage or salary.
Short - term employee benefits
Wages, salaries, paid annual leave and sick leave, bonuses and non-monetary benefits are accrued in the period in which the associated services are rendered by employees of the Group and Company.
Termination benefits
Termination benefits are payable whenever an employee’s service is terminated before the normal retirement date or whenever an
Notes to the consolidated financial statements (Contd)
A N N U A L R E P O R T 2 0 1 3 / 2 0 1 4
C M H O L D I N G S P L C A N D I T S S U B S I D I A R I E S36
employee accepts voluntary redundancy in exchange for these benefits. The Group and Company recognise termination benefits when it is demonstrably committed to either terminate the employment of current employees according to a detailed formal plan without possibility of withdrawal or to provide termination benefits as a result of an offer made to encourage voluntary redundancy.
2.18 Provisions
Provisions are recognised when the Group and Company have a present legal or constructive obligation as a result of past events when it is more probable that an outflow of resources will be required to settle the obligation and when a reliable estimate of the amount can be made. Provisions are not recognised for future operating losses.
Where there are number of similar obligations, the likelihood that an outflow will be required in settlement is determined by considering the class of obligations as a whole. A provision is recognised even if the likelihood of an outflow with respect to any one item included in the same class of obligations may be small.
The Group and Company do not recognise a contingent liability but disclose its existence in the financial statements. A contingent liability is a possible obligation that arises from past events whose existence will be confirmed by uncertain future events beyond the control of the Group and Company or a present obligation that is not recognised because it is not probable that an outflow of resources will be required to settle the obligation. A contingent liability also arises in the extremely rare circumstance where there is a liability that cannot be recognised because it cannot be measured reliably. A contingent asset is a possible asset that arises from past events whose existence will be confirmed by uncertain future events beyond the control of the Group and Company. The Group and Company do not recognise a contingent asset but discloses its existence where inflows of economic benefits are probable, but not virtually certain.
In the acquisition of subsidiaries by the Group under a business combination, the contingent liabilities assumed are measured initially at their fair values at the acquisition date, irrespective of the extent of any minority interest.
The Group and Company recognises separately the contingent liabilities of the acquiree’s as part of allocating the cost of a business combination where their fair values can be measured reliably. Where the fair values cannot be measured reliably, the resulting effect will be reflected in the goodwill arising from the acquisitions.
2.19 Revenue recognition
Revenue comprises the fair value of the consideration received or receivable for the sale of motor vehicle spare parts and motor vehicles, and repair and maintenance services rendered in the ordinary course of the Group’s and Company’s activities. Revenue is stated net of all applicable taxes and levies, returns, rebates and discounts. The Group revenue is subject to elimination of sales within the Group.
The Group and Company recognise revenue when the amount of revenue can be reliably measured, it is probable that future economic benefits will flow to the entity and when specific criteria have been met for each of the Group’s and Company’s activities as described below.
Sale of motor vehicles and motor vehicle spare parts
Revenue from the sale of motor vehicles and motor vehicle spare parts, is recognized in the Statement of Comprehensive Income when the significant risks and rewards of ownership have been transferred to the buyer. No revenue is recognized if there are any significant uncertainties regarding recovery of the consideration due, associated costs or the possible return of items sold.
Repair and maintenance
Revenue from motor vehicle repair and maintenance service contracts is
Notes to the consolidated financial statements (Contd)
A N N U A L R E P O R T 2 0 1 3 / 2 0 1 4
C M H O L D I N G S P L C A N D I T S S U B S I D I A R I E S 37
recognized in the income statement by reference to the stage of completion of the transaction at the end of the reporting period. Recognition of revenue is based on the percentage of completion of the contract, and is determined by the proportion costs incurred to date bear to estimated total cost of the transaction.
Interest income
Interest income is recognised using the effective interest method. When a loan granted or a receivable is impaired, the Group and Company reduces the carrying amount to its recoverable amount, being the estimated future cash flow discounted at the original effective interest rate of the instrument, and continues unwinding the discount as interest income. Interest income on impaired loan and receivables are recognised using the original effective interest rate.
Dividend income
Dividend income is recognised when the right to receive payment is established.
2.20 Dividend distribution
Dividend distribution to the Group’s and Company’s shareholders is recognized as a liability in the Group’s financial statements in the period in which the dividends are approved by the Company’s shareholders.
2.21 Comparatives
Where necessary, comparative figures have been adjusted to conform with changes in presentation in the current year.
3. Financial risk management
The principal financial instruments of the Group and Company comprise of bank loans, finance leases, short term deposits, investment in equity securities, unit trust and cash. The main purpose of these finance instruments is to raise and maintain liquidity for the Group’s and Company’s operations, and maximize returns on the Group’s and Company’s financial reserves. The Group and Company has various
other financial instruments such as trade receivables and trade payables which arise directly from its business activities.
Financial risk factors
The Group’s and Company’s activities are exposed to a variety of financial risks: market risk (including currency risk, fair value interest rate risk, cash flow interest rate risk, and price risk), credit risk and liquidity risk.
The Group’s and Company’s overall financial risk management programme focuses on the unpredictability of financial markets and seeks to minimise potential adverse effects on the financial performance of the Group and Company. Financial risk management is carried out through risk reviews, and adherence to the Group’s and Company’s financial risk management policies. The Board of Directors regularly reviews these risks and approves the risk management policies, which covers the management of these risks.
Market risk:
Market risk comprises of the following types of risks -
(i) Foreign currency exchange risk – risk that the value of a financial instrument will fluctuate due to changes in foreign exchange rates.
(ii) Fair value interest rate risk – risk that the value of a financial instrument will fluctuate due to changes in market interest rates.
(iii) Cash flow interest rate risk – risk that future cash flows associated with a financial instrument will fluctuate. In the case of a floating rate debt instrument, such fluctuations result in a change in the effective interest rate of the financial instrument, usually without a corresponding change in its fair value.
(iv) Price risk – risk that the value of a financial instrument will fluctuate as a result of changes in market prices, whether those changes are caused by factors specific to the individual instrument or its issuer or factors affecting all instruments traded in the market. The group has no commodity price risk.
Notes to the consolidated financial statements (Contd)
A N N U A L R E P O R T 2 0 1 3 / 2 0 1 4
C M H O L D I N G S P L C A N D I T S S U B S I D I A R I E S38
Credit risk :
Risk that one party to a financial instrument will fail to discharge an obligation and cause the other party to incur a financial loss.
Liquidity risk (funding risk) :
Risk that an entity will encounter difficulty in raising funds to meet commitments associated with financial instruments.
3.1 Foreign Currency Exchange Risk
The Group and Company is principally exposed to foreign exchange risk arising with respect to the Great Britain Pound, United States Dollar, Japanese Yen and Indian Rupee, due to its import activities of motor vehicles and motor vehicle spare parts for local sale and / or repair and maintenance services. Foreign exchange risk arises when future commercial transactions or recognised assets or liabilities are denominated in a currency that is not the entity’s functional currency.
As at 31 March 2014, if LKR has weakened by 1%, all other variables held constant the resultant net foreign exchange losses are as follows -
Group CompanyGreat Britain Pounds 247,910 Nil
United States Dollar 26,109 Nil
Indian Rupee Nil Nil
Japanese Yen 4,803,703 Nil
3.2 Credit risk
Credit risk is managed on Group and Company basis. Credit risk arises from cash and cash equivalents, derivative financial instruments, and deposits with banks, as well as credit exposures to customers, including outstanding receivables (net of deposits held). The utilisation of credit limits is regularly monitored.
3.3 Liquidity Risk
Prudent liquidity risk management implies maintaining sufficient liquid funds to meet its financial obligations.
In the management of liquidity risk, the Group and Company monitor and maintain a level of cash and cash equivalents deemed adequate by the management to finance the Company’s and the Group’s operations and to mitigate the effects of fluctuations in cash flows. Due to the nature of the underlying business, the Group and Company aim at maintaining flexibility in funding by credit lines available.
The table below analyses the Group’s and the Company’s non-derivative financial liabilities into relevant maturity groupings based on the remaining period at the statement of financial position date to the contractual maturity date.
Notes to the consolidated financial statements (Contd) (all amounts in Sri Lanka Rupees unless otherwise stated)
A N N U A L R E P O R T 2 0 1 3 / 2 0 1 4
C M H O L D I N G S P L C A N D I T S S U B S I D I A R I E S 39
Group
As at 31 March 2014 Less than3 months
Between3 months and 1 year
Between year 1 and
year 2
Between year 2 and
year 5
Over 5
yearsBorrowings 295,315,254 375,196,010 411,937 Nil Nil
Trade and other payables 198,733,158 18,178,205 191,622 187,855 117,988
(excluding non-financial liabilities)
As at 31 March 2013
Borrowings 6,674,100 281,504,591 5,443,854 20,203,613 Nil Trade and other payables 13,514,043 88,694,542 11,722,857 Nil Nil
(excluding non-financial liabilities)
Company
As at 31 March 2014 Less than3 months
Between3 months and 1 year
Between year 1 and
year 2
Between year 2 and
year 5
Over 5 years
Borrowings 8,352,523 635,930 411,937 Nil Nil Trade and other payables Nil 95,967,140 Nil Nil Nil (excluding non-financial liabilities)
As at 31 March 2013
Borrowings 6,674,100 143,969,398 3,667,174 13,096,744 Nil Trade and other payables Nil 21,450,165 Nil Nil Nil
(excluding non-financial liabilities)
Notes to the consolidated financial statements (Contd)
3.4 Capital risk management
The primary objective of the Group’s and the Company’s capital management is to ensure that it maintains a strong credit rating and healthy capital ratios in order to support its business and maximise shareholder value.
The Group and Company manage its capital structure and make adjustments to it in light of changes in economic conditions. To maintain or adjust the capital structure, the Group and Company may or may not make dividend payments to shareholders, return capital to shareholders or issue new shares or other instruments.
Consistent with others in the industry, the Group and Company monitor capital on the basis of the gearing ratio. This ratio is calculated as total borrowings by total equity. Total borrowings including non-current and current borrowings as shown in the statements of financial position. Total equity is calculated as ‘Total equity’ in the statements of financial position.
3.3 Liquidity Risk (Contd)
(all amounts in Sri Lanka Rupees unless otherwise stated)
A N N U A L R E P O R T 2 0 1 3 / 2 0 1 4
C M H O L D I N G S P L C A N D I T S S U B S I D I A R I E S40
Group31 March 2014 Level 1 Level 2 Level 3 Total
Assets
Financial Assets at FVTPLInvestment in unit trusts 7,061,999 Nil Nil 7,061,999 Investment in equity shares 596,313,215 Nil Nil 596,313,215 Warrants 457,243 Nil Nil 457,243
AFS assetsInvestment in equity shares 393,811,626 475,359,550 Nil 869,171,176
997,644,083 475,359,550 Nil 1,473,003,633
Group
31 March 2013 Level 1 Level 2 Level 3 Total
Assets
Financial Assets at FVTPLInvestment in unit trusts 7,100,909 Nil Nil 7,100,909 Investment in equity shares 688,237,075 Nil Nil 688,237,075 Warrants 5,167,995 Nil Nil 5,167,995
AFS assetsInvestment in equity shares 468,824,691 Nil Nil 468,824,691
1,169,330,670 Nil Nil 1,169,330,670
Group 2014 2013
Borrowings 670,923,250 313,826,158 Total equity 3,652,848,068 3,930,196,832 Gearing ratio 18.37% 7.98%
Company 2014 2013
Borrowings 9,400,390 167,407,416 Total equity 1,672,089,446 1,714,774,645 Gearing ratio 0.56% 9.76%
Notes to the consolidated financial statements (Contd)
3.5 Fair value estimation
The table below analyses financial instruments carried at fair value by valuation methods. The different levels have been defined as follows;
� Quoted prices (unadjusted) in active markets for identical assets or liabilities (level 1).
� Inputs other than quoted prices included within level 1 that are observable for the asset or liability, either directly (that is, as prices) or indirectly (that is, derived from prices) (level 2)
� Inputs for the asset or liability that are not based on observable market data (that is, unobservable inputs) (level 3).
The gearing ratio as at 31 March were as follows:
3.4 Capital risk management.(Contd)
(all amounts in Sri Lanka Rupees unless otherwise stated)
A N N U A L R E P O R T 2 0 1 3 / 2 0 1 4
C M H O L D I N G S P L C A N D I T S S U B S I D I A R I E S 41
Company31 March 2014 Level 1 Level 2 Level 3 Total
Assets
Financial Assets at FVTPLInvestment in unit trusts 6,120,606 Nil Nil 6,120,606 Investment in equity shares 46,002,698 Nil Nil 46,002,698
AFS assetsInvestment in equity shares 129,906,700 375,358,700 Nil 505,265,400
182,030,004 375,358,700 Nil 557,388,704
Company31 March 2013 Level 1 Level 2 Level 3 Total
Assets
Financial Assets at FVTPLInvestment in unit trusts 5,990,272 Nil Nil 5,990,272 Investment in equity shares 81,046,509 Nil Nil 81,046,509
AFS assetsInvestment in equity shares 158,541,591 Nil Nil 158,541,591
245,578,372 Nil Nil 245,578,372
4. Critical accounting estimates and judgements
Estimates and judgments are continually evaluated and are based on historical experience and other factors, including expectations of future events that are believed to be reasonable under the circumstances.
4.1 Critical accounting estimates and assumptions
The Group and Company make estimates and assumptions concerning the future. The resulting accounting estimates will, by definition, seldom equal the related actual results. The estimates and assumptions that have a significant risk of causing a material adjustment to the carrying amounts of assets and liabilities within the next financial year are addressed below.
Impairment assessment of goodwill
The Group tests goodwill for impairment annually in accordance with its accounting policy stated in note 2.7 and whenever events or change in circumstances indicate that this is necessary within the financial year. The cash generating unit, being the lowest level of assets for which there are separately identifiable cash flows, was assessed as the subsidiary for the purpose of such testing of impairment of goodwill.
The recoverable amount of the CGU is determined based on Value - In - Use (VIU) calculations.
The VIU calculations apply Discounted Cash Flow Model using cash flow projections based on the forecasts and projections approved by the management covering a five year period. Cash flows beyond the five year period are extrapolated using the estimated growth rate as stated below. The growth rate does not exceed the long-term average growth rate for the business in which the CGU operates.
In the Discounted Cash Flow (DCF) model, the free cash flows have been discounted by the pre-tax discount rate.
The subsidiary is engaged in the business of asset management, fund and portfolio management, and management of Trusts including unit trusts and investment trusts and to act as trustees thereof.
Notes to the consolidated financial statements (Contd)
3.5 Fair value estimation (Contd)
(all amounts in Sri Lanka Rupees unless otherwise stated)
A N N U A L R E P O R T 2 0 1 3 / 2 0 1 4
C M H O L D I N G S P L C A N D I T S S U B S I D I A R I E S42
These forecasts and projections reflect management expectations of revenue growth, operating costs and margins for the CGU based on past experience and future plans and strategies.
The following assumptions were applied in the value in use computation.
1 EBIDTA margin
Projected EBIDTA margin is determined based on expected growth potential of the business.
2 Free cash flow (FCF) growth rate FCF growth projections are based on expected growth in operational cashflows.
3 Pre-tax discount rate
Pre-tax discount rate of the Group is used as the discount rate for cash flow projections.
4 Terminal growth rate
Terminal growth reflects the management expectations on the growth potential of the business in Sri Lanka for the foreseeable future.
Given below are the projected variables used for the impairment test for 2014 and 2013:
2014 2013
EBITDA margin (1) 24.2% 33%
Free cash flow growth rate (2) 16% 16%
Pre-tax discount rate (3) 14% 15%
Terminal growth rate (4) 2% 2%
Based on the impairment test performed, the recoverable amounts exceed the carrying value, hence no provision for impairment of goodwill was recognised as of 31 March 2014.
Impact of possible changes in key assumptions
The Group’s review includes an impact assessment of change in key assumptions. Sensitivity analysis shows that no impairment loss is required for the carrying value of the goodwill, including where realistic variances are applied to key assumptions.
Fair value of financial instruments
Certain financial instruments are carried on the statement of financial position at fair value, with changes in fair value reflected in the statement of comprehensive income. Fair values are estimated by reference in part to published price quotations and in part by using discounted cashflow technique as the valuation technique. The fair value of financial instruments that are not traded in an active market is determined by using valuation techniques. The Group and Company use its judgment to select a variety of methods and make assumptions that are mainly based on market conditions existing at the end of each financial reporting period.
Defined benefit plan - gratuity
The present value of the defined benefit plan depends on a number of factors that are determined on an actuarial basis using a number of assumptions. The assumptions used in determining the net cost (income) for defined benefit plan include the discount rate, future salary increase rate, mortality rate, withdrawal and disability rates and retirement age. Any changes in these assumptions will impact the carrying amount of defined benefit plan. The Group and Company determine the appropriate discount
Notes to the consolidated financial statements (Contd)
4.1 Critical accounting estimates and assumptions (Contd)
Notes to the consolidated financial statements (Contd) (all amounts in Sri Lanka Rupees unless otherwise stated)
A N N U A L R E P O R T 2 0 1 3 / 2 0 1 4
C M H O L D I N G S P L C A N D I T S S U B S I D I A R I E S 43
4.1 Critical accounting estimates and assumptions
rate at the end of each year. This is the interest rate that should be used to determine the present value of estimated future cash outflows, expected to be required to settle the defined benefit plan. In determining the appropriate discount rate, the Group and Company consider the interest yield of long term government bonds that are denominated in the currency in which the benefits will be paid, and that have terms to maturity approximating the terms of the related defined benefit plan. Other key assumptions for defined benefit plan are based in part on current market conditions.
Provision for impairment of debtors
The Group and Company assesses at each balance sheet date whether there is objective evidence that trade receivables have been impaired. Provision for doubtful debts is calculated based on a review of the current status of existing receivables and historical collections experience. Such provisions are adjusted periodically to reflect the actual and anticipated impairment.
Contingent liabilities
Determination of the treatment of contingent liabilities in the financial statements is based on the management’s view of the expected outcome of the applicable contingency. The Group consults with legal counsel on matters related to litigation and other experts both within and outside the Group and Company with respect to matters in the ordinary course of business.
Notes to the consolidated financial statements (Contd)
5. Segment information
(a) Primary reporting format - business segments
At 31 March 2014 the Group is organised into two main business segments :
� Providing motor vehicle repair and maintenance services including sale of spare parts
� Sale of motor vehicles
The segment results for the year ended 31 March 2014 are as follows:
Repair &maintenance
services
Motor vehiclesales
Group
Total segmental revenue 623,335,569 228,138,846 851,474,415 Less: Turnover Tax Nil Nil NilRevenue from external customers 623,335,569 228,138,846 851,474,415
Operating profit / segment results
Finance income 50,943,619 Finance costs (62,038,120)Finance costs - net (11,094,501)
Profit before income tax (71,470,399)Income tax expense (62,339,911)Net Profit (133,810,310)
(all amounts in Sri Lanka Rupees unless otherwise stated)
A N N U A L R E P O R T 2 0 1 3 / 2 0 1 4
C M H O L D I N G S P L C A N D I T S S U B S I D I A R I E S44
Notes to the consolidated financial statements (Contd)
5. Segment information (Contd)
Inter segment transfers or transactions are entered into under the normal commercial terms and conditions that would also be available to unrelated third parties.
Segment assets consist primarily of property, plant and equipment, intangible assets, inventories, trade and other receivables, and cash and cash equivalents.
Segment liabilities comprise operating liabilities.
Capital expenditure comprises additions to property, plant and equipment and intangible assets.
(b) Secondary reporting format - geographical segmentsThe Group’s two business segments operate in one main geographical area, hence they do not qualify for secondary reporting.
(c) Primary reporting format - business segments At 31 March 2013 the Group is organised into two main business segments :
� Providing motor vehicle repair and maintenance services including sale of spare parts
� Sale of motor vehicles
The segment results for the year ended 31 March 2013 are as follows:
Repair &maintenance
services
Motor vehiclesales Group
Total segmental revenue 382,658,943 412,835,151 795,494,094 Less: Turnover Tax Nil Nil NilRevenue from external customers 382,658,943 412,835,151 795,494,094
Operating profit / segment results
Finance income 71,668,996 Finance costs (43,917,798)Finance costs - net 27,751,198 Profit before income tax 433,584,912 Income tax expense (117,368,626)Net profit 316,216,286
Other segment items included in the income statement are as follows:
Repair &maintenance
services
Motor vehiclesales Group
Depreciation 36,021,229 Nil 36,021,229 Amortization 1,075,450 Nil 1,075,450
The segment assets and liabilities at 31 March 2014 and capital expenditure for the year then ended are as follows:
Repair &maintenance
services
Motor vehiclesales Group
Assets 3,336,095,445 1,231,980,283 4,598,075,728 Liabilities 691,969,144 253,258,517 945,227,660 Capital expenditure 97,447,557 Nil 97,447,557
(all amounts in Sri Lanka Rupees unless otherwise stated)
A N N U A L R E P O R T 2 0 1 3 / 2 0 1 4
C M H O L D I N G S P L C A N D I T S S U B S I D I A R I E S 45
Notes to the consolidated financial statements (Contd)
5. Segment information (Contd)
Repair &maintenance
services
Motor vehiclesales Group
Assets 2,125,273,099 2,292,870,602 4,418,143,701 Liabilities 234,718,566 253,228,302 487,946,868 Capital expenditure 439,622,539 Nil 439,622,539
Other segment items included in the income statement are as follows:
Repair &maintenance
services
Motor vehiclesales Group
Depreciation 22,805,371 Nil 22,805,371 Amortization 139,868 Nil 139,868
The segment assets and liabilities at 31 March 2013 and capital expenditure for the year then ended are as follows:
Inter segment transfers or transactions are entered into under the normal commercial terms and conditions that would also be available to unrelated third parties.
Segment assets consist primarily of property, plant and equipment, intangible assets, inventories, trade and other receivables and cash and cash equivalents.
Segment liabilities comprise operating liabilities.Capital expenditure comprises additions to property, plant and equipment and intangible assets. (d) Secondary reporting format - geographical segmentsThe Group’s two business segments operate in one main geographical area, hence they do not qualify for secondary reporting.
(all amounts in Sri Lanka Rupees unless otherwise stated)
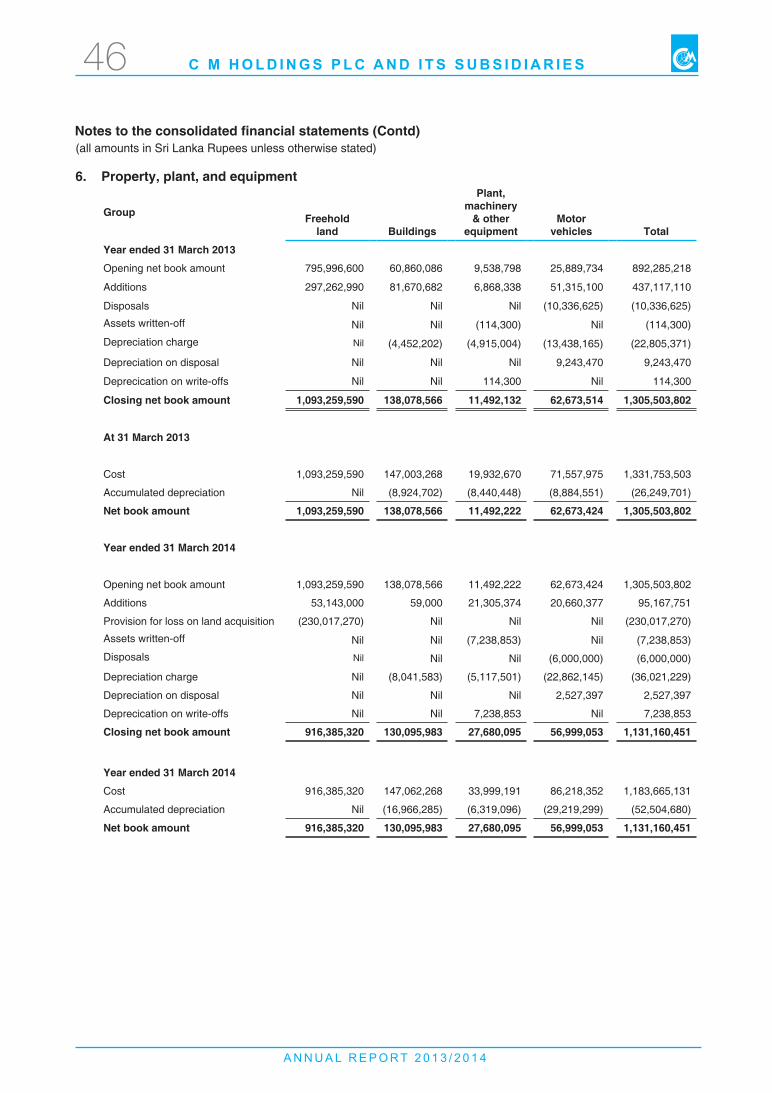
A N N U A L R E P O R T 2 0 1 3 / 2 0 1 4
C M H O L D I N G S P L C A N D I T S S U B S I D I A R I E S46
Notes to the consolidated financial statements (Contd)
6. Property, plant, and equipment
Group Freeholdland Buildings
Plant, machinery
& otherequipment
Motorvehicles Total
Year ended 31 March 2013
Opening net book amount 795,996,600 60,860,086 9,538,798 25,889,734 892,285,218
Additions 297,262,990 81,670,682 6,868,338 51,315,100 437,117,110
Disposals Nil Nil Nil (10,336,625) (10,336,625)
Assets written-off Nil Nil (114,300) Nil (114,300)
Depreciation charge Nil (4,452,202) (4,915,004) (13,438,165) (22,805,371)
Depreciation on disposal Nil Nil Nil 9,243,470 9,243,470
Deprecication on write-offs Nil Nil 114,300 Nil 114,300
Closing net book amount 1,093,259,590 138,078,566 11,492,132 62,673,514 1,305,503,802
At 31 March 2013
Cost 1,093,259,590 147,003,268 19,932,670 71,557,975 1,331,753,503
Accumulated depreciation Nil (8,924,702) (8,440,448) (8,884,551) (26,249,701)
Net book amount 1,093,259,590 138,078,566 11,492,222 62,673,424 1,305,503,802
Year ended 31 March 2014
Opening net book amount 1,093,259,590 138,078,566 11,492,222 62,673,424 1,305,503,802
Additions 53,143,000 59,000 21,305,374 20,660,377 95,167,751
Provision for loss on land acquisition (230,017,270) Nil Nil Nil (230,017,270)
Assets written-off Nil Nil (7,238,853) Nil (7,238,853)
Disposals Nil Nil Nil (6,000,000) (6,000,000)
Depreciation charge Nil (8,041,583) (5,117,501) (22,862,145) (36,021,229)
Depreciation on disposal Nil Nil Nil 2,527,397 2,527,397
Deprecication on write-offs Nil Nil 7,238,853 Nil 7,238,853
Closing net book amount 916,385,320 130,095,983 27,680,095 56,999,053 1,131,160,451
Year ended 31 March 2014
Cost 916,385,320 147,062,268 33,999,191 86,218,352 1,183,665,131
Accumulated depreciation Nil (16,966,285) (6,319,096) (29,219,299) (52,504,680)
Net book amount 916,385,320 130,095,983 27,680,095 56,999,053 1,131,160,451
(all amounts in Sri Lanka Rupees unless otherwise stated)
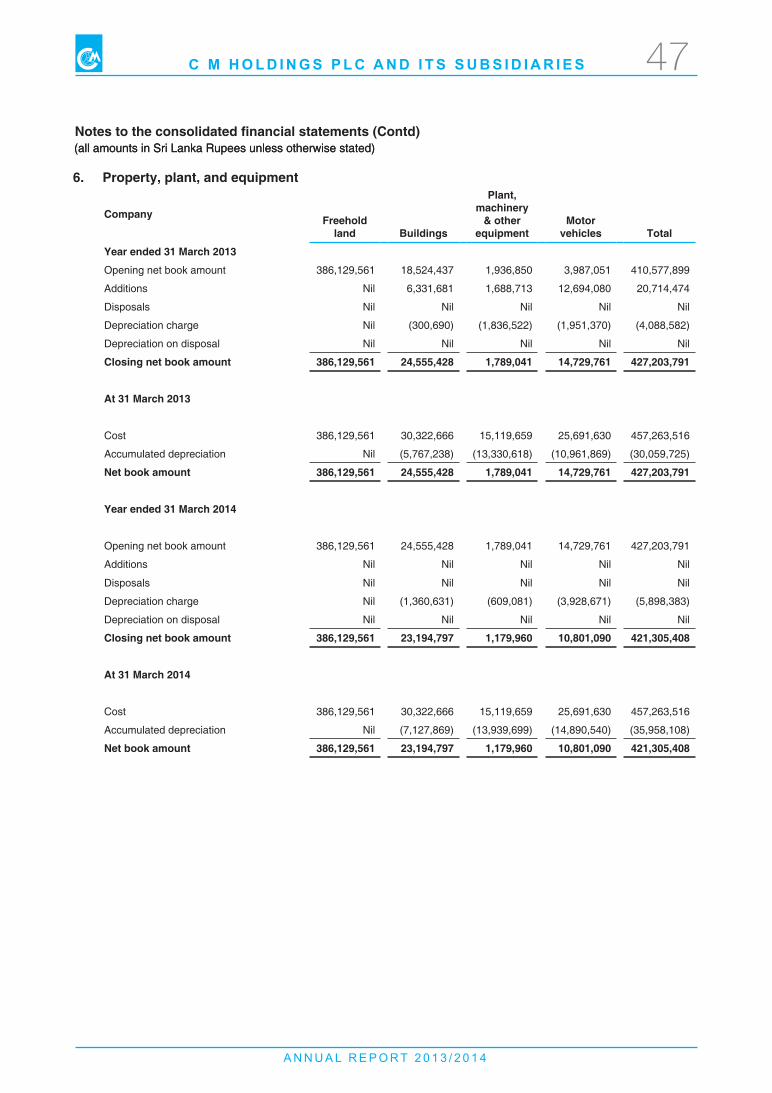
A N N U A L R E P O R T 2 0 1 3 / 2 0 1 4
C M H O L D I N G S P L C A N D I T S S U B S I D I A R I E S 47
Notes to the consolidated financial statements (Contd)
6. Property, plant, and equipment
Company Freeholdland Buildings
Plant, machinery
& otherequipment
Motorvehicles Total
Year ended 31 March 2013
Opening net book amount 386,129,561 18,524,437 1,936,850 3,987,051 410,577,899
Additions Nil 6,331,681 1,688,713 12,694,080 20,714,474
Disposals Nil Nil Nil Nil Nil
Depreciation charge Nil (300,690) (1,836,522) (1,951,370) (4,088,582)
Depreciation on disposal Nil Nil Nil Nil Nil
Closing net book amount 386,129,561 24,555,428 1,789,041 14,729,761 427,203,791
At 31 March 2013
Cost 386,129,561 30,322,666 15,119,659 25,691,630 457,263,516
Accumulated depreciation Nil (5,767,238) (13,330,618) (10,961,869) (30,059,725)
Net book amount 386,129,561 24,555,428 1,789,041 14,729,761 427,203,791
Year ended 31 March 2014
Opening net book amount 386,129,561 24,555,428 1,789,041 14,729,761 427,203,791
Additions Nil Nil Nil Nil Nil
Disposals Nil Nil Nil Nil Nil
Depreciation charge Nil (1,360,631) (609,081) (3,928,671) (5,898,383)
Depreciation on disposal Nil Nil Nil Nil Nil
Closing net book amount 386,129,561 23,194,797 1,179,960 10,801,090 421,305,408
At 31 March 2014
Cost 386,129,561 30,322,666 15,119,659 25,691,630 457,263,516
Accumulated depreciation Nil (7,127,869) (13,939,699) (14,890,540) (35,958,108)
Net book amount 386,129,561 23,194,797 1,179,960 10,801,090 421,305,408
(all amounts in Sri Lanka Rupees unless otherwise stated)(all amounts in Sri Lanka Rupees unless otherwise stated)
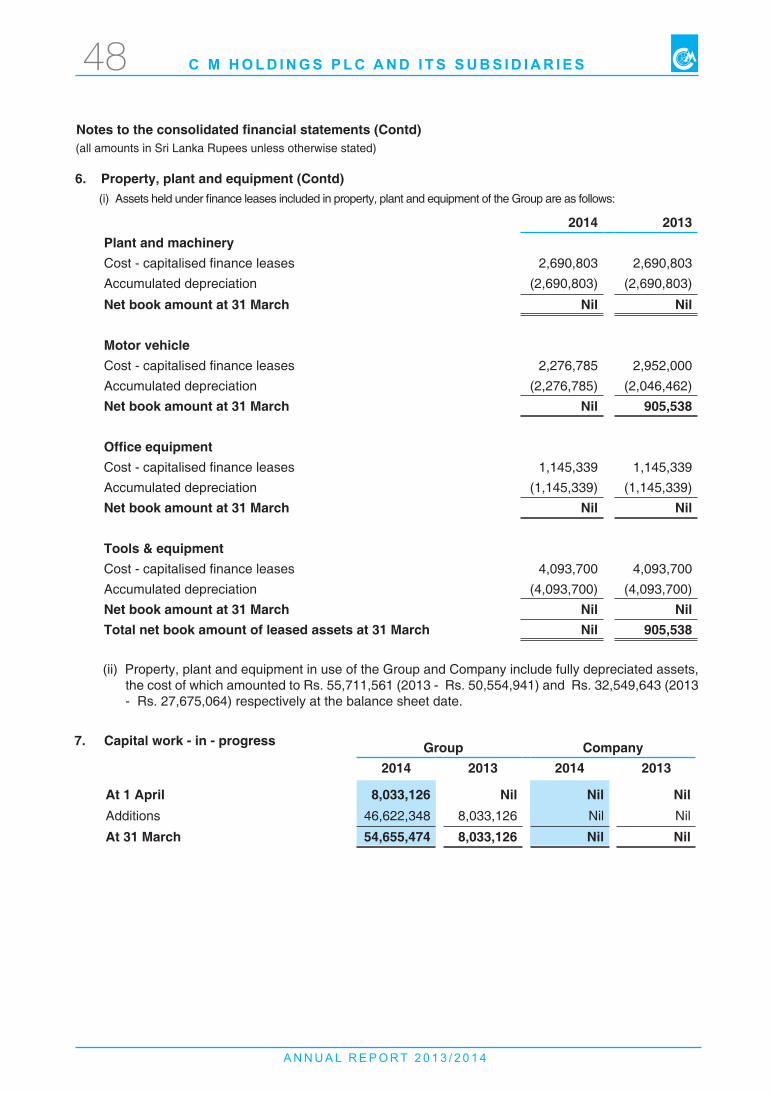
A N N U A L R E P O R T 2 0 1 3 / 2 0 1 4
C M H O L D I N G S P L C A N D I T S S U B S I D I A R I E S48
6. Property, plant and equipment (Contd)
7. Capital work - in - progress
2014 2013Plant and machineryCost - capitalised finance leases 2,690,803 2,690,803 Accumulated depreciation (2,690,803) (2,690,803)
Net book amount at 31 March Nil Nil
Motor vehicleCost - capitalised finance leases 2,276,785 2,952,000 Accumulated depreciation (2,276,785) (2,046,462)Net book amount at 31 March Nil 905,538
Office equipmentCost - capitalised finance leases 1,145,339 1,145,339 Accumulated depreciation (1,145,339) (1,145,339)Net book amount at 31 March Nil Nil
Tools & equipmentCost - capitalised finance leases 4,093,700 4,093,700 Accumulated depreciation (4,093,700) (4,093,700)Net book amount at 31 March Nil Nil Total net book amount of leased assets at 31 March Nil 905,538
(ii) Property, plant and equipment in use of the Group and Company include fully depreciated assets, the cost of which amounted to Rs. 55,711,561 (2013 - Rs. 50,554,941) and Rs. 32,549,643 (2013 - Rs. 27,675,064) respectively at the balance sheet date.
Group Company2014 2013 2014 2013
At 1 April 8,033,126 Nil Nil NilAdditions 46,622,348 8,033,126 Nil Nil
At 31 March 54,655,474 8,033,126 Nil Nil
Notes to the consolidated financial statements (Contd)
(i) Assets held under finance leases included in property, plant and equipment of the Group are as follows:
(all amounts in Sri Lanka Rupees unless otherwise stated)
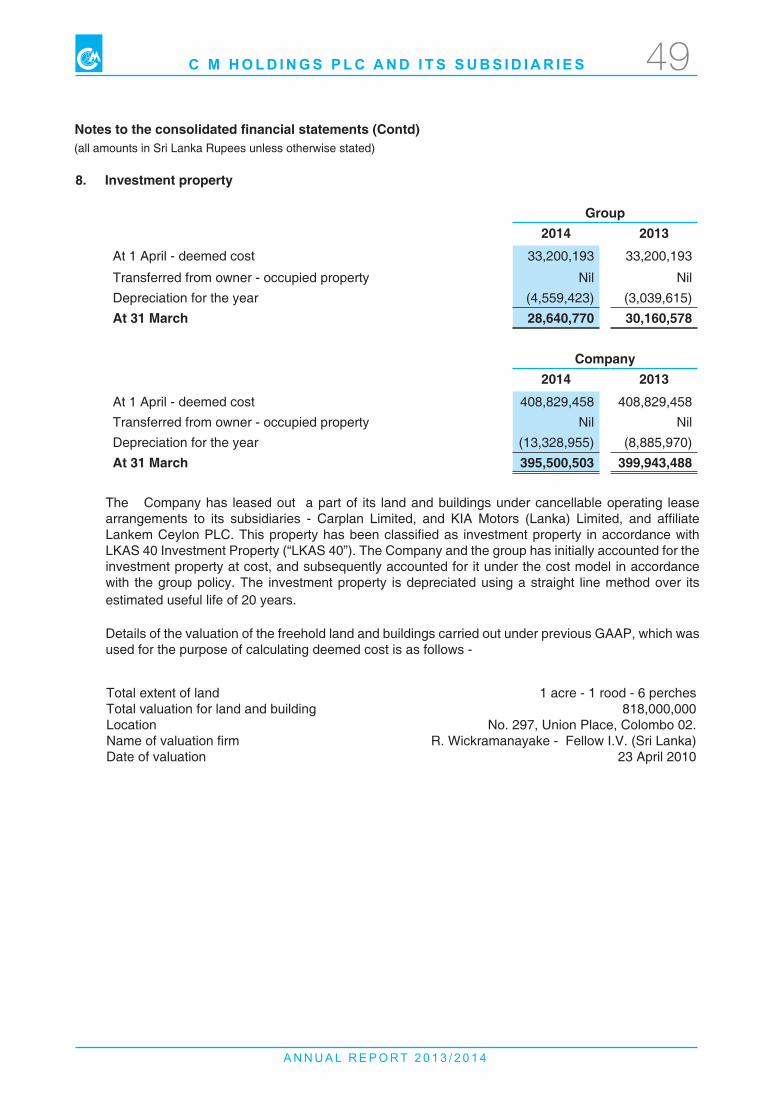
A N N U A L R E P O R T 2 0 1 3 / 2 0 1 4
C M H O L D I N G S P L C A N D I T S S U B S I D I A R I E S 49
The Company has leased out a part of its land and buildings under cancellable operating lease arrangements to its subsidiaries - Carplan Limited, and KIA Motors (Lanka) Limited, and affiliate Lankem Ceylon PLC. This property has been classified as investment property in accordance with LKAS 40 Investment Property (“LKAS 40”). The Company and the group has initially accounted for the investment property at cost, and subsequently accounted for it under the cost model in accordance with the group policy. The investment property is depreciated using a straight line method over its estimated useful life of 20 years. Details of the valuation of the freehold land and buildings carried out under previous GAAP, which wasused for the purpose of calculating deemed cost is as follows -
Total extent of land Total valuation for land and buildingLocation Name of valuation firm Date of valuation
1 acre - 1 rood - 6 perches 818,000,000
No. 297, Union Place, Colombo 02. R. Wickramanayake - Fellow I.V. (Sri Lanka) 23 April 2010
Group2014 2013
At 1 April - deemed cost 33,200,193 33,200,193
Transferred from owner - occupied property Nil Nil Depreciation for the year (4,559,423) (3,039,615)At 31 March 28,640,770 30,160,578
Company2014 2013
At 1 April - deemed cost 408,829,458 408,829,458 Transferred from owner - occupied property Nil Nil Depreciation for the year (13,328,955) (8,885,970)At 31 March 395,500,503 399,943,488
Notes to the consolidated financial statements (Contd)
8. Investment property
(all amounts in Sri Lanka Rupees unless otherwise stated)
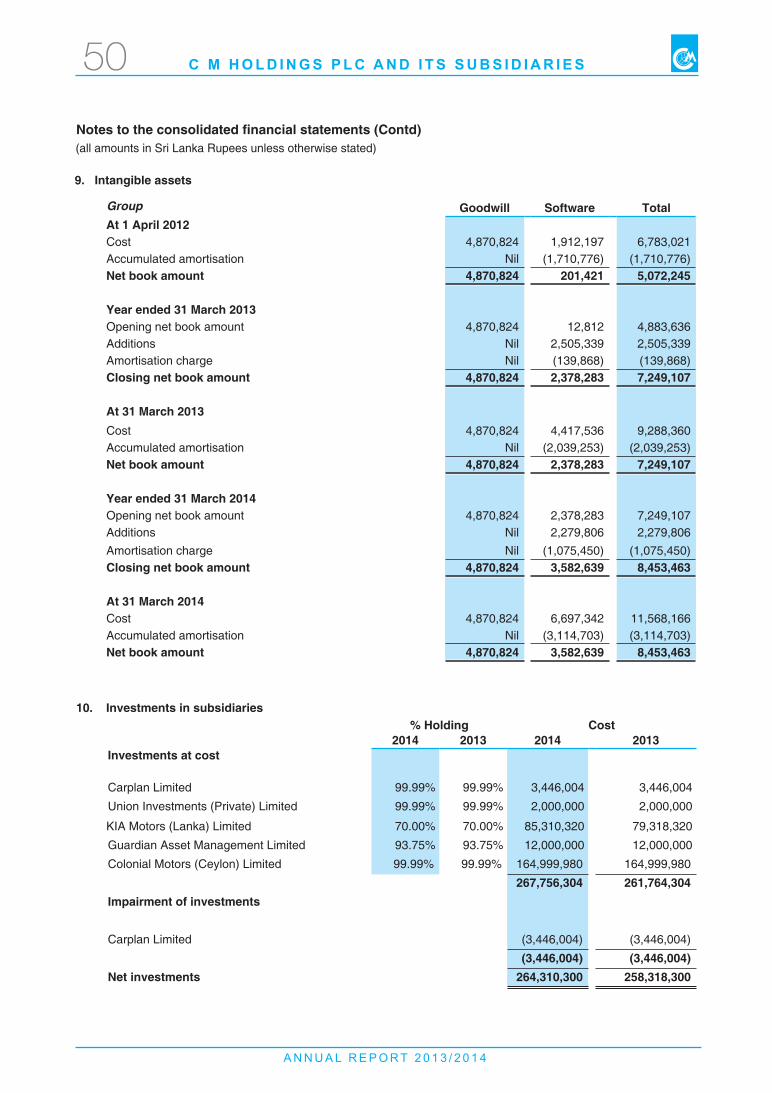
A N N U A L R E P O R T 2 0 1 3 / 2 0 1 4
C M H O L D I N G S P L C A N D I T S S U B S I D I A R I E S50
9. Intangible assets
10. Investments in subsidiaries
Goodwill Software TotalAt 1 April 2012Cost 4,870,824 1,912,197 6,783,021 Accumulated amortisation Nil (1,710,776) (1,710,776)Net book amount 4,870,824 201,421 5,072,245
Year ended 31 March 2013Opening net book amount 4,870,824 12,812 4,883,636 Additions Nil 2,505,339 2,505,339 Amortisation charge Nil (139,868) (139,868)Closing net book amount 4,870,824 2,378,283 7,249,107
At 31 March 2013Cost 4,870,824 4,417,536 9,288,360 Accumulated amortisation Nil (2,039,253) (2,039,253)Net book amount 4,870,824 2,378,283 7,249,107
Year ended 31 March 2014Opening net book amount 4,870,824 2,378,283 7,249,107 Additions Nil 2,279,806 2,279,806 Amortisation charge Nil (1,075,450) (1,075,450)Closing net book amount 4,870,824 3,582,639 8,453,463
At 31 March 2014Cost 4,870,824 6,697,342 11,568,166 Accumulated amortisation Nil (3,114,703) (3,114,703)Net book amount 4,870,824 3,582,639 8,453,463
% Holding Cost2014 2013 2014 2013
Investments at cost
Carplan Limited 99.99% 99.99% 3,446,004 3,446,004
Union Investments (Private) Limited 99.99% 99.99% 2,000,000 2,000,000
KIA Motors (Lanka) Limited 70.00% 70.00% 85,310,320 79,318,320
Guardian Asset Management Limited 93.75% 93.75% 12,000,000 12,000,000
Colonial Motors (Ceylon) Limited 99.99% 99.99% 164,999,980 164,999,980
267,756,304 261,764,304 Impairment of investments
Carplan Limited (3,446,004) (3,446,004)
(3,446,004) (3,446,004)Net investments 264,310,300 258,318,300
Notes to the consolidated financial statements (Contd)
Group
(all amounts in Sri Lanka Rupees unless otherwise stated)
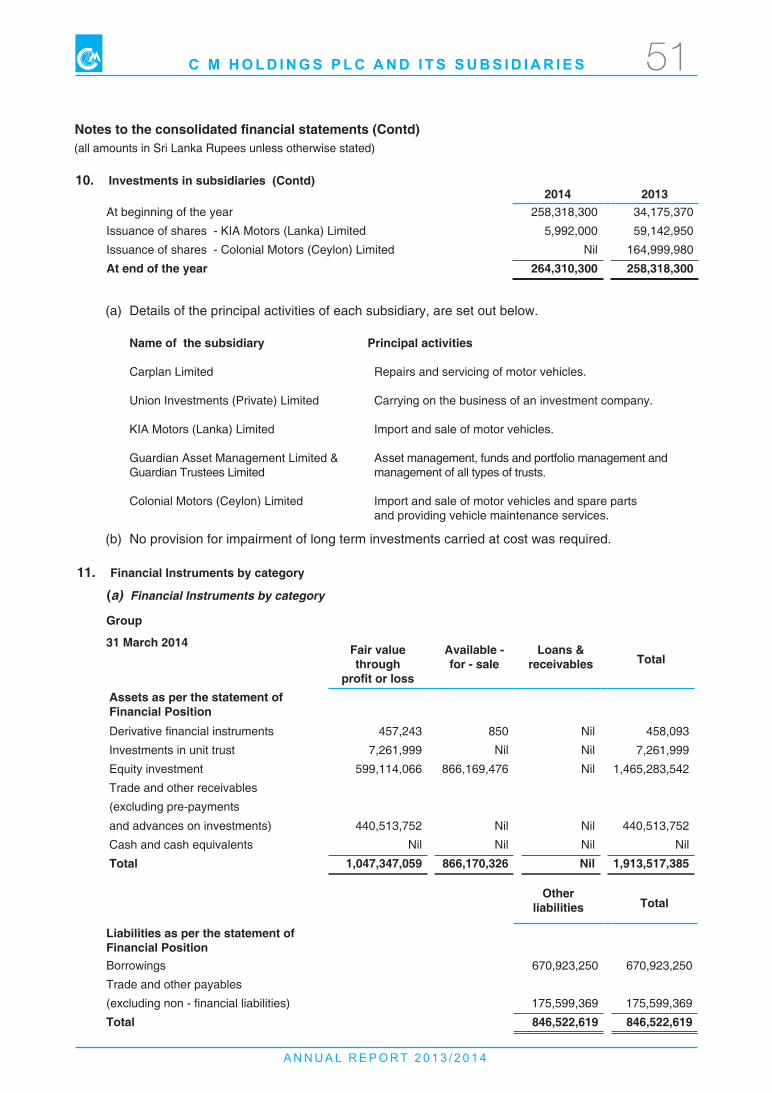
A N N U A L R E P O R T 2 0 1 3 / 2 0 1 4
C M H O L D I N G S P L C A N D I T S S U B S I D I A R I E S 51
2014 2013At beginning of the year 258,318,300 34,175,370
Issuance of shares - KIA Motors (Lanka) Limited 5,992,000 59,142,950
Issuance of shares - Colonial Motors (Ceylon) Limited Nil 164,999,980
At end of the year 264,310,300 258,318,300
Notes to the consolidated financial statements (Contd)
10. Investments in subsidiaries (Contd)
11. Financial Instruments by category
(a) Financial Instruments by category
(a) Details of the principal activities of each subsidiary, are set out below. Name of the subsidiary Principal activities Carplan Limited Repairs and servicing of motor vehicles. Union Investments (Private) Limited Carrying on the business of an investment company. KIA Motors (Lanka) Limited Import and sale of motor vehicles. Guardian Asset Management Limited & Asset management, funds and portfolio management and Guardian Trustees Limited management of all types of trusts. Colonial Motors (Ceylon) Limited Import and sale of motor vehicles and spare parts and providing vehicle maintenance services.
(b) No provision for impairment of long term investments carried at cost was required.
Fair value through
profit or loss
Available -for - sale
Loans &receivables Total
Assets as per the statement of Financial Position Derivative financial instruments 457,243 850 Nil 458,093
Investments in unit trust 7,261,999 Nil Nil 7,261,999
Equity investment 599,114,066 866,169,476 Nil 1,465,283,542
Trade and other receivables
(excluding pre-payments
and advances on investments) 440,513,752 Nil Nil 440,513,752
Cash and cash equivalents Nil Nil Nil Nil
Total 1,047,347,059 866,170,326 Nil 1,913,517,385
Otherliabilities Total
Liabilities as per the statement of Financial Position Borrowings 670,923,250 670,923,250
Trade and other payables
(excluding non - financial liabilities) 175,599,369 175,599,369
Total 846,522,619 846,522,619
(all amounts in Sri Lanka Rupees unless otherwise stated)
Group
31 March 2014
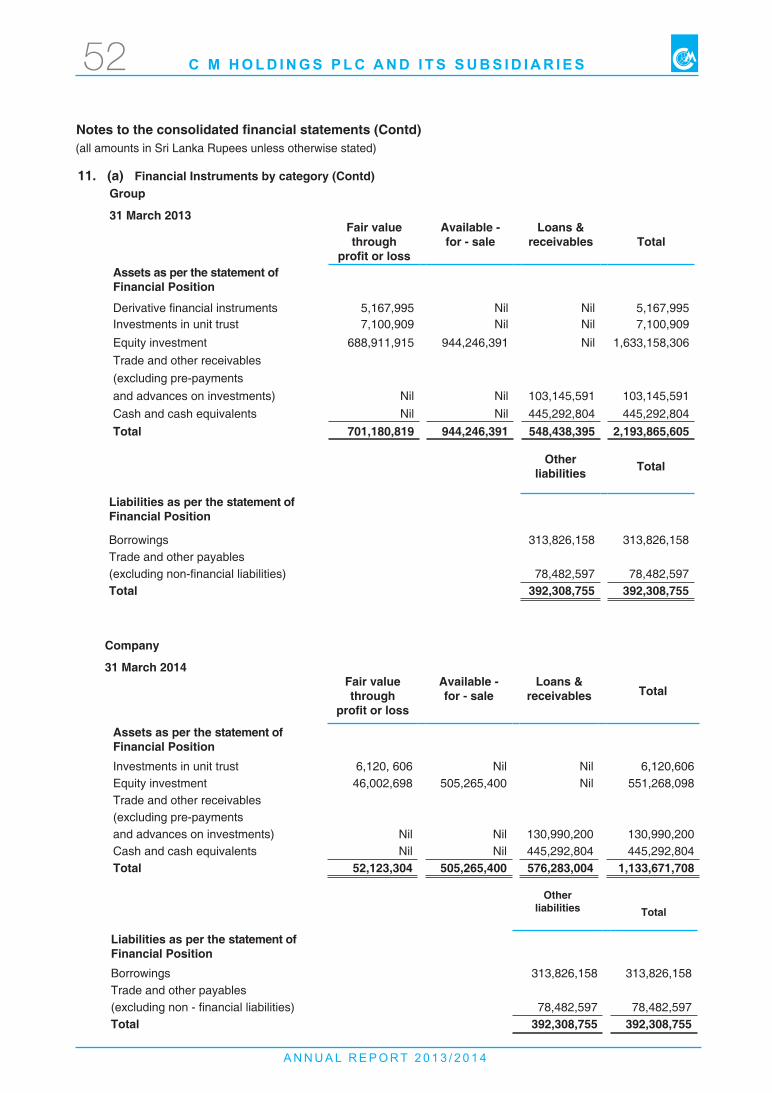
A N N U A L R E P O R T 2 0 1 3 / 2 0 1 4
C M H O L D I N G S P L C A N D I T S S U B S I D I A R I E S52
Notes to the consolidated financial statements (Contd)
11. (a) Financial Instruments by category (Contd)
Otherliabilities Total
Liabilities as per the statement of Financial Position
Borrowings 313,826,158 313,826,158 Trade and other payables(excluding non-financial liabilities) 78,482,597 78,482,597 Total 392,308,755 392,308,755
Fair value through
profit or loss
Available -for - sale
Loans &receivables Total
Assets as per the statement of Financial Position
Derivative financial instruments 5,167,995 Nil Nil 5,167,995 Investments in unit trust 7,100,909 Nil Nil 7,100,909
Equity investment 688,911,915 944,246,391 Nil 1,633,158,306 Trade and other receivables(excluding pre-paymentsand advances on investments) Nil Nil 103,145,591 103,145,591 Cash and cash equivalents Nil Nil 445,292,804 445,292,804 Total 701,180,819 944,246,391 548,438,395 2,193,865,605
Otherliabilities Total
Liabilities as per the statement of Financial Position Borrowings 313,826,158 313,826,158 Trade and other payables(excluding non - financial liabilities) 78,482,597 78,482,597 Total 392,308,755 392,308,755
Fair value through
profit or loss
Available -for - sale
Loans &receivables Total
Assets as per the statement of Financial Position Investments in unit trust 6,120, 606 Nil Nil 6,120,606 Equity investment 46,002,698 505,265,400 Nil 551,268,098 Trade and other receivables(excluding pre-paymentsand advances on investments) Nil Nil 130,990,200 130,990,200 Cash and cash equivalents Nil Nil 445,292,804 445,292,804 Total 52,123,304 505,265,400 576,283,004 1,133,671,708
(all amounts in Sri Lanka Rupees unless otherwise stated)
Group
31 March 2013
Company
31 March 2014
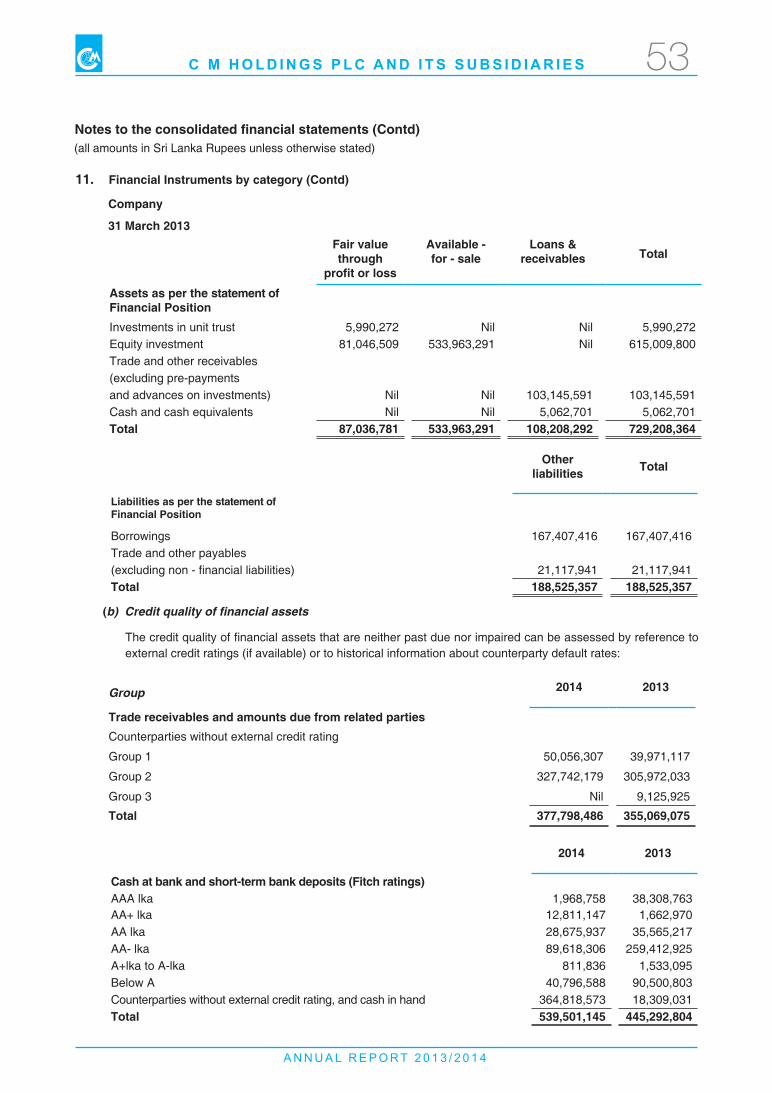
A N N U A L R E P O R T 2 0 1 3 / 2 0 1 4
C M H O L D I N G S P L C A N D I T S S U B S I D I A R I E S 53
11. Financial Instruments by category (Contd)
Notes to the consolidated financial statements (Contd)
Otherliabilities Total
Liabilities as per the statement of Financial Position
Borrowings 167,407,416 167,407,416 Trade and other payables(excluding non - financial liabilities) 21,117,941 21,117,941 Total 188,525,357 188,525,357
Fair value through
profit or loss
Available -for - sale
Loans &receivables Total
Assets as per the statement of Financial Position Investments in unit trust 5,990,272 Nil Nil 5,990,272 Equity investment 81,046,509 533,963,291 Nil 615,009,800 Trade and other receivables(excluding pre-paymentsand advances on investments) Nil Nil 103,145,591 103,145,591 Cash and cash equivalents Nil Nil 5,062,701 5,062,701 Total 87,036,781 533,963,291 108,208,292 729,208,364
(b) Credit quality of financial assets
The credit quality of financial assets that are neither past due nor impaired can be assessed by reference to external credit ratings (if available) or to historical information about counterparty default rates:
Group 2014 2013
Trade receivables and amounts due from related partiesCounterparties without external credit rating
Group 1 50,056,307 39,971,117
Group 2 327,742,179 305,972,033
Group 3 Nil 9,125,925
Total 377,798,486 355,069,075
2014 2013
Cash at bank and short-term bank deposits (Fitch ratings)AAA lka 1,968,758 38,308,763 AA+ lka 12,811,147 1,662,970 AA lka 28,675,937 35,565,217 AA- lka 89,618,306 259,412,925 A+lka to A-lka 811,836 1,533,095 Below A 40,796,588 90,500,803 Counterparties without external credit rating, and cash in hand 364,818,573 18,309,031 Total 539,501,145 445,292,804
(all amounts in Sri Lanka Rupees unless otherwise stated)
Company
31 March 2013
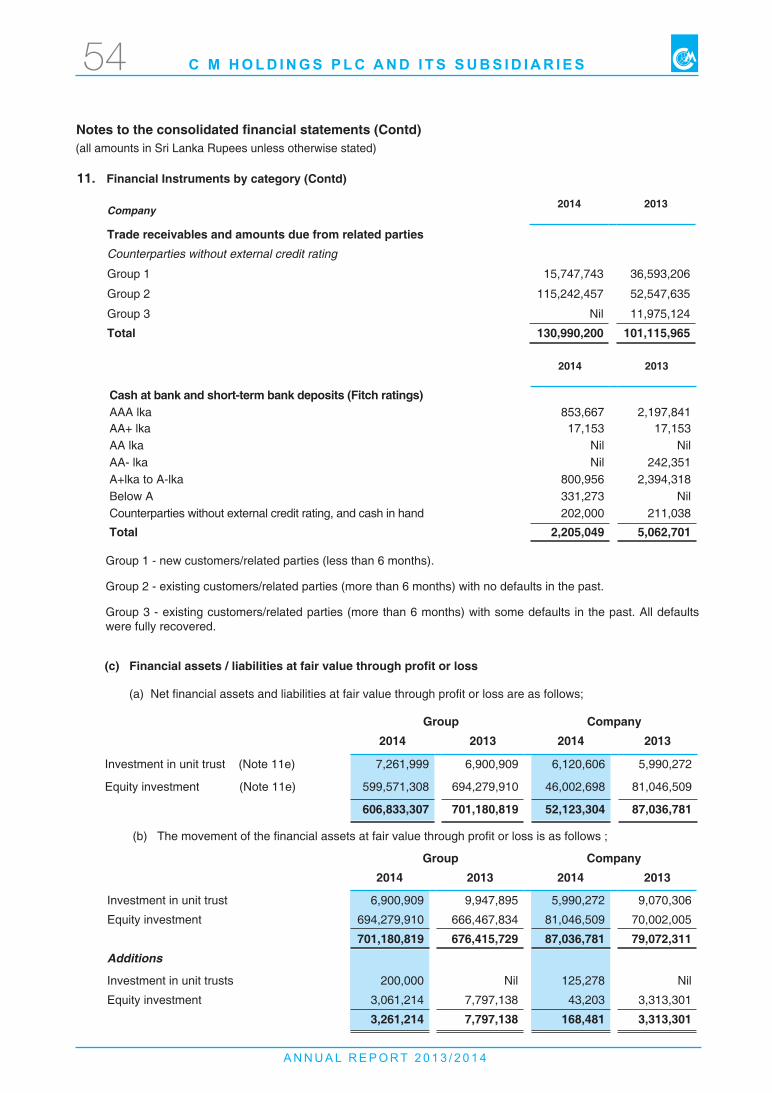
A N N U A L R E P O R T 2 0 1 3 / 2 0 1 4
C M H O L D I N G S P L C A N D I T S S U B S I D I A R I E S54
Notes to the consolidated financial statements (Contd)
Group 1 - new customers/related parties (less than 6 months).
Group 2 - existing customers/related parties (more than 6 months) with no defaults in the past.
Group 3 - existing customers/related parties (more than 6 months) with some defaults in the past. All defaults were fully recovered.
(c) Financial assets / liabilities at fair value through profit or loss
Group Company
2014 2013 2014 2013
Investment in unit trust (Note 11e) 7,261,999 6,900,909 6,120,606 5,990,272
Equity investment (Note 11e) 599,571,308 694,279,910 46,002,698 81,046,509
606,833,307 701,180,819 52,123,304 87,036,781
(a) Net financial assets and liabilities at fair value through profit or loss are as follows;
Company 2014 2013
Trade receivables and amounts due from related partiesCounterparties without external credit rating
Group 1 15,747,743 36,593,206
Group 2 115,242,457 52,547,635
Group 3 Nil 11,975,124
Total 130,990,200 101,115,965
2014 2013
Cash at bank and short-term bank deposits (Fitch ratings)AAA lka 853,667 2,197,841 AA+ lka 17,153 17,153 AA lka Nil Nil AA- lka Nil 242,351 A+lka to A-lka 800,956 2,394,318 Below A 331,273 Nil Counterparties without external credit rating, and cash in hand 202,000 211,038
Total 2,205,049 5,062,701
11. Financial Instruments by category (Contd)
Group Company2014 2013 2014 2013
Investment in unit trust 6,900,909 9,947,895 5,990,272 9,070,306
Equity investment 694,279,910 666,467,834 81,046,509 70,002,005
701,180,819 676,415,729 87,036,781 79,072,311 Additions
Investment in unit trusts 200,000 Nil 125,278 Nil
Equity investment 3,061,214 7,797,138 43,203 3,313,301
3,261,214 7,797,138 168,481 3,313,301
(b) The movement of the financial assets at fair value through profit or loss is as follows ;
(all amounts in Sri Lanka Rupees unless otherwise stated)
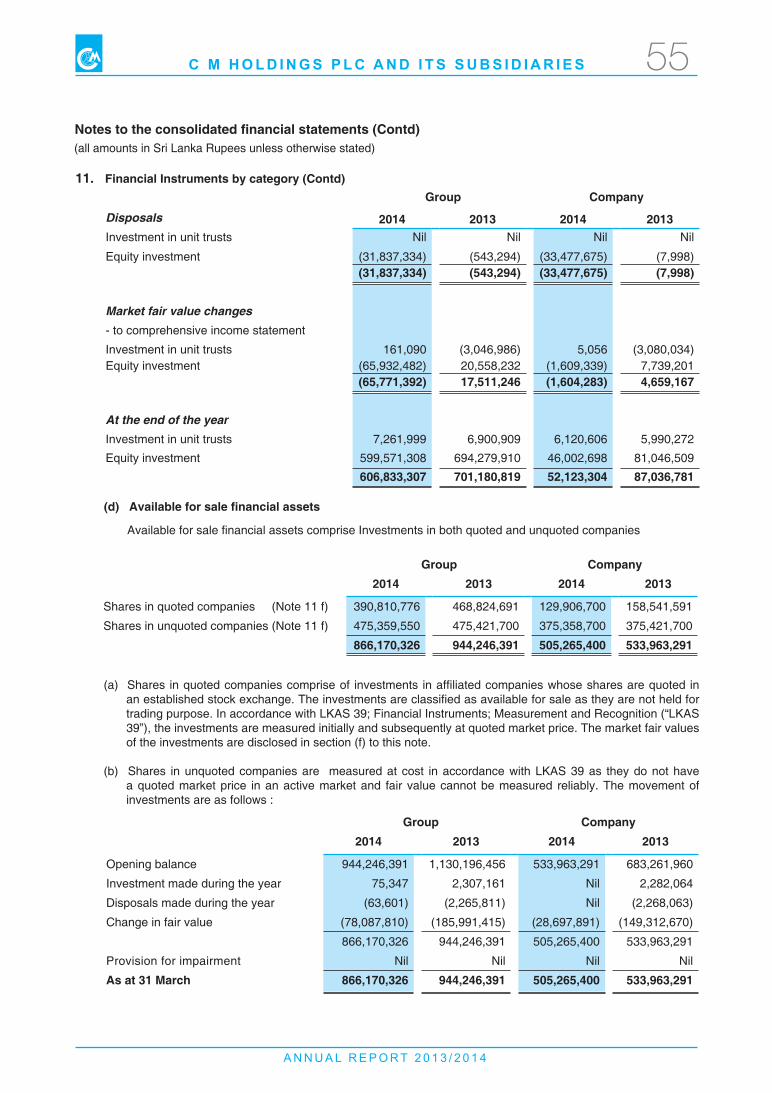
A N N U A L R E P O R T 2 0 1 3 / 2 0 1 4
C M H O L D I N G S P L C A N D I T S S U B S I D I A R I E S 55
Notes to the consolidated financial statements (Contd)
11. Financial Instruments by category (Contd)
Group Company2014 2013 2014 2013
Shares in quoted companies (Note 11 f) 390,810,776 468,824,691 129,906,700 158,541,591
Shares in unquoted companies (Note 11 f) 475,359,550 475,421,700 375,358,700 375,421,700
866,170,326 944,246,391 505,265,400 533,963,291
Group Company
Disposals 2014 2013 2014 2013Investment in unit trusts Nil Nil Nil Nil
Equity investment (31,837,334) (543,294) (33,477,675) (7,998)(31,837,334) (543,294) (33,477,675) (7,998)
Market fair value changes
- to comprehensive income statement
Investment in unit trusts 161,090 (3,046,986) 5,056 (3,080,034)Equity investment (65,932,482) 20,558,232 (1,609,339) 7,739,201
(65,771,392) 17,511,246 (1,604,283) 4,659,167
At the end of the year
Investment in unit trusts 7,261,999 6,900,909 6,120,606 5,990,272
Equity investment 599,571,308 694,279,910 46,002,698 81,046,509
606,833,307 701,180,819 52,123,304 87,036,781
(d) Available for sale financial assets
Available for sale financial assets comprise Investments in both quoted and unquoted companies
(a) Shares in quoted companies comprise of investments in affiliated companies whose shares are quoted in an established stock exchange. The investments are classified as available for sale as they are not held for trading purpose. In accordance with LKAS 39; Financial Instruments; Measurement and Recognition (“LKAS 39”), the investments are measured initially and subsequently at quoted market price. The market fair values of the investments are disclosed in section (f) to this note.
(b) Shares in unquoted companies are measured at cost in accordance with LKAS 39 as they do not have a quoted market price in an active market and fair value cannot be measured reliably. The movement of investments are as follows :
Group Company2014 2013 2014 2013
Opening balance 944,246,391 1,130,196,456 533,963,291 683,261,960
Investment made during the year 75,347 2,307,161 Nil 2,282,064
Disposals made during the year (63,601) (2,265,811) Nil (2,268,063)
Change in fair value (78,087,810) (185,991,415) (28,697,891) (149,312,670)
866,170,326 944,246,391 505,265,400 533,963,291
Provision for impairment Nil Nil Nil Nil
As at 31 March 866,170,326 944,246,391 505,265,400 533,963,291
(all amounts in Sri Lanka Rupees unless otherwise stated)
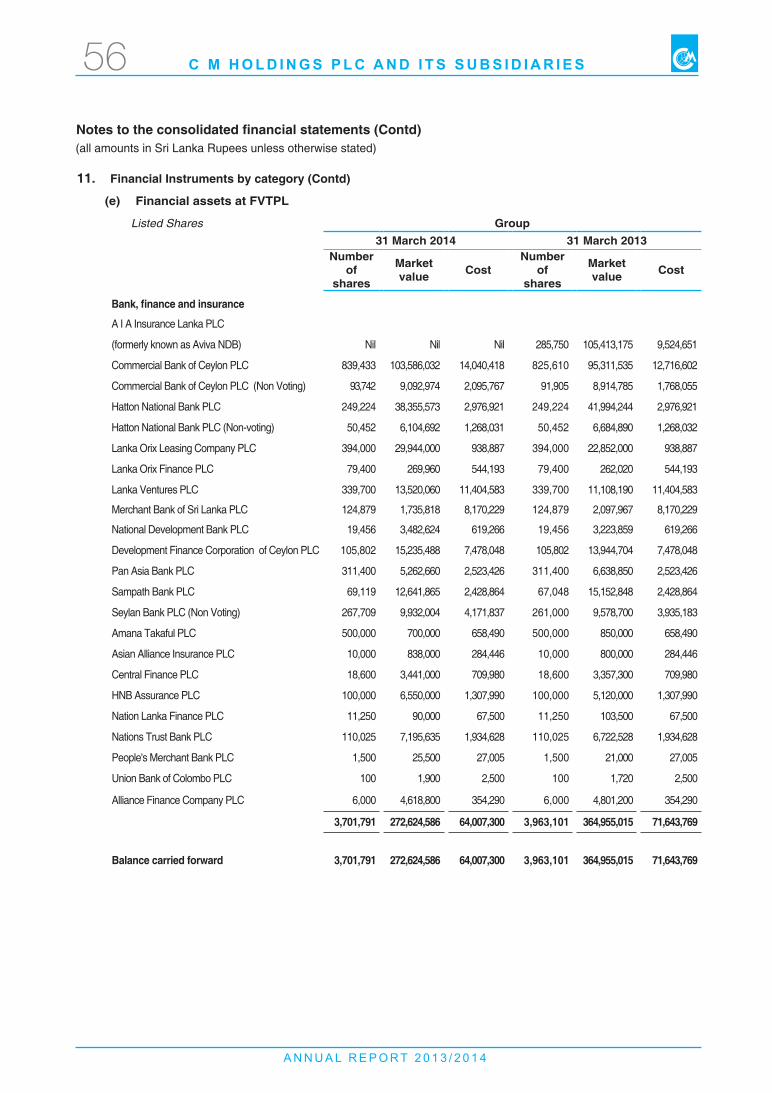
A N N U A L R E P O R T 2 0 1 3 / 2 0 1 4
C M H O L D I N G S P L C A N D I T S S U B S I D I A R I E S56
Notes to the consolidated financial statements (Contd)
Listed Shares Group31 March 2014 31 March 2013
Number of
shares
Market value Cost
Number of
shares
Market value Cost
Bank, finance and insurance
A I A Insurance Lanka PLC
(formerly known as Aviva NDB) Nil Nil Nil 285,750 105,413,175 9,524,651
Commercial Bank of Ceylon PLC 839,433 103,586,032 14,040,418 825,610 95,311,535 12,716,602
Commercial Bank of Ceylon PLC (Non Voting) 93,742 9,092,974 2,095,767 91,905 8,914,785 1,768,055
Hatton National Bank PLC 249,224 38,355,573 2,976,921 249,224 41,994,244 2,976,921
Hatton National Bank PLC (Non-voting) 50,452 6,104,692 1,268,031 50,452 6,684,890 1,268,032
Lanka Orix Leasing Company PLC 394,000 29,944,000 938,887 394,000 22,852,000 938,887
Lanka Orix Finance PLC 79,400 269,960 544,193 79,400 262,020 544,193
Lanka Ventures PLC 339,700 13,520,060 11,404,583 339,700 11,108,190 11,404,583
Merchant Bank of Sri Lanka PLC 124,879 1,735,818 8,170,229 124,879 2,097,967 8,170,229
National Development Bank PLC 19,456 3,482,624 619,266 19,456 3,223,859 619,266
Development Finance Corporation of Ceylon PLC 105,802 15,235,488 7,478,048 105,802 13,944,704 7,478,048
Pan Asia Bank PLC 311,400 5,262,660 2,523,426 311,400 6,638,850 2,523,426
Sampath Bank PLC 69,119 12,641,865 2,428,864 67,048 15,152,848 2,428,864
Seylan Bank PLC (Non Voting) 267,709 9,932,004 4,171,837 261,000 9,578,700 3,935,183
Amana Takaful PLC 500,000 700,000 658,490 500,000 850,000 658,490
Asian Alliance Insurance PLC 10,000 838,000 284,446 10,000 800,000 284,446
Central Finance PLC 18,600 3,441,000 709,980 18,600 3,357,300 709,980
HNB Assurance PLC 100,000 6,550,000 1,307,990 100,000 5,120,000 1,307,990
Nation Lanka Finance PLC 11,250 90,000 67,500 11,250 103,500 67,500
Nations Trust Bank PLC 110,025 7,195,635 1,934,628 110,025 6,722,528 1,934,628
People's Merchant Bank PLC 1,500 25,500 27,005 1,500 21,000 27,005
Union Bank of Colombo PLC 100 1,900 2,500 100 1,720 2,500
Alliance Finance Company PLC 6,000 4,618,800 354,290 6,000 4,801,200 354,290
3,701,791 272,624,586 64,007,300 3,963,101 364,955,015 71,643,769
Balance carried forward 3,701,791 272,624,586 64,007,300 3,963,101 364,955,015 71,643,769
(e) Financial assets at FVTPL
11. Financial Instruments by category (Contd)
(all amounts in Sri Lanka Rupees unless otherwise stated)
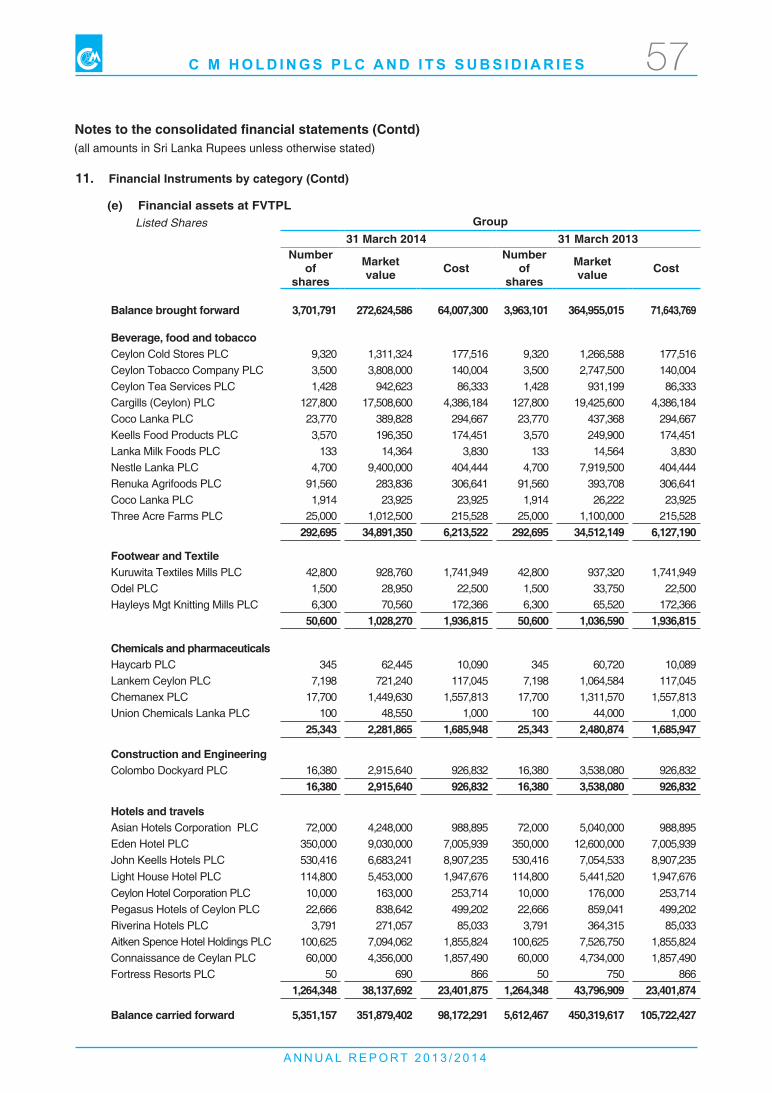
A N N U A L R E P O R T 2 0 1 3 / 2 0 1 4
C M H O L D I N G S P L C A N D I T S S U B S I D I A R I E S 57
Notes to the consolidated financial statements (Contd)
11. Financial Instruments by category (Contd)
Group31 March 2014 31 March 2013
Number of
shares
Market value Cost
Number of
shares
Market value Cost
Balance brought forward 3,701,791 272,624,586 64,007,300 3,963,101 364,955,015 71,643,769
Beverage, food and tobaccoCeylon Cold Stores PLC 9,320 1,311,324 177,516 9,320 1,266,588 177,516 Ceylon Tobacco Company PLC 3,500 3,808,000 140,004 3,500 2,747,500 140,004 Ceylon Tea Services PLC 1,428 942,623 86,333 1,428 931,199 86,333 Cargills (Ceylon) PLC 127,800 17,508,600 4,386,184 127,800 19,425,600 4,386,184 Coco Lanka PLC 23,770 389,828 294,667 23,770 437,368 294,667 Keells Food Products PLC 3,570 196,350 174,451 3,570 249,900 174,451 Lanka Milk Foods PLC 133 14,364 3,830 133 14,564 3,830 Nestle Lanka PLC 4,700 9,400,000 404,444 4,700 7,919,500 404,444 Renuka Agrifoods PLC 91,560 283,836 306,641 91,560 393,708 306,641 Coco Lanka PLC 1,914 23,925 23,925 1,914 26,222 23,925 Three Acre Farms PLC 25,000 1,012,500 215,528 25,000 1,100,000 215,528
292,695 34,891,350 6,213,522 292,695 34,512,149 6,127,190
Footwear and TextileKuruwita Textiles Mills PLC 42,800 928,760 1,741,949 42,800 937,320 1,741,949 Odel PLC 1,500 28,950 22,500 1,500 33,750 22,500 Hayleys Mgt Knitting Mills PLC 6,300 70,560 172,366 6,300 65,520 172,366
50,600 1,028,270 1,936,815 50,600 1,036,590 1,936,815
Chemicals and pharmaceuticalsHaycarb PLC 345 62,445 10,090 345 60,720 10,089 Lankem Ceylon PLC 7,198 721,240 117,045 7,198 1,064,584 117,045 Chemanex PLC 17,700 1,449,630 1,557,813 17,700 1,311,570 1,557,813 Union Chemicals Lanka PLC 100 48,550 1,000 100 44,000 1,000
25,343 2,281,865 1,685,948 25,343 2,480,874 1,685,947
Construction and EngineeringColombo Dockyard PLC 16,380 2,915,640 926,832 16,380 3,538,080 926,832
16,380 2,915,640 926,832 16,380 3,538,080 926,832
Hotels and travelsAsian Hotels Corporation PLC 72,000 4,248,000 988,895 72,000 5,040,000 988,895 Eden Hotel PLC 350,000 9,030,000 7,005,939 350,000 12,600,000 7,005,939 John Keells Hotels PLC 530,416 6,683,241 8,907,235 530,416 7,054,533 8,907,235 Light House Hotel PLC 114,800 5,453,000 1,947,676 114,800 5,441,520 1,947,676 Ceylon Hotel Corporation PLC 10,000 163,000 253,714 10,000 176,000 253,714 Pegasus Hotels of Ceylon PLC 22,666 838,642 499,202 22,666 859,041 499,202 Riverina Hotels PLC 3,791 271,057 85,033 3,791 364,315 85,033 Aitken Spence Hotel Holdings PLC 100,625 7,094,062 1,855,824 100,625 7,526,750 1,855,824 Connaissance de Ceylan PLC 60,000 4,356,000 1,857,490 60,000 4,734,000 1,857,490 Fortress Resorts PLC 50 690 866 50 750 866
1,264,348 38,137,692 23,401,875 1,264,348 43,796,909 23,401,874
Balance carried forward 5,351,157 351,879,402 98,172,291 5,612,467 450,319,617 105,722,427
(e) Financial assets at FVTPL Listed Shares
(all amounts in Sri Lanka Rupees unless otherwise stated)
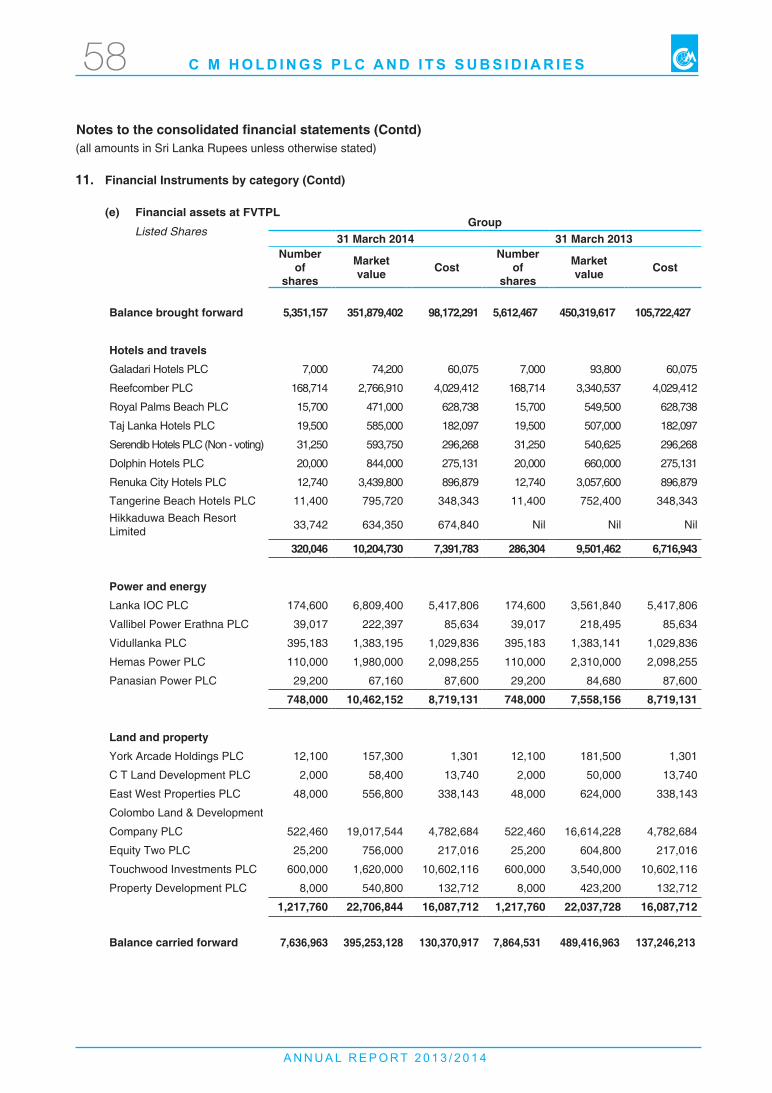
A N N U A L R E P O R T 2 0 1 3 / 2 0 1 4
C M H O L D I N G S P L C A N D I T S S U B S I D I A R I E S58
Notes to the consolidated financial statements (Contd)
11. Financial Instruments by category (Contd)
Group31 March 2014 31 March 2013
Number of
shares
Market value Cost
Number of
shares
Market value Cost
Balance brought forward 5,351,157 351,879,402 98,172,291 5,612,467 450,319,617 105,722,427
Hotels and travels
Galadari Hotels PLC 7,000 74,200 60,075 7,000 93,800 60,075
Reefcomber PLC 168,714 2,766,910 4,029,412 168,714 3,340,537 4,029,412
Royal Palms Beach PLC 15,700 471,000 628,738 15,700 549,500 628,738
Taj Lanka Hotels PLC 19,500 585,000 182,097 19,500 507,000 182,097
Serendib Hotels PLC (Non - voting) 31,250 593,750 296,268 31,250 540,625 296,268
Dolphin Hotels PLC 20,000 844,000 275,131 20,000 660,000 275,131
Renuka City Hotels PLC 12,740 3,439,800 896,879 12,740 3,057,600 896,879
Tangerine Beach Hotels PLC 11,400 795,720 348,343 11,400 752,400 348,343 Hikkaduwa Beach Resort Limited 33,742 634,350 674,840 Nil Nil Nil
320,046 10,204,730 7,391,783 286,304 9,501,462 6,716,943
Power and energy
Lanka IOC PLC 174,600 6,809,400 5,417,806 174,600 3,561,840 5,417,806
Vallibel Power Erathna PLC 39,017 222,397 85,634 39,017 218,495 85,634
Vidullanka PLC 395,183 1,383,195 1,029,836 395,183 1,383,141 1,029,836
Hemas Power PLC 110,000 1,980,000 2,098,255 110,000 2,310,000 2,098,255
Panasian Power PLC 29,200 67,160 87,600 29,200 84,680 87,600
748,000 10,462,152 8,719,131 748,000 7,558,156 8,719,131
Land and property
York Arcade Holdings PLC 12,100 157,300 1,301 12,100 181,500 1,301
C T Land Development PLC 2,000 58,400 13,740 2,000 50,000 13,740
East West Properties PLC 48,000 556,800 338,143 48,000 624,000 338,143
Colombo Land & Development
Company PLC 522,460 19,017,544 4,782,684 522,460 16,614,228 4,782,684
Equity Two PLC 25,200 756,000 217,016 25,200 604,800 217,016
Touchwood Investments PLC 600,000 1,620,000 10,602,116 600,000 3,540,000 10,602,116
Property Development PLC 8,000 540,800 132,712 8,000 423,200 132,712
1,217,760 22,706,844 16,087,712 1,217,760 22,037,728 16,087,712
Balance carried forward 7,636,963 395,253,128 130,370,917 7,864,531 489,416,963 137,246,213
(e) Financial assets at FVTPL
Listed Shares
(all amounts in Sri Lanka Rupees unless otherwise stated)
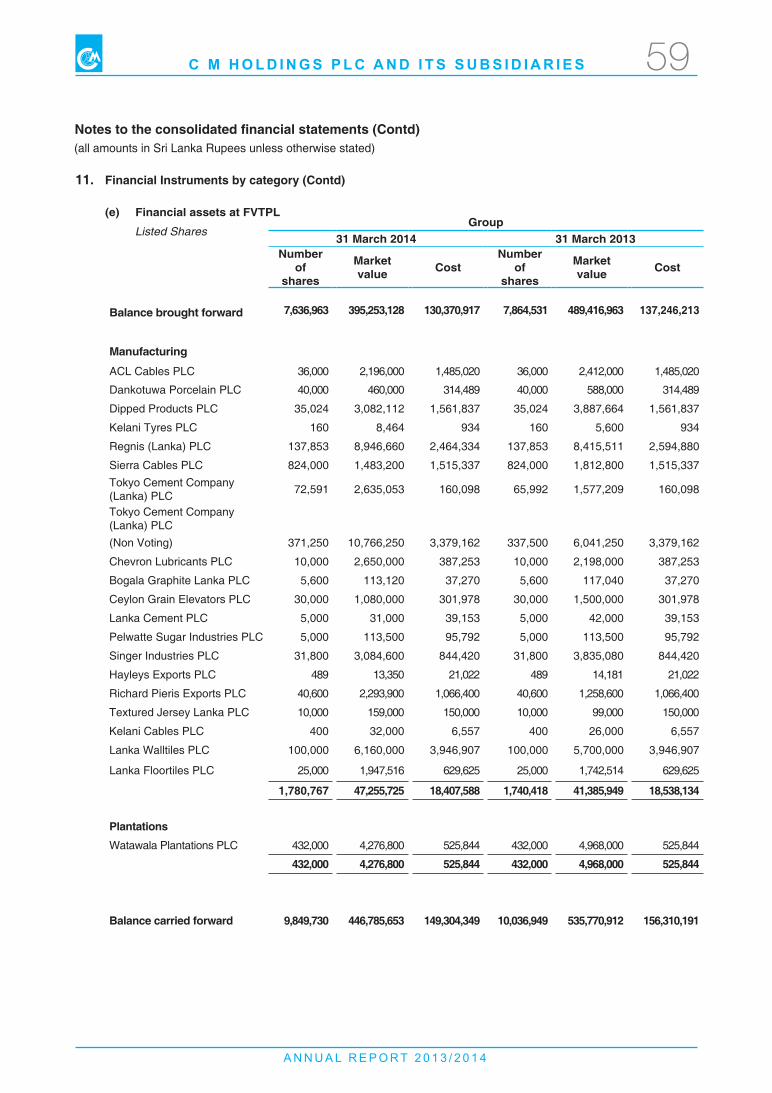
A N N U A L R E P O R T 2 0 1 3 / 2 0 1 4
C M H O L D I N G S P L C A N D I T S S U B S I D I A R I E S 59
11. Financial Instruments by category (Contd)
Group31 March 2014 31 March 2013
Number of
shares
Market value Cost
Number of
shares
Market value Cost
Balance brought forward 7,636,963 395,253,128 130,370,917 7,864,531 489,416,963 137,246,213
Manufacturing
ACL Cables PLC 36,000 2,196,000 1,485,020 36,000 2,412,000 1,485,020
Dankotuwa Porcelain PLC 40,000 460,000 314,489 40,000 588,000 314,489
Dipped Products PLC 35,024 3,082,112 1,561,837 35,024 3,887,664 1,561,837
Kelani Tyres PLC 160 8,464 934 160 5,600 934
Regnis (Lanka) PLC 137,853 8,946,660 2,464,334 137,853 8,415,511 2,594,880
Sierra Cables PLC 824,000 1,483,200 1,515,337 824,000 1,812,800 1,515,337 Tokyo Cement Company (Lanka) PLC 72,591 2,635,053 160,098 65,992 1,577,209 160,098
Tokyo Cement Company (Lanka) PLC (Non Voting) 371,250 10,766,250 3,379,162 337,500 6,041,250 3,379,162
Chevron Lubricants PLC 10,000 2,650,000 387,253 10,000 2,198,000 387,253
Bogala Graphite Lanka PLC 5,600 113,120 37,270 5,600 117,040 37,270
Ceylon Grain Elevators PLC 30,000 1,080,000 301,978 30,000 1,500,000 301,978
Lanka Cement PLC 5,000 31,000 39,153 5,000 42,000 39,153
Pelwatte Sugar Industries PLC 5,000 113,500 95,792 5,000 113,500 95,792
Singer Industries PLC 31,800 3,084,600 844,420 31,800 3,835,080 844,420
Hayleys Exports PLC 489 13,350 21,022 489 14,181 21,022
Richard Pieris Exports PLC 40,600 2,293,900 1,066,400 40,600 1,258,600 1,066,400
Textured Jersey Lanka PLC 10,000 159,000 150,000 10,000 99,000 150,000
Kelani Cables PLC 400 32,000 6,557 400 26,000 6,557
Lanka Walltiles PLC 100,000 6,160,000 3,946,907 100,000 5,700,000 3,946,907
Lanka Floortiles PLC 25,000 1,947,516 629,625 25,000 1,742,514 629,625
1,780,767 47,255,725 18,407,588 1,740,418 41,385,949 18,538,134
Plantations
Watawala Plantations PLC 432,000 4,276,800 525,844 432,000 4,968,000 525,844
432,000 4,276,800 525,844 432,000 4,968,000 525,844
Balance carried forward 9,849,730 446,785,653 149,304,349 10,036,949 535,770,912 156,310,191
(e) Financial assets at FVTPL
Listed Shares
Notes to the consolidated financial statements (Contd) (all amounts in Sri Lanka Rupees unless otherwise stated)
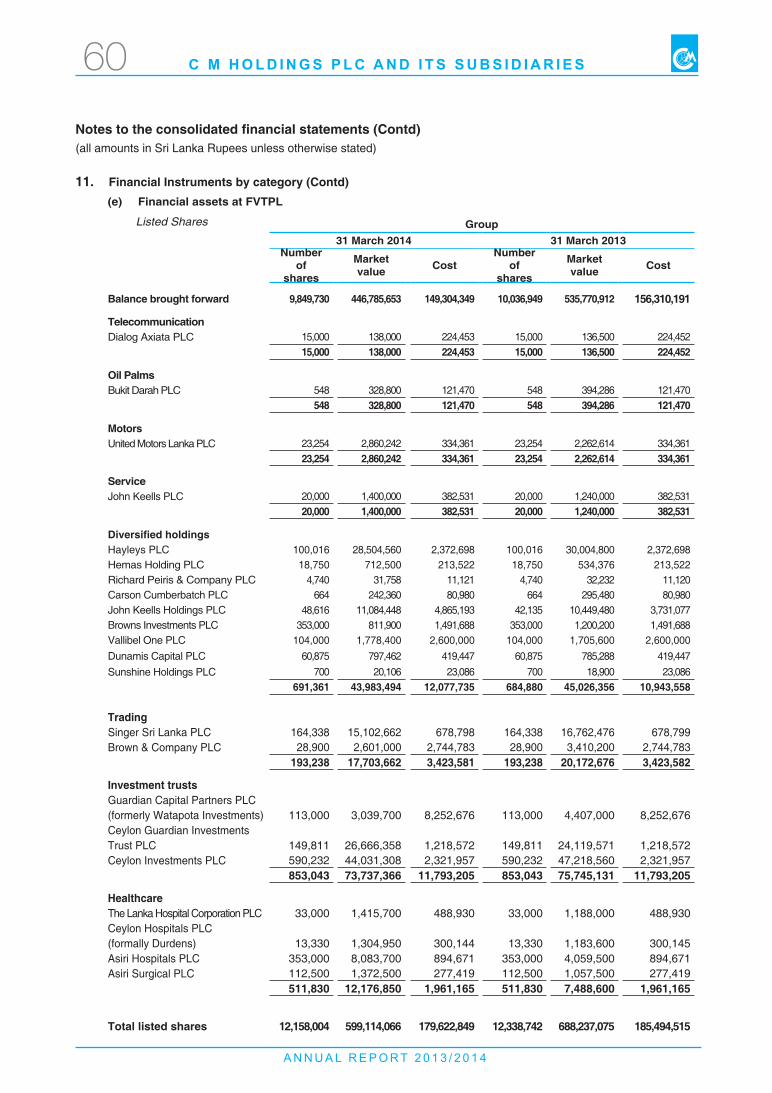
A N N U A L R E P O R T 2 0 1 3 / 2 0 1 4
C M H O L D I N G S P L C A N D I T S S U B S I D I A R I E S60
Notes to the consolidated financial statements (Contd)
Group31 March 2014 31 March 2013
Number of
shares
Market value Cost
Number of
shares
Market value Cost
Balance brought forward 9,849,730 446,785,653 149,304,349 10,036,949 535,770,912 156,310,191
TelecommunicationDialog Axiata PLC 15,000 138,000 224,453 15,000 136,500 224,452
15,000 138,000 224,453 15,000 136,500 224,452 Oil PalmsBukit Darah PLC 548 328,800 121,470 548 394,286 121,470
548 328,800 121,470 548 394,286 121,470
MotorsUnited Motors Lanka PLC 23,254 2,860,242 334,361 23,254 2,262,614 334,361
23,254 2,860,242 334,361 23,254 2,262,614 334,361
ServiceJohn Keells PLC 20,000 1,400,000 382,531 20,000 1,240,000 382,531
20,000 1,400,000 382,531 20,000 1,240,000 382,531
Diversified holdingsHayleys PLC 100,016 28,504,560 2,372,698 100,016 30,004,800 2,372,698 Hemas Holding PLC 18,750 712,500 213,522 18,750 534,376 213,522 Richard Peiris & Company PLC 4,740 31,758 11,121 4,740 32,232 11,120 Carson Cumberbatch PLC 664 242,360 80,980 664 295,480 80,980 John Keells Holdings PLC 48,616 11,084,448 4,865,193 42,135 10,449,480 3,731,077 Browns Investments PLC 353,000 811,900 1,491,688 353,000 1,200,200 1,491,688 Vallibel One PLC 104,000 1,778,400 2,600,000 104,000 1,705,600 2,600,000 Dunamis Capital PLC 60,875 797,462 419,447 60,875 785,288 419,447 Sunshine Holdings PLC 700 20,106 23,086 700 18,900 23,086
691,361 43,983,494 12,077,735 684,880 45,026,356 10,943,558
TradingSinger Sri Lanka PLC 164,338 15,102,662 678,798 164,338 16,762,476 678,799 Brown & Company PLC 28,900 2,601,000 2,744,783 28,900 3,410,200 2,744,783
193,238 17,703,662 3,423,581 193,238 20,172,676 3,423,582
Investment trustsGuardian Capital Partners PLC (formerly Watapota Investments) 113,000 3,039,700 8,252,676 113,000 4,407,000 8,252,676 Ceylon Guardian Investments Trust PLC 149,811 26,666,358 1,218,572 149,811 24,119,571 1,218,572 Ceylon Investments PLC 590,232 44,031,308 2,321,957 590,232 47,218,560 2,321,957
853,043 73,737,366 11,793,205 853,043 75,745,131 11,793,205
HealthcareThe Lanka Hospital Corporation PLC 33,000 1,415,700 488,930 33,000 1,188,000 488,930 Ceylon Hospitals PLC (formally Durdens) 13,330 1,304,950 300,144 13,330 1,183,600 300,145 Asiri Hospitals PLC 353,000 8,083,700 894,671 353,000 4,059,500 894,671 Asiri Surgical PLC 112,500 1,372,500 277,419 112,500 1,057,500 277,419
511,830 12,176,850 1,961,165 511,830 7,488,600 1,961,165
Total listed shares 12,158,004 599,114,066 179,622,849 12,338,742 688,237,075 185,494,515
11. Financial Instruments by category (Contd)(e) Financial assets at FVTPL
Listed Shares
(all amounts in Sri Lanka Rupees unless otherwise stated)
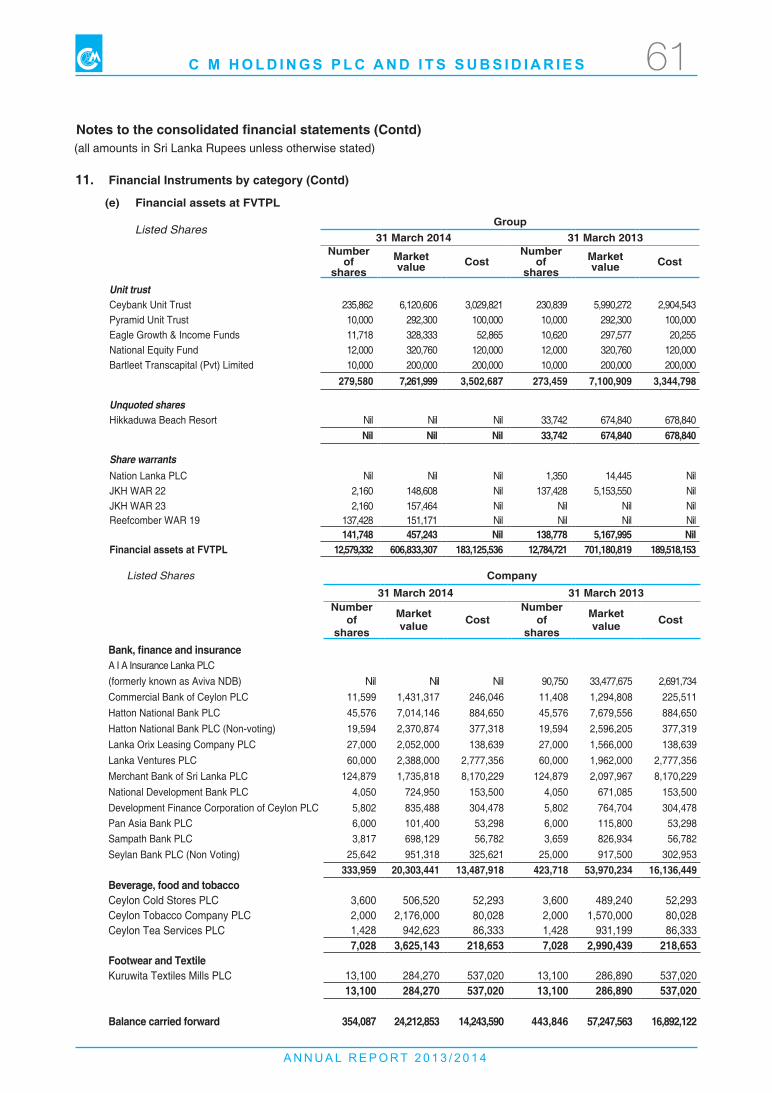
A N N U A L R E P O R T 2 0 1 3 / 2 0 1 4
C M H O L D I N G S P L C A N D I T S S U B S I D I A R I E S 61
Notes to the consolidated financial statements (Contd)
11. Financial Instruments by category (Contd)
Group31 March 2014 31 March 2013
Number of
sharesMarket value Cost
Number of
sharesMarket value Cost
Unit trustCeybank Unit Trust 235,862 6,120,606 3,029,821 230,839 5,990,272 2,904,543 Pyramid Unit Trust 10,000 292,300 100,000 10,000 292,300 100,000 Eagle Growth & Income Funds 11,718 328,333 52,865 10,620 297,577 20,255 National Equity Fund 12,000 320,760 120,000 12,000 320,760 120,000 Bartleet Transcapital (Pvt) Limited 10,000 200,000 200,000 10,000 200,000 200,000
279,580 7,261,999 3,502,687 273,459 7,100,909 3,344,798
Unquoted sharesHikkaduwa Beach Resort Nil Nil Nil 33,742 674,840 678,840
Nil Nil Nil 33,742 674,840 678,840
Share warrantsNation Lanka PLC Nil Nil Nil 1,350 14,445 Nil JKH WAR 22 2,160 148,608 Nil 137,428 5,153,550 Nil JKH WAR 23 2,160 157,464 Nil Nil Nil Nil Reefcomber WAR 19 137,428 151,171 Nil Nil Nil Nil
141,748 457,243 Nil 138,778 5,167,995 Nil Financial assets at FVTPL 12,579,332 606,833,307 183,125,536 12,784,721 701,180,819 189,518,153
(e) Financial assets at FVTPL
Listed Shares
Listed Shares Company31 March 2014 31 March 2013
Number of
shares
Market value Cost
Number of
shares
Market value Cost
Bank, finance and insuranceA I A Insurance Lanka PLC (formerly known as Aviva NDB) Nil Nil Nil 90,750 33,477,675 2,691,734 Commercial Bank of Ceylon PLC 11,599 1,431,317 246,046 11,408 1,294,808 225,511 Hatton National Bank PLC 45,576 7,014,146 884,650 45,576 7,679,556 884,650 Hatton National Bank PLC (Non-voting) 19,594 2,370,874 377,318 19,594 2,596,205 377,319 Lanka Orix Leasing Company PLC 27,000 2,052,000 138,639 27,000 1,566,000 138,639 Lanka Ventures PLC 60,000 2,388,000 2,777,356 60,000 1,962,000 2,777,356 Merchant Bank of Sri Lanka PLC 124,879 1,735,818 8,170,229 124,879 2,097,967 8,170,229 National Development Bank PLC 4,050 724,950 153,500 4,050 671,085 153,500 Development Finance Corporation of Ceylon PLC 5,802 835,488 304,478 5,802 764,704 304,478 Pan Asia Bank PLC 6,000 101,400 53,298 6,000 115,800 53,298 Sampath Bank PLC 3,817 698,129 56,782 3,659 826,934 56,782 Seylan Bank PLC (Non Voting) 25,642 951,318 325,621 25,000 917,500 302,953
333,959 20,303,441 13,487,918 423,718 53,970,234 16,136,449 Beverage, food and tobaccoCeylon Cold Stores PLC 3,600 506,520 52,293 3,600 489,240 52,293 Ceylon Tobacco Company PLC 2,000 2,176,000 80,028 2,000 1,570,000 80,028 Ceylon Tea Services PLC 1,428 942,623 86,333 1,428 931,199 86,333
7,028 3,625,143 218,653 7,028 2,990,439 218,653 Footwear and TextileKuruwita Textiles Mills PLC 13,100 284,270 537,020 13,100 286,890 537,020
13,100 284,270 537,020 13,100 286,890 537,020
Balance carried forward 354,087
24,212,853 14,243,590 443,846 57,247,563 16,892,122
(all amounts in Sri Lanka Rupees unless otherwise stated)
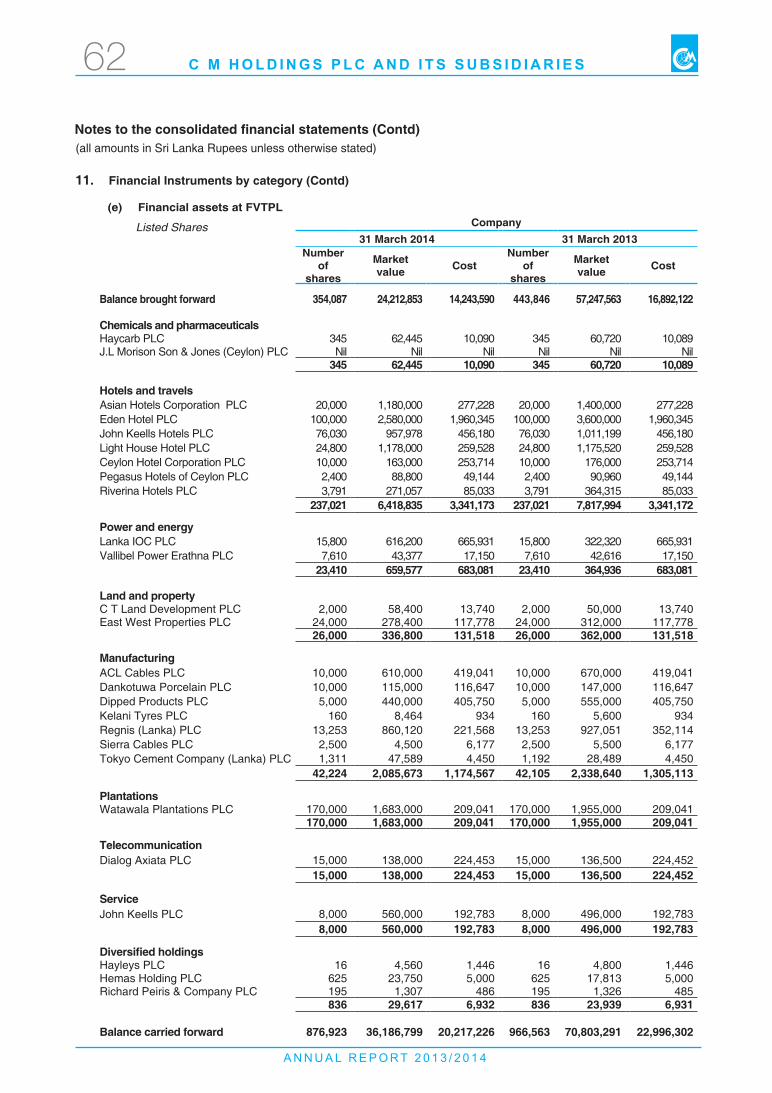
A N N U A L R E P O R T 2 0 1 3 / 2 0 1 4
C M H O L D I N G S P L C A N D I T S S U B S I D I A R I E S62
Notes to the consolidated financial statements (Contd)
11. Financial Instruments by category (Contd)
Company31 March 2014 31 March 2013
Number of
shares
Market value Cost
Number of
shares
Market value Cost
Balance brought forward 354,087
24,212,853 14,243,590 443,846 57,247,563 16,892,122
Chemicals and pharmaceuticalsHaycarb PLC 345 62,445 10,090 345 60,720 10,089 J.L Morison Son & Jones (Ceylon) PLC Nil Nil Nil Nil Nil Nil
345 62,445 10,090 345 60,720 10,089
Hotels and travelsAsian Hotels Corporation PLC 20,000 1,180,000 277,228 20,000 1,400,000 277,228 Eden Hotel PLC 100,000 2,580,000 1,960,345 100,000 3,600,000 1,960,345 John Keells Hotels PLC 76,030 957,978 456,180 76,030 1,011,199 456,180 Light House Hotel PLC 24,800 1,178,000 259,528 24,800 1,175,520 259,528 Ceylon Hotel Corporation PLC 10,000 163,000 253,714 10,000 176,000 253,714 Pegasus Hotels of Ceylon PLC 2,400 88,800 49,144 2,400 90,960 49,144 Riverina Hotels PLC 3,791 271,057 85,033 3,791 364,315 85,033
237,021 6,418,835 3,341,173 237,021 7,817,994 3,341,172
Power and energyLanka IOC PLC 15,800 616,200 665,931 15,800 322,320 665,931 Vallibel Power Erathna PLC 7,610 43,377 17,150 7,610 42,616 17,150
23,410 659,577 683,081 23,410 364,936 683,081
Land and propertyC T Land Development PLC 2,000 58,400 13,740 2,000 50,000 13,740 East West Properties PLC 24,000 278,400 117,778 24,000 312,000 117,778
26,000 336,800 131,518 26,000 362,000 131,518
ManufacturingACL Cables PLC 10,000 610,000 419,041 10,000 670,000 419,041 Dankotuwa Porcelain PLC 10,000 115,000 116,647 10,000 147,000 116,647 Dipped Products PLC 5,000 440,000 405,750 5,000 555,000 405,750 Kelani Tyres PLC 160 8,464 934 160 5,600 934 Regnis (Lanka) PLC 13,253 860,120 221,568 13,253 927,051 352,114 Sierra Cables PLC 2,500 4,500 6,177 2,500 5,500 6,177 Tokyo Cement Company (Lanka) PLC 1,311 47,589 4,450 1,192 28,489 4,450
42,224 2,085,673 1,174,567 42,105 2,338,640 1,305,113
PlantationsWatawala Plantations PLC 170,000 1,683,000 209,041 170,000 1,955,000 209,041
170,000 1,683,000 209,041 170,000 1,955,000 209,041
TelecommunicationDialog Axiata PLC 15,000 138,000 224,453 15,000 136,500 224,452
15,000 138,000 224,453 15,000 136,500 224,452 ServiceJohn Keells PLC 8,000 560,000 192,783 8,000 496,000 192,783
8,000 560,000 192,783 8,000 496,000 192,783
Diversified holdingsHayleys PLC 16 4,560 1,446 16 4,800 1,446 Hemas Holding PLC 625 23,750 5,000 625 17,813 5,000 Richard Peiris & Company PLC 195 1,307 486 195 1,326 485
836 29,617 6,932 836 23,939 6,931
Balance carried forward 876,923 36,186,799 20,217,226 966,563 70,803,291 22,996,302
(e) Financial assets at FVTPL
Listed Shares
(all amounts in Sri Lanka Rupees unless otherwise stated)
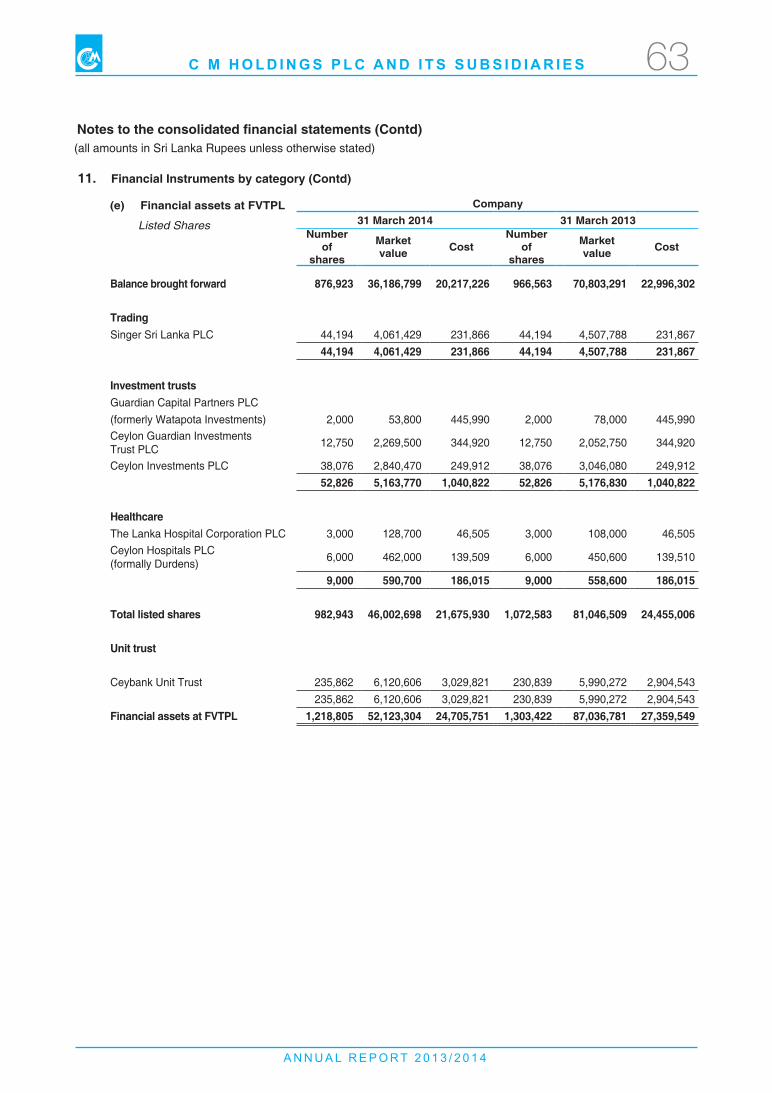
A N N U A L R E P O R T 2 0 1 3 / 2 0 1 4
C M H O L D I N G S P L C A N D I T S S U B S I D I A R I E S 63
Notes to the consolidated financial statements (Contd)
11. Financial Instruments by category (Contd)
Company31 March 2014 31 March 2013
Number of
shares
Market value Cost
Number of
shares
Market value Cost
Balance brought forward 876,923 36,186,799 20,217,226 966,563 70,803,291 22,996,302
TradingSinger Sri Lanka PLC 44,194 4,061,429 231,866 44,194 4,507,788 231,867
44,194 4,061,429 231,866 44,194 4,507,788 231,867
Investment trustsGuardian Capital Partners PLC (formerly Watapota Investments) 2,000 53,800 445,990 2,000 78,000 445,990 Ceylon Guardian Investments Trust PLC 12,750 2,269,500 344,920 12,750 2,052,750 344,920
Ceylon Investments PLC 38,076 2,840,470 249,912 38,076 3,046,080 249,912 52,826 5,163,770 1,040,822 52,826 5,176,830 1,040,822
HealthcareThe Lanka Hospital Corporation PLC 3,000 128,700 46,505 3,000 108,000 46,505 Ceylon Hospitals PLC(formally Durdens) 6,000 462,000 139,509 6,000 450,600 139,510
9,000 590,700 186,015 9,000 558,600 186,015
Total listed shares 982,943 46,002,698 21,675,930 1,072,583 81,046,509 24,455,006
unit trust
Ceybank Unit Trust 235,862 6,120,606 3,029,821 230,839 5,990,272 2,904,543 235,862 6,120,606 3,029,821 230,839 5,990,272 2,904,543
Financial assets at FVTPL 1,218,805 52,123,304 24,705,751 1,303,422 87,036,781 27,359,549
(e) Financial assets at FVTPL
Listed Shares
(all amounts in Sri Lanka Rupees unless otherwise stated)
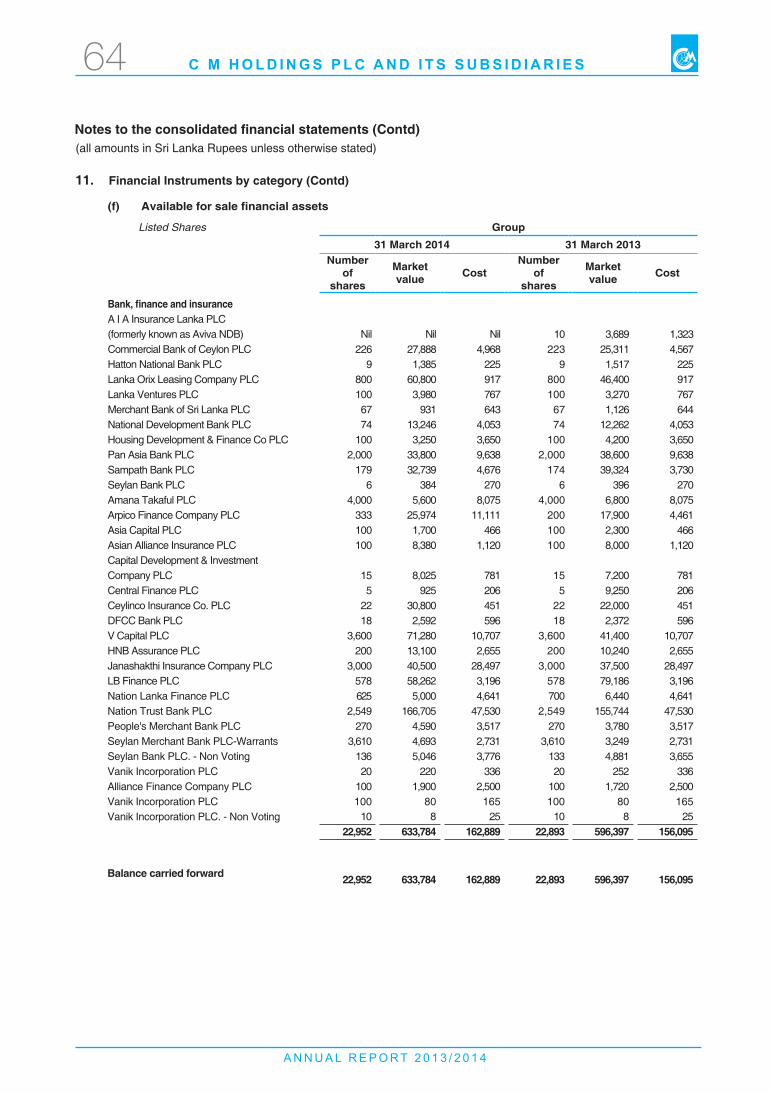
A N N U A L R E P O R T 2 0 1 3 / 2 0 1 4
C M H O L D I N G S P L C A N D I T S S U B S I D I A R I E S64
Notes to the consolidated financial statements (Contd)
11. Financial Instruments by category (Contd)
(f) Available for sale financial assets
Listed Shares Group31 March 2014 31 March 2013
Number of
shares
Market value Cost
Number of
shares
Market value Cost
Bank, finance and insuranceA I A Insurance Lanka PLC (formerly known as Aviva NDB) Nil Nil Nil 10 3,689 1,323 Commercial Bank of Ceylon PLC 226 27,888 4,968 223 25,311 4,567 Hatton National Bank PLC 9 1,385 225 9 1,517 225 Lanka Orix Leasing Company PLC 800 60,800 917 800 46,400 917 Lanka Ventures PLC 100 3,980 767 100 3,270 767 Merchant Bank of Sri Lanka PLC 67 931 643 67 1,126 644 National Development Bank PLC 74 13,246 4,053 74 12,262 4,053 Housing Development & Finance Co PLC 100 3,250 3,650 100 4,200 3,650 Pan Asia Bank PLC 2,000 33,800 9,638 2,000 38,600 9,638 Sampath Bank PLC 179 32,739 4,676 174 39,324 3,730 Seylan Bank PLC 6 384 270 6 396 270 Amana Takaful PLC 4,000 5,600 8,075 4,000 6,800 8,075 Arpico Finance Company PLC 333 25,974 11,111 200 17,900 4,461 Asia Capital PLC 100 1,700 466 100 2,300 466 Asian Alliance Insurance PLC 100 8,380 1,120 100 8,000 1,120 Capital Development & Investment Company PLC 15 8,025 781 15 7,200 781 Central Finance PLC 5 925 206 5 9,250 206 Ceylinco Insurance Co. PLC 22 30,800 451 22 22,000 451 DFCC Bank PLC 18 2,592 596 18 2,372 596 V Capital PLC 3,600 71,280 10,707 3,600 41,400 10,707 HNB Assurance PLC 200 13,100 2,655 200 10,240 2,655 Janashakthi Insurance Company PLC 3,000 40,500 28,497 3,000 37,500 28,497 LB Finance PLC 578 58,262 3,196 578 79,186 3,196 Nation Lanka Finance PLC 625 5,000 4,641 700 6,440 4,641 Nation Trust Bank PLC 2,549 166,705 47,530 2,549 155,744 47,530 People's Merchant Bank PLC 270 4,590 3,517 270 3,780 3,517 Seylan Merchant Bank PLC-Warrants 3,610 4,693 2,731 3,610 3,249 2,731 Seylan Bank PLC. - Non Voting 136 5,046 3,776 133 4,881 3,655 Vanik Incorporation PLC 20 220 336 20 252 336 Alliance Finance Company PLC 100 1,900 2,500 100 1,720 2,500 Vanik Incorporation PLC 100 80 165 100 80 165 Vanik Incorporation PLC. - Non Voting 10 8 25 10 8 25
22,952 633,784 162,889 22,893 596,397 156,095
Balance carried forward 22,952 633,784 162,889 22,893 596,397 156,095
(all amounts in Sri Lanka Rupees unless otherwise stated)
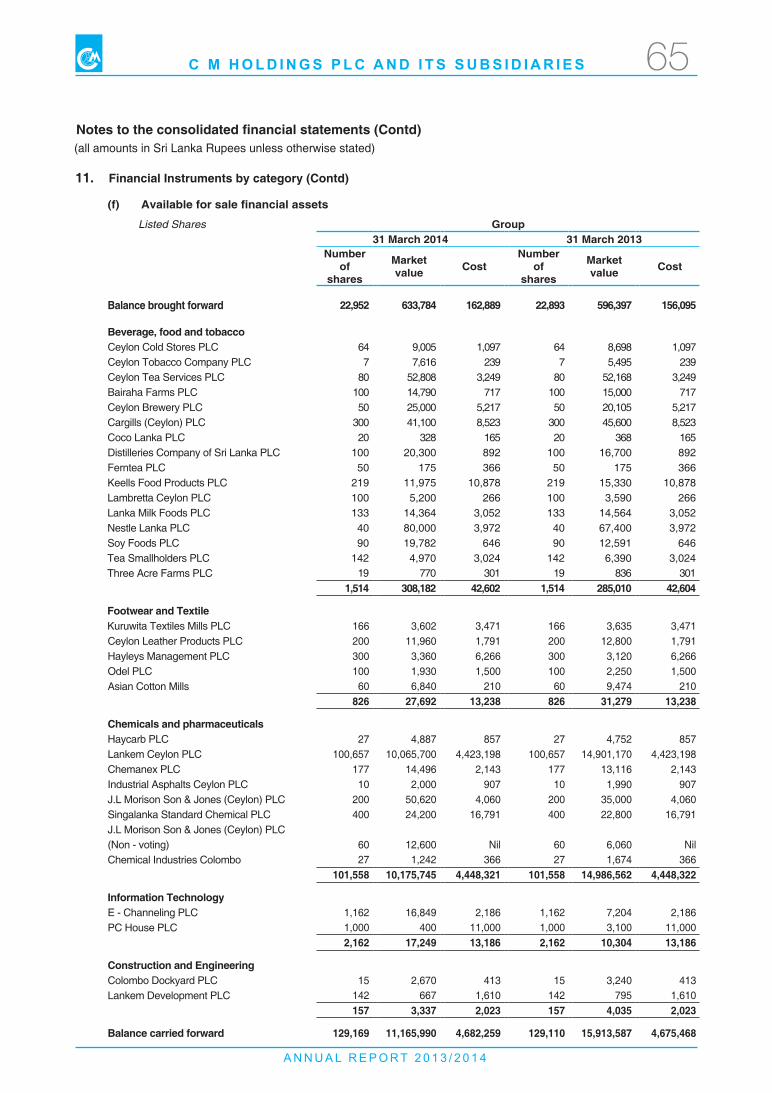
A N N U A L R E P O R T 2 0 1 3 / 2 0 1 4
C M H O L D I N G S P L C A N D I T S S U B S I D I A R I E S 65
11. Financial Instruments by category (Contd)
Notes to the consolidated financial statements (Contd)
(f) Available for sale financial assets
Listed Shares Group31 March 2014 31 March 2013
Number of
shares
Market value Cost
Number of
shares
Market value Cost
Balance brought forward 22,952 633,784 162,889 22,893 596,397 156,095
Beverage, food and tobaccoCeylon Cold Stores PLC 64 9,005 1,097 64 8,698 1,097 Ceylon Tobacco Company PLC 7 7,616 239 7 5,495 239 Ceylon Tea Services PLC 80 52,808 3,249 80 52,168 3,249 Bairaha Farms PLC 100 14,790 717 100 15,000 717 Ceylon Brewery PLC 50 25,000 5,217 50 20,105 5,217 Cargills (Ceylon) PLC 300 41,100 8,523 300 45,600 8,523 Coco Lanka PLC 20 328 165 20 368 165 Distilleries Company of Sri Lanka PLC 100 20,300 892 100 16,700 892 Ferntea PLC 50 175 366 50 175 366 Keells Food Products PLC 219 11,975 10,878 219 15,330 10,878 Lambretta Ceylon PLC 100 5,200 266 100 3,590 266 Lanka Milk Foods PLC 133 14,364 3,052 133 14,564 3,052 Nestle Lanka PLC 40 80,000 3,972 40 67,400 3,972 Soy Foods PLC 90 19,782 646 90 12,591 646 Tea Smallholders PLC 142 4,970 3,024 142 6,390 3,024 Three Acre Farms PLC 19 770 301 19 836 301
1,514 308,182 42,602 1,514 285,010 42,604
Footwear and TextileKuruwita Textiles Mills PLC 166 3,602 3,471 166 3,635 3,471 Ceylon Leather Products PLC 200 11,960 1,791 200 12,800 1,791 Hayleys Management PLC 300 3,360 6,266 300 3,120 6,266 Odel PLC 100 1,930 1,500 100 2,250 1,500 Asian Cotton Mills 60 6,840 210 60 9,474 210
826 27,692 13,238 826 31,279 13,238
Chemicals and pharmaceuticalsHaycarb PLC 27 4,887 857 27 4,752 857 Lankem Ceylon PLC 100,657 10,065,700 4,423,198 100,657 14,901,170 4,423,198 Chemanex PLC 177 14,496 2,143 177 13,116 2,143 Industrial Asphalts Ceylon PLC 10 2,000 907 10 1,990 907 J.L Morison Son & Jones (Ceylon) PLC 200 50,620 4,060 200 35,000 4,060 Singalanka Standard Chemical PLC 400 24,200 16,791 400 22,800 16,791 J.L Morison Son & Jones (Ceylon) PLC (Non - voting) 60 12,600 Nil 60 6,060 Nil Chemical Industries Colombo 27 1,242 366 27 1,674 366
101,558 10,175,745 4,448,321 101,558 14,986,562 4,448,322
Information TechnologyE - Channeling PLC 1,162 16,849 2,186 1,162 7,204 2,186 PC House PLC 1,000 400 11,000 1,000 3,100 11,000
2,162 17,249 13,186 2,162 10,304 13,186
Construction and EngineeringColombo Dockyard PLC 15 2,670 413 15 3,240 413 Lankem Development PLC 142 667 1,610 142 795 1,610
157 3,337 2,023 157 4,035 2,023
Balance carried forward 129,169 11,165,990 4,682,259 129,110 15,913,587 4,675,468
(all amounts in Sri Lanka Rupees unless otherwise stated)
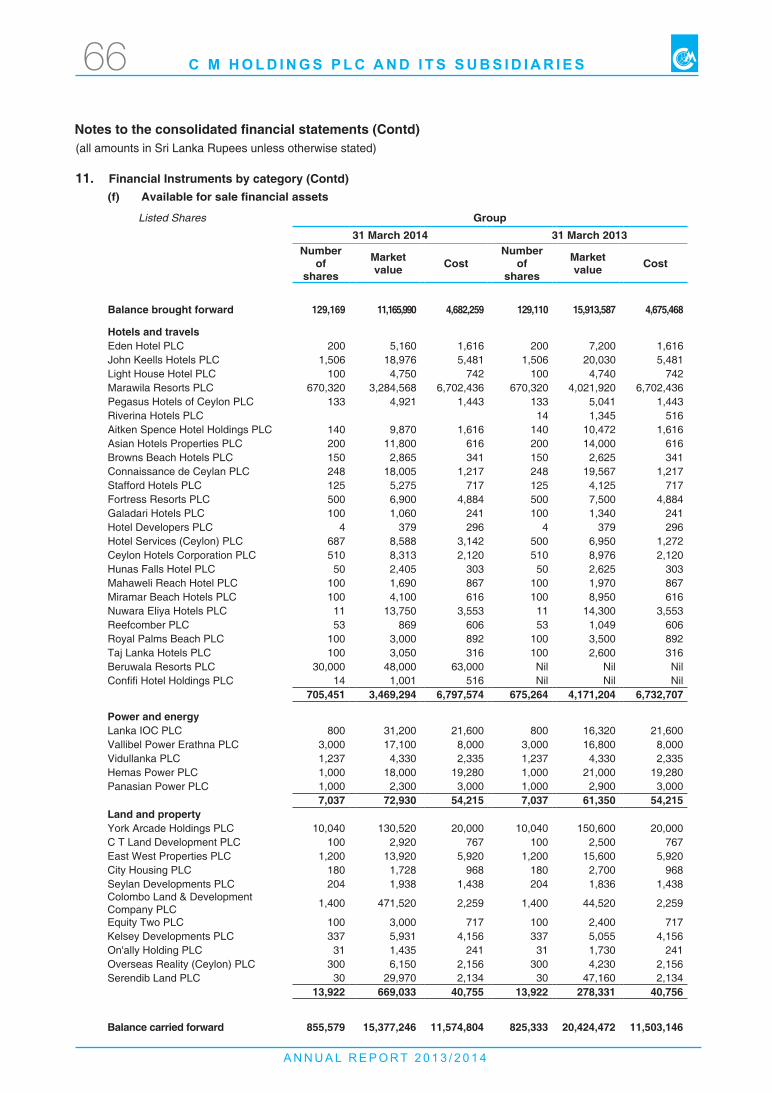
A N N U A L R E P O R T 2 0 1 3 / 2 0 1 4
C M H O L D I N G S P L C A N D I T S S U B S I D I A R I E S66
Notes to the consolidated financial statements (Contd)
11. Financial Instruments by category (Contd)(f) Available for sale financial assets
Listed Shares Group31 March 2014 31 March 2013
Number of
shares
Market value Cost
Number of
shares
Market value Cost
Balance brought forward 129,169 11,165,990 4,682,259 129,110 15,913,587 4,675,468
Hotels and travelsEden Hotel PLC 200 5,160 1,616 200 7,200 1,616 John Keells Hotels PLC 1,506 18,976 5,481 1,506 20,030 5,481 Light House Hotel PLC 100 4,750 742 100 4,740 742 Marawila Resorts PLC 670,320 3,284,568 6,702,436 670,320 4,021,920 6,702,436 Pegasus Hotels of Ceylon PLC 133 4,921 1,443 133 5,041 1,443 Riverina Hotels PLC 14 1,345 516 Aitken Spence Hotel Holdings PLC 140 9,870 1,616 140 10,472 1,616 Asian Hotels Properties PLC 200 11,800 616 200 14,000 616 Browns Beach Hotels PLC 150 2,865 341 150 2,625 341 Connaissance de Ceylan PLC 248 18,005 1,217 248 19,567 1,217 Stafford Hotels PLC 125 5,275 717 125 4,125 717 Fortress Resorts PLC 500 6,900 4,884 500 7,500 4,884 Galadari Hotels PLC 100 1,060 241 100 1,340 241 Hotel Developers PLC 4 379 296 4 379 296 Hotel Services (Ceylon) PLC 687 8,588 3,142 500 6,950 1,272 Ceylon Hotels Corporation PLC 510 8,313 2,120 510 8,976 2,120 Hunas Falls Hotel PLC 50 2,405 303 50 2,625 303 Mahaweli Reach Hotel PLC 100 1,690 867 100 1,970 867 Miramar Beach Hotels PLC 100 4,100 616 100 8,950 616 Nuwara Eliya Hotels PLC 11 13,750 3,553 11 14,300 3,553 Reefcomber PLC 53 869 606 53 1,049 606 Royal Palms Beach PLC 100 3,000 892 100 3,500 892 Taj Lanka Hotels PLC 100 3,050 316 100 2,600 316 Beruwala Resorts PLC 30,000 48,000 63,000 Nil Nil Nil Confifi Hotel Holdings PLC 14 1,001 516 Nil Nil Nil
705,451 3,469,294 6,797,574 675,264 4,171,204 6,732,707
Power and energyLanka IOC PLC 800 31,200 21,600 800 16,320 21,600 Vallibel Power Erathna PLC 3,000 17,100 8,000 3,000 16,800 8,000 Vidullanka PLC 1,237 4,330 2,335 1,237 4,330 2,335 Hemas Power PLC 1,000 18,000 19,280 1,000 21,000 19,280 Panasian Power PLC 1,000 2,300 3,000 1,000 2,900 3,000
7,037 72,930 54,215 7,037 61,350 54,215Land and propertyYork Arcade Holdings PLC 10,040 130,520 20,000 10,040 150,600 20,000 C T Land Development PLC 100 2,920 767 100 2,500 767 East West Properties PLC 1,200 13,920 5,920 1,200 15,600 5,920 City Housing PLC 180 1,728 968 180 2,700 968 Seylan Developments PLC 204 1,938 1,438 204 1,836 1,438 Colombo Land & Development Company PLC 1,400 471,520 2,259 1,400 44,520 2,259
Equity Two PLC 100 3,000 717 100 2,400 717 Kelsey Developments PLC 337 5,931 4,156 337 5,055 4,156 On'ally Holding PLC 31 1,435 241 31 1,730 241 Overseas Reality (Ceylon) PLC 300 6,150 2,156 300 4,230 2,156 Serendib Land PLC 30 29,970 2,134 30 47,160 2,134
13,922 669,033 40,755 13,922 278,331 40,756
Balance carried forward 855,579 15,377,246 11,574,804 825,333 20,424,472 11,503,146
(all amounts in Sri Lanka Rupees unless otherwise stated)
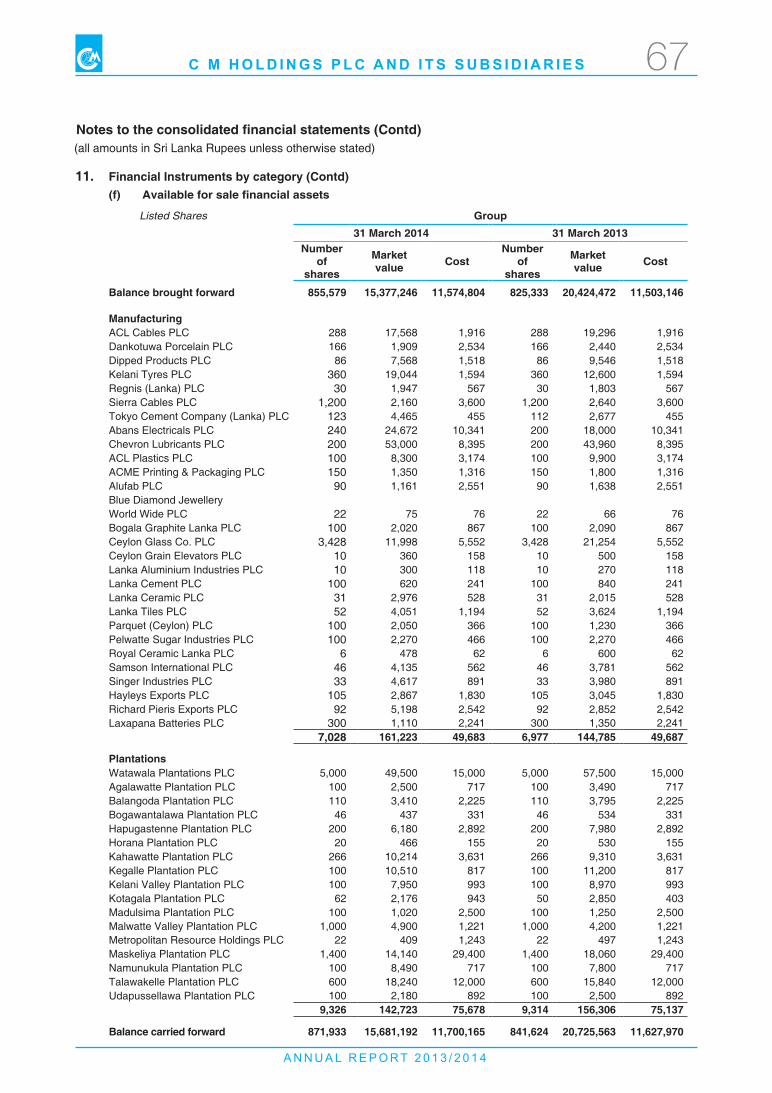
A N N U A L R E P O R T 2 0 1 3 / 2 0 1 4
C M H O L D I N G S P L C A N D I T S S U B S I D I A R I E S 67
11. Financial Instruments by category (Contd)
Notes to the consolidated financial statements (Contd)
(f) Available for sale financial assets
Listed Shares Group31 March 2014 31 March 2013
Number of
shares
Market value Cost
Number of
shares
Market value Cost
Balance brought forward 855,579 15,377,246 11,574,804 825,333 20,424,472 11,503,146
ManufacturingACL Cables PLC 288 17,568 1,916 288 19,296 1,916 Dankotuwa Porcelain PLC 166 1,909 2,534 166 2,440 2,534 Dipped Products PLC 86 7,568 1,518 86 9,546 1,518 Kelani Tyres PLC 360 19,044 1,594 360 12,600 1,594 Regnis (Lanka) PLC 30 1,947 567 30 1,803 567 Sierra Cables PLC 1,200 2,160 3,600 1,200 2,640 3,600 Tokyo Cement Company (Lanka) PLC 123 4,465 455 112 2,677 455 Abans Electricals PLC 240 24,672 10,341 200 18,000 10,341 Chevron Lubricants PLC 200 53,000 8,395 200 43,960 8,395 ACL Plastics PLC 100 8,300 3,174 100 9,900 3,174 ACME Printing & Packaging PLC 150 1,350 1,316 150 1,800 1,316 Alufab PLC 90 1,161 2,551 90 1,638 2,551 Blue Diamond Jewellery World Wide PLC 22 75 76 22 66 76 Bogala Graphite Lanka PLC 100 2,020 867 100 2,090 867 Ceylon Glass Co. PLC 3,428 11,998 5,552 3,428 21,254 5,552 Ceylon Grain Elevators PLC 10 360 158 10 500 158 Lanka Aluminium Industries PLC 10 300 118 10 270 118 Lanka Cement PLC 100 620 241 100 840 241 Lanka Ceramic PLC 31 2,976 528 31 2,015 528 Lanka Tiles PLC 52 4,051 1,194 52 3,624 1,194 Parquet (Ceylon) PLC 100 2,050 366 100 1,230 366 Pelwatte Sugar Industries PLC 100 2,270 466 100 2,270 466 Royal Ceramic Lanka PLC 6 478 62 6 600 62 Samson International PLC 46 4,135 562 46 3,781 562 Singer Industries PLC 33 4,617 891 33 3,980 891 Hayleys Exports PLC 105 2,867 1,830 105 3,045 1,830 Richard Pieris Exports PLC 92 5,198 2,542 92 2,852 2,542 Laxapana Batteries PLC 300 1,110 2,241 300 1,350 2,241
7,028 161,223 49,683 6,977 144,785 49,687
PlantationsWatawala Plantations PLC 5,000 49,500 15,000 5,000 57,500 15,000 Agalawatte Plantation PLC 100 2,500 717 100 3,490 717 Balangoda Plantation PLC 110 3,410 2,225 110 3,795 2,225 Bogawantalawa Plantation PLC 46 437 331 46 534 331 Hapugastenne Plantation PLC 200 6,180 2,892 200 7,980 2,892 Horana Plantation PLC 20 466 155 20 530 155 Kahawatte Plantation PLC 266 10,214 3,631 266 9,310 3,631 Kegalle Plantation PLC 100 10,510 817 100 11,200 817 Kelani Valley Plantation PLC 100 7,950 993 100 8,970 993 Kotagala Plantation PLC 62 2,176 943 50 2,850 403 Madulsima Plantation PLC 100 1,020 2,500 100 1,250 2,500 Malwatte Valley Plantation PLC 1,000 4,900 1,221 1,000 4,200 1,221 Metropolitan Resource Holdings PLC 22 409 1,243 22 497 1,243 Maskeliya Plantation PLC 1,400 14,140 29,400 1,400 18,060 29,400 Namunukula Plantation PLC 100 8,490 717 100 7,800 717 Talawakelle Plantation PLC 600 18,240 12,000 600 15,840 12,000 Udapussellawa Plantation PLC 100 2,180 892 100 2,500 892
9,326 142,723 75,678 9,314 156,306 75,137
Balance carried forward 871,933 15,681,192 11,700,165 841,624 20,725,563 11,627,970
(all amounts in Sri Lanka Rupees unless otherwise stated)
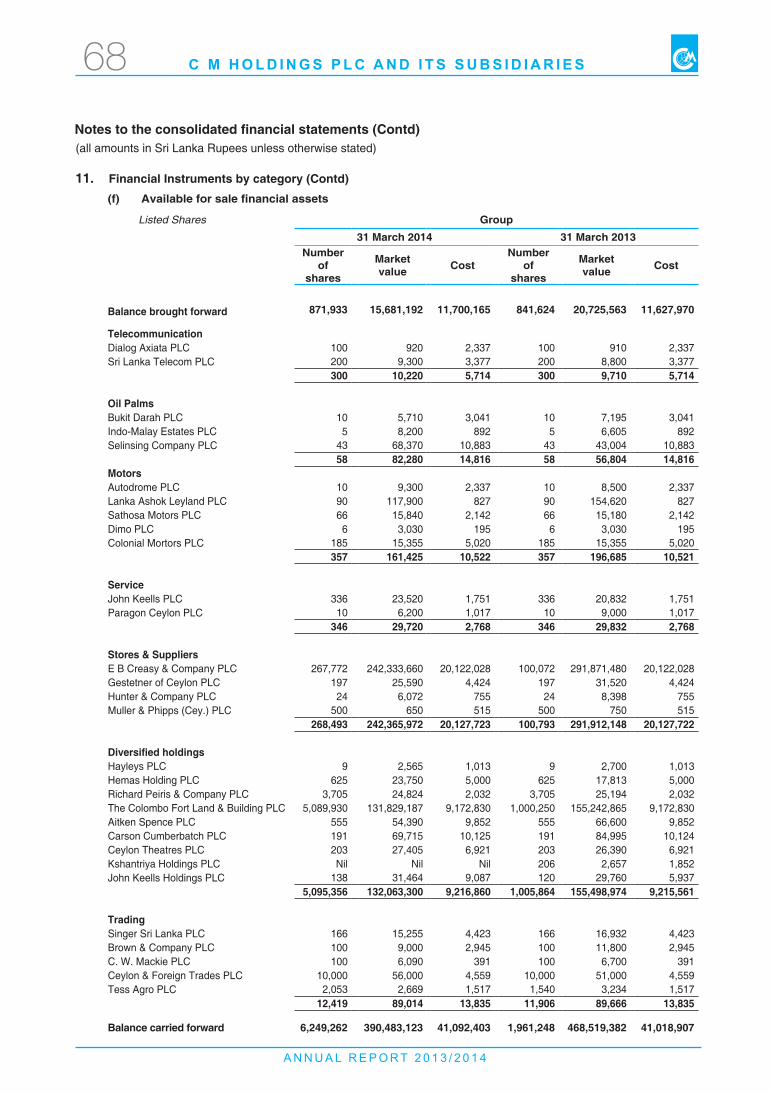
A N N U A L R E P O R T 2 0 1 3 / 2 0 1 4
C M H O L D I N G S P L C A N D I T S S U B S I D I A R I E S68
11. Financial Instruments by category (Contd)
Notes to the consolidated financial statements (Contd)
(f) Available for sale financial assets
Listed Shares Group31 March 2014 31 March 2013
Number of
shares
Market value Cost
Number of
shares
Market value Cost
Balance brought forward 871,933 15,681,192 11,700,165 841,624 20,725,563 11,627,970
TelecommunicationDialog Axiata PLC 100 920 2,337 100 910 2,337 Sri Lanka Telecom PLC 200 9,300 3,377 200 8,800 3,377
300 10,220 5,714 300 9,710 5,714 Oil PalmsBukit Darah PLC 10 5,710 3,041 10 7,195 3,041 Indo-Malay Estates PLC 5 8,200 892 5 6,605 892 Selinsing Company PLC 43 68,370 10,883 43 43,004 10,883
58 82,280 14,816 58 56,804 14,816 MotorsAutodrome PLC 10 9,300 2,337 10 8,500 2,337 Lanka Ashok Leyland PLC 90 117,900 827 90 154,620 827 Sathosa Motors PLC 66 15,840 2,142 66 15,180 2,142 Dimo PLC 6 3,030 195 6 3,030 195 Colonial Mortors PLC 185 15,355 5,020 185 15,355 5,020
357 161,425 10,522 357 196,685 10,521
ServiceJohn Keells PLC 336 23,520 1,751 336 20,832 1,751 Paragon Ceylon PLC 10 6,200 1,017 10 9,000 1,017
346 29,720 2,768 346 29,832 2,768
Stores & SuppliersE B Creasy & Company PLC 267,772 242,333,660 20,122,028 100,072 291,871,480 20,122,028 Gestetner of Ceylon PLC 197 25,590 4,424 197 31,520 4,424 Hunter & Company PLC 24 6,072 755 24 8,398 755 Muller & Phipps (Cey.) PLC 500 650 515 500 750 515
268,493 242,365,972 20,127,723 100,793 291,912,148 20,127,722
Diversified holdingsHayleys PLC 9 2,565 1,013 9 2,700 1,013 Hemas Holding PLC 625 23,750 5,000 625 17,813 5,000 Richard Peiris & Company PLC 3,705 24,824 2,032 3,705 25,194 2,032 The Colombo Fort Land & Building PLC 5,089,930 131,829,187 9,172,830 1,000,250 155,242,865 9,172,830 Aitken Spence PLC 555 54,390 9,852 555 66,600 9,852 Carson Cumberbatch PLC 191 69,715 10,125 191 84,995 10,124 Ceylon Theatres PLC 203 27,405 6,921 203 26,390 6,921 Kshantriya Holdings PLC Nil Nil Nil 206 2,657 1,852 John Keells Holdings PLC 138 31,464 9,087 120 29,760 5,937
5,095,356 132,063,300 9,216,860 1,005,864 155,498,974 9,215,561
TradingSinger Sri Lanka PLC 166 15,255 4,423 166 16,932 4,423 Brown & Company PLC 100 9,000 2,945 100 11,800 2,945 C. W. Mackie PLC 100 6,090 391 100 6,700 391 Ceylon & Foreign Trades PLC 10,000 56,000 4,559 10,000 51,000 4,559 Tess Agro PLC 2,053 2,669 1,517 1,540 3,234 1,517
12,419 89,014 13,835 11,906 89,666 13,835
Balance carried forward 6,249,262 390,483,123 41,092,403 1,961,248 468,519,382 41,018,907
(all amounts in Sri Lanka Rupees unless otherwise stated)
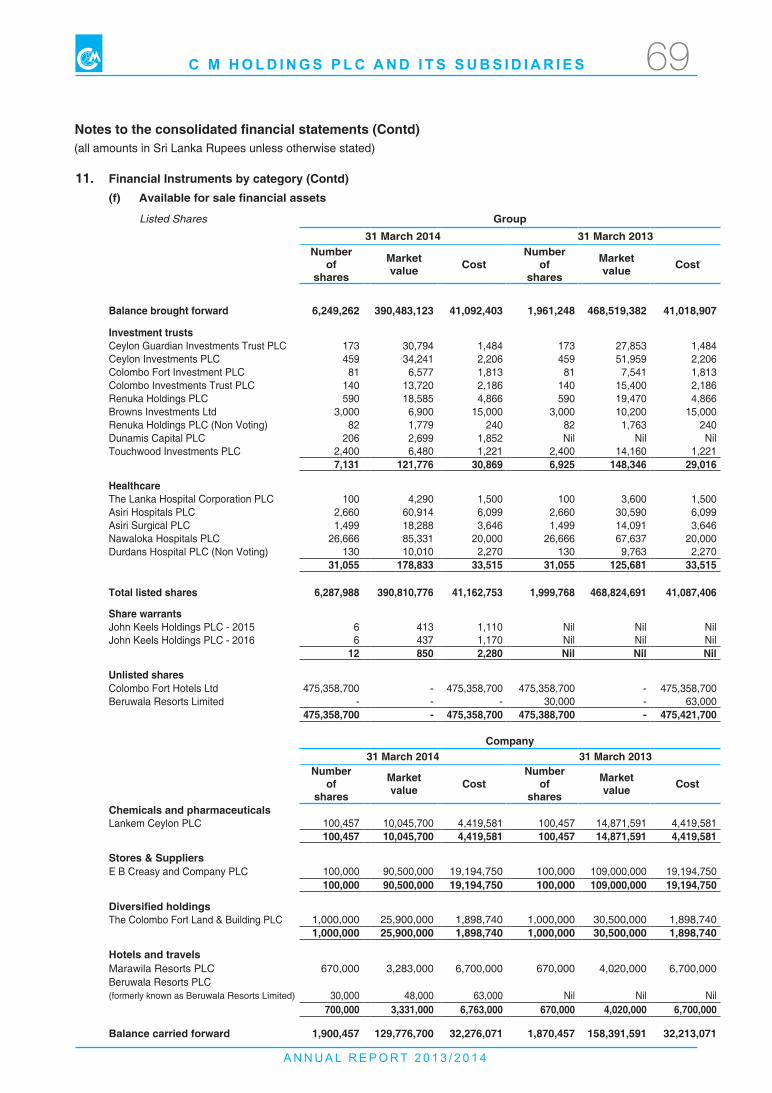
A N N U A L R E P O R T 2 0 1 3 / 2 0 1 4
C M H O L D I N G S P L C A N D I T S S U B S I D I A R I E S 69
11. Financial Instruments by category (Contd)
Notes to the consolidated financial statements (Contd)
(f) Available for sale financial assets
Listed Shares Group31 March 2014 31 March 2013
Number of
shares
Market value Cost
Number of
shares
Market value Cost
Balance brought forward 6,249,262 390,483,123 41,092,403 1,961,248 468,519,382 41,018,907
Investment trustsCeylon Guardian Investments Trust PLC 173 30,794 1,484 173 27,853 1,484 Ceylon Investments PLC 459 34,241 2,206 459 51,959 2,206 Colombo Fort Investment PLC 81 6,577 1,813 81 7,541 1,813 Colombo Investments Trust PLC 140 13,720 2,186 140 15,400 2,186 Renuka Holdings PLC 590 18,585 4,866 590 19,470 4,866 Browns Investments Ltd 3,000 6,900 15,000 3,000 10,200 15,000 Renuka Holdings PLC (Non Voting) 82 1,779 240 82 1,763 240 Dunamis Capital PLC 206 2,699 1,852 Nil Nil Nil Touchwood Investments PLC 2,400 6,480 1,221 2,400 14,160 1,221
7,131 121,776 30,869 6,925 148,346 29,016
HealthcareThe Lanka Hospital Corporation PLC 100 4,290 1,500 100 3,600 1,500 Asiri Hospitals PLC 2,660 60,914 6,099 2,660 30,590 6,099 Asiri Surgical PLC 1,499 18,288 3,646 1,499 14,091 3,646 Nawaloka Hospitals PLC 26,666 85,331 20,000 26,666 67,637 20,000 Durdans Hospital PLC (Non Voting) 130 10,010 2,270 130 9,763 2,270
31,055 178,833 33,515 31,055 125,681 33,515
Total listed shares 6,287,988 390,810,776 41,162,753 1,999,768 468,824,691 41,087,406
Share warrantsJohn Keels Holdings PLC - 2015 6 413 1,110 Nil Nil Nil John Keels Holdings PLC - 2016 6 437 1,170 Nil Nil Nil
12 850 2,280 Nil Nil Nil
unlisted sharesColombo Fort Hotels Ltd 475,358,700 - 475,358,700 475,358,700 - 475,358,700 Beruwala Resorts Limited - - - 30,000 - 63,000
475,358,700 - 475,358,700 475,388,700 - 475,421,700
Company31 March 2014 31 March 2013
Number of
shares
Market value Cost
Number of
shares
Market value Cost
Chemicals and pharmaceuticalsLankem Ceylon PLC 100,457 10,045,700 4,419,581 100,457 14,871,591 4,419,581
100,457 10,045,700 4,419,581 100,457 14,871,591 4,419,581
Stores & SuppliersE B Creasy and Company PLC 100,000 90,500,000 19,194,750 100,000 109,000,000 19,194,750
100,000 90,500,000 19,194,750 100,000 109,000,000 19,194,750
Diversified holdingsThe Colombo Fort Land & Building PLC 1,000,000 25,900,000 1,898,740 1,000,000 30,500,000 1,898,740
1,000,000 25,900,000 1,898,740 1,000,000 30,500,000 1,898,740
Hotels and travels Marawila Resorts PLC 670,000 3,283,000 6,700,000 670,000 4,020,000 6,700,000 Beruwala Resorts PLC(formerly known as Beruwala Resorts Limited) 30,000 48,000 63,000 Nil Nil Nil
700,000 3,331,000 6,763,000 670,000 4,020,000 6,700,000
Balance carried forward 1,900,457 129,776,700 32,276,071 1,870,457 158,391,591 32,213,071
(all amounts in Sri Lanka Rupees unless otherwise stated)
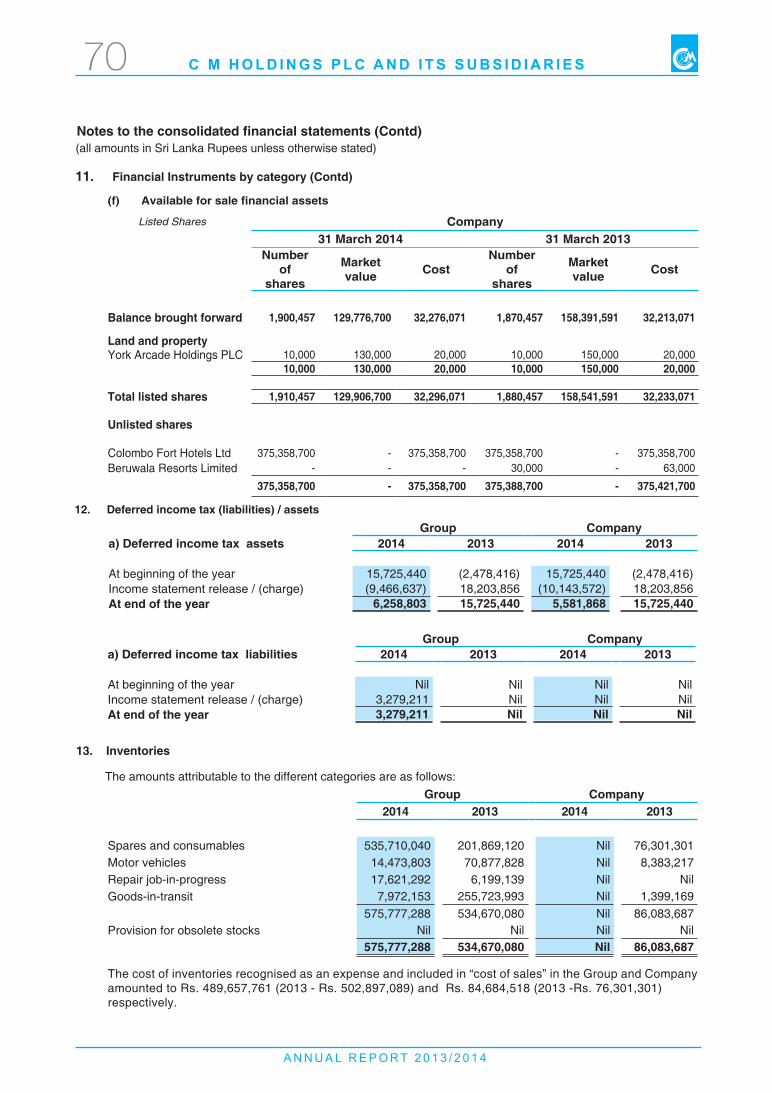
A N N U A L R E P O R T 2 0 1 3 / 2 0 1 4
C M H O L D I N G S P L C A N D I T S S U B S I D I A R I E S70
12. Deferred income tax (liabilities) / assets
13. Inventories
The amounts attributable to the different categories are as follows:
Group Companya) Deferred income tax assets 2014 2013 2014 2013
At beginning of the year 15,725,440 (2,478,416) 15,725,440 (2,478,416)Income statement release / (charge) (9,466,637) 18,203,856 (10,143,572) 18,203,856 At end of the year 6,258,803 15,725,440 5,581,868 15,725,440
Group Companya) Deferred income tax liabilities 2014 2013 2014 2013
At beginning of the year Nil Nil Nil NilIncome statement release / (charge) 3,279,211 Nil Nil NilAt end of the year 3,279,211 Nil Nil Nil
Group Company2014 2013 2014 2013
Spares and consumables 535,710,040 201,869,120 Nil 76,301,301 Motor vehicles 14,473,803 70,877,828 Nil 8,383,217 Repair job-in-progress 17,621,292 6,199,139 Nil NilGoods-in-transit 7,972,153 255,723,993 Nil 1,399,169
575,777,288 534,670,080 Nil 86,083,687 Provision for obsolete stocks Nil Nil Nil Nil
575,777,288 534,670,080 Nil 86,083,687
The cost of inventories recognised as an expense and included in “cost of sales” in the Group and Company amounted to Rs. 489,657,761 (2013 - Rs. 502,897,089) and Rs. 84,684,518 (2013 -Rs. 76,301,301) respectively.
11. Financial Instruments by category (Contd)
(f) Available for sale financial assets
Listed Shares Company31 March 2014 31 March 2013
Number of
shares
Market value Cost
Number of
shares
Market value Cost
Balance brought forward 1,900,457 129,776,700 32,276,071 1,870,457 158,391,591 32,213,071
Land and propertyYork Arcade Holdings PLC 10,000 130,000 20,000 10,000 150,000 20,000
10,000 130,000 20,000 10,000 150,000 20,000
Total listed shares 1,910,457 129,906,700 32,296,071 1,880,457 158,541,591 32,233,071
unlisted shares
Colombo Fort Hotels Ltd 375,358,700 - 375,358,700 375,358,700 - 375,358,700 Beruwala Resorts Limited - - - 30,000 - 63,000
375,358,700 - 375,358,700 375,388,700 - 375,421,700
Notes to the consolidated financial statements (Contd) (all amounts in Sri Lanka Rupees unless otherwise stated)
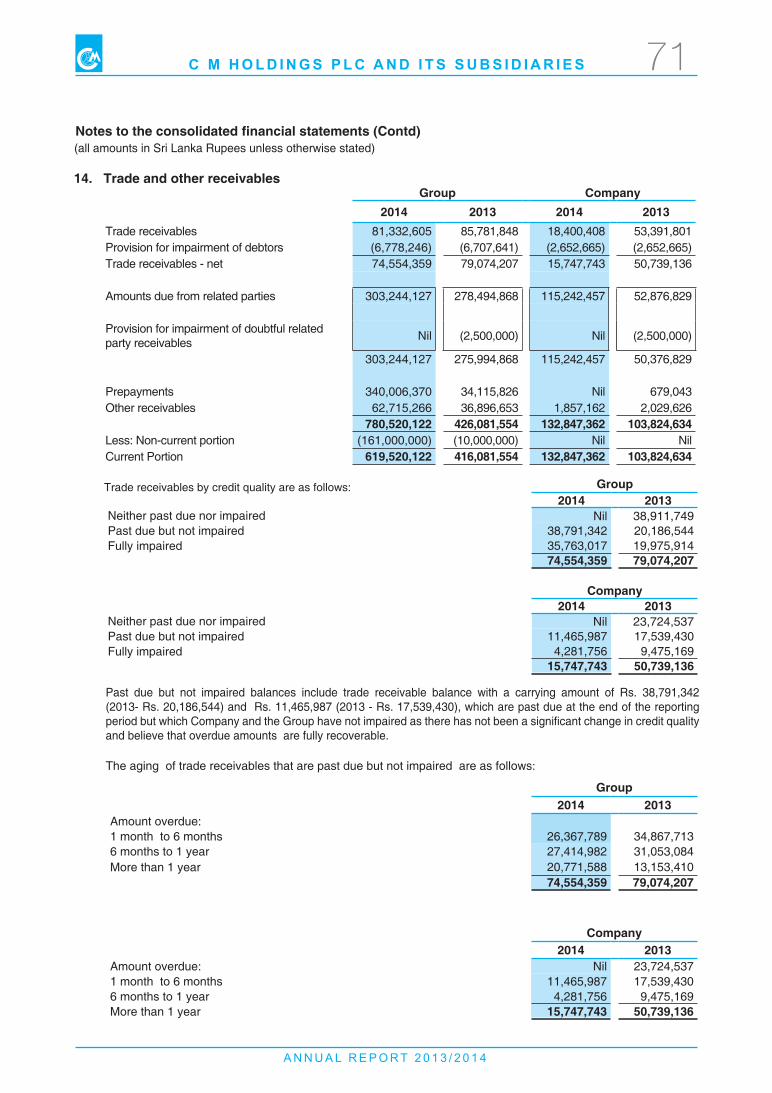
A N N U A L R E P O R T 2 0 1 3 / 2 0 1 4
C M H O L D I N G S P L C A N D I T S S U B S I D I A R I E S 71
Notes to the consolidated financial statements (Contd)
Trade receivables by credit quality are as follows: Group2014 2013
Neither past due nor impaired Nil 38,911,749 Past due but not impaired 38,791,342 20,186,544 Fully impaired 35,763,017 19,975,914
74,554,359 79,074,207
Company2014 2013
Neither past due nor impaired Nil 23,724,537 Past due but not impaired 11,465,987 17,539,430 Fully impaired 4,281,756 9,475,169
15,747,743 50,739,136
Group2014 2013
Amount overdue:1 month to 6 months 26,367,789 34,867,713 6 months to 1 year 27,414,982 31,053,084 More than 1 year 20,771,588 13,153,410
74,554,359 79,074,207
Company2014 2013
Amount overdue: Nil 23,724,5371 month to 6 months 11,465,987 17,539,430 6 months to 1 year 4,281,756 9,475,169 More than 1 year 15,747,743 50,739,136
Past due but not impaired balances include trade receivable balance with a carrying amount of Rs. 38,791,342 (2013- Rs. 20,186,544) and Rs. 11,465,987 (2013 - Rs. 17,539,430), which are past due at the end of the reporting period but which Company and the Group have not impaired as there has not been a significant change in credit quality and believe that overdue amounts are fully recoverable. The aging of trade receivables that are past due but not impaired are as follows:
(all amounts in Sri Lanka Rupees unless otherwise stated)
14. Trade and other receivablesGroup Company
2014 2013 2014 2013Trade receivables 81,332,605 85,781,848 18,400,408 53,391,801 Provision for impairment of debtors (6,778,246) (6,707,641) (2,652,665) (2,652,665)Trade receivables - net 74,554,359 79,074,207 15,747,743 50,739,136
Amounts due from related parties 303,244,127 278,494,868 115,242,457 52,876,829
Provision for impairment of doubtful related party receivables Nil (2,500,000) Nil (2,500,000)
303,244,127 275,994,868 115,242,457 50,376,829
Prepayments 340,006,370 34,115,826 Nil 679,043 Other receivables 62,715,266 36,896,653 1,857,162 2,029,626
780,520,122 426,081,554 132,847,362 103,824,634 Less: Non-current portion (161,000,000) (10,000,000) Nil NilCurrent Portion 619,520,122 416,081,554 132,847,362 103,824,634
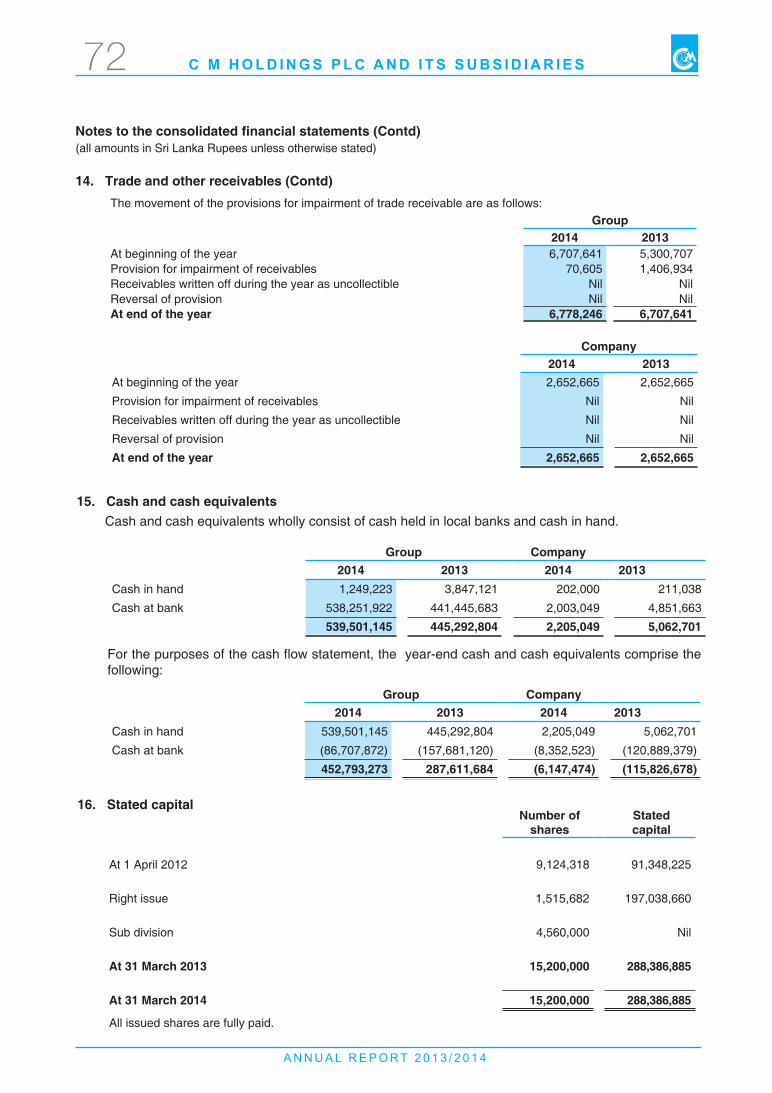
A N N U A L R E P O R T 2 0 1 3 / 2 0 1 4
C M H O L D I N G S P L C A N D I T S S U B S I D I A R I E S72
14. Trade and other receivables (Contd)
15. Cash and cash equivalents
Notes to the consolidated financial statements (Contd)
Company2014 2013
At beginning of the year 2,652,665 2,652,665
Provision for impairment of receivables Nil Nil
Receivables written off during the year as uncollectible Nil Nil
Reversal of provision Nil Nil
At end of the year 2,652,665 2,652,665
Cash and cash equivalents wholly consist of cash held in local banks and cash in hand.
For the purposes of the cash flow statement, the year-end cash and cash equivalents comprise the following:
Group Company2014 2013 2014 2013
Cash in hand 1,249,223 3,847,121 202,000 211,038
Cash at bank 538,251,922 441,445,683 2,003,049 4,851,663
539,501,145 445,292,804 2,205,049 5,062,701
Group Company2014 2013 2014 2013
Cash in hand 539,501,145 445,292,804 2,205,049 5,062,701
Cash at bank (86,707,872) (157,681,120) (8,352,523) (120,889,379)
452,793,273 287,611,684 (6,147,474) (115,826,678)
16. Stated capital Number of
shares Stated capital
At 1 April 2012 9,124,318 91,348,225
Right issue 1,515,682 197,038,660
Sub division 4,560,000 Nil
At 31 March 2013 15,200,000 288,386,885
At 31 March 2014 15,200,000 288,386,885
All issued shares are fully paid.
The movement of the provisions for impairment of trade receivable are as follows:Group
2014 2013At beginning of the year 6,707,641 5,300,707 Provision for impairment of receivables 70,605 1,406,934 Receivables written off during the year as uncollectible Nil Nil Reversal of provision Nil Nil At end of the year 6,778,246 6,707,641
(all amounts in Sri Lanka Rupees unless otherwise stated)
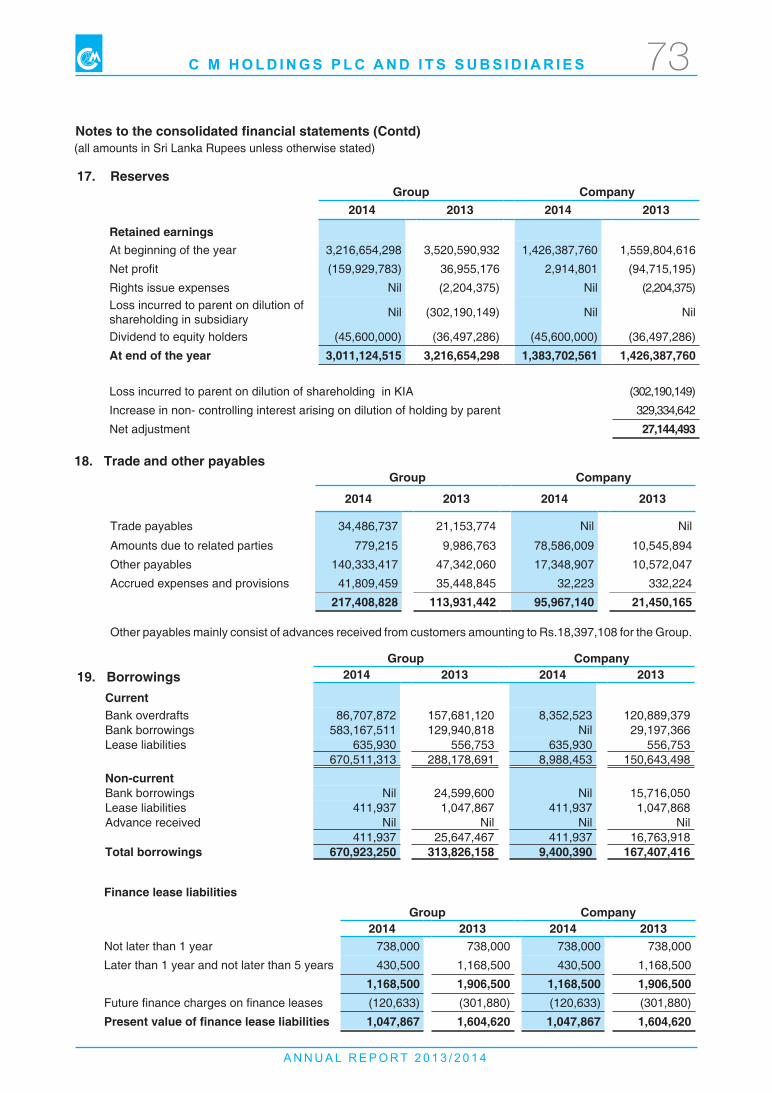
A N N U A L R E P O R T 2 0 1 3 / 2 0 1 4
C M H O L D I N G S P L C A N D I T S S U B S I D I A R I E S 73
Notes to the consolidated financial statements (Contd)
17. ReservesGroup Company
2014 2013 2014 2013
Retained earningsAt beginning of the year 3,216,654,298 3,520,590,932 1,426,387,760 1,559,804,616
Net profit (159,929,783) 36,955,176 2,914,801 (94,715,195)
Rights issue expenses Nil (2,204,375) Nil (2,204,375)Loss incurred to parent on dilution of shareholding in subsidiary Nil (302,190,149) Nil Nil
Dividend to equity holders (45,600,000) (36,497,286) (45,600,000) (36,497,286)
At end of the year 3,011,124,515 3,216,654,298 1,383,702,561 1,426,387,760
Loss incurred to parent on dilution of shareholding in KIA (302,190,149)
Increase in non- controlling interest arising on dilution of holding by parent 329,334,642
Net adjustment 27,144,493
18. Trade and other payablesGroup Company
2014 2013 2014 2013
Trade payables 34,486,737 21,153,774 Nil Nil
Amounts due to related parties 779,215 9,986,763 78,586,009 10,545,894
Other payables 140,333,417 47,342,060 17,348,907 10,572,047
Accrued expenses and provisions 41,809,459 35,448,845 32,223 332,224
217,408,828 113,931,442 95,967,140 21,450,165
Other payables mainly consist of advances received from customers amounting to Rs.18,397,108 for the Group.
19. BorrowingsGroup Company
2014 2013 2014 2013
Current Bank overdrafts 86,707,872 157,681,120 8,352,523 120,889,379 Bank borrowings 583,167,511 129,940,818 Nil 29,197,366 Lease liabilities 635,930 556,753 635,930 556,753
670,511,313 288,178,691 8,988,453 150,643,498
Non-currentBank borrowings Nil 24,599,600 Nil 15,716,050 Lease liabilities 411,937 1,047,867 411,937 1,047,868 Advance received Nil Nil Nil Nil
411,937 25,647,467 411,937 16,763,918 Total borrowings 670,923,250 313,826,158 9,400,390 167,407,416
(all amounts in Sri Lanka Rupees unless otherwise stated)
Finance lease liabilities
Group Company2014 2013 2014 2013
Not later than 1 year 738,000 738,000 738,000 738,000
Later than 1 year and not later than 5 years 430,500 1,168,500 430,500 1,168,500
1,168,500 1,906,500 1,168,500 1,906,500 Future finance charges on finance leases (120,633) (301,880) (120,633) (301,880)
Present value of finance lease liabilities 1,047,867 1,604,620 1,047,867 1,604,620
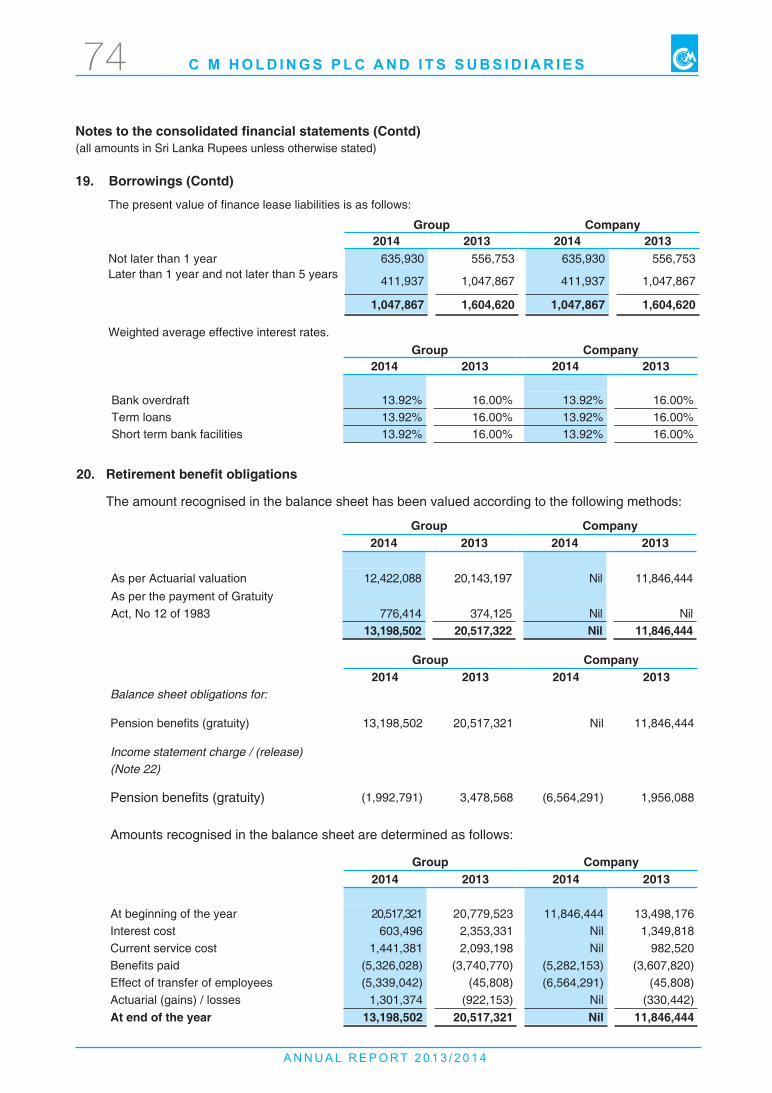
A N N U A L R E P O R T 2 0 1 3 / 2 0 1 4
C M H O L D I N G S P L C A N D I T S S U B S I D I A R I E S74
Notes to the consolidated financial statements (Contd)
Group Company2014 2013 2014 2013
Bank overdraft 13.92% 16.00% 13.92% 16.00%Term loans 13.92% 16.00% 13.92% 16.00%Short term bank facilities 13.92% 16.00% 13.92% 16.00%
20. Retirement benefit obligations
The amount recognised in the balance sheet has been valued according to the following methods:
Group Company2014 2013 2014 2013
As per Actuarial valuation 12,422,088 20,143,197 Nil 11,846,444 As per the payment of Gratuity Act, No 12 of 1983 776,414 374,125 Nil Nil
13,198,502 20,517,322 Nil 11,846,444
Group Company2014 2013 2014 2013
Balance sheet obligations for:
Pension benefits (gratuity) 13,198,502 20,517,321 Nil 11,846,444
Income statement charge / (release)(Note 22)
Pension benefits (gratuity) (1,992,791) 3,478,568 (6,564,291) 1,956,088
Amounts recognised in the balance sheet are determined as follows:
Group Company2014 2013 2014 2013
At beginning of the year 20,517,321 20,779,523 11,846,444 13,498,176 Interest cost 603,496 2,353,331 Nil 1,349,818 Current service cost 1,441,381 2,093,198 Nil 982,520 Benefits paid (5,326,028) (3,740,770) (5,282,153) (3,607,820)Effect of transfer of employees (5,339,042) (45,808) (6,564,291) (45,808)Actuarial (gains) / losses 1,301,374 (922,153) Nil (330,442)At end of the year 13,198,502 20,517,321 Nil 11,846,444
The present value of finance lease liabilities is as follows:
Group Company2014 2013 2014 2013
Not later than 1 year 635,930 556,753 635,930 556,753 Later than 1 year and not later than 5 years 411,937 1,047,867 411,937 1,047,867
1,047,867 1,604,620 1,047,867 1,604,620
Weighted average effective interest rates.
19. Borrowings (Contd)
(all amounts in Sri Lanka Rupees unless otherwise stated)
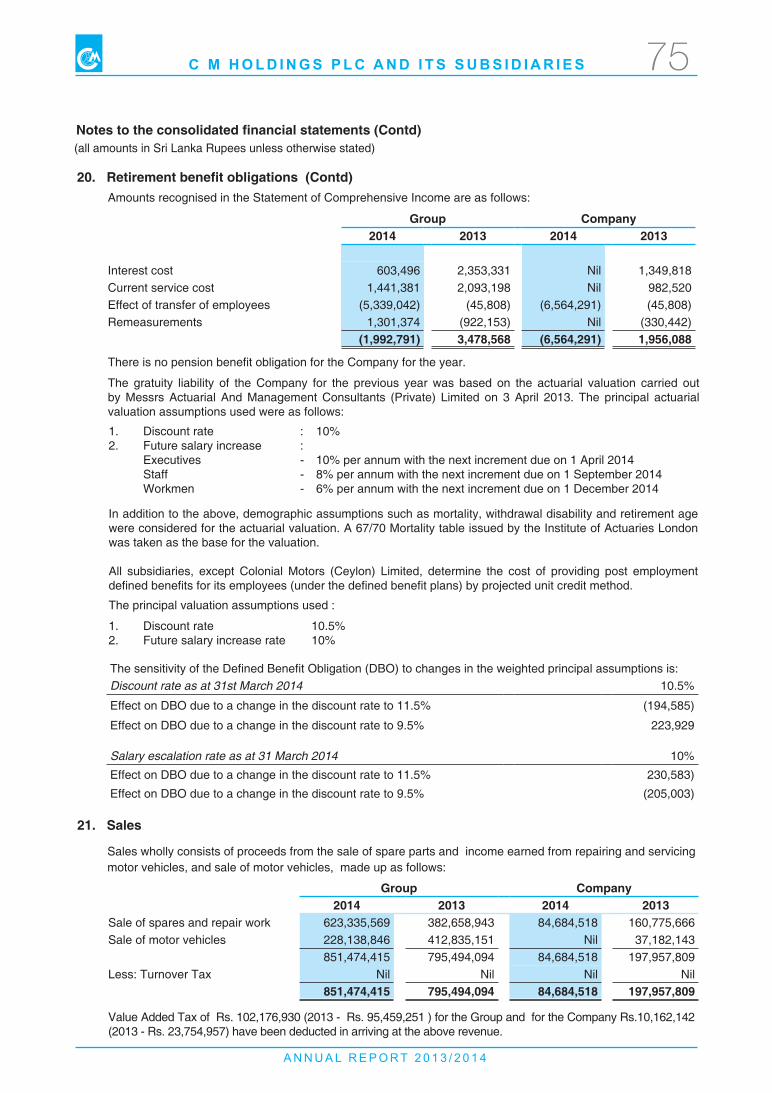
A N N U A L R E P O R T 2 0 1 3 / 2 0 1 4
C M H O L D I N G S P L C A N D I T S S U B S I D I A R I E S 75
The sensitivity of the Defined Benefit Obligation (DBO) to changes in the weighted principal assumptions is: Discount rate as at 31st March 2014 10.5%
Effect on DBO due to a change in the discount rate to 11.5% (194,585)
Effect on DBO due to a change in the discount rate to 9.5% 223,929
Salary escalation rate as at 31 March 2014 10%
Effect on DBO due to a change in the discount rate to 11.5% 230,583)
Effect on DBO due to a change in the discount rate to 9.5% (205,003)
Amounts recognised in the Statement of Comprehensive Income are as follows:
Group Company2014 2013 2014 2013
Interest cost 603,496 2,353,331 Nil 1,349,818 Current service cost 1,441,381 2,093,198 Nil 982,520 Effect of transfer of employees (5,339,042) (45,808) (6,564,291) (45,808)Remeasurements 1,301,374 (922,153) Nil (330,442)
(1,992,791) 3,478,568 (6,564,291) 1,956,088
There is no pension benefit obligation for the Company for the year.
The gratuity liability of the Company for the previous year was based on the actuarial valuation carried out by Messrs Actuarial And Management Consultants (Private) Limited on 3 April 2013. The principal actuarial valuation assumptions used were as follows:
Notes to the consolidated financial statements (Contd)
20. Retirement benefit obligations (Contd)
1. Discount rate : 10% 2. Future salary increase : Executives - 10% per annum with the next increment due on 1 April 2014 Staff - 8% per annum with the next increment due on 1 September 2014 Workmen - 6% per annum with the next increment due on 1 December 2014
In addition to the above, demographic assumptions such as mortality, withdrawal disability and retirement age were considered for the actuarial valuation. A 67/70 Mortality table issued by the Institute of Actuaries London was taken as the base for the valuation. All subsidiaries, except Colonial Motors (Ceylon) Limited, determine the cost of providing post employment defined benefits for its employees (under the defined benefit plans) by projected unit credit method.
The principal valuation assumptions used :
1. Discount rate 10.5%2. Future salary increase rate 10%
Group Company2014 2013 2014 2013
Sale of spares and repair work 623,335,569 382,658,943 84,684,518 160,775,666 Sale of motor vehicles 228,138,846 412,835,151 Nil 37,182,143
851,474,415 795,494,094 84,684,518 197,957,809 Less: Turnover Tax Nil Nil Nil Nil
851,474,415 795,494,094 84,684,518 197,957,809
Value Added Tax of Rs. 102,176,930 (2013 - Rs. 95,459,251 ) for the Group and for the Company Rs.10,162,142 (2013 - Rs. 23,754,957) have been deducted in arriving at the above revenue.
21. Sales
Sales wholly consists of proceeds from the sale of spare parts and income earned from repairing and servicing motor vehicles, and sale of motor vehicles, made up as follows:
(all amounts in Sri Lanka Rupees unless otherwise stated)
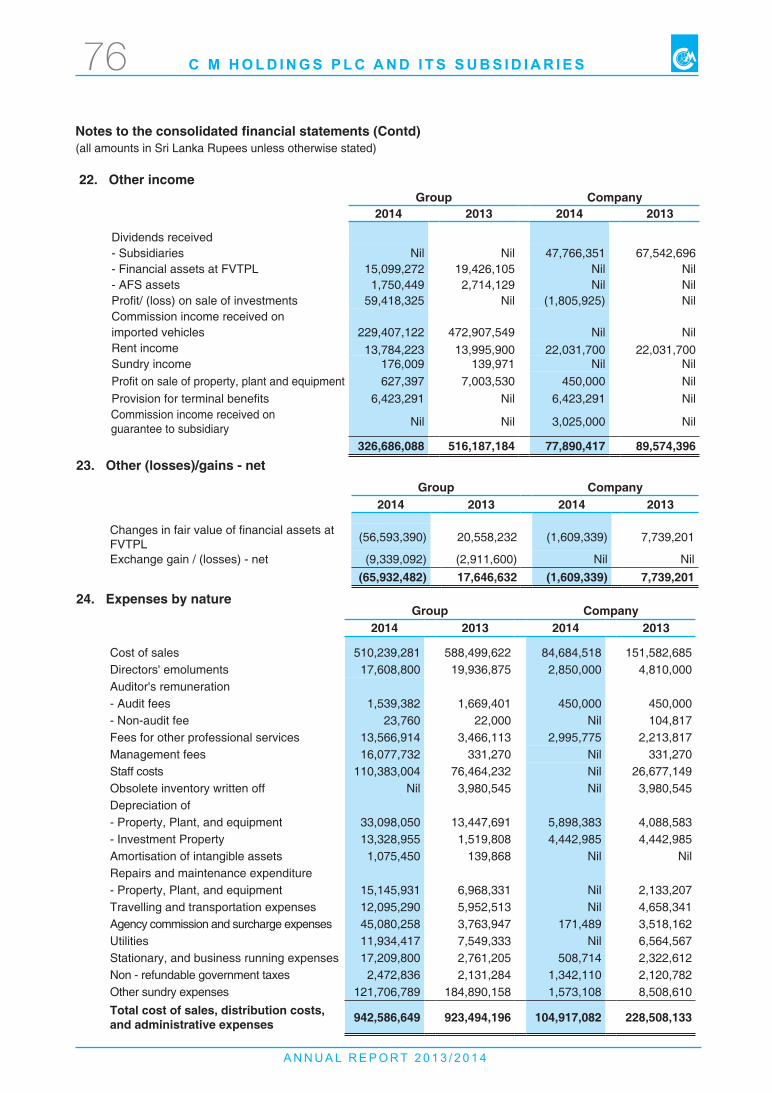
A N N U A L R E P O R T 2 0 1 3 / 2 0 1 4
C M H O L D I N G S P L C A N D I T S S U B S I D I A R I E S76
22. Other income Group Company
2014 2013 2014 2013
Dividends received - Subsidiaries Nil Nil 47,766,351 67,542,696 - Financial assets at FVTPL 15,099,272 19,426,105 Nil Nil - AFS assets 1,750,449 2,714,129 Nil Nil Profit/ (loss) on sale of investments 59,418,325 Nil (1,805,925) Nil Commission income received onimported vehicles 229,407,122 472,907,549 Nil Nil Rent income 13,784,223 13,995,900 22,031,700 22,031,700 Sundry income 176,009 139,971 Nil Nil Profit on sale of property, plant and equipment 627,397 7,003,530 450,000 Nil Provision for terminal benefits 6,423,291 Nil 6,423,291 Nil
Commission income received on guarantee to subsidiary Nil Nil 3,025,000 Nil
326,686,088 516,187,184 77,890,417 89,574,396
24. Expenses by nature Group Company
2014 2013 2014 2013
Cost of sales 510,239,281 588,499,622 84,684,518 151,582,685 Directors' emoluments 17,608,800 19,936,875 2,850,000 4,810,000 Auditor's remuneration- Audit fees 1,539,382 1,669,401 450,000 450,000 - Non-audit fee 23,760 22,000 Nil 104,817 Fees for other professional services 13,566,914 3,466,113 2,995,775 2,213,817 Management fees 16,077,732 331,270 Nil 331,270 Staff costs 110,383,004 76,464,232 Nil 26,677,149 Obsolete inventory written off Nil 3,980,545 Nil 3,980,545 Depreciation of - Property, Plant, and equipment 33,098,050 13,447,691 5,898,383 4,088,583 - Investment Property 13,328,955 1,519,808 4,442,985 4,442,985 Amortisation of intangible assets 1,075,450 139,868 Nil Nil Repairs and maintenance expenditure- Property, Plant, and equipment 15,145,931 6,968,331 Nil 2,133,207 Travelling and transportation expenses 12,095,290 5,952,513 Nil 4,658,341 Agency commission and surcharge expenses 45,080,258 3,763,947 171,489 3,518,162 Utilities 11,934,417 7,549,333 Nil 6,564,567 Stationary, and business running expenses 17,209,800 2,761,205 508,714 2,322,612 Non - refundable government taxes 2,472,836 2,131,284 1,342,110 2,120,782 Other sundry expenses 121,706,789 184,890,158 1,573,108 8,508,610 Total cost of sales, distribution costs, and administrative expenses 942,586,649 923,494,196 104,917,082 228,508,133
23. Other (losses)/gains - netGroup Company
2014 2013 2014 2013
Changes in fair value of financial assets at FVTPL (56,593,390) 20,558,232 (1,609,339) 7,739,201
Exchange gain / (losses) - net (9,339,092) (2,911,600) Nil Nil (65,932,482) 17,646,632 (1,609,339) 7,739,201
Notes to the consolidated financial statements (Contd) (all amounts in Sri Lanka Rupees unless otherwise stated)
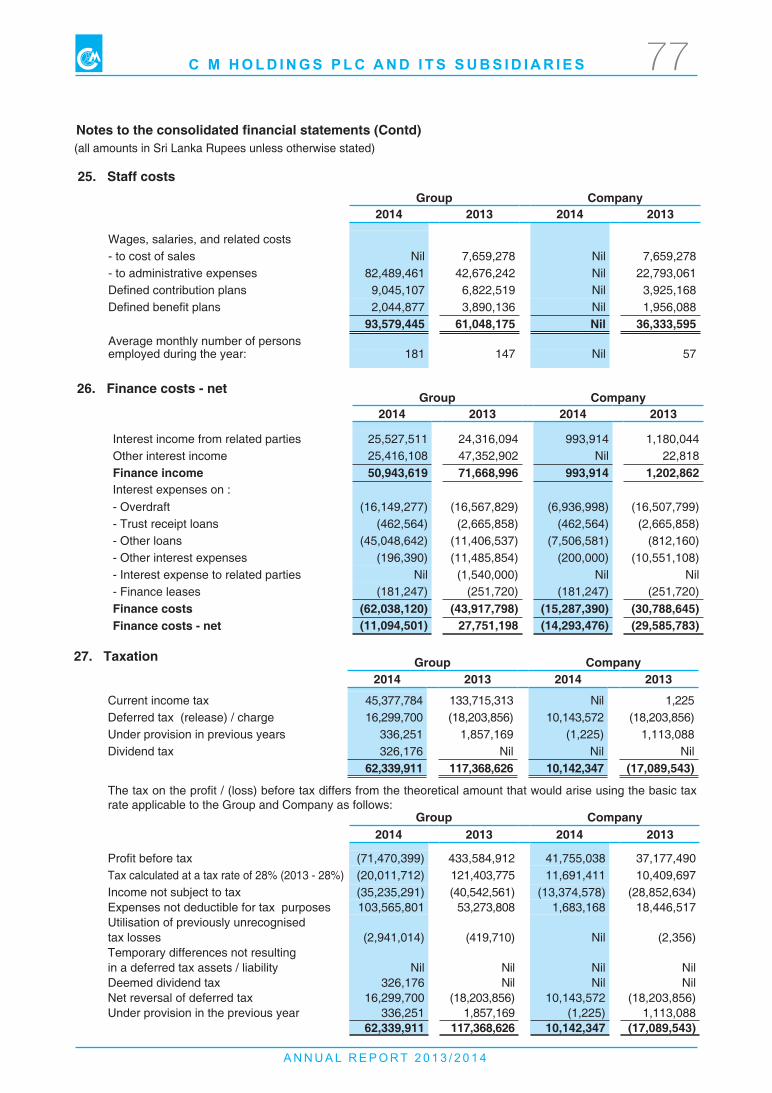
A N N U A L R E P O R T 2 0 1 3 / 2 0 1 4
C M H O L D I N G S P L C A N D I T S S U B S I D I A R I E S 77
Group Company2014 2013 2014 2013
Current income tax 45,377,784 133,715,313 Nil 1,225 Deferred tax (release) / charge 16,299,700 (18,203,856) 10,143,572 (18,203,856)Under provision in previous years 336,251 1,857,169 (1,225) 1,113,088 Dividend tax 326,176 Nil Nil Nil
62,339,911 117,368,626 10,142,347 (17,089,543)
26. Finance costs - net
27. Taxation
Group Company2014 2013 2014 2013
Interest income from related parties 25,527,511 24,316,094 993,914 1,180,044 Other interest income 25,416,108 47,352,902 Nil 22,818 Finance income 50,943,619 71,668,996 993,914 1,202,862 Interest expenses on : - Overdraft (16,149,277) (16,567,829) (6,936,998) (16,507,799)- Trust receipt loans (462,564) (2,665,858) (462,564) (2,665,858)- Other loans (45,048,642) (11,406,537) (7,506,581) (812,160)- Other interest expenses (196,390) (11,485,854) (200,000) (10,551,108)- Interest expense to related parties Nil (1,540,000) Nil Nil- Finance leases (181,247) (251,720) (181,247) (251,720)Finance costs (62,038,120) (43,917,798) (15,287,390) (30,788,645)Finance costs - net (11,094,501) 27,751,198 (14,293,476) (29,585,783)
Group Company2014 2013 2014 2013
Profit before tax (71,470,399) 433,584,912 41,755,038 37,177,490 Tax calculated at a tax rate of 28% (2013 - 28%) (20,011,712) 121,403,775 11,691,411 10,409,697 Income not subject to tax (35,235,291) (40,542,561) (13,374,578) (28,852,634)Expenses not deductible for tax purposes 103,565,801 53,273,808 1,683,168 18,446,517 Utilisation of previously unrecognised tax losses (2,941,014) (419,710) Nil (2,356)Temporary differences not resultingin a deferred tax assets / liability Nil Nil Nil Nil Deemed dividend tax 326,176 Nil Nil Nil Net reversal of deferred tax 16,299,700 (18,203,856) 10,143,572 (18,203,856)Under provision in the previous year 336,251 1,857,169 (1,225) 1,113,088
62,339,911 117,368,626 10,142,347 (17,089,543)
Group Company2014 2013 2014 2013
Wages, salaries, and related costs - to cost of sales Nil 7,659,278 Nil 7,659,278 - to administrative expenses 82,489,461 42,676,242 Nil 22,793,061 Defined contribution plans 9,045,107 6,822,519 Nil 3,925,168 Defined benefit plans 2,044,877 3,890,136 Nil 1,956,088
93,579,445 61,048,175 Nil 36,333,595 Average monthly number of personsemployed during the year: 181 147 Nil 57
25. Staff costs
The tax on the profit / (loss) before tax differs from the theoretical amount that would arise using the basic tax rate applicable to the Group and Company as follows:
Notes to the consolidated financial statements (Contd) (all amounts in Sri Lanka Rupees unless otherwise stated)
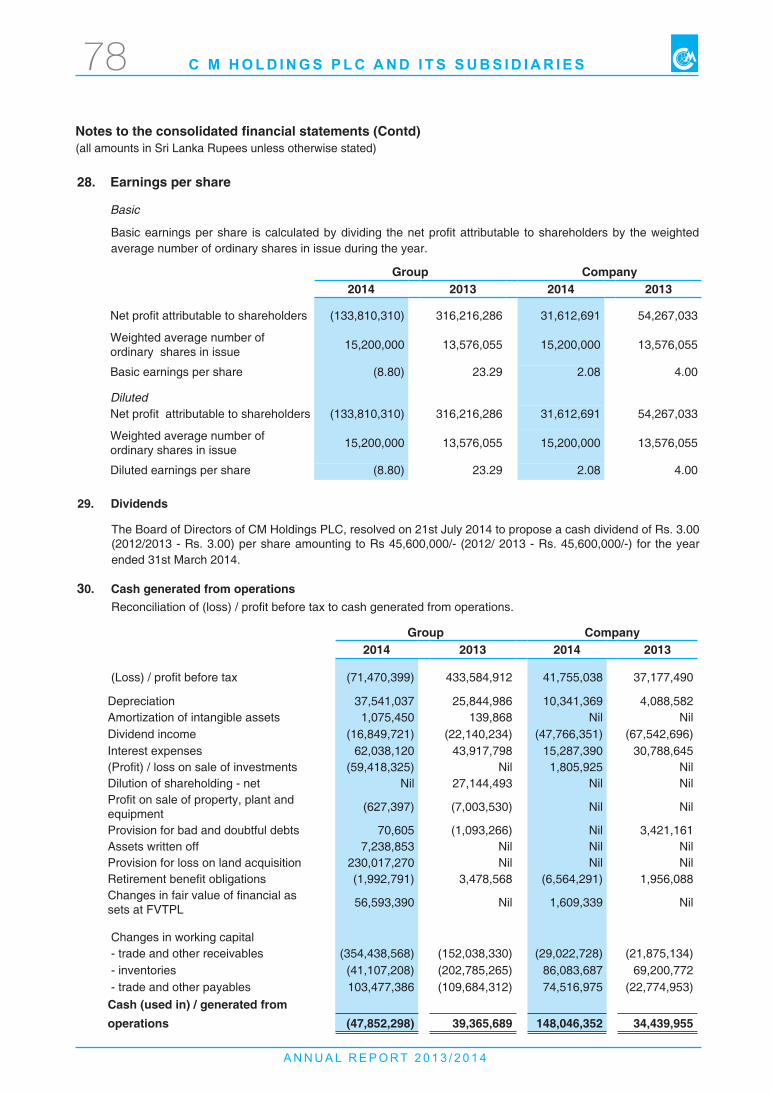
A N N U A L R E P O R T 2 0 1 3 / 2 0 1 4
C M H O L D I N G S P L C A N D I T S S U B S I D I A R I E S78
28. Earnings per share
Basic
Basic earnings per share is calculated by dividing the net profit attributable to shareholders by the weighted average number of ordinary shares in issue during the year.
Group Company2014 2013 2014 2013
Net profit attributable to shareholders (133,810,310) 316,216,286 31,612,691 54,267,033
Weighted average number of ordinary shares in issue 15,200,000 13,576,055 15,200,000 13,576,055
Basic earnings per share (8.80) 23.29 2.08 4.00
DilutedNet profit attributable to shareholders (133,810,310) 316,216,286 31,612,691 54,267,033
Weighted average number of ordinary shares in issue 15,200,000 13,576,055 15,200,000 13,576,055
Diluted earnings per share (8.80) 23.29 2.08 4.00
29. Dividends
The Board of Directors of CM Holdings PLC, resolved on 21st July 2014 to propose a cash dividend of Rs. 3.00 (2012/2013 - Rs. 3.00) per share amounting to Rs 45,600,000/- (2012/ 2013 - Rs. 45,600,000/-) for the year ended 31st March 2014.
30. Cash generated from operations
Group Company2014 2013 2014 2013
(Loss) / profit before tax (71,470,399) 433,584,912 41,755,038 37,177,490
Depreciation 37,541,037 25,844,986 10,341,369 4,088,582 Amortization of intangible assets 1,075,450 139,868 Nil Nil Dividend income (16,849,721) (22,140,234) (47,766,351) (67,542,696)Interest expenses 62,038,120 43,917,798 15,287,390 30,788,645 (Profit) / loss on sale of investments (59,418,325) Nil 1,805,925 Nil Dilution of shareholding - net Nil 27,144,493 Nil Nil Profit on sale of property, plant and equipment (627,397) (7,003,530) Nil Nil
Provision for bad and doubtful debts 70,605 (1,093,266) Nil 3,421,161 Assets written off 7,238,853 Nil Nil Nil Provision for loss on land acquisition 230,017,270 Nil Nil Nil Retirement benefit obligations (1,992,791) 3,478,568 (6,564,291) 1,956,088 Changes in fair value of financial as sets at FVTPL 56,593,390 Nil 1,609,339 Nil
Changes in working capital - trade and other receivables (354,438,568) (152,038,330) (29,022,728) (21,875,134) - inventories (41,107,208) (202,785,265) 86,083,687 69,200,772 - trade and other payables 103,477,386 (109,684,312) 74,516,975 (22,774,953)Cash (used in) / generated fromoperations (47,852,298) 39,365,689 148,046,352 34,439,955
Reconciliation of (loss) / profit before tax to cash generated from operations.
Notes to the consolidated financial statements (Contd) (all amounts in Sri Lanka Rupees unless otherwise stated)
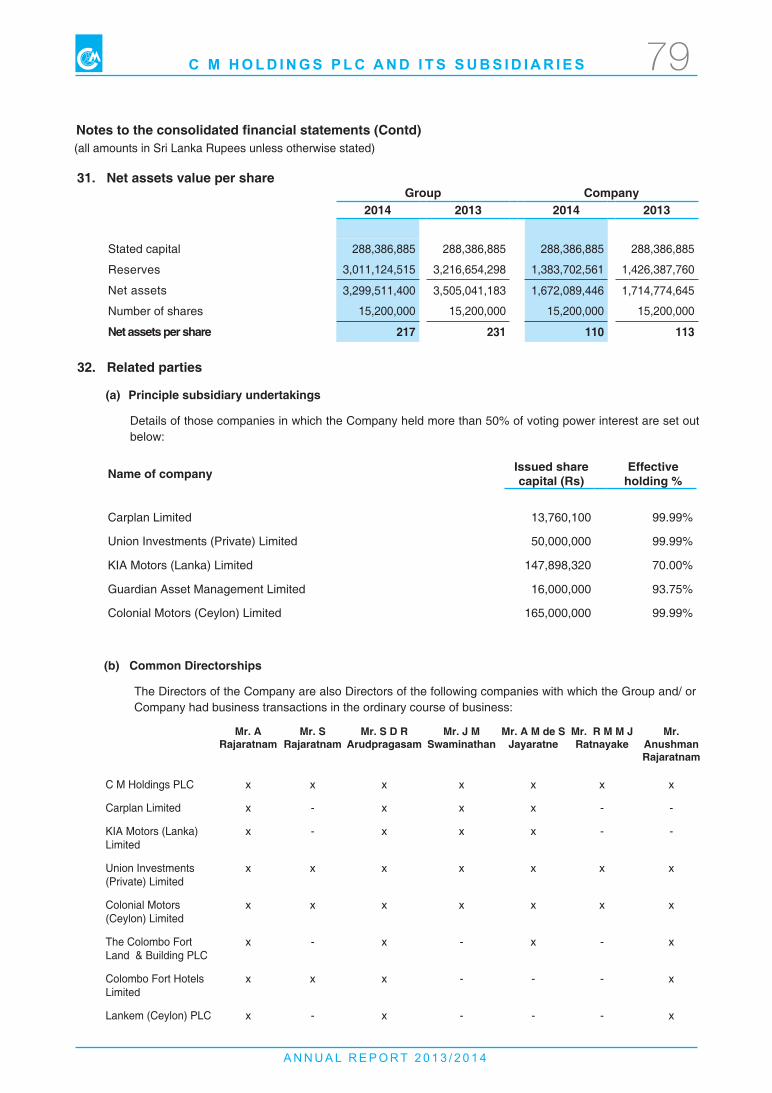
A N N U A L R E P O R T 2 0 1 3 / 2 0 1 4
C M H O L D I N G S P L C A N D I T S S U B S I D I A R I E S 79
31. Net assets value per share Group Company
2014 2013 2014 2013
Stated capital 288,386,885 288,386,885 288,386,885 288,386,885
Reserves 3,011,124,515 3,216,654,298 1,383,702,561 1,426,387,760
Net assets 3,299,511,400 3,505,041,183 1,672,089,446 1,714,774,645
Number of shares 15,200,000 15,200,000 15,200,000 15,200,000
Net assets per share 217 231 110 113
32. Related parties
(a) Principle subsidiary undertakings
Details of those companies in which the Company held more than 50% of voting power interest are set out below:
Name of company Issued share capital (Rs)
Effective holding %
Carplan Limited 13,760,100 99.99%
Union Investments (Private) Limited 50,000,000 99.99%
KIA Motors (Lanka) Limited 147,898,320 70.00%
Guardian Asset Management Limited 16,000,000 93.75%
Colonial Motors (Ceylon) Limited 165,000,000 99.99%
(b) Common Directorships
The Directors of the Company are also Directors of the following companies with which the Group and/ or Company had business transactions in the ordinary course of business:
Mr. ARajaratnam
Mr. SRajaratnam
Mr. S D RArudpragasam
Mr. J M Swaminathan
Mr. A M de SJayaratne
Mr. R M M J Ratnayake
Mr. AnushmanRajaratnam
C M Holdings PLC x x x x x x x
Carplan Limited x - x x x - -
KIA Motors (Lanka) Limited
x - x x x - -
Union Investments (Private) Limited
x x x x x x x
Colonial Motors (Ceylon) Limited
x x x x x x x
The Colombo Fort Land & Building PLC
x - x - x - x
Colombo Fort Hotels Limited
x x x - - - x
Lankem (Ceylon) PLC x - x - - - x
Notes to the consolidated financial statements (Contd) (all amounts in Sri Lanka Rupees unless otherwise stated)
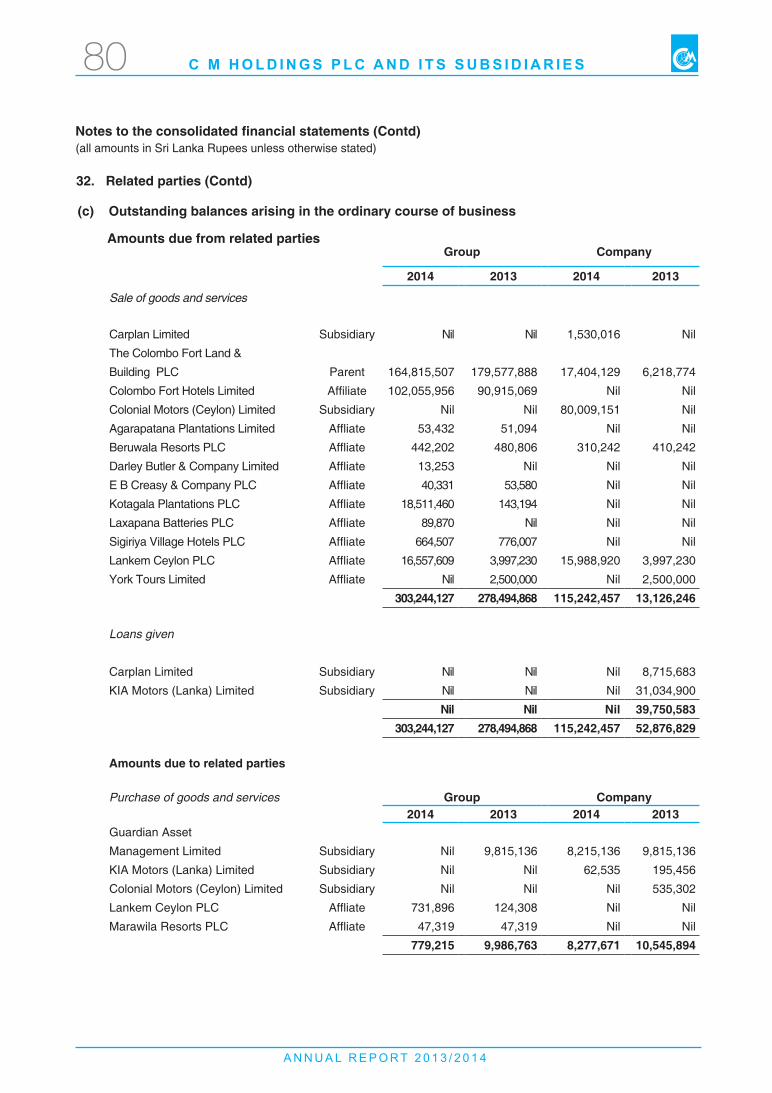
A N N U A L R E P O R T 2 0 1 3 / 2 0 1 4
C M H O L D I N G S P L C A N D I T S S U B S I D I A R I E S80
32. Related parties (Contd)
(c) Outstanding balances arising in the ordinary course of business
Amounts due from related parties Group Company
2014 2013 2014 2013
Sale of goods and services
Carplan Limited Subsidiary Nil Nil 1,530,016 Nil
The Colombo Fort Land &
Building PLC Parent 164,815,507 179,577,888 17,404,129 6,218,774
Colombo Fort Hotels Limited Affiliate 102,055,956 90,915,069 Nil Nil
Colonial Motors (Ceylon) Limited Subsidiary Nil Nil 80,009,151 Nil
Agarapatana Plantations Limited Affliate 53,432 51,094 Nil Nil
Beruwala Resorts PLC Affliate 442,202 480,806 310,242 410,242
Darley Butler & Company Limited Affliate 13,253 Nil Nil Nil
E B Creasy & Company PLC Affliate 40,331 53,580 Nil Nil
Kotagala Plantations PLC Affliate 18,511,460 143,194 Nil Nil
Laxapana Batteries PLC Affliate 89,870 Nil Nil Nil
Sigiriya Village Hotels PLC Affliate 664,507 776,007 Nil Nil
Lankem Ceylon PLC Affliate 16,557,609 3,997,230 15,988,920 3,997,230
York Tours Limited Affliate Nil 2,500,000 Nil 2,500,000
303,244,127 278,494,868 115,242,457 13,126,246
Loans given
Carplan Limited Subsidiary Nil Nil Nil 8,715,683
KIA Motors (Lanka) Limited Subsidiary Nil Nil Nil 31,034,900
Nil Nil Nil 39,750,583 303,244,127 278,494,868 115,242,457 52,876,829
Amounts due to related parties
Purchase of goods and services Group Company2014 2013 2014 2013
Guardian Asset
Management Limited Subsidiary Nil 9,815,136 8,215,136 9,815,136
KIA Motors (Lanka) Limited Subsidiary Nil Nil 62,535 195,456
Colonial Motors (Ceylon) Limited Subsidiary Nil Nil Nil 535,302
Lankem Ceylon PLC Affliate 731,896 124,308 Nil Nil
Marawila Resorts PLC Affliate 47,319 47,319 Nil Nil
779,215 9,986,763 8,277,671 10,545,894
Notes to the consolidated financial statements (Contd) (all amounts in Sri Lanka Rupees unless otherwise stated)
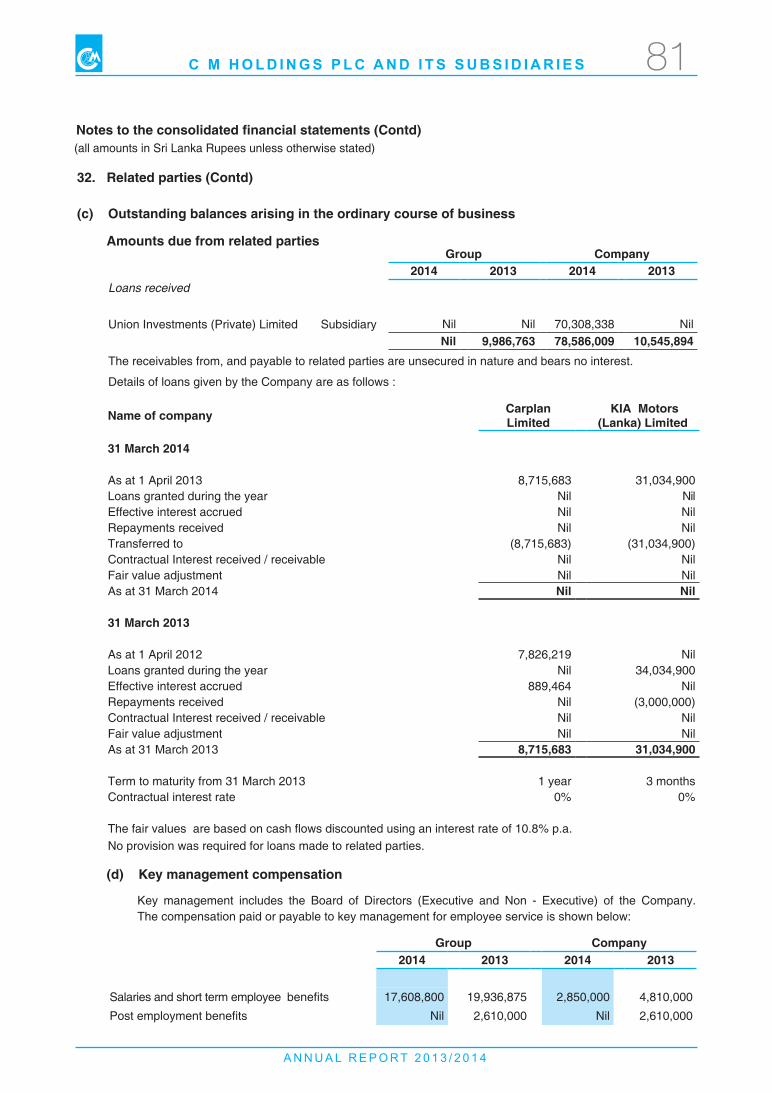
A N N U A L R E P O R T 2 0 1 3 / 2 0 1 4
C M H O L D I N G S P L C A N D I T S S U B S I D I A R I E S 81
(c) Outstanding balances arising in the ordinary course of business
Amounts due from related parties
32. Related parties (Contd)
Name of company Carplan Limited
KIA Motors (Lanka) Limited
31 March 2014
As at 1 April 2013 8,715,683 31,034,900 Loans granted during the year Nil NilEffective interest accrued Nil NilRepayments received Nil NilTransferred to (8,715,683) (31,034,900)Contractual Interest received / receivable Nil NilFair value adjustment Nil NilAs at 31 March 2014 Nil Nil
31 March 2013
As at 1 April 2012 7,826,219 NilLoans granted during the year Nil 34,034,900 Effective interest accrued 889,464 NilRepayments received Nil (3,000,000)Contractual Interest received / receivable Nil NilFair value adjustment Nil NilAs at 31 March 2013 8,715,683 31,034,900
Term to maturity from 31 March 2013 1 year 3 monthsContractual interest rate 0% 0%
The fair values are based on cash flows discounted using an interest rate of 10.8% p.a.No provision was required for loans made to related parties.
Group Company2014 2013 2014 2013
Loans received
Union Investments (Private) Limited Subsidiary Nil Nil 70,308,338 NilNil 9,986,763 78,586,009 10,545,894
The receivables from, and payable to related parties are unsecured in nature and bears no interest.
Details of loans given by the Company are as follows :
(d) Key management compensation
Key management includes the Board of Directors (Executive and Non - Executive) of the Company. The compensation paid or payable to key management for employee service is shown below:
Group Company2014 2013 2014 2013
Salaries and short term employee benefits 17,608,800 19,936,875 2,850,000 4,810,000
Post employment benefits Nil 2,610,000 Nil 2,610,000
Notes to the consolidated financial statements (Contd) (all amounts in Sri Lanka Rupees unless otherwise stated)
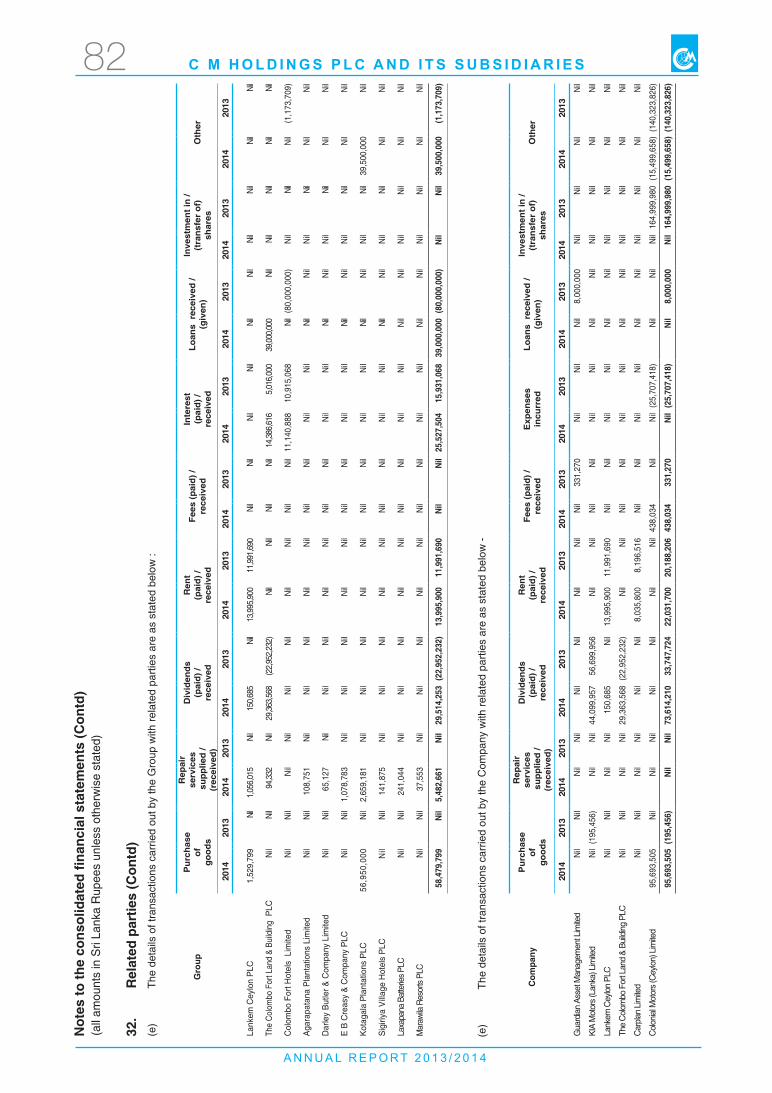
A N N U A L R E P O R T 2 0 1 3 / 2 0 1 4
C M H O L D I N G S P L C A N D I T S S U B S I D I A R I E S82
32.
Rel
ated
par
ties
(Con
td)
(e)
The
deta
ils o
f tra
nsac
tions
car
ried
out b
y th
e G
roup
with
rela
ted
parti
es a
re a
s st
ated
bel
ow :
Not
es to
the
cons
olid
ated
fina
ncia
l sta
tem
ents
(Con
td)
Gro
up
Pur
chas
e
of
good
s
Rep
air
se
rvic
es
sup
plie
d /
(rec
eive
d)
Div
iden
ds(p
aid)
/ re
ceiv
ed
Ren
t (p
aid)
/re
ceiv
ed
Fees
(pai
d) /
rece
ived
Inte
rest
(pai
d) /
rece
ived
Loan
s r
ecei
ved
/
(giv
en)
Inve
stm
ent i
n /
(tra
nsfe
r of
) sh
ares
Oth
er
2014
2013
2014
2013
2014
2013
2014
2013
2014
2013
2014
2013
2014
2013
2014
2013
2014
2013
Lank
em C
eylo
n P
LC1,
529,
799
Nil
1,05
6,01
5 Ni
l15
0,68
5 Ni
l13
,995
,900
11
,991
,690
Ni
lNi
lNi
lNi
lNi
lNi
lNi
lNi
lNi
lNi
l
The
Col
ombo
For
t Lan
d &
Build
ing
PLC
Nil
Nil
94,3
32
Nil
29,3
63,5
68
(22,
952,
232)
Nil
Nil
Nil
Nil
14,3
86,6
16
5,01
6,00
0 39
,000,0
00
Nil
Nil
Nil
Nil
Nil
Col
ombo
For
t Hot
els
Lim
ited
Nil
Nil
Nil
Nil
Nil
Nil
Nil
Nil
Nil
Nil
11,1
40,8
88
10,9
15,0
68
Nil
(80,
000,
000)
Nil
Nil
Nil
(1,1
73,7
09)
Aga
rapa
tana
Pla
ntat
ions
Lim
ited
Nil
Nil
108,
751
Nil
Nil
Nil
Nil
Nil
Nil
Nil
Nil
Nil
Nil
Nil
Nil
Nil
Nil
Nil
Dar
ley
But
ler &
Com
pany
Lim
ited
Nil
Nil
65,1
27
Nil
Nil
Nil
Nil
Nil
Nil
Nil
Nil
Nil
Nil
Nil
Nil
Nil
Nil
Nil
E B
Cre
asy
& C
ompa
ny P
LCN
ilN
il1,
078,
783
Nil
Nil
Nil
Nil
Nil
Nil
Nil
Nil
Nil
Nil
Nil
Nil
Nil
Nil
Nil
Kot
agal
a P
lant
atio
ns P
LC56
,950
,000
N
il2,
659,
181
Nil
Nil
Nil
Nil
Nil
Nil
Nil
Nil
Nil
Nil
Nil
Nil
Nil
39,5
00,0
00
Nil
Sig
iriya
Vill
age
Hot
els
PLC
Nil
Nil
141,
875
Nil
Nil
Nil
Nil
Nil
Nil
Nil
Nil
Nil
Nil
Nil
Nil
Nil
Nil
Nil
Laxa
pana
Bat
terie
s PL
CN
ilN
il24
1,04
4 N
ilN
ilN
ilN
ilN
ilN
ilN
ilN
ilN
ilN
ilN
ilN
ilN
ilN
ilN
il
Mar
awila
Res
orts
PLC
Nil
Nil
37,5
53
Nil
Nil
Nil
Nil
Nil
Nil
Nil
Nil
Nil
Nil
Nil
Nil
Nil
Nil
Nil
58,4
79,7
99
Nil
5,48
2,66
1 Ni
l29
,514
,253
(22
,952
,232
)13
,995
,900
11
,991
,690
Ni
lNi
l25
,527
,504
15
,931
,068
39
,000
,000
(80
,000
,000
)Ni
lNi
l39
,500
,000
(1
,173
,709
)
Com
pany
P
urch
ase
of
go
ods
Rep
air
se
rvic
es
sup
plie
d /
(rec
eive
d)
Div
iden
ds(p
aid)
/ re
ceiv
ed
Ren
t (p
aid)
/re
ceiv
ed
Fees
(pai
d) /
rece
ived
Exp
ense
s in
curr
edLo
ans
rec
eive
d /
(g
iven
)
Inve
stm
ent i
n /
(tra
nsfe
r of
) sh
ares
Oth
er
2014
2013
2014
2013
2014
2013
2014
2013
2014
2013
2014
2013
2014
2013
2014
2013
2014
2013
Gua
rdia
n As
set M
anag
emen
t Lim
ited
N
ilN
ilN
ilN
ilN
ilN
ilN
ilN
ilN
il33
1,27
0 N
ilN
ilN
il8,
000,
000
Nil
Nil
Nil
Nil
KIA
Mot
ors
(Lan
ka) L
imite
dN
il(1
95,4
56)
Nil
Nil
44,0
99,9
57
56,6
99,9
56
Nil
Nil
Nil
Nil
Nil
Nil
Nil
Nil
Nil
Nil
Nil
Nil
Lank
em C
eylo
n PL
CN
ilN
ilN
ilN
il15
0,68
5 N
il13
,995
,900
11
,991
,690
N
ilN
ilN
ilN
ilN
ilN
ilN
ilN
ilN
ilN
il
The
Col
ombo
For
t Lan
d &
Build
ing
PLC
Nil
Nil
Nil
Nil
29,3
63,5
68 (
22,9
52,2
32)
Nil
Nil
Nil
Nil
Nil
Nil
Nil
Nil
Nil
Nil
Nil
Nil
Car
plan
Lim
ited
Nil
Nil
Nil
Nil
Nil
Nil
8,03
5,80
0 8,
196,
516
Nil
Nil
Nil
Nil
Nil
Nil
Nil
Nil
Nil
Nil
Col
onia
l Mot
ors
(Cey
lon)
Lim
ited
95,6
93,5
05
Nil
Nil
Nil
Nil
Nil
Nil
Nil
438,
034
Nil
Nil
(25,
707,
418)
Nil
Nil
Nil
164,
999,
980
(15,
499,
658)
(140
,323
,826
)
95,6
93,5
05 (
195,
456)
Nil
Nil
73,6
14,2
10
33,7
47,7
24
22,0
31,7
00
20,1
88,2
06
438,
034
331,
270
Nil
(25,
707,
418)
Nil
8,00
0,00
0 Ni
l16
4,99
9,98
0 (1
5,49
9,65
8)(1
40,3
23,8
26)
(all
amou
nts
in S
ri La
nka
Rup
ees
unle
ss o
ther
wis
e st
ated
)
(e)
The
deta
ils o
f tra
nsac
tions
car
ried
out b
y th
e C
ompa
ny w
ith re
late
d pa
rties
are
as
stat
ed b
elow
-
A N N U A L R E P O R T 2 0 1 3 / 2 0 1 4
C M H O L D I N G S P L C A N D I T S S U B S I D I A R I E S 83
33. Events after the balance sheet date
The Board of Directors of C M Holdings PLC resolved to appoint the Company’s Secretaries Corporate Managers and Secretaries (Pvt) Ltd (CMSL) as Managers of the Company with effect from 1st April 2014. Accordingly CMSL functions as Managers and Secretaries with effect from the said date.
The Board of Directors of C M Holdings PLC has proposed a first and final dividend of Rs. 3.00 per share for the year ended 31st March 2014. The dividend so proposed is subject to the approval of the shareholders at the Annual General Meeting (AGM) of C M Holdings PLC and has not been recognized as a liability in the financial Statements as at 31st March 2014.
The Board of Directors of Guardian Asset Management Limited have recommended a First and Final Dividend of Rs. 0.30 per share for the year ended 31st March 2014 to be paid to the shareholders registered in the books of the Company on 11th August 2014, (EGM date) payable on the same day. The Board of Directors of Union Investments (Private) Limited have recommended a First and Final Dividend of Rs.1.00 per share for the year ended 31st March 2014 to be paid to the shareholders registered in the books of the Company on 25th August 2014, (AGM date) payable on the same day.
Other than the above no circumstances have arisen since the Financial Position date which would require adjustments to, or disclosure in the Financial Statements.
34. Contingencies
Contingent liabilities
KIA Motors (Lanka) Limited was a bona-fide purchaser of land in 2012 in Malabe in extent of 1 acre 2 roods and 22.2 perches. The title to this property is now being challenged by a third party. The Company has intervened in this matter in the Supreme Court and is confident of its final outcome. Nevertheless, the Company has made a provision in the financial statements for the full cost of this property.
KIA Motors (Lanka) Limited has challenged the Sri Lanka Customs in the matter relating to the importation of 47 vehicles. This matter is subject of litigation before the Supreme Court and the Company is confident of its final outcome. Pending such outcome the Company has written off the full cost of the vehicles during the year.
Other than above there are no other contingent liabilities as at the Financial Position date.
35. Commitments
Financial commitments
Union Investments (Private) Limited is committed to pay the following to Guardian Assets Management Limited (GAML).
- Management fees at 1.5% per annum calculated on the value of the portfolio on a daily basis.
- Custodian fees on the basis of the agreement entered with Deutsche Bank.
There were no other material financial commitments outstanding at the Financial Position date.
Notes to the consolidated financial statements (Contd)
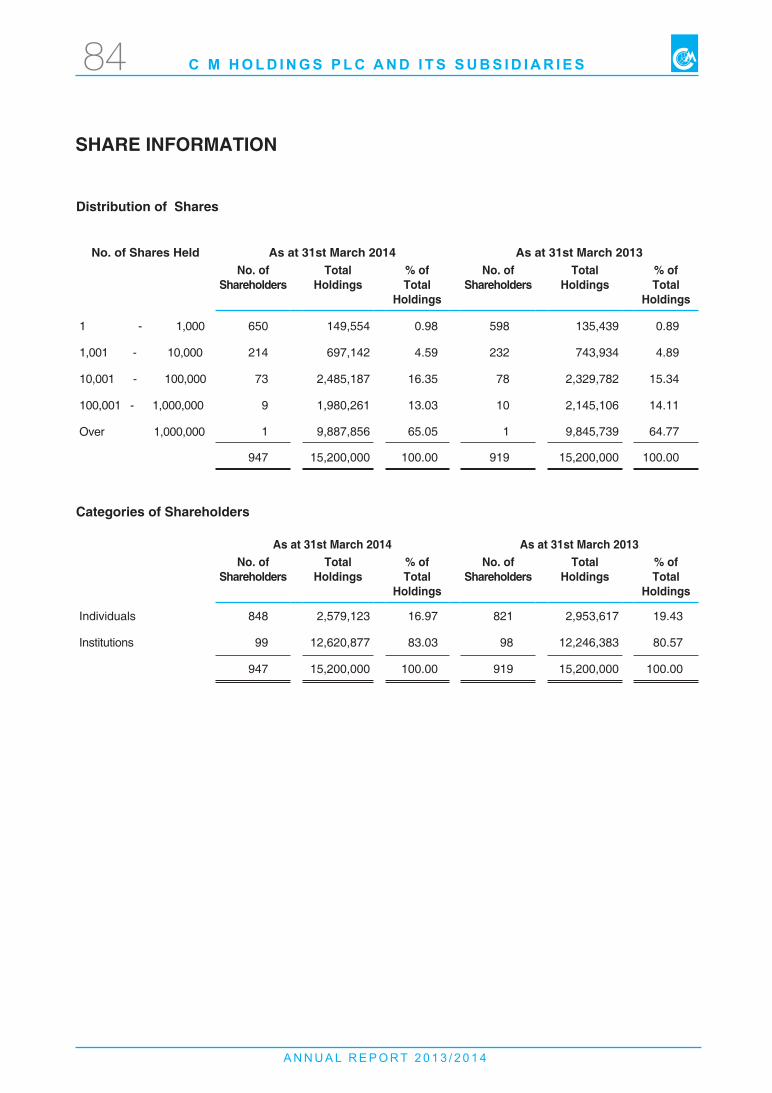
A N N U A L R E P O R T 2 0 1 3 / 2 0 1 4
C M H O L D I N G S P L C A N D I T S S U B S I D I A R I E S84
SHARE INFORMATION
Distribution of Shares
Categories of Shareholders
No. of Shares Held As at 31st March 2014 As at 31st March 2013No. of
ShareholdersTotal
Holdings
% of Total
Holdings
No. of Shareholders
Total Holdings
% of Total
Holdings
1 - 1,000 650 149,554 0.98 598 135,439 0.89
1,001 - 10,000 214 697,142 4.59 232 743,934 4.89
10,001 - 100,000 73 2,485,187 16.35 78 2,329,782 15.34
100,001 - 1,000,000 9 1,980,261 13.03 10 2,145,106 14.11
Over 1,000,000 1 9,887,856 65.05 1 9,845,739 64.77
947 15,200,000 100.00 919 15,200,000 100.00
As at 31st March 2014 As at 31st March 2013No. of
Shareholders Total
Holdings
% of Total
Holdings
No. of Shareholders
Total Holdings
% of Total
Holdings
Individuals 848 2,579,123 16.97 821 2,953,617 19.43
Institutions 99 12,620,877 83.03 98 12,246,383 80.57
947 15,200,000 100.00 919 15,200,000 100.00
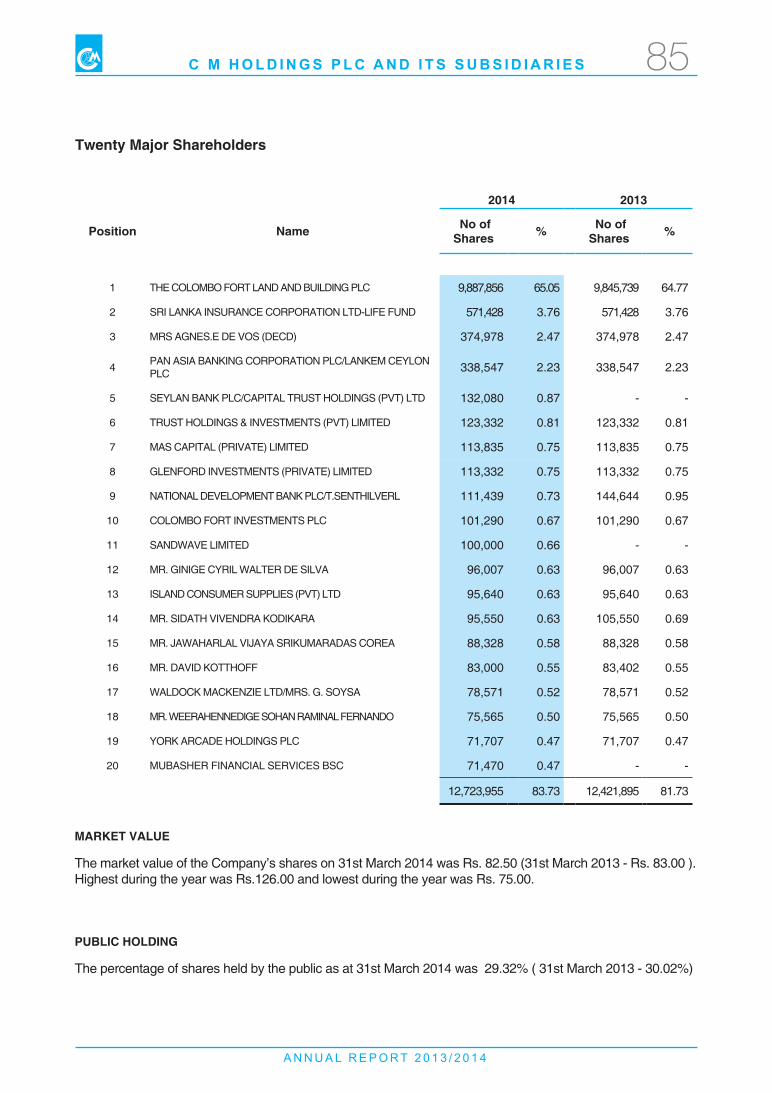
A N N U A L R E P O R T 2 0 1 3 / 2 0 1 4
C M H O L D I N G S P L C A N D I T S S U B S I D I A R I E S 85
Twenty Major Shareholders
MARKET VALuE
The market value of the Company’s shares on 31st March 2014 was Rs. 82.50 (31st March 2013 - Rs. 83.00 ). Highest during the year was Rs.126.00 and lowest during the year was Rs. 75.00. PuBLIC HOLDING The percentage of shares held by the public as at 31st March 2014 was 29.32% ( 31st March 2013 - 30.02%)
2014 2013
Position Name No of Shares % No of
Shares %
1 THE COLOMBO FORT LAND AND BUILDING PLC 9,887,856 65.05 9,845,739 64.77
2 SRI LANKA INSURANCE CORPORATION LTD-LIFE FUND 571,428 3.76 571,428 3.76
3 MRS AGNES.E DE VOS (DECD) 374,978 2.47 374,978 2.47
4 PAN ASIA BANKING CORPORATION PLC/LANKEM CEYLON PLC 338,547 2.23 338,547 2.23
5 SEYLAN BANK PLC/CAPITAL TRUST HOLDINGS (PVT) LTD 132,080 0.87 - -
6 TRUST HOLDINGS & INVESTMENTS (PVT) LIMITED 123,332 0.81 123,332 0.81
7 MAS CAPITAL (PRIVATE) LIMITED 113,835 0.75 113,835 0.75
8 GLENFORD INVESTMENTS (PRIVATE) LIMITED 113,332 0.75 113,332 0.75
9 NATIONAL DEVELOPMENT BANK PLC/T.SENTHILVERL 111,439 0.73 144,644 0.95
10 COLOMBO FORT INVESTMENTS PLC 101,290 0.67 101,290 0.67
11 SANDWAVE LIMITED 100,000 0.66 - -
12 MR. GINIGE CYRIL WALTER DE SILVA 96,007 0.63 96,007 0.63
13 ISLAND CONSUMER SUPPLIES (PVT) LTD 95,640 0.63 95,640 0.63
14 MR. SIDATH VIVENDRA KODIKARA 95,550 0.63 105,550 0.69
15 MR. JAWAHARLAL VIJAYA SRIKUMARADAS COREA 88,328 0.58 88,328 0.58
16 MR. DAVID KOTTHOFF 83,000 0.55 83,402 0.55
17 WALDOCK MACKENZIE LTD/MRS. G. SOYSA 78,571 0.52 78,571 0.52
18 MR. WEERAHENNEDIGE SOHAN RAMINAL FERNANDO 75,565 0.50 75,565 0.50
19 YORK ARCADE HOLDINGS PLC 71,707 0.47 71,707 0.47
20 MUBASHER FINANCIAL SERVICES BSC 71,470 0.47 - -
12,723,955 83.73 12,421,895 81.73
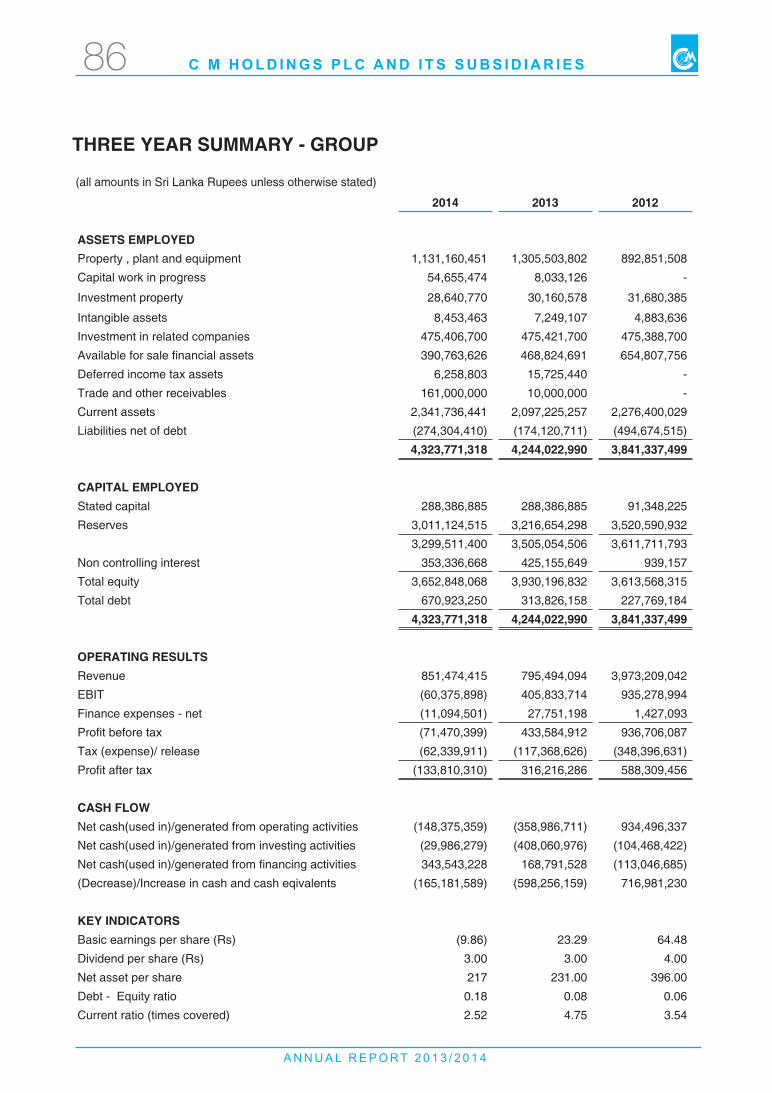
A N N U A L R E P O R T 2 0 1 3 / 2 0 1 4
C M H O L D I N G S P L C A N D I T S S U B S I D I A R I E S86
THREE YEAR SuMMARY - GROuP
2014 2013 2012
ASSETS EMPLOYEDProperty , plant and equipment 1,131,160,451 1,305,503,802 892,851,508
Capital work in progress 54,655,474 8,033,126 -
Investment property 28,640,770 30,160,578 31,680,385
Intangible assets 8,453,463 7,249,107 4,883,636
Investment in related companies 475,406,700 475,421,700 475,388,700
Available for sale financial assets 390,763,626 468,824,691 654,807,756
Deferred income tax assets 6,258,803 15,725,440 -
Trade and other receivables 161,000,000 10,000,000 -
Current assets 2,341,736,441 2,097,225,257 2,276,400,029
Liabilities net of debt (274,304,410) (174,120,711) (494,674,515)
4,323,771,318 4,244,022,990 3,841,337,499
CAPITAL EMPLOYEDStated capital 288,386,885 288,386,885 91,348,225
Reserves 3,011,124,515 3,216,654,298 3,520,590,932
3,299,511,400 3,505,054,506 3,611,711,793
Non controlling interest 353,336,668 425,155,649 939,157
Total equity 3,652,848,068 3,930,196,832 3,613,568,315
Total debt 670,923,250 313,826,158 227,769,184
4,323,771,318 4,244,022,990 3,841,337,499
OPERATING RESuLTSRevenue 851,474,415 795,494,094 3,973,209,042
EBIT (60,375,898) 405,833,714 935,278,994
Finance expenses - net (11,094,501) 27,751,198 1,427,093
Profit before tax (71,470,399) 433,584,912 936,706,087
Tax (expense)/ release (62,339,911) (117,368,626) (348,396,631)
Profit after tax (133,810,310) 316,216,286 588,309,456
CASH FLOWNet cash(used in)/generated from operating activities (148,375,359) (358,986,711) 934,496,337
Net cash(used in)/generated from investing activities (29,986,279) (408,060,976) (104,468,422)
Net cash(used in)/generated from financing activities 343,543,228 168,791,528 (113,046,685)
(Decrease)/Increase in cash and cash eqivalents (165,181,589) (598,256,159) 716,981,230
KEY INDICATORSBasic earnings per share (Rs) (9.86) 23.29 64.48
Dividend per share (Rs) 3.00 3.00 4.00
Net asset per share 217 231.00 396.00
Debt - Equity ratio 0.18 0.08 0.06
Current ratio (times covered) 2.52 4.75 3.54
(all amounts in Sri Lanka Rupees unless otherwise stated)
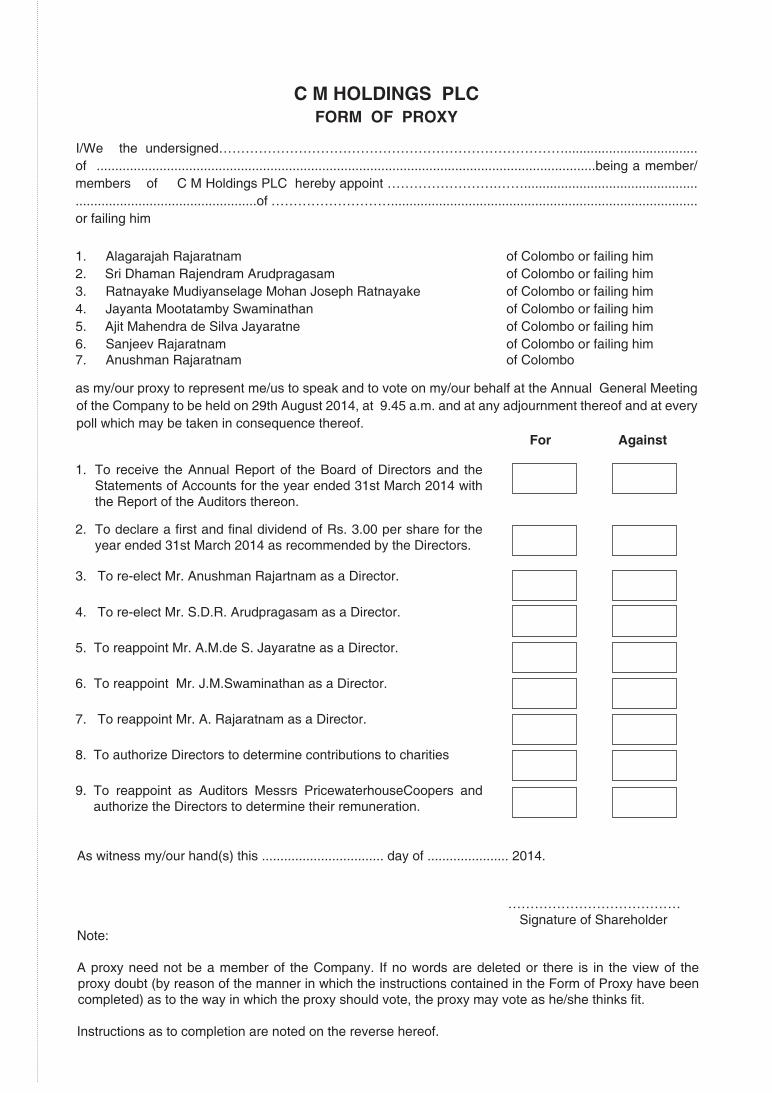
I/We the undersigned…………………………………………………………………….................................... of .......................................................................................................................................being a member/members of C M Holdings PLC hereby appoint …………………….……................................................................................................of ………………………...................................................................................or failing him
1. Alagarajah Rajaratnam of Colombo or failing him2. Sri Dhaman Rajendram Arudpragasam of Colombo or failing him3. Ratnayake Mudiyanselage Mohan Joseph Ratnayake of Colombo or failing him4. Jayanta Mootatamby Swaminathan of Colombo or failing him5. Ajit Mahendra de Silva Jayaratne of Colombo or failing him6. Sanjeev Rajaratnam of Colombo or failing him7. Anushman Rajaratnam of Colombo
as my/our proxy to represent me/us to speak and to vote on my/our behalf at the Annual General Meeting of the Company to be held on 29th August 2014, at 9.45 a.m. and at any adjournment thereof and at every poll which may be taken in consequence thereof.
C M HOLDINGS PLCFORM OF PROXY
1. To receive the Annual Report of the Board of Directors and the Statements of Accounts for the year ended 31st March 2014 with the Report of the Auditors thereon.
2. To declare a first and final dividend of Rs. 3.00 per share for the year ended 31st March 2014 as recommended by the Directors.
3. To re-elect Mr. Anushman Rajartnam as a Director.
4. To re-elect Mr. S.D.R. Arudpragasam as a Director.
5. To reappoint Mr. A.M.de S. Jayaratne as a Director.
6. To reappoint Mr. J.M.Swaminathan as a Director.
7. To reappoint Mr. A. Rajaratnam as a Director.
8. To authorize Directors to determine contributions to charities
9. To reappoint as Auditors Messrs PricewaterhouseCoopers and authorize the Directors to determine their remuneration.
For Against
As witness my/our hand(s) this ................................. day of ...................... 2014.
………………………………… Signature of ShareholderNote:
A proxy need not be a member of the Company. If no words are deleted or there is in the view of the proxy doubt (by reason of the manner in which the instructions contained in the Form of Proxy have been completed) as to the way in which the proxy should vote, the proxy may vote as he/she thinks fit.
Instructions as to completion are noted on the reverse hereof.
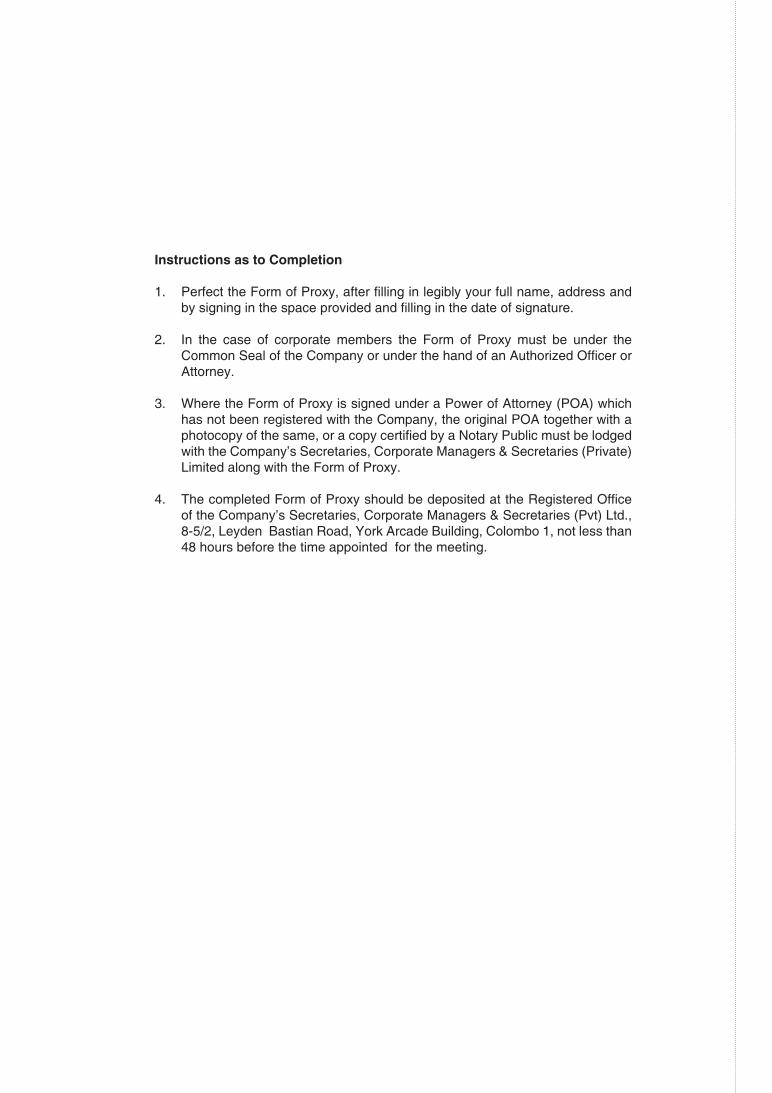
Instructions as to Completion
1. Perfect the Form of Proxy, after filling in legibly your full name, address and by signing in the space provided and filling in the date of signature.
2. In the case of corporate members the Form of Proxy must be under the Common Seal of the Company or under the hand of an Authorized Officer or Attorney.
3. Where the Form of Proxy is signed under a Power of Attorney (POA) which has not been registered with the Company, the original POA together with a photocopy of the same, or a copy certified by a Notary Public must be lodged with the Company’s Secretaries, Corporate Managers & Secretaries (Private) Limited along with the Form of Proxy.
4. The completed Form of Proxy should be deposited at the Registered Office of the Company’s Secretaries, Corporate Managers & Secretaries (Pvt) Ltd., 8-5/2, Leyden Bastian Road, York Arcade Building, Colombo 1, not less than 48 hours before the time appointed for the meeting.