Embed Size (px)
Citation preview
CHAPTER 5Probability(5.1-5.2)
1
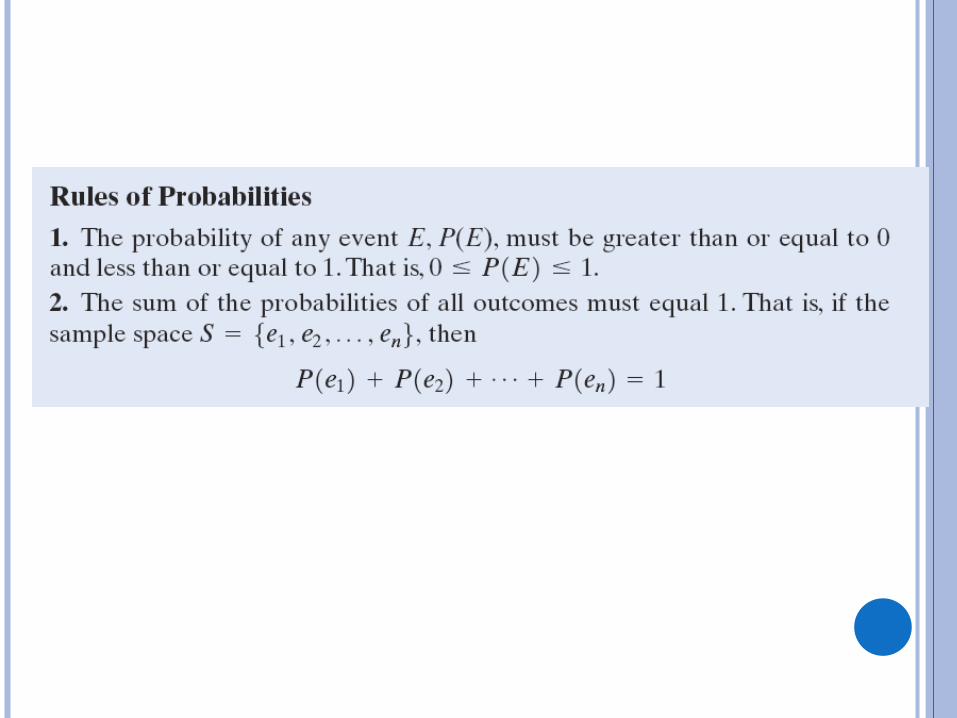
5.1 DEFINITIONS AND RULES
Probability is a measure of the likelihood of a random phenomenon.
Probability is the long-term proportion with which a certain outcome will occur.
Example:
Flip a coin 100 times. How many heads do you observe?
What is the Probability of observing Heads?
2
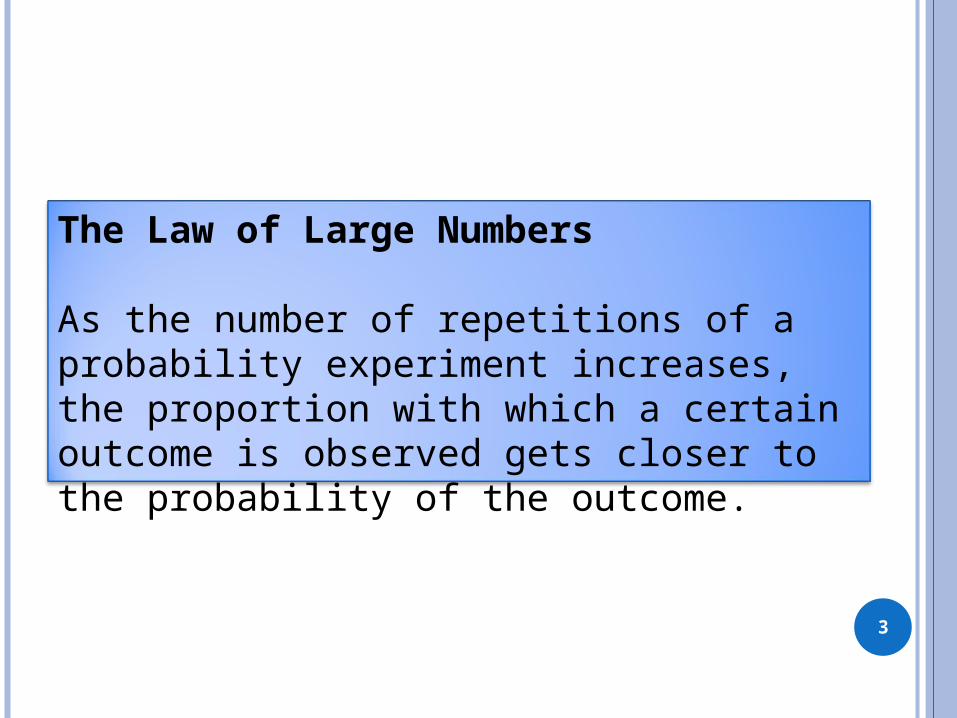
The Law of Large Numbers
As the number of repetitions of a probability experiment increases, the proportion with which a certain outcome is observed gets closer to the probability of the outcome.
3
4
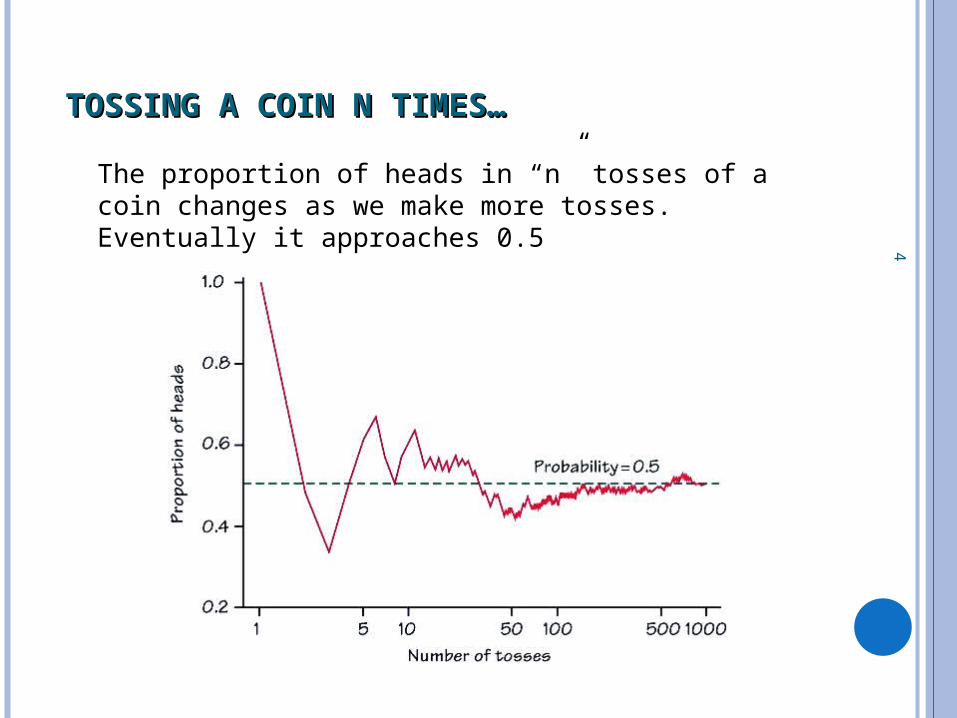
TOSSING A COIN N TIMES… TOSSING A COIN N TIMES…
The proportion of heads in “n” tosses of a coin changes as we make more tosses. Eventually it approaches 0.5
5
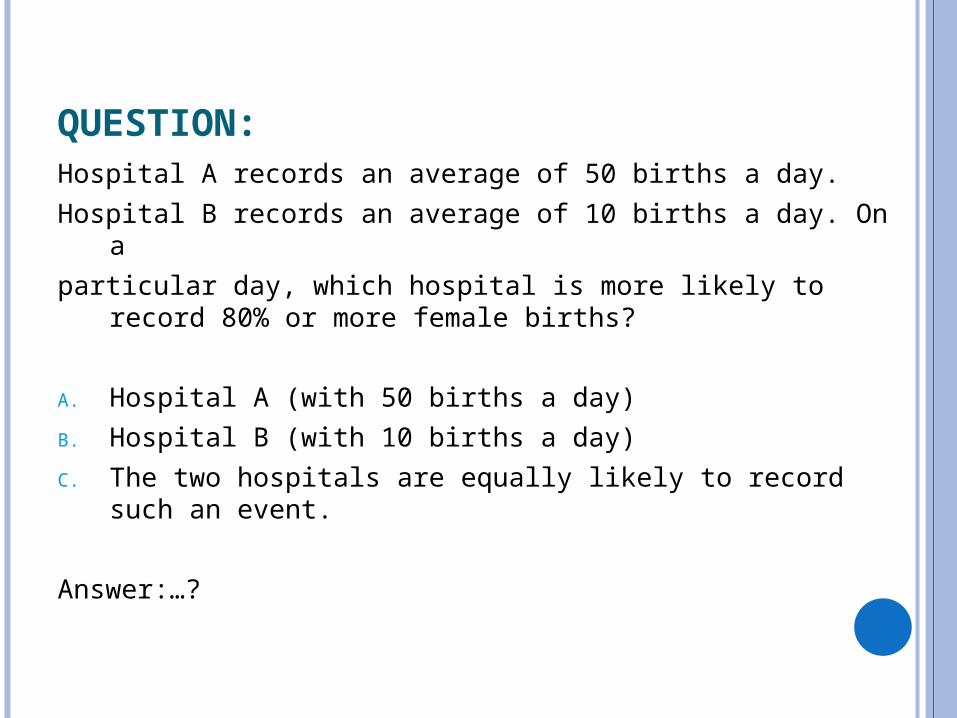
QUESTION:Hospital A records an average of 50 births a day.
Hospital B records an average of 10 births a day. On a
particular day, which hospital is more likely to record 80% or more female births?
A. Hospital A (with 50 births a day)
B. Hospital B (with 10 births a day)
C. The two hospitals are equally likely to record such an event.
Answer:…?
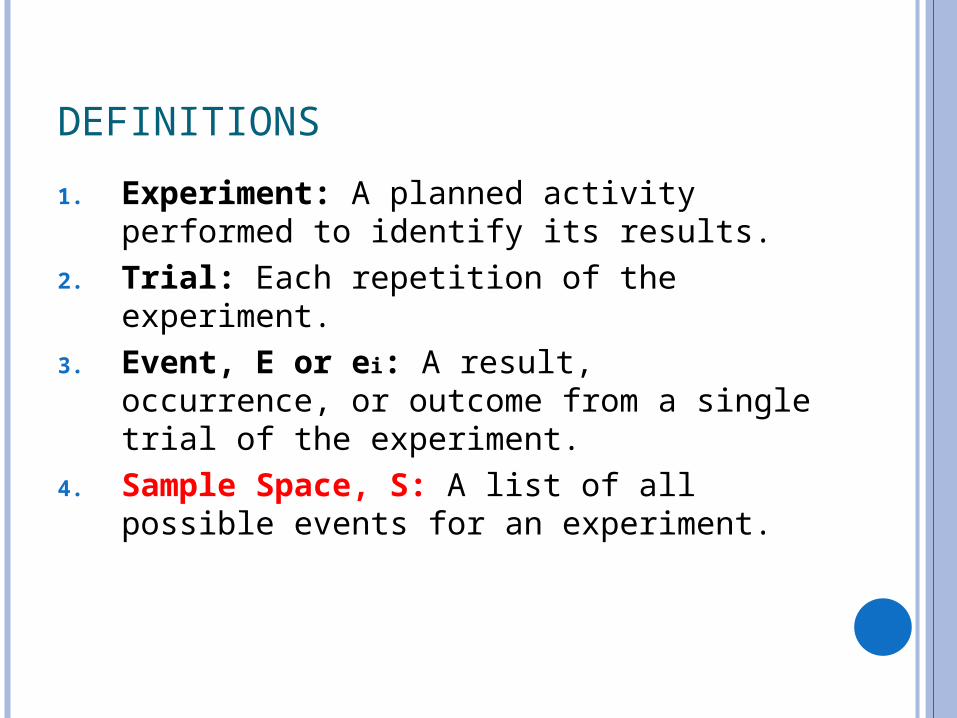
DEFINITIONS
1. Experiment: A planned activity performed to identify its results.
2. Trial: Each repetition of the experiment.3. Event, E or ei: A result, occurrence, or
outcome from a single trial of the experiment.
4. Sample Space, S: A list of all possible events for an experiment.
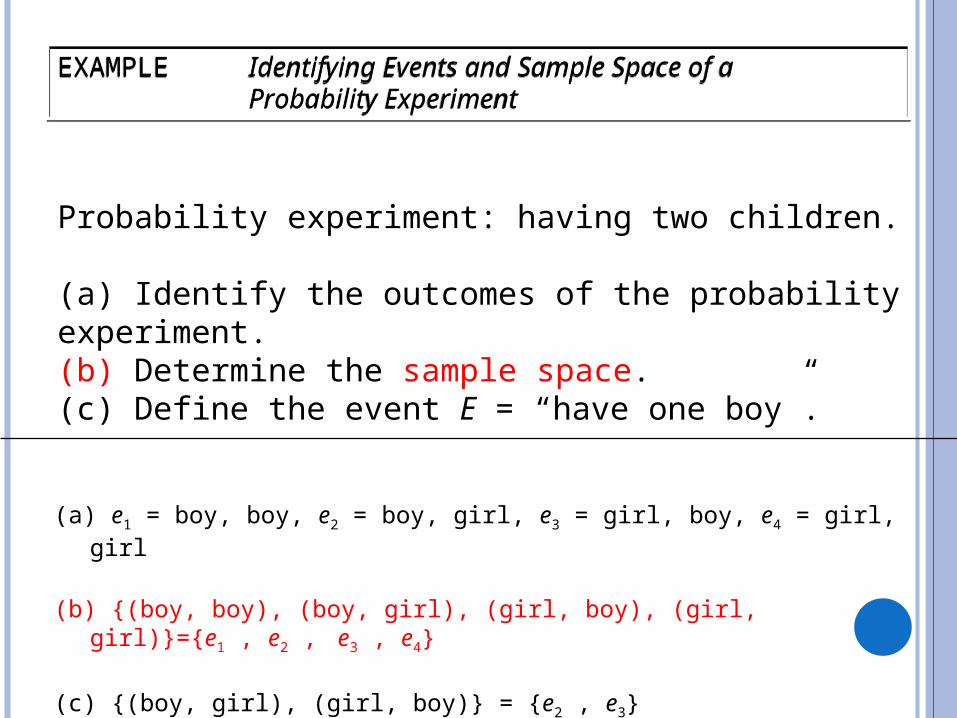
Probability experiment: having two children.
(a) Identify the outcomes of the probability experiment.(b) Determine the sample space.(c) Define the event E = “have one boy”.
EXAMPLE Identifying Events and Sample Space of a Probability Experiment
EXAMPLE Identifying Events and Sample Space of a Probability Experiment
(a) e1 = boy, boy, e2 = boy, girl, e3 = girl, boy, e4 = girl, girl
(b) {(boy, boy), (boy, girl), (girl, boy), (girl, girl)}={e1 , e2 , e3 , e4}
(c) {(boy, girl), (girl, boy)} = {e2 , e3}
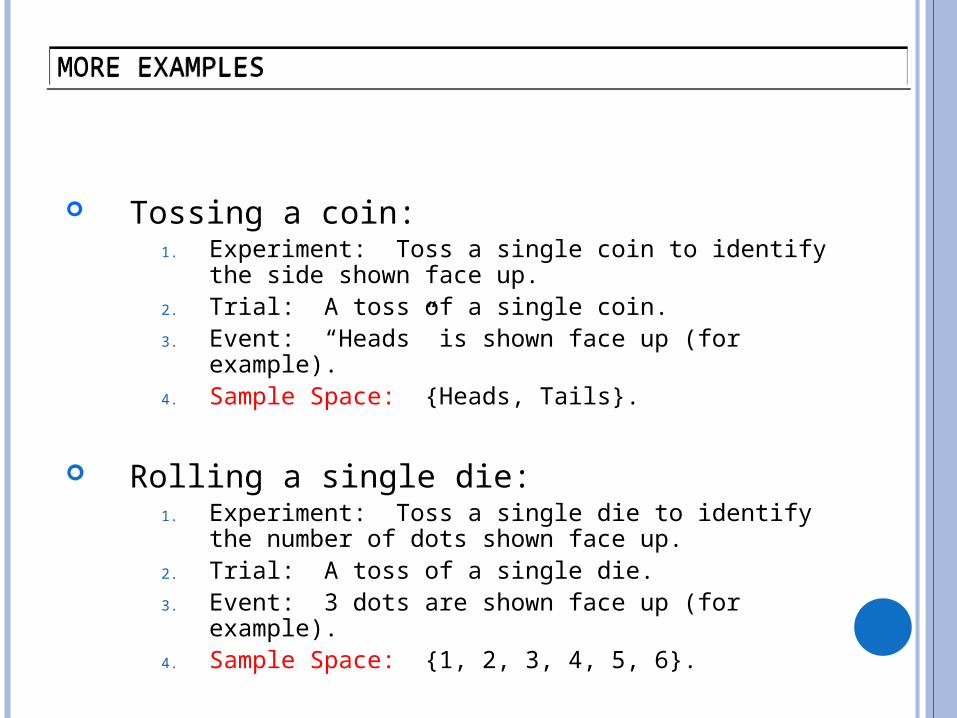
Tossing a coin:1. Experiment: Toss a single coin to identify the side
shown face up. 2. Trial: A toss of a single coin. 3. Event: “Heads” is shown face up (for example). 4. Sample Space: {Heads, Tails}.
Rolling a single die:1. Experiment: Toss a single die to identify the number
of dots shown face up. 2. Trial: A toss of a single die. 3. Event: 3 dots are shown face up (for example). 4. Sample Space: {1, 2, 3, 4, 5, 6}.
MORE EXAMPLESMORE EXAMPLES
EXAMPLEEXAMPLE
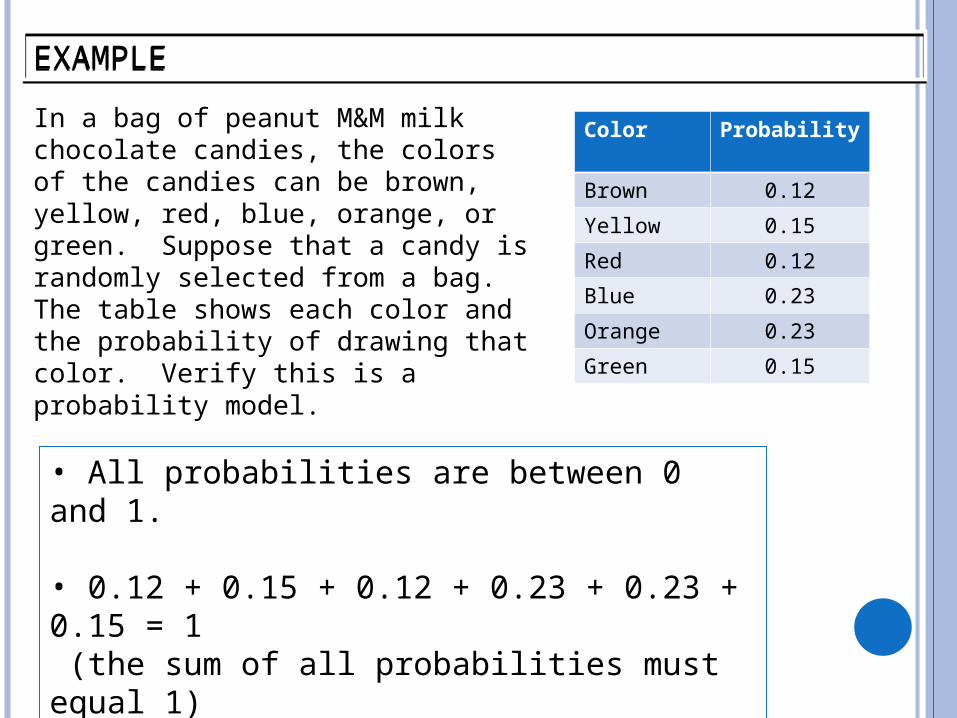
In a bag of peanut M&M milk chocolate candies, the colors of the candies can be brown, yellow, red, blue, orange, or green. Suppose that a candy is randomly selected from a bag. The table shows each color and the probability of drawing that color. Verify this is a probability model.
Color Probability
Brown 0.12
Yellow 0.15
Red 0.12
Blue 0.23
Orange 0.23
Green 0.15
• All probabilities are between 0 and 1.
• 0.12 + 0.15 + 0.12 + 0.23 + 0.23 + 0.15 = 1 (the sum of all probabilities must equal 1)
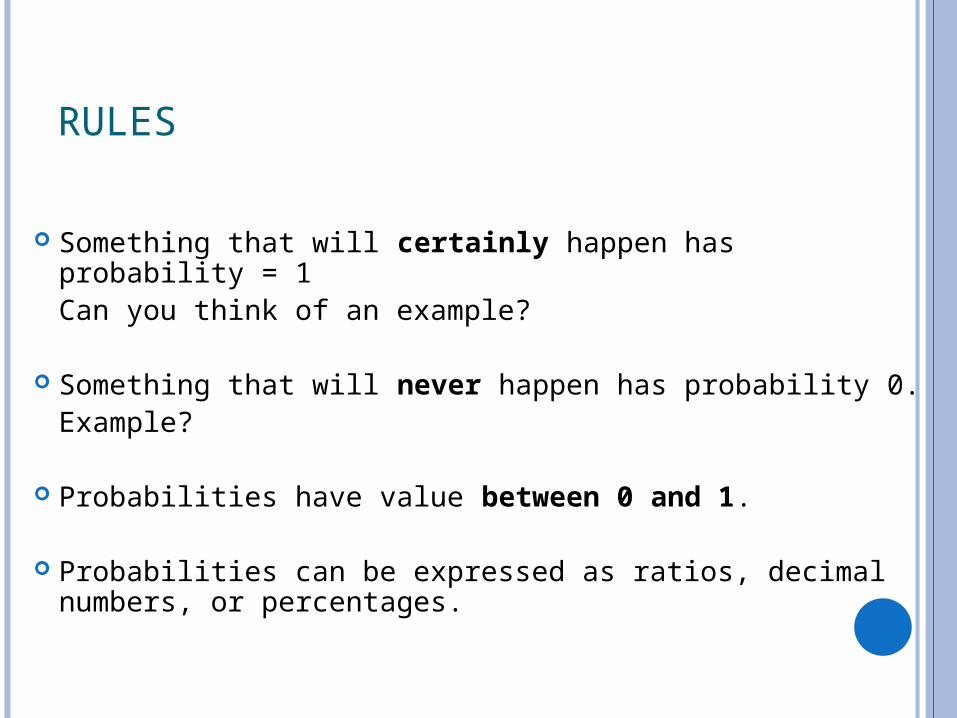
RULES
Something that will certainly happen has probability = 1Can you think of an example?
Something that will never happen has probability 0.Example?
Probabilities have value between 0 and 1.
Probabilities can be expressed as ratios, decimal numbers, or percentages.
EVALUATING PROBABILITIES
12
13
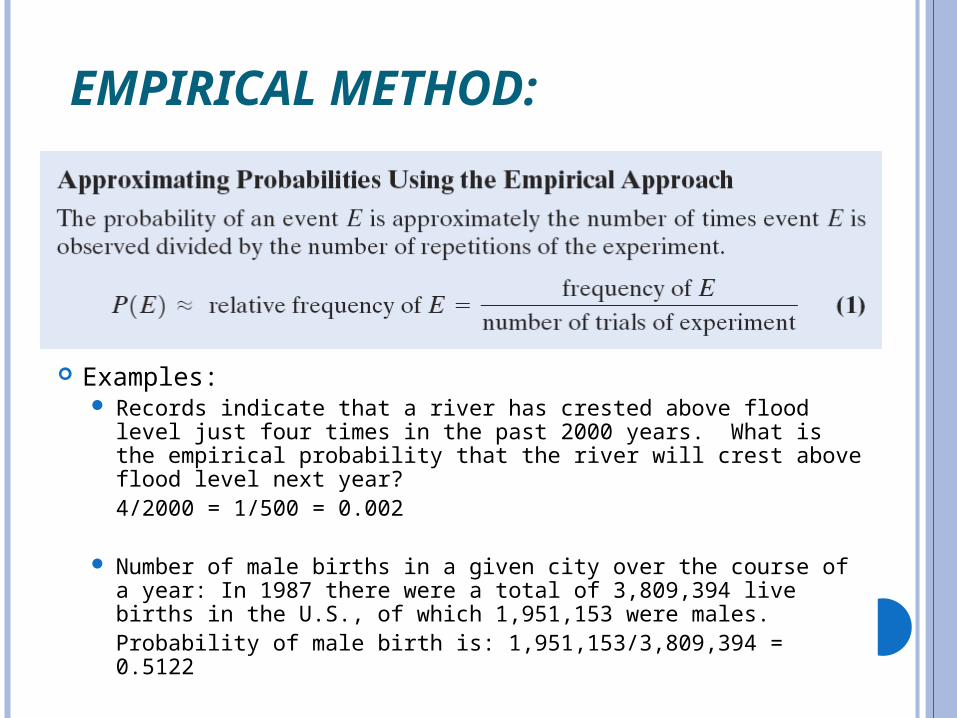
EMPIRICAL METHOD:
Examples: Records indicate that a river has crested above flood level
just four times in the past 2000 years. What is the empirical probability that the river will crest above flood level next year?4/2000 = 1/500 = 0.002
Number of male births in a given city over the course of a year: In 1987 there were a total of 3,809,394 live births in the U.S., of which 1,951,153 were males.Probability of male birth is: 1,951,153/3,809,394 = 0.5122
14
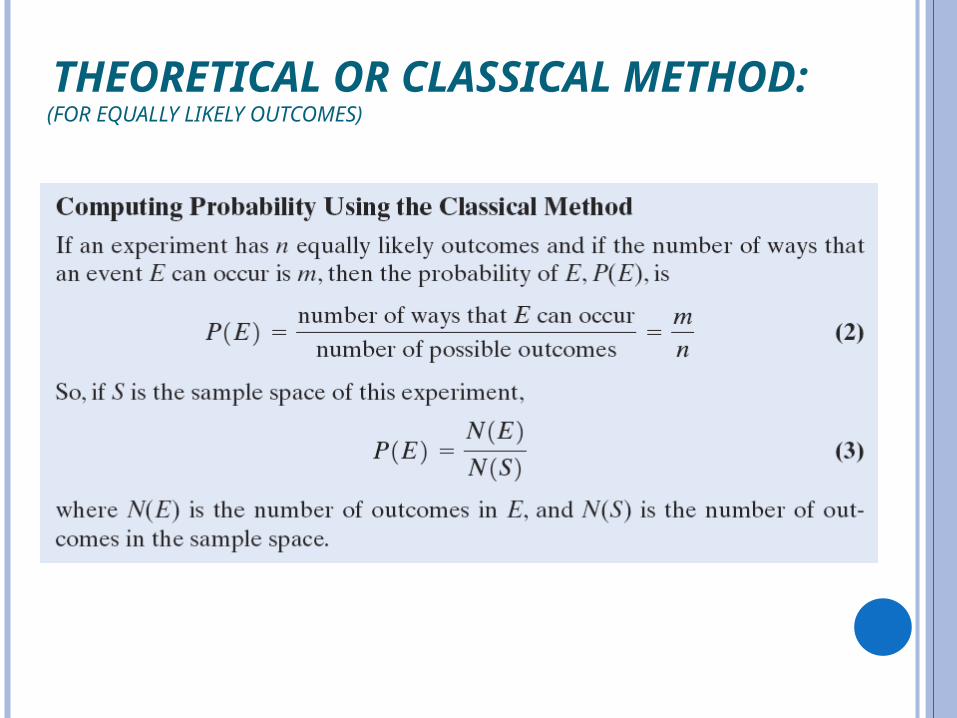
THEORETICAL OR CLASSICAL METHOD: (FOR EQUALLY LIKELY OUTCOMES)
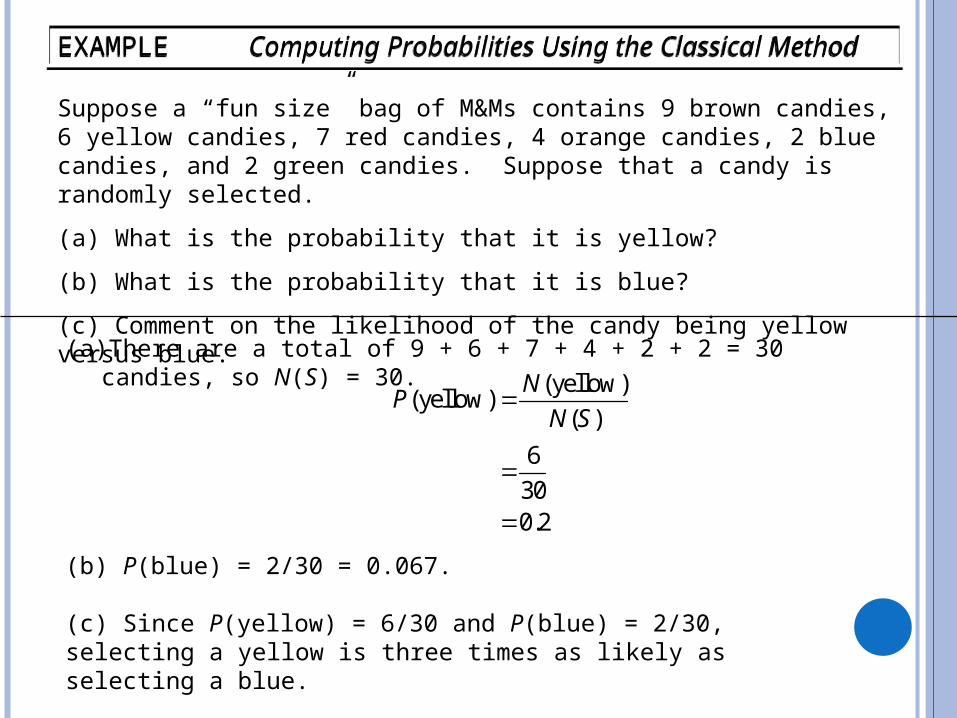
EXAMPLE Computing Probabilities Using the Classical MethodEXAMPLE Computing Probabilities Using the Classical Method
Suppose a “fun size” bag of M&Ms contains 9 brown candies, 6 yellow candies, 7 red candies, 4 orange candies, 2 blue candies, and 2 green candies. Suppose that a candy is randomly selected.
(a) What is the probability that it is yellow?
(b) What is the probability that it is blue?
(c) Comment on the likelihood of the candy being yellow versus blue.
(a) There are a total of 9 + 6 + 7 + 4 + 2 + 2 = 30 candies, so N(S) = 30. (yellow)
(yellow)( )
6
300.2
NP
N S
(b) P(blue) = 2/30 = 0.067.
(c) Since P(yellow) = 6/30 and P(blue) = 2/30, selecting a yellow is three times as likely as selecting a blue.
16
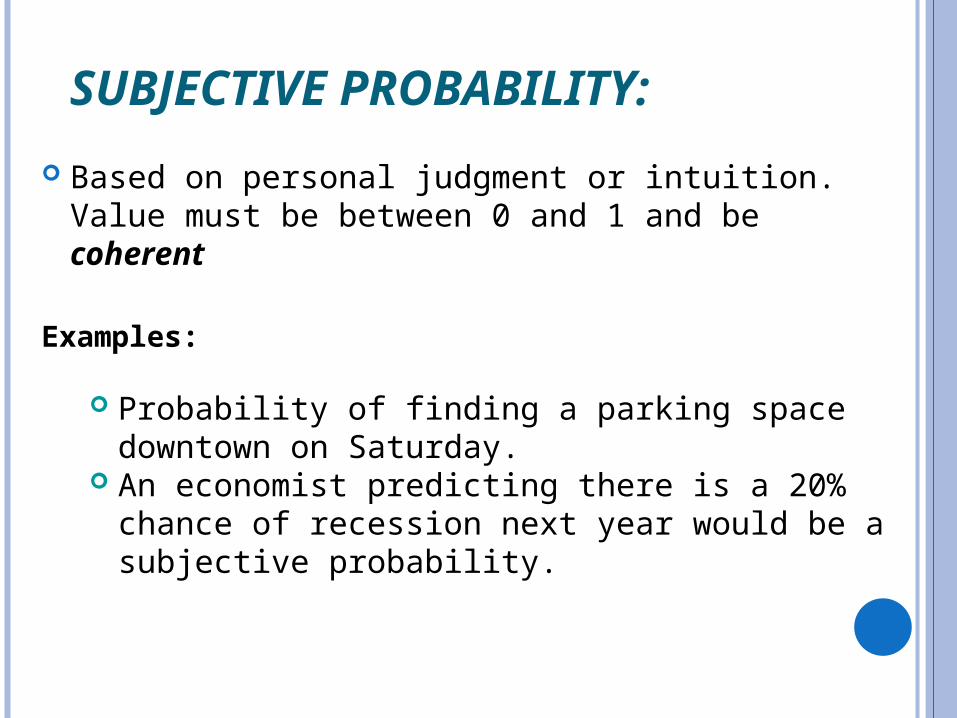
SUBJECTIVE PROBABILITY:
Based on personal judgment or intuition. Value must be between 0 and 1 and be coherent
Examples:
Probability of finding a parking space downtown on Saturday.
An economist predicting there is a 20% chance of recession next year would be a subjective probability.
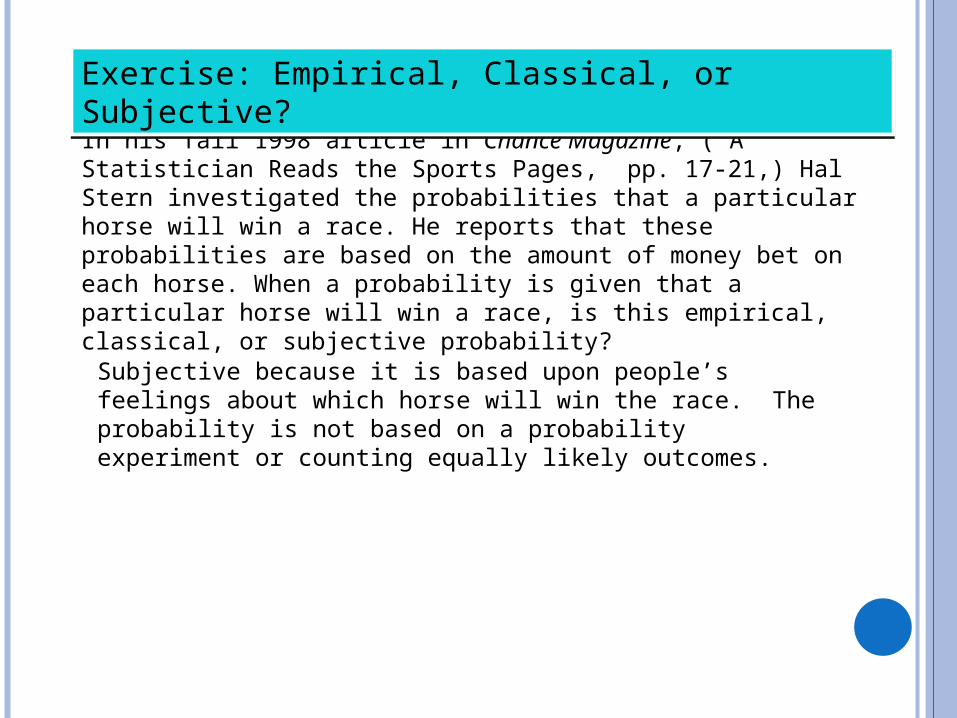
In his fall 1998 article in Chance Magazine, (“A Statistician Reads the Sports Pages,” pp. 17-21,) Hal Stern investigated the probabilities that a particular horse will win a race. He reports that these probabilities are based on the amount of money bet on each horse. When a probability is given that a particular horse will win a race, is this empirical, classical, or subjective probability?
Exercise: Empirical, Classical, or Subjective?Exercise: Empirical, Classical, or Subjective?
Subjective because it is based upon people’s feelings about which horse will win the race. The probability is not based on a probability experiment or counting equally likely outcomes.
5.2 ADDITION RULE
18
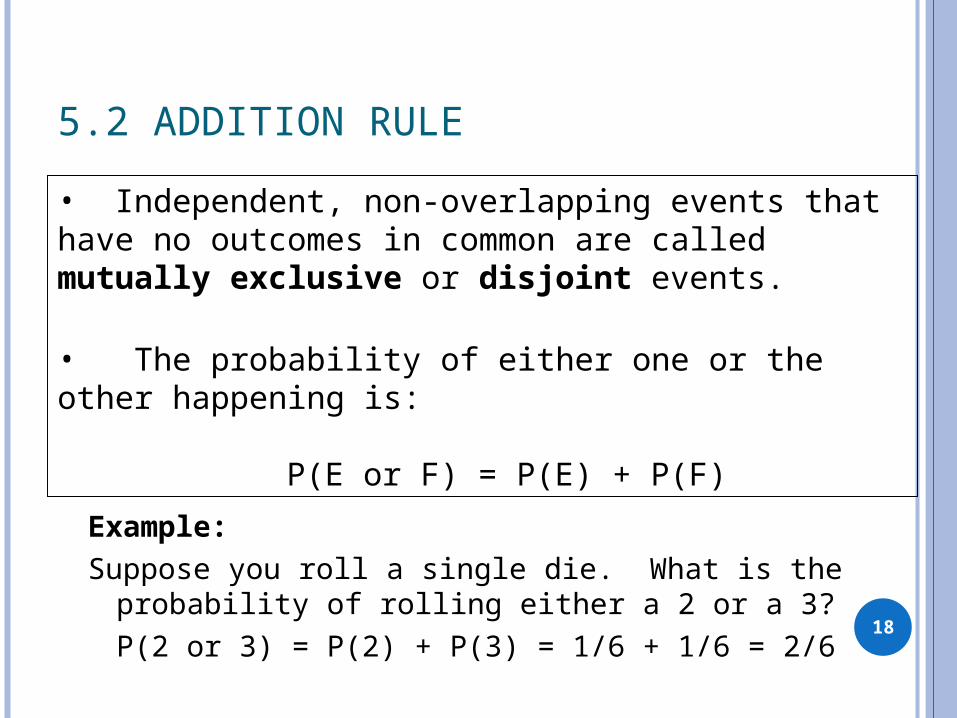
• Independent, non-overlapping events that have no outcomes in common are called mutually exclusive or disjoint events.
• The probability of either one or the other happening is:
P(E or F) = P(E) + P(F)
Example: Suppose you roll a single die. What is the probability
of rolling either a 2 or a 3?P(2 or 3) = P(2) + P(3) = 1/6 + 1/6 = 2/6
19
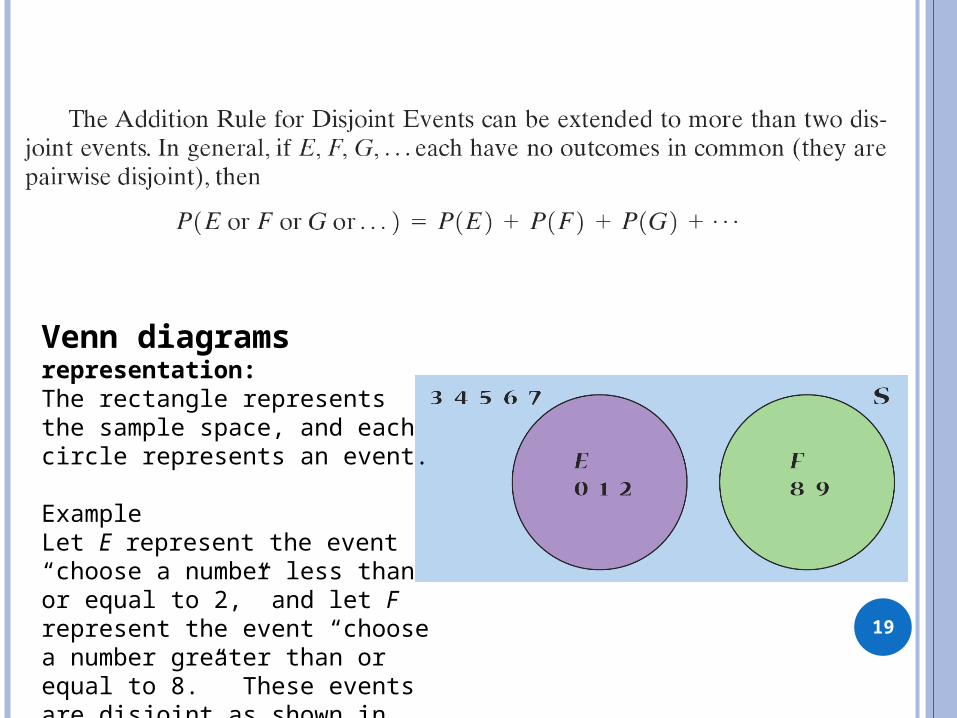
Venn diagrams representation: The rectangle represents the sample space, and each circle represents an event. ExampleLet E represent the event “choose a number less than or equal to 2,” and let F represent the event “choose a number greater than or equal to 8.” These events are disjoint as shown in the figure.
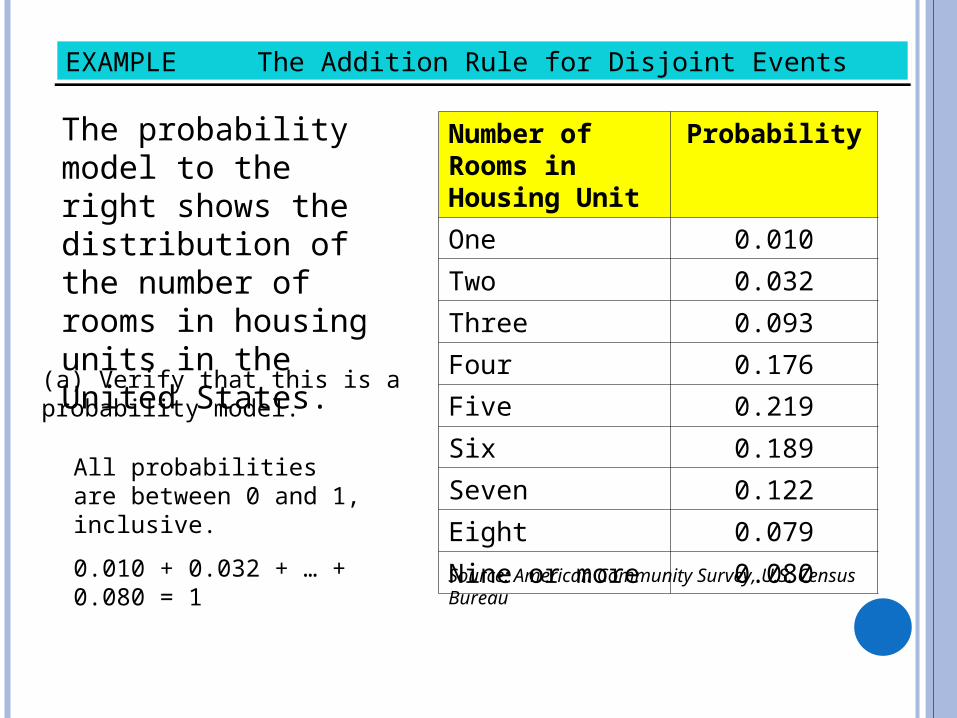
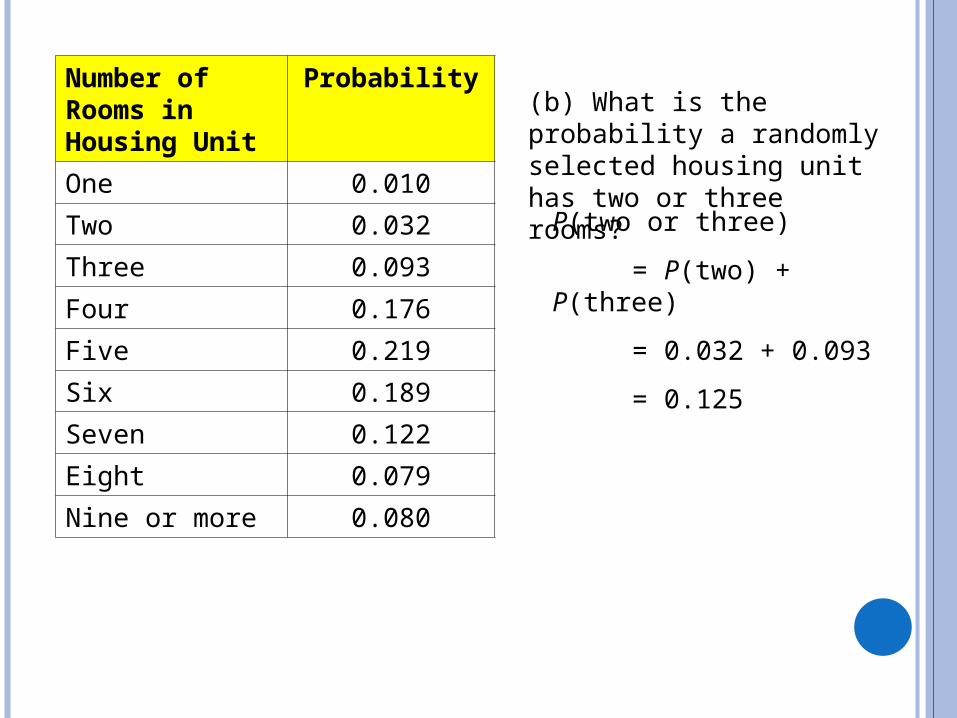
The probability model to the right shows the distribution of the number of rooms in housing units in the United States.
Number of Rooms in Housing Unit
Probability
One 0.010
Two 0.032
Three 0.093
Four 0.176
Five 0.219
Six 0.189
Seven 0.122
Eight 0.079
Nine or more 0.080Source: American Community Survey, U.S. Census Bureau
EXAMPLE The Addition Rule for Disjoint EventsEXAMPLE The Addition Rule for Disjoint Events
(a) Verify that this is a probability model.
All probabilities are between 0 and 1, inclusive.
0.010 + 0.032 + … + 0.080 = 1
Number of Rooms in Housing Unit
Probability
One 0.010
Two 0.032
Three 0.093
Four 0.176
Five 0.219
Six 0.189
Seven 0.122
Eight 0.079
Nine or more 0.080
(b) What is the probability a randomly selected housing unit has two or three rooms?
P(two or three)
= P(two) + P(three)
= 0.032 + 0.093
= 0.125
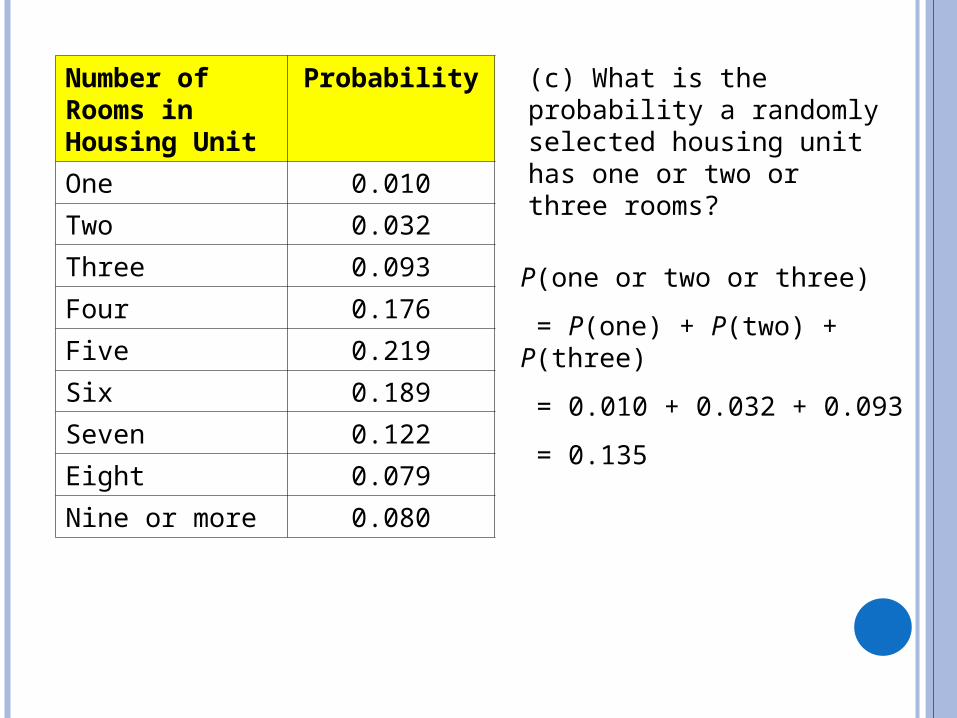
(c) What is the probability a randomly selected housing unit has one or two or three rooms?
Number of Rooms in Housing Unit
Probability
One 0.010
Two 0.032
Three 0.093
Four 0.176
Five 0.219
Six 0.189
Seven 0.122
Eight 0.079
Nine or more 0.080
P(one or two or three)
= P(one) + P(two) + P(three)
= 0.010 + 0.032 + 0.093
= 0.135
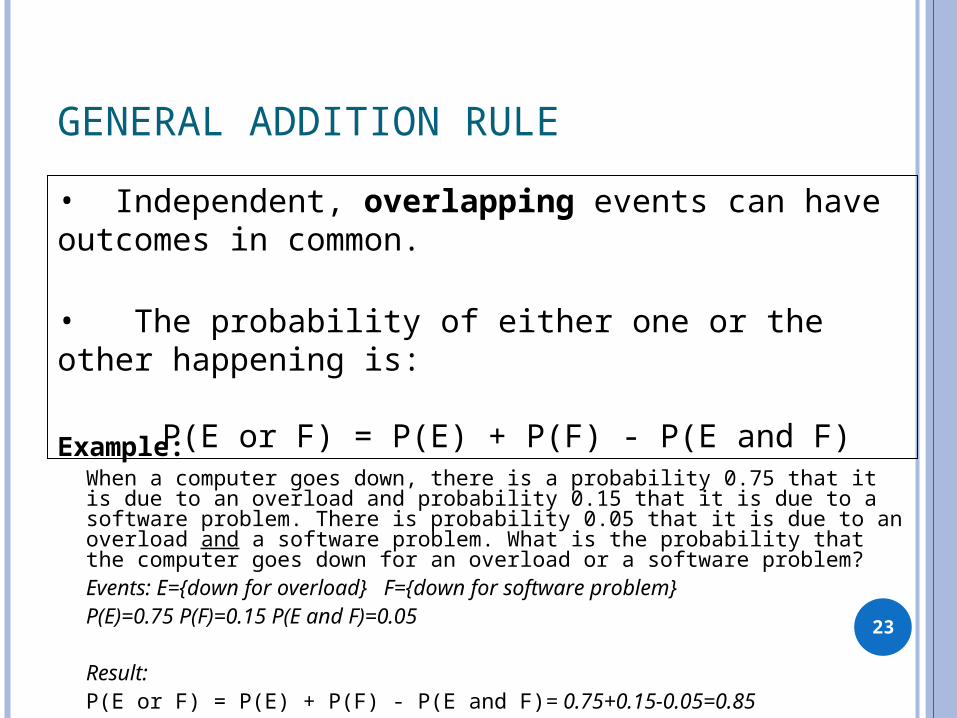
GENERAL ADDITION RULE
23
• Independent, overlapping events can have outcomes in common.
• The probability of either one or the other happening is:
P(E or F) = P(E) + P(F) - P(E and F)Example: When a computer goes down, there is a probability 0.75 that it is due to an overload and probability 0.15 that it is due to a software problem. There is probability 0.05 that it is due to an overload and a software problem. What is the probability that the computer goes down for an overload or a software problem?Events: E={down for overload} F={down for software problem}P(E)=0.75 P(F)=0.15 P(E and F)=0.05
Result:P(E or F) = P(E) + P(F) - P(E and F)= 0.75+0.15-0.05=0.85
24
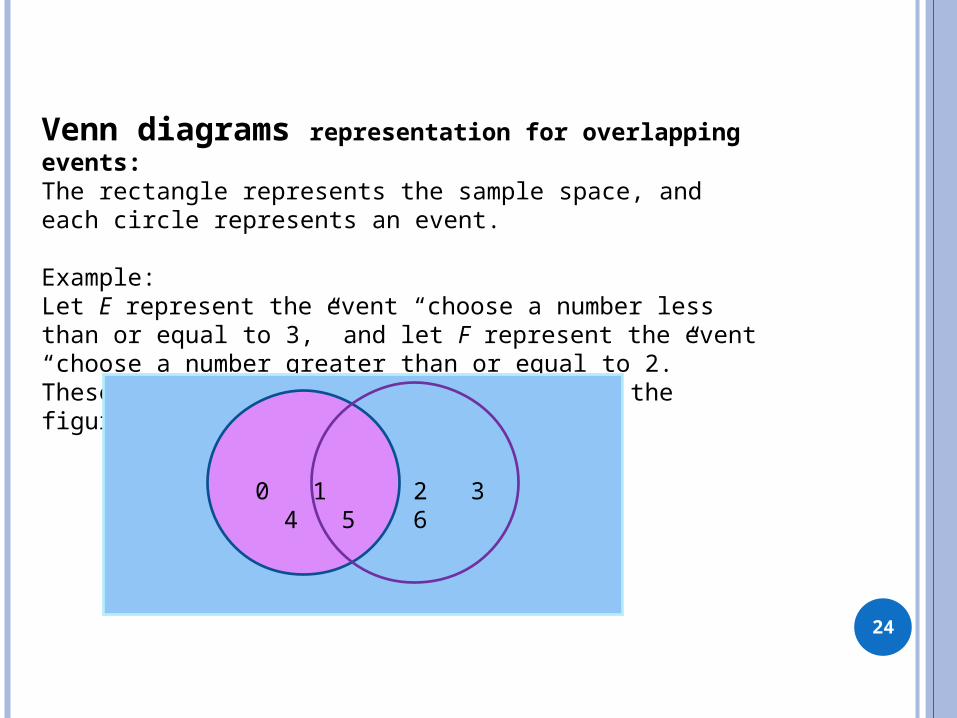
Venn diagrams representation for overlapping events: The rectangle represents the sample space, and each circle represents an event.
Example:Let E represent the event “choose a number less than or equal to 3,” and let F represent the event “choose a number greater than or equal to 2.” These events have an overlap as shown in the figure.
0 1 2 3 4 5 6
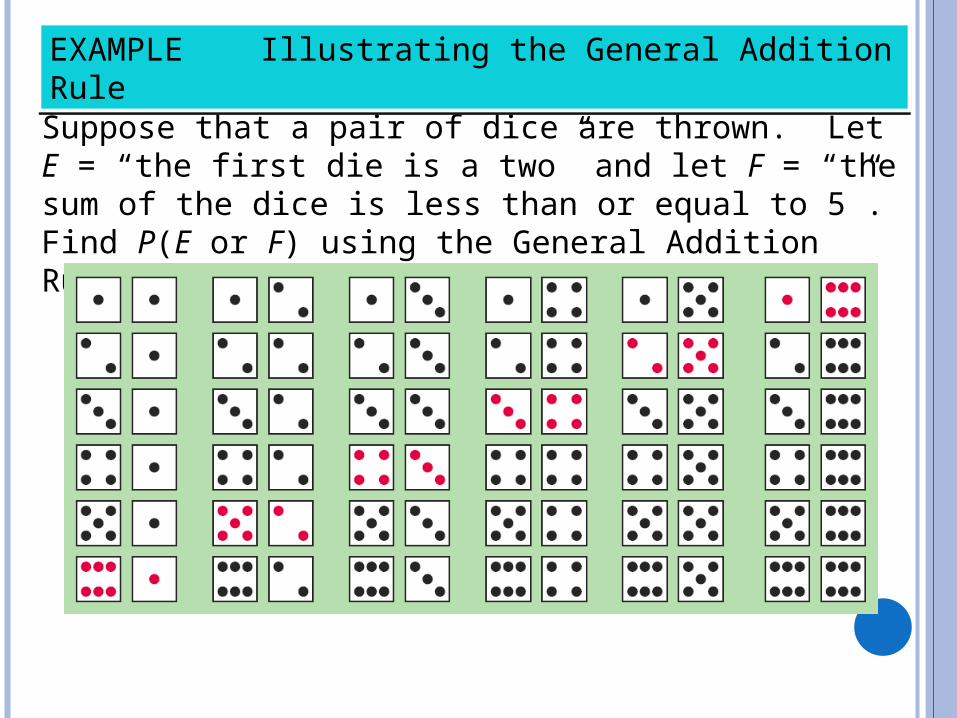
Suppose that a pair of dice are thrown. Let E = “the first die is a two” and let F = “the sum of the dice is less than or equal to 5”. Find P(E or F) using the General Addition Rule.
EXAMPLE Illustrating the General Addition RuleEXAMPLE Illustrating the General Addition Rule
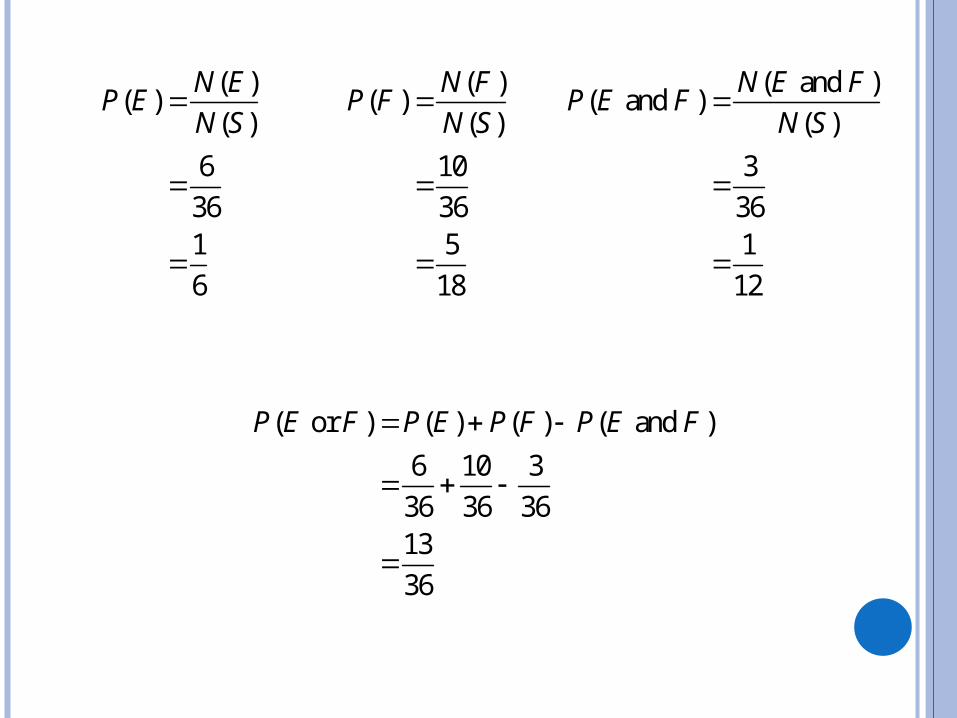
( )( )
( )
6
361
6
N EP E
N S
( )( )
( )
10
365
18
N FP F
N S
( and )( and )
( )
3
361
12
N E FP E F
N S
( or ) ( ) ( ) ( and )
6 10 3
36 36 3613
36
P E F P E P F P E F
27
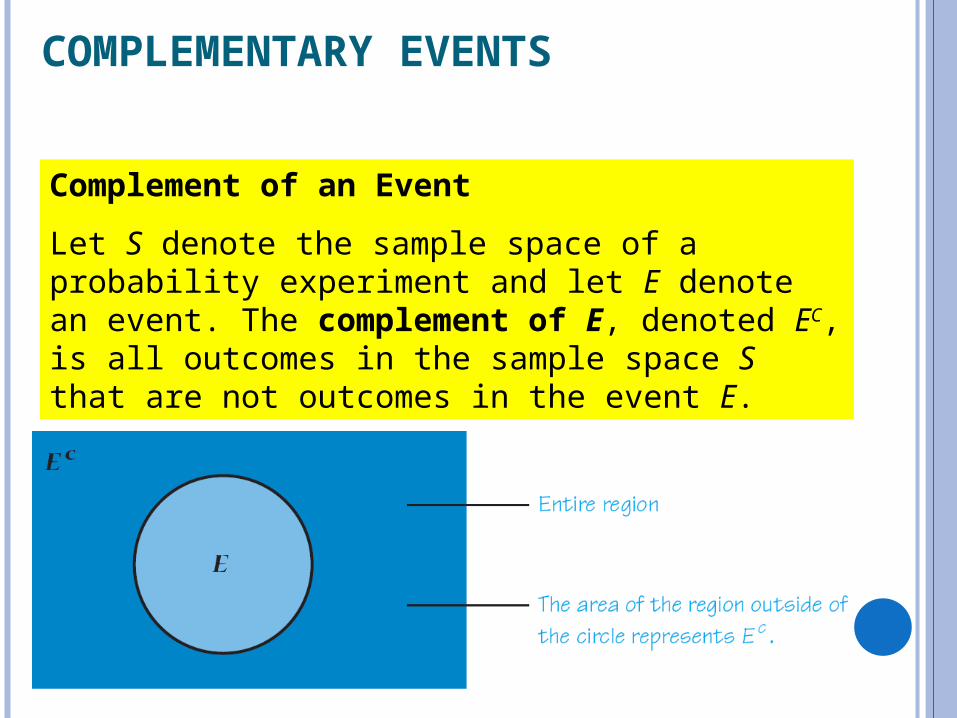
COMPLEMENTARY EVENTS
Complement of an Event
Let S denote the sample space of a probability experiment and let E denote an event. The complement of E, denoted EC, is all outcomes in the sample space S that are not outcomes in the event E.
28
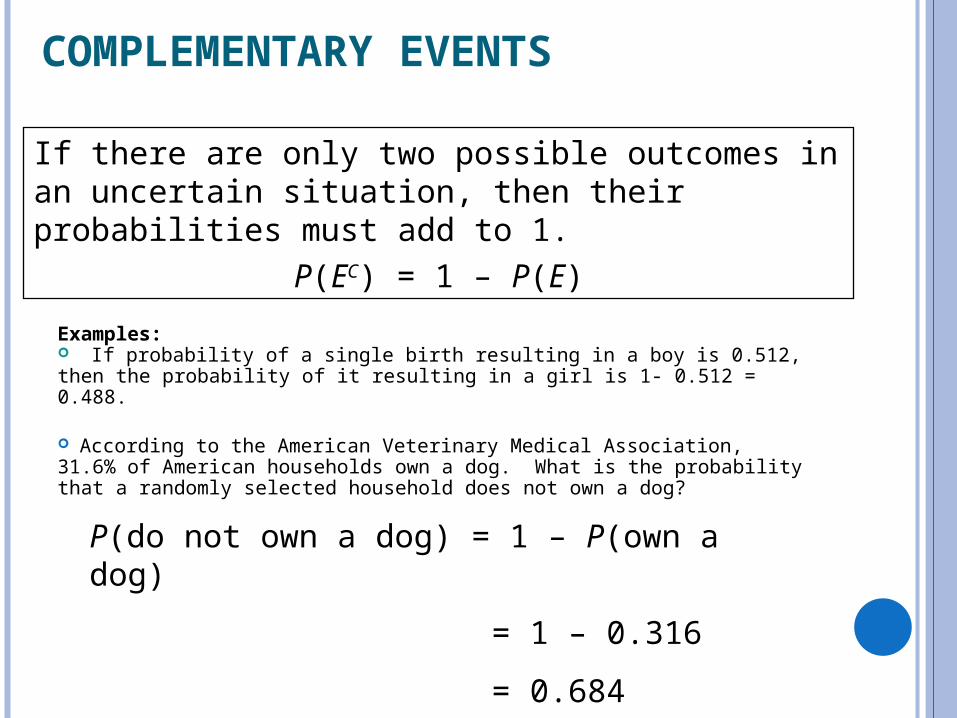
COMPLEMENTARY EVENTS
If there are only two possible outcomes in an uncertain situation, then their probabilities must add to 1.
P(EC) = 1 – P(E)
Examples: If probability of a single birth resulting in a boy is 0.512, then the probability of it resulting in a girl is 1- 0.512 = 0.488.
According to the American Veterinary Medical Association, 31.6% of American households own a dog. What is the probability that a randomly selected household does not own a dog?
P(do not own a dog) = 1 – P(own a dog)
= 1 – 0.316
= 0.684
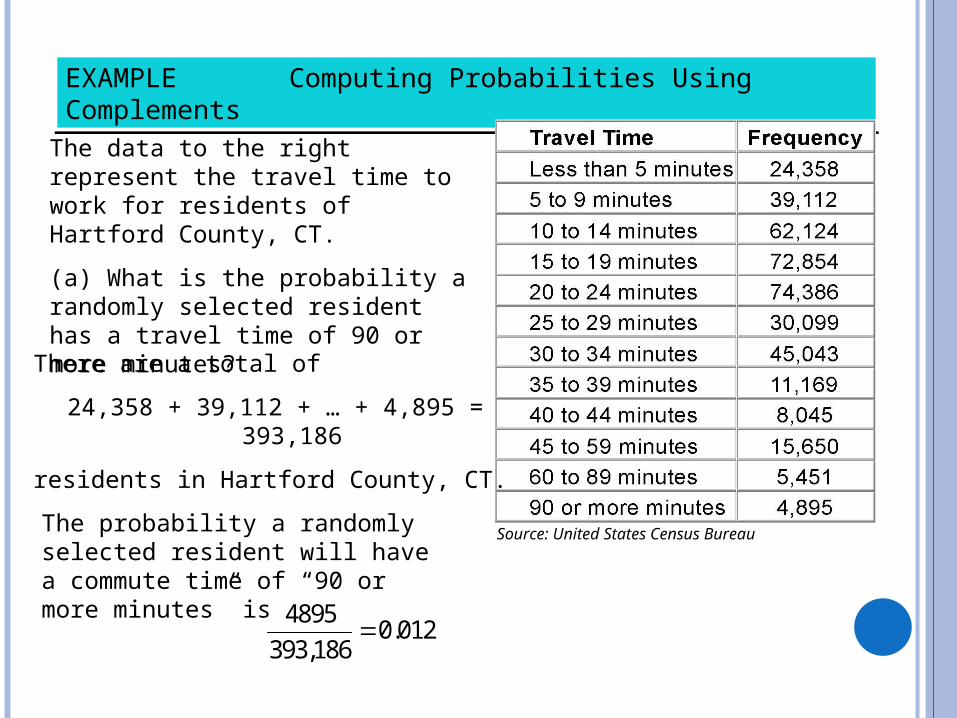
The data to the right represent the travel time to work for residents of Hartford County, CT.
(a) What is the probability a randomly selected resident has a travel time of 90 or more minutes?
EXAMPLE Computing Probabilities Using Complements EXAMPLE Computing Probabilities Using Complements
Source: United States Census Bureau
There are a total of
24,358 + 39,112 + … + 4,895 = 393,186
residents in Hartford County, CT.
48950.012
393,186
The probability a randomly selected resident will have a commute time of “90 or more minutes” is
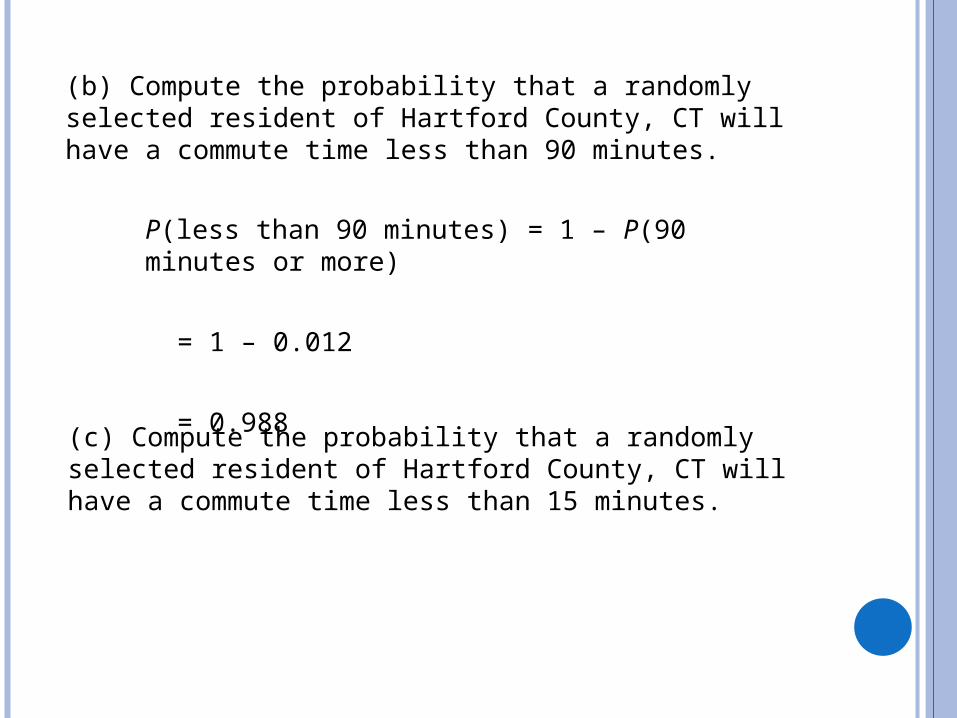
(b) Compute the probability that a randomly selected resident of Hartford County, CT will have a commute time less than 90 minutes.
P(less than 90 minutes) = 1 – P(90 minutes or more)
= 1 – 0.012
= 0.988
(c) Compute the probability that a randomly selected resident of Hartford County, CT will have a commute time less than 15 minutes.


![[Chapter 5. Multivariate Probability Distributions]viz.acg.maine.edu/~zwei/data/STS437/Chapter5.pdf[Chapter 5. Multivariate Probability Distributions] 5.1 Introduction 5.2 Bivariate](https://img.pdfslide.us/doc/110x75/5f11e91df488510f276f2a4f/chapter-5-multivariate-probability-distributionsvizacgmaineeduzweidatasts437.jpg)