Embed Size (px)
Citation preview

• ns
; C G>
"'C tn ~
c t: 0 .- 0 ....., CD CD
~ :E en
@ ~
~ 0 o.,.rJ!itJ ffi
....., ~
(.) ~ CD ~ ~ ~ .-~ rJ!itJ C
• rJ!itJ "'""" I"-
@ 0 a
@ a Ct::::::::J N cg C~ ""C M g ~ I
rJ!itJ CU N
@ .s::
rrt ~ 0 ~ ©Q) CO co
:2
• CONFIDENTIAL FMAC-FCIC 000044685

.....
•
• (1)
> 0 .... Q.
(1) E rn rn ,- 0 .....
..c:::: ..... (1) CJ rn ~ c .... ns (1) ns
~ .... ~ :E LL C
~ ..... ~
C) :::l C c t:: (1)
@) ,-0 CJ .....
~ rn Q. ns ~ ')( Q. '-'0 © w 0 <C U
, , , - - --I
.~ ~ ,Q
:g ~ Q)?l~ • ~:;s
~~I
CONFIDENTIAL FMAC-FCIC 000044686

CONFIDENTIAL FMAC-FCIC 000044687

•
Q) t/J .--'= (.) s::::: ca ~
LL
• C) s::::: .-... t/J .->< W
• -
• CONFIDENTIAL FMAC-FCIC 000044688

() o Z "'Tl H o rn z --l H » r
"'Tl :s:: » () I
"'Tl () H ()
o o o o .j:>. .j:>. 0"1 00 ~
• • • QFreddie ~Mac I
T[hl® [E~~®[/IT'D@l ~ @l IT'DtdJ ~ IT'D~® [{,IT'D@ ~ [p>[/®~~Q,1] [/®~
(Q)IT'D ~[hl® [8SQ,1]~~IT'D®~~ [F{]@l%7® ~IT'D~®IT'D~D~~®tdJ We make home possible"
Regulation
• Burdens of capital surcharge, growth cap
• Housing goals escalating
• Further legislative constraints possible (e.g., housing fund)
Competition in existing franchise
Internal challenges
• Fannie Mae is larger and operates at lower costs, in a commoditized business
• G-fees declining
Market
• Narrowing spreads
• Originator consolidation
• Credit may be worsening
• Limited GSE participation in non prime mortgages I products
• Management attention and resources strained by financial remediation
• Escalating cost structure
3

() o Z "'Tl H o rn z --l H » r
"'Tl :s:: » () I
"'Tl () H ()
o o o o .j:>. .j:>. 0"1 ~ o
• • QFreddie rill Mac
I W@ ~rt'@ @l~ Il?:!.D~~ (Q)~ IF@lm 1l1l~ 18l@~(Q)'W OIUJrt' 1l?:!.@~1UJ rt'1l1l
~~[p)~ If'@l~~(Q)[(l)~ We make home possible'"
Over a 3-5 year horizon, profitability in our businesses threaten to bring our fair value returns below our low-to-mid-teens guidance
Existing franchise
Single Family - new business projected at below 11 % ROE Multifamily on economic capital • ROEs at 11-12%
• Credit costs are rising - and may be more severe than • Market small expected • Poor competitive
• Volume set to grow at 8%, in line with total mortgage debt position vs. FNM
• Satisfying escalating housing goals is difficult and costly • Accretive to housing goals
Retained Portfolio - -15% ROE projected at current spreads, but slow growth*
Capital surcharge - a further drag on fair value returns (-4 percentage points drag on returns on fair value of net assets)
w~ $~U~~ ~1l1l](Ql~ tal WUll1lcdl(Qlw (Ql~ (QlLO>LO>(Q)lliclUJll1lo~~ ~(Q) talcdl]lUI~~ C<OllUlli$e
o Rapid house price appreciation has lowered credit costs on existing book
o Continued healthy earnings from Retained Portfolio
Note: All line of business ROEs in this document refer to returns on economic capital, net of G&A allocations
* Does not include returns from interest rate risk management
•
4

() o Z "'Tl H o rn z --l H » r
"'Tl :s:: » () I
"'Tl () H ()
o o o o .j:>. .j:>. 0"1 ~ I-'
• QFreddie c:QjMac We make home possible'"
20%
• I [E~[p)®~~®cdl ~®~lUJ~mJ~ (Q)mJ ~®W §omJ~~® f@lmO~W
~(U]@l~@lmJ~®® ~lUJ~OmJ®~~ ~@l~® [O)®~~OmJ®(d]
Ex-ante lifetime ROE by purchase year*
17.0%
Cr~<dIo~ o~ ~~~
~~li' l1.n1n~IT1l(QJWIT1l
Primary drivers behind
•
15.3% ,-- 15.4%
/
projections: - -
12.7% 15%
-
10%
5%
10.4% ;-- --: , I
I I
I
1 Credit costs t (used to be . projected at 4 bp, now 7 bp -
equivalent to 3% ROE drop)
2. G-fees in decline (e.g., 1 % ROE point fall in '07)
, ,
0%
,
I
3. G&A remains high (traditionally 1-2 bp higher than FNM)
I I I
2002 2003 2004 2005 2006
* Projection at time of funding
Source: Freddie Mac Single Family LOB projections
Rl1.n~<e CQl~ UmlTiTil[b): ~ ~ [blIP DInl rcevt6Inll1.nt6 (9J<alOIT1l~ I (6~IP(6IT1l~(6 Cl1.n~ :;;::
~ ~ % ROllE IP(QJOIT1l~ DInCr@<al~(6
4. Capital - risk-based capital up nearly 50% since 2004 (for business reasons, not regulation)
And we continue to suffer a funding disadvantage vs. FNM (3-4 bp)
5

() o Z "'Tl H o rn z --l H » r
"'Tl :s:: » () I
"'Tl () H ()
o o o o .j:>. .j:>. 0'1 ~ N
• QFreddie c:§jMac We rnaka home possible"
• I ~11'@cdlo~ l©~~@~ ~@l'1i'@ i8l@@1J'il ~@1i1f' l©w,
[B5[U]~ W® [P[f@j®~~ U~®M ~@ ~[Jl)~[f®@}~®
We and the mortgage industry have enjoyed very low credit losses 2000-2006, primarily driven by rapid home price appreciation (HPA)
FRE realized credit losses* (bp)
16
12.2 12
8
4
60
45
30 2-3
15
Thrifts' net charge-offs on residential mortgages (bp)
0 I~JT[~il~, T
___ ~"!':"~'::'~R>.~_. ~ 34
~ 1.8 ~ T rD-,-D_r_o_rD-,-D-,D,D,D-,- T l o+---~--~--~--~----~
...... ...... ...... ...... ...... ...... ...... ...... ...... I\.) I\.) 1\.)1\.)1\.)1\.) CD CD CD CD <0 <0 CD <0 <0 a a 0000 OJ OJ OJ OJ <0 <0 CD <0 <0 a a 0000 w (J1 --.j <0 ...... W (J1 --.j <0 ...... W (}1Ol--.jOJ
* Includes net-charge-offs, REO operations expense, and lost interest Source: Freddie Mac
91 94 97 00
Note: data series starts in 1991 Source: FDIC
03 06
•
6

() o Z "'Tl H o rn z --l H » r
"'Tl :s:: » () I
"'Tl () H ()
o o o o .j:>. .j:>. 0"1 ~ w
• QFreddie c:§jMac We make home possible"
• (Q)(U] [f M(Q)dl®~~ [P)[f(Q)]®~~ ~ D~ [h®[f l(Q)~~®§ ~(Q)[f
U\l]®w [E(u]~D!ri)®~~
For '06 book, credit losses are projected at 7 bp on average, assuming 4% home price appreciation (HPA) per year
•
This translates into losses on the portfolio of 3-4 bp in coming years, buoyed by prior vintages
Distribution of DEFCAP outcomes for 2006 purchases*
50th percentile = 6.0 bp
Top quintile of home price pillths (recent
experience)
30% ~
25% -
Mean = 7.1 bp, based on 4% annual HPA I I I I I I I I
m 20% E
I
o .B ::::J o -o
15%
~ 10% o
5%
0%
0-2 2-4 4-6 6-8
Losses if current environment persists
90th percentile loss (corresponds to
flat prices through 2011, then rising) A r,.------ --------.., I
I
___ ~_'_D_~D~I D~_.,_=~~ , ~ 8-10 10-12 12-14 14-16 16-18 18-20 20-22 22-24 24-26 26-28
Expected annual default cost (bp)
* YTD purchases through November. Distribution based on 150 paths from PortVal.
Source: Freddie Mac Credit Policy 7
() o Z "'Tl H o rn z --l H » r
"'Tl :s:: » () I
"'Tl () H ()
o o o o .j:>. .j:>. 0"1 ~ .j:>.
• • • QFreddie c::§jMac
(QJ(U][f CC(U]~~(Q)M®[j~ ~@~® ~®®mJ (QJ[jO~OmJ@~OmJ~
~D~lK\o®[f l(Q)@mJ~ We make home possible"
We are already taking on riskier products in our flow business ...
Proportion of TL TV* > 95% loans % of interest-only (10) mortgages have more than tripled in product mix is increasing
CI 12 CIl 20 18 C) C) C'CI C'CI -- c c 8 os: 9 os: 15
W W c:: 0:: LL. 6 LL. 10 CD CD 7 c c c 205 c
D N 3 N 5 - D ....
0 0
~ ~ 0 0
0 0
2005 Q3·200S 2005 Q3·2006
... and increasing risk layering, leading to more "Caution" scores
B
6
4
2
% of flow purchases with TL TV* > 90% and FICO** < 680
O~----~----~----~----~
2003 2004 2005 2006
.. Totalloan-to-value includes second-lien mortgages
** FICO credit score, the industry standard offered by Fair Isaac, using an 850 point scale
Source: Freddie Mac Credit Policy
Defect rate** (% of flow purchases)
16
12
2003 2004 2005 2006
** Portion of flow deliveries scored as LP "Caution" without compensation
In addition, we are obtaining less credit protection
• Credit enhancement is near historic lows
• Mortgage insurance is absorbing a reduced share of losses
"Caution" loans typically have 2-3X greater default costs
8

() o Z "'Tl H o rn z --l H » r
"'Tl :s:: » () I
"'Tl () H ()
o o o o .j:>. .j:>. 0"\ ~ Ul
• • QFreddie ~Mac
~(Q)M® (Q)~ CQ}[u]lr CC[U][J'[f®OI)~ [p[u]lrCC~@}§®§ ~@}\#®
We make home possible'" ~[U][b)~lr~M®al~~® ~~§~
We already purchase subprime-like loans to help achieve our HUD goals ,
, , ~=d=======
D D
Product/Deal LTV FICO
Home Possible & Similar Product 98% 687
Wachovia eRA Deal 97% 662
Example Manufactured Housing 75% 724 purchases in 2006 Mtg Revenue Bonds 94% 699
Worst 10% of Flow Business· 80% 674
Subprime (fixed rate) D 88% 650
D=========
r - - - - --0 I 0 I
G-fee (all-in) : ROE**
0.5% 31
-8.0% 9
1.0% 25
5.0% 29
0.0% 26
? 125-150
, ,
Subgoal Eligible
, , ,
80%
100%
34%
86%
21%
50%
Hit Rates Low-Mod Special Income Affordable
82% 37%
100% 100%
68% 34%
94% 50%
72% 35%
90% 35%
But we receive considerably lower fees than subprime loans would fetch in the market
* Excludes Home Possible, Manufactured Housing, and Mortgage Revenue Bonds .* ROEs based on fully-loaded G&A
Source: Single Family Profitability
•
9

() o Z "'Tl H o rn z --l H » r
"'Tl :s:: » () I
"'Tl () H ()
o o o o .j:>. .j:>. 0"1 ~ 0"1
• • • ~Freddie ~Mac
[E~~®[f[fi)@l~ ~®[fi)~[hm@l[flK\~ [f[]@l~® @l[fi) [E~®[fi) M@[f®
[P)®~~~m~~~~~ ~~®W 1[h@}[fi) (Q)lUJ[f M(Q)©J®~~ We make home possible"
Expected default costs for new purchases (bp on UPS)
8.7
,. __ I ____ ~ __ ~----.L---~___,
DEFCAP Dealer marks
* Based on GO cohorts for 2006 purchases
Source: Freddie Mac Investments and Capital Markets
50
40
30
20
10
2006 Guarantee Obligation portfolio credit costs* (bp on UPS)
35 34
Or-_~--l--,-_~--~--,--~--~_-,--L--~--,
March June September December
* Default and capital cost components only
Rise in GO caused by
• More bearish market
• Purchase of riskier product
10

() o Z "'Tl H o rn z --l H » r
"'Tl :s:: » () I
"'Tl () H ()
o o o o .j:>. .j:>. 0"1 ~ "'-J
• • QFreddie CQjMac
CCCQ)mJcdJ D~~ CQ)mJ~ CCCQ)(U] ~cdJ CGJ®~ WCQ)li~® [Q)®[p)®mJcdJ 0 mJ~
We make home possible'" CQ)mJ ~CQ)UJJ~OmJ~ [P)liO~®~
Rapid HPA in recent years has moderated defaults, and heavily suppressed credit losses
Our models assume 4% HPA in perpetuity, although 2006 HPA was much lower
Default rate (bp) Default rate vs. HPA
40
Defauli raie
30
20
HPA
YoY HPA (%)
12
9
6 Average HPA = 4.8%
3
o
•
co co co co tC co co CD 0) m CD CD CD Q) (.0) ~ 0'1 0> -...J OJ (,0
Credit losses (bp)
20
Credit losses VS. HPA
l:l a a 0 0 a o ... N W ~
~ ~ o 0 '" (J)
YaY HPA (%)
L2JS~ ffvolLOsffn~ hoom Qedi ~O Qosses -2~3 ye2Jrrs Q2J~err
HPA 12
15 Realized Credit Losses 9
10 6 : r ~"i~-~~]~~ --------------- ~D-~=~~~~~D~~~~f-~ ~ ~ ~ ~ ~ ~ ~ ~ ~ ~
~ ~ ~ ~ ~ ~ ~ ~ ~ ~ ~ ~ ~ ~ ~ ~ ~ ~ ~ ~ ~ ~ ~ ~ w ~ ~ m ~ ~ ~ 0 ~ w ~
Source: Freddie Mac Credit Policy
~ ~ ~ ~ w ~ ~ ~ ~ ~ ~ ~ ~ ~ ~ ~ ~ 000 0 0 0 0 ~ m ~ ~ m 0 ~ ~ w ~ ~ m
Average HPA = 4.8%
11

() o Z "'Tl H o rn z --l H » r
"'Tl :s:: » () I
"'Tl () H ()
o o o o .j:>. .j:>. 0"1 ~ 00
• • • QFreddie ~Mac We make home possible'"
2006 HPA was just above zero, and in some places, HPA has already turned negative
% of metropolitan areas (MSAs) with negative HPA 8 Pll'e~DmDllilalU1f 40106 dlal~ DllildlDcal~es
heme [pIl'Dce dli"O[p 40
30
20
10
I I I I I I
DIlil lhiaJUf/ 101 al~~ ~SAs*
~Ilil 3QOS, heme [pIl'Dces 1e~~ Ollil ~ lOo..nl1 101 everry 4 ~SAs
o ~----~--------------------------------\~----~-~~ 1976 1982 1985 1988
* National Association of Realtors
Source: Freddie Mac
Unemployment is a secondary driver
1991 1994 1997
~999-2005 bll'oaldi housDIlilg) sitll'ellilg)ith -Il..DI1i1oque period Ollil 30 years
Higher unemployment would aggravate losses, while continued robust conditions may mitigate them
12

() o Z "'Tl H o rn z --l H » r
"'Tl :s:: » () I
"'Tl () H ()
o o o o .j:>. .j:>. 0"\ ~ ~
• • • QFreddie ~Mac I l(Q)[Ill~ol\~lfTm M@O"[K\®~ [f(Q)O"cc®$ ffi\0"® ~O"®$$[u]O"~ITll~
CGJD[f®®~ [O)(Q)WOll We make home possible-
Freddie Mac average G-fee on the portfolio (bp)
30
25
20
15
10 r--,-,-,-,-,-r--r--I-'-'-81 83 85 87 89 91 93 95 97 99 01 03 05
Source: OFHEO 2006 Annual Report
• Originator-customers are consolidating and gaining more leverage
• Fannie Mae has a cost advantage and is committed to near-60% market share
• Regulatory pressure may be a factor
• Basel II may encourage U.S. banks to hold more whole loans or MBS (reversing 1980s-19905 disintermediation)
• Housing goals
13

() o Z "'Tl H o rn z --l H » r
"'Tl :s:: » () I
"'Tl () H ()
o o o o .j:>. .j:>. "'-J o o
• • ~Freddie ~Mac
I Originators Are Continuing to Consolidate and Gain Leverage
We make home possible-
The mortgage market has consolidated considerably in the last 10 years
Consolidation has been driven by the importance of capital and scale, tipping bargaining power in the direction of our large customers
Prime Mortgage Origination
$8508 $2,9748
} Top 5 Originators
1 Countrywide (15%)
2 Wells Fargo (12%)
3 Washington Mutual (7%)
4 Chase (5%)
5 Bank of America (5%)
Credit Card Receivables
$4636 $7316 Top 5 Issuers
1 JPMorgan Chase
2 Citigroup
•
1997 2005 3 MBNA (since acquired by BofA)
4 Bank of America
Prime Mortgage Servicing
$3,9718 $8,2918
}
1997 2005
Source: Nilson Report; Inside Mortgage Finance
Top 5 Servicers
1 Countrywide (13%)
2 Wells Fargo (12%)
3 Washington Mutual (9%)
4 Chase (7%)
5 CitiMortgage (5%)
5 Discover
1997 2005
Compared to other financial services markets, there is still room to go
14

() o Z "'Tl H o rn z --l H » r
"'Tl :s:: » () I
"'Tl () H ()
o o o o .j:>. .j:>. "'-J o I-'
• [dFreddie c:illMac We make home possible'"
• • Market share gains must be won against a committed, larger, historically lower-cost competitor
Perceived Fannie Mae strengths
• Liquidity premium
• Liberal view of credit (a strength for market share)
• Broader product range
• Better front-end systems - easier to deal with
• Historically lower G&A
Perceived Freddie Mac strengths
• Stronger coordination between Retained Portfolio and Single Family businesses
• Superior interest-rate-risk management (e.g., CMOs, REMICs)
Prior efforts to boost our share have been costly
• As Freddie Mac gained share in 2005, Fannie Mae responded by:
• Pushing G-fees down 2-3 bps
• Preemptively cutting pricing with leading originators (Countrywide, National City)
• Lowering bids even where unnecessary to win
• FNM appears intent on a 60% market share
15

() o Z "'Tl H o rn z --l H » r
"'Tl :s:: » () I
"'Tl () H ()
o o o o .j:>. .j:>. "'-J o N
• • III! Freddie ~Mac I Fannie Mae Enjoys Greater Scale We make home possible-
$600
$500
$400
$300
$200
$100
$0
Single Family MBS Issuance - 2005 ($ in Billions)
$501
Fannie Mae Freddie Mac
Equates to a 44% share for Freddie Mac
$2,000
$1,600
$1,200
$800
$400
$0
Source: OFHEO 2006 Annual Report; TradeWeb
Single Family MBS Outstanding - 2005 ($ in Billions)
$1,538
60% larger
Fannie Mae Freddie Mac
Including the retained portfolios, Fannie Mae's mortgage portfolio is 40% larger ($2.3 T vs. $1.7 T)
$12,000
$8,000
$4,000
$0
• TBA Trading Volume'" - 2006
($ in Billions)
$10,748
8x the volume
Fannie Mae Freddie Mac
• 30-year fixed
Fannie TBAs trade with a disproportionately higher volume
16

() o Z "'Tl H o m z --l H » r
"'Tl :s:: » () I
"'Tl () H ()
o o o o .j:>. .j:>. "'-J o W
• ~Freddie ~Mac INa make home possible'"
• ©[UJ[j [E~[P)@mJ§@§ H~§~@[j~~@)~~~ [}={]Cffid] [8)®@mJ ~~~[h)@[j
u[h)Cffi[ll) f@)mJmJ~@ M@)@~~
• While comparing FRE and FNM financials is difficult now, FRE traditionally has run at higher cost per unit of output (total mortgage portfolio)
Analysts agree (e.g., 5.0 bp G&A for FNM in credit guarantees, vs. 6.1 bp at FRE)*
14
13
12
11
10
9
Administrative expenses I average total mortgage portfolio** (bp)
DOl we lhlaIve aIlnl l\,mdlel1'~lfOInl\9l
COlsft dl o saIdi VaI InlftaI\9le?
2006 figures preliminary
Fannie Mae
Freddie Mac
2007 based on external commitments, assuming 4% portfolio growth
2007 based on 8
our budget (also assumes 4%
7 growth)
6+-------~--------~--------~------~--------~--------~------~--------~
2000 2001 2002 2003 2004 2005 2006 2007
* Morgan Stanley, "Fannie Mae, Freddie Mac, and the Road to Redemption," 7/6/2005 .. Administrative expenses include salaries and benefits, occupancy, professional services, and other administrative expenses. Portfolio size is
average of prior and closing-year balances.
Source: Company Financial Statements; BlackRock analysis
17

() o Z "'Tl H o rn z --l H » r
"'Tl :s:: » () I
"'Tl () H ()
o o o o .j:>. .j:>. "'-J o .j:>.
• • • IIII!Freddie ~Mac Rising Headcount Has Been a Driver VVe make home possible'"
The surge in expense and headcount occurred 2002-04; portfolio growth has increased efficiency since then
Expenses ($ in Millions)
1,800 Headcount including Contingent Workers*
1,600 Other Administrati~,400
- includes professional 1,200 services*
800 Salaries, benefits, 600
and occupancY400
200
Total Mortgage -Portfolio at year-end ($ Billions)
Administrative Expensesl total mortgage portfolio (bp)
2000
976
9.0
IEmJPl~tOlf'~~ ~~a1d<CtOlUlll1l~
2001
1,151
8.6
'Contingent Workers not available prior to 2002
Source: Company financial statements; Internal Financial Management
2002
1,317
7.9
2003
1,414
8.7
Headcount
2006 figures 8,000
2004
1,505
10.6
preliminary
2005 2006*
1,684 1,826
9.7 9.3
2004 vs. 2006 Portfolio +20%
G&A: +6% Employee headcount: +3% Contingent Workers: -25%
7,500
7,000
6,500
6,000
5,500
5,000
4,500
4,000
3,500
3,000
18

() o Z "'Tl H o rn z --l H » r
"'Tl :s:: » () I
"'Tl () H ()
o o o o .j:>. .j:>. "'-J o Ul
• • • ~Freddie uMac I
urrTI® §®~UJ][ro~~ ~®ru(Q)[fmTil@}[ru~® CG©l[p) v!~c
f@l[)l)[)I)O® M©l® ~®mTil©lO[)l)~c 0 0
We make home possible"
Freddie and Fannie securities trade roughly at the same price
Prices on 5.5% coupon, 30-year TBAs
104
102
100
98
96
On 2/14/07, Freddie Golds traded +1/32
Fannieftflae t 94+-----,-----,-----~----~
Feb-03 Feb-04 Feb-05 Feb-06 Feb-O?
Source: Bloomberg
In other categories (e.g., 15-years), Freddie securities also trade cheaper than Fannie's
But Freddie securities are inherently more valuable
• We pay investors 10 days earlier (45-day payment delay for Freddie Golds vs. 55 days for Fannie MBS)
• 10 days of float are worth roughly 4.5 ticks in price
Adjusting for timing differences, Freddie securities trade worse than Fannie's
o
Price difference between FRE and FNM securities, assuming same delay
(in ticks)
}2-4 ticks
-8 -t----------,-------,---------,-----~
Feb-03 Feb-04 Feb-OS Feb-06 Feb-O?
* Based on a weighted average of 30· and 15-year single-class securities
Source: Mortgage Funding
l~e <dIifif~II'~Il1l«:~ O~ ~~@
\9J1I'~al~~1I' ~Otq]lUlO<dlO~~ ©~ falll1lll1lD~
$~rclUlII'D~O~$ - ~~ ~lI'al<dlOIl1l~
V©~lUlm~ Y'~. fll'~<dI<dIo~ ~lIBA)
19

() o Z "'Tl H o rn z --l H » r
"'Tl :s:: » () I
"'Tl () H ()
o o o o .j:>. .j:>. "'-J o 0"1
• QFreddie CQjMac We make home possible'"
• • I
DOC W[h)ucc;[h) l®@1(d]~ ~(Q) ~u~[h)®[f CC(Q)~~~ urru (Q)[U][F
~ Q1]@1 [f@1 [fi)~®® [BS Q1] ~ u [fi) ®~~
Security performance matters because it is the currency we use with originators for much of our guarantee business
The gap manifests itself in two ways:
1. We have to lower our average G-fees to compete with Fannie Mae
2. We also provide originators variable discounts on G-fees ("Market Adjusted Pricing") when FRE pes trade 2+ ticks below FNM
200
150
100
50
Market Adjusted Pricing Costs ($ millions)
144 124 ~
.----
73 ~
2004 2005 2006*
* Excludes December
Source: Mortgage Funding
20

() o Z "'Tl H o rn z --l H » r
"'Tl :s:: » () I
"'Tl () H ()
o o o o .j:>. .j:>. "'-J o "'-J
• • • ~Freddie ~Mac We make home possible-
I We and Fannie Mae Have a Strong Position in Prime Fixed Rate, But This Segment Has Lower Growth and Returns
2005 Conventional Conforming Originations (100% = $1.9 Trillion, CAGRs are 2001-2005)
Fixed
Fannie Mae Purchases = $4208
CAGR=2% Prime
Unsecuritized = $2508
Subprime
ARM/Hybrid*
$3158 CAGR = 50%
$3808 CAGR = 28%
FNM and FRE bids are 2/3 of a point (20-24 ticks) typically higher than the best non-GSE bid
We and FNM have competed away returns in this segment (e.g., single digit ROEs for large customers)
Biggest threat to our position is that prime FRM continues to become less relevant in the mortgage market
• Includes index-based ARMs, Hybrids (3/1, 511, 7/1, 1011. 2/28, and 3/27 product) and balloons Sources: LoanPerformance LPS; OFHEO 2006 Annual Report; Freddie Mac Strategic Planning and BlackRock analysis 21


() o Z "'Tl H o rn z --l H » r
"'Tl :s:: » () I
"'Tl () H ()
o o o o .j:>. .j:>. "'-J o ~
• • • ~Freddie ~Mac I
ARMs Are Retained by Depositories, Creating a Much Smaller Securitization Market
We make home possible"
Mortgage Holdings for the Thrift Industry* 100%
80%
60%
40%
20%
0%
1994 1996 1998 2000 2002 2004
• Aggregate holdings of OrS-regulated institutions; includes both whole loans and MBS •• Includes balloon products
As an Example, More than 90% of Washington Mutual's Portfolio is ARMs* (100% = $1408)
Medium-Term ARMs
• Single Family loans as of September 2006
Fixed-Rate Mortgages
ARMs Simplify Banks' ALM and Reduce Earnings Volatility (vs. Fixed-rate mortgages)
Typical Duration of Assets and Liabilities (in years)
4-6
30-Year FRM
Portfolio
------------------:.:-----~}
ARM Portfolio
Deposits*
Eliminating duration risk requires swaps or other hedgesl offsets
• Varies widely across banks - depends on the mix of deposits and behavioral assumptions
Fixed-rate mortgages also have high negative convexity, which requires swaptions or callable debt to hedge, and generates earnings volatility
Sources: Office of Thrift SupeNision; Credit Suisse, "Mortgage Finance: 2007 Industry Outlook"; BlackRock Analysis 23

() o Z "'Tl H o rn z --l H » r
"'Tl :s:: » () I
"'Tl () H ()
o o o o .j:>. .j:>. "'-J I-' o
• QFreddie c:§jMac We make home possible'"
• • With some large clients, we compete just on pricing, because they don't want to sell us:
• AAA-rated ASS on production where we don't like the credit
• Servicing related assets (unlike other clients)
The result is low-margin business for us
Representative Client's Contract Economics
Actual Projections**
Flow Pricing (wI subsidy*) in bps 30 year amortizing 30 year 10 5/1 ARM amortizing 5/1 ARM 10
Flow Product Mix 30 year %
ARM%
Flow ROE (point estimates) 30 year
ARM
Total Client Business
Client's Share of GSE Purchases FRE's Share of GSE Product
FY 2006
13.5 19.8 6.0 11.0
68%
22%
r-----I_~~ __
25%
r-----1_ ~o~ __
6%
11%
Drop G-fee 1.0 bp Drop G-fee 1.0 bp & 3/4 pt subsidy
12.5 11 17.5 16 6.0 6.0 9.0 9.0
73% 73%
16% 16%
1---------- ------, 4% 3%1
- - - -25% - - - - 1-------25%
1---------- ------, 6% 5%1 ----------1-------8% 8%
25% 25%
* Aggregate G-fee equivalent of subsidy on affordable-rich population estimated as price / DV01 x 7.5% of business Thus: 3/4 point subsidy equates to aggregate 1.25 bp G-fee cut 75 bp price 14.5 x 7.5%
** Used Aug-Sep 06, during which more significant client volumes were purchased, as benchmark.
h
>-I-..J
tJ-
tr
Note: Assumed YTD06 corporate average spread impacts for projection purposes, and zero CEs in default cost estimates
Source: Single Family
We wm ~ullte~y lhiaJ"e ~O ClUJft G-1ees fto maJull1laaJull1l slhiaJl1'e
Tlhiull1l maJl1'Qoll1ls OIl1l 30-yeaJl1' pl1'OdilUJcft
ROlEs be~ow OIUJII'
IhilUli"d~e l1'aJfte
24

() o Z "'Tl H o rn z --l H » r
"'Tl :s:: » () I
"'Tl () H ()
o o o o .j:>. .j:>. "'-J I-' I-'
• • • ~Freddie c:fuMac
I 'flhl@ ~@~@lOIT1l@dJ [pl@Ii1~@~o@ [Q)@@~ INI@~ ffi\[pJ[pJ@@lir
~(Q)~~®cdl U (Q) [8S® ~U1® ~ [(1)~ ~ [(1)® @~ ~ [['(Q)~~U1 We make home possible'"
The rapid growth and profitability of the 1990s is unlikely to be repeated
• Regulatory/political pressure on portfolio size (whether formal cap or implied)
• Spreads have tightened, apparently on a secular basis, driven by entry of new class of MBS buyers (Asian central banks, hedge funds, and continued u.s. bank purchasing)
• Implied volatilities are much lower, reducing compensation for volatility/convexity risks
-15% ROEs expected but at slow growth (4%, lagging the market); wider spreads would create more purchase opportunities
Retained Portfolio Growth Slowing ($ billions) Mortgage Spreads Are Tight 1,0001---------------------, 40
Agency option-adjusted spreads -near zero, despite recent
improvements in funding costs 2003-2005 CAGR = 4% 750 ~
95 96 97 98 99 00 01 02 03 04 05 Source: OFHEO 2006 Annual Report '-----.. ---) V
fi/RoriB]8Jsg]S Dslb~ OOJJ~s~aJrujjof1Vg
2003~2005: 13% ICAGR
c: e-. I/)
<C 0
20
\ 0
-20
Ulbolr OAS - negative
40+---~--~--~--~--~
2002 2003
* 2D-day moving average Source: LehmanLive
2004 2005 2006 2007
25

() o Z "'Tl H o rn z --l H » r
"'Tl :s:: » () I
"'Tl () H ()
o o o o .j:>. .j:>. "-J I-' N
• • • QFreddie c:QjMac
I ~ lbJ ~ ® IT1l ~ Wi u <dl ® Ii' ~ [lilli'®@l <dl ~, Wi ® IHl @l'\!'® 11' '\%' (Q) l ® '\!' ® Ii'~ ~(Q) ~m [P)[j(Q)~® ~®~@l~ UI)®~ [P(Q)~~(Q)~ ~(Q) [P[j(Q)~~~@llb~ ~ ~~~
We make horne possible'"
1. Deploy new instruments or techniques to meet pockets of demand
• Reference REMICs
• Guaranteed Final Maturity securities
• Excess servicing 10
• Structured debt (issued $13 billion in 2006, mostly range accrual notes)
• Debt buybacks
2. Increase market risk-taking
• Reduce hedge coverage (duration, convexity, volatility, yield curve)
• Trade assets more actively
• Return to in-house dealer model (e.g., SS&TG)
Wa allia IPllDmll11S) ~IhlDS ~avali' ~oidl21Y: o ADidls G-~aa IbJllDSDl11lass/lia~al~DOl11lsIhlDIP
WD~1hl IOIiDQlOll11al~OIiS (saa!l{oI11lQl SO~llD~OOIl11S, 111l0~ jllDSt ~owssft IPIiUCS}
o wm yua~idl UI11lCliamSII11~~ QlalOI11lS
Tal!l{ol11lQl mOli'a m21li'!l{a~ IiDs!l{ lialusas savali'al~ s~lialftaQlDc IOJllDasftulOl11lS - ssa ll1lald iPJalQlS
26

() o Z "'Tl H o rn z --l H » r
"'Tl :s:: » () I
"'Tl () H ()
o o o o .j:>. .j:>. "'-J I-' w
• • • Jl!Freddie ~Mac We make home possible"
I Increasing Market Risk Raises Several Strategic Questions
Can we expect higher expected returns from assuming more risk (and which kinds?) - and by deploying what competitive advantages?
Are we prepared for the increased volatility of returns?
What regulatory/political response, if any, should we anticipate?
How do the returns - and the risk - compare to strategies that take on more credit risk?
Example: Additional Risk From Increasing Market Exposure
Duration Convexity Volatility Yield Curve Total
(equity-at-risk (months) (months) (equity-at -risk*) (equity-at-risk*) in $ Millions*)
2007 Planned 0.5 3.0 0.5% 0.5% I Position
Management 1.0 4.0 1.5% 1.5% • Limit
3.0%
6.0%
Board Limit 3.0 6.0 2.5% 2.0% 2,940 11.0%
• One month equity-at-risk. 95% confidence level
Source: 2007 ALM Plan
We have the capacity to take more market risk ... but choose not to, given
current risk/return trade-ofts
\ Anticipated losses
1-2 times every two years
27

() o Z "'Tl H o rn z --l H » r
"'Tl :s:: » () I
"'Tl () H ()
o o o o .j:>. .j:>. '-I I-' .j:>.
• ~Freddie ~Mac We make home possible'"
• Multifamily faces business challenges not unlike Single Family
• Buys and holds low risk (AAA), larger loans ($10-12 million)
• Has saturated target market (30% share of high-quality conventional)
• FNM's business is roughly twice as large, and is already active where we hope to expand:
• Smaller loans • Riskier loans (which they structure and securitize as a conduit)
• Ex ante ROEs hovering below corporate goals (11%-12%)
Multifamily Ex Ante Purchase ROEs
25% 20.8%
20% Depressed to
15% Meet HUD Goals 11.7% 11.8% 11.6%
10%
J 6.4% D D D_, 5% D 0% =
-5% -0.5%
2002 2003 2004 2005 2006E 2007F
Source: Freddie Mac Multifamily "2007 Operating Plan"
Note: Unlike Single Family, Multifamily purchases are typically housing goal-accretive
•
28

() o Z "'Tl H o rn z --l H » r
"'Tl :s:: » () I
"'Tl () H ()
o o o o .j:>. .j:>. "'-J I-' Ul
• • ~Freddie ~Mac
I Multifamily Faces Even Greater Competitive Disadvantages vs. FNM
We make home possible"
Fannie Mae has pursued a two-fold strategy of
• Buying for the portfolio (roughly 2x our purchases)
• Structuring and securitizing credit risk
We have traditionally just bought-and-held (in '06, we launched our first credit securitization)
Multifamily MBS issuance (in $ billions) Multifamily purchases (in $ billions)
25 35 ----- .-~----.~--
FNM FNM 30
20
15 FRE
•
1990 1992 1994 1996 1998 2000 2002 2004 1990 1992 1994 1996 1998 2000 2002 2004
Source: OFHEO 2006 Annual Report Source: OFHEO 2006 Annual Report
29

() o Z "'Tl H o rn z --l H » r
"'Tl :s:: » () I
"'Tl () H ()
o o o o .j:>. .j:>. "'-J I-' 0"1
• • • I!! Freddie .. Mac
The Multifamily Opportunity Is Too Small
We make home possible'" to Drive Overall Profitability
The Overall Market Is Much Smaller*
(MDO in $ Billions)
9,150
Single Family
• As of 12131105
Single family market is 14x
larger than multifamily
670
Multifamily
Sources: Mortgage Banker Association
Our Holdings Are Commensurately Smaller*
($ Billions)
1,341
23x (for whole loans)
96 CMBS = 37
__ i:::===iiiiiiiiiiiiiiiiiiiiii~~=-!Whole Loans = 55
Single Family Multifamily
• As of 12131105 Note: Sum includes Guaranteed pes, Structured Securities and Mortgage Loans in the
Retained Portfolio for both Single Family and Multifamily
Sources: Freddie Mac 2005 Annual Report; Freddie Mac Multifamily "2007 Operating Plan"
30

CONFIDENTIAL FMAC-FCIC 000044717

•
•
• CONFIDENTIAL
CI)
> 0 I.. C. E -0 +'
tn CI) .-+' .-s::::: ::l ~ 0 c. c. 0
• --
.... M
FMAC-FCIC 000044718

() o Z "'Tl H o rn z --l H » r
"'Tl :s:: » () I
"'Tl () H ()
o o o o .j:>. .j:>. "'-J I-' ~
• • • GJFreddie CfuMac
IT Ihl@ 11'@ ~ [pl [pl@@l11' ft(Q) 18l@ IF@w «))ft 1hl@11' «)) [pl [pl(Q) I1il: I!.IlIT1l U ft U @ ~ ft (Q)
(GJ[f(Q)W WD~[h)D[fj] (Q)[jJ][f ~~D$~D[fj]~ f[f@[fj]~[h)D$® We make home possible-
The main opportunity within prime credit - origination - is outside the charter
There are potential slivers of value elsewhere, but none is transformational
Prime credit
1
Mortgage value chain
Captured by
originators
. / AQJQJIr~QJal~DIJ1lQJ {11r1Om $mal~~~r
\ [P>101O~DInlQJ (CIr~al~DInlQJ IPIOIO~$ 101
lPal~DClUI~alll' DInl~ell'~$~ ~IO DInl"e$~IOIl'$) IOIrOQJDlnlal~lOll'$ ~IO Cll'~al~~ alilitll'alC~D"~
W~IO~~ ~lOalll1l lPalC~alQJ~$l
o Would put Freddie Mac in direct competition with large customers (e.g., Countrywide)
o Large servicers are offering aggressive bids
o Any value captured by Freddie Mac would likely be offset by lower G-fees (efficient market for loan pool attributes)
o Operational risk in handling loans
DD$~Il'DltlllL.II~DIOIl11 101 $~ClUIIl'D~D~$ -
wlOlUI~d1 ll'~qjlUlDIl'~:
o Hiring large and highly compensated salesforce
o Risk
o Displacing incumbents (i.e., broker-dealers)
32

() o Z "'Tl H o rn z --l H » r
"'Tl :s:: » () I
"'Tl () H ()
o o o o .j:>. .j:>. "'-J N o
• [;JFreddie ~Mac INa make home possible'"
• I WI @ ~ if@ [pJ GJlif~ GJI U 1Til:g) (Q) [pJ [pJ@ ITitGJIITil U ~ U @~ ~ @ ~ 1M [pJ if@'\i'@
(Q)Q1] [J [E~o~~o Oll~ ~ [J@0ll~[h] o~®
Increasing market or credit risk
Improving security
performance
Deploy some of our excess fair value capital
Increase efficiency (G&A as basis points of mortgage portfolio) as we emerge from financial remediation
Create security fungibility to improve our funding costs relative to Fannie Mae
Addressing the latter two (structural disadvantages) is a necessity before we can aim to achieve greater market share
•
33

() o Z "'Tl H o rn z --l H » r
"'Tl :s:: » () I
"'Tl () H ()
o o o o .j:>. .j:>. "'-J N I-'
• QFreddie c:§jMac We make home possible'"
Market
• I W® C(QlIlll~<dl1r@l~® ~(Q)I1'® ~@lI1'~®~ (Q)11' CI1'®<dlfl~ [R?fl~~ ~[r1J (V)[]J][J ~~~~~~IT'i)~ f[Jcal[r1J~[h]~~®
We have $10.3 billion in excess fair value capital ($5.4 billion above our targeted surplus) we could deploy
Economic Capital (100% = $21.18)
Operational
Credit Risk Capital (100% = $7.78)
------------------------------
Credit
--------------
Single Family
----
5.7
------Market risk was discussed on page 27
Note: As of 11/30/2006 Source: Economic Capital Adequacy Report
•
~" Multifamily
1.0
1.0 ) Retained Portfolio
34

() o Z "'Tl H o rn z --l H » r
"'Tl :s:: » () I
"'Tl () H ()
o o o o .j:>. .j:>. "'-J N N
• QFreddie C]jMac We make home possible'"
$ in Millions
1,800
1,600
1,400
1,200
1,000
800
600
400
200
$1,181
~
~~~
2003
•
$1,550 $1,535
~ ~
~ • 00
~
2004 2005
• We have held the line on overall G&A growth from last year
•
$1,641 $1,600
~~ ~ Other Expenses
®@I9) Pro1essional ~ Services
2006 2007
• A certain level of Professional Services spending has now been embedded in Salary spending
• We should see a natural decline in Professional Services costs as we exit systems development phase and move into more of a maintenance mode
35

() 0 Z "'Tl H 0 rn z --l H » r
"'Tl :s:: » () I
"'Tl () H ()
o o o o .j:>. .j:>. "'-J N W
• • • QFreddie C§:JMac We make home possible"
Basis Points of Total Portfolio
12.0 -G&A Expense Paths
2007 Division G&A 2003 Division G&A
11.0 - 10.6
10.0 -9.3
9.0 -
8.0 - 8.7
7.0 -
== 8.3 ~ ~
7.9 "= == =. 7.3
7.0 II!!I Support G&A D Business G&A
6.0 -
2003 2004 2005 2006 2007 Spending Ratio - SUpport: Business I-G&A Growth: Actual ;:::-=G&A Gr~: CPlI
1.1 : 1 1.3 : 1
• We gain more leverage if we grow total G&A at less than total portfolio growth
• From 2003 through budgeted 2007, support G&A increases relative to business G&A
• Certain costs will naturally decline, for example, consulting and audit fees
• We should also expect efficiencies from major system implementations
36

() o Z "'Tl H o rn z --l H » r
"'Tl :s:: » () I
"'Tl () H ()
o o o o .j:>. .j:>. "'-J N .j:>.
• QFreddie CQjMac We make home possible'"
• I WIhi«lltt ~~ 1I1hi@ [R?j~ M l@'1!'@~ «lllY1lidl tC@1ITIiI [llI@~uttu@1Y1l (Q) ~ ~ [P)® [)1 cd] ~ [)1 g] (Q) [)1 U ® ~ [h [)1 (Q) ~ (Q) g] Y'f
$700
$600
$500
$400
$300
$200
$100
$0 I
2002
2003-2007 Initiative Spending
2003 2004 2005 2006 2007 Plan
• Spending on financial reporting should decline over time
All Other
Financial Reporting
• The level of spending required to support business platform development is uncertain
•
37

() o Z "'Tl H o rn z --l H » r
"'Tl :s:: » () I
"'Tl () H ()
o o o o .j:>. .j:>. "'-J N Ul
• QFreddie C§jMac We make home possible'"
• [Frr®(Q](Q]~® M@lCC (Q)rr~@lml~~@l~~(Q)ml ~~rrlUlCC~lUlrr® @lml(Q]
CC(Q)M LQ)®ml~@l~O(Q)ml CC(Q)~~~
As of December 31,2006
Compper Employee: $786,048
Compper Employee:
762
Compper Employee: $11 822
Compper Employee:
946
Compper Employee:
$75,105
Notes: 1. Based on year end headcount 2. Hierarchy (from top): Officer, Director, Manager, Professional, Non-Exempt 3. Compensation per employee allocated above does not include expenses for sign-on bonuses, severance, termination
agreements, discretionary stock expenses, retention bonuses, sales bonus programs, or CEO/COO compensation.
Source: Human Resources
•
38

() o Z "'Tl H o rn z --l H » r
"'Tl :s:: » () I
"'Tl () H ()
o o o o .j:>. .j:>. "'-J N 0"1
• • QFreddie c:QjMac
[Frr®ddo® M©l(c (Q)rr~©l[(i)O~©l~O<Q)[ru ~~rrlUl(c~lUlrr® ©l[(i)d
CC(Q)[M LQ)®[(i)~©l~O(Q) [(i) CC(Q)~~~ ~ (CeQ) [(i)~o We make home possible'"
Freddie Mac
2.6%
23.8%
48.0%
11.7%
14.0%
More Typical "Pyramid" For a Complex Financial Organization
2.7% ;-- "'---
11.9%
23.9%
47.5%
14.1%
Drivers of Freddie Mac's top-heavy organization structure:
• Grade system forces manager to use leader titles to deliver higher compensation
• Sub-optimal technology infrastructure increases need for highly paid subject-matter experts
• Low rate of entry-level hiring results from:
Demand for highly experienced personnel to solve short-term remediation/infrastructure crises
- "Over-hiring" - risk averse to train/develop entry level personnel
• "Premium pay" has been required to compensate for perceived unique job-security "risk"
Source: Human Resources
•
39

() o Z "'Tl H o rn z --l H » r
"'Tl :s:: » () I
"'Tl () H ()
o o o o .j:>. .j:>. "'-J N "'-J
• ~Freddie CQjMac We make home possible'"
• • I ~ 1IT!1l[pl@]d @ 1[ ~ 1IT!1l[pl11'@ ~ U !Til @ (GJ ~fo1 IE 1[1[U ~ U ®!Til ~ ~
(Q) IT'll ~ ~ IT'll ~ ~ ® f @l m ~ ~ 17' [R<. CD ~ \GJ @l ~ IT'll ~
Potential SF ROE Impact by G&A Growth Rates
In 2007 we have a lot of preparatory staff work to do
• Diagnostics of underlying cost drivers
• Functional-level external benchmarking
• Assessments of feasibility and impact of changes
We will return to the Board in the fall with:
• Vision for the expense structure in 2008 and beyond
• Prioritized levers for improvement
• Initial action plans
N y=
0 N I::
I:: ffi ~ !!.! 0 ~
2.0%
1.8%
1.6%
1.4%
1.2%
1.0%
0.8%
0.6%
0.4%
0.2%
0.0%
Zero CPI 1/2 MOO Rate
Gwow1C1hl lRal~S SCSUlIalWUO
Source: Internal Freddie Mac Estimate
40

() o Z "'Tl H o rn z --l H » r
"'Tl :s:: » () I
"'Tl () H ()
o o o o .j:>. .j:>. "'-J N 00
• • [dFreddie ~Mac
I Wlhl@l~ CC@l1l'1l iBl@ iOl@1I'1l @ ~@ CC ~ @~@ ~Ihl@ ~@~ I!,I] IfU ~~
[P®ru(Q)[jM@~~® ~@[P W~~U1 ~@~[)1~® M©l®? We make home possible"
Closing this gap has been a long-running aspiration (e.g., SS&TG, portfolio management initiatives)
We believe that the only opportunity to address this permanently is security fungibility
• Eliminate differences between securities (match FNM payment delay of 55 days)
• Create standing offer to take delivery on FRE or FNM securities ("Agency TBA delivery")
• We could apply payment change just to new securities, or existing 45-day securities as well
Price difference between FRE and FNM securities, assuming
same delay (in ticks)
D
-s-r----,----,-----,----,
•
} 2-4
ticks
Feb-03 Feb-04 Feb-05 Feb-06 Feb-O?
This strategy rests on the premise that we can:
• Get market to value increased liquidity provided by trading the combined GSE market
• Minimize transitional costs and maintain liquidity
• Based on a weighted average of 30- and 15-year single-class securities
Source: Mortgage Funding
Even if successful, the strategy will take years to bear full fruit
• Rewiring FRE platform
• Altering market conventions
41

() o Z "'Tl H o rn z --l H » r
"'Tl :s:: » () I
"'Tl () H ()
o o o o .j:>. .j:>. "'-J N ~
• • c;JFreddie ~Mac We rnake home possible'"
Potential Impact on Portfolio ROEs
(Change Applied to New Securities Only)
1.4% -.----------------,
1.2% +--------
1.0% +-------N <r' o N ~ 0.8% +--------
~ .= ffi
C) 0.6% w (;) ~
0.4%
0.2%
0.0%
1/32 2/32
Note: AU estimates assume SF portfolio grows at 8% per year (in line with market MDO) Source: Internal Freddie Mac Estimate
2 tick improvement on new guarantee business
= 2% ROE gain
Projections are illustrative, and assume:
• Full implementation in 2007 (not feasible)
• Immediate liquidity gains on new securities
•
42

() o Z "'Tl H o rn z --l H » r
"'Tl :s:: » () I
"'Tl () H ()
o o o o .j:>. .j:>. "'-J W o
• G]Freddie ~Mac We make home possible'"
• • Our systems are hardwired for a 45-day delay - we will need to reconfigure
Servicers and service bureaus will need to follow suit
Front { Office
Acquisition -C
In 2007, we have funded Fulfillment a small internal team to
assess infrastructure
Asset Management
Finance
{ feasibility
43

CONFIDENTIAL FMAC-FCIC 000044731

•
•
• CONFIDENTIAL
... c: (I) o ca ...... -c «
• ---
FMAC-FCIC 000044732

() o Z "'Tl H o rn z --l H » r
"'Tl :s:: » () I
"'Tl () H ()
o o o o .j:>. .j:>. "'-J W W
• • • GJFreddie ~Mac
I ~ @il:::@ Il1I ~ IE '1!'@ Il1I ~ iillll1l cdl IF if@cdl cdl ~ @ M iillil:::' ~ ~ Il1I '1!' © ~ '1!'@m @ Il1I ~
~ [fj) ~ lUl [b) ~ [j~ m ® We make home possible'"
The subprime market has grown swiftly over the last five years
A significant retrenchment is underway (market pullback, regulatory pressure)
Our involvement to date has been buying AAA tranches of others' securitizations
We have taken steps to avoid abusive lending practices and provide market leadership
4S

() o Z "'Tl H o rn z --l H » r
"'Tl :s:: » () I
"'Tl () H ()
o o o o .j:>. .j:>. "'-J W .j:>.
• QFreddie ~Mac We make home possible'"
• Subprime Conforming Originations ($ in Billions)
600
500
400
300
200
100
0 2000 2001 2002 2003 2004
SlUllb~Il'DIl1I1lI9 BlS Bl % of cOl11lfoll'll1I1lol11lg) ~8% 7% ~«J)% ~IO% 2~%
0ll'oQJoD1lBl1ooll'1ls
* 1 H 2006 annualized Note: Subprime includes second liens and manufactured housing
Sources: Freddie Mac Strategic Analysis; Inside Mortgage Finance; MBA Mortgage Finance Forecast (January 2007)
•
545
2005 2006**
28% 29%
46

() o Z "'Tl H o rn z --l H » r
"'Tl :s:: » () I
"'Tl () H ()
o o o o .j:>. .j:>. "'-J W Ul
• ~Freddie ~Mac We make home possible-
150
100
50
Stock Prices of Subprime Lenders (indexed to 100)
•
o +-------~------~------~------~---01/04/06 04/04/06 07/04/06 10104/06 01/04/07
Source: Bloomberg
• Major lenders have announced credit
problems
• HSBC announced $1.8 B in additional loan loss reserves (Feb. 2007)
• New Century is restating 2006 earnings downwards for insufficient reserves to repurchase loans (Feb. 2007)
More than 20 subprime lenders have gone out of business, most after being forced to buy back "early payment defaults," i.e., loans becoming delinquent in first three months
Still other lenders are up for sale, e.g., Ameriquest, Option One
47

() o Z "'Tl H o rn z --l H » r
"'Tl :s:: » () I
"'Tl () H ()
o o o o .j:>. .j:>. "'-J W 0"1
• QFreddie c::§jMac We make home possible'"
• Value of Credit-Exposed Bonds Has Fallen Sharply
in Recent Weeks (ABX index*)
105 / 100l~~====~~==~~~==============~~-----------------
~"'-----95
90
85
80
75
70
Little impact on our ASS holdings
Liquidity is drying up
•
• Whole loan prices are falling
• Pipelines must be sold I marked at a steep loss
• Most originators hold residuals, subordinate tranches, or whole loans that must be written down
65 63
9/14/06 9/29/06 10/14/06 10/29/06 11/13/06 11/28/06 12/13/06 12128106 1/12/07 1/27/07 2/11/07 2126107
Note: Index represents 20 large subprime ASS deals issued in the first half of 2006
Sources: JP Morgan Securities; Markit
48

() o Z "'Tl H o rn z --l H » r
"'Tl :s:: » () I
"'Tl () H ()
o o o o .j:>. .j:>. "'-J W "'-J
• II! Freddie ~Mac
• • I We Participate in Subprime Through AAA Bonds Held in the Retained Portfolio
We make horne possible-
Agency
Assets in Retained Portfolio (as of 2/19/07; Total UPB = $730 B)
Other*
Subprime (UPS = $130 8, over 99% are AAA bonds)
We decided to purchase subprime only where we could layoff the credit risk - buying AAA bonds of others' securitizations instead of whole loans
* Includes CMBS, Alt-A, Option ARMs, Manufactured Housing, Mortgage Revenue Bonds, and HELOCs
Source: Freddie Mac 49

() o Z "'Tl H o rn z --l H » r
"'Tl :s:: » () I
"'Tl () H ()
o o o o .j:>. .j:>. "'-J W 00
• WFreddie ~Mac 'Ne make home possible'"
Economic benefits
• • Purchase volume: $72 billion (29% of total purchases)
• Expected ROE: 17%
• Agency Option-Adjusted Spread: 30 bp
Supports our housing goals I subgoals
100%
75%
50%
25%
0%
Risk management
Low / Mod subgoal
Underserved subgoal
Special Affordable subgoal
• Minimal interest rate risk (portfolio effective duration = 0.08; effective convexity = 0)
• Minimal credit risk (all AAA purchases)
•
50
() o Z "'Tl H o rn z --l H » r
"'Tl :s:: » () I
"'Tl () H ()
o o o o .j:>. .j:>. "'-J W ~
• • • QFreddie C:§JMac We make home possible"
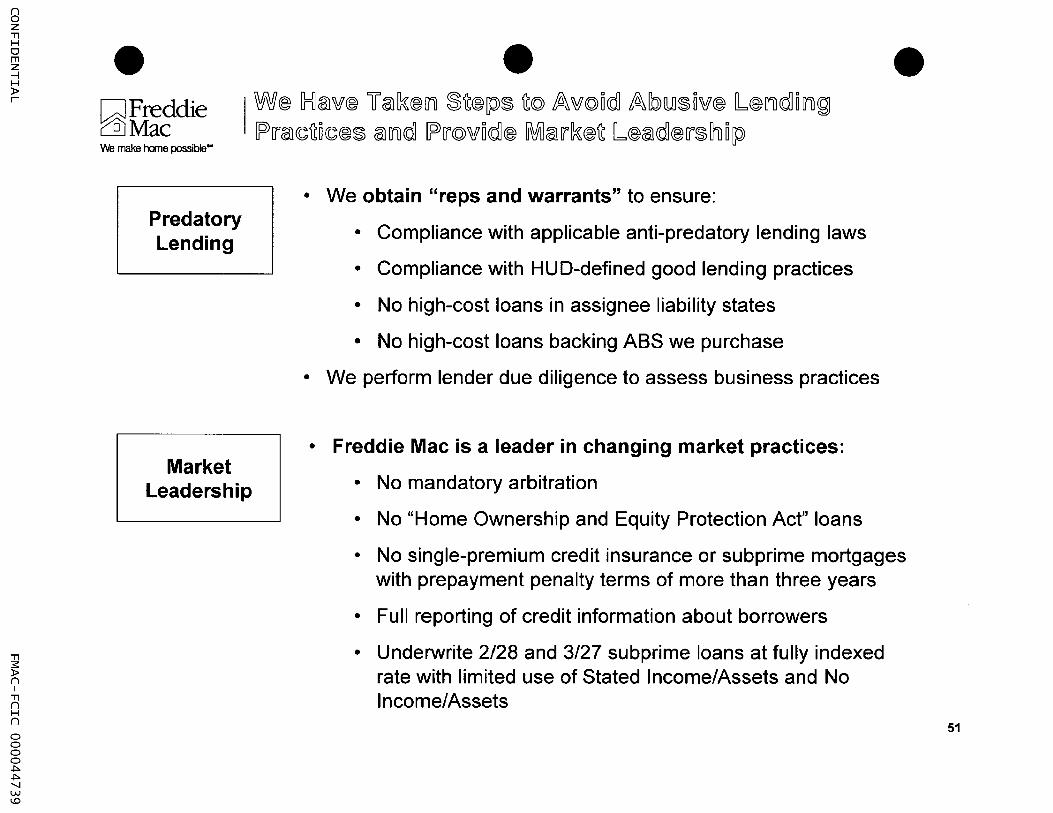
I W@ G={]@)~@ U@)~®ml ~~@[P)~ ~@ ffi\~@~~ ffi\[b)(UJ~~~@ l®U1)~~U1)~
[P[j@)~~~~@~ @)U1)~ [P[j@~~cdl® M@l[j~®~ l@@l~®[j~[h)~[p)
Predatory Lending
Market Leadership
• We obtain "reps and warrants" to ensure:
• Compliance with applicable anti-predatory lending laws
• Compliance with HUD-defined good lending practices
• No high-cost loans in assignee liability states
• No high-cost loans backing ABS we purchase
• We perform lender due diligence to assess business practices
• Freddie Mac is a leader in changing market practices:
• No mandatory arbitration
• No "Home Ownership and Equity Protection Act" loans
• No single-premium credit insurance or subprime mortgages with prepayment penalty terms of more than three years
• Full reporting of credit information about borrowers
• Underwrite 2/28 and 3/27 subprime loans at fully indexed rate with limited use of Stated Income/Assets and No Income/Assets
51

() o Z "'Tl H o rn z --l H » r
"'Tl :s:: » () I
"'Tl () H ()
o o o o .j:>. .j:>. "'-J .j:>. o
• [dFreddie ~Mac We make home possible'"
• • What long-term role should we take in the nonprime markets?
1.
2.
3.
4.
How and why has the nonprime market grown quickly?
Will nonprime grow, stabilize, or shrink back into a niche over the next 3-5 years?
What business and franchise opportunity will future non prime markets pose? What risks?
What strategy should we pursue? What are we doing next?
52

() o Z "'Tl H o rn z --l H » r
"'Tl :s:: » () I
"'Tl () H ()
o o o o .j:>. .j:>. "'-J .j:>. I-'
• • 1. How and why has the market grow.
~Freddie ~Mac We make home possible"
I CGJ~[E [P)[f®~®m)(~® [H©l~ [Q)OMOIn)O~[h)®(QJ Wo~[h) ~[h)® ~©l[p)O(QJ
[NlCQ)1n) [p)[fOM® ~[fCQ)W~[h) 0 In) ~®~®In)~ V ®©l[f~
GSE Securitizations Have Fallen As Share of Conforming Mortgages Outstanding*
($ in Billions)
9,000 ~----------------------------------------------------------.
8,000
7,000
6,000
5,000
4,000
3,000
2,000
1,000
GSE expansion of MBS drives share
-....
IF!.ne~eol roy li"alPuol eltlPaU1SuOIn O~
55%
1985 1987 1989 1991 1993 1995 1997 1999 2001 2003 2005
'fW'~ ~!i'~lTilcdl~ [bJ~rrnulTiltdl 1Til1C»1Til[p)!i'ume (9J!i'IC»~rrn:
~, ~j{[pJ~ITil$i(Q)1Til (Q)~ <C!i'ecdli~
~, P!i'~tdl~<c~ ilTillTil(Q)~~~o(Q)1Til
* Single Family Conventional Conforming
Sources: Freddie Mac Strategic Analysis; Inside Mortgage Finance
NOIn-GSE Share
GSE Share (guarantee portfolio only)
53

() o Z "'Tl H o rn z --l H » r
"'Tl :s:: » () I
"'Tl () H ()
o o o o .j:>. .j:>. "'-J .j:>. N
• • 1. How and why has the mallcet grow!fl
kJFreddie r§JMac We make home possible'"
I ~©[r1)~rrOm® M@}rr[k®~~ 01f1F®rr ~rr®<dJo~ ~(Q) ~(Q)rrrr(Q)w®rr~ W[h(Q) [O)© ~(Q)~ Q~@}~O~~ f(Q)rr ~~®[JI)CC~ l(Q)@l[r1)~
Prime
Alt-A (alternative to Agency)
Subprime
Typical borrower
680-800 FICQ*
650-800 FICO, less documentation /
credit history
< 650 FICO, prior credit problems
Typical margin over index
(e.g., Treasury)
250-300 bp
300 bp
650 bp**
D Nonprime markets
Typical annual delinquency rates
-0.5%
1-2X prime
6-10X prime (or higher)
These are the classic distinctions - but the lines are blurring, with converging practices and channels ("full spectrum lending")
* FICO credit score is the industry standard established by Fair Isaac, using an 850 point scale
** Initial teaser rates may be 200-300bp over index Sources: IMF; BlackRock; Freddie Mac
54

() o Z "'Tl H o rn z --l H » r
"'Tl :s:: » () I
"'Tl () H ()
o o o o .j:>. .j:>. "'-J .j:>. W
• QFreddie c:§JMac We make home possible'"
• Hybrid ARM Issuance ($ in Billions)
1,200
$897 $867
2000 2001 2002 2003 2004 2005 Sources: Loan Performance; JP Morgan
Interest-Only & Negative Amortization Share of Originations in Private Label Securities
40%
35%
30%
25%
20%
15%
10%
5%
0% 2000 2001 2002 2003 2004
* September 2006 YTD Source: Freddie Mac Strategic Analysis; Inside Mortgage Finance
2005 2006 YTD*
1. How and why has the market grow!/'
Customers are seeking:
• Broader variety of payment options
• Flexibility to not pay down principal (e.g., expecting to move within 5 years)
• Ways to bootstrap into pricier homes
Originators are differentiating products to compete
55

() o Z "'Tl H o rn z --l H » r
"'Tl :s:: » () I
"'Tl () H ()
o o o o .j:>. .j:>. "'-J .j:>. .j:>.
• ~Freddie ~Mac We make home possible'"
Borrower demand
•
Nonprime markets
Substitution out of FHA
1. How and why has the market grow!/'
Investor supply of capital
Opportunity to step in?
Freddie Mac
56

() o Z "'Tl H o rn z --l H » r
"'Tl :s:: » () I
"'Tl () H ()
o o o o .j:>. .j:>. "'-J .j:>. Ul
• • 1. How and why has the market grow.
QFreddie CQjMac We rmke home JX)SSible'"
I (8)(Q)[J[J~W®[J~ H©l%7® ~®COJ (U] 0 [J®cd] ~®W U~[pl®~ (Q)~
~ (Q) rru~ @l ~ ® ~ ~(Q) ffi\ cd] cd] [['® ~ ~ ffi\ ~~ (Q) [['cd] @l ~ ~ ~ 0 ~Sf
Home Price Appreciation Has Outpaced Income Growth
400
} Average
350 home price
300
250 -Mediialll1l
200 household! income
150
1980 = 100
50 +-~~~~~~~~~~~~~~~~~~~~~~~~~~ 1980 1981 1983 1985 1987 1989 1991 1993 1995 1997 1999 2001 2003 2005 2Q06
Sources: u.s. Census Bureau; OFHEO House Price Index
[pJ U"(O)d1 !l.lI1C~
OIT1lIT1l©"aJ~O<O>1T1l ~cal$ ~~~[p)~d1 1C~(Q)$<e ~~<e
tal \fff (0) U"d1 tal It» 0 ~ 0 ~~ \QJ tallPJ ~<e.(gJ.~ OlT1lftteU"te$~=
<O>1T1l~~}
57

() o Z "'Tl H o rn z --l H » r
"'Tl :s:: » () I
"'Tl () H ()
o o o o .j:>. .j:>. "'-J .j:>. 0"1
• QFreddie c:QjMac We make home possible-
• A flood of global capital has been seeking yield
Nonprime MBS Issuance Has Grown Rapidly ($ in Billions)
1000 -,------------------,
900
800
700
600
500
400
300
200
100
o
2000-2006 CAGR: 54%
1999 2000 2001 2002 2003 2004 2005 2006
Note: Number derived from total, prime and Alt-A issuances as IMF has not yet disclosed 2006 subprime MBS issuance
Source: Inside Mortgage Finance
80%
75%
70%
65%
60%
55%
50% -
45%
40%
35%
1. How and why has the market grow'
Ratio of Subprime MBS Issuance to Total Subprime Originations
76%
New classes of buyers: foreign investors, hedge
funds
30% +---~----~--~----~--~--~--~
1999 2000 2001 2002 2003 2004 2005
Source: Inside Mortgage Finance; BlackRock analysis
58

() o Z "'Tl H o rn z --l H » r
"'Tl :s:: » () I
"'Tl () H ()
0 0 0 0 .j:>. .j:>. "'-J .j:>. "'-J
• • 1. How and why has the market grow'
QFreddie rill Mac We make home possible"
Borrowers (with help of mortgage brokers and loan officers) have found Alt-A and subprime loans superior alternatives to the Federal Housing Administration:
• Subprime rates have improved - influx of private capital has helped lower rates
• Easier to do business with - FHA loans require a lot of paperwork, and limit size and frequency of refinancings
Shift From FHAN A to Nonprime Products
100%
14% 14% 13% 90% 23%
80% 35% Alt-A
70%
60% 4l®% <W% ®~%
50% ~
40% Subprime
30%
20%
10%
0% FHANA
2001 2002 2003 2004 2005
Source: Inside Mortgage Finance
Substitution
59

() o Z "'Tl H o rn z --l H » r
"'Tl :s:: » () I
"'Tl () H ()
o o o o .j:>. .j:>. "'-J .j:>. 00
• G]Freddie CQjMac We make home possible'"
$
Today's origination volumes
2006
• 2. Will nonprime grow, stabilize, or sht?
Uncertain how deep or long the retrenchment will be
• Can subprime and even Alt-A thrive without rapidly rising home prices?
• Will the gap between home prices and income suppress or energize non prime growth?
• Will the investor retreat turn into a permanent pullback?
• How hard will regulators clamp down on the market?
?
....... - - --
2007
----W~aJ~ 1P1i'~~$UJ)li'e wm (\j]<ellil'ilogjli'aJ[p)ihloC$ aJlJil<dl
1P1i'(Q)(\j]UJ)C~ OIJilIJil(Q)\tfaJ~o(Q)1Jil ~~~ru <Ol\tf~1i' na~ ~(Q)IJil\9J~~<e!r'm?
2010-2012
60

() o Z "'Tl H o rn z --l H » r
"'Tl :s:: » () I
"'Tl () H ()
o o o o .j:>. .j:>. "'-J .j:>. ~
• QFreddie ~Mac We make Iune possible'"
1. Regulators first focused on InterestOnly and Option ARM
2. Washington debate is now turning to subprime mortgages with large resets
• 2. Will nonprime grow, stabilize, or sht?
• Banking regulators ("Interagency Guidance") tightened underwriting standards (e.g., to fullyindexed rate, not teaser)
• Clearer disclosure of risks
• Modest expected impact on originations by itself
• But what will follow?
• Underwriting standards, as above
• Prepayment penalties under fire
• Mortgage brokerage practices (e.g., steering, ignoring suitability)
• Lack of price transparency
fPJ (Q) U ff qff rt;@]U @][f[J rdJ !J® g; (J)] U@]q(Q)!!Jf !P !J®~~ (J)] !J® W ff U U rt; rt)) [f[J qff [f[J (J)] ® qrt)) !!f!fJ (Q) (J)] [f[J q @J~ (f(Q)!J®rt;U(Q)~(J)]!J®~ !Jff~®
61

() o Z "'Tl H o rn z --l H » r
"'Tl :s:: » () I
"'Tl () H ()
o o o o .j:>. .j:>. "'-J Ul o
• ~Freddie c::§jMac We make home possible"
$
Today's origination volumes
2006
• 2. Will nonprime grow, stabilize, or Sh.? I W[h©l~ [P)[J®~~lUJ[J® W~~~ [5)®M(Q)~[J©l[P)[h~~~ ©lmJcdl [P)[J(Q)cdllUJ~~
~mJ mJ(Q)~©l~~(Q)mJ [E~®ru (Q)~®[J ~rru® lCQ)mJ~Cl~®[JM?
Nonprime is likely to grow faster long-term than overall mortgage market (8%)
+ Growing income disparity
+ Minority households growing faster, disproportionately served by subprime
+ Competition driving product innovation
- In severe retrenchment, loan balances might shrink
........ - - -
2007 2010-2012
62

() o Z "'Tl H o rn z --l H » r
"'Tl :s:: » () I
"'Tl () H ()
o o o o .j:>. .j:>. "'-J Ul I-'
• ~Freddie ~Mac We make home possible""
• 2. Will nonprime grow, stabilize, or shl7
Income growth for households in the bottom half has fallen far behind home price appreciation
Will the widening gap push households into subprime, or renting (multifamily)?
180
160
140
120
100
80
60
40
20
0 Lowest Fifth
Source: u.s. Census Bureau
Dichotomy of Household Income Growth -1980-2005
A "elrta1\9l~ Ihl©m~ jp)lro(c<P;
{-3lOJ(o)% <Ol"~1r ~a:Jm® jp)~lrooco1
+ 155%
Second Fifth
+ 162% ,
Third Fifth
+ 179%
•
Fourth Fifth
+
Highest Fifth
63

() o Z "'Tl H o rn z --l H » r
"'Tl :s:: » () I
"'Tl () H ()
o o o o .j:>. .j:>. "'-J Ul N
• QFreddie c:§jMac We make home possible"
• 2. Will nonprime grow, stabilize, or shl?
I T[h]® ~lUJlQ)~[[,DM® M©l[['[k®~ ~®N®s) l(Q)W®[['o~[Til~(Q)M® @1[Tilcd]
M 0 [Til (Q) rr 0 ~1f ~ (Q) lUJ S) ® [h] CD) ~ cd] S) M CD) IT'® ~ [h] ©l [Til ~ [['OM ®
Minority households are twice as likely to use subprime mortgages, regardless of income
.Subprime
DPrime
Non-Hispanic White
Minorities
Subprime vs. Prime Loans By Ethnic Group and Income Bracket - 2005
Low Income «= 80% of Median
Family Income)
Moderate Income (80-120% Median Family
Income)
Higher Income (> 120% Median Family Income)
Source: Freddie Mac, Office of Chief Economist; Home Mortgage Disclosure Act (2005) 64

() o Z "'Tl H o rn z --l H » r
"'Tl :s:: » () I
"'Tl () H ()
o o o o .j:>. .j:>. "'-J Ul W
• • 2. Will nonprime grow. stabilize, or sht7
QFreddie CfuMac We make home possible-
Minority households are expected to account for -70% of all household growth between 2000 to 2020
2005 Household Distribution (100% = 114 Million)
NonHispanic White
Minority
Minority
NonHispanic
White
Projected Growth in Households (2000-2020)
+ 11%
+72%
At current usage rates, 3-6 million first-time homebuyers are likely to take out subprime loans over the next 10 years (split evenly between minorities and whites)
Source: Joint Center For Housing Studies of Harvard University 65

() o Z "'Tl H o rn z --l H » r
"'Tl :s:: » () I
"'Tl () H ()
o o o o .j:>. .j:>. "'-J Ul .j:>.
• • 2. Will nonprime grow, stabilize, or Sht? QFreddie c:Q:iMac We make home possible'"
Today's volume (40% of 2006 conforming originations)
-$200B in Alt-A
700
600
500 .
400 .
Nonprime securitization market* (in $ Billions)
Growth trend slightly faster than overall market··
20% retrenchment in 2007 (current analyst consensus)
-$400B in subprime Stagnation
300 .
200 •
2006
Severe retrenchment
2008 2009
Growth trend slightly faster than overall market**
2010 2011
• Half of subprime and Alt-A lending disappears (down to pre-2004 levels, 20% of conforming production)
High liquidity 680 scenario
(Alt-A and subprime at -35% of total originations)
360 Low liquidity scenario ( .... 20%)
• Global investors turn away, underwriting standards tighten dramatically
* Conventional Conforming. Assumes 80% of Alt-A and subprime originations are securitized
*. Projections based on 9% growth in high liquidity scenario, and 10% growth in low liquidity scenario
Sources: Inside Mortgage Finance; Freddie Mac Strategic Analysis 66

() o Z "'Tl H o rn z --l H » r
"'Tl :s:: » () I
"'Tl () H ()
o o o o .j:>. .j:>. "'-J Ul Ul
• QFreddie CQjMac We make home possible'"
• 3. What is the opportunity and risk? •
I [E~[p)©lOl)doOl)~ ~Ol) ffi\dj©l(c®OI)~ M@l[j[k®~~ ~o~~ M (U] ~~~ [p)~® (Q) [b)j®(c~~%7®~ ~(Q)[j ~[j®cdJcdJ o® M©l(c
We see an alignment of business opportunity and mission fulfillment
Market Share
Mission
ffi\ (Q] j @l ~ ® [{1] ~
M@l[['[]{®~~
Profitability
67

() o Z "'Tl H o rn z --l H » r
"'Tl :s:: » () I
"'Tl () H ()
o o o o .j:>. .j:>. "'-J Ul 0"1
• QFreddie ~Mac We make home possible-
• 3. What is the opportunity and risk? •
I W[h)(ffi~ [85(ffi~(ffim1~® (Q)~ [P>(Q)~D~D~(ffi~9 ~®~~~(ffi~(Q)~9 (ffim1tdl l®~(ffi~ ~D~~~ (ffilflltdl MD~~D(Q)lfll f~~~D~~mJi)®m1~ [O)(Q)®~ [Q)®®[p)®rf [P>(ffi~D~D[P)(ffi~D(Q)OIl DOll
~(Q)0Il [p)[JDm® [P[J®~®[(i)~?
• Current state of the GSE policy debate
• Policymakers' views on subprime lending
• Our new subprime credit policy - implications
68

() o Z "'Tl H o rn z --l H » r
"'Tl :s:: » () I
"'Tl () H ()
o o o o .j:>. .j:>. "'-J Ul "'-J
• c;J Freddie ~Mac We make home possible'"
• 3. What is the opportunity and risk? •
At current homeownership trends, changing ethnic demographics will reduce the homeownership rate by 1 % per decade
80
75
70
65
60
55
U.S. Homeownership Rate Projections (in Percent)
The Homeownership Gap Rate
Non-Hispanic White 76% Minority 50%
Assumes current homeownership gap persists
1965 1970 1975 1980 1985 1990 1995 2000 2005 2010 2015 2020 2025 2030 2035 2040 2045 2050
Source: Freddie Mac, Office of the Chief Economist; U. S. Census Bureau
Wlhltal~ Ctal~ we dlo ~~ Ihle~ IP>
~aJll'll'<OlW ~1hl(B
~tallP>?
69
() o Z "'Tl H o rn z --l H » r
"'Tl :s:: » () I
"'Tl () H ()
o o o o .j:>. .j:>. "'-J Ul 00
• • • 3. What is the opportunity and risk?
QFreddie ~Mac
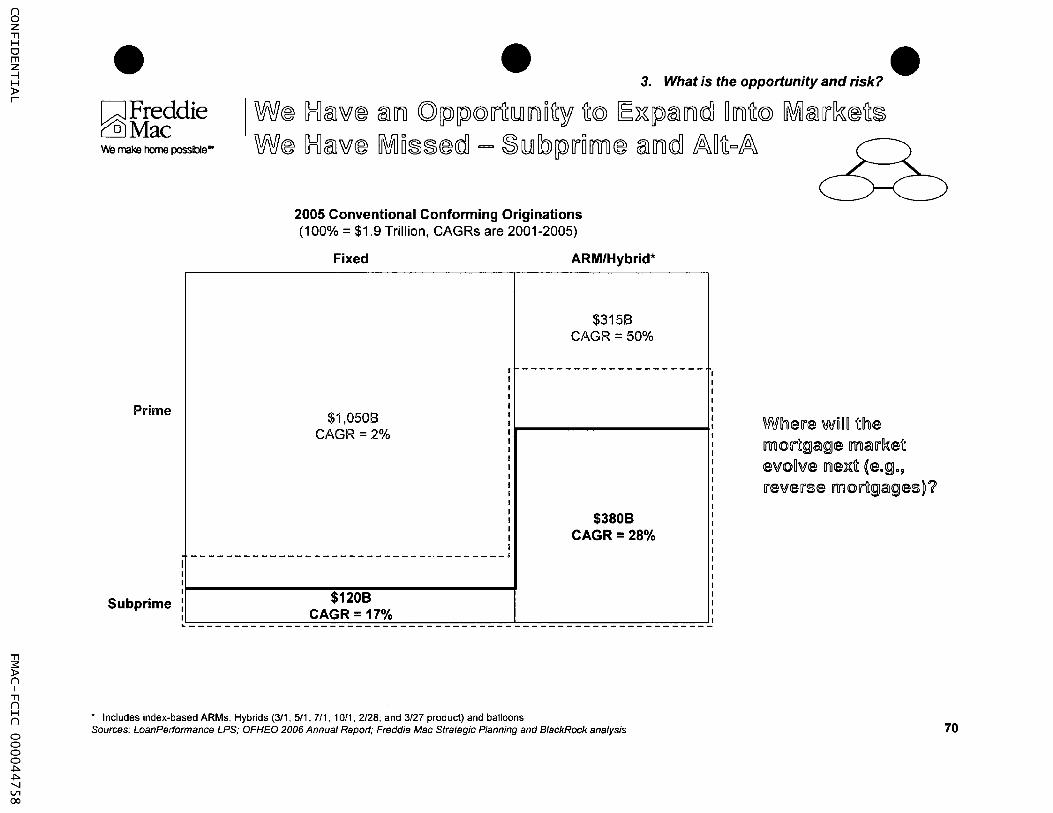
I W® ~@l~® @l[i1 (Q)[p[P(Q)rulUl[i1~~1f ~(Q) [EJ[[p@l[i1cd] ~[i1~(Q) ~@l[j~®~~ W® ~@l~® M05555®cd] = ~ lUl [b)[p)[jOM® tal[i1cd] ffi\~~=ffi\ We make home possible'"
Prime
Subprime
I I I I I I I
2005 Conventional Conforming Originations (100% = $1.9 Trillion, CAGRs are 2001-2005)
Fixed ARM/Hybrid*
$3158 CAGR = 50%
I ---------------------
$1,0508 CAGR=2%
f I I f
$3808 f f
CAGR = 28% f I
---------~-~----------~----~--------~
$1208 CAGR= 17%
~----------------------------------------------------- ------
• Includes index-based ARMs, Hybrids (3/1, 5/1, 7/1, 10/1, 2/28, and 3/27 product) and balloons Sources: LoanPerformance LPS; OFHEO 2006 Annual Report; Freddie Mac Strategic Planning and BlackRock analysis
I I I I I I I I
Wherre Wm fthe llinloU'ft(9Jal(9Je Ilinlalrr~eft evo~ve ll1leuft ~e.(9J., rrevelrse moU'ft(9Jal(9Jes}1
70

() o Z "'Tl H o rn z --l H » r
"'Tl :s:: » () I
"'Tl () H ()
o o o o .j:>. .j:>. "-J Ul ~
• • • 3. What is the opportunity and risk?
QFreddie r::illMac
I W®~~ClCC@l[P)D~@l~D~®~ fD!riJ@lITll~D@l~ ~ITll~~D~lUl~D(Q)!riJ~ ~@l\,#® ~®~ lUl!riJ ~(Q) [Q)(Q)M 0 ITll@l~® ~ [l1] LbLQ)rro M ® We make home possible'"
2005 Subprime Originations 2006 Subprime Originations D = Well capitalized (total market = $6658) (total market = $6408)
/ Doubled volumes in 2006 1. Ameriquest Mortgage 1. Wells Fargo Home Mortgage ~ Recent credit problems, but 2. New Century Financial 2. HSBC Finance r-- long-term commitment to business
[ 3. Countrywide Financial 3. New Century Financial (-20% of Group profits)
14. - --- - - - ---
[4. I' Restating 2006 earnings for
Wells Fargo Home Mortgage Countrywide Financial insufficient repurchase reserves
5. Option One Mortgage I 5. CitiMortgage I<J-- 85% increase in volume in 2006
16. Washington Mutual I 6. WMC Mortgage I GE 1
7. Fremont Investment & Loan 7. Fremont Investment & Loan <J-- Delayed quarterly earnings release
18. First Franklin Financial Corp. I 8. Ameriquest Mortgage <J-- Volumes dropped 60% in 2006;
9. GMAC-RFC 9. Option One Mortgage Citigroup to infuse capital
[ 10. HSBC Finance I 10. First Franklin Financial Corp. r- Acquired by Merrill Lynch
[11. - - . - - . --- - - -] I WMC Mortgage I GE 11. Washington Mutual
1 12. CitiMortgage 1
12. GMAC-RFC
Subprime volume is flowing to our traditional customers
We strengthen our value proposition by bidding for the majority of their conforming production
Wlh~~ W(Q)IUJ~(O] 1h~~~~1Til olF IF~~ CCOlIUJ~(O] @O~~ ~Ih<em ~1Til ~~~~OU1 [00(0]1 o To our value proposition and pricing?
o To our ability to meet our housing goals?
Sources: Inside Mortgage Finance; News releases 71
() o Z "'Tl H o rn z --l H » r
"'Tl :s:: » () I
"'Tl () H ()
o o o o .j:>. .j:>. "'-J 0"1 o
• ~Freddie c:QjMac We make home possible"
• 3. What is the opportunity and risk? •
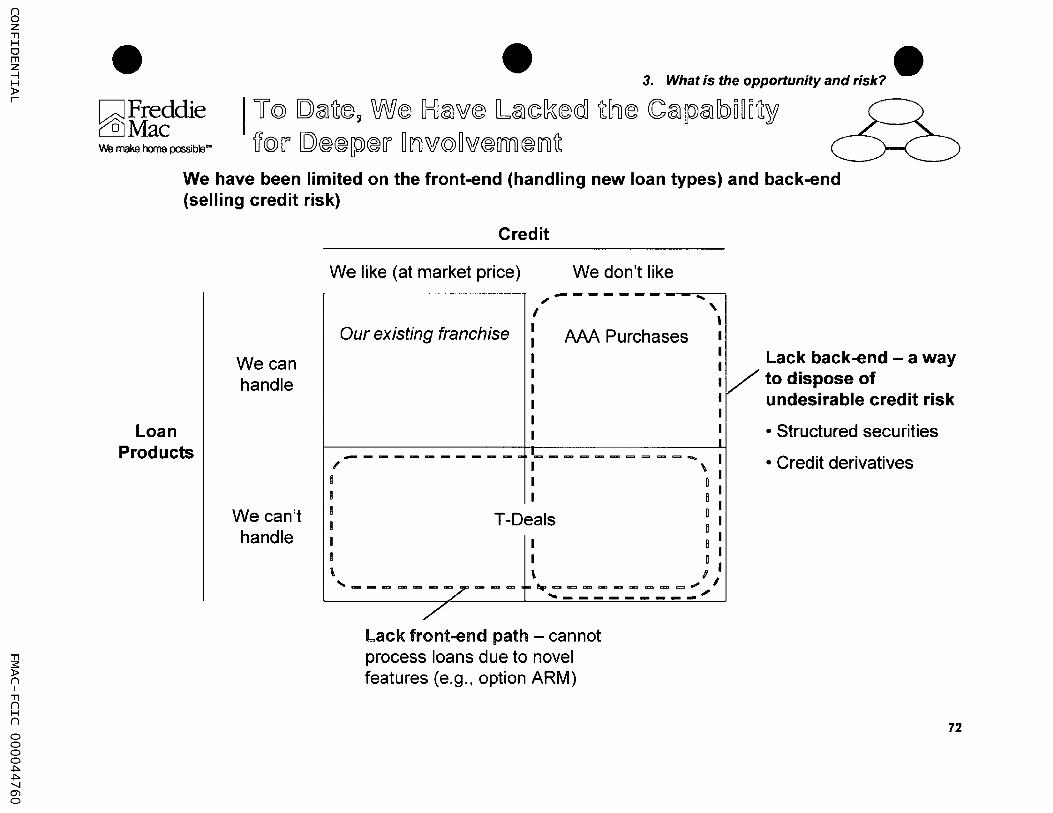
I U@ [Q)@l~®~ W® ~@l~® l@l~~®cdJ ~~® CC@l~©l[b)O~O~1f ~@[f [Q)®®[p)®[1 ~ [Tl)~@~~®m ®01)~
We have been limited on the front-end (handling new loan types) and back-end (selling credit risk)
Loan Products
We can handle
We can't handle
Credit
We like (at market price) We don't like ,,- ... , ,
Our existing franchise AM Purchases I
I I I I I I I I I
I Lack back-end - a way IIV to dispose of I undesirable credit risk I I I
_----------m~-----====~ I / I \ I I D I ! I 0 I I 0 I ! T-Oeals 0 I
I I n I I I D I \ \ I I ,-------,.--- -~-==-- ___ =.;."I
./ ,---------,/'
Lack front-end path - cannot process loans due to novel features (e.g., option ARM)
• Structured securities
• Credit derivatives
72

() o Z "'Tl H o rn z --l H » r
"'Tl :s:: » () I
"'Tl () H ()
o o o o .j:>. .j:>. '-I 0""1 I-'
• • ~Freddie c:§jMac We make home possible-
Freddie Mac has competitive advantages over non-GSE participants in nonprime
1. Securitization - our securities trade at higher prices
2. Holding interest rate and credit risk - Unlike most conduits, Freddie Mac can take long-term credit and interest rate positions in its portfolio
4. What strategy should we pursue?
The core of our value creation: Freddie Mac's liquidity advantage
(security price)
100.60
100.00
•
AAA security issued by a
dealer
FREwrapped
AAA security
FRE passthrough
73

() o Z "'Tl H o rn z --l H » r
"'Tl :s:: » () I
"'Tl () H ()
o o o o .j:>. .j:>. "'-J 0"1 N
• ~Freddie ~Mac
Illustrative economics in 2011
Available Originations ($ B)
FRE market share
Purchases ($ B)
Credit guarantee purchases ($ B)
Risk-based capital
Capital deployed ($ B)
ROE
Potential earnings ($ MM)
Growth Rate (2011-2016)
• New business from
existing Single Family franchise
(Prime)
$1,500
30%*
$450
$450
100 bp
$4.5
10-12%
$ 450-550
10%
4. What strategy should we pursue?
New business from Nonprime
$ 500
20%
$100
50%l $ 50
300-400 bp
$1.8
12-15%
$ 210-260 + $50-100 MM
•
in incremental earnings (at high ROEs) from credit
15% intermediation
Wee <L:~lUlMl [p)1i~~i~taljb)~3f (d)ee[p)~(Q)3f ctal[p)i~t8l~ OITil 1Til<01Til[p)IiOlmee, tallTildl dIliO\fee ~lUlli eetallilTililTil~~ tallTil(d) ~talili \ftal~lUlee ~1i~WitIh
Wee W~lUl ~d1 Ol~~<O e~[p)ec~ ~(Q) (gJIi<OW ~1ht8lliee
* Equals 45% GSE share 74

() o Z "'Tl H o rn z --l H » r
"'Tl :s:: » () I
"'Tl () H ()
o o o o .j:>. .j:>. "'-J 0"1 w
• QFreddie CQjMac
• 4. What strategy should we pursue? • We make home possible"
I ~~~~@rru ~@rr [Frr®~~u® M©l~: C@~®rrurru~ ~~® wrru@~® C(O)rru~(O)rr[M 0 rru ~ M©l rr~®~
Conforming mortgage
market
Prime
Alt-A
Subprime
Broaden the spectrum of loans we are willing to
purchase
@rum' WID(fj)©[}u~©®~
~~[]i]Jm ©[}ffi)[f@[}u@~@@cr
[]@[[lD[Jl]1)© rIDW @[W~[f(IDD(fj)~©ldl~~~W w@rrw~(fj)® @QD[(' U®l:@~[(l@Ql ~(fj)®~®
@(fj)@] ~@W@[ffiJ®~(fj)® []i]J@[ffucW [IDMls fko)[('
®OOl@[(' @~(ill~
Hold interest rate or credit
risk
Credit and Interest Rate Risk Portfolios
We have a competitive
advantage versus Fannie Mae in
capital markets and risk management
capabilities
Capital Markets
External Dispose of Investors
interest rate or credit risk (e.g., PC, structured
securities, CDS)
75

() o Z "'Tl H o rn z --l H » r
"'Tl :s:: » () I
"'Tl () H ()
o o o o .j:>. .j:>. "'-J 0"1 .j:>.
• CJFreddie ~Mac We make home possible"
From ...
Inflexible front end
Closed back end
Limited experience in
nonprime credit
investing
• To ...
Can rapidly adjust to handle loans as originators innovate
Can sell credit via subordinate bonds, derivatives, mortgage insurance, whole loans, or structured securities
Can model, price, and structure nonprime credit, and capture relative value
4. What strategy should we pursue?
Our greatest operational problems arise from:
• Boarding new types of loans
• Aggregating loans
• Issuing structured securities
•
We are investigating a parallel platform for adjacent markets, reliant on outsourcing
We need to further enhance our models and expertise, and already have:
• Dedicated a team to non prime credit
• Purchased external models
• Executed senior/sub-structures and our first CDS
76
() o Z "'Tl H o rn z --l H » r
"'Tl :s:: » () I
"'Tl () H ()
o o o o .j:>. .j:>. "'-J 0"1 Ul
• GJFreddie ~Mac We make home possible-
Market Share
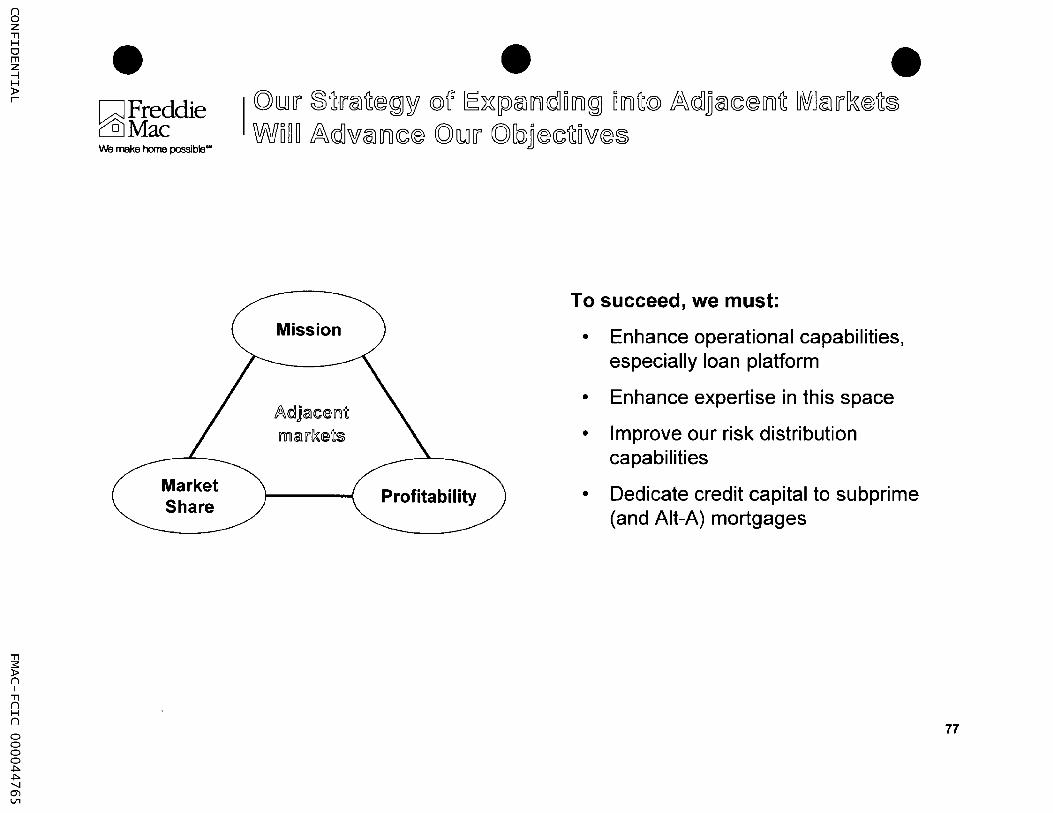
• • I (Q) Il.IlIr ~ ~lriill ~@ ~ 1i' «dl ~ IE~ [pl iilllJ'i rdl u IJ'i ~ U IJ'i ~«dl ffi\. rdl] iilll1';@ IJ'i ~ IJij[J iilllrik @ ~~ WD~~ fo\~w©:l[rucc® (Ql~[J (Ql~~®cc~Dw®~
Mission
#l\<dIj<alC~Iril~
m<alrr/){~~$
Profitability
To succeed, we must:
• Enhance operational capabilities, especially loan platform
• Enhance expertise in this space
• Improve our risk distribution capabilities
• Dedicate credit capital to subprime (and Alt-A) mortgages
77

() o Z "'Tl H o rn z --l H » r
"'Tl :s:: » () I
"'Tl () H ()
0 0 0 0 .j:>. .j:>. "'-J 0"1 0"1
• • • QFreddie rill Mac We make home possible"
We face profitability and growth constraints across our existing franchise, and will pursue the key opportunities to improve
• Manage G&A
• Improve security performance
• Consider taking more market risk
Our major expansion opportunity is adjacent markets (nonprime) - expanding there will advance all our business and franchise objectives
• Mission
• Market share
• Profitability
The next 12 - 24 months of retrenchment and low liquidity may provide an opportunity to recapture what we ceded in the past decade
Our vision is to cover the whole conforming mortgage market - and nimbly go wherever the market evolves
•
•
•
Offer a bid on all our customers' production
Profit through securitization I guarantees and the retained portfolio
Choose to take well-priced credit risk and layoff the remainder
78


![È á » ]U] ]F]S] ]M]d]F]S ]T]E]d]0] ]R]d] È á » ^ D ]3]d] ù*\ ô j T]c £ b \¾ ¹ T\¨ t B C © ® è H U ¼ ] ¢ \ ý ~]c]F]d] ].] ][] ] ¢ Ö\ È á »]F]d] ].] ][] ] ¢ ¼](https://img.pdfslide.us/doc/110x75/601c85db74e8c300e0487bfe/-u-fs-mdfs-ted0-rd-d-3d-j-tc-.jpg)