Embed Size (px)
Citation preview

C. Eberle, P. Gerlinger, M. Aigner, A sectional PAH model with reversible PAH chemistry for CFD soot simulations, Combustion and Flame 179 (2017) 63-73
The original publication is available at www.elsevier.com
http://dx.doi.org/10.1016/j.combustflame.2017.01.019
A Sectional PAH Model with Reversible PAH Chemistry for CFD SootSimulations
Authors: C. Eberlea, P. Gerlingerb, M. Aignera
Affiliations:
a Institut fur Verbrennungstechnik,Deutsches Zentrum fur Luft- und Raumfahrt,Paffenwaldring 38-40, 70569 Stuttgart, Germany
b Institut fur Verbrennungstechnik der Luft- und Raumfahrt,Universitat Stuttgart,Paffenwaldring 38-40, 70569 Stuttgart, Germany
Corresponding Author:Christian Eberle
Institut fur Verbrennungstechnik
Deutsches Zentrum fur Luft-und Raumfahrt (DLR)
Pfaffenwaldring 38-40, 70569 Stuttgart, Germany
Phone: +49/711/6862-563, Fax: +49/711/6862-578
Email: [email protected]
Type of Article: Full Length Article
Short title: A PAH Model for CFD Soot Simulations
Keywords: polycyclic aromatic hydrocarbons (PAHs); reduced PAH chemistry;sectional approach; soot; particle size distribution
1
A Sectional PAH Model with Reversible PAH Chemistry for CFD Soot
Simulations
C. Eberle, P. Gerlinger, M. Aigner
Abstract
A novel sectional approach for the modeling of polycyclic aromatic hydrocarbons (PAHs)
is presented. The PAH model includes PAH radicals and is based on a reversible PAH growth
mechanism. Combustion of species up to benzene and toluene is treated by finite-rate chem-
istry. The soot particle size distribution (PSD) is discretized by a sectional approach. Soot,
PAHs, and the thermo-chemical state of the gas phase are fully coupled by a simultaneous
solution of all governing equations. The new PAH model has been validated for a series of
combustion configurations and shows significant improvements compared to irreversible PAH
models at basically no increase in computational cost. Compared to irreversible PAH models,
soot nucleation is significantly slower, yielding a better agreement to measured soot volume
fractions in a series of laminar premixed flames. Moreover, the model developments led to
correct predictions of the temperature dependency of the soot yield in ethylene pyrolysis after
reflected shock waves. Finally, it will be shown that the new model describes the influence of
the equivalence ratio on soot PSD functions correctly.
Keywords polycyclic aromatic hydrocarbons (PAHs); reduced PAH chemistry; sectional approach;
soot; particle size distribution
1 Introduction
Soot predictions are a pressing technological need. This is not only due to adverse effects on health,
environment, and climate [1, 2, 3, 4] but also from an engineering point of view. An example are
1
aero-engine combustors where soot, by its high radiative emissivity, contributes to locally elevated
heat loads on combustion chamber walls [5]. Soot modelling in technical combustion devices as for
example gas turbine combustors or internal combustion engines by means of computational fluid
dynamics (CFD) is a challenging task. On one hand, complex geometries impose high computational
cost, since in many applications grids with several million volumes are required for an accurate
spatial resolution [6]. To allow realistic simulation times under such circumstances, a soot model
for CFD applications can only consider the most important processes of soot evolution using as few
variables as possible. On the other hand, technical combustion usually occurs at high pressures and
temperatures and is very complex, since effects such as turbulence, partial premixing, and secondary
air injection may lead to locally and temporally varying combustion conditions. For accurate soot
predictions in such complex systems, the soot model has to be validated for a wide range of different
combustion problems.
One of the least understood processes of soot evolution is nucleation. In simple nucleation
models, nucleation rates are correlated to the acetylene concentration [7]. Because such models
are computationally efficient, they are nowadays often used for simulations of complex combustion
configurations as for example turbulent jet flames [8, 9], gas turbine combustors [10] or diesel
engines [11]. A recent study by Roy and Haworth [12] confirmed that good soot predictions can be
obtained with such models. However, as shown by McKinnon and Howard [13], exclusive formation
of nascent soot by acetylene addition can be too slow. Moreover, the fast depletion of PAHs in
regions where soot is formed shows that soot nucleation is correlated to PAH distributions [13, 14,
15, 16, 17].
Therefore, more comprehensive soot models which include a detailed description of PAH kinetics
have been developed and applied to laminar combustion problems. In these models, soot nucleation
is modeled by PAH dimerization. Either a single PAH species as for example pyrene [18, 19] or
an ensemble of PAH species [20, 21] are used as soot incipient species. However, since the number
of species with similar mass and the number of structural isomers increase quickly with molecular
mass [22], lumping techniques for PAHs exceeding a certain size have been developed [22, 23].
These PAH models distinguish between PAH molecules and PAH radicals and PAH kinetics are
described in a detailed way. In recently published sectional PAH models [24, 25] an additional
2
discretization for the H/C-ratio of PAHs is introduced to distinguish between different molecule
structures. An example is the model of D’Anna et al. [24] where species heavier than 300 g/mol
are discretized by 25 mass classes and five subclasses with different H/C-ratios are introduced per
class. In total 125 (5 H/C ratios × 25 mass classes) lumped species are defined in this way for PAH
molecules and another 125 for the corresponding PAH radicals. Eaves et al. [26] and Veshkini et
al. [27] developed models which consider the reversibility of soot nucleation and PAH condensation
processes. For the calculation of the respective reverse rates, additional transport equations for
PAHs on the soot surface were introduced. Thereby the need for arbitrary constants for nucleation
and condensation efficiencies was removed.
Due to the high computational cost of such complex approaches, different model reduction
strategies have been developed for PAH chemistry to be used in turbulent flame simulations. One
possibility are flamelet combustion models which rely on tabulated chemistry. Pitsch et al. [28]
developed a Lagrangian unsteady flamelet approach where equations for the kinetics of gas phase
species up to pyrene, the further planar PAH growth, and a two moment soot model are interactively
solved in mixture fraction space. In a later work, Mueller et al. [29] used a steady flamelet/progress
variable model [30] for large-eddy simulations of a sooting turbulent jet flame. Since PAH mass
fractions can deviate significantly from the steady state flamelet model [31], Mueller et al. [29]
implemented an additional transport equation for a single lumped PAH species to take the slow
PAH chemistry into account. An extended PAH relaxation model for flamelet simulations was
developed in a later work by Xuan and Blanquart [32]. This model includes multi-step chemical
processes of PAHs by solving transport equations for benzene and naphthalene. While these PAH
models take the slow time scales of PAH kinetics into account, they do not provide information
about the PAH size distribution and PAH radicals are not explicitly considered. However, as will
be shown in this work, both aspects can be relevant to obtain correct soot nucleation rates and
ultimately accurate predictions of the soot morphology. Besides these flamelet based approaches,
reduced PAH models which are solved directly by finite-rate chemistry were developed [33, 34, 35].
They are computationally more expensive but provide a full coupling of soot, PAHs, and the thermo-
chemical state of the gas phase by a simultaneous solution of all governing equations. These finite-
rate chemistry based models use skeletal mechanisms to describe the formation of small aromatic
3
species, as for example benzene. PAH chemistry is modeled in a simplified way by irreversible
reactions between a few lumped PAH species. Basis of this work is a sectional PAH model of
Blacha et al. [35], where PAHs with a molar weight in the range of 100 g/mol to 800 g/mol are
discretized by three sections. In this model, PAH radicals are not considered and irreversible PAH
chemistry is assumed. The model has been validated using different laminar [35] and turbulent [36]
flames where a good overall agreement was found with one set of model constants. However, this
model has difficulties in combustion regimes with strong partial premixing. For example, it cannot
correctly predict the sensitivity of particle size distribution (PSD) functions with respect to the
equivalence ratio at conditions close to the sooting limit in a plug flow reactor. Also, as a result of a
too fast PAH growth, the onset of soot formation is predicted too early in laminar premixed flames.
Moreover, coupled to a two-equation soot model [34] and used for simulations of a confined swirl
flame [37], the maximum soot volume fraction is significantly overpredicted [6]. This is attributed
to the cited challenges regarding partial premixing and irreversible PAH chemistry.
Thus the focus of the present work is the development of a new PAH model in order to improve
the predictive capability of soot models at technically relevant conditions. To this end PAH radi-
cals and a reversible formulation of PAH chemistry are introduced. The model will be validated for
selected combustion configurations which capture technical relevant aspects such as elevated pres-
sures, high temperatures, and partial premixing. Comparisons to an irreversible PAH model [35]
and to more detailed models from the literature will be presented and differences will be analyzed.
2 Methodology
The soot and PAH models are implemented in the DLR code THETA. THETA is an unstructured
finite-volume solver which has been optimized for low Mach number combustion problems. Com-
bustion is modelled by finite-rate chemistry. PAHs and soot are described by sectional approaches
where transport equations are solved for each section. Chemical reactions involving soot and PAHs
are formulated in Arrhenius form and are solved in the same way as reactions of gas phase species.
This allows a full coupling of soot, PAHs, and gas phase species. The calculation of diffusion coef-
ficients [38] is based on molecular data as derived in [39]. Diffusive fluxes of soot sections are set to
4
zero due the large Schmidt number of soot particles (1/Sc→ 0), while thermophoresis [40] of soot
particles is taken into account [35].
2.1 Gas Phase Chemistry
The kinetics of gas phase species are modeled by a reaction mechanism which describes the formation
of hydrocarbons up to benzene and toluene. The mechanism includes 43 species and 304 elementary
reactions and has been validated for pyrolysis and combustion of small hydrocarbons, such as
methane or ethylene at atmospheric and high-pressure conditions [41]. This mechanism has been
obtained by reduction of the detailed mechanism of Slavinskaya et al. [20] and has successfully been
used for soot predictions in previous works [6, 35, 36].
2.2 PAH Model
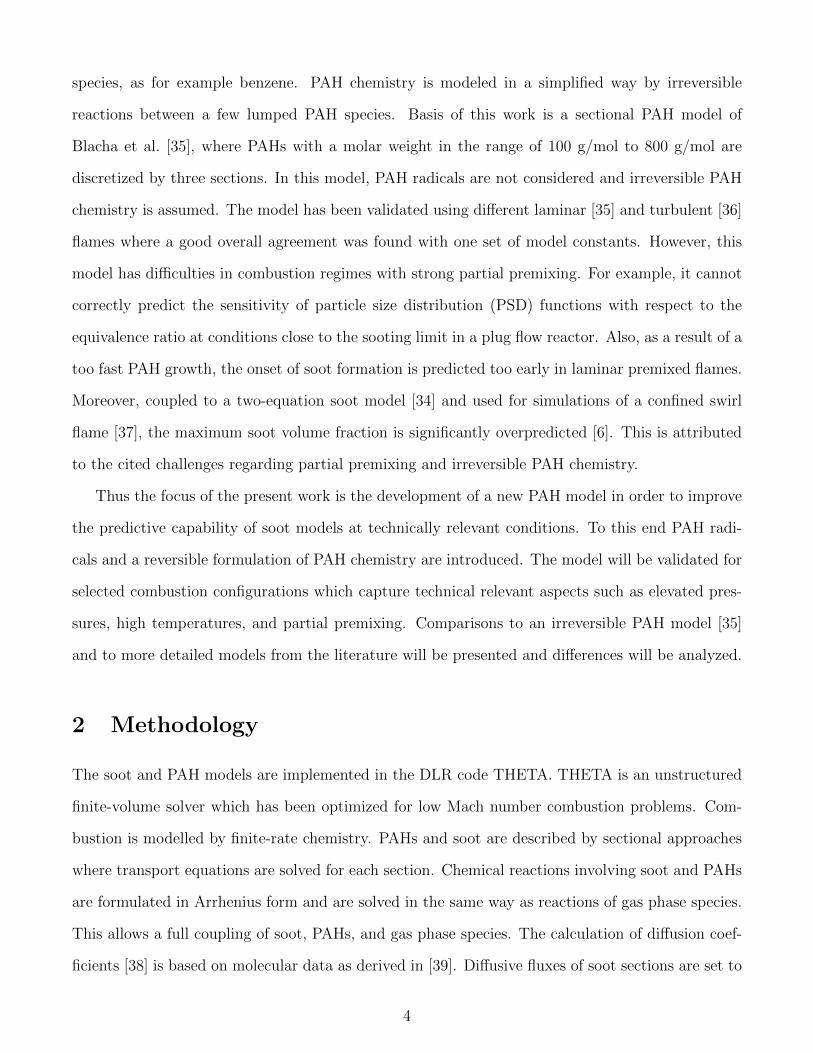
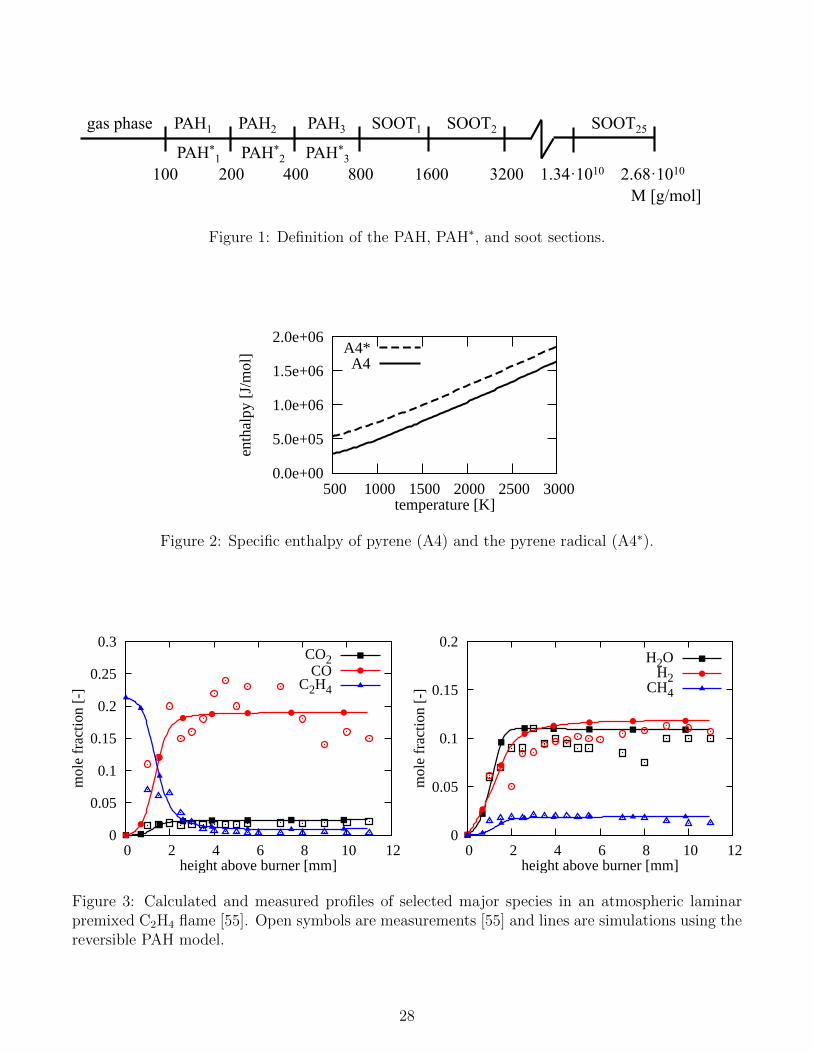
As shown in Fig. 1, PAHs are described by three logarithmically scaled sections. The minimum
PAH mass is set to 100 g/mol in order to cover all PAHs (Naphthalene being the smallest PAH has
a molar mass of 128 g/mol). As the maximum PAH mass is assumed to be equal to the minimum
soot mass (cf. Fig. 1), the maximum PAH mass has to be chosen in a way to yield incipient soot
particles of realistic size. At the same time the maximum PAH mass should be as small as possible.
This is because modelling uncertainties may increase with increasing PAH size since, as will be
shown in section 2.2.2, chemical analogy to small PAHs is assumed. Also, as will be discussed in
section 2.2.1, thermodynamical data may not be available for very large PAHs. In this context,
it was decided to set the maximum PAH mass to 800 g/mol leading to an incipient soot particle
diameter of 1.28 nm which is in line with measured particle diameters [42]. To describe reversible
PAH chemistry, a radical branch PAH∗i is assigned to each PAH section.
2.2.1 PAH Thermodynamics
Thermodynamic properties such as H/C ratios and enthalpies of PAHi are obtained by inter- and
extrapolation from 43 reference PAHs [43] ranging from benzene to tetrabenzoperylene as explained
in [35]. Transport properties of PAHi are obtained in a similar way using data from Richter et
5
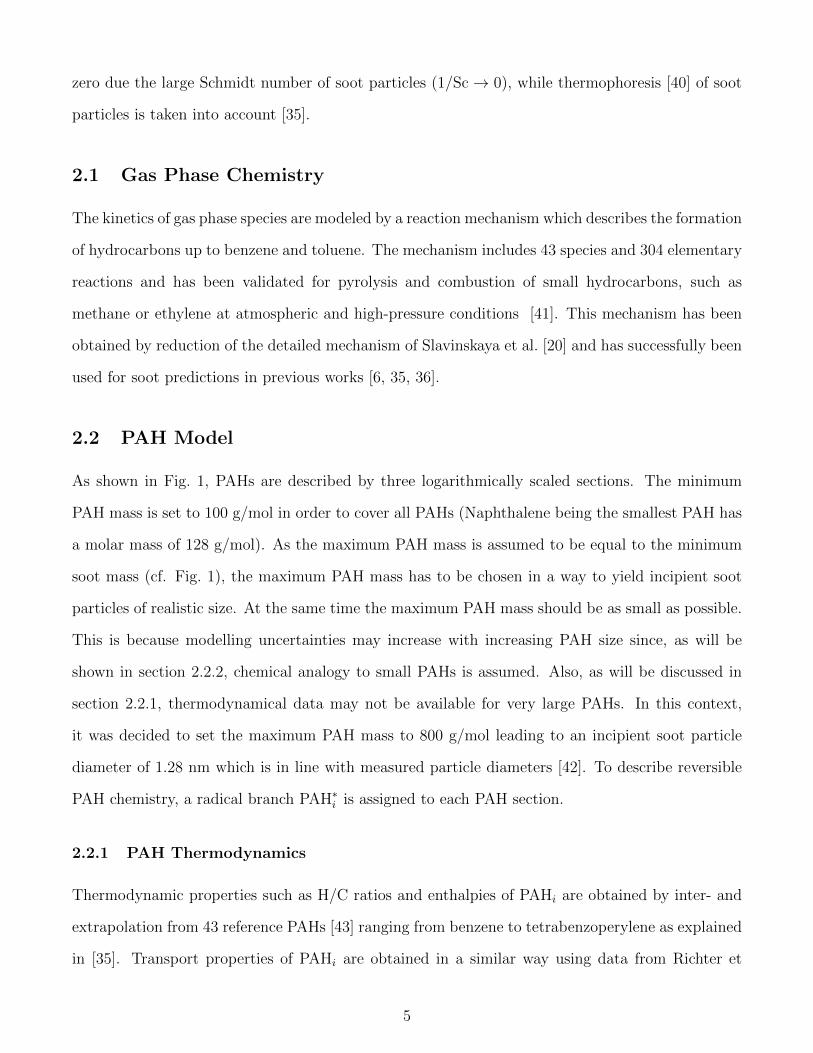
al. [22]. While it is assumed that transport properties of PAH∗i are identical to those of PAHi, an
approximation for the enthalpy of PAH radicals is required. As shown in Fig. 2 on the basis of
pyrene, the enthalpy difference between a PAH molecule and the corresponding PAH radical
∆h∗ = hPAH∗i− hPAHi
(1)
is approximately constant. An analysis of a number of unsubstituted PAHs ranging from naphtha-
lene to ovalene using thermodynamic data from Burcat et al. [44] and Richter et al. [45] showed
that ∆h∗ is not a function of the PAH size. Using ∆h∗ = 2.5×10⁵ J/mol, the maximum deviation
between hPAH∗ derived from thermodynamic data [44, 45] and hPAH∗ calculated by Eq. (1) is ap-
proximately 5 % in the temperature range 500 K < T < 3000 K. This is considered reasonably
accurate for the calculation of mixture properties such as temperatures. The fitted thermodynami-
cal data of PAH sections should however not be used to calculate equilibrium constants since fitting
errors may be amplified exponentially [35]. Moreover, the concentration of PAH∗i is low compared
to PAHi (see section 3.1). Thus, the influence of PAH radicals on the enthalpy of the mixture is
expected to be small.
2.2.2 PAH Chemistry
PAH chemistry is divided into four processes: PAH1 gas phase interaction, PAH dehydrogenation,
acetylene (C2H2) addition, and PAH oxidation. The chemical kinetics describing these processes
are defined in analogy to small PAHs. A list of the individual chemical reactions is given in table 1.
Rate parameters are taken from a detailed reaction mechanism which describes the kinetics of PAHs
up to benzo(a)pyrene [46]. Since the fitted thermodynamical data of PAH sections should not be
used to calculate equilibrium constants (cf. section 2.2.1), reverse rates are also taken from small
PAHs. As this simple approximation may induce some uncertainty, parametric sensitivity studies
will be shown in the supplemental material. The stoichiometric coefficients ν are introduced to
satisfy mass conservation.
PAH1 gas phase interaction describes the formation and consumption of PAH1 by reactions with
chemical species included in the gas phase mechanism (for instance benzene or toluene). Blacha et
6
al. [35] derived 19 reversible reactions for PAH1 gas phase interaction. In the present work, this
set of reactions is extended by 6 reactions (see table 1) which additionally describe the interaction
of gas phase species with the PAH∗1 radical. They are taken from the mechanism of Slavinskaya et
al. [46].
Dehydrogenation or H-atom abstraction is the first step of the hydrogen-abstraction acetylene-
addition (HACA) mechanism [47]. In the present approach, dehydrogenation of PAHs by H-atoms,
O-atoms, hydroxyl (OH), and unimolecular decomposition is considered. The corresponding reac-
tion rates (see table 1) are taken from equivalent PAH reactions as defined in [46]. The second step
of the HACA mechanism is C2H2 addition at a reactive site of a PAH radical. The newly developed
reversible formulation of C2H2 addition is given by:
PAH∗j + C2H2 → ν1PAHj + ν2PAHj+1 + ν3H , (2)
PAHj + H→ ν1PAH∗j−1 + ν2PAH∗
j + ν3H2 + C2H2 . (3)
Following Pope an Howard [48], the stoichiometric coefficients νi are calculated depending on intra
sectional distribution functions and atom conservation. This is done in a way that both, mass and
atoms are conserved (see [35] for more details). This procedure is also applied in case of PAH
oxidation and PAH collisions. The reaction rate parameters for the C2H2 addition are obtained
by assuming chemical analogy to the pyrene radical [46]. Further considerations are required for
C2H2 addition to the last PAH section (j = 3 in Eq. (2)). In this case, Blacha et al. [35] replaced
PAHj+1 by SOOT1 and thereby allowed C2H2 addition to contribute to soot nucleation. This is in
contrast to soot models with detailed PAH chemistry, where soot nucleation is modelled by PAH
dimerization [18, 22, 49]. Therefore ν2 is set to zero for j = 3 and in this case Eq. (2) reads
PAH∗3 + C2H2 → ν1PAH3 + ν3H. Oxidation of PAHs is implemented in a similar way. An example
is the PAH oxidation by molecular oxygen
PAH∗j + O2 → ν1PAH∗
j−1 + ν2PAH∗j + ν3H2 + 2 CO . (4)
Since the transition of PAHs to gas phase species is captured by the PAH1 gas phase interaction
7
model, ν1 is set to zero in Eqs. (3) and (4) for j = 1. The full list of PAH oxidation reactions is
given in table 1.
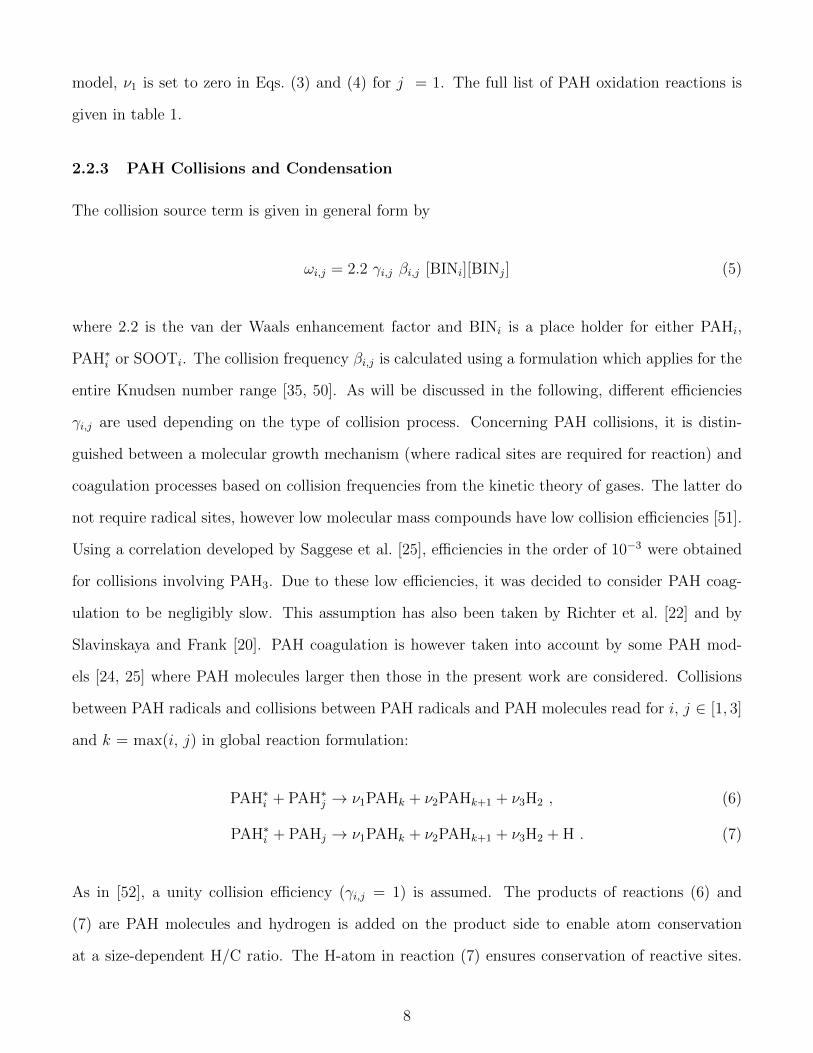
2.2.3 PAH Collisions and Condensation
The collision source term is given in general form by
ωi,j = 2.2 γi,j βi,j [BINi][BINj] (5)
where 2.2 is the van der Waals enhancement factor and BINi is a place holder for either PAHi,
PAH∗i or SOOTi. The collision frequency βi,j is calculated using a formulation which applies for the
entire Knudsen number range [35, 50]. As will be discussed in the following, different efficiencies
γi,j are used depending on the type of collision process. Concerning PAH collisions, it is distin-
guished between a molecular growth mechanism (where radical sites are required for reaction) and
coagulation processes based on collision frequencies from the kinetic theory of gases. The latter do
not require radical sites, however low molecular mass compounds have low collision efficiencies [51].
Using a correlation developed by Saggese et al. [25], efficiencies in the order of 10−3 were obtained
for collisions involving PAH3. Due to these low efficiencies, it was decided to consider PAH coag-
ulation to be negligibly slow. This assumption has also been taken by Richter et al. [22] and by
Slavinskaya and Frank [20]. PAH coagulation is however taken into account by some PAH mod-
els [24, 25] where PAH molecules larger then those in the present work are considered. Collisions
between PAH radicals and collisions between PAH radicals and PAH molecules read for i, j ∈ [1, 3]
and k = max(i, j) in global reaction formulation:
PAH∗i + PAH∗
j → ν1PAHk + ν2PAHk+1 + ν3H2 , (6)
PAH∗i + PAHj → ν1PAHk + ν2PAHk+1 + ν3H2 + H . (7)
As in [52], a unity collision efficiency (γi,j = 1) is assumed. The products of reactions (6) and
(7) are PAH molecules and hydrogen is added on the product side to enable atom conservation
at a size-dependent H/C ratio. The H-atom in reaction (7) ensures conservation of reactive sites.
8
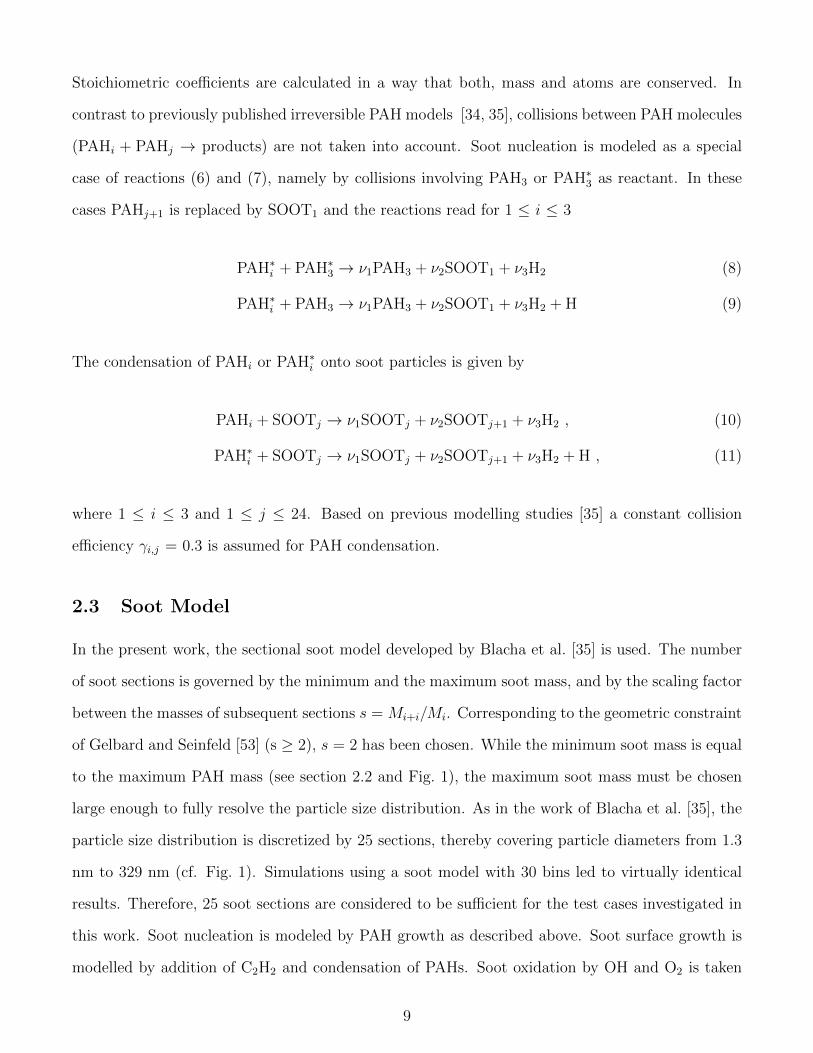
Stoichiometric coefficients are calculated in a way that both, mass and atoms are conserved. In
contrast to previously published irreversible PAH models [34, 35], collisions between PAH molecules
(PAHi + PAHj → products) are not taken into account. Soot nucleation is modeled as a special
case of reactions (6) and (7), namely by collisions involving PAH3 or PAH∗3 as reactant. In these
cases PAHj+1 is replaced by SOOT1 and the reactions read for 1 ≤ i ≤ 3
PAH∗i + PAH∗
3 → ν1PAH3 + ν2SOOT1 + ν3H2 (8)
PAH∗i + PAH3 → ν1PAH3 + ν2SOOT1 + ν3H2 + H (9)
The condensation of PAHi or PAH∗i onto soot particles is given by
PAHi + SOOTj → ν1SOOTj + ν2SOOTj+1 + ν3H2 , (10)
PAH∗i + SOOTj → ν1SOOTj + ν2SOOTj+1 + ν3H2 + H , (11)
where 1 ≤ i ≤ 3 and 1 ≤ j ≤ 24. Based on previous modelling studies [35] a constant collision
efficiency γi,j = 0.3 is assumed for PAH condensation.
2.3 Soot Model
In the present work, the sectional soot model developed by Blacha et al. [35] is used. The number
of soot sections is governed by the minimum and the maximum soot mass, and by the scaling factor
between the masses of subsequent sections s = Mi+i/Mi. Corresponding to the geometric constraint
of Gelbard and Seinfeld [53] (s ≥ 2), s = 2 has been chosen. While the minimum soot mass is equal
to the maximum PAH mass (see section 2.2 and Fig. 1), the maximum soot mass must be chosen
large enough to fully resolve the particle size distribution. As in the work of Blacha et al. [35], the
particle size distribution is discretized by 25 sections, thereby covering particle diameters from 1.3
nm to 329 nm (cf. Fig. 1). Simulations using a soot model with 30 bins led to virtually identical
results. Therefore, 25 soot sections are considered to be sufficient for the test cases investigated in
this work. Soot nucleation is modeled by PAH growth as described above. Soot surface growth is
modelled by addition of C2H2 and condensation of PAHs. Soot oxidation by OH and O2 is taken
9
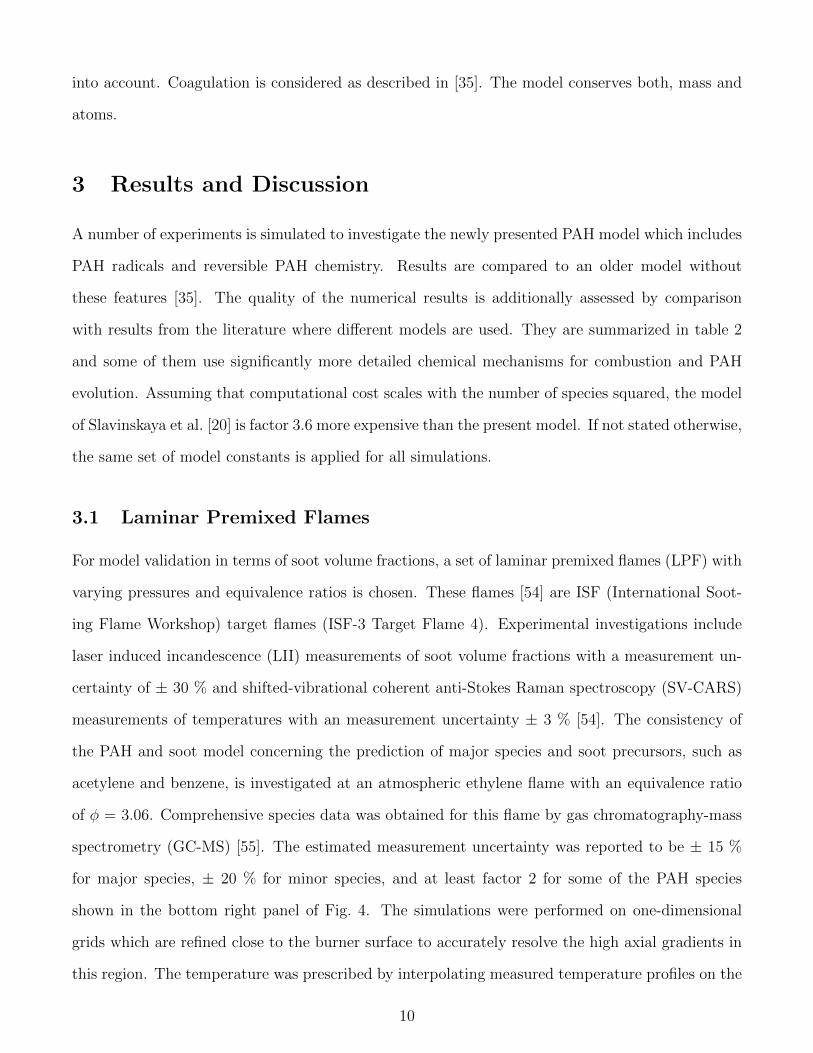
into account. Coagulation is considered as described in [35]. The model conserves both, mass and
atoms.
3 Results and Discussion
A number of experiments is simulated to investigate the newly presented PAH model which includes
PAH radicals and reversible PAH chemistry. Results are compared to an older model without
these features [35]. The quality of the numerical results is additionally assessed by comparison
with results from the literature where different models are used. They are summarized in table 2
and some of them use significantly more detailed chemical mechanisms for combustion and PAH
evolution. Assuming that computational cost scales with the number of species squared, the model
of Slavinskaya et al. [20] is factor 3.6 more expensive than the present model. If not stated otherwise,
the same set of model constants is applied for all simulations.
3.1 Laminar Premixed Flames
For model validation in terms of soot volume fractions, a set of laminar premixed flames (LPF) with
varying pressures and equivalence ratios is chosen. These flames [54] are ISF (International Soot-
ing Flame Workshop) target flames (ISF-3 Target Flame 4). Experimental investigations include
laser induced incandescence (LII) measurements of soot volume fractions with a measurement un-
certainty of ± 30 % and shifted-vibrational coherent anti-Stokes Raman spectroscopy (SV-CARS)
measurements of temperatures with an measurement uncertainty ± 3 % [54]. The consistency of
the PAH and soot model concerning the prediction of major species and soot precursors, such as
acetylene and benzene, is investigated at an atmospheric ethylene flame with an equivalence ratio
of φ = 3.06. Comprehensive species data was obtained for this flame by gas chromatography-mass
spectrometry (GC-MS) [55]. The estimated measurement uncertainty was reported to be ± 15 %
for major species, ± 20 % for minor species, and at least factor 2 for some of the PAH species
shown in the bottom right panel of Fig. 4. The simulations were performed on one-dimensional
grids which are refined close to the burner surface to accurately resolve the high axial gradients in
this region. The temperature was prescribed by interpolating measured temperature profiles on the
10
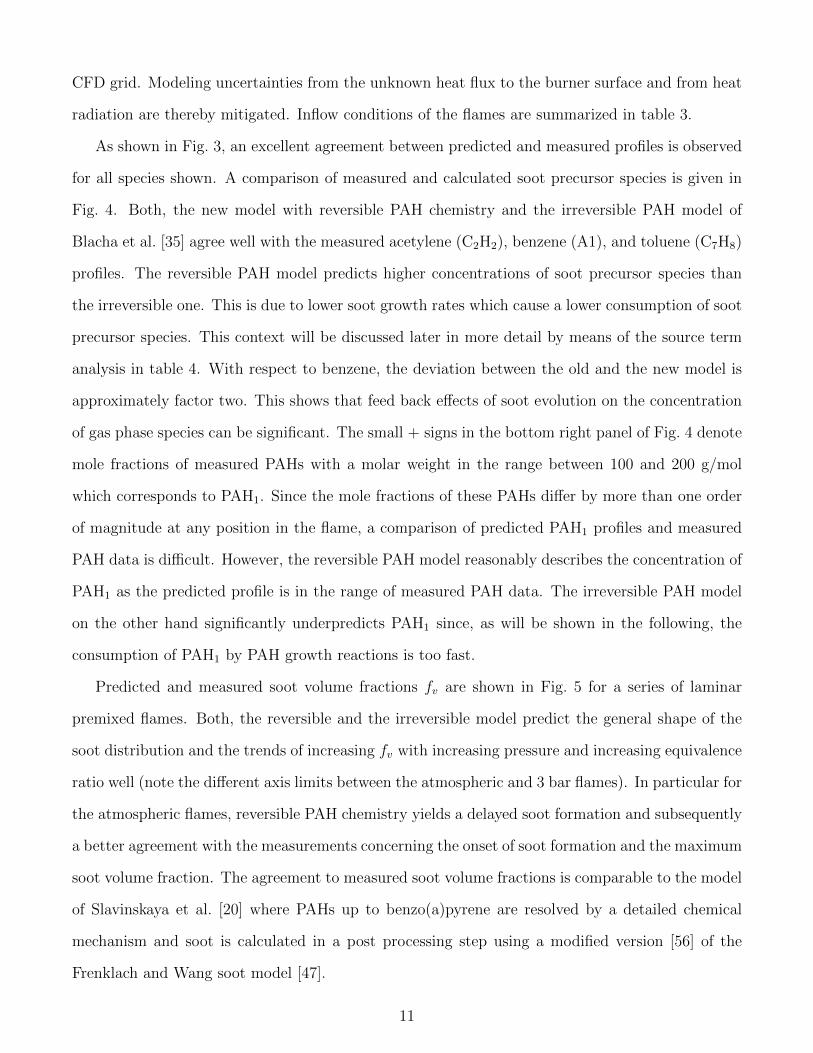
CFD grid. Modeling uncertainties from the unknown heat flux to the burner surface and from heat
radiation are thereby mitigated. Inflow conditions of the flames are summarized in table 3.
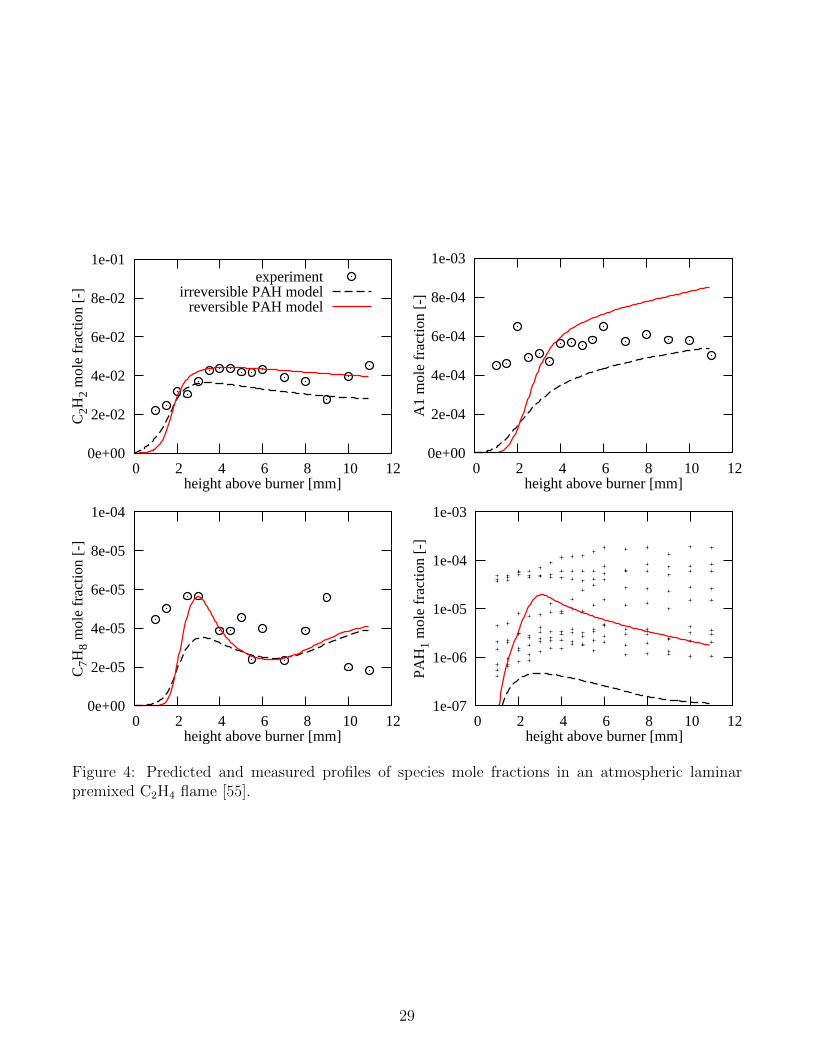
As shown in Fig. 3, an excellent agreement between predicted and measured profiles is observed
for all species shown. A comparison of measured and calculated soot precursor species is given in
Fig. 4. Both, the new model with reversible PAH chemistry and the irreversible PAH model of
Blacha et al. [35] agree well with the measured acetylene (C2H2), benzene (A1), and toluene (C7H8)
profiles. The reversible PAH model predicts higher concentrations of soot precursor species than
the irreversible one. This is due to lower soot growth rates which cause a lower consumption of soot
precursor species. This context will be discussed later in more detail by means of the source term
analysis in table 4. With respect to benzene, the deviation between the old and the new model is
approximately factor two. This shows that feed back effects of soot evolution on the concentration
of gas phase species can be significant. The small + signs in the bottom right panel of Fig. 4 denote
mole fractions of measured PAHs with a molar weight in the range between 100 and 200 g/mol
which corresponds to PAH1. Since the mole fractions of these PAHs differ by more than one order
of magnitude at any position in the flame, a comparison of predicted PAH1 profiles and measured
PAH data is difficult. However, the reversible PAH model reasonably describes the concentration of
PAH1 as the predicted profile is in the range of measured PAH data. The irreversible PAH model
on the other hand significantly underpredicts PAH1 since, as will be shown in the following, the
consumption of PAH1 by PAH growth reactions is too fast.
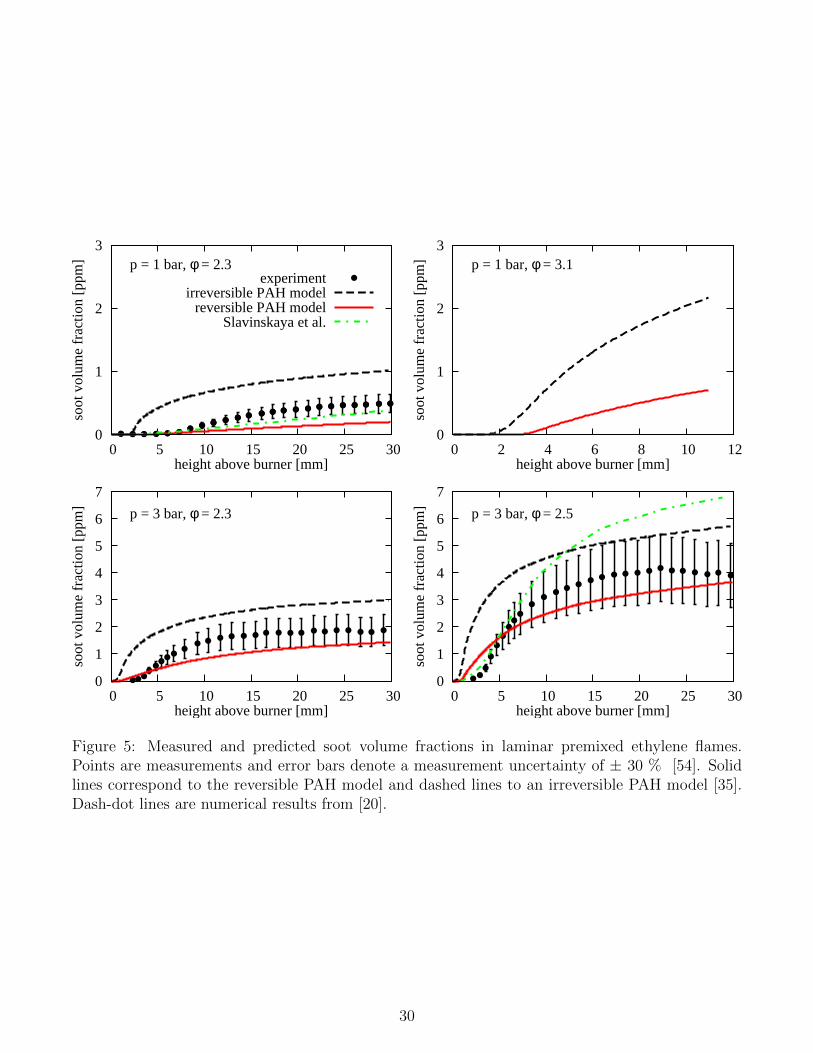
Predicted and measured soot volume fractions fv are shown in Fig. 5 for a series of laminar
premixed flames. Both, the reversible and the irreversible model predict the general shape of the
soot distribution and the trends of increasing fv with increasing pressure and increasing equivalence
ratio well (note the different axis limits between the atmospheric and 3 bar flames). In particular for
the atmospheric flames, reversible PAH chemistry yields a delayed soot formation and subsequently
a better agreement with the measurements concerning the onset of soot formation and the maximum
soot volume fraction. The agreement to measured soot volume fractions is comparable to the model
of Slavinskaya et al. [20] where PAHs up to benzo(a)pyrene are resolved by a detailed chemical
mechanism and soot is calculated in a post processing step using a modified version [56] of the
Frenklach and Wang soot model [47].
11
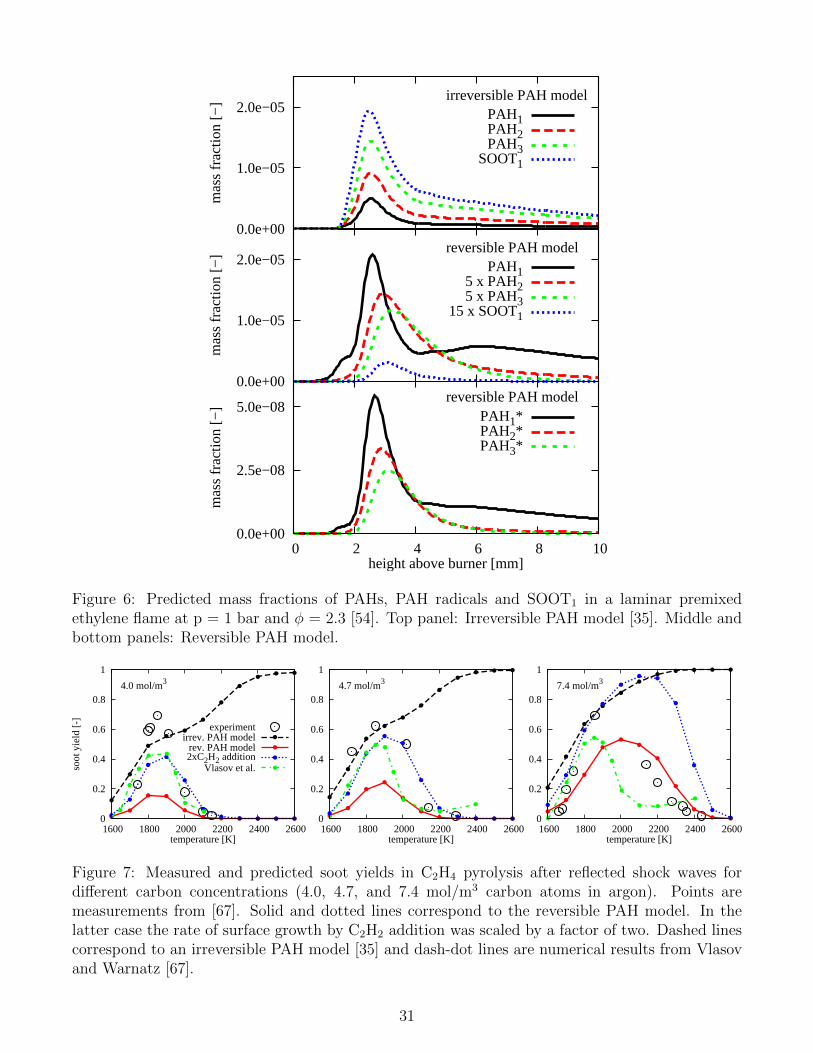
The differences between reversible and irreversible PAH model are analyzed in more detail by
the following study on the basis of the atmospheric LPF with φ = 2.3 (results from this flame are
representative for the other flames listed in table 3). To this end, Fig. 6 shows predicted mass
fractions of PAH sections, PAH radicals, and SOOT1. As shown in the top panel of Fig. 6, the
model with irreversible PAH chemistry [35] predicts the mass fractions of PAHs and SOOT1 to
peak approximately at the same position. The maximum mass fractions are increasing from PAH1
to SOOT1, indicating that PAH1 is consumed quickly by respective PAH growth reactions. The
reversible PAH model predicts a significantly different PAH size distribution. As a result of a slower
PAH growth, PAH1 accumulates and becomes the PAH section with the maximum mass fraction.
The larger PAH sections and SOOT1 peak at significantly lower mass fractions and are formed
further downstream. This result is in line with the expectation of slow PAH chemistry and there
is also experimental evidence that the concentration of small PAHs (the upper limit of PAH1 is
200 g/mol which corresponds approximately to the molar weight of 4-ring PAHs) is significantly
higher than that of larger PAHs. For example, Di Lorenzo et al. [57] found that the concentration
of 5 to 7 ring PAHs is almost negligible compared to the concentration of smaller PAHs in rich,
premixed CH4/O2 flames. Similar observations were made for the oxidation of toluene and heptane
after reflected shock waves [58] and more recently in the pyrolysis of C2H4 and C2H2 [59, 60]. The
calculated PAH radical profiles shown in the bottom panel of Fig. 6 have a similar shape as the
corresponding PAH molecules. Their concentration however is about three orders of magnitude
lower which is in line with experimental investigations [61, 62], where the concentration of PAH
radicals was measured in laminar premixed flames using nozzle beam sampling followed by radical
scavenging with dimethyl disulfide.
As shown in table 4, the different PAH size distributions have significant implications on soot
nucleation. With irreversible PAH chemistry [35], the contribution of soot nucleation to the total
soot production term is more than 24 % in all investigated flames, while in case of reversible PAH
chemistry it is of the order of 0.1 %. This is in agreement with experimental and numerical studies
of laminar premixed ethylene flames, where nucleation was found to be orders of magnitude lower
than surface growth [63, 64, 65, 66]. The percentage of PAH condensation onto soot particles
increases with increasing pressure and equivalence ratio. The most extreme case is the atmospheric
12
φ = 3.06 flame were the contribution of condensation (61 %) is higher than that of surface growth
via C2H2 addition (39 %).
3.2 Soot Yield after Reflected Shock Waves
Vlasov and Warnatz [67] presented measurements and predictions of soot yields (percentage of
carbon mass contained in soot particles) in ethylene pyrolysis after reflected shock waves at a
pressure of 50 bar for different initial temperatures and carbon concentrations (4.0, 4.7, and 7.4
mol/m3 carbon atoms in argon). In their model, gas phase chemistry is described by a detailed
mechanism (1700 gas phase elementary reactions, 141 species) for PAHs up to pyrene and polyynes
up to C12H2. The soot particle size distribution is approximated by a discrete Galerkin technique
suggested by Deuflhard and Wulkow [68]. The shock tube experiments were modelled as adiabatic,
isochoric reactors with residence times of 1.5 ms.
A comparison of predicted and measured soot yields as a function of temperature is given in
Fig. 7. As argued by Vlasov and Warnatz [67], the experimentally observed bell-shaped curve
of soot yield as a function of temperature is caused by PAH kinetics. While the reversible PAH
model and the model of Vlasov and Warnatz [67] accurately describe this effect at all carbon atom
concentrations, the PAH model from Blacha et al. [35] predicts a monotonically increasing soot yield
with increasing temperature. This is because reversibility of PAH chemistry and PAH radicals are
neglected. As can be seen from Fig. 7, this erroneous behavior becomes evident at temperatures
higher than 2000 K only. However, accurate soot predictions at such high temperatures are very
relevant since technical combustion devices are in many cases operated with preheated air leading
to high combustion temperatures. A scaling of the rate coefficient of soot surface growth via
C2H2 addition by a factor of two (dotted line) additionally improves the quantitative agreement
to measurements in the 4.0 and 4.7 mol/m3 cases. In this way, results from the newly proposed
model are similar to those obtained by the more detailed and computationally significantly more
expensive model of Vlasov and Warnatz [67]. However by using this scaled rate coefficient, the soot
yield is overpredicted in the temperature range 1900 K < T < 2400 K for the 7.4 mol/m3 case.
13
3.3 Prediction of Particle Size Distributions
Manzello et al. [69] studied PAH growth and soot inception by measurements of soot particle size
distributions (PSD) at atmospheric pressure in a device where an ethylene fuelled well-stirred reactor
(WSR) is followed by a plug flow reactor (PFR). The soot particle measurements were conducted
at the bottom most sampling port of the PFR using a dilution probe followed by a nano-differential
mobility analyzer. This measurement technique captures particles with diameters from 3 nm to
60 nm using 30 sampling bins. In addition, gas chromatography measurements of selected species
are available. The air flow rate was kept constant while the ethylene flow rate was varied to obtain
the equivalence ratios φ = 1.8, 1.9, 2.0, 2.1, and 2.2. The expanded measurement uncertainty in
the reported equivalence ratios is ± 3 %. The temperature in the PFR was approximately 1400
K at all equivalence ratios. A major uncertainty is the definition of temperatures in the WSR
since temperature measurements are reported only for φ = 2.0 (T = 1723 K with a measurement
uncertainty of ± 10 %). In the present work the estimated temperatures proposed by Bhatt and
Lindstedt [18] are reduced by 5% (well within the range of measurement uncertainty) to obtain a
better agreement with experimental data, resulting in T = 1713 K, 1675 K, 1637 K, 1599 K, and
1561 K for the φ = 1.8, 1.9, 2.0, 2.1, and 2.2 cases. The WSR and PFR are modeled by isobaric,
isothermal reactors. Residence times of the WSR and the PFR amount to 11 and 18 ms.
Figure 8 shows a comparison of measured and predicted species mole fractions as a function of the
equivalence ratio φ. Calculated acetylene and benzene mole fractions compare well to measurements
and the sensitivity with respect to φ is accurately predicted. Calculated PAH1 mole fractions are
compared to measured naphthalene data. Considering the difficulties associated with comparisons
of PAH bins and individual PAH species (cf. Fig. 4), a reasonable agreement is observed. Similar
as in the study of Bhatt and Lindstedt [18], the naphthalene mole fraction is underpredicted at φ
= 2.2. Bhatt and Lindstedt [18] attributed this underprediction to the influence of soot nucleation.
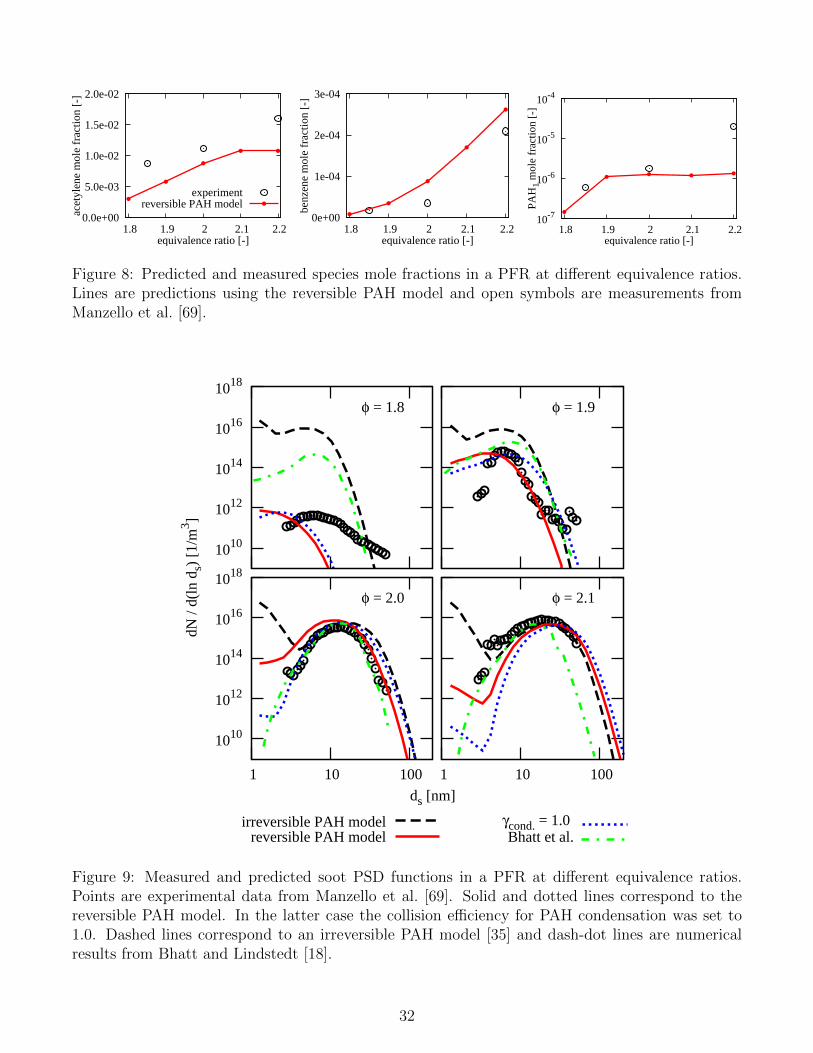
Figures 9 and 10 show predicted and measured soot properties. Experimental soot volume frac-
tions fv, particle number densities N , and mean particle diameters ds were obtained by integrating
14
the PSD data from Manzello et al. [69] by
ds =1
N
∫ds dN , (12)
fv =π
6
∫d3s dN . (13)
Since in the measurements no indication of flame generated particles was found at φ = 1.8, the
sooting limit is in the range 1.8 < φ < 1.9. The measured soot properties shown in Fig. 10 are
monotonically increasing with φ and the corresponding PSD functions in Fig. 9 are shifted to larger
particle diameters and number densities when φ is increased. At φ = 2.0, a local minimum in the
measured PSD function indicates bimodality and thus the existence of a nucleation mode. Singh et
al. [70] explained bimodal soot PSDs by competing nucleation and coagulation processes. Possible
reasons why bimodality is not observed at other equivalence ratios may be the detection limit of the
measurement technique (only particles with ds ≥ 3 nm are detected) and, as argued by Manzello
et al. [69], the different mixing properties of a WSR/PFR relative to laminar premixed flames. For
the latter ones, Abid et al. [42] found that PSD functions are in general bimodal.
While the model with irreversible PAH chemistry [35] predicts bimodal PSD functions at all
equivalence ratios, Bhatt and Lindstedt [18] report unimodal distributions at all equivalence ra-
tios. They used a sectional approach for soot where inception is modeled by pyrene dimerization;
combustion and PAH chemistry were described by a detailed mechanism (285 species and 1520
reactions). The model developed in the present work on the other hand shows a transition from
unimodal distributions close to the sooting limit to bimodal distributions in the well-sooting regime.
The model with irreversible PAH chemistry [35] shows good agreement to measured PSD functions
at φ = 2.0 and 2.1. This model however overpredicts the PSD function at φ = 1.8 by four orders
of magnitude and thus fails to predict PSD functions close to the sooting limit. The model with
reversible PAH chemistry on the other hand provides excellent predictions of the sooting limit. The
shift of the PSD functions to larger particle diameters and number densities with increasing φ is
also in good agreement to the experimental data.
A dominant impact parameter on soot PSD functions is the efficiency of PAH condensation
onto soot particles γcond. As shown in table 5, increasing γcond from the standard value 0.3 to 1.0
15
decreases the ratio of nucleation to condensation (ωnucl/ωcond) by factors between 3 and 6.75, since
more PAH mass is transferred to soot via the condensation pathway. As shown in Fig. 9, a higher
γcond shifts the PSD function to larger diameters and, as a result of decreased soot nucleation,
less small particles are observed. A similar effect was observed in modelling studies by Saggese et
al. [25] and Veshkini et al [27]. This influence of γcond on the PSD function is most pronounced in
the well sooting regime, for example at φ=2.1, where the PSD function is decreased by two orders
of magnitude at particle diameters within the nucleation mode. Similar to a study on reversible
nucleation and condensation by Eaves at al. [26], an increase in γcond yields higher mean particle
diameters while the particle number densities are slightly decreased (see Fig. 10). Thus, less particles
with larger diameters are predicted. While γcond = 1.0 underpredicts the PSD function at small
diameters at φ = 2.1 and yields too large mean particle diameters, γcond = 0.3 achieves a good
agreement to measurements at all equivalence ratios.
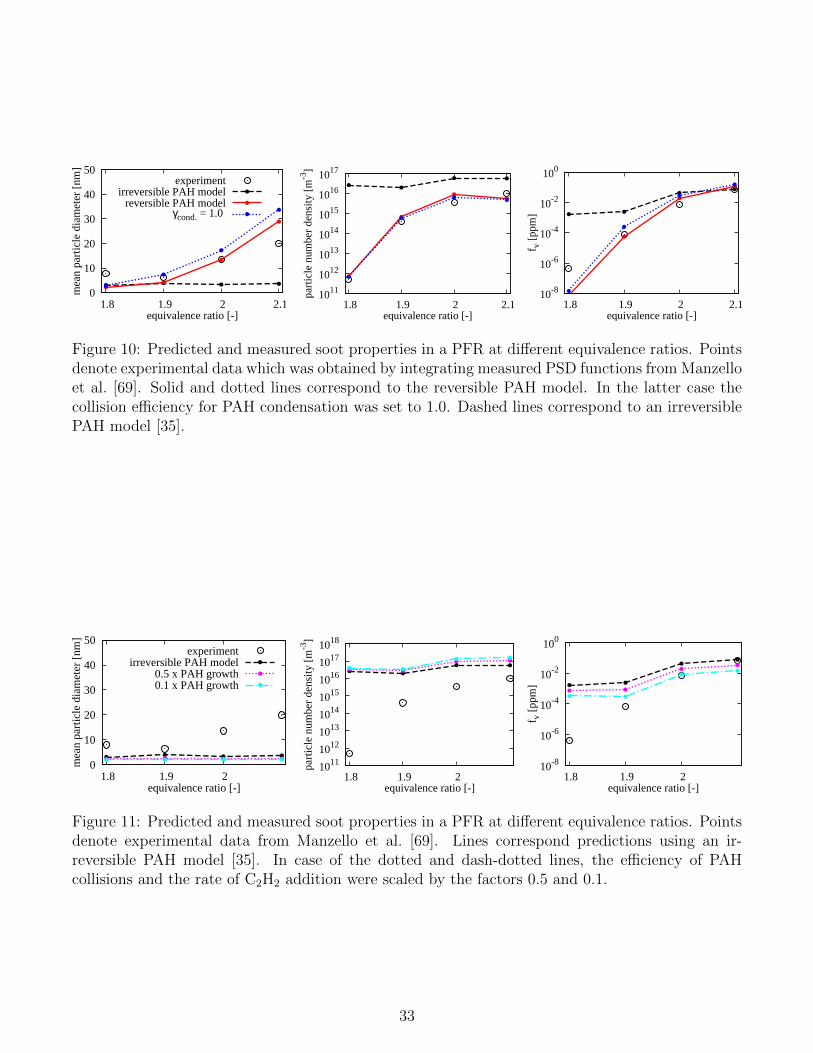
The excellent agreement of the reversible PAH model to measured mean particle diameters,
particle number densities, and soot volume fractions shown in Fig. 10 demonstrates that the soot
morphology is accurately described at these challenging combustion conditions, where N and fv
increase by several orders of magnitude when φ is changed from 1.8 to 2.1. With irreversible PAH
chemistry, on the other hand, the particle number density is overpredicted and the sensitivity of
the soot morphology with respect to φ is not resolved. Consistent to the laminar flame simulations
discussed in section 3.1, the source term analysis shown in table 5 reveals that in case of irreversible
PAH chemistry, the percentage of soot nucleation to the total soot formation rate is, with more
than 10 %, significantly too high [63, 64, 65]. Realistic values are in the order of 0.1 to 1 %
as obtained by the reversible PAH model. Nevertheless, as observed in previous works [34, 35],
irreversible PAH chemistry can yield accurate soot volume fraction predictions in the well sooting
regime (φ > 2 in the present test case). However, resulting from too strong soot nucleation, the
soot morphology is not described accurately since compared to measurements, too much particles
with too small diameters are observed. As shown in Fig. 11, it was not possible to improve the
prediction of particle number densities by slowing down the PAH growth rates of the irreversible
model. This indicates that PAH radicals and reversible PAH chemistry are required for accurate
predictions of the soot morphology.
16
4 Conclusions
A new sectional PAH model which uses PAH radicals and reversible PAH chemistry was presented.
The new model is validated for a series of combustion configurations, which feature technical relevant
aspects such as elevated pressure, high temperature, and partial premixing at equivalence ratios
in the range of the sooting limit. In comparison to an irreversible PAH model [35], significant
improvements are demonstrated at basically no increase in computational cost. This is important
because the aim of these developments are complex CFD soot simulations. The quality of the soot
predictions is comparable to more detailed models from the literature.
A changed PAH size distribution is obtained leading to significantly smaller soot nucleation
source terms than in case of irreversible PAH chemistry. By the described model developments, the
agreement to measured soot volume fractions was improved in a series of laminar premixed flames.
The extended description of PAH chemistry allowed to predict the bell-shaped curve of soot yield
as a function of temperature. This is of high relevance for soot predictions in technical devices
which are in many cases operated at high temperatures. The new model also predicts particle size
distributions and their sensitivity with respect to the equivalence ratio accurately. Both is highly
challenging especially close to the sooting limit. Moreover, it was found that PAH radicals and a
reversible PAH chemistry are required to accurately predict the soot morphology since irreversible
PAH chemistry leads to too strong soot nucleation which results in an overprediction of particle
number densities.
Acknowledgements
The authors thank Dr. K. P. Geigle and A. Steinbach for their contribution to this work. The
authors gratefully acknowledge the Gauss Centre for Supercomputing e.V. (www.gauss-centre.eu)
for funding this project by providing computing time on the GCS Supercomputer SuperMUC at
Leibniz Supercomputing Centre (LRZ, www.lrz.de)
17
References
[1] B. Karcher (ed.), Particles and cirrus clouds, Tech. rep., German Aerospace Center,
http://www.pa.op.dlr.de/pazi/DLR-Mitteilung 2008-01.pdf, accessed at December 2nd, 2015
(2008).
[2] E. J. Jensen, O. B. Toon, The potential impact of soot particles from aircraft exhaust on cirrus
clouds, Geophysical Research Letters 24 (1997) 249–252.
[3] A. Petzold, J. Strom, S. Ohlsson, F. P. Schroder, Elemental composition and morphology of
ice-crystal residual particles in cirrus clouds and contrails, Atmospheric Research 49 (1998)
21–34.
[4] A. Petzold, J. Strom, F. P. Schroder, B. Karcher, Carbonaceous aerosol in jet engine exhaust:
emission characteristics and implications for heterogeneous chemical reactions, Atmospheric
Environment 33 (1999) 2689–2698.
[5] M. Nakamura, S. Koda, K. Akita, Sooting behavior and radiation in methanol/benzene/air
diffusion flames, Proceedings of the Combustion Institute 19 (1982) 1395–1401.
[6] C. Eberle, P. Gerlinger, K. P. Geigle, M. Aigner, Numerical investigation of transient soot
evolution processes in an aero-engine model combustor, Combustion Science and Technology
187 (2015) 1841–1866.
[7] K. M. Leung, R. P. Lindstedt, A simplified reaction mechanism for soot formation in non-
premixed flames, Combustion and Flame 87 (1991) 289–305.
[8] A. Kronenburg, R. W. Bilger, J. H. Kent, Modeling soot formation in turbulent methane air
jet diffusion flames, Combustion and Flame 121 (2000) 24–40.
[9] R. S. Mehta, D. C. Haworth, M. F. Modest, Composition PDF/photon monte carlo modeling
of moderately sooting turbulent jet flames, Combustion and Flame 157 (2010) 982–994.
18
[10] G. Lecocq, D. Poitou, I. Hernandez, F. Duchaine, E. Riber, B. Cuenot, A methodology for
soot prediciton including thermal radiation in complex industrial burners, Flow, Turbulence
and Combustion 92 (2014) 947–970.
[11] M. Bolla, D. Farrace, Y. M. Wright, K. Boulouchos, Modelling of soot formation in a heavy-
duty diesel engine with conditional moment closure, Fuel 117 (2014) 309–325.
[12] S. P. Roy, D. C. Haworth, A systematic comparison of detailed soot models and gas-phase
chemical mechanisms in laminar premixed flames, Combustion Science and Technology 188
(2016) 1021–1053.
[13] J. T. McKinnon, J. B. Howard, The roles of PAH and acetylene in soot nucleation and growth,
Proceedings of the Combustion Institute 24 (1992) 965–971.
[14] J. D. Bittner, J. B. Howard, Composition profiles and reaction mechanisms in a near-sooting
premixed benzene/oxygen/argon flame, Proceedings of the Combustion Institute 18 (1981)
1105–1116.
[15] M. Bachmann, W. Wiese, K. H. Homann, PAH and aromers: Precursors of fullerenes and soot,
Proceedings of the Combustion Institute 26 (1996) 2259–2267.
[16] W. J. Grieco, A. L. Lafleur, K. C. Swallow, H. Richter, K. Taghizadeh, J. B. Howard, Fullerenes
and PAH in low-pressure premixed benzene/oxygen flames, Proceedings of the Combustion
Institute 27 (1998) 1669–1675.
[17] A. Ciajolo, R. Barbella, A. Tregrossi, L. Bonfanti, Spectroscopic and compositional signatures
of PAH-loaded mixtures in the soot inception region of a premixed ethylene flame, Proceedings
of the Combustion Institute 27 (1998) 1481–1487.
[18] J. S. Bhatt, R. P. Lindstedt, Analysis of the impact of agglomeration and surface chemistry
models on soot formation and oxidation, Proceedings of the Combustion Institute 32 (2009)
713–720.
19

[19] S. B. Dworkin, Q. Zhang, M. J. Thomson, N. A. Slavinskaya, U. Riedel, Application of an
enhanced PAH growth model to soot formation in a laminar coflow ethylene/air diffusion
flame, Combustion and Flame 158 (2011) 1682–1695.
[20] N. A. Slavinskaya, P. Frank, A modelling study of aromatic soot precursors formation in laminar
methane and ethene flames, Combustion and Flame 156 (2009) 1705–1722.
[21] M. R. Kholghy, A. Veshkini, M. J. Thomson, The core-shell internal nanostructure of soot - a
criterion to model soot maturity, Carbon 100 (2016) 508–536.
[22] H. Richter, S. Granata, W. H. Green, J. B. Howard, Detailed modeling of PAH and soot
formation in a laminar premixed benzene/oxygen/argon low-pressure flame, Proceedings of
the Combustion Institute 30 (2005) 1397–1405.
[23] M. Frenklach, H. Wang, Detailed modeling of soot particle nucleation and growth, Proceedings
of the Combustion Institute 23 (1990) 1559–1556.
[24] A. D’Anna, M. Sirignano, J. Kent, A model of particle nucleation in premixed ethylene flames,
Combustion and Flame 157 (2010) 2106–2115.
[25] C. Saggese, S. Ferrario, J. Camacho, A. Cuoci, A. Frassoldati, E. Ranzi, H. Wang, T. Faravelli,
Kinetic modeling of particle size distribution of soot in a premixed burner-stabilized stagnation
ethylene flame, Combustion and Flame 162 (2015) 3356–3369.
[26] N. A. Eaves, S. B. Dworkin, M. J. Thomson, The importance of reversibility in modeling soot
nucleation and condensation processes, Proceedings of the Combustion Institute 35 (2015)
1787–1794.
[27] A. Veshkini, N. A. Eaves, M. J. Thomson, Application of PAH-condensation reversibility in
modeling soot growth in laminar premixed and nonpremixed flames, Combustion and Flame
167 (2016) 335–352.
[28] H. Pitsch, E. Riesmeier, N. Peters, Unsteady flamelet modeling of soot formation in turbulent
diffusion flames, Combustion Science and Technology 158 (2000) 389–406.
20
[29] M. E. Mueller, H. Pitsch, LES model for sooting turbulent nonpremixed flames, Combustion
and Flame 159 (2012) 2166–2180.
[30] C. D. Pierce, P. Moin, Progress-variable approach for large-eddy simulation of non-premixed
combustion, Journal of Fluid Mechanics 504 (2004) 73–97.
[31] F. Bisetti, G. Blanquart, M. Mueller, H. Pitsch, On the formation and early evolution of soot
in turbulent nonpremixed flames, Combustion and Flame 159 (2012) 317–335.
[32] Y. Xuan, G. Blanquart, A flamelet-based a priori analysis of the chemistry tabulation of
polycyclic aromatic hydrocarbons in non-premixed flames, Combustion and Flame 161 (2014)
1516–1525.
[33] B. Zamuner, F. Dupoirieux, Numerical simulation of soot formation in a turbulent flame with
a Monte-Carlo PDF approach and detailed chemistry, Combustion Science and Technology 158
(2000) 407–438.
[34] M. Di Domenico, P. Gerlinger, M. Aigner, Development and validation of a new soot formation
model for gas turbine combustor simulations, Combustion and Flame 157 (2010) 246–258.
[35] T. Blacha, M. Di Domenico, P. Gerlinger, M. Aigner, Soot predictions in premixed and non-
premixed laminar flames using a sectional approach for PAHs and soot, Combustion and Flame
159 (2012) 181–193.
[36] M. Kohler, K. P. Geigle, T. Blacha, P. Gerlinger, W. Meier, Experimental characterization and
numerical simulation of a sooting lifted turbulent jet diffusion flame, Combustion and Flame
159 (2012) 2620–2635.
[37] K. P. Geigle, M. Kohler, W. O’Loughlin, W. Meier, Investigation of soot formation in pressur-
ized swirl flames by laser measurements of temperature, flame structures and soot concentra-
tions, Proceedings of the Combustion Institute 35 (2015) 3373–3380.
[38] F. A. Williams, Combustion Theory, Addison-Wesley, 1997.
21
[39] M. Di Domenico, Numerical simulations of soot formation in turbulent flows, Ph.D. thesis,
Institute of Combustion Technology for Aerospace Engineering Universitat Stuttgart (2008).
[40] Friedlander, Smoke, dust and haze: Fundamentals of aerosol behavior, Wiley-Interscience,
1977.
[41] N. A. Slavinskaya, O. J. Haidn, Reduced chemical model for high pressure methane combustion
with PAH formation, in: Proceedings of the 46th AIAA Aerospace Sciences Meeting, no. AIAA
2008-1012, 2008.
[42] A. D. Abid, E. D. Tolmachiff, D. J. Phares, H. Wang, Y. Liu, A. Laskin, Size distribution and
morphology of nascant soot in premixed ethylene flames with and without benzene doping,
Proceedings of the Combustion Institute 32 (2009) 681–688.
[43] J. Yu, R. Sumathi, W. Green Jr., Accurate and efficient method for predicting thermochemistry
of polycyclic aromatic hydrocarbons - bond-centered group additivity, Journal of the American
Chemical Society 126 (2004) 12685–12700.
[44] A. Burcat, Ideal gas thermodynamic data in polynomial form for combustion and air pollution
use, http://tx.technion.ac.il/~aer0201/, accessed at December 2nd, 2015.
[45] H. Richter, T. G. Benish, O. A. Mazyar, W. H. Green, J. B. Howard, Formation of poly-
cyclic aromatic hydrocarbons and their radicals in a nearly sooting premixed benzene flame,
Proceedings of the Combustion Institute 28 (2000) 2609–2618.
[46] N. A. Slavinskaya, U. Riedel, S. B. Dworkin, M. J. Thomson, Detailed numerical modeling
of PAH formation and growth in non-premixed ethylene and ethane flames, Combustion and
Flame 159 (2012) 979–995.
[47] M. Frenklach, H. Wang, Detailed mechanism and modeling of soot particle formation, in:
H. Bockhorn (Ed.), Soot Formation in Combustion, Springer Verlag, 1994.
[48] C. J. Pope, J. B. Howard, Simultaneous particle and molecule modeling (SPAMM): An ap-
proach for combining sectional aerosol equations and elementary gas-phase reactions, Aerosol
Science and Technology 27 (1997) 73–94.
22
[49] A. Khosousi, S. B. Dworkin, Detailed modelling of soot oxidation by O2 and OH in laminar
diffusion flames, Proceedings of the Combustion Institute 35 (2014) 1903–1910.
[50] N. A. Fuchs, The Mechanics of Aerosols, Pergamon Press, Oxford, 1964.
[51] A. D’Alessio, A. C. Barone, R. Cau, A. D’Anna, P. Minutolo, Surface deposition and coag-
ulation efficiency of combustion generated nanoparticles in the size range from 1 to 10 nm,
Proceedings of the Combustion Institute 30 (2005) 2595–2603.
[52] A. D’Anna, J. H. Kent, A model of particulate and species formation applied to laminar,
nonpremixed flames for three aliphatic-hydrocarbon fuels, Combustion and Flame 152 (2008)
573–587.
[53] F. Gelbard, J. H. Seinfeld, Simulation of multicomponent aerosol dynamics, Journal of Colloid
and Interface Science 78 (1980) 485–501.
[54] M. S. Tsurikov, K. P. Geigle, V. Kruger, Y. Schneider-Kuhnle, W. Stricker, R. Luckerath,
R. Hadef, M. Aigner, Laser-based investigation of soot formation in laminar premixed flames
at atmospheric and elevated pressures, Combustion Science and Technology 177 (2005) 1835–
1862.
[55] M. J. Castaldi, N. M. Marinov, C. F. Mellius, J. Huang, S. M. Senkan, W. J. Pitz, C. K.
Westbrook, Experimental and modeling investigation of aromatic and polycyclic aromatic hy-
drocarbon formation in a premixed ethylene flame, Proceedings of the Combustion Institute
26 (1996) 693–702.
[56] H. Bohm, M. Braun-Unkhoff, P. Frank, Investigations on initial soot formation at high pres-
sures, Progress in Computational Fluid Dynamics 3 (2003) 145–150.
[57] A. Di Lorenzo, A. D’Alessio, V. Cincotti, S. Masi, P. Menna, C. Venitozzi, UV absorption, laser
excited fluorescence and direct sampling in the study of the formation of polycyclic aromatic
hydrocarbons in rich CH4/O2 flames, Proceedings of the Combustion Institute 18 (1980) 485–
491.
23
[58] R. Wang, P. Cadman, Soot and PAH production from spray combustion of different hydrocar-
bons behind reflected shock waves, Combustion and Flame 112 (1998) 359–370.
[59] N. E. Sanchez, A. Callejas, A. Millera, R. Bilbao, M. U. Alzueta, Polycyclic aromatic hydrocar-
bon (PAH) and soot formation in the pyrolysis of acetylene and ethylene: effect of the reaction
temperature, Energy & Fuels 26 (2012) 4823–4829.
[60] N. E. Sanchez, A. Callejas, A. Millera, R. Bilbao, M. U. Alzueta, Formation of PAH and soot
during acetylene pyrolysis at different gas residence, Energy 43 (2012) 30–36.
[61] T. G. Benish, PAH radical scavenging in fuel-rich premixed benzene flames, Ph.D. thesis,
Massachusetts Institute of Technology (1999).
[62] J. Griesheimer, K. H. Homann, Large-molecules, radicals, ions, and small soot particles in
fuel-rich hydrocarbon flames, Proceedings of the Combustion Institute 27 (1998) 1753–1759.
[63] F. Xu, P. B. Sunderland, G. M. Faeth, Soot formation in laminar premixed ethylene/air flames
at atmospheric pressure, Combustion and Flame 108 (1997) 471–493.
[64] A. Kazakov, H. Wang, M. Frenklach, Detailed modeling of soot formation in laminar premixed
ethylene flames at a pressure of 10 bar, Combustion and Flame 100 (1995) 111–120.
[65] M. Balthasar, M. Frenklach, Detailed kinetic modeling of soot aggregate formation in laminar
premixed flames, Combustion and Flame 140 (2005) 130–145.
[66] N. A. Eaves, A. Veshkini, C. Riese, Q. Zhang, S. B. Dworkin, M. J. Thomson, A numerical
study of high pressure, laminar, sooting, ethane-air coflow diffusion flames, Combustion and
Flame 159 (2012) 3179–3190.
[67] P. A. Vlasov, J. Warnatz, Detailed kinetic modeling of soot formation in hydrocarbon pyrolysis
behind shock waves, Proceedings of the Combustion Institute 29 (2002) 2335–2341.
[68] P. Deuflhard, M. Wulkow, Computational treatment of polyreaction kinetics by orthogonal
polynomials of a discrete variable, IMPACT of Computing in Science and Engineering 1 (1989)
269–301.
24
[69] S. L. Manzello, D. B. Lenhert, A. Yozgatligil, M. T. Donovan, G. W. Mulholland, M. R.
Zachariah, W. Tsang, Soot particle size distributions in a well stirred reactor/ plug flow reactor,
Proceedings of the Combustion Institute 31 (2007) 675–683.
[70] J. Singh, R. I. A. Patterson, M. Kraft, H. Wang, Numerical simulation and sensitivity analysis
of detailed soot particle size distribution in laminar premixed ethylene flames, Combustion and
Flame 145 (2006) 117–127.
25
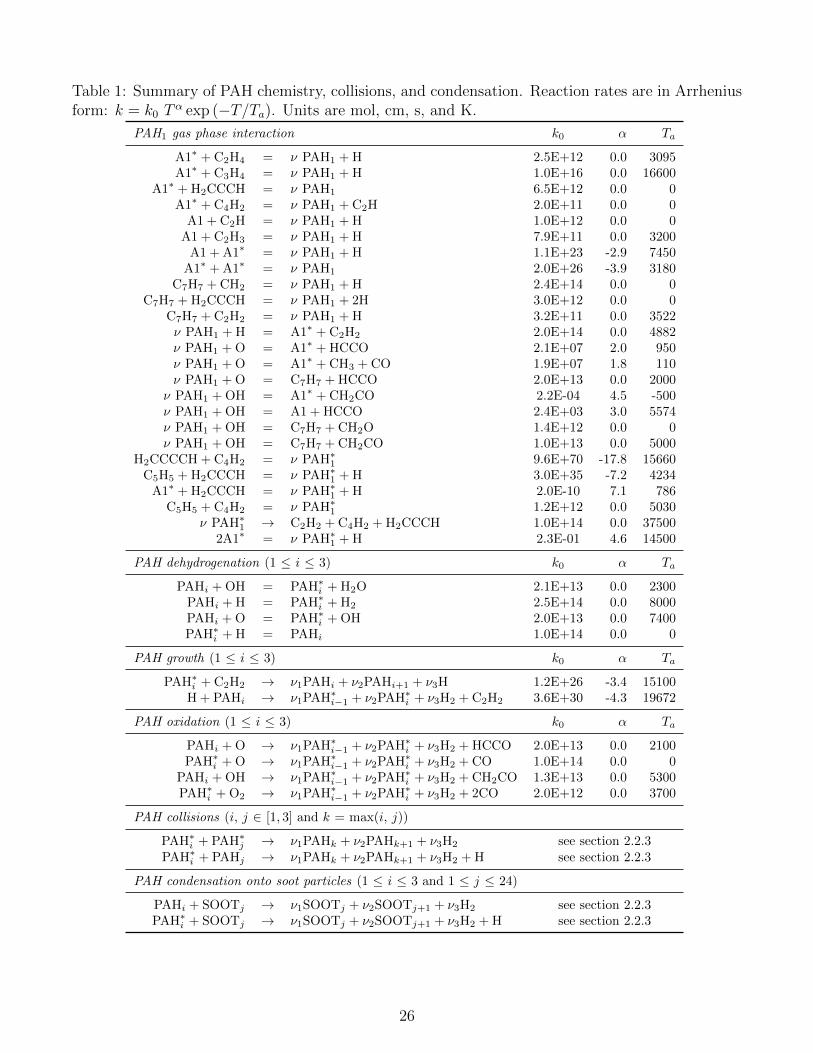
Table 1: Summary of PAH chemistry, collisions, and condensation. Reaction rates are in Arrheniusform: k = k0 T
α exp (−T/Ta). Units are mol, cm, s, and K.
PAH1 gas phase interaction k0 α Ta
A1∗ + C2H4 = ν PAH1 + H 2.5E+12 0.0 3095A1∗ + C3H4 = ν PAH1 + H 1.0E+16 0.0 16600
A1∗ + H2CCCH = ν PAH1 6.5E+12 0.0 0A1∗ + C4H2 = ν PAH1 + C2H 2.0E+11 0.0 0
A1 + C2H = ν PAH1 + H 1.0E+12 0.0 0A1 + C2H3 = ν PAH1 + H 7.9E+11 0.0 3200
A1 + A1∗ = ν PAH1 + H 1.1E+23 -2.9 7450A1∗ + A1∗ = ν PAH1 2.0E+26 -3.9 3180
C7H7 + CH2 = ν PAH1 + H 2.4E+14 0.0 0C7H7 + H2CCCH = ν PAH1 + 2H 3.0E+12 0.0 0
C7H7 + C2H2 = ν PAH1 + H 3.2E+11 0.0 3522ν PAH1 + H = A1∗ + C2H2 2.0E+14 0.0 4882ν PAH1 + O = A1∗ + HCCO 2.1E+07 2.0 950ν PAH1 + O = A1∗ + CH3 + CO 1.9E+07 1.8 110ν PAH1 + O = C7H7 + HCCO 2.0E+13 0.0 2000
ν PAH1 + OH = A1∗ + CH2CO 2.2E-04 4.5 -500ν PAH1 + OH = A1 + HCCO 2.4E+03 3.0 5574ν PAH1 + OH = C7H7 + CH2O 1.4E+12 0.0 0ν PAH1 + OH = C7H7 + CH2CO 1.0E+13 0.0 5000
H2CCCCH + C4H2 = ν PAH∗1 9.6E+70 -17.8 15660
C5H5 + H2CCCH = ν PAH∗1 + H 3.0E+35 -7.2 4234
A1∗ + H2CCCH = ν PAH∗1 + H 2.0E-10 7.1 786
C5H5 + C4H2 = ν PAH∗1 1.2E+12 0.0 5030
ν PAH∗1 → C2H2 + C4H2 + H2CCCH 1.0E+14 0.0 37500
2A1∗ = ν PAH∗1 + H 2.3E-01 4.6 14500
PAH dehydrogenation (1 ≤ i ≤ 3) k0 α Ta
PAHi + OH = PAH∗i + H2O 2.1E+13 0.0 2300
PAHi + H = PAH∗i + H2 2.5E+14 0.0 8000
PAHi + O = PAH∗i + OH 2.0E+13 0.0 7400
PAH∗i + H = PAHi 1.0E+14 0.0 0
PAH growth (1 ≤ i ≤ 3) k0 α Ta
PAH∗i + C2H2 → ν1PAHi + ν2PAHi+1 + ν3H 1.2E+26 -3.4 15100
H + PAHi → ν1PAH∗i−1 + ν2PAH∗
i + ν3H2 + C2H2 3.6E+30 -4.3 19672
PAH oxidation (1 ≤ i ≤ 3) k0 α Ta
PAHi + O → ν1PAH∗i−1 + ν2PAH∗
i + ν3H2 + HCCO 2.0E+13 0.0 2100PAH∗
i + O → ν1PAH∗i−1 + ν2PAH∗
i + ν3H2 + CO 1.0E+14 0.0 0PAHi + OH → ν1PAH∗
i−1 + ν2PAH∗i + ν3H2 + CH2CO 1.3E+13 0.0 5300
PAH∗i + O2 → ν1PAH∗
i−1 + ν2PAH∗i + ν3H2 + 2CO 2.0E+12 0.0 3700
PAH collisions (i, j ∈ [1, 3] and k = max(i, j))
PAH∗i + PAH∗
j → ν1PAHk + ν2PAHk+1 + ν3H2 see section 2.2.3PAH∗
i + PAHj → ν1PAHk + ν2PAHk+1 + ν3H2 + H see section 2.2.3
PAH condensation onto soot particles (1 ≤ i ≤ 3 and 1 ≤ j ≤ 24)
PAHi + SOOTj → ν1SOOTj + ν2SOOTj+1 + ν3H2 see section 2.2.3PAH∗
i + SOOTj → ν1SOOTj + ν2SOOTj+1 + ν3H2 + H see section 2.2.3
26
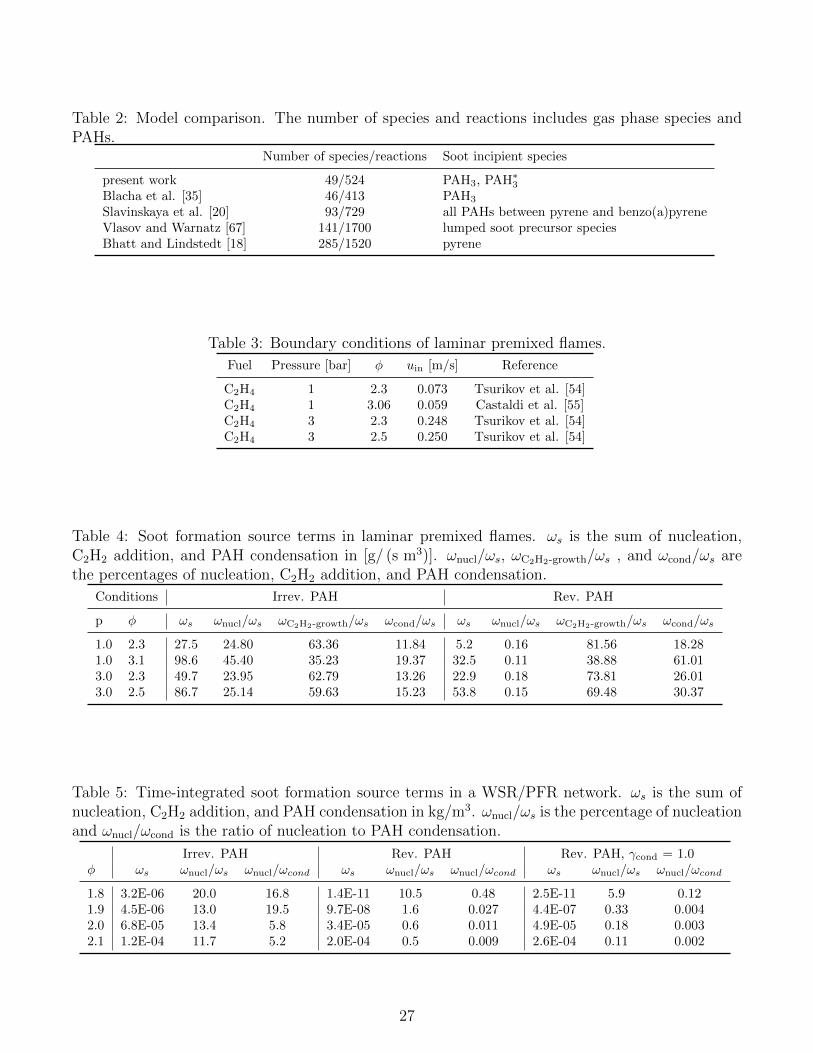
Table 2: Model comparison. The number of species and reactions includes gas phase species andPAHs.
Number of species/reactions Soot incipient species
present work 49/524 PAH3, PAH∗3
Blacha et al. [35] 46/413 PAH3
Slavinskaya et al. [20] 93/729 all PAHs between pyrene and benzo(a)pyreneVlasov and Warnatz [67] 141/1700 lumped soot precursor speciesBhatt and Lindstedt [18] 285/1520 pyrene
Table 3: Boundary conditions of laminar premixed flames.
Fuel Pressure [bar] φ uin [m/s] Reference
C2H4 1 2.3 0.073 Tsurikov et al. [54]C2H4 1 3.06 0.059 Castaldi et al. [55]C2H4 3 2.3 0.248 Tsurikov et al. [54]C2H4 3 2.5 0.250 Tsurikov et al. [54]
Table 4: Soot formation source terms in laminar premixed flames. ωs is the sum of nucleation,C2H2 addition, and PAH condensation in [g/ (s m3)]. ωnucl/ωs, ωC2H2-growth/ωs , and ωcond/ωs arethe percentages of nucleation, C2H2 addition, and PAH condensation.
Conditions Irrev. PAH Rev. PAH
p φ ωs ωnucl/ωs ωC2H2-growth/ωs ωcond/ωs ωs ωnucl/ωs ωC2H2-growth/ωs ωcond/ωs
1.0 2.3 27.5 24.80 63.36 11.84 5.2 0.16 81.56 18.281.0 3.1 98.6 45.40 35.23 19.37 32.5 0.11 38.88 61.013.0 2.3 49.7 23.95 62.79 13.26 22.9 0.18 73.81 26.013.0 2.5 86.7 25.14 59.63 15.23 53.8 0.15 69.48 30.37
Table 5: Time-integrated soot formation source terms in a WSR/PFR network. ωs is the sum ofnucleation, C2H2 addition, and PAH condensation in kg/m3. ωnucl/ωs is the percentage of nucleationand ωnucl/ωcond is the ratio of nucleation to PAH condensation.
Irrev. PAH Rev. PAH Rev. PAH, γcond = 1.0φ ωs ωnucl/ωs ωnucl/ωcond ωs ωnucl/ωs ωnucl/ωcond ωs ωnucl/ωs ωnucl/ωcond
1.8 3.2E-06 20.0 16.8 1.4E-11 10.5 0.48 2.5E-11 5.9 0.121.9 4.5E-06 13.0 19.5 9.7E-08 1.6 0.027 4.4E-07 0.33 0.0042.0 6.8E-05 13.4 5.8 3.4E-05 0.6 0.011 4.9E-05 0.18 0.0032.1 1.2E-04 11.7 5.2 2.0E-04 0.5 0.009 2.6E-04 0.11 0.002
27
100 200 400
gas phase PAH1 PAH2
800 1600 3200 1.34·1010
M [g/mol]
PAH3 SOOT1 SOOT2 SOOT25
2.68·1010 PAH*
1 PAH*2 PAH*
3
Figure 1: Definition of the PAH, PAH∗, and soot sections.
0.0e+00
5.0e+05
1.0e+06
1.5e+06
2.0e+06
500 1000 1500 2000 2500 3000
enth
alpy
[J/
mol
]
temperature [K]
A4*A4
Figure 2: Specific enthalpy of pyrene (A4) and the pyrene radical (A4∗).
0
0.05
0.1
0.15
0.2
0.25
0.3
0 2 4 6 8 10 12
mol
e fr
actio
n [-
]
height above burner [mm]
CO2CO
C2H4
0
0.05
0.1
0.15
0.2
0 2 4 6 8 10 12
mol
e fr
actio
n [-
]
height above burner [mm]
H2OH2
CH4
Figure 3: Calculated and measured profiles of selected major species in an atmospheric laminarpremixed C2H4 flame [55]. Open symbols are measurements [55] and lines are simulations using thereversible PAH model.
28
0e+00
2e-02
4e-02
6e-02
8e-02
1e-01
0 2 4 6 8 10 12
C2H
2 m
ole
frac
tion
[-]
height above burner [mm]
experimentirreversible PAH model
reversible PAH model
0e+00
2e-04
4e-04
6e-04
8e-04
1e-03
0 2 4 6 8 10 12
A1
mol
e fr
actio
n [-
]
height above burner [mm]
0e+00
2e-05
4e-05
6e-05
8e-05
1e-04
0 2 4 6 8 10 12
C7H
8 m
ole
frac
tion
[-]
height above burner [mm]
1e-07
1e-06
1e-05
1e-04
1e-03
0 2 4 6 8 10 12
PAH
1 m
ole
frac
tion
[-]
height above burner [mm]
Figure 4: Predicted and measured profiles of species mole fractions in an atmospheric laminarpremixed C2H4 flame [55].
29
0
1
2
3
0 5 10 15 20 25 30
soot
vol
ume
frac
tion
[ppm
]
height above burner [mm]
p = 1 bar, φ = 2.3experiment
irreversible PAH modelreversible PAH model
Slavinskaya et al.
0
1
2
3
0 2 4 6 8 10 12
soot
vol
ume
frac
tion
[ppm
]
height above burner [mm]
p = 1 bar, φ = 3.1
0
1
2
3
4
5
6
7
0 5 10 15 20 25 30
soot
vol
ume
frac
tion
[ppm
]
height above burner [mm]
p = 3 bar, φ = 2.3
0
1
2
3
4
5
6
7
0 5 10 15 20 25 30
soot
vol
ume
frac
tion
[ppm
]
height above burner [mm]
p = 3 bar, φ = 2.5
Figure 5: Measured and predicted soot volume fractions in laminar premixed ethylene flames.Points are measurements and error bars denote a measurement uncertainty of ± 30 % [54]. Solidlines correspond to the reversible PAH model and dashed lines to an irreversible PAH model [35].Dash-dot lines are numerical results from [20].
30
0.0e+00
2.5e−08
5.0e−08
0 2 4 6 8 10
mas
s fr
actio
n [−
]
height above burner [mm]
reversible PAH modelPAH1*PAH2*PAH3*
0.0e+00
1.0e−05
2.0e−05
mas
s fr
actio
n [−
] reversible PAH modelPAH1
5 x PAH25 x PAH3
15 x SOOT1
0.0e+00
1.0e−05
2.0e−05
mas
s fr
actio
n [−
] irreversible PAH modelPAH1PAH2PAH3
SOOT1
Figure 6: Predicted mass fractions of PAHs, PAH radicals and SOOT1 in a laminar premixedethylene flame at p = 1 bar and φ = 2.3 [54]. Top panel: Irreversible PAH model [35]. Middle andbottom panels: Reversible PAH model.
0
0.2
0.4
0.6
0.8
1
1600 1800 2000 2200 2400 2600
soot
yie
ld [
-]
temperature [K]
4.0 mol/m3
experimentirrev. PAH model
rev. PAH model2xC2H2 addition
Vlasov et al.
0
0.2
0.4
0.6
0.8
1
1600 1800 2000 2200 2400 2600
soot
yie
ld [
-]
temperature [K]
4.7 mol/m3
0
0.2
0.4
0.6
0.8
1
1600 1800 2000 2200 2400 2600
soot
yie
ld [
-]
temperature [K]
7.4 mol/m3
Figure 7: Measured and predicted soot yields in C2H4 pyrolysis after reflected shock waves fordifferent carbon concentrations (4.0, 4.7, and 7.4 mol/m3 carbon atoms in argon). Points aremeasurements from [67]. Solid and dotted lines correspond to the reversible PAH model. In thelatter case the rate of surface growth by C2H2 addition was scaled by a factor of two. Dashed linescorrespond to an irreversible PAH model [35] and dash-dot lines are numerical results from Vlasovand Warnatz [67].
31
0.0e+00
5.0e-03
1.0e-02
1.5e-02
2.0e-02
1.8 1.9 2 2.1 2.2
acet
ylen
e m
ole
frac
tion
[-]
equivalence ratio [-]
experimentreversible PAH model
0e+00
1e-04
2e-04
3e-04
1.8 1.9 2 2.1 2.2
benz
ene
mol
e fr
actio
n [-
]
equivalence ratio [-]
10-7
10-6
10-5
10-4
1.8 1.9 2 2.1 2.2
PAH
1 m
ole
frac
tion
[-]
equivalence ratio [-]
Figure 8: Predicted and measured species mole fractions in a PFR at different equivalence ratios.Lines are predictions using the reversible PAH model and open symbols are measurements fromManzello et al. [69].
1010
1012
1014
1016
1018
1 10 100
ds [nm]
φ = 2.0
dN /
d(ln
ds)
[1/
m3 ]
1 10 100
φ = 2.1
1010
1012
1014
1016
1018
φ = 1.8 φ = 1.9
irreversible PAH modelreversible PAH model
γcond. = 1.0Bhatt et al.
Figure 9: Measured and predicted soot PSD functions in a PFR at different equivalence ratios.Points are experimental data from Manzello et al. [69]. Solid and dotted lines correspond to thereversible PAH model. In the latter case the collision efficiency for PAH condensation was set to1.0. Dashed lines correspond to an irreversible PAH model [35] and dash-dot lines are numericalresults from Bhatt and Lindstedt [18].
32
0
10
20
30
40
50
1.8 1.9 2 2.1
mea
n pa
rtic
le d
iam
eter
[nm
]
equivalence ratio [-]
experimentirreversible PAH model
reversible PAH modelγcond. = 1.0
1011
1012
1013
1014
1015
1016
1017
1.8 1.9 2 2.1pa
rtic
le n
umbe
r de
nsity
[m
-3]
equivalence ratio [-]
10-8
10-6
10-4
10-2
100
1.8 1.9 2 2.1
f v [
ppm
]
equivalence ratio [-]
Figure 10: Predicted and measured soot properties in a PFR at different equivalence ratios. Pointsdenote experimental data which was obtained by integrating measured PSD functions from Manzelloet al. [69]. Solid and dotted lines correspond to the reversible PAH model. In the latter case thecollision efficiency for PAH condensation was set to 1.0. Dashed lines correspond to an irreversiblePAH model [35].
0
10
20
30
40
50
1.8 1.9 2
mea
n pa
rtic
le d
iam
eter
[nm
]
equivalence ratio [-]
experimentirreversible PAH model
0.5 x PAH growth0.1 x PAH growth
10111012101310141015101610171018
1.8 1.9 2
part
icle
num
ber
dens
ity [
m-3
]
equivalence ratio [-]
10-8
10-6
10-4
10-2
100
1.8 1.9 2
f v [
ppm
]
equivalence ratio [-]
Figure 11: Predicted and measured soot properties in a PFR at different equivalence ratios. Pointsdenote experimental data from Manzello et al. [69]. Lines correspond predictions using an ir-reversible PAH model [35]. In case of the dotted and dash-dotted lines, the efficiency of PAHcollisions and the rate of C2H2 addition were scaled by the factors 0.5 and 0.1.
33


![AIGNER ARCHIVE IMAGE SHEET - Yale University Art Gallery · IMAGE SHEET. 3 AIGNER ARCHIVE IMAGE CAPTIONS [01] Lucien Aigner, Mussolini at Stresa, 1935. Gelatin silver print, 13 ×](https://img.pdfslide.us/doc/110x75/5f4192f8660186021b5598e8/aigner-archive-image-sheet-yale-university-art-gallery-image-sheet-3-aigner-archive.jpg)


![[Aigner] Handbook of Econometrics. Latent Variable](https://img.pdfslide.us/doc/110x75/577c77a91a28abe0548cfe87/aigner-handbook-of-econometrics-latent-variable.jpg)