Embed Size (px)
Citation preview

This is the author’s version of a work that was submitted/accepted for pub-lication in the following source:
Jumat, Abdul R., Coffey, Vaughan, & Skitmore, Martin(2012)Stakeholder service delivery expectations of military facilities manage-ment.Built Environment Project and Asset Management, 2(2), pp. 142-146.
This file was downloaded from: https://eprints.qut.edu.au/55063/
c© Copyright 2012 Emerald Group
Notice: Changes introduced as a result of publishing processes such ascopy-editing and formatting may not be reflected in this document. For adefinitive version of this work, please refer to the published source:
https://doi.org/10.1108/20441241211280891
1
Stakeholder service delivery expectations of military facilities management
1. Abstract Purpose – The paper examines the quality of service of a South East Asian country’s military facilities management organisation. Design/methodology/approach – An interview survey and questionnaire survey were used to obtain a description and summary of stakeholders’ expectations and the extent to which they were being satisfied by the services provided. Findings – The method provides a useful means of identifying and prioritising varying expectations between stakeholder groups and of indicating any mismatch in expectations in the management of military facilities. Social implications – The development and use of a method to test and improve the effectiveness and efficiency of the management of military facilities helps in providing better value for money. Originality/value - In addition to re-affirming Parasuraman’s overall dimensions of service expectation, the empirical summary of the stakeholders’ expectations obtained in this way is of practical value for the service provider in developing a strategy for expectation management. For the case studied, it is also apparent that although the current processes in service delivery are well understood by all involved stakeholders, there is a need for further improvement with regards to their expectation levels. It is also one of the very few reported studies on the management of military facilities. Keywords expectation, facilities management, service delivery, service quality. 1. Introduction Customers actively participate in creating service needs and in ensuring their own satisfaction (Bitner et al 1997). They define the quality of services provided (Zumbehl and Mayo 1994), and therefore, it is only by carefully identifying users [end-users] and their needs that an effective system can be established to deliver and monitor these services(Alexander 1992).
Service quality is an antecedent of service satisfaction and both are affected by customer expectations and perceptions (De Ruyter et al, 1997). When a discrepancy develops between the expected service quality and the actual service quality as received by the customer, it is termed a ‘gap’. Gaps appear due to the customer’s perception and comparison of expectation and performance. Parasuraman et al’s (1985) service quality model (gap model), indicates that consumers’ quality perceptions are influenced by five such gaps:
Gap 1 – Consumer expectations and management’s perception of these specifications.
Gap 2 – Management's perception of consumers’ expectations and service quality specifications.
Gap 3- Quality specifications and the actual service delivered.
Gap 4 – Delivery and communication regarding the service to consumers.

2
Gap 5 is the perceived service quality, or the difference between customer expectation and perception. This is in turn depends on the size and direction of the four gaps associated with the provision of service quality.
Zeithaml et al’s (1988) extended model of service quality provides the theoretical construct involved in closing each gap in service quality and thus achieving better service results in terms of five customer service expectations; tangibles, reliability, responsiveness, assurance and empathy (Parasuraman et al, 1991). Zeithaml et al’s (1993) later and more complex conceptual model of service quality and satisfaction includes their relationship, in which the distinction between the two is indistinguishable and both service variables and level factors are common.
Stakeholder expectations are therefore critically important in reducing the difference between actual and perceived expectations – identified as Gap 1 in Parasuraman et al’s (1985) service quality model. Furthermore, knowing that expectations are an antecedent to their management (Pennanen et al, 2005) is believed to lead to better service delivery.
In this paper, we examine the quality of service of a South East Asian country’s military facilities management organisation. Stakeholders include the general public, as well as officers from within the ministry and other government agencies. Here, the following stakeholders are identified; End-users, Commanders and Representatives, Maintenance and Works Services Section (MWSS) Management, and MWSS Supervising Officer (S.O. - the major players in relation to service delivery within Ministry of Defence (MinDef) facilities management). The roles of each stakeholder in service delivery can be summarised as:
1. End-users have “a duty of care” for the facilities being used by them and the majority of maintenance work requests are initiated by them1. They are also the receivers, or consumers, of the services provided.
2. The relevant Commander of each military camp is responsible for the MinDef’s facilities management work requests.2 Relevant units (Housing or Unit Administration Officer/Barrack Officer or G4) in the camps assist the Commander and are in turn responsible for processing service requests in terms of administration management
3. MWSS managers are responsible for the overall management of the implementation of the MinDef’s facilities management work and also control the facilities management work processes.
4. MWSS supervising officers are responsible for supervising and managing the MinDef’s facilities work in their respective areas of control.
5. Relevant contractors are employed to carry out the MinDef’s facilities management work as instructed by MWSS.
1
In most cases, the end-users initiate the maintenance work request, except for planned maintenance work and work made necessary due to technical requirements. 2 This is since the year 2005; prior to this, the financing was the responsibility of Maintenance and Work Services Section, Directorate of Development and Work Services, MinDef. The exception being for planned maintenance work where the budget has been requested separately under DDWS.

3
Generally in the MinDef, everybody is involved in the up-keep and maintenance of their own as well as the common parts of the estate. In addition, the stakeholders are regarded as customers. Therefore, in order for customers to be fully satisfied, the process of requesting and implementing facilities management work demands excellent delivery of service from the departments/units/agencies involved.
However, Zumbehl and Mayo’s (1994) definition of customer perception of quality may differ significantly from the view of quality laid-down in the various technical standards adopted by the Directorate of Development and Work Services3 (DDWS) through its MWSS – those responsible for implementing facilities management accordingly. This paper, therefore, seeks to understand the stakeholders’ expectations of the MinDef’s facilities management in terms of the difference between actual and the service provider’s perceived expectations.
2. Literature review 2.1 Facilities Management Facilities Management (FM) is the integration and alignment of non-core services, including those relating to premises, required to operate and maintain a business (Pitt and Tucker, 2008: 241-254). They can be characterised in terms of its technical, economic, strategic, social, service or professional functions (Grimshaw 2003: 50). For effective implementation, FM is said to need: meaning (a plausible, well-grounded definition, actionable and easy to apply); management (clear guidelines for practice, filled with operational advice rather than high aspirations); and measurement (better tools for assessing an organisation’s rate and level of improvement to ensure that gains have been made) (Alexander 2003: 274). It also needs to be positioned as a cross-disciplinary activity and enable the application of generic management skills across boundaries (Alexander 2003). In addition, facilities managers are required to consider the business implications of their actions before developing maintenance programmes, and provide feedback mechanisms to monitor the impact of any actions taken against key business drivers (Jones and Sharp 2007).
Four key processes are involved – customer-relationship management, estate-related and facilities management planning, service and organisational development and service delivery (Atkin and Brooks 2000). For facilities managers, this means managing customers, managing assets and managing services (Alexander 2003). Facilities managers also need to identify the process by which an organisation delivers and sustains a quality operation environment and the services required to meet strategic needs at best cost (Alexander 2003). 2.2 Service delivery Service is an economic activity that creates value and provides benefits for customers at specific times and places by bringing about a desired change in, or on behalf of, the recipients of the service. Service delivery indicates ‘where’, ‘when’ and ‘how’ the service product is delivered to the customer (Lovelock and Wirtz, 2004). The service delivery process can be broken down into service encounters that comprise the main part of the whole process (Danaher and Mattsson, 1994) and, as noted by Chowdhary and Prakash (2007), some generalisation within service types is possible for different services and service providers, and managers may have to consider this in its design.
3 DDWS's mission is “Managing Ministry of Defence Estate”.

4
2.3 Service quality In terms of the service provider, service quality is related to productivity, in that improving service quality and boosting productivity are in conflict (Parasuraman 2002). Likewise, for profit and price, there are positive and negative relationships between service quality and profit (Zeithaml, 2000), and service quality and price (Monroe, 1973). Service quality improvements are also concerned with personnel, which is at odds with the manufacturing sector where improvements are largely related to robust and effective processes (Lagrosen and Lagrosen, 2003). Mersha and Adlakha (1992) have also suggested that most customers would be willing to trade convenience for cost reductions. These relationships thus need to be moderated through marketing and management variables (Zeithaml, 2000). Employee empowerment, information and communication, customer focus, and continuous improvements all have a significant effect on service quality (Zeithaml et al, 1988; Samat et al, 2006). However, as Parasuraman (2002) points out, the customer perspective is the most important aspect for service providers when examining productivity.
To manage this, Dedeke (2003, p276) maintains that “service quality is ... dependent on the composite result that a service provider and its systems offer a customer”; termed the ‘fulfilment-oriented construct’. This leads to the view that, to maximize investments in service improvements, there should be a focus on increasing service quality beyond the adequate level rather than seeking to develop a customer franchise, by creating “delight” (Yap and Sweeney 2007). To do this involves ample communication around the level of service between the service provider and the customer, resources to be committed and definition of action and time taken achieved (Burke 2006). In addition, assurance, responsiveness and empathy are the quality factors that have the most significant effects on overall service quality (Cavana et al 2007); more sophisticated employee management practices (Brown and Maxwell 2002); the management of customer-to-staff, customer-to-technology, and customer-to-product/services (Dedeke 2003): and management of changing stakeholder expectations (Bruke (2006, p17; Pennanen et al, 2005). Customer satisfaction is determined by the interplay between four antecedents: are expectations, experience, participation and perceptions,enabling customers to be clustered into distinct expectation and experience (Zeithaml et al., 1996; Bhandari et al., 2007; Berry et al., 1990), participation (Bitner et al., 1997) or response styles (Singh, 1990). For example, customer complaints may be driven by expectations as well as their actual experiences (Forbes, 2008). Similarly, internal and external sources of information, values, involvement and the need for cognition, influence “should” and “will” expectations differently (Kalamas et al, 2002). The perception of acceptable performance, on the other hand, varies according to service dimensions and customers acquired experience, even though perceptions of what a service provider should offer remain relatively stable (Walker and Baker 2000). Service quality expectations (Kueh and Voon, 2007) and responses to service quality (Liu et al., 2001) also vary across the dimensions. In connection with this is the ‘Zone of Tolerance’, representing the range of service performance that a customer considers satisfactory, and which recognizes multiple expectation standards (Yap and Sweeney, 2007). Customers therefore become dissatisfied with service quality because they are outside of their normal tolerance zone (Forbes, 2008; Zeithaml et al, 1993). Measuring customer expectations thus becomes highly important, as does incorporating outputs into service design to ensure correct customer focus on the service provided (Schofield and Breen, 2006).
Consumers of services have expectations about what they will receive from the delivery system (Coye 2004, p54). Licata et al. (2008, p178) have amalgamated several definitions to state that customer expectations are defined as guidelines for product evaluations (Cardozo, 1965), predictions of what will be received (Woodruff et al., 1983), standards for a specific brand evaluation (Cadotte et al., 1987), or standards for comparison to a subsequent purchase
5
experience (Zeithaml et al., 1993). Customer expectations exist on multiple levels (Boulding et al, 1993, Licata et al, 2008; Zeithaml et al, 1993; Teas, 1993, Oliver and Winer,1987; Licata et al 2008) and depend on a variety of factors, such as the definition of the level of service being provided (Burke 2006) and the business involved (Lovelock and Wirtz, 2004). The degree of influence changes with time and service purchase experience (Licata et al. 2008). There is also a relationship between the dimensions of culture and service quality that is viewed from the perspective of expectation (Liu et al., 2001; Tsoukatos and Rand, 2007). Furthermore, Coye (2004) has developed a model of service delivery expectations and interventions.
In addition to expectations, customer perceptions depend to some extent on culture, (Donthu and Yoo, 1998; Furrer et al., 2000). Service performance perceptions, filtered through the lens of culture (Liu et al., 2001), have been found to directly affect perceived service quality and satisfaction (Halstead et al., 1994). Also, failure to clearly define the level of service to be delivered by the provider means that customers manage their own expectations of the service provider, who will then be judged against the best service experiences the customer has experienced. When this occurs, service providers usually fall short of expectations (Burke, 2006). As a result, therefore, it has been suggested that service providers should take steps to increase customers’ self efficacy so as to improve their abilities to participate in, and respond to, service (McKee et al. 2006). 3. Research problem and hypotheses Demand for the MinDef’s facilities management work is increasing as existing real estate grows older and new real estate is being developed. This is further compounded by ever-increasing stakeholders’ knowledge and demands, as well as by the MinDef’s actual delivery capability and the increasing requirement for the use of Druckman’s (2004) new ‘soft skills’4 in delivering facilities management services.
There have been some recent changes in budgetary control procedures making the relevant Commander in each military base responsible for financing facilities management work and this has brought about different expectations in service delivery. The demands for MWSS to perform better have increased significantly due to there now being a clear responsibility focus and it is these demands that have given rise to changed expectations.
New processes have been developed by amending the previous system and provide a framework for the implementation of all facilities management work. However the details of work operations are developed between each MWSS estate manager and the Commander of each particular camp.
Although the new framework has been in operation for nearly five years, there are apparently still problems with its overall operation. Also, the role of MWSS has been, and will continue to be, changed to suit rising demands for excellence in all of the MinDef’s facilities management work. The biggest challenge therefore is in adequately responding to these rising demands and expectations of the various stakeholders involved.
Handling requests for facilities management work may differ between various stakeholders and there are several influencing factors involved, which in turn give rise to differing expectations from stakeholders' concerning the actual facilities management work that is being carried out. The major aims of this research were therefore:
4 'Soft skills' is a sociological term relating to a person's EQ (Emotional Intelligence Quotient), the cluster of personality traits, social graces, communication, personal habits, interpersonal skills and optimism that characterize relationships with other people.

6
to evaluate such expectations and develop a model for improving service delivery operations;
to ascertain whether the expectations of service delivery within the MinDef’s facilities management organisation accord with the views of the stakeholders under study.
From these aims, three hypotheses were proposed: 1. Hypothesis H1: There are disparities in stakeholders’ expectations of the service
delivery of facilities management work,
2. Hypothesis H2: Stakeholders’ expectations have not been catered for in the processes currently operated by the MinDef facilities management organisation: and,
3. Hypothesis H3: One stakeholder’s expectation of another stakeholder’s performance in facilities management or maintenance is higher than the actual level of performance.
4. Method 3.1 Data collection A questionnaire survey and informal interviews were carried out in early 2008 (Appendix 1 and 2). The survey questionnaires were provided to selected stakeholders. Almost all the MWSS SOs and management were involved, primarily because the MWSS plays a major role in the MinDef’s facilities management.
Interviews were conducted with randomly selected respondents from each group of stakeholders. The interviews were informal and conducted on a one-to-one basis, with questions focused on determining and probing the respondents’ expectations and general views on the MinDef’s facilities management. Stakeholder opinions on issues highlighted by other stakeholders were also obtained. 3.2 Questionnaire A pilot test was conducted in early January 2008 and feedback was obtained from a small group of participants. The test group was selected based on their preparedness to spend time and willingness to contribute to answering the questionnaire, giving feedback and providing interviews. Some improvement was made to the survey questionnaire accordingly based on the feedback and the discussions. The survey returns were compiled according to the stakeholders’ groupings (Figure 1).
The expectations variables are based on experience and match the overall dimensions of the service expectations categorised by Parasuraman et al. (1991), i.e., reliability, tangibles, responsiveness, assurance, and empathy. 3.3 Interviews The discussions and feedback gained from the pilot survey stage helped to structure the informal interviews, which were primarily based on the general questions contained in the survey. Other probing questions were asked as needed to obtain further clarification on the answers given in the survey. Furthermore, the interviewees were also given an opportunity to

7
respond to some of the issues highlighted by other stakeholders, as a result of earlier interviews.
The informal interviews were conducted on a one-to-one basis in a friendly and informal manner. Through this means, interviewees were made comfortable and encouraged to talk freely about their opinions. The interviewees were not placed under any pressure to provide information that they did not want to talk about and the time taken was purely dictated by how much the interviewees were able to allocate to the task.
The interviewees were selected from the stakeholders; Commanders, MWSS Management, MWSS SOs, end-users and contractors, based on their roles in the MinDef’s facilities management (Figure 2).
5. Results During the survey stage, 200 questionnaires were administered and a response rate of 32% was obtained. All responses were generally useable although there was some apparent confusion amongst a few participants when completing the survey. The responses to one question on the expectations of other stakeholders received were unusable, with most participants either refusing to answer or providing a significantly inflated rating. This issue subsequently became more apparent in discussions with participants after the return of the questionnaires.
The input and cooperation from the interviewees was also very encouraging. The interviews appear to support empirical results of the survey by providing an overview of the respective stakeholder groups concerning their perspectives of the MinDef’s facilities management. Therefore, except for the ‘fulfilling of expectations by other stakeholders’ issue, there is a general congruence between the results of the survey and informal interviews. 4.1 Subjects Survey respondents came mainly from the MWSS HQ and Camp offices, at the SO and management level. There was no gender selection in the survey. A limited number of returns were obtained from other stakeholders. This is partially due to the original selection of the population and direction of the research, where the majority of perspectives needed were from the providers of services concerning the fulfilment of other stakeholders needs.
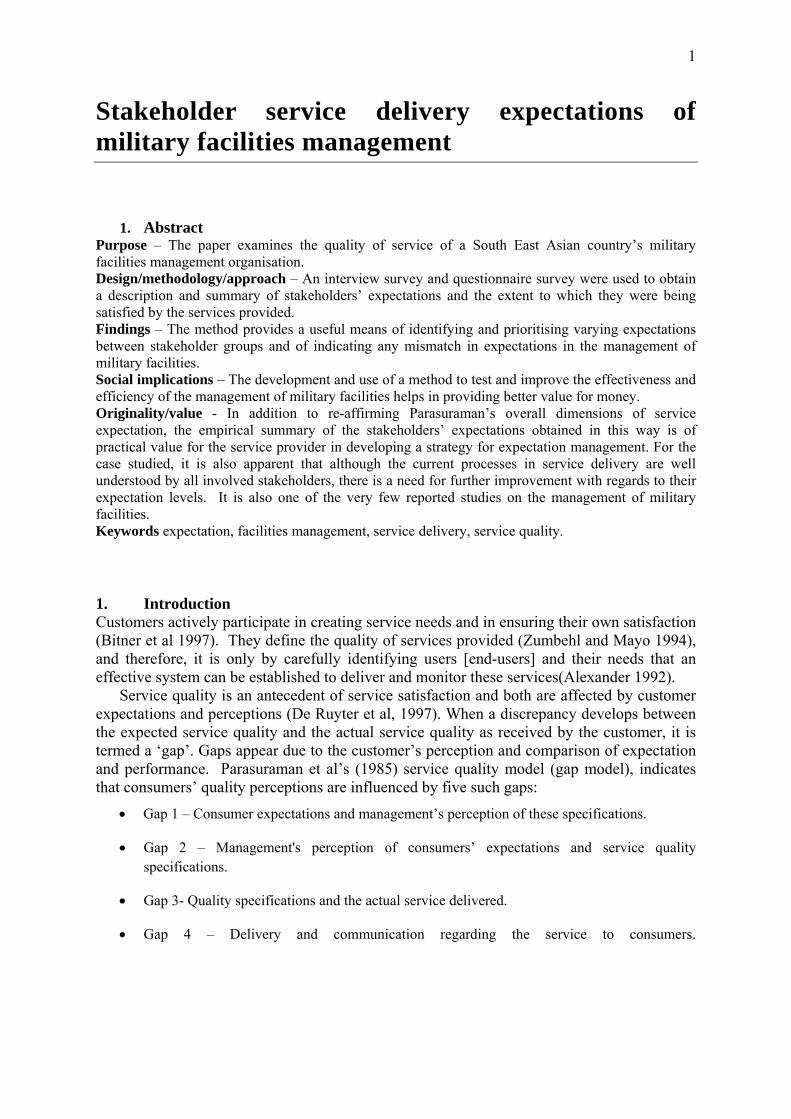
The interviewees were selected from opposite extremes of the power spectrum, from the most important and powerful stakeholders involved, notably Commanders in the camps, to the contractors who carry out the work. MWSS management, SOs and end-users were also randomly selected. 4.2 Expectations of the service delivery of maintenance work Table 1 summarises the ranked expectations of the five stakeholder groups in terms of the 17 variables involved (question 3). Overall, swiftness and computerisation are the two most important expectations, although quite a wide variety of views exists among the stakeholder groups. All 17 variables were selected by at least one stakeholder (see Figure 3), with two being shared by all stakeholders, three unique to particular stakeholders (MWSS SO, Contractor and Commander) and with the remaining 12 being shared between at least 2 to 4 stakeholders.
As Figure 4 indicates, the Commander group has the greatest number of shared variables, followed by the end-users, MWSS management, MWSS SOs and finally, the Contractors.

8
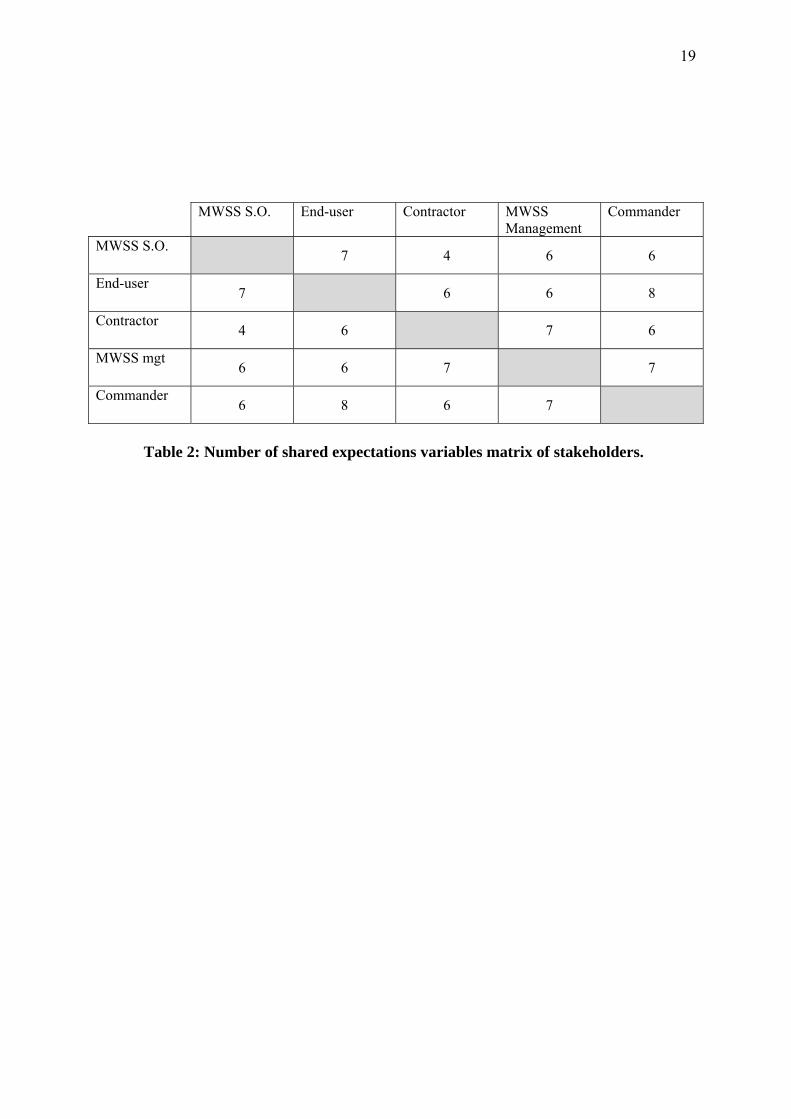
The number of shared variables is also shown in matrix form in Table 2 Table 2. This indicates that the Commander and end-user groups share the highest
number (8) of variables and with the lowest (4) being shared by the MWSS SOs and Contractors. Comparing the variables for each stakeholder, the MWSS Management share seven (7) variables with Commander and Contractor groups, and share six (6) variables with MWSS SOs and End-users. The MWSS SOs share seven (7) expectation variables with end-users, six (6) with MWSS Management and Commanders, and four (4) with the Contractors. 4.3 Areas for improvement Table 3 summarises the mean responses to question 12 “In terms of the process of requesting and implementing the maintenance work, please give your level of priority for MWSS to improve further” for the six processes identified. Overall, the ratings are high, which indicates that improvement of the identified processes is viewed as a priority by the stakeholders. As can be seen, MWSS’s role and maintenance work supervision processes are the top two priorities involved.
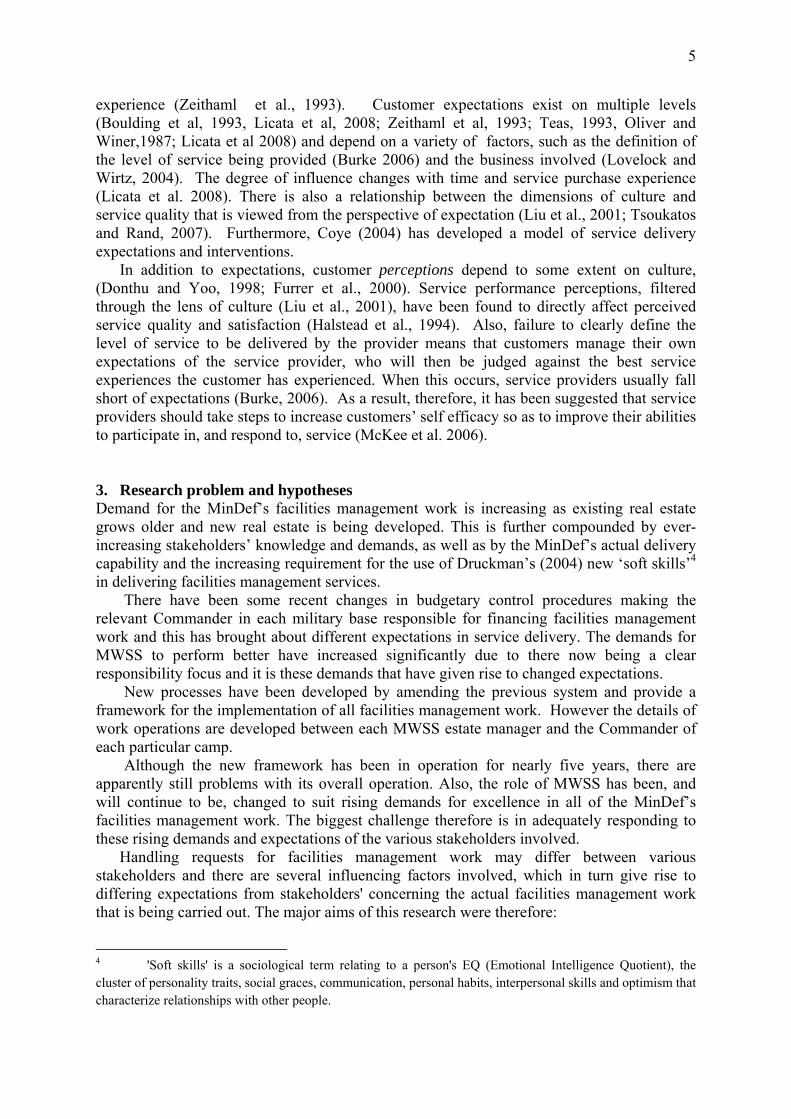
Table 4 provides the mean levels of existing processes as perceived by the groups (question 2) ranked by overall mean level. These are also generally high. 4.4 Stakeholder’s expectations Figure 4 shows the extent to which each stakeholder is fulfilling the expectations of the others (question 4). Most respondents (84%) answered the question, while others either did not answer the question at all or omitted some part. It also became apparent in the discussions held following the survey that the ratings given were inflated to some extent. The pattern of fulfilment of stakeholders’ expectations can be seen in Figure 5. Overall, however, it is clear that the expectations of Contractors are not being met by the others, while the MWSS feel that they fulfil the expectations of other stakeholders – a view not shared by other stakeholders themselves.
The fulfilment of expectations by other stakeholders, between 60% - 80%, is relatively high. An exception is the Commander’s expectation fulfilment by the MWSS SOs (50%) and Contractor expectation fulfilment by the End-users (55%) and Contractors themselves (55%).
A common theme arising from the informal interviews is that of the interviewee anticipation of the others ‘should’ expectation. This ‘should’ expectation is repeated amongst all stakeholders relative to the others. This is also supported by responses to questionnaire question number 13, where the points highlighted do represent the belief of the ‘should’ expectation, which is a higher level of expectation, i.e., desired expectation. 6. Discussion Hypothesis H1: There are disparities in the expectations of the parties involved in the service delivery of maintenance work. There is a ‘shortfall’ in the expectations of service providers (MWSS Management, MWSS SOs and Contractors) and the procurers/consumers of services (Commander and End-users), with three ‘shortfalls’ for service providers and one for each procurer/consumer. This suggests that service providers need to re-align themselves better with their recipients in order to provide ‘exceptional’ service delivery.
The research also found that expectation ‘miss-out’ among the service providers was highest between the MWSS SO and Contractors. This is not a favourable situation in the

9
service-quality improvement effort and indicates that more effort is needed by MWSS to re-align with service providers’ expectations – an issue emphasised by Henry (1994) who has noted the importance of service employees in the success of an organisation’s service delivery. Hypothesis H2: These expectations have not been catered for in the process. Each stakeholder group has a similar, and relatively high, understanding of current processes. However, as Table 4 Table shows, the need for improvement in the current process (question 2d) is also high (80%). In responding to survey question 2e, the stakeholders state that processing time is too lengthy (68%), indicating that stakeholders’ expectations are yet to be met by current processes.
Overall, the stakeholders are generally happy with the service being provided in terms of maintenance work requests and implementation, as indicated in question 2h where stakeholders provide an overall score of 67%. Hypothesis H3: One stakeholder’s expectation for another stakeholder to perform better in facilities management or maintenance is higher than the actual standard in practice. Each stakeholder expects the other stakeholder to perform better than is currently the case, a finding even more apparent from the interviews concerning the expectations of the others’ knowledge of their respective roles and responsibilities in the process of MinDef’s facilities management. This is consistent with Zeithaml et al’s (1988) extended quality service model where role identification is one of the main constructs needed for closing the gap involved. 7. Conclusions Service providers need to manage stakeholders’ expectations of service delivery (Pennanen et al., 2005). This will enhance future stakeholders’ perceptions of the service provided and hence improve service quality. Knowing stakeholders’ expectations will better enable service providers to cater for the stakeholder needs. This paper has examined the service quality of a South East Asian country’s military facilities' management organisation, with stakeholders including the general public, officers from within the ministry and other government agencies. These stakeholders comprise end-users, Commanders and Representatives, Maintenance and Works Services Section (MWSS) Management, MWSS Supervising Officers (SO) and Contractors; the major players in relation to the service delivery of the Ministry of Defence (MinDef) facilities management. A description and summary of the stakeholders’ expectations is provided along with an empirical summary of these expectations. In particular, it is concluded that the prioritisation of expectations vary between stakeholder groups indicating a mismatch in stakeholder expectations. The empirical summary of stakeholder expectations should be utilised in the service provider’s strategy development for the expectation management for the MinDef’s facilities management. It is also apparent that, although current service delivery current processes are well understood by all stakeholders, there is need for further improvement, specifically in relation to their expectation levels.
From a theoretical point of view, the paper re-affirms the overall dimensions of the service expectation as categorised by Parasuraman et al. (1991); namely reliability, tangibles, responsiveness, assurance, and empathy, and that expectation levels vary from one stakeholder to another. In terms of facilities management practice on the other hand, the combined interview and survey technique used in the research produced findings that should prove useful in informing better communication between stakeholders. In better

10
understanding each other's expectations in the service delivery process, this understanding may provide facilities management teams with an improved prospect of closing the gaps in the service quality model. Better communication may also eventually lead to improved relationship management of the recipients of the facilities management services. The service providers involved can take account of the research findings in their future strategy formulation for managing stakeholder expectations and in fostering an improved cohesiveness in service delivery actions.
Finally, it should be noted that this paper is concerned solely with the evaluation of stakeholders’ expectations as this is a basic ingredient to developing a framework/model that can be tailored to suit the emerging situation relating to improved facilities management. Further research to boost development of the framework/model, including field trials to test the viability of the approach, is the natural progression of this work. References Alexander, K. (1992) "Facilities Management practice (part 5)." Facilities, Vol. 10, pp. 11-
18. Alexander, K. (2003) "A strategy for Facilities Management." Facilities, Vol 21, pp. 269-
274. Atkin, B. and Brooks, A. (2000) Total Facilities Management, Oxford:, Blackwell Science. Berry, L. L., Zeithaml, V.A. and Parasuraman, A. (1990) "Five imperatives for improving
service quality." Sloan Management Review, Vol 31, pp. 29-38. Bhandari, M. S., Tsarenko, Y. and Polonsky, M. J. (2007) "A proposed multi-dimensional
approach to evaluating service recovery." The Journal of Services Marketing, Vol 21, pp. 174-185.
Bitner, M. J., Faranda, W.T., Hubbert, A.R. and Zeithaml, V.A. (1997) "Customer contributions and roles in services delivery." International Journal of Service Industry Management, Vol. 8, pp. 193-205.
Boulding, W., A. Kaira, R. Staelin & V. A. Zeithaml (1993) "A dynamic process model of service quality: from expectations to behavioural intentions." JMR, Journal of Marketing Research. Vol 30, pp. 7-27.
Brown, G. & G. Maxwell (2002) "Customer service in UK call centres: Organisational perspectives and employee perceptions." Journal of Retailing and Consumer Services, Vol 9, pp. 309-316.
Burke, J. (2006) "Managing, meeting, and exceeding client expectations." American Agent & Broker, Vol 78, pp. 16-17.
Cadotte. E. R., Woodruff, R.B. and Jenkins, R.L. (1987), "Expectations and norms in models of consumer satisfaction." Journal of Marketing Research, Vol 24 (August), pp. 305-314.
Cardozo, R. N. (1965), "An experimental study of consumer effort, expectation and satisfaction," Journal of Marketing Research, Vol 2 (August), pp. 244-9.
Cavana, R. Y., Corbett, L.M. and Lo, Y.L. (2007) "Developing zones of tolerance for managing passenger rail service quality." The International Journal of Quality & Reliability Management, Vol 24, pp. 7-31.
Chowdhary, N. & M. Prakash (2007) "Prioritizing service quality dimensions." Managing Service Quality, Vol 17, pp. 493-509.
Coye, R. W. (2004) "Managing customer expectations in the service encounter." International Journal of Service Industry Management, Vol 15, pp. 54-71.
11
Danaher, P. J. & J. Mattsson (1994) "Customer satisfaction during the service delivery process." European Journal of Marketing, Vol 28, pp. 5-16.
De Ruyter, K., Bloemer, J. and Peeters, P. (1997) “Merging service quality and service satisfaction: An empirical test of an integrative model.” Journal of Economic Psychology, Vol. 18, pp. 387-406.
Dedeke, A. (2003) "Service quality: A fulfilment-oriented and interactions-centred approach." Managing Service Quality, Vol 13, pp. 276-289.
Donthu, N., and Yoo, B. (1998). Cultural influences on service quality expectations. Journal of Service Research, Vol 1 (November): 178-86.
Druckman, A. (2004) "Facility Management for the future." Journal of Property Management, Vol. 69, pp. 52-53.
Forbes, S. J. (2008) "The effect of service quality and expectations on customer complaints." The Journal of Industrial Economics, Vol 56, pp. 190-213.
Furrer, O., B. S. C. Liu & D. Sudharshan (2000) "The relationships between culture and service quality perceptions: Basis for cross-cultural market segmentation and resource allocation." Journal of Service Research, Vol 2, pp. 355-371.
Grimshaw, R. W. (2003) "FM: The professional interface." Facilities, Vol 21, pp. 50-57. Halstead, D., Hartman, D., & Schmidt, S. L. (1994). Multisource effects on the satisfaction
formation process. Journal of the Academy of Marketing Science, Vol 22(2), pp. 114-129.
Henry, J. W. (1994) "The service employee’s pivotal role in organizational success." The Journal of Services Marketing, Vol. 8, pp. 25-35.
Jones, K. & M. Sharp (2007) "A new performance-based process model for built asset maintenance." Facilities, Vol 25, pp. 525-535.
Kalamas, M., M. Laroche & A. Cėzard (2002) "A model of the antecedents of should and will service expectations." Journal of Retailing and Consumer services, Vol 9, pp. 291-308.
Kueh, K. & B.H. Voon (2007) "Culture and service quality expectations." Managing Service Quality, Vol 17(6), pp. 656-680.
Lagrosen, S. & Y. Lagrosen (2003) "Management of service quality – Differences in values, practices and outcomes." Managing Service Quality, Vol 13(5), pp. 370-381.
Licata, J. W., G. Chakraborty & B. C. Krishnan (2008) "The consumer’s expectation formation process over time." The Journal of Services Marketing, Vol 22(3), pp. 176-187.
Liu, B. S. C., O. Furrer & D. Sudharshan (2001) "The relationships between culture and behavioral intentions toward services." Journal of Service Research, Vol 4(2), pp. 118-129.
Lovelock, C. H. & J. Wirtz (2004) Services Marketing : People, Technology, Strategy. Upper Saddle River, N. J. :, Pearson/Prentice Hall.
McKee, D., C. S. Simmers & J. Licata (2006) "Customer self-efficacy and response to service." Journal of Service Research. Vol 8, pp. 207-220.
Mersha, T. &V.Adlakha (1992) "Attributes in service quality: the consumers’ perspective." International Journal of Service Industry Management, Vol 3, pp. 34-45.
Monroe, K. B. (1973) "Buyers’ subjective perceptions of price." JMR, Journal Of Marketing Research (pre-1986), Vol 10, pp. 70-80.
Oliver, R. L. & R. S. Winer (1987) "A framework for the formation and structure of consumer expectations: review and propositions." Journal of Economic Psychology, Vol 8, pp. 469-499.
Parasuraman, A. (2002) "Service quality and productivity: A synergistic perspective." Managing Service Quality, Vol 12, pp. 6-9.

12
Parasuraman, A., Berry, L.L. and Zeithaml, V.A. (1991) "Understanding customer expectations of service." Sloan Management Review, Vol. 32, pp. 39-48.
Parasuraman, A., Zeithaml, V.A and Berry, L.L. (1985) "A conceptual model of service quality and its implications for future research." Journal of Marketing, Vol. 49, pp. 41-50.
Pennanen, A., Whelton, M. and Ballard, G. (2005) "Managing stakeholder expectations in facility management using workplace planning and commitment making techniques." Facilities, Vol. 23, pp. 542-557.
Pitt, M. and Tucker,M. (2005). "Performance measurement in FM", Property Management Vol. 26 No. 4, 2008 pp. 241-254.
Samat, N., T. Ramayah & N. Mat Saad (2006) "TQM practices, service quality, and market orientation: Some empirical evidence from developing country." Management Research News, Vol 29, pp. 713-728.
Schofield, R. A. & L. Breen (2006) "Suppliers, do you know your customers?" The International Journal of Quality & Reliability Management, Vol 23, pp. 390-408.
Singh, J. (1990) "A typology of consumer dissatisfaction response styles." Journal of Retailing, Vol 66, pp. 57-99.
Teas, R. K. (1993) "Expectations, performance evaluation, and consumers’ perceptions of quality." Journal of Marketing, Vol 57, pp. 18-34.
Tsoukatos, E. & G. K. Rand (2007) "Cultural influences on service quality and customer satisfaction: Evidence from Greek Insurance." Managing Service Quality, Vol 17, pp. 467-485.
Walker, J. and Baker, J. (2000) "An exploratory study of a multi-expectation framework for services." The Journal of Services Marketing, Vol 14, pp. 411-431.
Woodruff, R.B., Cadotte, E.R and Jenkins, R.L. (1983) “Modeling consumer satisfaction processes using experience-based norms.” Journal of Marketing Research, Vol 20 (August), pp. 296-304.
Yap, K. B. & J. C. Sweeney (2007) "Zone-of-tolerance moderates the service quality-outcome relationship." The Journal of Services Marketing, Vol 21, pp. 137-148.
Zeithaml, V. A. (2000) "Service quality, profitability, and the economic worth of customers: What we know and what we need to learn." Academy of Marketing Science. Journal, Vol 28, pp. 67-85.
Zeithaml, V. A., Berry, L.L., and Parasuraman, A. (1988) "Communication and control processes in the delivery of service quality." Journal of Marketing, Vol. 52, pp. 35-48.
Zeithaml, V. A., Berry, L.L., and Parasuraman, A. (1993) "The nature and determinants of customer expectations of service." Academy of Marketing Science, Journal, Vol. 21, pp. 1.
Zeithaml, V. A., L. L. Berry & A. Parasuraman (1996) "The behavioral consequences of service quality." Journal of Marketing, Vol 60, pp. 31.
Zumbehl, R. K. and Mayo, R.E. (1994) "Customer focussed quality for the maintenance and repair of air force facilities." Project Management Journal, Vol. 25, pp. 32-36.

13
Figure 1: Questionnaire respondents
MWSS S.O, 27
Enduser, 3
Contractor, 15
MWSS Management,
13
Commander, 5

14
Figure 2: Interviewees
MWSS S.O, 5
Enduser, 2Contractor, 2
MWSS Management, 3
Commander, 2

15
Figure 3: The number of stakeholder sharing variables
0
1
2
3
4
5
6
Number of
stakeh
older

16
Figure 4: Number of shared variables
0
1
2
3
4
5
6
7
4 3 2 1 0
Number of stakeholder sharing the same expectation variables
MWSS S.O
End‐user
Contractor
MWSS mgt
Commander
No of sh
ared vareiab
les

17
Figure 5: Expectation fulfillment of stakeholders shown in radar chart.
0
2
4
6
8
10
End‐user
Commander
MWSS S.OMWSS Mgt
Contractor
End‐user Commander MWSS S.O MWSS Mgt Contractor

18
Expectation variable MWSS SO End-user
Contractor MWSS
management Commander
All groups
Swiftness 7 8 2 1 1 1
Value for money 10 6
Following procedures 3 3 2 2 3
Profit 8
Friendly service 2 7 8 7 7
Professional service 4 1 1 3 4 Customer service oriented
6 4
4 9
Ease of process 5 5 9 10 8
Transparent process 7 4 10
Information savvy 8
Less paperwork 8 10
Payment on time 6 10
Payment process 10 7 Certification of maintenance work
9
Maintenance request processed on time
2 9
4 5 6
Maintenance request implemented on time
5 3
5 6 5
Computerisation 1 6 9 3 9 2 (Note: Number 1 is the highest ranking)
Table 1: Stakeholder expectations
19
MWSS S.O. End-user Contractor MWSS
Management Commander
MWSS S.O. 7 4 6 6
End-user 7 6 6 8
Contractor 4 6 7 6
MWSS mgt 6 6 7 7
Commander 6 8 6 7
Table 2: Number of shared expectations variables matrix of stakeholders.

20
Process Respondent
Maintenance work request
payment
Information management
Implementing maintenance work
Maintenance work supervision
MWSS’s role
MWSS SO 6.8 7.7 8.1 7.5 8.4 8.5
End-user 6.8 7.7 8.1 7.5 8.4 8.5
Contractor 7.2 8.7 8.7 8.3 9.0 9.0
MWSS mgt 7.3 8.8 8.7 8.4 9.2 9.0
Commander 7.0 8.2 8.4 8.0 8.7 8.7
Average 7.0 8.2 8.4 8.0 8.7 8.7
Table 3: Mean rating (out of ten) by stakeholders on the priority of processes in need of improvement.

21
MWSS Supervising
Officer End-user Contractor
MWSS Management
Commander Average overall
Work process to improve
7.6 8.1 8.0 8.1 8.1 8.0
Paperwork dependency
7.7 7.8 7.9 7.7 7.8 7.8
Maintenance work request
7.5 7.0 7.1 7.0 7.0 7.1
Happy with service provided by MWSS
7.5 6.9 6.8 7.3 7.0 7.1
Time consumption
7.1 6.8 6.4 6.8 6.7 6.8
Maintenance work implementation
7.1 6.7 6.6 6,8 6.7 6.8
Adequacy of estate maintenance
7.1 6.8 6.7 6.8 6.7 6.8
Happy with service provided in general
7.1 6.6 6.3 6.9 6.6 6.7
Processing time 7.4 6.1 5.8 6.5 6.1 6.4
Table 4: Mean satisfaction levels of the current process