Embed Size (px)
Citation preview

This is the author’s version of a work that was submitted/accepted for pub-lication in the following source:
Webber, Ann L., Wood, Joanne M., Gole, Glen A., & Brown, Brian(2011)DEM test, visagraph eye movement recordings, and reading ability in chil-dren.Optometry and Vision Science, 88(2), pp. 295-302.
This file was downloaded from: https://eprints.qut.edu.au/46171/
c© Copyright 2011 Lippincott, Williams & Wilkins
Notice: Changes introduced as a result of publishing processes such ascopy-editing and formatting may not be reflected in this document. For adefinitive version of this work, please refer to the published source:
https://doi.org/10.1097/OPX.0b013e31820846c0

The DEM Test, Visagraph Eye Movement Recordings and Reading Ability in Children
Ann Webber, PhD, MS, BAppSc(Optom), Joanne Wood, PhD, FAAO, Glen Gole, MD, and
Brian Brown, PhD, FAAO
School of Optometry and Institute of Biomedical Innovation, Queensland University of
Technology, Brisbane, Queensland Australia (AW, JW, BB), and Discipline of Paediatrics,
University of Queensland, Royal Children’s Hospital, Brisbane, Queensland, Australia (GG)
Short tile: Children's Reading Eye Movements and Reading Scores
4 tables; 2 figures
Received: May 16, 2010; accepted September 13, 2010.

ABSTRACT
Purpose. To determine how Developmental Eye Movement (DEM) test results relate to reading
eye movement patterns recorded with the Visagraph in visually normal children, and whether
DEM results and recorded eye movement patterns relate to standardized reading achievement
scores.
Methods. Fifty-nine school-age children (age = 9.7 ± 0.6y) completed the DEM test and had eye
movements recorded with the Visagraph III test while reading for comprehension. Monocular
visual acuity in each eye and random dot stereoacuity were measured and standardized scores on
independently administered reading comprehension tests (Reading Progress Test) were obtained.
Results. Children with slower DEM horizontal adjusted times tended to have slower reading
rates with the Visagraph (r = -0.547); those with slower DEM vertical adjusted times tended to
have slower reading rates with the Visagraph (r = -0.414). While a significant correlation was
also found between DEM Ratio and Visagraph reading rate (r = -0.368), the strength of the
relationship was less than that between DEM Horizontal time and reading rate. DEM outcome
scores were not significantly associated with Reading Progress Test scores. When the relative
contribution of reading ability and DEM scores was accounted for in multivariate analysis, DEM
outcomes did not significantly associate with reading rate. Reading Progress Test scores
associated with Visagraph outcomes of duration of fixations (r = -0.403) and calculated reading
rate (r = 0.366), but not with DEM outcomes.
Conclusions. DEM outcomes can identify children whose Visagraph recorded eye movement
patterns show slow reading rates, however, when reading ability is accounted for, DEM
outcomes are a poor predictor of reading rate. Visagraph outcomes duration of fixation and
reading rate relate to standardized reading achievement scores, however DEM results do not.

Keywords: reading eye movements; visagraph; DEM

The optometric management of vision problems related to learning outcomes in children includes
clinical assessment of visual acuity, refractive error and binocular vision status, plus assessment
of the oculomotor system, with the aim of identifying and addressing vision problems that may
interfere with the learning process. 1 Methods of evaluating oculomotor performance range in
complexity from gross observation of pursuit and saccadic eye movements through to indirect
measures of eye movements (such as the Developmental Eye Movement (DEM) test), to more
complex direct measures of eye movements with infra-red recording systems.2
In optometric practice the method most frequently used to assess eye movements is observation
and grading of fixation stability, pursuit and saccadic eye movements, where the smoothness and
accuracy of these movements are rated on a scale from 1 to 4.2 Normative data have been
provided for some of these grading scales, including the North Eastern State University College
of Optometry Oculomotor Test (NSUCO) and the Southern California College of Optometry
(SCCO) rating system.3 However, while the advantages of grading scales are that they are simple
to administer and require no special equipment, their reliability, repeatability and ability to
quantify clinical observations of eye movements has been questioned.2, 3
Other clinical approaches to evaluating eye movements involve the indirect assessment of
saccadic eye movements during tasks that simulate reading. Some of these tests include the
Pierce Saccadic Test, the King-Devick Saccadic Test and the DEM Test.3 These tests share a
similar design, with the patient being required to name a series of single digits arranged in rows
as quickly as possible, without using a finger or pointer as a guide. The time taken to report the
digits and the number of errors made are compared to normative data tables. Of these indirect

tests of eye movements, clinically the DEM test is the most frequently used; it specifically
measures the time taken to name numbers arranged irregularly in horizontal rows (horizontal
time), and the time taken to name numbers arranged in vertical columns (vertical time), a
measure of rapid automatized naming (RAN). RAN is the time it takes individuals to name aloud
objects, pictures, colors, or symbols (letters or digits) as quickly as they can. Variations in rapid
automatized naming time in children provide a strong predictor of their later ability to read, and
does so independently of other predictors such as phonological awareness, verbal IQ, and
existing reading skills.4 The DEM Ratio, calculated by dividing the time taken to name the 80
numbers presented in horizontal rows by the time taken to name the 80 numbers presented in
vertical columns, is intended to provide a measure of saccadic eye movements that factors out
RAN.5 The DEM is considered to be the best of the clinical indirect methods for evaluating
saccadic eye movements because the test design aims to account for automaticity in number-
naming skills.3 By calculating the ratio between horizontal time and vertical time the variability
in the rate at which children can automatically name numbers aloud is factored out.
While the DEM test was originally developed in the late 1980’s to provide a simple way to
assess saccadic eye movements related to reading in school-age children,6 Ayton et al.
7 recently
questioned its validity as an index of saccadic eye movements. Their study failed to find a
significant relationship between DEM outcomes and objectively measured infra-red recordings
of saccadic latency, gain, peak velocity or accuracy.7
The DEM is relatively inexpensive, easy to obtain and simple to use, however it is not clear how
DEM outcome measures relate to the pattern of children’s eye movements made during reading

for comprehension. Given the widespread use of the DEM as a clinical measure of eye
movements and the recommendation for its use in the optometric evaluation of children with
learning-related problems,1 it is important to have a clearer understanding of the relationship
between DEM measures and direct measures of oculomotor function. It is also important to
determine how these clinical eye movement measures relate to standardized reading test scores.
The Visagraph III Eye Movement recording system (Taylor Associates, New York) has been
identified as one of the best clinical methods for direct eye movement recording,2, 3
and has been
commercially available for clinical use for over a decade. The Visagraph uses goggles containing
infra-red sensors to record eye movements during reading, which are then described by a report
that counts the number of fixations, regressions, return-sweep saccades, span of recognition,
fixation duration and reading rate. An example of a recording is shown in Figure 1 and an
example of a report is given in Figure 2. In the report fixations/100 words refer to the number of
stationary periods between left-to-right progressive saccades of 1 to 2 degrees, while
regressions/100 words refer to the number of times the eye movements are directed from right-
to-left by “backward” saccades during reading. In established readers, about ten to fifteen
percent of saccades made during reading are regressions, while children learning to read and
poor readers make a larger number of regressions and have prolonged fixation durations.8
However, when given material appropriate for their reading level, the overall reading eye
movement pattern of inexperienced or poor readers tends to normalize, suggesting that the
abnormal reading eye movement pattern had reflected difficulty with cognitive processing of the
reading material.8 Return-sweep saccades are the large right-to-left, slightly oblique saccadic eye
movement that shift the eyes from near the end of one line to near the beginning of the next line

of text and are typically 12 to 20 degrees in angular extent, with saccadic durations of 40 to 54
msec.8
In this study we investigated how the outcome measures of the DEM relate to the pattern of eye
movements recorded with the Visagraph during reading for comprehension in children with
normal visual development, and we also examined how these clinical measures of oculomotor
function related to academic outcomes assessed by scores on standardized tests of reading.
METHODS
Participants
Visually normal participants (n=59; age = 9.7 ± 0.6y) were recruited from grades 4 and 5 of a
local primary (elementary) school via a letter sent home to parents, which outlined the purpose of
the study; 60% of invited students were granted parental consent to participate. Children
recruited for this study also formed part of a control group for a study of motor and psychosocial
skills in amblyopic children, the results of which have been published elsewhere.9-11
For
inclusion in the study, written information was obtained from parents that the child had no
known neurological or ocular disorder (other than refractive error) and was carried in full-term
pregnancy. All met the criteria of normal visual development with better than 0.1 logMAR VA
in each eye and at least 60 seconds of arc stereoacuity.
Assessment of visual acuity and stereoacuity, fine motor skills, perceived self esteem and the
DEM took about 45 minutes per subject and were completed within an initial test session by all
participants. Infra-red recording of eye movements during reading for comprehension were made

with the Visagraph III at a second session and took about 20 minutes per subject to complete. All
data were collected within a one month period. Fifty-seven children had standardized tests of
reading with the Reading Progress Test (RPT) conducted by the usual classroom teacher in class
time at the start of the school year, two months prior to participation in the current study (two
students were absent from the school on the day of testing).
All participants were given a full explanation of the experimental procedures and the option to
withdraw from the study at any time was explained to both parent and child. Written informed
consent for participation in the experimental procedures and for access to educational
information from school records was obtained from the parent prior to participation in the study.
The study was conducted in accordance with the requirements of the Queensland University of
Technology Human Research Ethics Committee and all protocols concurred with the guidelines
of the Declaration of Helsinki.
Vision Assessment
Visual acuity was measured using a 3 metre Bailey-Lovie logMAR letter chart while the child
wore their habitual refractive correction (if any). A screening/threshold procedure was used
which was based on the Amblyopia Treatment Study VA protocol.12
The child read the first
letter of each row from the top of the logMAR chart until an error was made (screening). The
child was then redirected to two rows above the screening error row and asked to attempt each
letter until four incorrect responses were given (threshold). The resultant monocular VA for each
eye was scored on a letter by letter basis. The level of binocular function was assessed with the
Randot Preschool Stereoacuity test.13, 14

Reading Proficiency
The level of reading proficiency of the children was determined from outcome scores on
standardized tests of reading performance, the Reading Progress Test (RPT).15
The RPT is a
series of seven tests for children aged 5 to 11 years and has high repeatability and validity.15
Each test has cross-sectional norms based on Australian schools which give standardized scores
for the interpretation of individual scores relative to the expected performance standards of
students at the same school year level. The tests are made up of three main types of
comprehension question: (1) identifying the meaning of individual words, (2) selecting the
correct answer from a number of choices after reading a short story, non-fiction passage or
poem, and (3) choosing, or supplying, missing words in a short story or non-fiction passage. The
children work through the tests at their own pace after an initial explanation by the teacher, and
generally require 45-50 minutes to complete the tests.15
Raw scores were converted to
standardized scores based upon Australian normative data of children at equivalent school grade
level. Standardized scores of 71 to 88 suggest reading proficiency that is below average for grade
level (less than 23rd
percentile); scores between 89 and 111 indicate average performance ability;
and scores between 112 and 126 suggest above average reading proficiency (above 77th
percentile).
Developmental Eye Movement Test
The DEM test consists of a pre-test of number knowledge followed by two subtests with 40
numbers arranged in vertical columns (Tests A and B), and a subtest with 80 irregularly spaced
numbers arranged in 16 horizontal rows (Test C). Participants were asked to name aloud the

single digit numbers as quickly and accurately as possible and the time taken to read aloud the 80
numbers in both the four vertical columns (vertical time) and the sixteen line horizontal array
(horizontal time) was recorded. The number of omissions and addition errors was recorded and
test times were adjusted for errors made. Both the vertical and horizontal times were adjusted to
account for the number of digits actually named by the child. That is, if a child skipped a line of
digits in the horizontal test and therefore called out five fewer digits than required the horizontal
time would be lower than expected. One second was added to the recorded time for each digit
skipped; similarly one second was deducted for each digit called twice.
A ratio was calculated by dividing the time taken to read the 80 numbers in the horizontal array
(test card C) by the total time for reading the 80 numbers in vertical subsets (test cards A and B).
The outcome measures from the DEM test included Vertical time, Horizontal time, Number of
Errors and Ratio (horizontal time/vertical time). Results were converted to standard scores and
percentile ranks based on published age-normative data for the test.6
Visagraph
Eye movements were recorded with the Visagraph III recording system that uses goggles
containing infra-red sensors to capture eye position information while the child reads a short
grade level appropriate paragraph of text. A comprehension test involving ten questions with
“yes” or “no” responses was administered following the recording to confirm that the child was
reading for comprehension, rather than merely scanning through the text. All participants in this
study had more than 70% correct on the multiple choice comprehension test, and thus met the
Visagraph criterion for data acceptance. Figure 1 shows an example of the traces produced by the

Visagraph. Traces for both right (red) and left (blue) eye are shown. The right tracing of each
pair represent the original data and the left of each pair are the computed traces from which the
measures in the Reading Report are derived.
The outcome measures calculated by the Visagraph software include the number of fixations per
100 words, number of regressions per 100 words, span of recognition, average duration of
fixations and reading rate. The average span of recognition refers to the amount of print
perceived and processed with each fixation. It is specified in units of “words” and calculated by
dividing the number of words in the specified paragraph by the number of fixations. Fixation
duration refers to the length of time that the eye pauses or remains fixated on a word. Reading
rate refers to the number of words read per unit time and is specified in words per minute. As the
data obtained for each eye separately differed by less than five percent, results for the right and
left eye were averaged for analysis of Visagraph outcomes for both the reading and number
naming tasks. From the Visagraph recordings a number of measures of the eye movement pattern
made during the reading task are summarized in a Reading Report (an example is shown in
Figure 2).
Statistical Analysis
Pearson’s correlation co-efficients (r) were calculated to test for associations between DEM
measures and the eye movement parameters derived from the Visagraph reports (Statistical
Package for the Social Sciences – SPSS V16). The contribution of DEM and Visagraph variables
to reading ability was investigated using multivariate analysis. In view of the extensive testing

performed on this data set, we have adopted the more conservative criterion for statistically
significance of p=0.01 for the analysis.
RESULTS
Participants had a group mean visual acuity of -0.03 logMAR in the better eye and -0.02
logMAR in the worst eye, with an average inter-ocular difference in acuity of 0.013 logMAR.
Two subjects wore spectacles to correct hyperopic refractive error. All but one of the 59
participants had at least 40 sec of arc stereoacuity as measured with the Randot stereoacuity test,
with the remaining subject having stereoacuity of 60 sec of arc.
The mean, standard deviation and range of DEM test outcomes and Visagraph outcome measures
of number of fixations, number of regressions, duration of fixation, span of recognition and
reading rate are presented in Table 1. The mean, standard deviation and range of RPT raw scores
and age standardized scores are also included in Table 1.
Relationship between DEM outcomes and Visagraph Recorded Eye Movement Patterns
There was a wide range of reading ability within the sample (Reading standard score range 70 to
126: the scores are standardized to a value of 100 for each age group, Table 1). While the sample
was skewed towards high reading scores, there were five students whose reading scores were
more than two standard deviations below the mean of the group.
Bivariate correlation analysis showed a number of significant associations between the DEM and
Visagraph outcomes. Pearson correlation coefficients are presented in Table 2. Children with

slower reading rates measured with the Visagraph tended to have slower DEM horizontal
adjusted (r = -0.547; p<0.000) and Vertical adjusted times (r = -0.414; p=0.001). The bivariate
correlation between Visagraph reading rate and DEM horizontal adjusted time is shown in
Figure 3; approximately thirty percent of the variation in reading rate could be predicted from the
DEM horizontal time. While significant correlation was also found between DEM Ratio and
Visagraph reading rate (wpm) (r = -0.368; p=0.004) (Figure 4), the strength of the relationship is
less than that between DEM Horizontal time and reading rate (r = -0.547; p<0.000) (Figure 3).
Children with a higher DEM Ratio had slower reading rates recorded during reading for
comprehension (r = -0.368; p=0.004); however, as shown in Figure 5, only 13 percent of the
variation in Visagraph reading rate could be predicted from the DEM Ratio outcome. The
number of errors recorded during the DEM test was not significantly associated with any of the
measures of reading fluency recorded by the Visagraph.
Relationship between DEM and Visagraph Outcomes and Reading Progress Test Score
Bivariate correlation analysis showed no significant association between DEM outcome scores
and Reading Progress Test scores (Table 3). Performance on the Reading Progress Test was
significantly related to both the duration of fixation (r = -0.403; p=0.002) and reading rate (r =
0.366; p=0.005) derived from the Visagraph recording of eye movement patterns during reading
for comprehension.
Determinants of Reading Speed when Controlling for Reading Ability
In this study significant correlations were found both between DEM outcomes and Visagraph
reading rate (Table 2) and between the measure of reading ability (RPT score) and reading rate

(Table 3). Multiple regression analysis was used to determine the relative contributions of DEM
outcomes and RPT scores to reading rate. That is, to examine the correlation between DEM
outcomes and Visagraph reading rate when the reading ability of the child, as measured by RPT
score, is taken into account.
The multiple regression analysis indicated that when the inter-relationships between these
measures was taken into account, reading rate as measured by Visagraph was significantly
associated with RPT score (t=3.192; p=0.002) but not with DEM outcome measures (Table 4).
Multiple regression analysis of the association between Visagraph eye movement parameters and
reading rate was precluded due to unacceptably high inter-correlation between the Visagraph
outcomes (multicollinearity). The variance inflation factors (VIF) were greater than 10 indicating
that the variables are so highly related that it is not possible to obtain reliable estimates of the
individual regression coefficients. Multiple regression models with RPT scores as outcome
measures and either DEM or Visagraph measures as input parameters each had high VIF values,
and so could not be applied to this data set.
DISCUSSION
We examined the relationship between the outcome measures of the DEM and parameters
derived from Visagraph III clinical recordings of reading eye movement patterns and determined
how these measures relate to a standardized test of reading achievement (Reading Progress Test).
Bivariate analysis demonstrated a number of significant relationships between these two tests
which are used clinically to assess eye movements in children. The DEM outcome measure of
horizontal adjusted time, rather than DEM Ratio, showed the most significant associations with

Visagraph outcome measures. While the associations found between DEM outcomes measures
and the pattern of eye movements obtained from the Visagraph recording suggest that the DEM
may be clinically useful to identify children with slow reading rates, the data suggest that it is the
DEM timed outcomes, rather than the Ratio, that are the most useful measures in terms of their
relationship to objective measures of eye movement patterns. When the relative contribution of
reading ability and DEM scores to reading rate was accounted for in multivariate analysis,
reading rate was associated with RPT score, but not to DEM outcomes.
DEM Ratio scores are calculated by dividing horizontal time by vertical time and the Ratio score
is intended to differentiate between poor saccadic function and a primary rapid naming deficit.16
High Ratio scores are the result of abnormally increased time to complete the horizontal test
relative to the time taken to complete the vertical test and are reported by the DEM test authors
to be characteristic of oculomotor dysfunction.6 A high Ratio score is purported to indicate poor
saccadic eye movement competence which, in turn, has been suggested to explain poor reading
fluency.6 If this were the case then we would expect that the Ratio outcome would have the
strongest relationship with the pattern of eye movements recorded during reading. However, in
our data, the DEM Ratio accounted for only thirteen percent of the variation in Visagraph
measured reading rate and was a poorer predictor of reading rate than Horizontal time. Similarly,
the DEM Ratio did not correlate with the number of fixations or regressions made during either
the reading for comprehension. The number of errors made during the DEM, which generally
resulted from skipping a row of numbers on the horizontal task, showed no correlation with
infra-red recording of reading rates. The DEM examiner’s booklet advises that error scores
should not be taken into account in their clinical response categories and advises clinicians to

consider error scores independently. Similarly, our data suggests that error scores alone are not
useful for the identification of children with slower Visagraph recorded reading rates.
Correlation between DEM horizontal time and reading rate has been reported in dyslexic17
and in
poor readers18
. In our study, when we controlled for the level of reading ability of the child using
multiple regression analysis, DEM outcomes did not significantly associate with reading rate
(p>0.01).
The findings of this study support the conclusions of Ayton et al.7 and Ciuffreda
19 that the DEM
does not evaluate basic components of eye movement control. Ayton et al.7 recently reported no
significant correlation between DEM test performance and quantitative eye movement
parameters (gain, latency, asymptotic peak velocity and number of corrective saccades) in their
sample of 158 children aged 8 to 11 years from a normal, unselected school-based cohort and
advised that the DEM should not be described as an eye movement assessment tool.
We found that the duration of fixation and reading rate determined by Visagraph associated with
scores achieved on the standardized test of reading achievement (RPT), however DEM outcome
measures did not relate to this measure of reading ability. A number of studies suggest that poor
outcomes on the DEM may identify children with poor academic performance.6, 7, 20, 21
In the
initial validation study of the DEM (n=58; mean age 8.9 years) reading scores on the Wide
Range Achievement Test (WRAT) correlated with both DEM horizontal time (r=-0.78) and
Ratio (r=-0.55)6 and the timed outcomes of the DEM were found to predict performance on a test
of academic achievement (n=60; age = 11y 7m ± 5m), the English Language Arts section of the

Test of New York State Standards.20
Poor performance on the DEM test has also been reported
to correlate with parental observation of reading errors, such as losing one’s place or omitting
words when reading or re-reading lines unknowingly 21
and, while their findings indicate that the
DEM is not a valid measure of saccadic eye movements, Ayton et al.7 also report that DEM
outcome scores significantly correlate with a measure of reading age (Burt reading test) and with
measures of visual processing speed (RSVP task).7 However, our data suggest that DEM
outcomes do not predict performance on standardized tests of reading ability that assess
comprehension of read passages of text, while the Visagraph measures of duration of fixation
and calculated reading rate were related to these standardized measures of reading ability.
In summary, slow DEM outcomes appear to identify children whose Visagraph recorded eye
movement patterns show slow reading rate, however, DEM outcomes do not associate with
results on independently administered tests of reading ability (RPT score). Clinicians need to be
aware that, while the DEM can be used to identify children with poor automaticity in number
naming, the DEM is not a measure of saccadic eye movements. The strongest bivariate
correlation with RPT reading achievement score was found with Visagraph recorded duration of
fixation, that is, the length of time that the eye movement pattern paused during a fixation. This
suggests that the time taken to process the text information is controlling reading speed, rather
than reading speed being limited by the mechanics of saccadic eye movement control. These
findings support the argument that the cognitive aspects of reading, rather than the motor aspects,
control reading rate when reading for comprehension.

A potential limitation of our study was that participants were not selected based upon their
academic ability. Our sample had RPT standardized scores that ranged from 70 to 126, and was
skewed towards higher RPT scores (Table 1). Four children in our sample had RPT standardized
scores less than or equal to 88 suggesting reading proficiency that is below average for grade
level (less than 23rd
percentile). We plan future studies which will further explore recorded eye
movement patterns in children from a broader range of academic ability, with particular regard to
those children whose reading ability is below average for school grade level.
ACKNOWLEDGEMENTS
This work was supported by Queensland University of Technology (QUT) and the Institute of
Health and Biomedical Innovation (IHBI). The authors would like to thank Philippe Lacherez for
statistical advice and also thank all the participants and the administration of Bulimba State
School for their co-operation.

REFERENCES
1. Garzia R, Borsting E, Nicholson S, Press L, Scheiman M, Solan H. Optometric Clinical
Practice Guideline: Care of the patient with learning related vision problems. St Louis, MO:
American Optometric Association; 2006.
2. Scheiman M, Wick B. Clinical Management of Binocular Vision. Philadelphia: J.B.
Lippincott Company; 1994.
3. Scheiman M, Rouse M. Optometric Management of Learning-Related Vision Problems,
2 ed. St Louis, Missourie: Mosby, Elsevier; 2006.
4. Powell D, Stainthorp R, Stuart M, Garwood H, Quinlan P. An experimental comparison
between rival theories of rapid automatized naming performance and its relationship to reading. J
Exp Child Psychol 2007;98:46-68.
5. Garzia RP. A new visual-verbal saccade test: the developmental eye movement test
(DEM). J Am Optom Assoc 1990;61:124-35.
6. Richman M, Garzia R. Developmental Eye Movement Test, Version 1, Examiners
Booklet. South Bend, IN: Bernell Corporation; 1987.
7. Ayton L, Abel L, Fricke T, McBrien N. Does the Development Eye Movement (DEM)
test actually measure eye movements? Optom Vis Sci 2009;86:722-30.
8. Ciuffreda KJ, Tannen B. Eye movements during reading. In: Sasser M, editor. Eye
Movement Basics for the Clinician. St Louis, Missouri: Mosby-Year Book, Inc, 1995: 161-83.
9. Webber AL, Wood JM, Gole GA, Brown B. The effect of amblyopia on fine motor skills
in children. Invest Ophthalmol Vis Sci 2008a;49:594-603.
10. Webber AL, Wood JM, Gole GA, Brown B. The effect of amblyopia on self-esteem in
children. Optom Vis Sci 2008b;85:1074-81.
11. Webber AL, Wood JM, Gole GA, Brown B. The effect of amblyopia on the
Developmental Eye Movement test in children. Optom Vis Sci 2009;86:760-6.
12. The Pediatric Eye Disease Investigator Group, Holmes JM, Beck RW, Repka MX, Leske
DA, Kraker RT, Blair C, Moke PS, Birch EE, Saunders RA, Hertle RW, Quinn GE, Simons KA,
Miller JM. The Amblyopia Treatment Study Visual Acuity Testing Protocol. Arch Ophthalmol
2001;119:1345-53.
13. Birch EE, Williams C, Hunter J, Lapa MC, ALSPAC. Random Dot Stereoacuity of
Preschool Children. J Ped Ophthalmol Strab 1997;34:217-22.
14. Birch EE, Williams C, Drover J, Fu V, Cheng C, Northstone K, Courage M, Adams R.
Randot Preschool Stereoacuity Test: Normative data and validity. J AAPOS 2008;12:23-6.
15. Vincent D, Crumpler M, East London Assessment Group. Reading Progress Tests (RPT)
Stage 1 and Stage 2. London: Hodder and Stoughton Educational Division; 1997.
16. Rouse MW, Nestor EM, Parot CJ, DeLand PN. A reevaluation of the Developmental Eye
Movement (DEM) Test's repeatability. Optom Vis Sci 2004;81:934-8.
17. Northway N. Predicting the continued use of overlays in school children - a comparison
of the Developmental Eye Movement test and the rate of reading test. Ophthal Physiol Opt
2003;23:457-64.
18. Palomo-Alvarez C, Puell M. Relationship between oculomotor scanning determined by
the DEM test and a contextual reading test in schoolchildren with reading difficulties. Graefes
Arch Clin Exp Ophthalmol 2009;247:1243-9.

19. Ciuffreda KJ, Tannen B. Clinical Evaluation of Eye Movements. In: Sasser M, editor.
Eye Movement Basics for the Clinician. St Louis, Missouri: Mosby-Year Book, Inc, 1995b: 206-
29.
20. Lack D. Comparison of the Developmental Eye Movement Test, the Visagraph numbers
test with a test of the English language arts. J Behav Optom 2005;16:1-5.
21. Tassinari JT, De Land PN. Developmental Eye Movement Test: reliability and
symptomatology. Optometry 2005;76:387-99.
Corresponding author:
Ann Webber
School of Optometry and Institute of Biomedical Innovation
Queensland University of Technology
Brisbane, Australia, QLD
AUSTRALIA
e-mail: [email protected]

Table 1. DEM and Visagraph outcome measures and Reading Progress Test scores.
Outcome measure Mean (Std. Deviation)
Range
Developmental Eye Movement Test (DEM) (n=59)
Vertical adjusted time (seconds) 40.4 (7.0) 29 - 65
Horizontal adjusted time (seconds) 51.2 (11.1) 30 - 85
Number of Errors 1.3 (2.9) 0 - 10
Ratio Horizontal Time/Vertical Time 1.26 (0.17) 1.0 - 1.8
Visagraph Recording during silent reading for comprehension (n=59)
Average number of Fixations per 100 words 168 (37.3) 101.5 - 257
Average number of Regressions per 100 words 29 (14) 5 - 74
Average span of recognition 0.62 (0.14) 0.39 - 0.99
Average duration of fixation (seconds) 0.29 (0.05) 0.22 - 0.46
Average reading rate (words per minute) 130 (34) 70 - 231
Reading Progress Test (n=57) Raw Score 27.91 (6.77) 11 - 38
Standard Score 108.02 (12.99) 70 – 126

Table 2. Pearson correlation co-efficients calculated between DEM and Visagraph.
Visagraph
Silent reading for comprehension
DEM Test Number Fixations
Number Regressions
Span Recognition
Duration Fixation
Reading Rate (wpm)
Vertical Adjusted Time .277 (0.033) .301 (0.021) -.296 (0.023) .300 (0.021) -.414 (0.001)
Horizontal Adjusted Time .407 (0.001) .263 (0.044) -.418 (0.001) .355 (0.006) -.547 (<0.001))
Number of Errors -.042 (0.750) -.087 (0.512) -.004 (0.974) .247 (0.060) -.138 (0.298)
Ratio (Vertical Time /Horz Time) .317 (0.015) .048 (0.720) -.306 (0.018) .184 (0.162) -.368 (0.004)
Bold italics indicate correlation is significant at the 0.01 level.
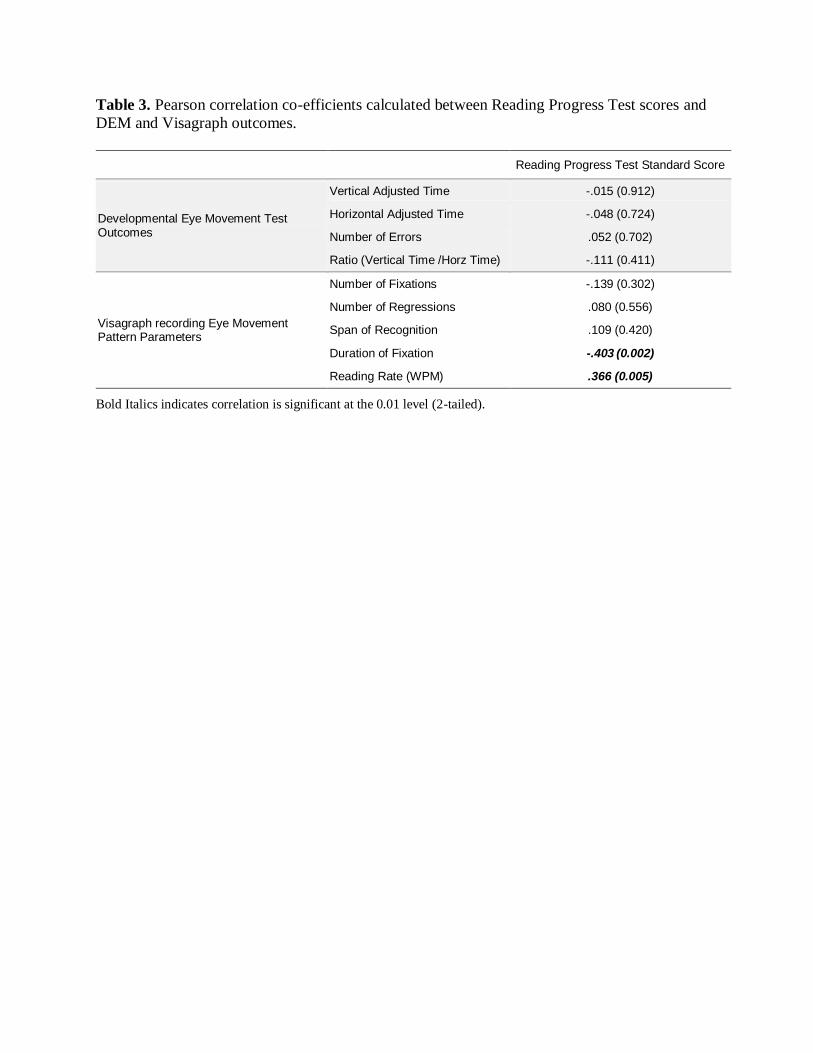
Table 3. Pearson correlation co-efficients calculated between Reading Progress Test scores and
DEM and Visagraph outcomes.
Reading Progress Test Standard Score
Developmental Eye Movement Test Outcomes
Vertical Adjusted Time -.015 (0.912)
Horizontal Adjusted Time -.048 (0.724)
Number of Errors .052 (0.702)
Ratio (Vertical Time /Horz Time) -.111 (0.411)
Visagraph recording Eye Movement Pattern Parameters
Number of Fixations -.139 (0.302)
Number of Regressions .080 (0.556)
Span of Recognition .109 (0.420)
Duration of Fixation -.403 (0.002)
Reading Rate (WPM) .366 (0.005)
Bold Italics indicates correlation is significant at the 0.01 level (2-tailed).

Table 4. Multiple regression analysis of contributors to Reading Rate.
Regression coefficient t Collinearity Statistics
B Std. Error Sig. Tolerance VIF
DEM Vertical Time (sec) -.086 .902 -.095 .925 .324 3.089
DEM Horizontal Time (sec) -1.516 .618 -2.454 .018 .298 3.352
DEM number of errors .232 1.328 .174 .862 .879 1.138
RPT Score 1.754 .550 3.192 .002 .967 1.034

FIGURE LEGENDS
Figure 1. Original tracing for left eye (left column) and right eye (right column) from which
Visagraph measures are derived. A color version of this figure is available online at
www.optvissci.com.
Figure 2. Reading report generated by Visagraph.


![[PPT]Weber: Health Assessment in Nursing - Lippincott …downloads.lww.com/wolterskluwer_vitalstream_com/sample... · Web viewWeber: Health Assessment in Nursing Subject Chapter 13:](https://img.pdfslide.us/doc/110x75/5b389c917f8b9a4b0a8be181/pptweber-health-assessment-in-nursing-lippincott-web-viewweber-health.jpg)