Embed Size (px)
Citation preview


Contents
Our Vision 2
Financial Highlights 3
Chairman’s Review 4
Management Discussion and Analysis 8
Board of Directors 20
Management Team 22
Sustainability Report 26
Enterprise Governance 34
Risk Management 43
Financial Information
Annual Report of the Board of Directors 49
Audit Committee Report 54
Statement of Directors’ Responsibilities in
Relation to the Financial Statement 56
Independent Auditors’ Report 57
Balance Sheet 58
Income Statement 59
Statement of Changes in Equity 60
Cash Flow Statement 61
Accounting Policies 63
Notes to the Financial Statements 70
Your Share in Detail 86
Decade at a Glance 88
Key Figures & Ratios 89
Group Real Estate Portfolio 89
Glossary of Financial Terminology 90
Notice of Meeting 91
Notes 92
Form of Proxy 95
Corporate Information Back Inner Cover
95

Annual Report 2010 / 2011
We transformed ourselves, revitalizing our brand to make it more relevant to a new generation of consumers. We built upon our strengths, providing the best quality products filled with goodness and great taste at all times. Being innovative and progressive while reaching to the most discerning consumer preferences in everything we do sets us apart from all others in the market.
Whether it’s through introducing a range of new tastes and flavours or being ‘Lankan to the last drop’, we have always been one step ahead in the industry. Our natural goodness has resonated with the public and they have embraced our new look, with which we hope to revolutionize the market. Our youthful, innovative take on consumables mean that we are moving forward, into new prospects with a new outlook. It’s in with the new and in with excellence.

2
OurVision
Our passion is to deliverpleasure and nutritionthroughout people’s lives,through exciting andsuperior products, wheneverand wherever they chooseto eat and drink

Annual Report 2010 / 2011
3
Financial HighlightsGroup 2011 2010 Change
Earnings Highlights and RatiosGross Revenue Rs.’000s 17,658,598 15,322,957 15%Net Revenue Rs.’000s 16,637,198 14,363,301 16%Profit from operating activities Rs.’000s 572,776 541,864 6%Profit before Tax Rs.’000s 482,982 420,151 15%Profit after Tax Rs.’000s 199,536 228,874 -13%Earnings per Share Rs. 9.24 10.60 -13%Interest Cover No. of Times 6.38 4.45 43%Return on Total Assets % 2.47 3.56 (1.09)Return on Capital Employed % 5.63 8.92 (2.95)Return on Equity % 4.39 8.68 (4.29)
Balance Sheet Highlights and RatiosTotal Assets Rs.’000s 9,639,855 6,486,438 49%Total Debt Rs.’000s 2,062,653 975,171 212%Net Debt Rs.’000s 1,989,670 847,168 235%Total Shareholders’ Funds Rs.’000s 4,448,641 2,637,341 69%Net Assets per Share Rs. 205.96 122.10 69%Debt / Equity % 46.37 36.98 9.39 Debt / Total Assets % 19.69 15.03 4.66
Market / Shareholder InformationMarket Price of Share as at 31st March Rs. 750.60 172.00 336%Market Capitalisation Rs.’000s 16,212,960 3,715,200 336%Price Earnings Ratio (PER) No. of Times 81.26 16.23 401%Dividends per Share (Gross) - Paid Rs. 4.00 4.00 0%Dividends Payout Ratio % 43.30 37.75 5.55 Dividend Yield % 0.53 2.33 (1.79)Total Shareholder Return % 338.72 153.24 185.48
OtherTotal Value Added Rs.’000s 4,296,343 3,918,242 9.6%Government Rs.’000s 1,910,171 1,799,633 6.14%Employees Rs.’000s 1,658,500 1,402,863 18.2%Paid to Shareholders as Dividend Rs.’000s 86,414 86,414 -Retain within the Business Rs.’000s 551,464 519,867 6.01%
0
200
400
600
1,200
07 08 09 10 11
Net Revenue & Revenue to State
0
3,000
18,000
800
6,000
9,000
12,000
15,000
Gross Turnover (Rs. ‘000)Turnover Based Taxes (Rs. ‘000)
1,000
0
10%
20%
50%
07 08 09 10 11
Earnings Per Share Vs Dividend Pay Out
0
4
14
30%
6
8
10
12
Earnings per Share (Rs.)Dividend Payout (%)
40%
2
07 08 09 10 11
ROE Vs ROCE
0
25
5
10
15
20
Return on Equity (%)Return On Capital Employed (%)

Ceylon Cold Stores PLC (PQ4)
4
Chairman’s Review
I am pleased to present to you the Annual Report together with the Financial Statements for the year ended 31st March 2011.
The country’s macro indicatorsWith the end of the war in 2009, the country has seen an up-tick in economic activity and development. The forecasted GDP growth of 8% was achieved in 2010 and GDP growth of 8.5% is expected in 2011. Inflation was contained at mid-single digit levels, resulting in lower interest rates. There was a reduction of import duties on several consumer items, while the Sri Lankan Rupee was stable against the US Dollar.
Beverages and frozen confectioneryManaging our brands received top priority during the year under review. Pursuant to extensive consumer research, we decided to revitalize the Elephant House brand in July 2010 with a ‘new look’, while protecting its’ core values. The brand revitalization was followed in December 2010 with the launch of KIK Cola. Over the years the Cola flavour had captured a fair segment of the carbonated soft drinks market and your company was of the view that it was the right time for the Elephant House brand to enter the Cola market with our own. The initial sales volumes have been in line with expectations and the company received many plaudits for the launch campaign. Our range of soft drinks competes with international brands and this year too we have been successful in retaining our market leadership. The introduction of KIK Cola has helped us to increase the lead.
Both the beverages and frozen confectionery business saw a double digit growth in volumes. Volume growth in the North and East, markets where we now have unhindered access, contributed to the overall growth in volumes. Investment in the new stick machine gave us the capability to increase capacity and introduce a range of new products to the market. With the addition of the new production capacity, we quadrupled the range and the production capacity in the impulse ice cream category.
Retail BusinessThe post war positivism also had a favourable impact, on the Retail business. More customers upgraded their shopping to Modern Trade and our supermarkets benefitted from this and recorded a double digit growth in the customer numbers that patronized our stores.
To cater to the modern customer who is now looking for more convenience and choice, the Retail business ventured into operating Neighbourhood Malls and Departmental Stores, the first of which was opened in Moratuwa under the brands K Zone and KEKO respectively. The initial response from customers has been very positive. We hope to expand further in these two models in addition to large format supermarkets.
Financial performanceAt a Company level our revenue increased by 21% to stand at Rs. 6.4 billion, a significant improvement over last year. Through prudent cost management initiatives, some what we reduced the impact of cost increases in key raw materials and managed to maintain selling prices at competitive levels, for most of the year.
Profit before tax increased to Rs. 490 million, a growth of 4.5%, despite heavy expenditure on revitalization of the Elephant House brand and the KIK Cola launch, while profit after tax at Rs. 253 million was 9% below last year.
Our 100% owned subsidiary company Jaykay Marketing Services (Pvt) Limited engaged in the operation of supermarkets also saw growth during the year with revenue increasing by 13% to Rs. 10.3 billion, up from Rs. 9.1 billion posted last year. The loss before tax at Rs. 8 million was an improvement from the previous year loss before tax of Rs. 49 million.
Your Board has approved and paid a first and final dividend of Rs. 4.00 per share for the year under review.

Annual Report 2010 / 2011
5
We are confident that the investment we made in revitalizing the Elephant House brand will continue to provide the impetus for growth in volumes and profitability in the coming year.
The Board of Directors has recommended to the shareholders that the Company raise capital by way of a 1 for 10 Rights Issue at Rupees Three hundred (Rs. 300) per share and after the listing of the shares arising form the right issue, the ordinary shares in issue be subdivided in the proportion of four (4) ordinary shares for one (1) ordinary share.
Future prospectsWe are confident that the investment we made in revitalizing the Elephant House brand will continue to provide the impetus for growth in volumes and profitability in the coming year. Our plans for both beverages and frozen confectionery include increasing our range of products to give our consumers a choice and stay ahead of competition both in our offerings and market share. Several investments have been approved and some are under consideration to increase capacity and capability.
We will continue to invest in adding outlets to our supermarket chain in selected locations meeting the criteria we have set out for opening of new locations.
ConclusionI take this opportunity to thank our loyal clientele, our reliable business partners and our staff at all levels who have delivered quality customer service. I would also like to extend my sincere appreciation to my colleagues on the Board for their guidance and support during the year.
Finally, I wish to acknowledge all our shareholders for continuing to have confidence in us and look forward to your continued support in the year ahead.
Susantha RatnayakeChairman
25th May 2011

Ceylon Cold Stores PLC (PQ4)
6
Cream Soda, our flagship brand has been
successful in winning the People’s Most
Popular Beverage Brand, at the Peoples
Awards organized by the Sri Lanka
Institute of Marketing and The Neilsen
Company for four consecutive years. This
year too we were awarded the same title
as a joint winner in the category.
New Feel

Annual Report 2010 / 2011
7
Ceylon Cold Stores PLC (PQ4)
8
Management Discussion and Analysis
Operating EnvironmentThis was the first full year of peace after the end of the conflict in May 2009 and as envisaged, Sri Lanka strengthened the resilience it had showcased over those years to build a strong and solid trajectory of growth in this year. The forecasts for the country’s Key Performance Indicators were met, as was the GDP of 8% envisaged. While inflation and interest regimes were kept in check on the ground sentiment became more positive and investor confidence increased.
Key growth industries like tourism and agriculture gained with tourism having a record breaking year and related industries therefore echoing similar benefits. Hence, as expected, the Food and Beverage sector benefited both in terms of increased consumer demand and access to new markets in the North and East. The growth momentum experienced during the first two quarters slowed during the latter part of the year due to heavy rainfall island wide and floods in certain parts of the Country.
A new look for Elephant HouseHaving seen the positivity that prevailed since the return to peace, we were confident that some of the preparatory trusses we had implemented prior were now ready to be brought to fruition. One of these was the rejuvenating the Elephant brand and make it relevant to a new generation of consumers while retaining its values of trust and goodness.
The strategy backed by consumer research was to position Elephant brand in order to align with the aspirations of our consumers. The new logo was launched in July 2010 through mass media supported by outdoor signage, branding on shop facia in the general trade. The packaging too was aligned to the new look and feel of the brand.
Our post launch research confirmed that revitalization of the brand was a success. The growth in sales ahead of the market was an indication of the consumer acceptance of our brand values and the new range of products introduced.
This was further evidenced in the research conducted by Brand Finance with the Elephant House brand being rated AA and the brand rating moving up five places from the previous year.
Beverages After several years, it was encouraging to see the industry growth for carbonated soft drinks having a jump start with impressive volume growth in excess of 20% in the first two quarters. However the inclement weather that followed resulting in extensive floods in several areas in the Country dampened this growth and the year ended with an overall increase of 17%.
Retaining market leadership is not easy in an intensely competitive environment therefore a number of initiatives introduced during the year assisted us in further augmenting this position, gaining further momentum into our brand and increasing our market share and retain leadership.
We have consistently retained consumer interest through product innovation, promotions and market activations. The brand and our range of rainbow flavours in soft drinks which include Necto a raspberry flavour, cream soda, orange crush, a ginger beer made of natural ginger and probably one of its’ kind in the world continue to be popular among our consumers. An island wide distribution network supported by a sales team covering all provinces give us the competitive edge.

Annual Report 2010 / 2011
9
During the year we further consolidated our presence in the north and the east and our efforts were handsomely rewarded with significant growth in volumes during the year. During the period of the conflict our products were available in the north and the east in limited quantities and the full potential was never realized. During last year we built our distribution network, strengthened emerging retail business to make our products available to cover all parts of the North and the East. The response from the consumers was extremely good and despite the lag in time the strength of the brand was evident in terms of particular flavours in the range which has traditionally performed well in this market showing signs of a strong comeback.
With the launch of KIK Cola in December 2010, we entered the cola flavour segment hitherto dominated by one multinational brand. KIK Cola is marketed in four pack sizes including returnable glass and PET bottles. Our Cola brand is positioned to meet the aspirations of a modern consumer while emphasizing strong local values with a tag line, “Lankan to the last drop”. The new design introduced for the glass bottle was a hit among the consumers. The product itself has had high acceptance in terms of both quality and taste. KIK cola is available island wide supported by a communication campaign that
reached our target segment in all provinces in the country. The post launch feedback done in March 2011 confirmed that the objectives of the launch had been achieved successfully.
We are currently in the development process of extending our beverage portfolio. Research and development and pilot tests are being conducted to move beyond the carbonated segment.
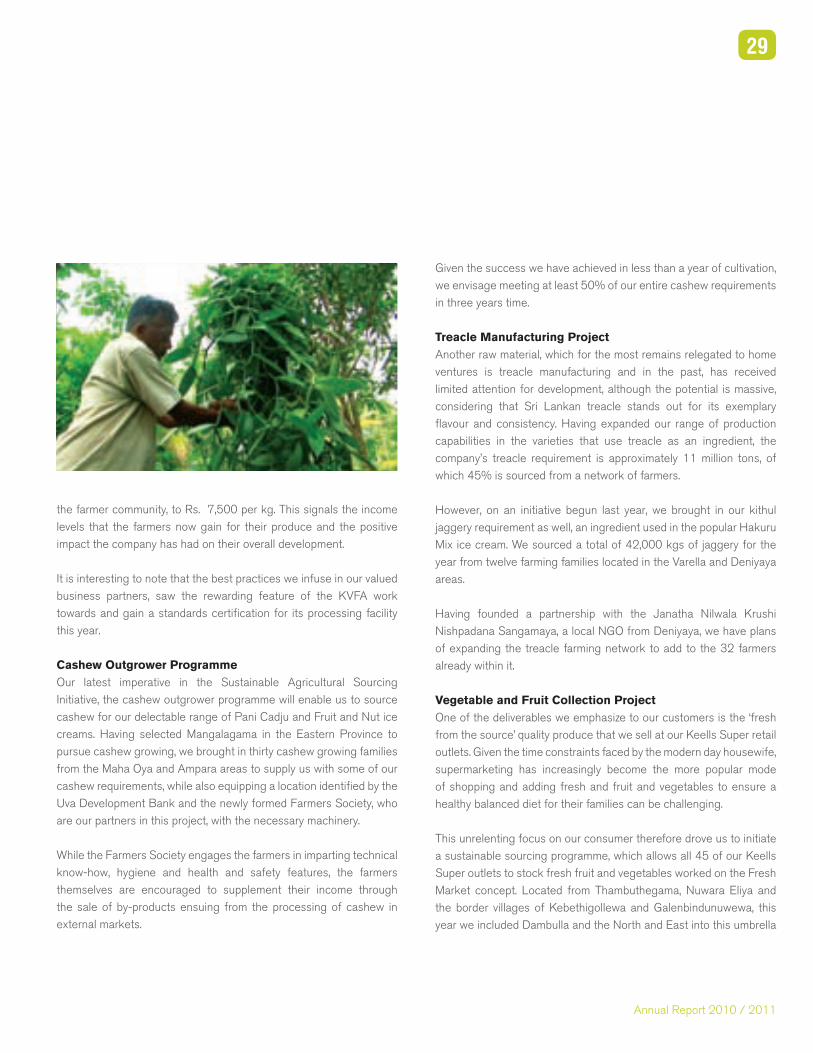
Our 400ml glass bottle which has remained in the current shape for over 50 years was subjected to a design change to make it more appealing and to align it to our brand values identified through consumer research. Cream Soda is now available in this new bottle and the growth in flavour volume is a positive indication.
Cream Soda, our flagship brand has been successful in winning the People’s Most Popular Beverage Brand, at the Peoples Awards organized by the Sri Lanka Institute of Marketing and The Neilsen Company for four consecutive years. This year too we were awarded the same title as a joint winner in the category.
Frozen ConfectioneryOur growth in volumes at 18% in the frozen confectionary category was significantly above the market. The take home segment which accounts for nearly 76% of the total volumes grew at a faster pace while the impulse range volumes also grew at a satisfactory level. The price adjustments that were taken in the final quarter of the previous financial year were maintained during the year despite an increase in our raw material costs and other overhead increases. This strategy whilst impacting our profitability target enabled the brand to increase its market share. The volume contribution from the North and East continued to increase while the brand penetration in these areas also increased with deep freezer placements and new outlets opened.
In December 2010, we commissioned a new machine to increase both the range and manufacturing capacity for impulse products in ice creams and water ice. With the introduction of nine new stick products into the market, we strengthened our leadership position in this category too.
Our seasonal products targeting the holiday season during Christmas continue to grow our volumes and increase our brand loyalty. Last

Ceylon Cold Stores PLC (PQ4)
10
year, we introduced the Trio slice and Winter Slice, a delightful combination of ice cream to be served in slices. During the year we launched Pistachio Ice Cream and Anodha ice cream which is a fruit based (soursoup) ripple ice cream.
Our marketing and promotional campaigns to a great extent relied on the brand revitalization which saw a significant awareness on the brand and our product portfolio. Having repositioned the brand as one that is contemporary and aligned to the modern day consumer labeling and packaging too took on similar hues of modernity highlighting the natural goodness of the product. We augmented our communication campaigns with focused advertising on the niche products, namely the Vanilla Lite and Chocolate Lite products, catering to a more health conscious urban market. Dairy Elephant House Pasteurized Milk is an extremely popular product available in the modern trade and sold in schools and institutions. With the expansion of the dairy industry this segment has growth potential. We are looking at options to play a bigger role in this sector leveraging our brand and distribution network. We still have a home delivery service within the city of Colombo. The milk for our Ice Creams and the ready to drink packs is sourced from the Maskeliya / Hatton region.
Retail BusinessThe post conflict positivism also had a favourable impact on the Retail business. More customers upgraded their shopping to Modern Trade and our subsidiary company, Jaykay Marketing Services (Pvt) Ltd, under which the supermarkets are operated, recorded a double digit growth in the customer numbers that patronized its stores.
The Company expanded its chain by opening two new outlets during the year in Matara in October 2010 and in Moratuwa in January 2011.
Identifying the specific needs of customers to shop in one place, have convenience of access and the need for a place to spend time together with the family, the Company ventured into Neighbourhood Malls and the first of its kind was opened in Moratuwa under the brand ‘K Zone’. Along with the opening of K Zone the Company also launched into the business of Department Stores under the brand ‘KEKO’. The first KEKO Department Store which was opened at K Zone in Moratuwa has received a very positive response from customers in and around Moratuwa. Encouraged by that, the Company plans to expand this format further in the future.
During the year under review the Company added another collection centre in Embilipitiya to its network of collection centres that collects vegetables and fruits directly from the farm gate. The Company continues to work closely with farmers, providing assistance to them in various ways, to ensure that they cultivate the required crops at the expected quality levels.
In order to further improve on efficiencies the retail business moved to SAP Retail which now powers the inventory system and the Central Distribution Centre. The front end Point of Sale system too was changed to an internally developed software which enables the Company to understand and service the customer better and cater to their specific needs in a more personalized manner.
Export MarketsElephant House drinks are available in a number of ethnic shops in the UK, Europe, Australia and in the Middle East. Although primarily to serve the Sri Lankan expatriate community in those countries,
Management Discussion and Analysis
One of these was the rejuvenating the Elephant brand and make it relevant to a new generation of consumers while retaining its values of trust and Goodness.

Annual Report 2010 / 2011
11
Whether you’re calorie conscious or
on a strict diet, you need not ig
nore
the ice cream craving with our range
of balanced Lite ice creams which
have the identical creamy taste of our
normal ice creams but with no sugar
and far fewer calories. Comes in two
variants Vanilla Lite and Choco Lite.
New Markets

Ceylon Cold Stores PLC (PQ4)
12
our ginger drink has also been popular among some of the local consumers in some of these countries as well as in India. Our range of frozen confectionery has been marketed in the Maldives over the past ten years. Male has proved to be a great success story with a 47% market share for our brand.
During the year our overall export revenue increased by 26%.
Supply Chain Our manufacturing process conforms to ISO 9000 and 22000 and SLS standards, our state of the art filling lines were supplemented by a PET blowing plant. The returnable glass bottles are purchased locally.
Our capacity and capability to introduce a variety of impulse products in the frozen confectionery category was enhanced with the commissioning of an automated line in December 2010.
The initiative to reduce our energy cost and reduce our carbon footprint is making good progress.
Once again the Company benefitted from the long term contracts entered in to for the supply of sugar and skimmed milk powder and shielded itself from the sharp rise in world prices.
The significant increase in volumes of both the carbonated soft drinks and frozen confectionery were met on a timely basis. However, increase in frozen confectionery take-home capacity and storage for both categories have been identified for the new financial year to cater for future growth in volumes.
Employee RelationsThe Company subscribes to the principle of collective bargaining and entered in to a new collective agreement with the worker unions during the year. The traditional Cost of Living Index related payments were delinked from the new agreement and a gain share concept was introduced enabling the non executive employees to be incentivized based on improving Company performance.
Achievements Elephant House Cream Soda, our flagship brand has been
successful in winning the People’s Most Popular Beverage Brand, at the Peoples Awards organized by the Sri Lanka Institute of Marketing and The Neilsen Company for four consecutive years. This year too we were awarded the same title as a joint winner in the category.
The Company established its stature for consistency and quality in financial reporting by winning the Gold award for the best Annual
0
500
1,000
1,500
2,000
07 08 09 10 11
Overhead Cost AnalysisRs. ‘000
Administration CostDistribution CostFinance Cost
0
500
1,000
1,500
2,500
07 08 09 10 11
Net Turnover and Gross profitRs. ‘000
0
3,000
18,000
2,000
6,000
9,000
12,000
15,000
Gross profit Net Turnover
0
0.30
0.40
0.50
0.60
07 08 09 10 11
Liquidity & BorrowingsRs.
0
0.05
0.30
0.50
0.10
0.15
0.20
0.25
Quick RatioDebt/Total Assets
0.20
0.10
Management Discussion and Analysis

Annual Report 2010 / 2011
13
Report 2010 in the Food and Beverages sector presented by the Institute of Chartered Accounts of Sri Lanka for the fourth consecutive year.
The Company won the merit award in large scale category - Manufacturing sector at the Sri Lanka National Energy Efficiency Award 2010 conducted by Sri Lanka Sustainable Energy Authority in recognition of their contribution to reduce energy through energy management effort.
In the NCE export awards organised by the National Chamber of exporters in Sri Lanka, the Company was awarded Bronze for the year 2009 in the Agriculture and Value Added Sector - Extra Large category.
The Future in FocusWe anticipate a good year ahead given that macro indicators all point towards a growth trajectory which will undoubtedly accelerate given the trends we have observed this year. Having always been a Company that was pragmatic and had thus instituted the necessary fundamentals in place to ensure a consistent growth curve, we do believe that the foundation we laid this year, vis a vis strategic investment in the manufacturing process, the brand revitalization and astute product enhancements and additions, will augur well for the journey ahead.
From a carbonated soft drinks consumption perspective, Sri Lanka continues to be relatively low with a per capita consumption of 7.5 liters compared to that of developed economies in South East Asia, although we are hopeful that this trend will gradually change. This is evidenced by the fact that we achieved the highest literage in average per capita this year, an assured feature that Sri Lankans will begin consuming more soft drinks in the coming year.
0
80
120
160
240
07 08 09 10 11
Net Asset Per Share Vs. Market Price Per ShareRs.
0
300
800
200
400
500
600
700
Market Price Per ShareNet Asset Per Share
40
200
100
07 08 09 10 11
EarningsRs.
0
2,500
500
1,000
1,500
2,000
Gross ProfitEarnings Before Interest & TaxProfit After Tax
0
2
4
6
8
07 08 09 10 11
Interest CoverTimes

Ceylon Cold Stores PLC (PQ4)
14
With a conscious effort on ensuring that we continue to strengthen our market leadership, the R&D processes that we infused this year will see fruition with a number of products being added to our portfolio, in both beverages and frozen confectionery. In beverages our rainbow range will gain more strength with a few more being added to the product range while, with the success of our maiden Cola beverage KIK, we envisage introducing KIK Diet Cola also to the market.
Ice cream continues to be driven by consumption patterns that are linked heavily to the consumer psyche. Even though Sri Lanka is a tropical country, consumers purchase ice cream only for special occasions as the dessert culture is not yet prevalent among most social segments. With marked advertising and promotions, we aim to change this mindset, where consuming frozen confectionery will become habitual rather than occasional. We will continue to drive the concept of affordability, giving consumers various pricing and packaging options that will eventually herald a mindset transformation.
In line with the global trend in enabling a common language for financial reporting, the Institute of Chartered Accountants of Sri Lanka have taken steps to adopt International Financial Reporting Standards (IFRS) by issuing new accounting standards comprising of Sri Lanka Accounting Standards (SLFRS) and Lanka Accounting Standards (LKAS) for annual financial periods beginning on or after 1 January 2012. The adoption of SLFRS and LKAS would have an
impact on the reported financial results of the Group, the impact of which is being presently evaluated.
The Group is proposing to adopt SLFRS & LKAS for the financial period beginning 1 April 2012 and will present the Financial Statements for the year ending 31 March 2013 using SLFRS and LKAS.
Financial Performance ReviewTurnoverAt a Company level, turnover increased by 21% to Rs. 6.4 billion (Rs. 5.3 billion in 2009/2010). A significant part of the turnover increase was due to increase in volumes in both the beverage and frozen confectionary categories.
The increase in turnover at the Subsidiary Company was due to a combination of increased customers at existing stores as well as the addition of two new outlets to the network.
At a consolidated level Group turnover increased by 16% to Rs. 16.6 billion (Rs. 14.4 billion in 2009/2010).
Cost of Sales and Gross ProfitA Sharp increase in imported raw materials such as sugar and skimmed milk powder and local raw materials such as fresh milk and cashew resulted in a sharp increase in our manufacturing costs which
0
30
40
60
90
07 08 09 10 11
Price Earnings Ratio (No. of Times)
80
20
10
50
70
0
100
150
200
300
07 08 09 10 11
Profit After Tax & Dividend PaidRs. ‘000
250
PATDividend Paid
50
0
6,000
12,000
15,000
18,000
07 08 09 10 11
Net Revenue Vs Working Capital RequirementRs.
0
300
700
400
500
600
Net RevenueWorking Capital
3,000
200
100
Management Discussion and Analysis

Annual Report 2010 / 2011
15
were not passed on to our consumers. This resulted in a 3% decline in the gross profit margin. However increase in petroleum prices caused an increase in our distribution costs as well as packaging material forcing the Company to increase the prices of both Beverages and Frozen Confectionary products during the last quarter to arrest the drop in gross profit margin and improve the overall profitability.
As in the previous years the Company engaged in forward supply contracts with suppliers of key raw materials, imported and local that helped to reduce the impact of the increase in raw material cost whilst also ensuring a constant supply. Although the Company continued to engage in the energy saving initiatives the significant increase in electricity tariffs resulted in a 20% increase in our total energy cost.
The Subsidiary Company also managed to improve their gross profit margins as a result of the change in its sales mix as well as volume discounts received on suppliers.
The overall gross profit margin at a Group level remained unchanged during the year at 12.5% despite the drop at the Company level.
Distribution ExpensesDistribution expenses include the cost incurred in distribution of products, advertising and promotions undertaken to increase sales volumes and customer counts at the supermarkets and the payroll and related costs of the sales and marketing personnel.
Selling and Distribution Expenses at Company level increased by 30% due to the expenditure incurred on the Corporate Revitalisation campaign and the mega launch of the KIK Cola the new cola flavour introduced by the Company. The expenditure was on account of positioning the brand, creating brand recall in the minds of the consumers both in terms of “above the line” and “below the line” activities. Investment was also made in terms of several consumer promotions and providing name boards to our valued retail shop customers. The limitations on full deductibility of advertising spend, for tax purposes; continue to adversely affect the Company since this expenditure is an essential part of building and sustaining our brands on the longer term. The Company welcomes the proposal made in the last year Fiscal budget to reduce the percentage added back from 50% to 25% as it will enable us to invest more effectively on brand building.
Administrative and Other Operating ExpensesAt both Company level as well as at the Subsidiary, administrative costs were kept below inflation due to strict cost control measures.
At Company level other operating expenses increased by 11% largely as a result of the Nations Building Tax (NBT) which increased from Rs. 133 million last year to Rs. 151 million in the current year.
Other operating expenses of the Subsidiary Company also increased by 88% as Nation Building Tax replaced turnover tax effective 01st January 2011 and NBT being accounted under other operating expenses as opposed to being deducted from turnover.
Finance Costs and Interest CoverDuring the year under review, interest rates were at a lower rate and both the Company and the Subsidiary attracted favorable interest rates from the financial institutions, at low premiums to SLIBOR, leveraging on the Company’s financial strength. Once again borrowings were structured utilizing a mix of both fixed and variable interest rate instruments to ensure that the financial impact due to volatility in the capital market was mitigated.
The cost of financing at Company level declined to Rs. 40 million (Rs. 68 million 2009/2010), as a result of lower interest rates despite the increase in borrowings.
At a consolidated level the Group’s interest cost reduced to Rs. 90 million (Rs. 122 million in 2009/2010).
The Group interest cover was 6.4 times (4.4 times 2009/2010), whilst at Company level it was 13.4 times (8 times in 2009/2010).
Profit from Operating ActivitiesDespite a significant revenue growth of 21%, the increase in raw material costs and a significant increase in distribution expenses resulted in the Company posting an Earnings from operating activities before interest and tax (EBIT) of Rs. 531 million compared to a EBIT of Rs. 537 million in the previous year.
The Subsidiary was able to bring down their losses from Rs. 49.4 million to Rs. 8 million during the year under review.

Ceylon Cold Stores PLC (PQ4)
16
At a consolidated level EBIT increased by 6% to record Rs. 573 million compared to an EBIT of Rs. 542 million in the previous year.
TaxationThe tax charge for the year at the Company was Rs. 238 million (2009/2010 Rs. 189 million) - an effective tax rate of 49% which is an increase of 9% compared to last year. The restriction on the claim of advertising expenses for tax purposes to 50% of the expense incurred together with the disallowance of 2/3 of the cost of NBT continued to adversely affect the Company.
The Group Income Tax charge for the year was Rs. 283 million (2009/2010 Rs. 191 million).
Financial Position – Balance SheetShareholders’ FundShareholders’ funds at the Company level increased significantly to Rs. 4.6 billion as compared to Rs. 2.8 billion in the previous year as result of the revaluation surplus arising on the freehold land at Glennie Street and Justice Akbar Mawatha, Colombo 2 and an increase in retained earnings.
As at the Balance Sheet date the total shareholders’ funds at a consolidated level was Rs 4.4 billion (2009/2010 Rs. 2.6 billion)
Asset BaseThe Company revalued the freehold land at Glennie Street and Justice Akbar Mawatha and a surplus of Rs. 1.7 billion contributed to the increase in the asset base. The Company also invested Rs. 750 million on capital expenditure whilst Rs. 147.8 million of depreciated assets and bottle breakages were written off during the year. The revalued freehold land was reclassified as Investment Property. The total depreciation charge amounted to Rs. 259 million. Current Assets of the Company increased by Rs. 352 million as result of the increase in trade receivables and inventories due to increased trading volumes.
Property Plant and Equipment at the Subsidiary increased by Rs. 502 million as a result of the increase in outlet network whilst assets were depreciated by Rs. 167 million during the year. Current assets too increased by Rs. 274 million as a result of the increase in inventories and trade receivables due to increased trading volumes.
At a consolidated level the Group total asset base amounted to Rs. 9.6 billion from Rs. 6.5 billion in the previous year.
At Group level the short term borrowings and Bank Overdrafts have significantly increased as a result of increase in inventories, trade and other receivables and funding of capital expenditure on short term borrowings. We are of the view that this trend will not continue and the Group will improve its working capital to reduce the borrowing and over drafts.
Cash Flow and LiquidityThe Company’s key sources of finance for the year under review were cash generated from operations and an effective combination of long term and short term borrowings. The Company ensured the adequacy of liquidity to service debt and meet future working capital, capital expenditure and dividend payment requirements.
The Company operates its own treasury function assisted by the Treasury division of John Keells Holdings PLC based on the policies and plans approved by the Board. Our Treasury manages a variety of market risks, including the effects of changes in foreign exchange rates, interest rates and liquidity. Further details of the management of these risks are given on page 45. The CCS Treasury’s role is to ensure that appropriate financing is available for all value-creating investments. Additionally, the treasury delivers financial services to allow the Company to manage their financial transactions and exposures in an efficient, timely and low-cost manner.
Cash flow from operating activities of the Group increased to Rs. 1,073 (Rs. 1,046 million in 2009/2010) whilst at Company level it amounted to Rs. 852 million (Rs. 876million in 2009/2010). Cash generated from operations of the Group inclusive of working capital changes reduced to Rs. 620 million in the current year (Rs.1,422 million 2009/2010) whilst at Company level it was Rs. 456 million in comparison to Rs. 1,157 million in the previous year. Increase in inventories and trade and other receivables both at the Company and the Subsidiary resulted in this decrease.
The total net borrowings at a Group level including overdrafts net of cash increased during the year to Rs. 1,990 million (Rs. 847 million 2009/2010) as at the Balance Sheet date whilst at Company Level it increased to Rs. 938 million against Rs. 199 million in the previous
Management Discussion and Analysis

Annual Report 2010 / 2011
17
New Products
year. This increase was due to the capital investments and an increase in working capital both at the Company and the Subsidiary. Accordingly, the Gearing Ratio at the Company Level stood at 19% and at the Group level was 46%
Ceylon Cold Stores PLC and Jaykay Marketing Services (Pvt) Ltd are satisfied that their respective financing arrangements are adequate to meet the working capital needs for the foreseeable future. The Board of Directors have also recommended to the shareholders that the Company raise Rs. 648 million by way of a Right Issues to meet part of the future Capital Investments plans of the Company and the Subsidiary.
Shareholder Value The Company’s strategic priorities are primarily focused on delivering shareholder value through the achievement of sustainable, capital efficient and long term profitability growth.
The basic Earnings per Share (EPS) for the Group was at Rs. 9.24 (Rs. 10.60 - 2009/2010).
The Group net assets per share at book value stood at Rs. 205.96 (Rs. 122 - 2009/2010) whilst at Company Level it stood at Rs. 216 (Rs. 129 - 2009/2010).
The Company’s share price as at 31 March 2011 was Rs. 750.60 moving within a range of Rs. 150 to Rs 850 during the year.
The market capitalization of the Company, as at the year end was Rs. 16.2 billion. (Rs. 3.8 billion 2009/2010)
Return on Equity (ROE) for the Group stood at 6% (9% -2009/2010) and for the Company at 7% ( 10 % - 2009/2010) whilst Return on Capital Employed (ROCE) was 11.32% as against the 14.27% in last year at Group level.
A first and final dividend of Rs. 4 per share (2009/10 Rs. 4 per share) amounting to a total payout of Rs. 86.4 million (2009/2010 Rs. 86.4 million) was approved by the Board of Directors and were paid on 23rd May 2011.

18
With the launch of KIK Cola in
December 2010, we entered the cola
flavour segment hitherto dominated
by one multinational brand. KIK Cola is
marketed in four pack sizes including
returnable glass and PET bottles.
New Identities

19

Ceylon Cold Stores PLC (PQ4)
20
Board of Directors
Susantha Ratnayake
Non Independent - Non ExecutiveChairman
Mr. Ratnayake was appointed to the Board of Ceylon Cold Stores PLC from 01st October 2002 and was appointed as Chairman in January 2006.
Mr. Ratnayake was appointed as the Chairman and CEO of John Keells Holdings PLC in January 2006 and has served on the JKH board since 1992/1993. He is also the Chairman of many of the listed and un-listed companies within the Group. He is a council member of the Employers’ Federation of Ceylon, serves on various clusters of the National Council of Economic Development (NCED) and is the Vice Chairman of the Ceylon Chamber of Commerce as well as the Chairman of the Sri Lanka Tea Board. He has over 33 years of management experience, all of which is within the John Keells Group.
Ajit Gunewardene
Non Independent – Non Executive, Director
Mr. Gunewardene was appointed to the Board of Ceylon Cold Stores PLC from 01st October 2002.
Mr. Gunewardene is the Deputy Chairman of John Keells Holdings PLC and has been a member of their Board for over 18 years. He is a Director of many companies in the John Keells Group and is the Chairman of Nations Trust Bank PLC and Union Assurance PLC. He is a member of the board of Nanco (Pvt) Ltd, a company established for the development of Nanotechnology in Sri Lanka under the auspices of the Ministry of Science and Technology. He has also served as the Chairman of the Colombo Stock Exchange. Ajit has a degree in Economics and brings over 29 years of management experience.
Ronnie Peiris
Non Independent - Non Executive, Director
Mr. Peiris was appointed to the Board of Ceylon Cold Stores PLC from 01st June 2003.
Appointed to the John Keells Holdings PLC Board in 2002/03, Ronnie Peiris has overall responsibility for the Group’s Finance and Accounting including Taxation, the Information Technology function and Group Initiatives. He was previously the Managing Director of Anglo American Corporation (Central Africa) Limited in Zambia.
Mr. Peiris has 40 years of finance and general management experience in Sri Lanka and abroad. He is a Fellow of the Chartered Institute of Management Accountants, UK; Association of Chartered Certified Accountants UK and the Society of Certified Management Accountants, Sri Lanka and holds an MBA from the University of Cape Town, South Africa. He is a member of the committee of the Ceylon Chamber of Commerce, Chairman of its Taxation Sub Committee and also serves on its Economic, Fiscal and Policy Planning Sub Committee. He is the Vice President of the Sri Lanka Institute of Directors.
Jitendra Gunaratne
Non Independent - Executive, Director
Mr. Gunaratne, is the President of the Consumer Foods sector of the John Keells Group and was appointed to the Board of Ceylon Cold Stores PLC in 2004/2005
Prior to his appointment as President, he overlooked the Plantation and Retail sectors. His 30 years of management experience in the Group also covers Leisure and Property. Jitendra holds a diploma in marketing and serves as a member of the advisory committee on consumer affairs of the Ceylon Chamber of Commerce.

Annual Report 2010 / 2011
21
Rasakantha Rasiah
Independent Non Executive, Director
Mr. Rasakantha Rasiah was appointed to the Board of Ceylon Cold Stores Ltd, from 1st July 2005. He is the Chairman of the Audit Committee of the Board of Directors.
He is a graduate of the University of Ceylon and a fellow member of the Institute of Chartered Accountants of Sri Lanka. He brings to the Board a wealth of experience in the FMCG industry. He has wide experience of over 30 years in the industry both locally and overseas. He was the former Finance Director of Nestle Lanka PLC, holding the position for over a decade. He was also a visiting lecturer in “Finance and Accounts” for Nestle SA (international) for Africa-Asia Oceania region. He is a former President of the Benevolent Society of the Institute of Chartered Accountants of Sri Lanka.
He is also a Director of Nations Trust Bank PLC, MTD Walkers PLC, EB Creasy Group of Companies and a commercial advisor of Ceylon Pencil Co Ltd. A visiting Lecturer in Finance at the Postgraduate Institute of Management (PIM). and a keen sportsman and represented Sri Lanka at Table tennis.
Prasanna Jayawardena
Independent - Non Executive, Director
Mr. Jayawardene joined the Board of Ceylon Cold Stores PLC from 1st July 2005 and serves as a member of the Audit Committee of the Board of Directors.
He brings to the Board wide knowledge and experience in the sphere of Law. Mr. Jayawardene is an Attorney-at-Law who specializes in Commercial Law, Industrial Law, Banking Law and Intellectual Property Law. Prior to commencing practice as a Lawyer, he was at HSBC in a senior management capacity for over a decade and has extensive experience in the Banking Industry. Mr. Jayawardene is also a Director of the Environmental Foundation Ltd.
Uditha Liyanage
Independent - Non Executive, Director
Prof. Liyanage, was appointed to the Board of Ceylon Cold Stores PLC from 1st July 2005. Prof. Liyanage is a member of the Audit Committee of the Board of Directors.
He brings to the Board extensive knowledge and experience in the sphere of Marketing activities. Prof. Liyanage is a Director of the Postgraduate Institute of Management (PIM) of the University of Sri Jayewardenepura. He is a Consultant to a number of key companies and international agencies. Prof. Liyanage has published widely in reputed journals on Strategic Marketing, and addressed many international conferences on similar subject matter. He is a past Chairman of the Chartered Institute of Marketing (CIM) and former member of the International Board of Trustees of CIM.
Ceylon Cold Stores PLC (PQ4)
22
Management Team
(In alphabetical Order)
Bandara Abeysinghe - Manager Production - Frozen Confectionery
Mahendra Amarasinghe - Manager - Field Sales Frozen Confectionery
Marian Arsekularatne - Manager - R & D / Quality Control
Premananda Attanayake - Manager Factory - Frozen Confectionery
Jayathilaka Bandara - Manager - Quality Compliance
Ramses Cooray - Manager - Credit Control
Ivan Dassanayake - Manager - Essence
Ujith De Silva - Manager – Quality System
Ranjith Edirisinghe - Manager Marketing Services - Beverages
Wasanthalal Fernando - Manager National Sales - Beverages
Augustine Gunawardena - Manager - Head of Tax
Daminda Gamlath - Vice President - Head of Finance / Sector Financial Controller
Jitendra Gunaratne - President /Chief Executive Officer
Nilantha Jayasinghe - Manager - Employee Relations
Sanjeewa Jayasundara - Manager - Head of Engineering
Sanjeewa Jayaweera - Executive Vice President - Chief Financial Officer
Sasanke Jayawardane - Finance Manager - Management Accounting

Annual Report 2010 / 2011
23
Pradeep Maherambe - Manager Production - Beverages
Wasantha Malwattege - Assistant Vice President - Head of Sourcing & Procurement
Chandima Perera - Vice President - Head of Category - Beverages
Russell Perera - Manager - Regional Sales Frozen Confectionery
Niranjan Palipane - Manager Marketing - Beverages
Mithila Poholiadde - Manager - Logistics
Surani Sahabandu - Manager Marketing - Frozen Confectionery
Neil Samarasinghe - Vice President - Head of Category - Frozen Confectionery
Lakshitha Samaranayake - Manager - Human Resource
Gihan Samarakkody - Manager - Finance
Kanthi Tissakuttiarchchi - Manager - Internal Audit
Nalaka Umagiliya - Assistant Vice President - IT Business Solutions
Kamal Wickramasinghe - Manager - Engineering
Rohana Witanachchi - Vice President - Head of Supply Chain Management

Ceylon Cold Stores PLC (PQ4)
24
Elephant House Fruit and Nut Ice
Cream is a fun flavour for all ages
and a hit all year round. We’ve thrown
in real plums and cashew nuts and
pumpkin preserve in a flavourful and
yet chewy-nutty treat.
New look

Annual Report 2010 / 2011
25

Ceylon Cold Stores PLC (PQ4)
26
Sustainability Report
A Campany that has endured for nearly one and a half centuries in an environment that has become increasingly competitive and global in nature; where price and quality become the decisive factors and consumers are given choice options that are varied, diverse and multiple - this is where Elephant House, truly Sri Lankan brand excel on all counts. Enduring through time, but transforming to reflect market trends, Elephant House products have remained aligned to customer needs and spearheaded change ahead of its time to excel customer expectations. This is the sign of a sustainable brand, one that works on the multiple dynamics of stakeholder expectations to ensure that the product and therefore the company, is solidly constructed on a foundation that echoes the goals and objectives of these stakeholder expectations. If all stakeholders are imbued into the overall philosophy and culture of the company, the sustainability of the company is assured.
It is this ethos of ensuring that all stakeholders are positively impacted due to their relationship with us that forms the solid and stable foundation to our sustainability vision. So this enduring brand has consistently walked the path of responsible corporate stewardship. We have collated experience, skill, expertise, knowledge and humaneness into a single minded vision to add value to lives. We’ve remained an entity that has been one with the people where sustainability adds up to meeting the needs of the present generation without compromising
the ability of future generations to meet their own needs. We are a company that builds on a vision, mission, objectives, values and ethics to encompass our final goal of being the truss upon which the future relies on.
Driving SustainabilityOur sustainability strategy remains the foundation upon which our overall business strategy is based upon and is a solid framework that develops our priorities and action plans. This then forms the platform upon which we respond to the risks and opportunities that arise due to sustainability trends and challenges. Hence, enhancing business performance, building an open and honest culture and actively engaging with our stakeholders creates the springboard for our sustainability drive. Focusing on product excellence through innovation, being cognizant of our consumer profile, needs and expectations, inspiring and encouraging our team to journey towards a collective vision, enhancing the lives of our communities and creating value for our stakeholders by partnering them in avenues of development and working on initiatives that would reduce our carbon footprint are the multi-pronged strategies we have instituted into our sustainable development vision.
Sustainability within the Company is driven by the Head of Supply Chain Management and manned by a cross-functional team to whom sustainability remains at the core of their actions. The macro vision of sustainability however comes under the umbrella of John Keells Holdings, whose expansive sustainability development platforms form the core to our inner workings. This lends direction to our imperatives and becomes the axis upon which the cross functional Sustainability Committee plans sustainability initiatives. Regular meetings spearhead discussion on identified projects, follow up to ongoing initiatives and potential projects that can be undertaken under our banner.
Given that sustainable development is a far reaching vision that encompasses numerous facets in our stakeholder segments, we have identified several platforms that will add value to our relationships with them and set the foundation for a win-win formula for both sides. We adhere to Good Manufacturing Practices (GMP) and Good Hygiene Practices (GHP), in addition to the ISO and SLS certifications we have obtained over the years to ensure that our products conform
Our sustainability strategy remains the foundation upon which our overall business strategy is based upon and is a solid framework that develops our priorities and action plans.

Annual Report 2010 / 2011
27
to the quality expected by the consumer. This adherence cascades to our sourcing avenues, which comprises a network of farmers who are micro and small entrepreneurs through Sustainable Agricultural Sourcing Initiatives which forms the core of our sustainable development drive.
Business ContinuityQuality, Choice and Price are the three brand pillars that encompass our popular brand of beverages and frozen confectionery. Being a brand that has always met consumer expectations, we have built a strong and solid foundation of consumer loyalty that translates into notable brand equity. According to the Brand Finance collation of Sri Lanka’s most valuable brands in its annual Most Valuable Brands League, Elephant House and Keells Super have earned the commendable brand ratings of AA and AA- (minus) respectively. This is further evidence of the unequivocal consumer loyalty we have attracted to our brands over the years and that we have kept to our brand promise and brand delivery tenets.
Consumers are the key to our sustainability as a business. Our team is constantly motivated to keep this in focus, as are our suppliers. As a Company, we imbue a continuous improvement curve that’s further augmented with our stringent conformance to manufacturing practices including SLS Standards, ISO 9000 quality management system and ISO 22000 food safety management system. The constant monitoring of product quality aided by a comprehensive R&D process, which naturally permeates to a superior product delivered to our consumer.
We also remain in constant dialogue with our customers. Consumer surveys and one to one marketing exercises give us an in depth insight into their expectations from us. It was this that prompted the complete new look that was heralded this year. Elephant House was rejuvenated with a brand new logo and tag line, Good Friends – Good Times, to reflect the contemporary and discerning consumer who is our target profile. Supported by a unique communication campaign, the brand revitalization spearheaded the beginning of a new era in consumer loyalty for our brand, amply evidenced by the growth we observed in volume and revenue this year. New derivative products were added to the frozen confectionery range, while we also significantly added
to our product range in the stick segment of ice creams to give our consumers more choice.
The launch of our maiden venture into the Cola sphere with KIK – Sri Lankan to the last drop – was also readily accepted by the younger target audience and fulfilled a dearth in our beverages portfolio which otherwise, caters well to our consumers through our choice of rainbow flavours. Visibility and accessibility being key to ensuring that consumer loyalty is maintained, our communication campaigns for all products were targeted and very successful, while our supermarket chain Keells Super added to this by adding two more to its extensive retail outlet network.
With the strong presence we command in both general and modern trade, we continue to maintain our relationships with our valued business partners through dialogue and fellowship events, while also this year, equipping these retail outlets with bottle coolers and freezers to ensure that our brand promise of quality freshness remains intact.
Sustainable Agricultural Sourcing InitiativesAgriculture forms an integral economic facet to Sri Lanka’s development, although farming has always been considered a challenge to succeed in. Most farmers in Sri Lanka work in rural areas, where contemporary logistics, know-how and markets are not easily accessible. Further, they come from difficult economic backgrounds and gaining a sustainable income therefore can be challenging. But rising above these negatives is the fact that agricultural produce in Sri Lanka remains world class, blessed by fertile soil and an abundance of natural agricultural options.
Our beverages and frozen confectionery require natural components that are available in Sri Lanka. Vanilla, ginger, cashew, treacle and tropical fruit are prime examples. Having seen the potential in sourcing these from our very own farmers, nine years ago, we began a project that moved on sourcing the required ingredients from within Sri Lanka. Approaching the collective agricultural organisations and entities prevalent in the various villages, we thus began sourcing our requirements from these farmer organisations.

Ceylon Cold Stores PLC (PQ4)
28
The relationship we nurture is a two way one where while the farmers provide us with a steady supply of our raw materials, we are instrumental in creating a sustainable development platform for them to exist on. We have infused a quality consciousness in them through the permeation of best practices that we strictly adhere to in our manufacturing process; we impart technical know how and expertise on agricultural practices including farming techniques, soil and water conservation and management, fertilizer management and financing methods when necessary. Having entered into forward contracts with the farmers on a stipulated price, quantity and quality standards etched into the agreement, the farmer is assured of a guaranteed market and price for his produce. This then gives him leeway to invest further in his farm and improve his living conditions, creating an unshakeable foundation for further aspirations of betterment.
Ginger Outgrower ProgrammeWe began our foray into the Sustainable Agricultural Sourcing Initiatives with the Ginger Outgrower Programme in partnership with the Kandurata Development Bank. Today, the programme encompasses farming communities from Aludeniya, Galabawa, Poojapitiya and Udawa areas, supplying our entire requirement of ginger for the very popular EGB, which is the only commercially produced soft drink in the world to use 100% natural ginger in its manufacturing process. This year, we purchased a total of 14,760kg raw ginger from the 253 farmers within the programme.
Vanilla Outgrower ProgrammeAn impressive number of 2,500 vanilla growers supply us with our total requirement of vanilla required for the manufacture of our popular range of plain vanilla ice cream as well as the vanilla ice cream based products of Hakuru Mix, Pani Kadju, Twist range, Fruit and Nut and Winter Slice. Having brought in vanilla growers from Badulla, Matale, Kandy, Kurunegala, Kegalla and Nuwara Eliya under this programme, given that our knowledge and technical input has aided in optimizing crop production, there seems to be potential for export of this crop as well.
The Kandy Vanilla Farmers Association interacts with farmers from both micro and small levels, engaging those who are involved in home gardening as well. The successful intervention where advice and continued knowledge input has seen productivity increase especially in the smaller farming ventures, has also showcased the rewarding feature of the smaller entrepreneurs involved in home gardening especially, develop their standards of living.
The KVFA’s sustained engagement with the vanilla growers has been extensive wherein, they also engage in the collection of beans and curing them for the company to purchase. Accordingly, while the KVFA collated a total of 925 kgs of cured vanilla beans this year which is a significant increase of 438 kgs over last year’s output, the productivity increase also saw a notable increase in income among
Sustainability Report
Annual Report 2010 / 2011
29
the farmer community, to Rs. 7,500 per kg. This signals the income levels that the farmers now gain for their produce and the positive impact the company has had on their overall development.
It is interesting to note that the best practices we infuse in our valued business partners, saw the rewarding feature of the KVFA work towards and gain a standards certification for its processing facility this year.
Cashew Outgrower ProgrammeOur latest imperative in the Sustainable Agricultural Sourcing Initiative, the cashew outgrower programme will enable us to source cashew for our delectable range of Pani Cadju and Fruit and Nut ice creams. Having selected Mangalagama in the Eastern Province to pursue cashew growing, we brought in thirty cashew growing families from the Maha Oya and Ampara areas to supply us with some of our cashew requirements, while also equipping a location identified by the Uva Development Bank and the newly formed Farmers Society, who are our partners in this project, with the necessary machinery.
While the Farmers Society engages the farmers in imparting technical know-how, hygiene and health and safety features, the farmers themselves are encouraged to supplement their income through the sale of by-products ensuing from the processing of cashew in external markets.
Given the success we have achieved in less than a year of cultivation, we envisage meeting at least 50% of our entire cashew requirements in three years time.
Treacle Manufacturing ProjectAnother raw material, which for the most remains relegated to home ventures is treacle manufacturing and in the past, has received limited attention for development, although the potential is massive, considering that Sri Lankan treacle stands out for its exemplary flavour and consistency. Having expanded our range of production capabilities in the varieties that use treacle as an ingredient, the company’s treacle requirement is approximately 11 million tons, of which 45% is sourced from a network of farmers.
However, on an initiative begun last year, we brought in our kithul jaggery requirement as well, an ingredient used in the popular Hakuru Mix ice cream. We sourced a total of 42,000 kgs of jaggery for the year from twelve farming families located in the Varella and Deniyaya areas.
Having founded a partnership with the Janatha Nilwala Krushi Nishpadana Sangamaya, a local NGO from Deniyaya, we have plans of expanding the treacle farming network to add to the 32 farmers already within it.
Vegetable and Fruit Collection ProjectOne of the deliverables we emphasize to our customers is the ‘fresh from the source’ quality produce that we sell at our Keells Super retail outlets. Given the time constraints faced by the modern day housewife, supermarketing has increasingly become the more popular mode of shopping and adding fresh and fruit and vegetables to ensure a healthy balanced diet for their families can be challenging.
This unrelenting focus on our consumer therefore drove us to initiate a sustainable sourcing programme, which allows all 45 of our Keells Super outlets to stock fresh fruit and vegetables worked on the Fresh Market concept. Located from Thambuthegama, Nuwara Eliya and the border villages of Kebethigollewa and Galenbindunuwewa, this year we included Dambulla and the North and East into this umbrella

Ceylon Cold Stores PLC (PQ4)
30
Employee Service Year Profile
15% 0-4 7% 5-921% 10-1419% 15-1919% 20-2413% 25-296% 30-340% 35-39
of farmers, gaining access to some produce that is unique to these geographic locations. While mangoes, onions, sweet potatoes are sourced from the Jaffna peninsula, we also extended sourcing fish and crab as well from Jaffna. We also obtain different varieties of rice directly from farmers engaged in paddy production in Dehiattakandiya, Polonnaruwa, Ampara and Tissamaharama.
It is pertinent to note, that the fruit obtained from the fresh markets also form some of the primary ingredients in our frozen confectionery range such as Karuthu Kolomban ice cream.
The Mahaweli Authority has been a strong stakeholder in this project, evaluating the farmers progress and advising them on technical and quality requirements. The ITI is a partner in ensuring the permeation of modern and safe farming methods, which have all borne fruition given the increase in productivity we have observed from our sourcing partners since the inception of this initiative.
Our Team – Our Success DriversPeople power is the secret to our success, given that it is our team that ultimately conceptualises, moots, produces and finally delivers the product that meets and in most cases, exceeds customer expectations.
Our 2,554 strong team is driven by motivation, dynamism, inspiration and a winning formula that collates a host of tenets pertaining to learning, applying and growing an entity with individual ability and skill at its center. We also promote a people based culture that employs equality, meritocracy, a participatory interactive approach and an inspirational milieu that encourages teamwork, entrepreneurial spirit and individual spark. Innovation and creativity becomes a part of this culture, complimented through a knowledge gathering milieu that instills a life long learning culture.
One of our fundamental HR principles is to develop the best people in the industry, a process that involves seeking, developing and retaining the best talent. Ours is a work environment which thrives on the diversity we have within our team due to the multi-cultural platforms and the dimensions these infuse into meeting our goals. A wide range of learning and development programmes are imbued into our workings, while the team is assured of functioning to their optimum in a non-discriminatory environment that promotes dignity, respect, self worth and equality.
The recruitment process, which echoes the guidelines laid down by the John Keells Group, is based on organizational needs, as are recruitment and selection criteria including qualifications, experience, external and internal examinations, assessment interviews and aptitude tests. The selection process goes across both internal and external candidates, with the potential candidates short-listed, before final selection.
Sustainability Report
People power is the secret to our success, given that it is our team that ultimately conceptualises, moots, produces and finally delivers the product that meets and in most cases, exceeds customer expectations.
Annual Report 2010 / 2011
31
Ethics, Values and PrinciplesOur HR processes are aligned to the HR vision, mission and plans prevailing within the John Keells Group, which has garnered for itself the title of being a preferred employer. Given the stature the Group commands in the local and regional corporate sphere, HR is governed by a strict code of ethics, principles and absolute transparency, which permeates the HR initiative of all Group companies. We value honesty and integrity in everything that we do. We conduct our business responsibly and in compliance with local and international laws and regulations.
Learning and DevelopmentOur Learning and Development initiatives are steeped in developing a holistic individual and team that will add value to the organization. Through focused training programmes, the knowledge building culture we emphasize is constantly driven upwards, with the Annual Training Needs Analysis and Annual Training Plan forming the base of continuous development. From leadership training to specialised technical skills training, the Performance Management Review process, identifies training needs at three levels of employment – at group competency level, technical level and sector level.
At each level of employment, Assessment Center Programmes identifies performance levels in order to gauge each employee’s readiness for the functions they are involved in, on the axiom of ‘the right person for the right job’. The Development Center meanwhile evaluates each individual on their readiness for the next level. Promotions and succession planning is based on these findings. During the year, four employees having shown leadership and management potential, promoted to the management cadre.
Rewarding ExcellenceMeritocracy and performance excellence is rewarded and recognized. We strongly believe that career development is further augmented with the process of individual and team recognition, which cascades to motivation and a need to continually excel. Through the Group wide V-SPARC scheme (Value-Supeior Performance And Recognition Creation), high achievers who display JKH values and worked towards exceeding expectations are rewarded. Similarly, the Group too rewards excellence with exceptional performance recognised through the ‘Chairman’s Award’ for Management cadre and above, and the ‘Champion’s Award’, presented to Executives and Assistant Managers.
Industrial RelationsWorking within a highly unionised environment which, while having its challenges, has enabled us to pursue pathways of unity and enhancing team spirit, gave us the impetus to pursue methodologies that would enable higher productivity and work efficiency. This year, the three year Collective Agreement was signed, post a series of discussions held with the trade unions, which resulted in mutually agreed areas being infused into the Agreement.
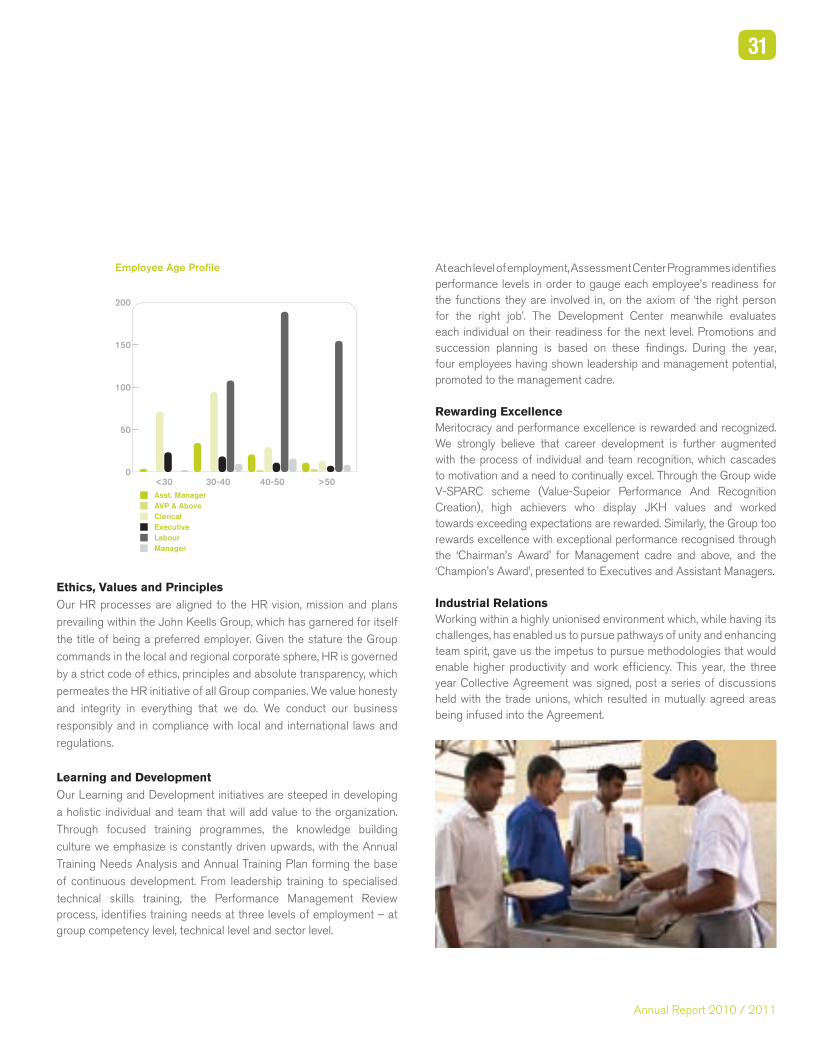
0
50
100
150
200
<30 30-40 40-50 >50
Employee Age Profile
Asst. ManagerAVP & AboveClericalExecutiveLabourManager

Ceylon Cold Stores PLC (PQ4)
32
Sustainability Report
Adhering stringently to the internationally accepted ILO labour practices and standards as well as other relevant regulations applicable to Sri Lanka, industrial harmony is crucial for the smooth functioning of our Company. In addition to the learning, applying and growing fundamentals which we continue to implement for our team, we are very focused on maintaining absolutely cordial relations with the respective unions and their representatives. The continuous dialogue we have established with them, the open door discussions, the transparent and accountable processes have all added up to an environment of industrial harmony, which is ultimately reflected in our bottom line.
Permeating Good Friends – Good TimesWe firmly believe that our axiom of ‘Good Friends – Good Times’ must be a feeling that must emanate from the heart of our team, an ethos they must personally experience in order to ensure that the product they produce is optimised in expectation. We are of the view that the team must buy in to this pervasive belief and therefore strive to create the apt milieu that would trigger absolute levels of enjoyment among them, by working for the Company. Espousing the advantages of team spirit and togetherness, during the year we implement a host of holistic features that helped build a cohesive and united team, who echo camaraderie, friendship and loyalty above and beyond the call of duty.
Extracurricular activities, recreational efforts and talent spotting are all encouraged, with family days, sports meets, festive and religious events as well as excursions organised to nurture and strengthen the bonds, not only among our team but within their families as well.
To gain closer access into the hearts and minds of our team, we introduced two new initiatives this year that would augment the good relationship we have already constructed with our team. An art competition was organised for employees’ children in three age groups with cash prizes being rewards. 98 young children participated enthusiastically in this competition which was held within our facility and was judged by erudite judges from the George Keyt Foundation, while our team assisted completely in organising the event.
Another talent spotting initiative was the first Elephant House Super Star and Elephant House Little Star competitions. Modeled on the lines of international television reality shows, the two competitions were most exciting and saw both our team and their families participate
with amazing keenness. The talent showcased in those competitions were exemplary and also enabled us to see a positive facet of our employees and their families never seen before. We aim to continue this initiative annually.
Occupational Health and SafetyBeing a Company that is governed very stringently by international standards in Occupational Health and Safety and Group-wide safety policies which are most comprehensive and since our business is one that is susceptible to contamination, we are most focused on ensuring that we maintain a health and safety environment that exists beyond compliance.
OH&S is helmed by a dedicated manager and cross functional committee, tasked with ensuring complete health and safety within the facility and also to training the team to optimise health and safety. These include regular fire fighting drills, safety awareness programmes, OHS audits and Lead Auditing programmes.
The warehouse and distributor areas were refurbished and new more stringent safety measures introduced to create a more conducive environment for the external team that visits the facility. A significant investment was infused to ensure that these imperatives would be adhered to strictly as our responsibility towards the health and safety of all those within and visiting the facility is paramount.
Responsible Environmental ManagementBeing in manufacturing, we are an energy intensive Company. Our processes and systems, while conforming to high quality standards, have come under intense scrutiny more so in recent years in purview of energy usage and prudent management. Fuel and electricity, are two of our most expensive components that affect our bottom line and while it makes good economic sense to manage these costs astutely, we cannot make rash decisions that will effectively compromise the ultimate product that we send to the marketplace.
Environmental management, which includes judicious decision making in energy cost curtailment, water management, air and noise pollution have become a company wide priority on our ‘Green Agenda’. While we do conform to Group wide policies on environmental management, striving to establish green practices within the company through the 3R concept of ‘Reduce-Reuse-Recycle’, we are also conscious that these efforts must be further augmented with focused energy

Annual Report 2010 / 2011
33
management practices. Within the daily administrative workings, paper and waste packaging in recycled, while we remain one of the pioneers in glass recycling. We have continually promoted the use of glass bottles for our soft drinks and only introduced the concept of PET bottles, primarily for the convenience of the consumer. However, we actively promote the purchase of glass bottles due to the ‘green’ benefits that accrue within the 3R initiative and in an effort to reduce our carbon footprint. Labeling too is bio-degradable and causes minimum harm to the environment.
High volumes of water is used in both soft drinks and ice cream manufacture, not only in the cleaning process but in the former, for manufacture as well. This also results in a significant levels of waste water which needs to be managed efficiently. Throughout the years, we have implemented processes that enable us to manage our water consumption efficiently, while not compromising in any way on the quality of our product.
While we do have an Energy Management Committee that is highly knowledgeable on the ground realities of energy management and conservation, in our constant bid to infuse better energy management practices, we initiated an Energy Forum to take this further. Founded on ensuring that we remain cognizant of our sustainability platform, the Forum which has met quite regularly during the year, has been extremely productive in suggesting and prompting the introduction of numerous conservation initiatives. Saving energy, recycling water and recycling waste come under the discussion agenda with water recycling already begun.

Ceylon Cold Stores PLC (PQ4)
34
Ceylon Cold Stores PLC (CCS) and its Subsidiary Jaykay Marketing Services (Private) Limited referred to as the “Group” and through its holding company John Keells Holdings PLC (JKH) has a Corporate Governance philosophy founded on a culture of performance within a framework of conformance and compliance to succeed in today’s competitive business environment in a manner that is sustainable and equitable to all our stakeholders. This philosophy has been institutionalised at all levels in the Group through a strong set of corporate values and a written code of conduct that all employees, senior management and the Board of Directors are required to follow in the performance of their official duties and in other situations that could affect the Group’s image. Directors and employees at all levels are expected to display ethical and transparent behaviour through their communication and role modeling. All the Group’s recognition schemes insist, as a minimum, that all nominees have lived the JKH values and the behaviour of the senior management of the Group is monitored through an annual 360 degree feedback programme.
JKH Code of Conduct Allegiance to the Company and the Group Compliance with rules and regulations applying in the
territories that the group operates in Conduct of business in an ethical manner at all times and in
keeping with acceptable business practices Exercise of professionalism and integrity in all business and
‘public’ personal transactions
The Chairman of the Board affirms that there has not been any material violation of any of the provisions of the aforementioned Code of Conduct. In the instances where violations did take place, they were investigated and handled through the Company’s well established procedures which, among others, include direct and confidential access to an independent, external ombudsperson.
The Group Corporate Governance policies are in full compliance with the following and where necessary, any deviations as allowed by the relevant rules and regulations have been disclosed.
Enterprise Governance
The Companies Act No. 7 of 2007 The Listing rules of the Colombo Stock Exchange (CSE) (revised
April 2011) The recommendations of the Combined Code of 2008 to the
extent that they are practicable in the context of the nature of our diverse businesses and their risk profiles.
All provisions of the Code of Governance of the Institute of Chartered Accountants of Sri Lanka.
Corporate Governance FrameworkThe Group is committed to the highest standards of business integrity, ethical values and professionalism in all its activities towards rewarding all its stakeholders with greater creation of value, year-on-year. Our governance framework which has been communicated to all levels of management and staff in individual businesses and function units is based on the following;
The Board is responsible to the shareholders to fulfill its stewardship obligations, in the best interest of the Company and its stakeholders
Maximising shareholder wealth-creation on a sustainable basis while safeguarding the rights of multiple stakeholders
The methods we employ to achieve our goals are as important to us as the goals themselves
No one person has unfettered powers of decision making Building and improving stakeholder relationships is an integral
aspect of board effectiveness and a responsible approach to business
Opting, when practical, for early adoption of best practice governance regulations and accounting standards
Our resolve to maintain strong governance practices which present strong commercial advantages especially through a lowering of our cost of capital as a result of the strengthened stakeholder confidence, particularly the confidence of our investors, both institutional and individual
The making of business decisions and resource allocations, in an efficient and timely manner, within a framework that ensures transparent and ethical dealings which are compliant with the laws of the country and the standards of governance our stakeholders expect of us.

Annual Report 2010 / 2011
35
Board of DirectorsThe Board of Directors is the focal point of the Group’s Corporate Governance process and is ultimately accountable and responsible for the performance and affairs of the Group.
Board Composition and Directors’ IndependenceThe Board of Directors of Ceylon Cold Stores PLC consists of the Chairman who is a Non Executive Non Independent Director, two Non Executive Non Independent Directors, three Non Executive Independent Directors and one Executive Director.
The Board members have a wide range of expertise as well as significant experience in corporate, marketing, legal and financial activities enabling them to discharge their governance duties in an effective manner. A brief profile of each Director is given on pages 20 and 21.
Independence of the Directors has been determined in accordance with the criteria suggested by the Combined Code and the criteria of the CSE Listing Rules (revised in April 2011). The three Independent Non-Executive Directors have submitted signed confirmations of their independence
Board Responsibilities and Decision RightsThe Board of Directors is accountable to the shareholders for the governance of the Company. All Directors are accountable for the proper stewardship of the Company’s affairs and share responsibility
in ensuring the highest standards of disclosure and reporting, ethics and integrity across the Group. Powers specifically reserved for the board decision matrix’ include –
Providing direction and guidance to the Group in the formulation of its strategies and in the pursuance of its operational and financial goals
Monitoring systems of governance and compliance Overseeing systems of internal control and risk management Determining any changes to the discretions/authorities delegated
from the Board to the executive levels Approving major acquisitions and disposals and capital
expenditure Reviewing HR processes with emphasis on top management
succession planning Approving annual budgets and strategic plans
Non Executive/Independent Directors and the Board BalanceThe Board is of the view that its present composition ensures a right balance between executive expediency and independent judgment. Collectively, the Non-Executive Directors bring a range of value adding domestic and international experience and expertise in specialised functions. The Company is conscious of the need to maintain an appropriate mix of skills and experience on the board and to refresh progressively its composition over time. The Company also notes the value that has been brought to bear by the Non-Executive Directors on the governance of the Group. The Non-Executive Directors of the
Name of Director Executive / Non Executive
Independent / Non Independent
Involvement/ Interest in Shareholding
Involvement/ Interest in Management
Continuously served for 9 years
Involvement/ Interest in Supply Contracts
Mr. S. C. Ratnayake - Chairman
Non Executive Non Independent Yes No - No
Mr. A. D. Gunewardene Non Executive Non Independent Yes No - No
Mr. J. R. F. Peiris Non Executive Non Independent Yes No - No
Mr. J. R. Gunaratne (CEO) Executive Non Independent Yes Yes - No
Mr. P. Jayawardene Non Executive Independent Yes No No No
Prof. U. Liyanage Non Executive Independent Yes No No No
Mr. A. Rasiah Non Executive Independent Yes No No No

Ceylon Cold Stores PLC (PQ4)
36
board collectively possess strong financial acumen and are in good positions to assess the integrity of the Group’s financial reporting systems and controls, continually review and critique these systems and make changes to them as necessary.
All Non-Executive Directors (NED) are encouraged to propose discussion items for the board meetings.
Access to Management InformationThe Board Members meet the Executive Director and senior management staff once every three months to review among other matters, the performance and Financial Statements for the period. Procedures exist to ensure that Directors receive relevant documentation in advance of each meeting. Guidelines with regard to the content and presentation have been established for all documents submitted. Quarterly accounts, including key operational and financial ratios, are circulated to the Board and discussed at the quarterly meetings. In addition, controls are in place to ensure compliance with the policies of the Board. The Board of Directors has unrestricted access to all Company information, records, documents, and property.
Chairman of the BoardThe Chairman is a Non Executive Non Independent Director. The Chairman conducts Board Meetings ensuring effective participation of all Directors. The Chairman is responsible for providing leadership to the Board and ensuring that proper order and effective discharge of Board functions are carried out at all times by the Board Members. The roles of the Chairman and the President / Chief Executive Officer (CEO) are separate with a clear distinction of responsibilities between them. The executive responsibility for the functioning of the Company’s business including implementation of strategies approved by the Board and developing and recommending to the Board the business plans and budgets that support the Company’s strategy has been entrusted to the President / CEO.
Board of Directors Delegation of AuthorityThe Board has delegated some of its functions to Board committees while retaining final decision rights pertaining to matters under the purview of these committees.
The Board has, subject to pre-defined limits, delegated its executive authority to the President-CEO who exercises this authority through the Group Management Committee (GMC), which he heads and to which he provides leadership and direction.
Financial ExpertiseThe Board of Directors consists of two senior qualified Accountants with significant experience in the corporate sector. Both of them posses the necessary knowledge and expertise to offer the Board of Directors guidance on matters of finance. One of them serves as the Finance Director of the parent company whilst the other as Chairman of the Audit Committee.
Board MeetingsThe Board met 4 times during the year. The attendance at these meetings was as follows.
Name 27th
Apr
il 20
10
28th
Jul
y 20
10
26th
Oct
ober
201
0
21st
Jan
uary
201
1
Mr. S. C. Ratnayake Y Y Y N
Mr. A. D. Gunewardene Y Y Y Y
Mr. J. R. F. Peiris Y N Y Y
Mr. J. R. Guneratne Y Y Y Y
Prof. U. P. Liyanage Y N Y Y
Mr. P. S. Jayawardena Y Y Y Y
Mr. A. R. Rasiah Y Y Y Y
Re-Election of Director’sAt each Annual General Meeting two Directors, retire by rotation on the basis prescribed in the Articles of Association of the Company and are eligible for re-election. The Directors who retire are those who have been longest in office since their appointment / re-appointment. In addition any new Director who was appointed to the Board during the year is required to stand for re-election at the next Annual General Meeting.
Enterprise Governance

Annual Report 2010 / 2011
37
The re-election of Directors ensure that shareholders have an opportunity to reassess the composition of the Board. The names of the Directors submitted for re-election are provided to the shareholders in advance to enable them to make an informed decision on their election.
The retiring Directors eligible for re-election this year are mentioned in the Notice of the Annual General Meeting of the Company.
Audit Committee, External Auditors and IndependenceThe Audit Committee comprises solely of Non-Executive, Independent Directors and conforms to the requirements of the Listing Rules of the Colombo Stock Exchange. It is governed by a charter, which inter alia, covers the reviewing of policies and procedures of Internal Control, business risk management, compliance with laws and company policies and independent audit function.
The Committee is also responsible for the consideration and recommendation of the appointment of External Auditors, the maintenance of a professional relationship with them, reviewing the accounting principles, policies and practices adopted in the preparation of public financial information and examining all documents representing the final Financial Statements.
A quarterly self certification program requires the Chief Financial Officer and Head of Finance of the sector to confirm compliance, with statutory requirements and key control procedures and to identify any deviations from the set requirements. In addition the CEO and the Operational Heads of the different business units are also required to confirm operational compliance with statutory and other regulations and key control procedures, coupled with the identification of any deviations from the expected norms. These have significantly aided the committee in its efforts in ensuring correct financial reporting and effective internal control and risk management.
The Audit Committee had 5 meetings during the year and attendance of the Audit Committee members are indicated in the Audit Committee Report on page 54.
The President / CEO, the CFO, the Head of Finance and other operational heads are invited to the meetings of the Audit Committee. The detailed Audit committee report including areas reviewed during the financial year 2010/11 is given on pages 54 and 55 of the Annual Report.
Going Concern and Financial ReportingThe Directors are satisfied that the Company has sufficient resources to continue in operation for the foreseeable future. In the unlikely event that the net assets of the company fall below a half of shareholders funds, shareholders would be notified and an extraordinary resolution passed on the proposed way forward.
The going concern principle has been adopted in preparing the Financial Statements. All statutory and material declarations are highlighted in the Annual Report of the Board of Directors in the Annual Report. Financial Statements are prepared in accordance with the Sri Lanka Accounting Standards (SLAS), including all the new standards introduced during the subject year.
Information in the Financial Statements of the Annual Report are supplemented by a detailed ‘Management Discussion and Analysis’ which explains to shareholders the strategic, operational, investment and risk related aspects of the Company that have translated into the reported financial performance and are likely to influence future results.
The Statement of Directors’ Responsibilities in relation to Financial Statements is given on page 56 of the Annual Report. The Directors’ interests in contracts of the Company are addressed in the Annual Report of the Board of Directors.
The Directors have taken all reasonable steps in ensuring the accuracy and timeliness of published information and in presenting an honest and balanced assessment of results in the quarterly and annual Financial Statements. All price sensitive information has been made known to the Colombo Stock Exchange, shareholders and the press in a timely manner and in keeping with regulations.

Ceylon Cold Stores PLC (PQ4)
38
International Financial Reporting Standards (IFRS)The John Keells Group has a committee comprising of financial personnel from within the Group working on the implementation of IFRS as per the guidelines set by the ICASL. As per the given requirements by the ICASL, IFRS is to be implemented by the start of the 2012/2013 financial year and the Company and its Subsidiary is in line to meet this requirement.
Remuneration Committee and PolicyThe Remuneration Committee of the Parent Company John Keells Holdings PLC functions as the remuneration committee of the Company and conforms to the requirements of the Listing Rules of the Colombo Stock Exchange.
The Remuneration Committee of the Parent Company consists of three Non Executive Independent Directors:
Names of MembersMr. Franklyn Amerasinghe - Chairman Mrs. S. TiruchelvamMr. D. Rodrigo
The Remuneration Policy of the Group is formulated to attract and retain high calibre executives and motivate them to develop and implement the business strategy in order to optimise long term Shareholder value creation.
The key principles underlying the Remuneration Policy of the Group are as follows:
All executive roles across the JKH Group have been banded by an independent third party on the basis of the relative worth of jobs.
Compensation be set at levels that are competitive to enable the recruitment and the retention of high calibre executives in the identified job classes/bands – as guided by the best comparator set of companies (from Sri Lanka and the region, where relevant)
Compensation, comprising of fixed (base) payments, short term incentives and long term incentives be tied to performance, both individual and organisational.
Performance be measured annually on well-defined objectives and matrices at each level- individual, business and group, thereby aligning shareholder interests through well established performance management system.
The more senior the level of management, the higher the proportion of the incentive component, thereby lower the proportion of the fixed (base) component of total compensation.
As the seniority and therefore the decision influencing capability of the position on organizational results, increases, the individual performance to hold lesser weightage than the organizational performance when determining total compensation and incentives.
The aggregate amount paid to the Executive and the Non Executive Directors are disclosed in note 27 of the Notes to the Financial Statements.
Risk Review and Internal ControlThe Company and its Subsidiary also adopts the Parent Company’s Risk Management Programme which is given in pages 44 to 45 manage the significant risks.
The programme ensures that a multitude of risks, arising as a result of the group’s operations, are effectively managed in creating and preserving shareholder and other stakeholder wealth. The detailed Risk Management report of the Annual Report describes the process of risk management as adopted by the Group and the key risks to the achievement of the Group’s strategic business objectives.
The risk review programme covering the internal audit of the Company is outsourced to Messrs. Price WaterhouseCoopers (Pvt) Limited, a firm of Chartered Accountants and that of the subsidiary is outsourced to BDO Partners – Chartered Accountants and the reports arising out of such audits are, in the first instance, considered and discussed at the business / functional unit levels and after review by the respective President/CEO of the Company and the Subsidiary are forwarded to the Audit Committee on a regular basis. Further, the Audit Committees also assess the effectiveness of the risk review process and systems of internal control on a regular basis. Follow-up on internal audits are done on a structured basis.
Enterprise Governance

Annual Report 2010 / 2011
39
Compliance with Legal RequirementsThe Board is conscious of its responsibility to the Shareholders, the Government and the Society in which it operates and is unequivocally committed to upholding ethical behavior in conducting its business. The Board strives to ensure that the Company and its Subsidiary complies with the laws and regulations of the Country.
The Board of Directors has also taken all reasonable steps to ensure that all Financial Statements are prepared in accordance with the Sri Lanka Accounting Standards, the requirements of the Colombo Stock Exchange and other applicable authorities. The Directors are satisfied that the Company and its Subsidiary has sufficient resources to continue in operation for the foreseeable future. Accordingly, the going concern principle has been adopted in preparing the Financial Statements.
The Sri Lanka Accounting Standards as set by The Institute of Chartered Accountants are those which govern the preparation of the Financial Statements. The Board is aware of the growing importance of the disclosure of critical accounting policies as a part of Corporate Governance and are of the opinion that there are no instances where the use of such a concept would have had a material impact on the Company’s and the Group’s financial performance.
Relations with ShareholdersShareholders will have the opportunity at the forthcoming AGM, notice of which has been communicated, to put questions to the Board and to the Chairman. The contents of the Annual Report will enable existing and prospective stakeholders to make better informed decisions in their dealings with the Company.
Employee RelationsThe HR units are designed in a manner that enables high accessibility by any employee to every level of management. constant dialogue and facilitation are also maintained, relating to work-related issues as well as matters pertaining to general interest that could affect employees and their families.
Whistleblower PolicyThe employees can report to the Chairman through a communication link named ‘Chairman Direct’, concerns about unethical behaviour and any violation of group values. Employees reporting such incidents are guaranteed complete confidentiality and such complaints are investigated and addressed via a select committee under the direction of the Chairman.
OmbudspersonThe Ombudsperson is to entertain complaints, from an employee or a group of employees, of alleged violations of the published Code of Conduct, when that employee or group of employees feel that an alleged violation has not been addressed satisfactorily using the available/existing procedures and processes.
The findings of the Ombudsperson and recommendations arising there from shall be confidential and be communicated to the Chairman or the Senior Independent Director of JKH, where applicable, in writing and the Ombudsperson’s duty will thereupon cease forthwith.
The Chairman or the Senior Independent Director of JKH, as the case may be, will place before the Board- I. The decision and the recommendationsII. Action taken based on the recommendationsIII. Where the Chairman or the Senior Independent Director disagrees
with any or all of the findings and or the recommendations thereon, the areas of disagreement and the reasons therefore.
In situation (iii) the Board shall consider the areas of disagreement and decide on the way forward. The Chairman or the Senior Independent Director of JKH is expected to take such steps as necessary to ensure that the complainant is not victimised for having invoked this process.

Ceylon Cold Stores PLC (PQ4)
40
Rule No. Subject Applicable requirement Compliance Status
Applicable Section in the Annual Report
7.10.1 (a) Non Executive Directors Two or at least one third of the total number of Directors should be Non-Executive Directors.
Compliant Enterprise Governance
7.10.2 (a) Independent Directors Two or one third of Non-Executive Directors, whichever is higher, should be independent.
Compliant Enterprise Governance
7.10.2 (b) Independent Directors Each Non-Executive Director should submit a declaration of independence / non-independence in the prescribed format.
Compliant Available with Secretaries for Review
7.10.3 (a) Disclosure relating to Directors
The Board shall annually make a determination as to the independence or otherwise of the Non-Executive Directors and names of Independent Directors should be disclosed in the Annual Report.
Compliant Enterprise Governance
7.10.3 (b) Disclosure relating to Directors
The basis for the Board to determine a Director is Independent, if criteria specified for Independence is not met.
Compliant Enterprise Governance
7.10.3 (c) Disclosure relating to Directors
A brief resume of each Director should be included in the Annual Report and should include the Directors areas expertise.
Compliant Board of Directors (profile) section in the Annual Report
7.10.3 (d) Disclosure relating to Directors
Forthwith provide a brief resume of new Directors appointed to the Board with details specified in 7.10.3(a), (b) and (c) to the Exchange.
Compliant No new Director was appointed during the year.
7.10.4 (a-h)
Determination of Independence
Requirements for meeting criteria Compliant Enterprise Governance
7.10.5 Remuneration Committee A listed company shall have a Remuneration Committee.
Compliant Enterprise Governance
7.10.5 (a) Composition of Remuneration Committee
Shall comprise of Non – Executive Directors a majority of whom will be Independent.
Compliant Enterprise Governance
7.10.5 (b) Functions of Remuneration Committee
The Remuneration Committee shall recommend the remuneration of the Chief Executive Officer and Executive Directors.
Compliant Enterprise Governance
7.10.5 (c) Disclosure in the Annual Report relating to Remuneration Committee
The Annual Report should set out, a. Names of Directors comprising the
Remuneration Committeeb. Statement of Remuneration Policyc. Aggregated remuneration paid to
Executive and Non – Executive Directors
Compliant
Compliant Compliant
Enterprise Governance and the Board of Directors Reports and Note 27 to the Financial Statements.
Levels of Compliance with the Colombo Stock Exchange’s new listing rules - Section 7.10, Rules on Corporate Governance
Enterprise Governance
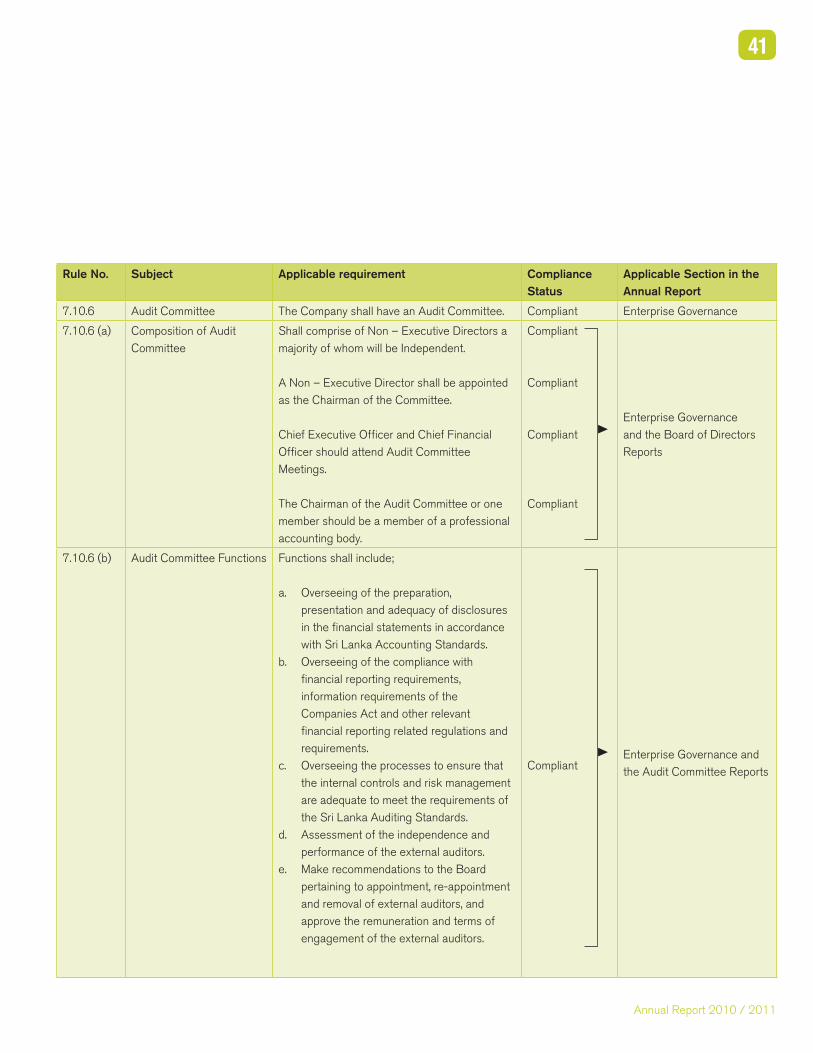
Annual Report 2010 / 2011
41
Rule No. Subject Applicable requirement Compliance Status
Applicable Section in the Annual Report
7.10.6 Audit Committee The Company shall have an Audit Committee. Compliant Enterprise Governance
7.10.6 (a) Composition of Audit Committee
Shall comprise of Non – Executive Directors a majority of whom will be Independent.
A Non – Executive Director shall be appointed as the Chairman of the Committee.
Chief Executive Officer and Chief Financial Officer should attend Audit Committee Meetings.
The Chairman of the Audit Committee or one member should be a member of a professional accounting body.
Compliant
Compliant
Compliant
Compliant
Enterprise Governance and the Board of Directors Reports
7.10.6 (b) Audit Committee Functions Functions shall include;
a. Overseeing of the preparation, presentation and adequacy of disclosures in the financial statements in accordance with Sri Lanka Accounting Standards.
b. Overseeing of the compliance with financial reporting requirements, information requirements of the Companies Act and other relevant financial reporting related regulations and requirements.
c. Overseeing the processes to ensure that the internal controls and risk management are adequate to meet the requirements of the Sri Lanka Auditing Standards.
d. Assessment of the independence and performance of the external auditors.
e. Make recommendations to the Board pertaining to appointment, re-appointment and removal of external auditors, and approve the remuneration and terms of engagement of the external auditors.
Compliant Enterprise Governance and the Audit Committee Reports

Ceylon Cold Stores PLC (PQ4)
42
Rule No. Subject Applicable requirement Compliance Status
Applicable Section in the Annual Report
7.10.6 (c) Disclosure in Annual Report relating to Audit Committee
a. Names of Directors comprising the Audit Committee.
b. The Audit Committee shall make a determination of the independence of the Auditors and disclose the basis for such determination.
c. The Annual Report shall contain a Report of the Audit Committee setting out of the manner of compliance with their functions.
Compliant.
Compliant
Compliant
Enterprise Governance and the Board of Directors Reports and the Audit Committee Report
Enterprise Governance

Annual Report 2010 / 2011
43
Introduction Ceylon Cold Stores PLC is exposed to various forms of industrial, operational, environmental and financial risk arising from transactions entered into and the economic environment within which it operates. Risk Management, an integral part of ‘Sustainability’ at John Keells Group, forms a part of our business process. The objective of the Risk Management Strategy of the Company of its subsidiary is to identify and manage risk, harness opportunities, adopt to changing environment and adopt long term and short term strategies which link well with the overall objectives of the Company and the its subsidiary.
The individual risk categories are founded on the success factors which are critical for the implementation and attainment of the Company
Risk Management
objectives. The risks in the Company are identified and analysed using a uniform risk register, which over the years has been adopted by the John Keells Group. The key operational, strategic and financial risks include areas such as socio-economic factors, competition, internal processes, procurement, products, currency and interest rate fluctuations, information technology and human resources.
The Company has adopted the John Keells Group risk management strategy which is an on going process of identifying risk (Risk Mapping), measuring its potential impact and likelihood thereof against a broad set of assumptions (Risk Action/Decisions), establishing what are
unacceptable exposures and initiating mitigating activities to reduce exposure to within tolerance levels (Risk Control Strategies). Risk management takes place as a bottom-up approach, as depicted below.
Risk Management ProcessThe risk management process has been designed to ensure identification of any event, situation or circumstances that would adversely effect the achievement of the objectives of the Company and to accept and manage unavoidable risks and to ensure surprise events or situations are minimized. This process is aligned directly in to the Company strategy, annual plans and audit committee process. The risk management process is outlined as follows-
Risk Identification - This part of the process will identify the events or scenarios that could prevent the Company from achieving its set objectives.
Risk Assessment and Evaluation - This is where it is determined whether the risk will have an ultra-high, high, moderate, low or insignificant impact on the operations of the Company. Also the likelihood of risk occurrence based on past experience as well as future projections is assessed. The Group Risk Management teams along with the functional and operational managers carry out the risk assessment and evaluation process.
JKH PLC Audit Committee
Group Executive Committee (GEC)
Layer 2
Layer 4
Layer 3
Layer 1
Group Operating Committee (GOC)
Sector Committee
Listed Company Audit Committee
JK Group Review Risk Report &
Action
BU Risk Report & Action
BU Review & Sector Risk
Report & Action
Report Content
John Keells Risk Universe
Headline Risks
External Environment
Business Strategies &
Policies
Business Process
Organisation & People
Analysis & Reporting
Technology &
Data
Business Unit

Ceylon Cold Stores PLC (PQ4)
44
Risk Mitigation Action Plans - Identified and evaluated risks are assigned to risk owners. Risk mitigation action plans will be developed with timelines for implementation by the risk owners along with the management of the Company. When the action plans are formulated accepting and managing risk, transferring the risk to a third party, elimination of the risk by adopting an exit strategy, building controls into process to reduce risk, sharing the risk with another party and insuring against risks are considered.
Monitoring - On a quarterly basis the risk mitigation actions plans will be monitored and reported to the Management Committee.
The Risk Management process is reviewed by the Risk Management Teams headed by the President/CEO of the Company along with the functional and operational managers.
The Audit Committee of the Board of Directors is the prime mover in setting up policy and the monitoring of effective implementation of set policies on behalf of the Board.
The significant risk areas that impact the achievement of the strategic business objectives of the Company and the measures taken to address these risks are given below;
Brand and Company Product Portfolio Products manufactured and sold by the Company have a leading house hold brand name with high brand equity. Therefore it must be managed and protected to survive and prosper in the years to come. The irreparable damage done to the brand following a crisis or catastrophe may substantially out-way the immediate and visible costs. The strategies used to manage brand risks include quantitative and qualitative tools, including market intelligence and competitive intelligence management systems, with a focus on negating potential risk factors, as well as developed proactive risk management practices for our brands.
Competitor Activity & Demand for Company Products The Company faces stiff competition from other producers of thirst quenchers and frozen confectionery manufacturers. The Company has formulated a basis on which the Company competes with such producers which revolve mainly on Brand identification, product portfolio, availability, communication, quality and distribution.
Price Volatility of Raw Materials The Company’s manufacturing costs are largely dependant upon the cost of raw materials sourced. Over the last few years there has been significant price volatility in the world market in respect of certain key ingredients. We have mitigated some of the risks associated with price volatility as well as availability by entering into forward contracts for key ingredients and substitute where possible with local materials without compromising quality. Further we have built a strong relationship with farmer community and other local suppliers through the Corporate Social Responsibility initiatives to ensure continuous supply at stable price levels.
Supplier Stability and Consistent Quality of Raw MaterialsThe Company depends on few suppliers for some of the key raw materials due to the cost advantage and ease of supply. Any adverse impact on the sustainability of these suppliers will create a disturbance to the manufacturing process. We have evaluated the alternate suppliers and are in the process of diluting the dependency on key suppliers whilst managing the cost impact optimally. The Company also regularly conducts supplier audits to ensure that the raw materials comply with stipulated standards. We also encourage and assist the suppliers to obtain ISO / HACCP certification and the Company gives the preference to the suppliers who has obtained such standards.
Stability of Distribution ChannelsStability of distribution channels largely depend on the viability and consistent performance of our distributors. It is extremely important to ensure the continued services of the distributors to deliver the Company products to end consumers. The Company has a stringent process for selection of distributors and monitors the distributor performance on an on going basis and guide and supports them to ensure the viability and growth of their business.
Human ResourcesKey HR areas ranging from recruitment and selection, career management, performance management, training and development, competency frameworks and coaching skills to talent appreciation, reward and recognition and compensation and benefits have been reviewed and revised to modern standards.
Risk Management

Annual Report 2010 / 2011
45
The Company has approximately 900 employees in its cadre and 500 of the staff are represented by unions. A deterioration of labor relations or a significant increase in labour costs would have a significant impact on Company’s results. With a view to addressing the above concerns, key HR areas ranging from performance management, training and development, coaching and mentoring skills to reward and recognition and compensation and benefits have all been reviewed and revised in keeping with modern trends and methodologies. The Company maintains a dialogue, on a proactive basis with unionised employees to maintain cordial industrial relations.
Exposure to Credit Facilities Credit facilities are offered to Company’s customers in keeping with the business environment. This may expose the Company to default of payments. The Company mitigates such risk by offering credit within set limits following an evaluation of creditworthiness together with measures to adequately safeguard exposures with sufficient asset backed securities.
Reliance on Effective Internal Controls Segregation of duties, definition of authority limits, operating manuals, detective and preventive controls and internal and external audit procedures which are independent of each other enable the management to ensure that the operations are being carried out as per laid down procedures.
Meeting Quality Expectations The food manufacturing industry is subject to general risks of food spoilage or contamination, consumer preferences with respect to nutrition and health related concerns, governmental regulations, consumer liability claims etc. Our quality assurance system administered by qualified specialists using international benchmarks considers all continuous product and process innovations necessary to maintain the Company’s competitive edge and avoid any regulatory, health and nutrition related concerns. Company’s risk management strategy has identified such risks and set in motion an action plan to mitigate the results of such risks. Towards addressing nutritional concerns the Company has a food nutritionist validating all products nutritional standards. With respect to Governmental regulations, the Company ensures only ingredients that satisfy international standards are used in its product formulation. The Company also ensures compliance to the quality certifications of HACCP manufacturing
practices with the conduct of regular internal and external audits as applicable to the industries and product lines we operate in.
Vulnerabilities from IT Related Risks Dedicated professionals and use of appropriate software ensures continuity of business operations and safeguard from IT related risks including the setting up of early warning mechanisms to mitigate possible infrastructure failure.
LiquidityExposure to liquidity risk arises in the general funding of the companies business activities and includes the risk of being unable to fund the business activities in a timely manner. The Company managers its liquidity risk by marinating sufficient cash and available funding through unutilized credit facilities from various banks.
Ensure Compliance Legal and Regulatory Requirements Compliance Risk is managed through the use of legal advice from appropriately qualified and experienced legal professionals supplemented by the JKH legal team. We have put in place periodic reporting of compliance by the respective Functional Managers.
Changes in Interest The Company’s policy is to manage its interest rate risk using a mix of fixed and variable rate debt taking advantage of the changes in the market rates. Guidance received from Group Treasury division with respect to forecasting of exchange rates, interest rates etc has been of immense value in management of this risk exposure.
Company’s Foreign Operations The Company markets its products internationally. These international sales are subject to compliance with foreign laws and other economic and political uncertainties, trade barriers and other restrictions. All of these risks could result in increased costs which would affect the Company. We have set in motion a process to identify specific risks, and wherever risks are identified appropriate corrective action to be taken.

Ceylon Cold Stores PLC (PQ4)
46

Annual Report 2010 / 2011
47
Financial InformationFinancial CalendarYear ended 31st March 20111st Quarter released on 28th July 20102nd Quarter released on 26th October 20103rd Quarter released on 27th January 20114th Quarter released on 25th May 2011Annual Reports posted on 07th June 2011114th Annual General Meeting on 30th June 2011
Financial ContentAnnual Report of the Board of Directors 49Audit Committee Report 54Statement of Directors’ Responsibilities in Relation to the Financial Statement 56Independent Auditors’ Report 57Balance Sheet 58Income Statement 59Statement of Changes in Equity 60Cash Flow Statement 61Accounting Policies 63Notes to the Financial Statements 70

Ceylon Cold Stores PLC (PQ4)
48

49
Annual Report 2010 / 2011
Annual Report of the Board of DirectorsThe Board of Directors of Ceylon Cold Stores PLC have pleasure in presenting their Annual Report together with the Audited Financial Statements of Ceylon Cold Stores PLC and the Audited Consolidated Financial Statements of the Group for the year ended 31st March 2011.
The content of this Report has also considered the requirements of the Companies Act No 7 of 2007, the relevant Listing Rules of the Colombo Stock Exchange and recommended best reporting practices.
GeneralThe Company was incorporated in 1866 as the Colombo Ice Company Limited as a limited liability Company and in 1941 changed its name to Ceylon Cold Stores Limited. The Company was quoted in the Colombo Stock Exchange in January 1970. Pursuant to the requirements of the new Companies Act No.7 of 2007, the Company was re-registered and obtained a new Company number PQ4 on 15 June 2007.
Corporate Conduct and the Vision of the CompanyThe business activities of the Company and its Subsidiary are conducted with the highest level of ethical standards in achieving the Company’s vision. The Company’s vision is given on the page 2 of the Annual Report.
Principal ActivityCompanyThe principal activities of the Company remained unchanged as manufacture and marketing of Beverages and Frozen Confectionery.
SubsidiaryThe principal activity of Jaykay Marketing Services (Pvt) Limited, a 100% owned subsidiary remained unchanged as that of owning and operating of a chain of supermarkets under the name of “Keells Super”
Business ReviewA review of the Group’s performance during the financial year is given in the Chairman’s Review, and the Management Discussion and Analysis Review. These reports form an integral part of the Directors Report and provide a fair review of the performance of the Group during the financial year ended 31 March 2011.
Future DevelopmentsThe Chairman’s review and the Management Discussion and Analysis provide a review of the future developments of the Company and its Subsidiary under the section referred as “Future Prospects” and “The Future in Focus” respectively.
Financial StatementsThe Financial Statements of the Group and the Company are set out on pages 58 to 85 to of the Annual Report.
Auditors’ ReportThe Auditors’ Report on the Financial Statements is given on page 57 of the Annual Report.
Going ConcernThe Board of Directors is satisfied that the Company and its Subsidiary have adequate resources to continue its operations in the foreseeable future. Accordingly the Financial Statements are prepared based on the “going concern concept”.
Stated CapitalThe total Stated Capital of the Company as at 31 March 2011 was Rs. 270.2 Million (2009/2010- Rs. 270.2 million). The Stated Capital of the Company comprises of 21,600,000 Ordinary Shares fully paid up and 25,000 Preference Shares fully paid up.
Significant Accounting PoliciesThe Accounting Policies adopted in the preparation of Financial Statements are given on pages 63 to 69 of the Annual Report. There were no changes in the accounting policies adopted in the previous year for the Company or the Group under review, other than policy on Intangible Assets and Returnable Containers.
RevenueThe Net Revenue generated by the Company amounted to Rs. .6.4 billion (2009/2010 Rs. 5.3 billion), whilst the Consolidated Net Revenue of the Group amounted to Rs. 16.6 billion (2009/2010 Rs. 14.3 billion). An analysis of revenue is given in Note 23 to the Financial Statements.
Results and AppropriationsThe Profit after Tax of the Company was Rs. 252.8 million (2009/2010 Rs. 280 million), whilst the Group Profit attributable to Shareholders for the year was Rs.199.5 million (2009/2010 Rs. 228.9 million).

50
Ceylon Cold Stores PLC (PQ4)
TaxationProvision for taxation has been computed at the rates given in Note 28 to the Financial Statements.
Segment ReportingA segmental analysis of the activities of the Company and the Group is given in Note 23.2 and 23.3 to the Financial Statements.
Related Party TransactionsThere are no related party transactions which exceeds the lower of 10% of Equity or 5% of the total assets of the Company.
Corporate DonationsDuring the year the Group made donations amounting to Rs. 7 million (2009/2010 – Rs. 5 million). The donations made to Government approved charities from above amounted to Rs. 7 million (2009/2010 – Rs. 5 million). The Group makes no political donations.
DividendsThe Directors have declared and paid a first and final dividend of Rs. 4.00 per share for the year ended 31st March 2011, from the profits available for appropriation. The total dividend payout amounts to Rs. 86.4 million. In accordance with Sri Lanka Accounting Standards No 12 (Revised), Events after the Balance Sheet date, the declared dividend has not been recognized as a liability as at 31 March 2011.
As required by Section 56 (2) of the Companies Act No 7 of 2007, the Board of Directors have confirmed that the Company satisfies the Solvency Test in accordance with section 57 of Companies Act No 7 of 2007 and have obtained a certificate from the Auditors prior
to declaring the first and final dividend of Rs. 4.00 per share for the year.
The dividends paid out are out of taxable profits of the Company and will be subjected to a 10% withholding tax.
Property, Plant and EquipmentCapital expenditure on Property, Plant and Equipment and Capital Work-In-Progress of the Group amounted to Rs.1,252million (2009/2010 Rs. 334 million). Details of and the movement in the Property, Plant and Equipment of the Group is given in Note 3 to the Financial Statements.
Market Value of PropertyThe Land and Buildings (Except Freehold Land at Colombo) owned by the Company were re-valued by a professionally qualified independent valuer as at 31 March 2008.The Directors are of the opinion that the re-valued amounts are not in excess of the current market values of such properties. The details of the re-valued land and buildings of the Company are given in Note 3.1 and 3.3 to the Financial Statements.
The Freehold Land at Glennie Street and Justice Akbar Mawatha were revalued as at 31 March 2011 by a professionally qualified Independent Valuer. The land was valued at their open market / fair value, and the surplus arising from the revaluation was transferred to the Revaluation Reserve and the Freehold Land value was reclassified as Investment Property due to change in nature of use. The details of the Investment Property of the Company are given in Note 5 to the Financial Statements.
Detailed description of the Results and Appropriations of the Group are given below.
Result and Appropriations
For the year ended 31 March 2011 2010 Rs.000 Rs.000
Profit earned before interest after providing for all known liabilities and bad and doubtful debts 572,776 541,864Finance Expenses (89,794) (121,713)Profit Before Taxation 482,982 420,151Tax Expenses (283,446) (191,277)Profit After Taxation 199,536 228,874Balance Brought Forward from the Previous Year 565,362 422,902Amount available for appropriations 764,898 651,776Ordinary Dividend Paid (86,400) (86,400)Preference Dividend Paid (14) (14)Balance Carried Forward 678,484 565,362
Annual Report of the Board of Directors

51
Annual Report 2010 / 2011
Fully Depreciated AssetsThe details of the fully depreciated assets are given on Note 3.5 to the Financial Statements.
InvestmentsInvestments of the Company amounted to Rs. 523 million (2009/2010 Rs. 523 million). Detailed description of the long term investments held as at the Balance Sheet date is given in Note 6 to the Financial Statements.
ReservesTotal reserves as at 31st March 2011 for the Company and Group amounted to Rs. 4,391 million (2009/2010 Rs. 2,526 million) and Rs. 4,178 million (2008/2009 Rs. 2,367 million) respectively. The detailed movement of reserves is given in the Statement of Changes in Equity on page 60 of the Annual Report.
Post Balance Sheet EventsEvents occurring after the Balance Sheet Date are given in Note 34 to the Financial Statements.
Contingent Liabilities and Capital CommitmentsThere were no material Contingent liabilities or Capital commitments as at 31 March 2011 except disclosed in Note 32 and 33 to the Financial Statements.
Human ResourcesCeylon Cold Stores PLC and its Subsidiary employed a 2,554 persons at 31st March 2011 (31st March 2010 - 2,532).
The Group is committed to pursuing various HR initiatives that ensure the individual development of all our team as well as facilitating the creation of value for themselves, the Group and all other stakeholders.
There were no material issues pertaining to employees and industrial relations during the year under review. The Company entered in to a new collective agreement with the workers union during the year.
System of Internal ControlsThe Directors acknowledge their responsibility for the Company system of Internal Control and having conducted a review of internal controls covering financial, operational, compliance controls and risk management, have obtained reasonable assurance of their effectiveness and successful adherence for the period up to the date of signing the Financial Statements.
Enterprise GovernanceEnterprise Governance practices and principles with respect to the management and operations of the Group is set out on pages 34 to 42 of the Annual Report. The Directors confirm that the Group is in compliance with the Rules on Corporate Governance as per the listing rules of Colombo Stock Exchange.
The Directors declare that: The Company and its Subsidiary have not engaged in any
activities, which contravene laws and regulations.
The Directors have declared all material interests in contracts involving the Company and its Subsidiary and refrained from voting on matters in which they were materially involved.
The Company has made all endeavor’s to ensure the equitable treatment of all shareholders.
Risk ManagementThe Group Policy on Risk Management and a summary of the key risks impacting the business is set out on pages 43 to 45 of the Annual Report.
Audit CommitteeThe following Non-Executive, Independent Directors of the Board served as members of the Audit Committee during the year.
Mr. A. R. Rasiah - ChairmanMr. P. S. JayawardenaProf. U. P. Liyanage
The report of the Audit Committee is given on pages 54 to 55 of the Annual Report. The Audit Committee has reviewed the other services provided by the External Auditors to the Group to ensure that their independence as Auditor has not been compromised.
Remuneration CommitteeAs permitted by the Listing Rules of the Colombo Stock Exchange, the Remuneration Committee of John Keells Holdings PLC, the parent Company of Ceylon Cold Stores PLC, functions as the Remuneration Committee of the Company. The Remuneration Committee of John Keells Holdings PLC comprises of three Independent Non-Executive Directors:
Mr. E. F. G. Amerasinghe - ChairmanMrs. S. TiruchelvamMr. P. D. Rodrigo
The remuneration policy of the Company is set out in the Corporate Governance section in the Annual Report.

52
Ceylon Cold Stores PLC (PQ4)
Share Market InformationAn Ordinary Share of the Company was quoted on the Colombo Stock Exchange at Rs. 750.60 as at 31st March 2011 (31st March 2010 - Rs.172.00). Information relating to earnings, dividends, net assets and market value per share is given in “Key Figures and Ratios” on page 89 and in the “Your Share in Detail” on pages 86 to 87.
Shareholding and Substantial ShareholdingsThere were 1,615 registered shareholders, holding ordinary voting shares as at 31st March 2011. The distribution of shareholding is given on page 86 of this report. The names of the twenty largest shareholders, the number of shares held and the percentage held are given on page 87 of the Annual Report.
Information to ShareholdersThe Board strives to be transparent and provide accurate information to shareholders in all published material.
DirectorateThe Board of Directors of Ceylon Cold Stores PLC who served during the year and as at the end of the Financial Year are given below and their brief profiles appear on pages 20 to 21 of the Annual Report. No other Director held office during the period under review.
Mr. S. C. Ratnayake (Chairman) (Non - Executive, Non Independent)Mr. A. D. Gunewardene (Non - Executive, Non Independent)Mr. J. R. F. Peiris (Non - Executive, Non independent)Mr. J. R. Gunaratne (Executive, Non independent)Prof. U. P. Liyanage (Non - Executive, Independent)Mr. P. S. Jayawardena (Non - Executive, Independent)Mr. A. R. Rasiah (Non - Executive, Independent)
The Board of Directors of Jaykay Marketing Services (Private) Limited who served during the year and as at the end of the Financial Year are given below. No other Director held office during the period under review.
Mr. S. C. Ratnayake (Chairman) (Non - Executive, Non Independent)Mr. J. R. F. Peiris (Non - Executive, Non Independent)Mr. K. N. J. Balendra (Non - Executive, Non Independent)Ms. M. R. N. Jayasundera Moreas (Executive, Non Independent)
Directors’ ShareholdingsShareholdings of Directors and the CEO of the Company and of their spouses in the Company are as follows: Number of SharesName of the Director 31/03/2011 31/03/2010
Mr. Susantha Chaminda Ratnayake 760 760 Mr. Ajit Damon Gunewardene 7,000 7,000 Mr. James Ronnie Felitus Peiris 150 150 Mr. Jitendra Romesh Gunaratne - CEO 1,140 1,140 Prof. Uditha Pilane Liyanage 300 300 Mr. Prasanna Sujeewa Jayawardena 300 300 Mr. Albert Rasakantha Rasiah 2,900 2,900 12,550 12,550
Retirement of Directors by rotation or otherwise and their Re-electionMr. J R F Peiris and Mr. J R Guneratne retire by rotation in terms of Article 84 of the Articles of Association of the Company, and being eligible offer themselves for re-election.
Directors RemunerationThe details of fees paid to the Directors of the Company and the Subsidiary are set out in Note 27 to the Financial Statements
Interest RegisterThe Company has maintained an Interests Register as contemplated by the Companies Act No. 7 of 2007. In compliance with the requirements of the Companies Act No. 7 of 2007 this Annual Report contains particulars of entries made in the Interests Register. As the Subsidiary Company is a private company which has dispensed with the need to maintain an Interests Register as permitted by Section 30 of the Companies Act No 7 of 2007, this Annual Report does not contain the particulars of entries made in the Interests Register of the Subsidiary.
Particulars of Entries in the Interests Register for the Financial Year 2010/11
a) Interests in Contracts – The Directors have all made a General Disclosure to the Board of Directors as permitted by Section 192 (2) of the Companies Act No 7 of 2007 and no additional interests have been disclosed by any Director.
b) Share Dealings: There have been no disclosures of share dealings as at 31st March 2011.
c) Indemnities and Remuneration.
Annual Report of the Board of Directors

53
Annual Report 2010 / 2011
The Board approved payments to the Executive Director of the Company, namely Mr. J R Gunaratne for the period 01st April 2010 to 31st March 2011, comprising of:
An increment from 1st July 2010 based on the individual performance rating obtained by the Executive Directors in terms of the Performance Management System of the John Keells Group;
Short term variable incentives based on individual performance, organisation performance and role responsibility based on the results of the financial year 2009/2010, paid in July 2010;
Long Term Incentive in the nature of ESOP in John Keells Holdings PLC dependent on the aforesaid performance rating, organisational rating and role responsibility granted in December 2010.
as recommended by the Remuneration Committee of John Keells Holdings PLC the holding company of Ceylon Cold Stores PLC in keeping with the Group remuneration policy.
SuppliersThe Group endeavours to transact business with reputed organisations capable of offering quality goods and services at competitive prices with a view to building mutually beneficial business relationships.
Statutory PaymentsThe Directors confirm to the best of their knowledge all taxes, duties and levies payable by the Group and all contributions, levies and taxes payable on behalf of and in respect of the employees of the Group and all other known statutory dues as were due and payable by Group as at the Balance Sheet date have been paid or where relevant provided for.
Environment ProtectionThe Group is conscious of the impact, direct and indirect, on the environment due to its business activities. Every endeavour is made to minimize the adverse effects on the environment to ensure sustainable continuity of our resources.
AuditorsThe Financial Statements for the year have been audited by Messrs. Ernst & Young Chartered Accountants.
The details of fees paid to the Auditors for the Company and its subsidiary are set out in Note 27 to the Financial Statements.
As far as the Directors are aware, the Auditors have no other relationship with the Company and its subsidiary.
Notice of MeetingThe Notice of Meeting relating to 114th Annual General Meeting is given on page 91 of the Annual Report.
J. R. Gunaratne J. R. F. Peiris Keells ConsultantsDirector Director (Private) Limited Secretaries
25th May 2011

54
Ceylon Cold Stores PLC (PQ4)
Audit Committee ReportThe powers and responsibilities of the Audit Committee are governed by the Audit Committee Charter which is approved and adopted by the Board. The Audit Committee is tasked mainly with assisting the Board in fulfilling its oversight responsibility to the shareholders, potential shareholders, the investment community and other stakeholders in relation to the integrity of the Company’s and the Consolidated Financial Statements of the Group and that the process is in accordance with the Company’s Act and other legislative reporting requirements. Furthermore the Audit Committee also ensures that adequate disclosures are made in the Financial Statements in accordance with the Sri Lanka Accounting Standards.
The Audit Committee also has the responsibility to ensure that the internal controls and the risk management process are adequate to meet the requirements of the Sri Lanka Auditing Standards and that the Company is in compliance with legal, regulatory and ethical requirements.
The Committee evaluates the performance and the independence of the Company’s internal audit function and the Company’s External Auditors. The Committee is also tasked with the responsibility of recommending to the Board the re-appointment and change of External Auditors and to recommend their remuneration and terms of engagement.
In fulfilling its purpose, it is the responsibility of the Audit Committee to maintain free and open communication between the Independent External Auditors, the Group Risk and Control Review Division, the outsourced Internal Auditors and the Management of the Company, and to ensure that all parties are aware of their responsibilities.
Composition of the Audit CommitteeThe Audit Committee is a sub-committee of the Board of Directors appointed by and responsible to the Board of Directors. The Audit Committee consists of three Independent, Non-Executive Directors in conformity with the listing rules of The Colombo Stock Exchange.
Mr. A R Rasiah – Chairman Prof. U P Liyanage Mr. P S Jayawardena
The Audit Committee comprises of individuals with extensive experience and expertise in the fields of Finance, Corporate Management, Legal and Marketing. The Chairman of the Audit Committee is a Chartered Accountant. A brief profile of each member of the Audit Committee is given on page 21 of this report under the section Board of Directors.
Meetings of the Audit CommitteeThe Audit Committee meets as often as may be deemed necessary or appropriate in its judgment and at least quarterly each year. During the year under review there were five (5) meetings and attendance of the committee members are given below.
The Executive Director / CEO, the Chief Financial Officer and the Head of Finance and Heads of Categories attended such meetings by invitation and briefed the Committee on specific issues. The External Auditors and the Internal Auditors were also invited to attend meetings when matters pertaining to official functions are taken up for consideration. The proceedings of the Audit Committee are reported to the Board of Directors by the Chairman of the Audit Committee.
Attendance at Audit Committee Meetings
Name 23rd
Apr
il 20
10
26th
Jul
y 20
10
21st
Oct
ober
201
0
27st
Jan
uary
201
1
9th
Mar
ch 2
011
Mr. A. R. Rasiah Y Y Y Y Y
Prof. U. Liyanage N N N Y Y
Mr. P. S. Jayawardena Y Y Y N N
Summary of Activities during the Financial YearOversight of Company and Consolidated Financial StatementsReviewed the activities and the financial affairs of the Company and the Subsidiary and the financial reporting system adopted in the preparation of the Quarterly and Annual Financial Statements to ensure reliability of the processes, appropriateness and consistency of accounting policies and methods adopted and that they facilitate compliance with the requirements of the Sri Lanka Accounting Standards (SLAS), the Companies Act No 07 of 2007 and other relevant statutory and regulatory requirements.
Reviewed the quarterly and year end Financial Statements and recommended their adaptation to the Board of Directors.
Appointment of External AuditorAs mentioned in the Audit Committee report for 2009/2010, Messrs. Ernst and Young – Chartered Accountants were recommended to be appointed as the new External Auditors of your Company which was approved at the AGM held on 29th June 2010.

55
Annual Report 2010 / 2011
Ernst & Young Advisory Services (Private) Limited (Associate Company of EY) who were previously providing outsourced internal audit services, ceased from providing such services to the Company in keeping with best practices and Messrs. Pricewaterhouse Coopers (Private) Limited, a firm of Chartered Accountants were appointed as new Internal Auditors with effect from 1st April 2010.
Review of Audit Committee CharterThe Audit Committee Charter was reviewed and revised during the year. The process adopted took into consideration the relevant provisions of the Companies Act No 07 of 2007, Listing Rules of Colombo Stock Exchange (CSE), Code of Best Practices on Corporate Governance issued jointly by the Securities and Exchange Commission of Sri Lanka (SEC) and the Institute of Chartered Accountants of Sri Lanka (ICASL) and the code of Best Practices on Audit Committees issued by ICASL. The new Charter was adopted from July 2010.
Internal AuditThe internal audit function of the Company has been outsourced to Messer’s Pricewaterhouse Coopers (Private) Limited, a firm of Chartered Accountants. The Audit Committee has agreed with the Internal Auditor as to the frequency of audits to be carried out, the scope of the audit and the areas to be covered and the fee to be paid for their services.
During the year under review, the Audit Committee has met the Internal Auditors to consider their reports, management responses and matters requiring follow up on the effectiveness of internal controls and audit recommendations.
The internal audit frequency depends on the risk profile of each area, higher risk areas being on a shorter audit cycle. The Audit Committee is of the opinion that the above approach provides an optimal balance between the need to manage risk and the costs thereof.
In September 2010, the Audit Committee decided to shift the focus of the internal audit from mere financial reviews to a more operational business assurance review. The new operating model has since been effectively implemented.
Risk and Control ReviewThe Audit Committee has reviewed the Business Risk Management Process and procedures adopted by the Company to manage and mitigate the effects of such risks and observe that the risk analysis exercise had been conducted within the Company. The key risks that could impact operations had been identified and appropriate action has been taken to mitigate their impact to the minimum extent.
External AuditThe External Auditors of the Company and its Subsidiary submitted a detailed audit plan for the financial year 2010/2011, which specified, inter alia, the areas of operations to be covered in respect of the Company and its Subsidiary. The audit plan specified ‘areas of special emphasis’ which had been identified from the last audit and from a review of current operations. The areas of special emphasis had been selected due to the probability of error and the material impact it can have on the Financial Statements. At the conclusion of the audit, the Auditors met with the Audit Committee to discuss and agree on the treatment of any matters of concern discovered in the course of the audit. There were pending of significance during the year under review.
The Audit Committee also reviews the audit fees of the External Auditors of the Company and of the Subsidiary and recommended its adoption by the Board. It also reviews the other services provided by the Auditors in ensuring that their independence as auditors are not compromised.
The Audit Committee has proposed to the Board of Directors that Messer’s Ernst and Young, Chartered Accountants, be recommended for reappointment as auditors for the year ending 31st March 2012, at the next Annual General Meeting.
Compliance with Financial Reporting and Statutory RequirementsThe Audit Committee receives a quarterly declaration from the Head of Finance, listing any departures from financial reporting, statutory requirements and Group policies. Reported exceptions, if any, are followed up to ensure that appropriate corrective action has been taken. With a view of ensuring uniformity of reporting, the Group has adopted the standardized format of Annual Financial Statements developed by the Parent Company.
ConclusionThe Audit Committee is satisfied that the effectiveness of the organisational structure of the Company and the Subsidiary in the implementation of the accounting policies and operational controls provide reasonable, assurance that the affairs of the Company and the Subsidiary are managed in accordance with accepted policies and that assets are properly accounted for and adequately safeguarded.
Rasakantha RasiahChairman, Audit Committee
25th May 2011

56
Ceylon Cold Stores PLC (PQ4)
The responsibility of the Directors, in relation to the Financial Statements, is set out in the following statement.
The responsibility of the Auditors, in relation to the Financial Statements prepared in accordance with the provisions of the Companies Act No. 7 of 2007, is set out in the Independent Auditors Report on page 57 of the Annual Report.
The Financial Statements comprise of: A Balance Sheet, which presents a true and fair view of the state
of affairs of the Company and its Subsidiary as at the end of the financial year; and
An Income Statement which presents a true and fair view of the profit and loss of the Company and its Subsidiary for the financial year.
The Directors are required to confirm that the Financial Statements have been prepared:
Using appropriate accounting policies, which have been selected and applied in a consistent manner, and material departures, if any have been disclosed and explained; and
Presented in accordance with Sri Lanka Accounting Standards; and that
Reasonable and prudent judgements and estimates have been made so that the form and substance of transactions are properly reflected; and .
Provides the information required by and otherwise comply with the Companies Act and the Listing Rules of the Colombo Stock Exchange.
The Directors are also required to ensure that the Company and its Subsidiary have adequate resources to continue in operation to justify applying the going concern basis in preparing these Financial Statements.
Further, the Directors have a responsibility to ensure that the Company and its Subsidiary maintains sufficient accounting records to disclose, with reasonable accuracy the financial position of the Company and of the Group.
The Directors are also responsible for taking reasonable steps to safeguard the assets of the Company and of the Group, and in this regard to give a proper consideration to the establishment of
Statement of Directors’ Responsibilities in Relation to the Financial Statementappropriate internal control systems with a view to preventing and detecting fraud and other irregularities.
The Directors are required to prepare the Financial Statements and to provide the Auditors with every opportunity to take whatever steps and undertake whatever inspections they may consider being appropriate to enable them to give their audit opinion.
Further, as required by section 56(2) of the Companies Act No.7 of 2007, the Board of Directors have confirmed that the Company, based on the information available, satisfies the solvency test immediately after the distribution, in accordance with Section 57 of the Companies Act No.7 of 2007, and has obtained a certificate from the Auditors, prior to declaring first and final dividend of Rs. 4.00 per share for this year paid on 23rd May 2011.
The Directors are of the view that they have discharged their responsibilities as set out in this statement.
Compliance ReportThe Directors confirm that to the best of their knowledge, all taxes, duties and levies payable by the Company and its Subsidiary, all contributions, levies and taxes payable on behalf of the employees of the Company and its Subsidiary, and all other known statutory dues as were due and payable by the Company and its Subsidiary as at the Balance Sheet date have been paid or, where relevant provided for except as specified in note 32 to the Financial Statements covering contingent liabilities.
By Order of the Board
Keells Consultants (Private) LimitedSecretaries
25th May 2011

57
Annual Report 2010 / 2011
Independent Auditors’ Report
TO THE SHAREHOLDERS OF CEYLON COLD STORES PLC
Report on the Financial StatementsWe have audited the accompanying financial statements of Ceylon Cold Stores PLC (“Company”), the consolidated financial statements of the Company and its subsidiary which comprise the balance sheets as at 31 March 2011, and the income statements, statements of changes in equity and cash flow statements for the year then ended, and a summary of significant accounting policies and other explanatory notes.
Management’s Responsibility for the Financial StatementsManagement is responsible for the preparation and fair presentation of these financial statements in accordance with Sri Lanka Accounting Standards. This responsibility includes: designing, implementing and maintaining internal control relevant to the preparation and fair presentation of financial statements that are free from material misstatement, whether due to fraud or error; selecting and applying appropriate accounting policies; and making accounting estimates that are reasonable in the circumstances.
Scope of Audit and Basis of OpinionOur responsibility is to express an opinion on these financial statements based on our audit. We conducted our audit in accordance with Sri Lanka Auditing Standards. Those standards require that we plan and perform the audit to obtain reasonable assurance whether the financial statements are free from material misstatement.
An audit includes examining, on a test basis, evidence supporting the amounts and disclosures in the financial statements. An audit also includes assessing the accounting policies used and significant
estimates made by management, as well as evaluating the overall financial statement presentation.
We have obtained all the information and explanations which to the best of our knowledge and belief were necessary for the purposes of our audit. We therefore believe that our audit provides a reasonable basis for our opinion.
OpinionIn our opinion, so far as appears from our examination, the Company maintained proper accounting records for the year ended 31 March 2011 and the financial statements give a true and fair view of the Company’s state of affairs as at 31 March 2011 and its profit and cash flows for the year then ended in accordance with Sri Lanka Accounting Standards.
In our opinion, the consolidated financial statements give a true and fair view of the state of affairs as at 31 March 2011 and the profit and cash flows for the year then ended, in accordance with Sri Lanka Accounting Standards, of the Company and its subsidiary dealt with thereby, so far as concerns the shareholders of the Company.
Report on Other Legal and Regulatory RequirementsIn our opinion, these financial statements also comply with the requirements of Section 151(2) and Sections 153(2) to 153(7) of the Companies Act No. 07 of 2007.
25th May 2011Colombo
Statement of Directors’ Responsibilities in Relation to the Financial Statement

58
Ceylon Cold Stores PLC (PQ4)
Balance Sheet Group CompanyAs at 31st March 2011 2010 2011 2010In Rs. ‘000 s Page Note
ASSETSNon-Current AssetsProperty, Plant and Equipment 70 3 3,689,511 3,789,440 2,512,617 2,946,089Intangible Assets 72 4 168,564 115,006 259 -Investment Properties 73 5 2,582,195 - 2,582,195 -Investments in Subsidiary 73 6 - - 522,892 522,892Deferred Tax Assets 73 7 42,340 64,299 - -Other Non Current Assets 73 8 76,230 58,778 58,371 43,653 6,558,840 4,027,523 5,676,334 3,512,634
Current AssetsInventories 75 9 1,602,826 1,368,845 436,754 347,143Trade and Other Receivables 75 10 1,290,848 853,859 850,164 520,135Tax Recoverable 75 11 106,949 95,205 - -Amounts Due from Related Parties 82 31 7,418 13,003 5,255 7,162Short Term Investments 75 12 - 33,000 - 30,000Cash in Hand and at Bank 75 12 72,974 95,003 19,861 55,709 3,081,015 2,458,915 1,312,034 960,149Total Assets 9,639,855 6,486,438 6,988,368 4,472,783
EQUITY AND LIABILITIESStated Capital 76 13 270,200 270,200 270,200 270,200Capital Reserves 76 14 2,853,957 1,155,779 2,853,957 1,155,779Revenue Reserves 76 15 1,324,484 1,211,362 1,536,950 1,370,595 4,448,641 2,637,341 4,661,107 2,796,574
Non-Current LiabilitiesInterest Bearing Borrowings 76 16 219,769 142,817 219,769 142,817Interest Bearing Borrowings from Related Parties 78 21 97,000 58,000 - -Deferred Tax Liabilities 77 17 76,741 96,698 76,741 96,698Employee Benefit Liabilities 77 18 316,901 280,319 270,136 239,416Deposits for Returnable Containers 256,644 216,400 256,644 216,400 967,055 794,234 823,290 695,331
Current LiabilitiesTrade and Other Payables 78 19 2,293,393 2,078,336 756,992 737,185Amounts Due to Related Parties 83 31 109,827 110,881 10,780 11,371Income Tax Liabilities 78 20 75,055 91,292 74,399 90,141Short Term Borrowings from Related Parties 78 21 164,164 164,164 - -Short Term Borrowings 78 22 232,000 - 232,000 -Current Portion of Long Term Interest Bearing Borrowings 76 16 153,048 140,757 153,048 140,757Bank Overdrafts 75 12 1,196,672 469,433 276,752 1,424 4,224,159 3,054,863 1,503,971 980,878Total Equity and Liabilities 9,639,855 6,486,438 6,988,368 4,472,783
I certify that the Financial Statements comply with the requirements of the Companies Act No.7 of 2007.
S. JayaweeraChief Financial Officer
The Board of Directors is responsible for the preparation and presentation of these Financial Statements.Signed for and on behalf of the Board by,
J. R. Guneratne J. R. F PeirisDirector Director
25th May 2011ColomboFigures in brackets indicate deductions.The Accounting Policies and Notes as set out in pages 63 to 85 form an integral part of these Financial Statements.

59
Annual Report 2010 / 2011
Income Statement Group CompanyFor the year ended 31st March Page Note 2011 2010 2011 2010In Rs. ‘000 s
Revenue 79 23 16,637,198 14,363,301 6,380,740 5,264,128
Cost of Sales (14,548,301) (12,565,520) (4,410,566) (3,539,972)
Gross Profit 2,088,897 1,797,781 1,970,174 1,724,156
Other Operating Income 80 24 337,332 304,068 93,827 79,167
Distribution Expenses (1,142,151) (903,808) (1,082,148) (832,243)
Administrative Expenses (457,158) (452,334) (261,636) (262,700)
Other Operating Expenses 80 25 (254,144) (203,843) (189,084) (170,939)
Finance Expenses 80 26 (89,794) (121,713) (40,172) (67,902)
Profit Before Income Tax 80 27 482,982 420,151 490,961 469,539
Tax Expense 81 28 (283,446) (191,277) (238,192) (189,533)
Profit for the Year 199,536 228,874 252,769 280,006
Attributable to: Minority Interests - -Equity Holders of the Parent 199,536 228,874 199,536 228,874
Basic Earnings Per Share 82 29.1 9.24 10.60
Dividend Per Share 82 30.3 4.00 4.00
Figures in brackets indicate deductions.
The Accounting Policies and Notes as set out in pages 63 to 85 form an integral part of these Financial Statements.

60
Ceylon Cold Stores PLC (PQ4)
Attributable to Equity Holders For The Year Ended 31st March 2011 Stated Revaluation Other General Retained TotalIn Rs. ‘000 s Capital Reserve Capital Reserve Earnings Reserves
COMPANYAs at 1st April 2009 270,200 1,151,805 3,974 646,000 531,003 2,602,982Profit for the Year - - - - 280,006 280,006Final Dividend Paid - 2008/09 - - - - (86,400) (86,400)Preference Dividends - (7%) - - - - (14) (14)As at 31 March 2010 270,200 1,151,805 3,974 646,000 724,595 2,796,574Profit for the Year - - - - 252,769 252,769Final Dividend Paid - 2009/10 - - - - (86,400) (86,400)Preference Dividends - (7%) - - - - (14) (14)Revaluation - 1,687,500 - - - 1,687,500Deferred Tax Impact due to reduction in Tax Rate - 10,678 - - - 10,678As at 31 March 2011 270,200 2,849,983 3,974 646,000 890,950 4,661,107
GROUPAs at 1st April 2009 270,200 1,151,805 3,974 646,000 422,902 2,494,881Profit for the Year - - - - 228,874 228,874Final Dividend Paid - 2008/09 - - - - (86,400) (86,400)Preference Dividends - (7%) - - - - (14) (14)As at 31 March 2010 270,200 1,151,805 3,974 646,000 565,362 2,637,341Profit for the Year - - - - 199,536 199,536Final Dividend Paid - 2009/10 - - - - (86,400) (86,400)Preference Dividends - (7%) - - - - (14) (14)Revaluation - 1,687,500 - - - 1,687,500Deferred Tax Impact due to reduction in Tax Rate - 10,678 - - - 10,678As at 31 March 2011 270,200 2,849,983 3,974 646,000 678,484 4,448,641
Figures in brackets indicate deductions.
The Accounting Policies and Notes as set out in pages 63 to 85 form an integral part of these Financial Statements.
Statement of Changes in Equity

61
Annual Report 2010 / 2011
Group CompanyFor the year ended 31st March Note 2011 2010 2011 2010In Rs. ‘000 s
CASH FLOWS FROM OPERATING ACTIVITIESOperating Profit Before Working Capital Changes A 1,072,961 1,045,754 852,071 875,564
Decrease /(Increase) in Inventories (233,981) (159,152) (89,611) 57,671Decrease / (Increase) in Trade and Other Receivables (438,514) 45,615 (327,901) 64,274Decrease in Dues from Related Parties 5,586 1,536 1,907 3,762(Decrease)/Increase in Dues to Related Parties (1,054) 2,567 (591) (4,283)Increase in Trade and Other Payables 215,102 485,840 19,807 159,899Cash Generated from Operations 620,100 1,422,161 455,682 1,156,887
Interest Expenses Paid (89,794) (121,713) (40,172) (67,902)Tax /ESC Paid (298,873) (314,347) (263,212) (289,629)Gratuity Paid (12,599) (11,545) (9,878) (9,320)
Net Cash Flow from Operating Activities 218,834 974,556 142,420 790,036
CASH FLOWS FROM /(USED IN) INVESTING ACTIVITIESPurchase and Construction of Property, Plant and Equipment (1,251,848) (333,763) (750,340) (202,067)Purchase of Intangible Assets (53,590) - (291) -Net of Staff Loans (Granted)/Recovered (23,484) 21,003 (19,683) 17,145Proceeds from Sale of Property, Plant and Equipment 1,045 2,812 920 -Interest Income Received 8,545 11,909 6,568 6,085Net Cash Flow used in Investing Activities (1,319,332) (298,039) (762,826) (178,837)
CASH FLOWS FROM / (USED IN) FINANCING ACTIVITIESDividend Paid to Equity Holders of Parent (86,400) (86,400) (86,400) (86,400)Dividend Paid to Preference Shareholders (14) (14) (14) (14)Net of Receipts/ (Repayments) of Short Term Loans by Related Parties 39,000 131,970 - (18,757)Net of Short term Borrowings Received 232,000 - 232,000 -Net of Long term Borrowings Received/(Paid) 89,243 (274,983) 89,243 (140,757)Net Deposits Received for Returnable Containers 44,401 11,758 44,401 11,758
Net Cash Flow used in Financing Activities 318,230 (217,669) 279,230 (234,170)
NET INCREASE / (DECREASE) IN CASH AND CASH EQUIVALENTS (782,268) 458,847 (341,176) 377,029
CASH AND CASH EQUIVALENTS AT THE BEGINNING OF THE YEAR (341,430) (800,277) 84,285 (292,744)
CASH AND CASH EQUIVALENTS AT THE END OF THE YEAR (1,123,698) (341,430) (256,891) 84,285
ANALYSIS OF CASH AND CASH EQUIVALENTS Short Term Investment - 33,000 - 30,000 Cash in hand and at Bank 72,974 95,003 19,861 55,709 Bank Overdrafts (1,196,672) (469,433) (276,752) (1,424)Total Cash and Cash Equivalents (1,123,698) (341,430) (256,891) 84,285
Cash Flow Statement
Figures in brackets indicate deductions.
The Accounting Policies and Notes as set out in pages 63 to 85 form an integral part of these Financial Statements.

62
Ceylon Cold Stores PLC (PQ4)
Group CompanyFor the year ended 31st March 2011 2010 2011 2010In Rs. ‘000 s
Note - AOperating Profit Before Working Capital ChangesProfit Before Tax 482,982 420,151 490,961 469,539
Adjustments for: Interest Income (8,545) (11,909) (6,568) (6,085)Profit on Sale of Investment - (3,131) - (3,131)Interest Expenses 89,794 121,713 40,172 67,902Depreciation of Property, Plant and Equipment 425,662 419,152 259,017 262,450Transfer from Work In Progress - 1,264 - 1,264Amortization of Intangible Assets 32 - 32 -Defined Benefit Plan Cost 49,181 46,217 40,597 37,211Loss / (Profit) on Sale of Property, Plant and Equipment 709 3,006 (486) 1Unrealized Foreign Exchange (Gain) / Loss (45) 40 (44) 40Bad Debt. Provision 7,682 10,304 2,881 7,426Returnable Containers Breakages and Disposals 29,666 108,881 29,666 108,881Deposits for Returnable Containers - Write back (4,158) (69,934) (4,157) (69,934) 1,072,960 1,045,754 852,069 875,564
Figures in brackets indicate deductions.
The Accounting Policies and Notes as set out in pages 63 to 85 form an integral part of these Financial Statements.
Cash Flow Statement

63
Annual Report 2010 / 2011
1. CORPORATE INFORMATIONCeylon Cold Stores PLC (PQ 4) is a Public Limited Liability Company incorporated and domiciled in Sri Lanka. The registered office of the Company is located at No 1, Justice Akbar Mawatha, Colombo 2 and the principal place of business is located at Samadaragahawatte, Ranala, Kaduwella.
Ordinary shares of the Company are listed on the Colombo Stock Exchange (CSE).
In the Annual report of the Board of Directors and in the Financial Statements, “The Company” refers to Ceylon Cold Stores PLC as the holding Company and “The Group” refers to the companies whose accounts have been consolidated therein.
The Consolidated Financial Statements of the Group for the year ended 31 March 2011 were authorized for issue by the Directors on 25th May 2011.
Principal Activities The principal activity of the company is the manufacture and marketing of Beverages and Frozen Confectionery.
The principal activity of Jaykay Marketing Services (Pvt) Ltd is retail trading and super marketing.
Parent Enterprise and Ultimate Parent EnterpriseThe Group’s parent undertaking is John Keells Holdings PLC. The Directors are of the opinion that the Group’s ultimate parent undertaking and controlling party is John Keells Holdings PLC which is incorporated in Sri Lanka.
2.1 Basis of PreparationThe Consolidated Financial Statements have been prepared on an accrual basis and under the historical cost convention unless stated otherwise.
The Consolidated Financial Statements are presented in Sri Lankan Rupees, which is the Group’s functional and presentation currency and all values are rounded to the nearest rupees thousand (Rs. ’000) except when otherwise indicated.
The Significant Accounting Policies are being discussed below.
a) Statement of ComplianceThe Balance Sheet, Statement of Income, Statement of Changes in
Equity and the Cash Flow Statement, together with the Accounting Policies and notes (the “Financial Statements”) of the Company and its subsidiary as at 31 March 2011 and for the year then ended; have been prepared and presented in accordance with the Sri Lanka Accounting Standards (SLAS) adopted by the Institute of Chartered Accountants of Sri Lanka. and requirements of the Companies Act No 7 of 2007.
b) Basis of ConsolidationThe Consolidated Financial Statements comprise the Financial Statements of the Company and its Subsidiary as at 31st March 2011. The Financial Statement of the subsidiary is prepared in compliance with the group’s Accounting Policies unless specifically stated.
All intra group balances, income and expenses and unrealized gains and losses resulting from Intra group transactions are eliminated in full.
Subsidiary is fully Consolidated from the date of acquisition or incorporation, being the date on which the group obtains control and continue to be consolidated until the date that such control ceases.
The Financial Statements of the Subsidiary is prepared for the same reporting period as the parent company, which is 12 months ending 31 March, using consistent accounting policies.
c) SubsidiarySubsidiaries are those enterprises controlled by the parent. Control exists when the parent holds more than 50% of the voting rights or otherwise has a controlling interest.
The following company has been consolidated under Section 152 of the Companies Act, No.7 of 2007, where the Company controls the composition of the Board of Directors of the Subsidiary.
% Holding
Jaykay Marketing Services (Pvt) Ltd. 100
Jaykay Marketing Services (Pvt) Ltd has been listed in the group directory.
The total profits and losses for the year, of the Company and of its Subsidiary are included in consolidated Income Statement. All assets and liabilities of the company and of its subsidiary are included in consolidate Balance Sheet. The Consolidated Cash Flow Statement includes the Cash Flows of the Company and its Subsidiary.
Accounting Policies
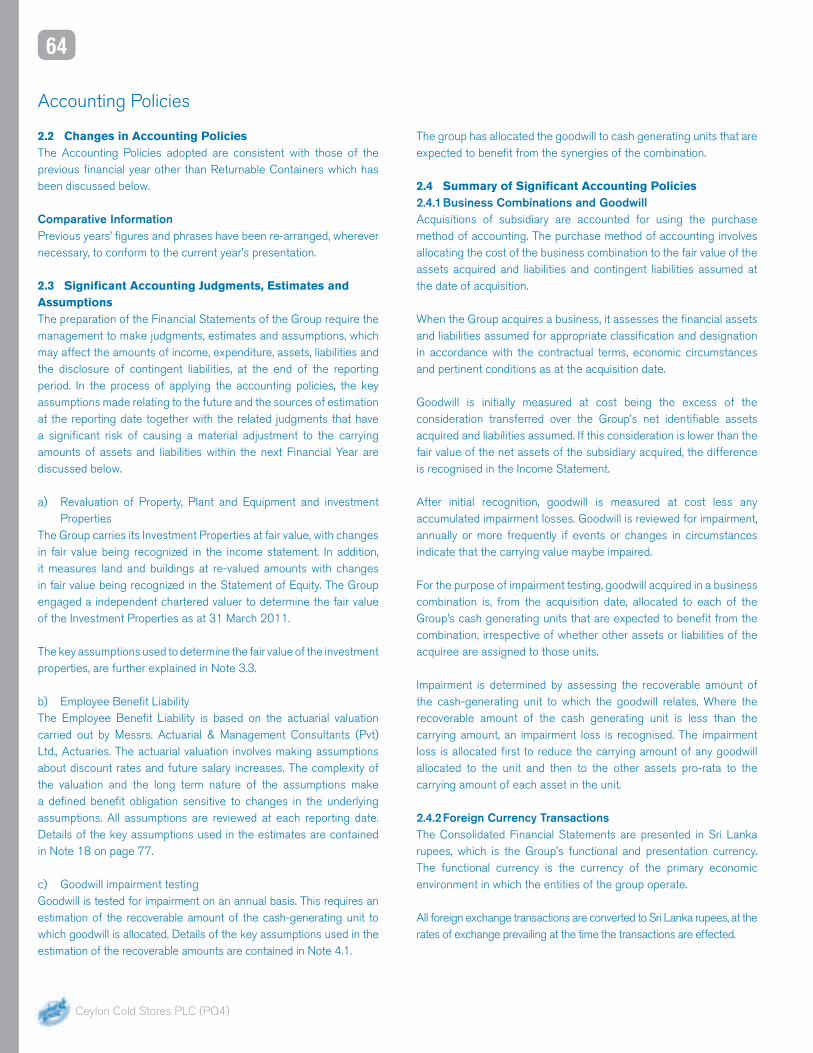
64
Ceylon Cold Stores PLC (PQ4)
2.2 Changes in Accounting PoliciesThe Accounting Policies adopted are consistent with those of the previous financial year other than Returnable Containers which has been discussed below.
Comparative InformationPrevious years’ figures and phrases have been re-arranged, wherever necessary, to conform to the current year’s presentation.
2.3 Significant Accounting Judgments, Estimates and AssumptionsThe preparation of the Financial Statements of the Group require the management to make judgments, estimates and assumptions, which may affect the amounts of income, expenditure, assets, liabilities and the disclosure of contingent liabilities, at the end of the reporting period. In the process of applying the accounting policies, the key assumptions made relating to the future and the sources of estimation at the reporting date together with the related judgments that have a significant risk of causing a material adjustment to the carrying amounts of assets and liabilities within the next Financial Year are discussed below.
a) Revaluation of Property, Plant and Equipment and investment Properties
The Group carries its Investment Properties at fair value, with changes in fair value being recognized in the income statement. In addition, it measures land and buildings at re-valued amounts with changes in fair value being recognized in the Statement of Equity. The Group engaged a independent chartered valuer to determine the fair value of the Investment Properties as at 31 March 2011.
The key assumptions used to determine the fair value of the investment properties, are further explained in Note 3.3.
b) Employee Benefit LiabilityThe Employee Benefit Liability is based on the actuarial valuation carried out by Messrs. Actuarial & Management Consultants (Pvt) Ltd., Actuaries. The actuarial valuation involves making assumptions about discount rates and future salary increases. The complexity of the valuation and the long term nature of the assumptions make a defined benefit obligation sensitive to changes in the underlying assumptions. All assumptions are reviewed at each reporting date. Details of the key assumptions used in the estimates are contained in Note 18 on page 77.
c) Goodwill impairment testingGoodwill is tested for impairment on an annual basis. This requires an estimation of the recoverable amount of the cash-generating unit to which goodwill is allocated. Details of the key assumptions used in the estimation of the recoverable amounts are contained in Note 4.1.
The group has allocated the goodwill to cash generating units that are expected to benefit from the synergies of the combination.
2.4 Summary of Significant Accounting Policies2.4.1 Business Combinations and GoodwillAcquisitions of subsidiary are accounted for using the purchase method of accounting. The purchase method of accounting involves allocating the cost of the business combination to the fair value of the assets acquired and liabilities and contingent liabilities assumed at the date of acquisition.
When the Group acquires a business, it assesses the financial assets and liabilities assumed for appropriate classification and designation in accordance with the contractual terms, economic circumstances and pertinent conditions as at the acquisition date.
Goodwill is initially measured at cost being the excess of the consideration transferred over the Group’s net identifiable assets acquired and liabilities assumed. If this consideration is lower than the fair value of the net assets of the subsidiary acquired, the difference is recognised in the Income Statement.
After initial recognition, goodwill is measured at cost less any accumulated impairment losses. Goodwill is reviewed for impairment, annually or more frequently if events or changes in circumstances indicate that the carrying value maybe impaired.
For the purpose of impairment testing, goodwill acquired in a business combination is, from the acquisition date, allocated to each of the Group’s cash generating units that are expected to benefit from the combination, irrespective of whether other assets or liabilities of the acquiree are assigned to those units.
Impairment is determined by assessing the recoverable amount of the cash-generating unit to which the goodwill relates. Where the recoverable amount of the cash generating unit is less than the carrying amount, an impairment loss is recognised. The impairment loss is allocated first to reduce the carrying amount of any goodwill allocated to the unit and then to the other assets pro-rata to the carrying amount of each asset in the unit.
2.4.2 Foreign Currency TransactionsThe Consolidated Financial Statements are presented in Sri Lanka rupees, which is the Group’s functional and presentation currency. The functional currency is the currency of the primary economic environment in which the entities of the group operate.
All foreign exchange transactions are converted to Sri Lanka rupees, at the rates of exchange prevailing at the time the transactions are effected.
Accounting Policies

65
Annual Report 2010 / 2011
Monetary assets and liabilities denominated in foreign currency are retranslated to Sri Lanka rupee equivalents at the exchange rate prevailing at the Balance Sheet date. Non-monetary assets and liabilities are translated using exchange rates that existed when the values were determined. The resulting gains and losses are accounted for in the income statement.
2.4.3 TaxIncome tax expense comprises of current and deferred tax. Income tax expense is recognized in the Income Statement except to the extent that it relates to items recognized directly in equity, in which case it is recognized in equity.
a) Current TaxCurrent tax is the expected tax payable on the taxable income for the year, using tax rates enacted or substantively enacted at the reporting date, and any adjustment to tax payable in respect of previous years. The elements of income and expenditure as reported in the Financial Statements and computed in accordance with the provisions of the Inland Revenue Act No. 10 of 2006 and amendments thereto. Relevant details are disclosed in note 28 to the Financial Statements.
b) Deferred TaxDeferred tax is provided using the liability method on temporary differences at the Balance Sheet date between the tax bases of assets and liabilities, and their carrying amounts for financial reporting purposes.
Deferred tax assets and liabilities are recognised for all temporary differences. Deferred tax assets are recognised for all deductible temporary differences, carry-forward of unused tax credits and unused tax losses, to the extent that it is probable that taxable profit will be available against which the deductible temporary differences, and the carry-forward of unused tax credits and unused tax losses can be utilized.
The carrying amount of deferred tax assets is reviewed at each Balance Sheet date and reduced to the extent that it is no longer probable that sufficient taxable profit will be available to allow all or part of the deferred tax asset to be utilised. Unrecognised deferred tax assets are reassessed at each Balance Sheet date and are recognised to the extent that it has become probable that future taxable profit will allow the deferred tax asset to be recovered.
Deferred tax assets and liabilities are measured at tax rates that are expected to apply to the year when the asset is realised or liability is settled, based on the tax rates and tax laws that have been enacted or substantively enacted as at the Balance Sheet date.
Income tax relating to items recognised directly in equity is recognised in equity.
Deferred tax assets and deferred tax liabilities are offset, if a legally enforceable right exists to set off current tax assets against current tax liabilities and the deferred taxes relate to the same taxable entity and the same taxation authority.
c) Sales taxRevenue, expenses and assets are recognized net of the amount of sales tax except:
where sales tax incurred on a purchase of a asset or service is not recoverable from the taxation authority, in which case the sales tax is recognized as part of the cost of acquisition of the asset or as part of the expense item as applicable; and
Receivables and payables that are stated with the amount of sales tax included.
The net amount of sales tax recoverable from, or payable to, the taxation authority is included as part of receivables or payables in the balance sheet.
2.4.4 Property, Plant and Equipmenta) Recognition and measurementThe Property, Plant and Equipment are recorded at cost /valuation less accumulated depreciation and impairment losses as setout below.
Land and Buildings are stated at valuation determined by an Independent Chartered Valuer.
All other classes of assets are stated at cost.
When an asset is revalued, any increase in the carrying amount is credited directly to a revaluation reserve, except to the extent that it reverses a revaluation decrease of the same asset previously recognised in the Income statement, in which case the increase is recognised in the Income statement. Any revaluation deficit that offsets a previous surplus in the same asset is directly offset against the surplus in the revaluation reserve and any excess recognised as an expense. Upon disposal, any revaluation reserve relating to the asset sold is transferred to retained earnings.
Where Land and Buildings are subsequently revalued, the entire class of such assets is revalued at fair value on the date of revaluation. The group has adopted a policy of revaluing assets every 5 years.
Items of Property, Plant and Equipment are derecognised upon disposal or when no future economic benefits are expected from its use. Any gain or loss arising on derecognising of the asset is included in the Income Statement in the year the asset is derecognised.

66
Ceylon Cold Stores PLC (PQ4)
The cost of Property, Plant and Equipment is the cost of purchase or construction together with any expenses incurred in bringing the assets to its working condition for its intended use.
Expenditure incurred for the purpose of acquiring, extending or improving assets of permanent nature by means of which to carry on the businesses or to increase the earning capacity of the business has been treated as capital expenditure.
The cost of Property, Plant and Equipment is the cash price equivalent at the recognition date. If payment is deferred beyond normal credit terms, the difference between the cash price equivalent and the total payment is recognized as interest over the period of credit unless such interest is recognized in the carrying amount of the item in accordance with the allowed alternative treatment in SALS 20.
Returnable containers are reflected under Property, Plant and Equipment’s at cost less accumulated depreciation and any impairment loses with effect from 1st April 2010. Depreciation is provided over its useful life. The bottle breakages during the financial year are written off to the income statement at written down value. Upon termination of dealership the weighted average cost of bottles not returned less the deposit is written off to the Income Statement
The carrying value of Property Plant and equipment are reviewed for impairment when events or changes in circumstances indicate that the carrying value may not be recoverable.
b) Subsequent Costs/ Replacement of PartsThe cost of replacing a part of an item of property, plant and equipment is recognized in the carrying amount of the item if it is probable that the future economic benefits embodied within the part will flow to the Group and its cost can be measured reliably. The carrying amount of those parts that are replaced is derecognized. The costs of the day-to-day servicing of property, plant and equipment are recognized in the Income Statement as incurred.
c) DepreciationProvision for depreciation is calculated by using a straight-line method on the cost or valuation of all property, plant and equipment, other than freehold land, in order to write off such amounts over the estimated useful economic life of such assets.
The buildings on leasehold land are depreciated over the lease term.
The estimated useful life of assets is as follows:
Assets Years
Buildings on freehold land 50
Buildings on leasehold land (Over lease period)
Plant and Machinery 10-20
Motor Vehicles 4 - 8
Furniture, Fittings and Other Equipment 3 - 10
Returnable Containers 5
Others 2 - 10
The useful life, residual values and depreciation methods of assets are reviewed, and adjusted if required, at the end of each financial year.
2.4.5 Investment PropertiesInvestment Properties acquired are measured initially at cost. The carrying value of an investment property includes the cost of replacing part of an existing investment property at the time that cost is incurred if the recognition criteria are met and excludes the costs of day to day servicing of the investment property. Subsequent to initial recognition, investment properties are stated at fair value, which reflect market conditions at the balance sheet date.
Gains or losses arising from changes in fair value are included in the income statement in the period of de recognition.
Investment Properties are derecognised when disposed, or permanently withdrawn from use because no future economic benefits are expected. Any gains or losses on retirement or disposal are recognised in the income statement in the year of retirement or disposal.
Transfers are made to or from Investment Properties only when there is a change in use. For a transfer from investment properties to owner occupied property, the deemed cost for subsequent accounting is the fair value at the date of change in use. If an owner-occupied property becomes an investment property that will be carried at fair value, the Company applies SLAS 18 Property, Plant and Equipment (Revised 2005) up to the date of change in use. The Company treats any difference at that date between the carrying amount of the property in accordance with SLAS 18 and its fair value in the same way as a revaluation in accordance with SLAS 18.
2.4.6 Equity InvestmentsUnquoted securities, which are held as non-current investments, are valued at cost. The cost of the investment is the cost of acquisition inclusive of brokerage and costs of transaction. The carrying amounts of long term investments are reduced to recognise a decline which is considered other than temporary, in the value of investments, determined on an individual investment basis.
In the Company’s Financial Statements, investments in subsidiary have been accounted for at cost, net of any impairment losses which are charged to the income statement. Incomes from these investments are recognised only to the extent of dividends received.
Accounting Policies

67
Annual Report 2010 / 2011
2.4.7 Intangible AssetsIntangible assets acquired separately are measured on initial recognition at cost. The cost of intangible assets acquired in a business combination is the fair value as at the date of acquisition.
Following initial recognition, intangible assets are carried at cost less any accumulated amortisation and any accumulated impairment losses.
Software licenses cost is recognised as an intangible asset and amortised over the period of expected future usage.
Internally generated intangible assets, excluding capitalised development costs, are not capitalized, and expenditure is charged against Income Statement in the year in which the expenditure is incurred.
The useful lives of intangible assets are assessed as either finite or indefinite lives. Intangible assets with finite lives are amortised over the useful economic life and assessed for impairment whenever there is an indication that the intangible asset may be impaired. The amortisation period and the amortisation method for an intangible asset with a finite useful life is reviewed at least at each financial year-end and such changes are treated as accounting estimates. The amortisation expense on intangible assets with finite lives is recognised in the Income Statement.
2.4.8 Impairment of AssetsThe Group assesses at each reporting date whether there is an indication that an asset may be impaired. If any such indication exists, or when annual impairment testing for an asset is required, the Group makes an estimate of the asset’s recoverable amount. An asset’s recoverable amount is the higher of an asset’s or cash generating unit’s fair value less cost to sell and its value in use and is determined for an individual asset, unless the asset does not generate cash inflows that are largely independent of those from other assets or groups of assets. Where the carrying amount of an asset exceeds its recoverable amount, the asset is considered impaired and is written down to its recoverable amount. In assessing value in use, the estimated future cash flows are discounted to their present value using a pre-tax discount rate that reflects current market assessments of the time value of money and the risks specific to the asset.
Impairment losses are recognized in the Income Statement, except that, impairment losses in respect of property, plant and equipment are recognized against the revaluation reserve to the extent that it reverses a previous revaluation surplus.
An assessment is made at each reporting date as to whether there is any indication that previously recognized impairment losses may
no longer exist or may have decreased. If such indication exists, the recoverable amount is estimated. A previously recognized impairment loss is reversed only if there has been a change in the estimates used to determine the asset’s recoverable amount since the last impairment loss was recognized. If that is the case the carrying amount of the asset is increased to its recoverable amount. That increased amount cannot exceed the carrying amount that would have been determined, net of depreciation, had no impairment loss been recognized for the asset in prior years. Such reversal is recognized in profit or loss unless the asset is carried at revalued amount, in which case the reversal is treated as a revaluation increase. After such a reversal the depreciation charge is adjusted in future periods to allocate the asset’s revised carrying amount, less any residual value, on a systematic basis over its remaining useful life. Impairment loss on goodwill is not reversed.
2.4.9 InventoriesInventories are measured at the lower of cost and net realizable value. Net realisable value is the estimated selling price less estimated costs of completion and the estimated costs necessary to make the sale.
The costs incurred in bringing inventories to its present location and condition, are accounted for as follows:
Raw materials - On actual cost on a weighted average basis
Finished/Trading goods - valued at full cost on weighted average basis;
Work in Progress - at weighted average cost of direct material excluding packing material, and appropriate proportions of direct cost based on percentage completed
Machinery Spares - At actual cost Other inventories - At actual cost on weighted average
basis
2.4.10 Trade and Other ReceivableTrade and other receivable are stated at the amounts they are estimated to realise, net of provisions for bad and doubtful receivables.
A provision for doubtful debts is made when the debt exceeds 180 days and the collection of the full amount is no longer probable. Bad debts are written off when identified.
2.4.11 Short-Term InvestmentsTreasury bills and other interest earning securities held for resale in the near future to benefit from short-term market movements are accounted for at cost plus the relevant proportion of the discounts or premiums.

68
Ceylon Cold Stores PLC (PQ4)
2.4.12 Cash and Cash EquivalentsCash and cash equivalents in the Cash Flow Statement comprise cash at bank and in hand and short term Investment with a maturity of 3 months or less, net of outstanding bank overdrafts.
2.4.13 Defined Benefit Plan – GratuityThe liability recognized in the Balance Sheet is the present value of the defined benefit obligation at the Balance Sheet date using the projected unit credit method. Any actuarial gains or losses arising are recognised immediately in the Income Statement.
2.4.14 Defined Contribution Plan - Employees’ Provident Fund and Employees’ Trust FundEmployees are eligible for Employees’ Provident Fund contributions and Employees’ Trust Fund contributions in line with respective statutes and regulations. The Group contributes a minimum of the defined percentages of gross emoluments of employees to an approved Employees’ Provident Fund and to the Employees’ Trust Fund respectively which are externally funded.
2.4.15 Provisions, Contingent Assets and Contingent LiabilitiesProvisions are recognised when the Group has a present obligation (legal or constructive) as a result of a past event, it is probable that an outflow of resources embodying economic benefits will be required to settle the obligation and a reliable estimate can be made of the amount of the obligation. Where the company expects some or all of a provision to be reimbursed, for example under an insurance contract, the reimbursement is recognised as a separate asset but only when the reimbursement is virtually certain. The expense relating to any provision is presented in the income statement net of any reimbursement. If the effect of the time value of money is material, provisions are discounted using a current pre-tax rate that reflects, where appropriate, the risks specific to the liability. Where discounting is used, the increase in the provision due to the passage of time is recognised as a finance cost.
All contingent liabilities are disclosed as a note to the Financial Statements unless the outflow of resources is remote.
2.4.16 Revenue RecognitionRevenue is recognised to the extent that it is probable that the economic benefits will flow to the group, and the revenue and associated costs incurred or to be incurred can be reliably measured. Revenue is measured at the fair value of the consideration received or receivable, net of trade discounts and value added taxes, after eliminating sales within the group.
The following specific criteria are used for recognition of revenue:
Sale of goods Revenue from the sale of goods is recognised when the significant
risk and rewards of ownership of the goods have passed to the buyer with the Group retaining neither a continuing managerial involvement to the degree usually associated with ownership, nor an effective control over the goods sold.
Rendering of services Revenue from rendering of services is recognised in the
accounting period in which the services are rendered or performed.
Turnover based Taxes Turnover based taxes include value added tax, Nation Building
Tax and Turnover Tax (TT), which are recognised in the Financial Statements to the period which it relates in respect of the trading activities of the Group.
The Group pays such taxes in accordance with the respective statutes
Dividend Dividend income is recognised on a cash basis.
Franchise Income Franchise Fees is recognised on an accrual basis
Rental Income Rental income is recognised on an accrual basis over the term of
the lease.
Interest Income Interest income is recognized on an accrual basis unless
collectibility is in doubt.
Gains and losses Net gains and losses of a revenue nature arising from the
disposal of property, plant and equipment and other non-current assets, including investments, are accounted for in the Income Statement, after deducting from the proceeds on disposal, the carrying amount of such assets and the related selling expenses.
Gains and losses arising from activities incidental to the main revenue generating activities and those arising from a group of similar transactions which are not material, are aggregated, reported and presented on a net basis
Accounting Policies

69
Annual Report 2010 / 2011
Any losses arising from guaranteed rentals are accounted for in the year of incurring the same. A provision is recognised if the best estimate indicates a loss.
Other income Other income which consists of Promotional Income, Scrap sales
and others are recognized on an accrual basis.
2.4.17 Expenditure Recognition Expenses are recognised in the Income Statement on the basis
of a direct association between the cost incurred and the earning of specific items of income. All expenditure incurred in the running of the business and in maintaining the property, plant and equipment in a state of efficiency has been charged to the Income Statement.
For the purpose of presentation of the Income Statement, the “function of expenses” method has been adopted, on the basis that it presents fairly the elements of the Company and Group’s performance
Borrowing costs Borrowing costs are recognised as an expense in the period in
which they are incurred unless they are incurred in respect of qualifying assets in which case it is capitalized.
Operating Leases Leases, where the lessor effectively retains substantially all of
the risks and benefits of ownership over the term of the lease, are classified as operating leases.
Lease payments are recognised as an expense in the Income Statement on a straight-line basis over the term of the lease.
Research and development Expenditure on Research and development recognized as expense
when incurred.
2.5 Segment Informationa) Reporting Segments The Group internal organization and management is structured
based on individual products and services which are similar in nature and process and where the risk and return are similar. The primary segments represent this business structure.
Since the individual segments are located close to each other and operate in the same industry environment and catering to clientele from the same geographical location the needs for geographical segmentation does not arise.
b) Inter segment Pricing Inter segment transactions are priced at fair market values.
c) Segment Information Segment information has been prepared in conformity with the
accounting policies adopted for preparing and presenting the Consolidated Financial Statements of the group.
2.6 Events Occurring After The Balance Sheet DateAll material post Balance Sheet events have been considered and where appropriate, adjustment or disclosures have been made in respective notes to the Financial Statements.
2.7 Effect of Sri Lanka Accounting Standards Issued but not yet EffectiveThe following standards have been issued by the Institute of Chartered Accountants of Sri Lanka.
Sri Lanka Accounting Standard 44 Financial Instruments; Presentation (SLAS 44)
Sri Lanka Accounting Standard 45 Financial Instruments; Recognition and Measurement (SLAS 45)
Sri Lanka Accounting Standard 39 Share Based Payments (SLAS 39)
The effective date of SLAS 44, 45 and 39 was changed during the year to be effective for financial periods beginning on or after 01 January 2012. These three standards have been amended and forms a part of the new set of financial reporting standards mentioned below.
Following the convergence of Sri Lanka Accounting Standards with the International Financial Reporting Standards, the Council of the Institute of Chartered Accountants of Sri Lanka has adopted a new set of financial reporting standards that would apply for financial periods beginning on or after 01 January 2012. The application of these financial reporting standards is substantially different to the prevailing standards.
Due to the complex nature of the effects of these standards the impact of adoption in the period of initial application cannot be estimated as at the date of publication of these Financial Statements.
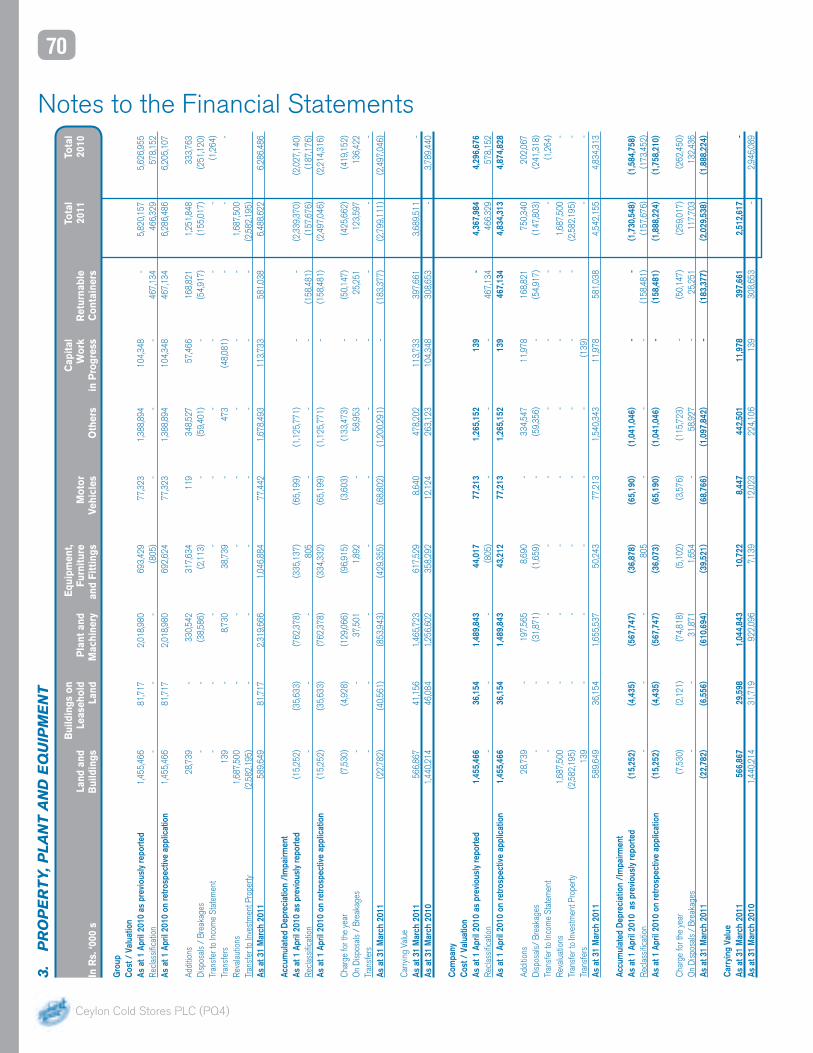
70
Ceylon Cold Stores PLC (PQ4)
3.
PR
OP
ER
TY
, PLA
NT
AN
D E
QU
IPM
EN
T
Bui
ldin
gs o
n
Equ
ipm
ent,
C
apit
al
To
tal
Tota
l
Land
and
Le
aseh
old
Pla
nt a
nd
Furn
itur
e M
otor
Wor
k R
etur
nabl
e 20
11
2010
In R
s. ‘0
00 s
B
uild
ings
La
nd
Mac
hine
ry
and
Fitt
ings
Ve
hicl
es
Oth
ers
in P
rogr
ess
Con
tain
ers
G
roup
Cost
/ V
alua
tion
As a
t 1 A
pril
2010
as
prev
ious
ly re
porte
d 1,
455,
466
81,7
17
2,01
8,98
0 69
3,42
9 77
,323
1,
388,
894
104,
348
- 5,
820,
157
5,62
6,95
5Re
class
ifica
tion
- -
- (8
05)
- -
- 46
7,13
4 46
6,32
9 57
8,15
2As
at 1
Apr
il 20
10 o
n re
trosp
ectiv
e ap
plic
atio
n 1,
455,
466
81,7
17
2,01
8,98
0 69
2,62
4 77
,323
1,
388,
894
104,
348
467,
134
6,28
6,48
6 6,
205,
107
Addi
tions
28
,739
-
330,
542
317,
634
119
348,
527
57,4
66
168,
821
1,25
1,84
8 33
3,76
3Di
spos
als
/ Br
eaka
ges
- -
(38,
586)
(2
,113
) -
(59,
401)
-
(54,
917)
(1
55,0
17)
(251
,120
)Tr
ansf
er to
Inco
me
Stat
emen
t -
- -
- -
- -
- -
(1,2
64)
Tran
sfer
s 13
9 -
8,73
0 38
,739
-
473
(48,
081)
-
- -
Reva
laut
ions
1,
687,
500
- -
- -
- -
- 1,
687,
500
Tran
sfer
to In
vest
men
t Pro
perty
(2
,582
,195
) -
- -
- -
- -
(2,5
82,1
95)
As a
t 31
Mar
ch 2
011
589,
649
81,7
17
2,31
9,66
6 1,
046,
884
77,4
42
1,67
8,49
3 11
3,73
3 58
1,03
8 6,
488,
622
6,28
6,48
6
Accu
mul
ated
Dep
reci
atio
n /I
mpa
irmen
tAs
at 1
Apr
il 20
10 a
s pr
evio
usly
repo
rted
(15,
252)
(3
5,63
3)
(762
,378
) (3
35,1
37)
(65,
199)
(1
,125
,771
) -
- (2
,339
,370
) (2
,027
,140
)Re
class
ifica
tion
- -
- 80
5 -
- -
(158
,481
) (1
57,6
76)
(187
,176
)As
at 1
Apr
il 20
10 o
n re
trosp
ectiv
e ap
plic
atio
n (1
5,25
2)
(35,
633)
(7
62,3
78)
(334
,332
) (6
5,19
9)
(1,1
25,7
71)
- (1
58,4
81)
(2,4
97,0
46)
(2,2
14,3
16)
Char
ge fo
r the
yea
r (7
,530
) (4
,928
) (1
29,0
66)
(96,
915)
(3
,603
) (1
33,4
73)
- (5
0,14
7)
(425
,662
) (4
19,1
52)
On
Disp
osal
s /
Brea
kage
s -
- 37
,501
1,
892
- 58
,953
-
25,2
51
123,
597
136,
422
Tran
sfer
s -
- -
- -
- -
- -
-As
at 3
1 M
arch
201
1 (2
2,78
2)
(40,
561)
(8
53,9
43)
(429
,355
) (6
8,80
2)
(1,2
00,2
91)
- (1
83,3
77)
(2,7
99,1
11)
(2,4
97,0
46)
Carry
ing
Valu
e As
at 3
1 M
arch
201
1 56
6,86
7 41
,156
1,
465,
723
617,
529
8,64
0 47
8,20
2 11
3,73
3 39
7,66
1 3,
689,
511
-As
at 3
1 M
arch
201
0 1,
440,
214
46,0
84
1,25
6,60
2 35
8,29
2 12
,124
26
3,12
3 10
4,34
8 30
8,65
3 -
3,78
9,44
0
Com
pany
Cost
/ V
alua
tion
As a
t 1 A
pril
2010
as
prev
ious
ly re
porte
d 1,
455,
466
36,1
54
1,48
9,84
3 44
,017
77
,213
1,
265,
152
139
- 4,
367,
984
4,29
6,67
6Re
class
ifica
tion
- -
- (8
05)
- -
- 46
7,13
4 46
6,32
9 57
8,15
2As
at 1
Apr
il 20
10 o
n re
trosp
ectiv
e ap
plic
atio
n 1,
455,
466
36,1
54
1,48
9,84
3 43
,212
77
,213
1,
265,
152
139
467,
134
4,83
4,31
3 4,
874,
828
Addi
tions
28
,739
-
197,
565
8,69
0 -
334,
547
11,9
78
168,
821
750,
340
202,
067
Disp
osal
s/ B
reak
ages
-
- (3
1,87
1)
(1,6
59)
- (5
9,35
6)
- (5
4,91
7)
(147
,803
) (2
41,3
18)
Tran
sfer
to In
com
e St
atem
ent
- -
- -
- -
- -
- (1
,264
)Re
valu
atio
ns
1,68
7,50
0 -
- -
- -
- -
1,68
7,50
0 -
Tran
sfer
to In
vest
men
t Pro
perty
(2
,582
,195
) -
- -
- -
- -
(2,5
82,1
95)
-Tr
ansf
ers
139
- -
- -
- (1
39)
-
-As
at 3
1 M
arch
201
1 58
9,64
9 36
,154
1,
655,
537
50,2
43
77,2
13
1,54
0,34
3 11
,978
58
1,03
8 4,
542,
155
4,83
4,31
3
Accu
mul
ated
Dep
reci
atio
n /I
mpa
irmen
tAs
at 1
Apr
il 20
10 a
s pr
evio
usly
repo
rted
(15,
252)
(4
,435
) (5
67,7
47)
(36,
878)
(6
5,19
0)
(1,0
41,0
46)
- -
(1,7
30,5
48)
(1,5
84,7
58)
Recla
ssifi
catio
n -
- -
805
- -
- (1
58,4
81)
(157
,676
) (1
73,4
52)
As a
t 1 A
pril
2010
on
retro
spec
tive
appl
icat
ion
(15,
252)
(4
,435
) (5
67,7
47)
(36,
073)
(6
5,19
0)
(1,0
41,0
46)
- (1
58,4
81)
(1,8
88,2
24)
(1,7
58,2
10)
Char
ge fo
r the
yea
r (7
,530
) (2
,121
) (7
4,81
8)
(5,1
02)
(3,5
76)
(115
,723
) -
(50,
147)
(2
59,0
17)
(262
,450
)O
n Di
spos
als
/ Br
eaka
ges
- -
31,8
71
1,65
4 -
58,9
27
- 25
,251
11
7,70
3 13
2,43
6As
at 3
1 M
arch
201
1 (2
2,78
2)
(6,5
56)
(610
,694
) (3
9,52
1)
(68,
766)
(1
,097
,842
) -
(183
,377
) (2
,029
,538
) (1
,888
,224
)
Carr
ying
Val
ueAs
at 3
1 M
arch
201
1 56
6,86
7 29
,598
1,
044,
843
10,7
22
8,44
7 44
2,50
1 11
,978
39
7,66
1 2,
512,
617
-As
at 3
1 M
arch
201
0 1,
440,
214
31,7
19
922,
096
7,13
9 12
,023
22
4,10
6 13
9 30
8,65
3 -
2,94
6,08
9
Notes to the Financial Statements

71
Annual Report 2010 / 2011
3.1 The Land ( other than Freehold Land at Glennie Street and Justice Akbar Mawatha) and Buildings were revalued during the financial year ended 31 March 2008 by Messrs. P.B. Kalugalagedara & Associates - Chartered valuation surveyors. The properties were valued at their open market / fair value, and the surplus arising from the revaluation was transferred to the revaluation reserve.
3.2 The carrying amount of revalued assets that would have been included in the Financial Statements had the assets been carried at cost less depreciation as follows;
As at 31st March Cost Accumulated Net Book Net Book Depreciation Value ValueIn Rs. ‘000s 2011 2010
Class of assetFreehold Land 57,266 - 57,266 256,383Freehold Buildings 266,054 112,747 153,307 158,621Buildings on Leasehold Land 27,964 18,666 9,298 10,078
3.3 Due to change in nature of use, Freehold Land at Glennie Street and Justice Akbar Mawatha, was transferred as Investment Property and these properties were revalued as at 31 March 2011 by Messrs. P.B. Kalugalagedara & Associates - Chartered valuation surveyors. The Land was valued at their open market / fair value, and the surplus arising from the revaluation was transferred to the revaluation reserve.
3.4 Returnable Containers previously classified under Non Current Assets were reclassified under Property ,Plant and Equipment during the financial year ended 31 March 2011.
3.5 Property, Plant and Equipment with a cost of Rs.1,252 million (2010 - Rs. 1,054 million) have been fully depreciated and are in use by the Company and its Subsidiary.
3.7 Building on Leasehold LandThe Company and its Subsidiary has constructed buildings on lease hold land. Future minimum lease payments under non cancellable operating leases are as follows:
Group CompanyAs at 31st March 2011 2010 2011 2010In Rs. ‘000s
Not later than one year 10,688 4,881 3 3Later than one year and not later than five years 39,516 52,913 11 11Later than five years - 9,384 24 27

72
Ceylon Cold Stores PLC (PQ4)
TotalAs at 31st March GOODWILL SOFTWARE 2011 2010In Rs. ‘000 s
4. INTANGIBLE ASSETSGroupCostAt the beginning of the year as previously reported 143,706 - 143,706 143,706Reclassification - 805 805 805At the beginning of the year - retrospective application 143,706 805 144,511 144,511Additions - 53,590 53,590 -Disposals - (11) (11) -At the end of the year 143,706 54,384 198,090 144,511
Impairment/AmortizationAt the beginning of the year as previously reported (28,700) - (28,700) (28,700)Reclassification - (805) (805) (805)At the beginning of the year - retrospective application (28,700) (805) (29,505) (29,505)Amortizations - (32) (32) -On Disposals - 11 11 -At the end of the year (28,700) (826) (29,526) (29,505)
Carrying Value31st March 2011 115,006 53,558 168,564 -
31st March 2010 115,006 - - 115,006
CompanyCostAt the beginning of the year as previously reported - - - -Reclassification - 805 805 805At the beginning of the year - retrospective application - 805 805 805Additions - 291 291 -Disposals - (11) (11) -At the end of the year - 1,085 1,085 805
Impairment/AmortizationAt the beginning of the year as previously reported - - - -Reclassification - (805) (805) (650)At the beginning of the year - retrospective application - (805) (805) (805)Amortization - (32) (32) (155)On Disposals - 11 11 -At the end of the year - (826) (826) (805)
Carrying Value31st March 2011 - 259 259 -
31st March 2010 - - - -
4.1 The recoverable amount of the cash generating unit relevant to goodwill is more than the carrying amount as at the Balance Sheet date. Therefore no impairment loss is recognised in respect of Goodwill as at 31st March 2011.
4.2 Software previously classified under Property Plant and Equipment were reclassified to Intangible Assets during the Financial Year ended 31 March 2011.
Notes to the Financial Statements

73
Annual Report 2010 / 2011
Group CompanyAs at 31st March NOTE 2011 2010 2011 2010In Rs. ‘000 s
5. INVESTMENT PROPERTIESAt the beginning of the year - - - -Transfers 3.3 2,582,195 - 2,582,195 -At the end of the year 2,582,195 - 2,582,195 -
6. INVESTMENTS IN SUBSIDIARYCarrying ValueInvestments in Subsidiary - Unquoted 6.1 - - 522,892 522,892 - - 522,892 522,892
6.1 Investments in SubsidiaryJaykay Marketing Services (Pvt) Ltd. - - 522,892 522,892 - - 522,892 522,892
7. DEFERRED TAX ASSETAt the beginning of the year 64,299 55,432 - -(Reversal) for the year (21,959) 8,867 - -At the end of the year 42,340 64,299 - -
The closing Deferred Tax Asset balance relates to the following : Accelerated Depreciation for Tax Purposes (90,401) (80,419) - -Retirement Benefit Obligations 13,094 14,315 - -Tax Losses 119,647 130,403 - -Balance as at year end 42,340 64,299 - -
The Subsidiary Company Jaykay Marketing Services (Pvt) Ltd has recognised the Deferred Tax asset amounting to Rs. 42Mn (2010-64 Mn) based on the amount of unused tax losses carried forward as at 31 March 2011, to the extent that is probable that future taxable profits will be available against which the unused tax losses can be utilised. The availability of future taxable profits have been computed on the basis of forecasted profits of Jaykay Marketing Services (Pvt) Ltd for the next 5 years.
Group Company 2011 2010 2011 2010
8. OTHER NON-CURRENT ASSETSRETURNABLE CONTAINERS - - - - LOANS TO STAFF - RECEIVABLES AFTER ONE YEAR 76,230 58,778 58,371 43,653 76,230 58,778 58,371 43,653

74
Ceylon Cold Stores PLC (PQ4)
Group Company 2011 2010 2011 2010 8. OTHER NON-CURRENT ASSETS (contd.)8.1 Returnable ContainersCostAt the beginning of the year - 578,957 - 578,957 Purchases during the year - 81,104 - 81,104 Breakages/Disposals during the year - (192,928) - (192,928)As of 1st April 2010 - previously reported - 467,133 - 467,133 Reclassification - (467,133) - (467,133)At the end of the year - retrospective application - - - -
Accumulated Depreciation / ImpairmentAt the beginning of the year - (187,981) - (187,981)Charge for the year - (54,546) - (54,546)Adjustment on Breakages/Disposal - 84,047 - 84,047 As of 1st April 2010 - previously reported - (158,480) - (158,480)Reclassification - 158,480 - 158,480 At the end of the year - retrospective application - - - -
Carrying Value at the end of the year - 308,653 - 308,653 Reclassification - (308,653) - (308,653)Carrying Value at the end of the year - retrospective application - - - -
8.2 Loans to StaffAt the beginning of the year 82,646 103,650 61,528 78,673Loans granted during the year 58,922 22,309 45,973 18,799Loans recovered during the year (35,437) (43,312) (26,290) (35,944)At the end of the year 106,131 82,647 81,211 61,528
Receivables within One year (vide Note No :8) 29,901 23,869 22,840 17,875Receivables after One year 76,230 58,778 58,371 43,653 106,131 82,647 81,211 61,528
Notes to the Financial Statements

75
Annual Report 2010 / 2011
Group CompanyAs at 31st March 2011 2010 2011 2010In Rs. ‘000 s
9. INVENTORIESRaw Materials 164,947 117,226 164,947 117,226Work-in-Progress 21,199 24,908 21,199 24,908Finished Goods 1,311,331 1,135,637 158,994 113,935Machinery Spares 86,173 87,476 86,173 87,476Other Stocks 19,176 3,598 5,441 3,598 1,602,826 1,368,845 436,754 347,143
Group CompanyAs at 31st March Note 2011 2010 2011 2010In Rs. ‘000 s
10. TRADE AND OTHER RECEIVABLESTrade and Other Receivables 891,113 604,096 731,232 494,938Less : Provision for Bad and Doubtful Debts. (33,103) (34,928) (22,785) (29,411)Other Debtors - 2,298 - -Advances, Prepayments and Deposits 402,937 258,524 118,877 36,733Loans to Staff - Receivable within one year 29,901 23,869 22,840 17,875 1,290,848 853,859 850,164 520,135
Trade and Other Receivables include Staff Loans amounting to Rs. 29.9 Mn (2010 - Rs. 23.8 Mn.) for the Group and Rs. 22.8Mn (2010 - Rs. 17.8 Mn) for the Company reflected in Note No 8.
11. TAX RECOVERABLEAt the beginning of the year 95,205 79,924 - -Payments During the year 35,503 24,718 - -Written off during the year (22,680) (8,763) - -Transferred to Income Tax Payable (1,079) (674) - -At the end of the year 106,949 95,205 - -
The Tax Recoverable represent Economic Service charge paid to be and to the set off against future Income Tax liabilities and the Subsidiary.
12. CASH AND CASH EQUIVALENTSShort Term Investments - 33,000 - 30,000
Cash in Hand 12,636 10,510 941 727Cash at Bank 60,338 84,493 18,920 54,982 72,974 95,003 19,861 55,709
Bank overdrafts (1,196,672) (469,433) (276,752) (1,424) (1,123,698) (341,430) (256,891) 84,285
All the cash and cash equivalents held by the Group are available for use.

76
Ceylon Cold Stores PLC (PQ4)
Group CompanyAs at 31st March No. of shares 2011 2010 2011 2010In Rs. ‘000 s 000s
13. STATED CAPITALFully Paid Ordinary Shares 21,600 270,000 270,000 270,000 270,000Fully Paid Preference Shares 25 200 200 200 200 270,200 270,200 270,200 270,200
14. CAPITAL RESERVESRevaluation Reserve On Property, Plant and Equipment 14.1 1,162,483 1,151,805 1,162,483 1,151,805 Investment Property 1,687,500 - 1,687,500 -Other Capital Reserves 14.2 3,974 3,974 3,974 3,974 2,853,957 1,155,779 2,853,957 1,155,779
14.1 Revaluation reserve consists of the surplus on the revaluation of Property, Plant and Equipment net of Deferred Tax effect.
14.2 Other Capital Reserves comprises of the Capital Redemption Reserve Fund and the Capital Accretion Reserve.
Group CompanyAs at 31st March Note 2011 2010 2011 2010In Rs. ‘000 s
15. REVENUE RESERVESGeneral Reserves 15.1 646,000 646,000 646,000 646,000Retained Earnings 678,484 565,362 890,950 724,595 1,324,484 1,211,362 1,536,950 1,370,595
15.1 The General Reserve represents amounts set aside by the Directors for general application.
16. INTEREST BEARING BORROWINGSAt the beginning of the year 283,574 558,557 283,574 424,331Additions 230,000 - 230,000 -Repayments (140,757) (274,983) (140,757) (140,757)At the end of the year 372,817 283,574 372,817 283,574
Repayable within One Year 153,048 140,757 153,048 140,757Repayable after One Year 219,769 142,817 219,769 142,817 372,817 283,574 372,817 283,574
Notes to the Financial Statements

77
Annual Report 2010 / 2011
16. INTEREST BEARING BORROWINGS (contd.)Security and Repayment Terms
Lending Institution Name of Facility Assets Pledged Interest Rate Repayment Terms
DFCC Project Loan 10.5 % 5 years
Project Loan Kaduwela Land, AWPR- 0.5% 4 Years Building and Machinery Min - 9% Max -13% Term Loan AWDR + 0.75% 4 1/2 years
NDB Project Loan 10.5 % 5 years E Friendly Loan 6.5 % 5 years
Group CompanyAs at 31st March 2011 2010 2011 2010In Rs. ‘000 s
17. DEFERRED TAX LIABILITIESAt the beginning of the year 96,698 129,575 96,698 129,575Reversal for the year (9,279) (32,877) (9,279) (32,877)Transferred to the Revaluation Reserve due to reduction in Tax Rate (10,678) - (10,678) -At the end of the year 76,741 96,698 76,741 96,698
The closing Deferred Tax Liability balance relates to the following:Accelerated Depreciation for Tax Purposes 152,380 177,705 152,380 177,705Retirement Benefit Liabilities (75,639) (81,007) (75,639) (81,007)Balance as at year end 76,741 96,698 76,741 96,698
18. EMPLOYEE BENEFIT LIABILITIESAt the beginning of the year 280,319 245,647 239,416 211,525Interest Cost 28,032 24,565 23,942 21,153Charge for the year 21,487 18,204 16,414 13,530Payments during the year (12,648) (15,500) (9,926) (13,275)Transfers 49 3,955 49 3,955Actuarial Loss / (Gain) (338) 3,448 241 2,528At the end of the year 316,901 280,319 270,136 239,416
The Employee Benefit Liability of the Company is based on the Actuarial Valuation carried out by Messrs. Actuarial & Management Consultants (Pvt) Ltd., Independent Actuaries, on 31st March 2011. The principle assumptions used in determining the cost of retirement benefits were as follows:
Financial Assumptions ;Rate of Discount 10%Long Term Salary Increment Rate 10%
The liability to the above Employee Benefit is not externally funded.

78
Ceylon Cold Stores PLC (PQ4)
18. EMPLOYEE BENEFIT LIABILITIES (contd.)The provision for employees’ benefits liabilities, disclosed as a non-current liability, is based on the liability that would arise, in accordance with the Labour Law, if the employment of all employees were terminated at the balance sheet date.
The expense of the employee benefit liability charge for the year reflected in the following expense category in the Income Statement
Group CompanyAs at 31st March 2011 2010 2011 2010In Rs. ‘000 s
Cost of sales 30,601 25,119 26,912 21,398Distribution expenses 8,728 9,342 4,755 5,567Administrative expenses 9,852 11,756 8,930 10,246 49,181 46,217 40,597 37,211
19. TRADE AND OTHER PAYABLESTrade and Other Payables 1,446,263 1,261,218 260,046 195,026Accrued Expenses 179,612 178,487 96,212 116,206Sundry Creditors 459,783 404,394 212,467 229,311Other Taxes Payable 207,735 234,237 188,267 196,642 2,293,393 2,078,336 756,992 737,185
20. INCOME TAX LIABILITIESAt the beginning of the year 91,291 157,336 90,140 157,360Provision for the year 248,083 224,259 247,341 222,410Payments during the year (263,240) (289,629) (263,082) (289,629)Transfers from Tax Recoverable (1,079) (674) - -At the end of the year 75,055 91,292 74,399 90,141
21. INTEREST BEARING BROWINGS FROM RELATED PARTIESAt the beginning of the year 222,164 90,921 - 18,757Additions 39,000 150,000 - -Repayments - (18,757) - (18,757)At the end of the year 261,164 222,164 - -
Payable toShort Term BorrowingsUltimate Parent 164,164 164,164 - -
Long Term BorrowingsCompanies under common control 97,000 58,000 - - 261,164 222,164 - -
22. SHORT TERM BORROWINGS 232,000 - 232,000 -
Notes to the Financial Statements

79
Annual Report 2010 / 2011
Group CompanyFor the year ended 31st March 2011 2010 2011 2010In Rs. ‘000 s
23. REVENUE23.1 Net Revenue 16,637,198 14,363,301 6,380,740 5,264,128
The above Net Revenue is stated after deducting Value Added Tax amounting to Rs. 914.7 million. ( 2010 - Rs. 829.1 million) for the Group and Rs. 909 million (2010 - 823 million) for the Company and Turnover Tax of Rs.106.7 million. (2010 - Rs. 130.4 million) for the Group and Turnover Tax of Rs.3.5 million( 2010 - Rs. 2.7 million) for the Company.
Manufacture Retail Trade Total 2011 2010 2011 2010 2011 2010
23.2 Business Segment AnalysisCOMPANYRevenue External Sales 6,288,208 5,152,610 92,532 111,518 6,380,740 5,264,128 Total Revenue 6,288,208 5,152,610 92,532 111,518 6,380,740 5,264,128Segment Results 628,582 624,355 (2,192) 4,858 626,390 629,213
Other Operating Expenses (189,084) (170,939) 437,306 458,274 Other Operating Income 93,827 79,167 Finance Expenses (40,172) (67,902) Profit before Income Tax 490,961 469,539 Tax Expenses (238,192) (189,533) Profit for the year 252,769 280,006
Reportable Segment Assets 6,461,408 3,938,844 3,948 11,046 6,465,356 3,949,890Capital Expenditure 750,631 202,067 - - 750,631 202,067Reportable Segment Liabilities 2,325,436 1,483,528 1,706 5,843 2,327,142 1,489,371
Manufacture Retail Trade Total 2011 2010 2011 2010 2011 2010
23.3 Business Segment AnalysisGROUPRevenue External Sales 6,378,886 5,152,560 10,258,312 9,210,691 16,637,198 14,363,301 Total Revenue 6,378,886 5,152,560 10,258,312 9,210,741 16,637,198 14,363,301Segment Results 638,917 620,602 30,524 (14,075) 669,441 606,527
Other Operating Expenses (189,084) (167,212) (65,060) (36,631) (254,144) (203,843) 449,833 453,390 (34,536) (50,706) 415,297 402,684 Other Operating Income 93,827 79,192 63,652 59,988 157,479 139,180 Finance Expenses (40,172) (67,902) (49,622) (53,811) (89,794) (121,713) Profit before Income Tax 503,488 464,680 (20,506) (44,529) 482,982 420,151 Tax Expenses (238,192) (189,533) (45,254) (1,744) (283,446) (191,277) Profit for the year 265,296 275,147 (65,760) (46,273) 199,536 228,874
Reportable Segment Assets 6,461,408 3,938,844 3,017,034 2,353,496 9,478,442 6,292,340Capital Expenditure 750,631 202,067 555,099 131,695 1,305,730 333,762Reportable Segment Liabilities 2,323,529 1,481,931 2,865,862 2,170,737 5,189,391 3,652,668

80
Ceylon Cold Stores PLC (PQ4)
23.4 Inter-segment revenues and Inter-Company balances are eliminated on consolidation.23.5 Segment Results of Retail Trade include promotional Income.23.6 Segment assets do not include goodwill and Investment in Subsidiary.23.7 Capital expenditure consists of additions of property, plant and equipment, intangible assets and investment properties including assets from
the acquisition of subsidiary. Group CompanyFor the year ended 31st March 2011 2010 2011 2010In Rs. ‘000 s
23.8 Geographical Segment Analysis (By Location)Sri Lanka 16,512,700 14,264,529 6,256,242 5,165,356Outside Sri Lanka 124,498 98,772 124,498 98,772
Total Company Revenue 16,637,198 14,363,301 6,380,740 5,264,128
24. OTHER OPERATING INCOMEInterest Income 8,545 11,909 6,568 6,085Exchange Gain 8,000 21 7,906 -Profit on Sale of Property, Plant and Equipment 486 - 486 -Profit on Sale of Investment - 3,131 - 3,131Rental Income 26,389 21,156 9,761 10,023Franchise Income 25,598 22,960 9,193 7,734Promotional Income 167,844 164,889 - -Scrap Sales 11,277 10,877 11,277 10,877Sundry Income 89,193 69,125 48,636 41,317 337,332 304,068 93,827 79,167
25. OTHER OPERATING EXPENSESOther Operating Expenses includes Nation Building Tax of Rs.187 million (2010 - 140 million) for Group and Rs. 151 million (2010 -133 million) for the Company
26. FINANCE EXPENSESInterest Expense on BorrowingsLong Term 75,015 89,754 25,393 41,401Short Term 14,779 31,959 14,779 26,501 89,794 121,713 40,172 67,902
27. PROFIT BEFORE TAXProfit Before Income Tax is stated after charging all expenses including the followingRemuneration to Executive Director 20,909 18,021 13,163 11,087Remuneration to Non - Executive Directors 4,944 3,144 3,600 3,600Auditors’ Fees and Expenses - External Audit 1,335 1,481 794 792 - Non audit services 245 70 245 70Costs of Defined Employee Benefits Defined Benefit Plan Cost 49,181 46,217 40,597 37,211 Defined Contribution Plan Cost - EPF and ETF 106,918 90,569 71,049 60,540Staff Expenses 1,481,222 1,266,077 987,024 855,471Depreciation on Property, Plant and Equipment 425,662 419,152 259,017 262,450Provision for Bad Debts - Trade 7,682 10,304 2,881 7,426Donations 7,045 5,085 6,907 5,074Loss on disposal of Property, Plant and Equipment 1,194 3,006 - 1Exchange Loss - 413 - 413
Notes to the Financial Statements

81
Annual Report 2010 / 2011
Group CompanyFor the year ended 31st March Note 2011 2010 2011 2010In Rs. ‘000 s
28. INCOME TAX EXPENSECurrent Tax Expense 28.1 218,038 232,897 217,304 230,417Economic service charge written off 22,680 8,763 - -Under / (Over) Provision of previous years tax 28.1 30,048 (8,639) 30,167 (8,007)Deferred Tax Charge/ (Reversal) 28.2 12,680 (41,744) (9,279) (32,877) 283,446 191,277 238,192 189,533
The Tax Liability of the Company and its Subsidiary is computed at the standard rate of 35% (2009/2010 - 35%) and for qualified exports at the rate of 15% (2009/2010 - 15%).
Social Responsibility Levy has been charged at the rate of 1.5 % on the Income Tax Liability, which is included in the Income Tax Expense.
28.1 Reconciliation between Income Tax Expense and the Product of Accounting Profit
Profit Before Income Tax 482,982 420,151 490,961 469,539Exempted Profits (14,501) (19,570) (14,501) (19,570)Accounting Profit Liable to Income Tax 468,481 400,581 476,460 449,969Income Tax on Accounting Profit at Applicable Rates 166,681 140,203 165,236 156,082Under /(Over) Provision for Previous Year - Income Tax 30,048 (8,639) 30,167 (8,007)Aggregate Disallowed Expenses 61,414 48,053 39,454 37,934Benefits due to Utilization of Tax Losses (723) (645) - -Economic Service Charge written off 22,680 8,763 - -Social Responsibility Levy at the Rate of 1.5% 3,346 3,542 3,335 3,524Total Income Tax Expense 283,446 191,277 238,192 189,533
Income Tax charged at Standard Rate - CSE Listed Companies 35% (2010-35%) 235,876 236,575 212,473 225,350 Concessionary Rate of 15% (2010-15%) 1,496 1,543 1,496 1,543 237,372 238,118 213,969 226,893
Social Responsibility Levy at the Rate of 1.5% 3,346 3,542 3,335 3,524Deferred Tax Charge/ (Reversal) 10,603 (41,744) (771) (32,877)Deferred Tax reversal on rate differential 2,077 - (8,508) -Under /(Over) Provision for Previous Year - Income Tax 30,048 (8,639) 30,167 (8,007)Total Income Tax Expense 283,446 191,277 238,192 189,533
28.2 Deferred Tax ExpenseDeferred Tax arising fromAccelerated Depreciation for tax purposes (4,666) (867) (14,648) (22,583)Retirement Benefits Liability 6,591 (12,668) 5,369 (10,294)Benefit arising from Tax Losses 10,755 (28,209) - - 12,680 (41,744) (9,279) (32,877)
Deferred Tax Liabilities have been computed taking into consideration the revised average tax rates effective from 1 April 2011, which is 28 %. (2010 - 35%) for the Company and the Subsidiary.
28.3 Tax Losses Carried ForwardTax Losses Brought Forward 372,579 329,112 - -Losses during the period 58,746 41,436 -Adjustment to brought forward Tax Losses (3,289) 3,874 - -Utilization of Tax Losses (723) (1,843) - - 427,313 372,579 - -

82
Ceylon Cold Stores PLC (PQ4)
GroupFor the year ended 31st March Note 2011 2010In Rs. ‘000 s
29. EARNINGS PER SHARE29.1 Basic Earnings Per ShareProfit for the Year 199,536 228,874
Dividend on Preference Shares (Net of tax) (13) (13)
Profit Attributable to Ordinary Equity Holders of the Company 199,523 228,861Weighted Average Number of Ordinary Shares 29.2 21,600 21,600
Basic Earnings Per Share 9.24 10.60
29.2 Amount used as DenominatorWeighted average number of ordinary shares outstanding during the year 21,600 21,600
30. DIVIDEND PAID AND PROPOSED30.1 Declared and Paid During the YearFirst and Final Dividend - 2008/09 - 86,400First and Final Dividend - 2009/10 86,400 -Total Dividend 86,400 86,400
30.2 Proposed DividendFirst and Final Dividend 86,400 86,400
The First and Final Dividend Proposed for this financial year has not been recognized as at the Balance Sheet date in compliance with SLAS 12 (Revised) - Events after the Balance Sheet Date.
30.3 Dividend Per Share - Paid 4.00 4.00
31. RELATED PARTY DISCLOSURESThe Company carried out transactions in the ordinary course of business at commercial rates with the following related parties.
Group CompanyAs at 31st March Balance Outstanding Balance Outstanding 2011 2010 2011 2010
31.1 Amounts due from related partiesPlease refer Note 31.1 A for detailsUltimate parent - 99 - -Subsidiary - - - 571Companies under common control 7,418 12,904 5,255 6,591 7,418 13,003 5,255 7,162
Notes to the Financial Statements

83
Annual Report 2010 / 2011
Group CompanyAs at 31st March Balance Outstanding Balance Outstanding 2011 2010 2011 2010
31.2 Amounts due to related partiesPlease refer Note 31.1 B for detailsUltimate parent 24,391 12,193 4,353 5,445Subsidiary - - 1,907 2,168Companies under common control 85,436 98,688 4,520 3,758 109,827 110,881 10,780 11,371
Group CompanyFor the year ended 31st March 2011 2010 2011 2010
31.3 Transactions with related partiesUltimate Parent(Purchases) / Sale of Goods 1,410 2,072 - -Rendering / (Receiving) of Services (73,423) (77,462) (31,290) (38,231)Interest received / (Paid) (14,126) (5,343) - (1,340)
SubsidiaryRendering / (Receiving) of Services - - (12,189) (4,935)(Purchases) / Sale of Goods - - 1,854 1,439
Companies under common control(Purchases) / Sale of Goods (388,110) (316,075) 9,984 6,965Rendering / (Receiving) of Services (223,760) (172,265) (7,460) (2,210)Interest Received / (Paid) (7,424) (4,230) - 2,759Rental Income Received / (Paid) 6,114 6,875 6,114 6,875
For the year ended 31st March 2011 2010 2011 2010
31.4 Compensation of Key Management PersonnelShort-Term Employee Benefits 25,853 21,165 16,763 14,687
Total Compensation Paid to Key Management Personnel 25,853 21,165 16,763 14,687
Key Management Personnel include members of the Board of Directors of the Company and its Subsidiary, and the Ultimate Parent Company John Keells Holdings PLC.
For the year ended 31st March 2011 2010 2011 2010
31.5 Post Employment Benefit PlanContribution to Provident FundCeylon Cold Stores PLC Management Staff Provident Fund 13,448 11,421 13,448 11,421Ceylon Cold Stores PLC Staff Provident Fund 37,087 31,023 37,087 31,023John Keells Limited Executive Staff Provident Fund 12,109 11,371 6,900 6,326Mackinnons Keells Financial Service Limited Provident Fund 1,545 1,552 112 152

84
Ceylon Cold Stores PLC (PQ4)
Group CompanyAs at 31st March Balance Outstanding Balance OutstandingIn Rs. ‘000 s 2011 2010 2011 2010
31.1 A Amounts Due from Related PartiesUltimate parentJohn Keells Holdings PLC - 99 - -
SubsidiaryJayKay Marketing Services ( Pvt) Limited - - - 571
Companies under common controlKeells Food Products PLC 3,123 4,612 3,123 4,602Asian Hotels & Properties PLC 1,117 1,183 642 652Union Assurance PLC 894 1,125 - -Mack Air (Pvt) Limited 706 251 672 249DHL Keells (Pvt) Limited 691 186 - -Mackinnons Travels Pvt Limited 571 511 571 511Kandy Walk Inn Limited 117 48 117 42Ceylon Holiday Resorts Limited 117 147 115 147Habarana Walk Inn Limited 71 97 69 85Habarana Lodge Limited 58 42 25 42Trinco Holiday Resorts (Pvt) Limited 48 - 48 Yala Village (Pvt) Limited 32 - 32 -Trans Asia Hotels PLC 9 134 9 134Walkers Tours Limited - 112 - 112Walkers Air Services (Pvt) Limited - 32 - -Nexus Networks (Pvt) Limited - 3,110 - -Mackinnon & Keells Financial Services Limited - 3 - -Keells Hotel Management Services (Pvt) Limited - - - -John Keells Properties (Pvt) Limited - 1,122 - -John Keells Office Automation (Pvt) Limited - 60 - -Infomate (Pvt) Limited - 70 - -John Keells PLC (136) 59 (168) 15 7,418 13,003 5,255 7,162
31.1 B Amounts Due to Related PartiesUltimate parentJohn Keells Holdings PLC 24,391 12,193 4,353 5,445
SubsidiaryJayKay Marketing Services (Pvt) Limited - - 1,907 2,168
Companies under common control Keells Food Products PLC 59,611 43,855 - 12John Keells Logistics (Pvt) Limited 13,211 10,471 254 69Nexus Network (Pvt) Limited 4,983 38,462 - -John Keells Logistic Lanka (Pvt) Limited 3,077 3,492 3,077 3,492Informate (Pvt) Limited 1,424 673 471 (356)Whittall Boustead (Private) Limited 1,000 - - -John Keells Properties (Pvt) Limited 858 1,263 - -John Keells Office Automation (Pvt) Limited 562 58 296 66Trans Asia Hotels PLC 243 - 7 -
Notes to the Financial Statements

85
Annual Report 2010 / 2011
Group CompanyAs at 31st March 2011 2010 2011 2010In Rs. ‘000 s
31.1 B Amounts Due to Related Parties Contd.DHL Keells (Pvt) Limited 207 59 207 59Travel Club Private Limited 67 - 67 -Keells Consultants Limited 62 48 54 40Mackinnons Travels (Pvt) Limited 42 203 - 203Auxicogent International Lanka Pvt Limited 32 - 32 -Companies under common control 28 - 28 -Tranquility Private Limited 26 - 26 -Union Assurance PLC 16 14 16 11Kandy Walk Inn Limited 2 25 - 11Walkers Tours Limited - 6 - 6Habarana Lodge Limited - 7 - -Ceylon Holiday Resort Limited - 1 - 1Asian Hotels and Properties PLC - - - 98John Keells PLC (15) 51 (15) 47 109,827 110,881 10,780 11,371
32. CONTINGENT LIABILITIESThere were no material contingent liabilities as at the balance sheet date.
33. CAPITAL COMMITMENTSThere were no significant capital commitments as at the balance sheet date other than the following.
Capital Expenditure approved and contracted as at the Balance Sheet date, not provided for the Financial Statements amounts to Rs.160 million for the Company and the Group (2010 - Rs. 265 million) and for the Company is Rs. 160 million ( 2010 - Rs. 265 million)
34. POST BALANCE SHEET EVENTSThere have been no material events occurring after the Balance Sheet date that required adjustments to or disclosure in the Financial Statements.
As required by section 56(2) of the Companies Act No. 7 0f 2007, the Board of Directors have confirmed that the Company satisfies the Solvency test in accordance with Section 57 of the Companies Act No 7 of 2007, and has obtained a certificate from the Auditors, prior to approving a first and final dividend of Rs. 4.00 per share and were paid an 23rd May 2011.
The Board of Directors has recommended to the shareholders that the Company raise capital by way of a 1 for 10 Rights Issue at Rupees Three hundred (Rs. 300) per share and after the listing of the shares arising form the right issue, the ordinary shares in issue be subdivided in the proportion of four (4) ordinary shares for one (1) ordinary share.
The resolution to give effect to the aforesaid will be placed before an Extraordinary General Meeting of the Shareholders to be convened for the purpose.

86
Ceylon Cold Stores PLC (PQ4)
Ordinary ShareholdingNumbers of Ordinary Shares - 21,600,000
Distribution of Shareholders
31st March 2011 31st March 2010Shareholding Range No. of No. of % No. of No. of % Shareholders Shares Held Shareholders Shares Held
Less than or equal to 1,000 1,146 270,795 1.25 1,139 280,690 1.30 1,001 to 10,000 392 1,393,772 6.45 403 1,386,520 6.42 10,001 to 100,000 72 1,645,520 7.62 76 1,642,877 7.61 100,001 to 1,000,000 3 918,874 4.25 3 918,874 4.25 Over 1,000,000 2 17,371,039 80.42 2 17,371,039 80.42 1,615 21,600,000 100.00 1,623 21,600,000 100.00
Categories of Shareholders
No. of No. of % No. of No. of % Shareholders Shares Held Shareholders Shares Held
John Keells Holdings & Subsidiaries 3 17,381,649 80.47 3 17,381,649 80.47 Others 1,612 4,218,351 19.53 1,620 4,218,351 19.53 Total 1,615 21,600,000 100.00 1,623 21,600,000 100.00
Sri Lankan Residents 1,493 20,292,485 93.95 1,497 20,275,963 93.87 Non-Residents 122 1,307,515 6.05 126 1,324,037 6.13 Total 1,615 21,600,000 100.00 1,623 21,600,000 100.00
John Keells Holdings & Subsidiaries 3 17,381,649 80.47 3 17,381,649 80.47 Director’s and Spouses 7 12,550 0.06 7 12,550 0.06 Shareholders holding more than 10% - - - - - - Public 1,605 4,205,801 19.47 1,613 4,205,801 19.47 1,615 21,600,000 100.00 1,623 21,600,000 100.00
* Percentage of shares held by the public as at 31st March, 2011 is 19.47%
Your Share in Detail
0
50
100
150
250
07 08 09 10 11
Net Asset per ShareRs.
200
0
200
400
600
800
07 08 09 10 11
Market PriceRs.

87
Annual Report 2010 / 2011
Top 20 Shareholders
As at 31st March 2011 2010 No. of Shares % of Issued No. of Shares % of Issued Held Capital Held Capital
John Keells Holdings PLC 15,060,722 69.73 15,060,722 69.73Whittal Boustead Limited 2,310,317 10.70 2,310,317 10.70The Gilpin Fund Limited 417,400 1.93 417,400 1.93Employees Provident Fund 304,600 1.41 304,600 1.41N.S Sethna (Decd) 196,874 0.91 196,874 0.91Asha investments Limited 90,160 0.42 90,160 0.42HSBC International Nominee Limited 83,570 0.39 83,570 0.39Life Insurance Corporation of India 68,228 0.32 68,228 0.32Sisira Investors Limited 58,136 0.27 58,136 0.27Waldock Mackenzie Limited/Delmage Forsyth and Co (Shipping) Limited 49,600 0.23 37,700 0.17Paints & General Industries Limited 46,900 0.22 - -M.Radhakrishnan 42,314 0.20 42,314 0.20J.R.Printers 41,984 0.19 41,984 0.19M.A.Lukmanjee 41,875 0.19 933 -Merrill J.Fernando & sons (Pvt) Limited 34,284 0.16 34,284 0.16H.M.Mount (Decd) 31,340 0.15 31,340 0.15C.F.M.Wilson 30,842 0.14 30,842 0.14E.C.Rodrigo 30,468 0.14 30,468 0.14C.D.Kohombanwickramage 30,000 0.14 24,000 0.11M V Theagarajah 29,962 0.14 29,962 0.14L.Gulamhusein - - 41,142 0.19Waldock Mackenzie Limited/Delmage Forsyth and Co (Exports) Limited - - 31,900 0.15E L Blizard (Decd) - - 29,528 0.14
As at 31st March 2011 2010
SHARE PRICES - (Rs.)Beginning of the year 172.00 69.50Highest for year 850.00 (23.03.11) 172.00 (15.03.10)Lowest for year 150.00 (14.05.11) 68.00 (01.04.09)As at 31st March 750.60 172.00
0
5,000
10,000
15,000
20,000
07 08 09 10 11
Market CapitalisationRs. Mn.
0
2,000
3,000
4,000
5,000
07 08 09 10 11
Shareholders FundsRs.
1,000

88
Ceylon Cold Stores PLC (PQ4)
Year ended 31st March 2011 2010 2009 2008 2007 2006 2005 2004 2003 2002
Rs`000 Rs`000 Rs`000 Rs`000 Rs`000 Rs`000 Rs`000 Rs`000 Rs`000 Rs`000
Trading Results
Gross Revenue 17,658,598 15,322,957 13,631,168 10,960,073 9,277,671 7,290,257 5,186,980 3,141,772 3,019,658 2,597,148
Profit from Operating Activities 572,776 541,864 460,951 450,948 555,230 370,323 180,529 280,994 299,303 317,834
Profit before Taxation 482,982 420,151 268,345 269,358 469,474 305,315 84,795 (464,477) 256,106 155,824
Taxation (283,446) (191,277) (128,731) (93,432) (192,490) (104,256) (101,159) 65,083 (64,514) (88,180)
Profit after Taxation 199,536 228,874 139,614 175,926 276,984 201,059 (16,364) (399,394) 191,592 67,644
Minority Interest - - - 311 18,074 - - -
Retained Earnings Brought forward 565,362 422,902 304,902 198,110 (49,678) (251,020) (251,603) 196,805 75,331 92,048
764,898 651,776 444,516 374,036 227,306 (49,650) (249,894) (202,589) 266,923 159,692
Transfer to General Reserve - - - - - - (39,000) (29,761)
Transfer to/frm Distributable
Dividends Reserve - - 22,742 - - - - -
Adjustment due to change of Associate to - - - -
Subsidiary Company - - - - (11,694) -
Adjustment due to impairment of PPE - - - - 10,582
Dividends (86,414) (86,414) (21,614) (69,134) (51,854) (28) (14) (49,014) (31,118) (54,600)
Deffered Tax - - (84)
Retained Earnings carried forward 678,484 565,362 422,902 304,902 198,110 (49,678) (251,020) (251,603) 196,805 75,331
As at 31 March
Balance Sheet
Fixed Assets 3,689,511 3,848,218 4,070,987 4,073,966 2,800,353 2,096,472 2,005,132 1,934,493 1,864,775 1,669,898
Investment Property 2,582,195 - - - - - - - - -
Investments - - 3,100 3,100 3,100 3,100 3,100 3,100 3,100 3,100
Non Current Assets 287,134 115,006 115,006 140,196 138,525 115,006 103,165 23,232 - -
6,558,840 3,963,224 4,189,093 4,217,262 2,941,978 2,214,578 2,111,397 1,960,825 1,867,875 1,672,998
Net Current Assets (1,240,142) (653,948) (719,546) (682,367) (350,684) (272,390) (280,317) (277,101) 340,905 251,402
5,318,698 3,309,275 3,469,547 3,534,895 2,591,294 1,942,188 1,831,080 1,683,724 2,208,780 1,924,400
Long Term loans 219,769 142,817 380,300 421,830 373,890 73,583 228,283 - - -
Deferred Liabilities 650,288 529,118 594,366 736,184 627,156 488,371 408,353 426,428 503,076 454,296
Net Assets 4,448,641 2,637,341 2,494,881 2,376,881 1,590,248 1,380,234 1,194,444 1,257,296 1,705,704 1,470,104
Represented by
Stated Capital 270,200 270,200 270,200 270,200 270,200 270,200 270,200 270,200 270,200 270,200
Capital Reserves 2,853,957 1,155,779 1,155,779 1,155,779 475,938 490,970 490,970 554,406 554,406 479,280
Revenue Reserve 646,000 646,000 646,000 646,000 646,000 668,742 684,294 684,294 684,294 645,294
Retained Profits 678,484 565,362 422,902 304,902 198,110 (49,678) (251,020) (251,604) 196,804 75,330
Shareholder’s Funds 4,448,641 2,637,341 2,494,881 2,376,881 1,590,248 1,380,234 1,194,444 1,257,296 1,705,704 1,470,104
Decade at a Glance

89
Annual Report 2010 / 2011
Group Real Estate Portfolio
Owning Company and Location Buildings Land in Acres Land in Acres in (Sq. Ft) Freehold Leasehold
Properties in Colombo Ceylon Cold Stores PLC Slave Island Complex, Colombo 2 94,655 4.97 3.12 Properties Outside Colombo Ceylon Cold Stores PLC Kaduwela 242,439 26.15 - Trincomalee 24,905 1.14 - Jaykay Marketing Services (Pvt) Limited 385, Negambo Road, Wattala 12,820 - 0.30 388, Galle Road, Mount Lavinia 6,500 - 0.24
Ratios and other information - Group
Year ended 31st March 2011 2010 2009 2008 2007 2006 2005 2004 2003 2002
Dividend per Share (Rs.) - Paid 4.00 4.00 1.00 3.20 2.40 0.80 - 2.40 1.60 2.72
Dividend Payout (%) 43.30% 37.75% 15.47% 39.29% 18.72% 8.59% 0.00% -12.98% 18.04% 86.85%
Net Asset per Share (Rs.) 205.96 122.10 115.50 110.04 73.62 63.90 55.30 58.21 78.97 68.06
Market Value per Share (Rs.) 750.60 172.00 69.50 130.00 152.00 154.00 120.00 117.00 102.00 56.50
Debt / Equity Ratio (%) 46.37 36.98 59.62 68.78 81.77 49.64 66.23 56.48 7.67 13.08
Interest Cover (No.of Times) 6.38 4.45 2.39 2.48 6.47 5.70 2.26 5.28 75.56 26.33
Liquid Ratio (No.of Times) 0.34 0.35 0.35 0.37 0.51 0.42 0.46 0.56 1.45 1.26
Earnings per Share (Rs.) 9.24 10.60 6.46 8.14 12.82 9.32 (0.42) (18.49) 8.87 3.13
Price Earnings Ratio (No.of Times) 81.25 16.23 10.76 15.96 11.86 16.52 N/A N/A 11.50 18.05
Current Ratio (No.of Times) 0.71 0.79 0.76 0.74 0.83 0.79 0.76 0.72 1.96 1.54
Return on Total Assets (%) 2.47 3.56 2.22 3.27 7.07 6.50 (0.30) (15.22) 7.73 2.79
Return on Equity (%) 4.39 8.68 5.73 8.87 17.42 15.64 0.14 (26.96) 12.06 4.62
Dividend Yield (%) 0.53 2.33 1.44 2.46 1.58 1.55 0.60 2.05 1.57 4.81
Earnings Yield (%) 1.23 6.16 9.29 6.27 8.43 6.05 0.35 (15.80) 8.70 5.54
Key Figures & Ratios

90
Ceylon Cold Stores PLC (PQ4)
Accrual BasisRecording Revenues and Expenses in the period in which they are earned or incurred regardless of whether cash is received or disbursed in that period.
Contingent LiabilitiesA condition or situation existing at the Balance Sheet date due to past events, where the financial effect is not recognised because:1. The obligation is crystallized by the occurrence or non occurrence
of one or more future events or,2. A probable outflow of economic resources is not expected or,3. It is unable to be measured with sufficient reliability.
Current RatioCurrent Assets divided by Current Liabilities
Debt / Equity RatioDebt as a percentage of Shareholders Funds
Dividends per Share - PaidDividends Gross(Ordinary)paid divided by Number of Ordinary Shares issued
Dividend CoverEarnings per share divided by dividend per share
Dividend Payout RatioTotal Dividend as a percentage of Company profits
Dividend YieldDividend per Shares as a percentage of share price at the end of the period.
Earnings Per Share (EPS)Consolidated profit after tax and Preference Dividends before Extraordinary items divided by weighted average number of shares in issue during the period.
Earnings YieldEarnings per Share as a percentage of Market Price per Share end of the period
Effective Rate of TaxationIncome Tax including Differed tax over Profit before Tax
Interest CoverProfit on Operating Activities over Finance Expenses.
Market CapitalizationNumber of Shares in issue at the end of period multiplied by the share price at end of period
Net AssetsTotal Assets - Current Liabilities - Long Term Liabilities - Minority interest
Glossary of Financial TerminologyNet Asset per ShareNet Assets divided by number of ordinary shares in issue at the end of the period.
Net DebtDebt - (Cash + Short Term Deposits)
Net Turnover per EmployeeNet Turnover divided by average number of employees.
Price Earnings RatioMarket Price of share as at year end divided by Earnings per Share
Quick RatioCash + Short Term Investments + Trade and Other Receivables, divided by Current Liabilities
Return on AssetsProfit After Tax divided by Average Total Assets
Return on EquityConsolidated Profit after Tax and Minority interest as a Percentage of Average Shareholder’s Funds
Return on Capital EmployedEarnings before interest and tax as a % of average of share holders funds + total debt
Shareholders’ FundsTotal of issued and fully paid share Capital, Capital Reserves and Revenue Reserves
Total AssetsFixed Assets + Investments + Non Current Assets + Current Assets
Total DebtLong Term Loans plus short Term Loans and Overdraft
Total Debt / Total AssetsTotal Debt divided by Total Assets
Total Value AddedThe difference between Gross revenue after adjusting for other income minus, expenses and the cost of materials and services from external sources
Total Shareholders Returns(P1 - P0 + D)/P0 x 100P1 = Market Price at the end of Financial YearP0 = Diluted Market Price of the end of Previous Financial YearD = Adjusted dividend for the Year

91
Annual Report 2010 / 2011
Notice is hereby given that the
114thAnnual General Meeting
of Ceylon Cold Stores PLC will be held at theHuman Resources Auditorium, of John Keells Holdings PLC.
No.130, Glennie Street, Colombo 2on Thursday, 30th June 2011 at 2.00 p.m.
The business to be brought before the meeting will be:
To read the Notice convening the meeting
To receive and consider the Annual Report of the Directors and the Financial Statements for the Year Ended 31 March 2011 with the Report of the Auditors thereon.
To re-elect as Director, Mr. James Ronnie Felitus Peiris who retires by rotation in terms of Article 84 of the Articles of Association of the Company.
To re-elect as Director, Mr Jitendra Romesh Guneratne who retires by rotation in terms of Article 84 of the Articles of Association of the Company.
To authorise the Director’s to determine and make donations.
To re-appoint Messrs Ernst and Young, Chartered Accountants as Auditors and to authorise the Directors to determine their remuneration.
To Consider any other business of which due notice has been given.
By Order of the BoardCeylon Cold Stores PLC
Keells Consultants (Pvt) Ltd.SecretariesColombo
7th June 2011
Note A member unable to attend is entitled to appoint a proxy to attend and vote in his/her place. A proxy need not be a member of the Company. A member wishing to vote by proxy at the meeting may use the proxy form enclosed. In order to be valid, the completed proxy form must be lodged at the Registered Office of the Company not less than 48 hours before the
meeting.
Notice of Meeting

92
Ceylon Cold Stores PLC (PQ4)
Notes

93
Annual Report 2010 / 2011

94
Ceylon Cold Stores PLC (PQ4)
Notes

95
Annual Report 2010 / 2011
I/We . . . . . . . . . . . . . . . . . . . . . . . . . . . . . . . . . . . . . . . . . . . . . . . . . . . . . . . . . . . . . . . . . . . . . . . . . . . . . . . . . . . . . . . . . . . . . . . . . . . . . . . . . . . . . . . . . . . . . . . . . . . . . . . . . . . . . . . . . . . . . . . . . . . . . . . . . . . . . . . . . . . . . . . . . . . . . . . . . . . . . . . . . . . . . . . . . . . . . . . . . . . . . . . . . . . . of. . . . . . . . . . . . . . . . . . . . . . . . . . . . . . . . . . . . . . . . . . . . . . . . . . . . . . . . . . . . . . . . . . . . . . . . . . . . . . . . . . . . . . . . . . . . . . . . . . . . . . . . . . . . . . . . . . . . . . . . . . . . . . . . . . . . . . . . . . . . . . . . . . . . . . . . . . . . . . . . . . . . . . . . . . . . . . . . . . . . . . . . . . . . . . . . . . . . . . . . . . . . . . . . . . . . being amember/s of Ceylon Cold Stores PLC hereby appoint
. . . . . . . . . . . . . . . . . . . . . . . . . . . . . . . . . . . . . . . . . . . . . . . . . . . . . . . . . . . . . . . . . . . . . . . . . . . . . . . . . . . . . . . . . . . . . . . . . . . . . . . . . . . . . . . . . . . . . . . . . . . . . . . . . . . . . . . . . . . . . . . . . . . . . . . . . . . . . . . . . . . . . . . . . . . . . . . . . . . . . . . . . . . . . . . . . . . . . . . . . . . . . . . . . . . . . . . . . . . . . .of
. . . . . . . . . . . . . . . . . . . . . . . . . . . . . . . . . . . . . . . . . . . . . . . . . . . . . . . . . . . . . . . . . . . . . . . . . . . . . . . . . . . . . . . . . . . . . . . . . . . . . . . . . . . . . . . . . . . . . . . . . . . . . . . . . . . . . . . . . . . . . . . . . . . . . . . . . . . . . . . . . . . . . . . . . . . . . . . . . . . . . . . . . . . . . . . . . . . . or failing him/her
Mr.Susantha Chaminda Ratnayake of Colombo or failing himMr.Ajit Damon Gunewardene of Colombo or failing himMr.James Ronnie Felitus Peiris of Colombo or failing himMr.Jitendra Romesh Gunaratne of Colombo or failing himMr. Prasanna Sujeewa Jayawardena of Colombo or failing himProf Uditha Pilane Liyanage of Colombo or failing him Mr. Albert Rasakantha Rasiah of Colombo
as my/our proxy to vote for me/us on my/our behalf at the 114th Annual General Meeting of the Company to be held at 2.00 p.m on the 30th of June 2011 and at any adjournment thereof and at every poll which may be taken in consequence thereof.
FOR AGAINST
To re-elect as Director, Mr. J. R. F. Peiris, who retires in terms of Article 84 of the Articles of Association of the Company.
To re-elect as Director, Mr. J. R. Guneratne, who retires in terms of Article 84 of the Articles of Association of the Company.
To authorise the Directors to determine and make donations.
To re-appoint Auditors and to authorise the Directors to determine Their remuneration.
Signed this .................................................................. day of ................................................................... Two Thousand and Eleven
....................................................................................Signature/s of shareholder/s
Note:INSTRUCTIONS AS TO COMPLETION OF FORM OF PROXY ARE SET OUT ON THE REVERSE HEREOF.
Form of Proxy

96
Ceylon Cold Stores PLC (PQ4)
INSTRUCTIONS AS TO COMPLETION OF PROXY
1. Kindly complete the Form of Proxy by filling in legibly your full name and address and that of the Proxy holder. Please sign in the space provided and fill in the date of signature.
2. The instrument appointing a Proxy shall, in the case of an individual, be signed by the appointer or by his Attorney and in the case of a Corporation must be executed under the Common Seal or in such other manner prescribed by its Articles of Association or other Constitutional documents.
3. If the Proxy Form is signed by an Attorney the relevant Power of Attorney or a notarially certified copy thereof, should also accompany the completed Form of Proxy if it has not already been registered with the Company.
4. To be valid, the completed Form of Proxy should be deposited at the Registered Office of the Company at No 1, Justice Akbar Mawatha, Colombo 2 not less than 48 hours before the time appointed for the holding of the meeting.
Form of Proxy
Name of CompanyCeylon Cold Stores PLC
Legal FormPublic Limited Liability CompanyEstablished in 1866 as Colombo Ice Company LimitedName changed to Ceylon Cold Stores Limited in 1941Quoted in the Colombo Stock Exchange in January 1970Registered under Companies Act No.7 of 2007 on new Company No. PQ4
Registered Office of the CompanyNo.1, Justice Akbar MawathaColombo 2, Sri Lanka.Tel : +94 11 2318798Fax : +94 11 2447422E-mail : [email protected] : www.elephanthouse.lk
Kaduwela FactorySamadaragahawatte, RanalaTel: +94 11 4414500Fax : +94 11 2415435
Customer Call CentreTel: +94 11 2303800
Board of DirectorsMr. S. C. Ratnayake (Chairman)Mr. A. D. GunewardeneMr. J. R. F.PeirisMr. J. R. GunaratneMr. A. R. RasiahMr. P. S. JayawardenaProf. U. P. Liyanage
Secretaries & RegistrarsKeells Consultants (Pvt) Limited130, Glennie StreetColombo 02, Sri Lanka
Corporate Information
AuditorsErnst & Young,Chartered Accountants,201, De Saram Place.P.O.Box 101,Colombo 10Sri Lanka
BankersCommercial Bank of Ceylon PLCDeutsche Bank LtdHongkong & Shanghai Banking Corporation LimitedNational Development Bank PLCNations Trust Bank PLCStandard Chartered BankDFCC Bank
Subsidiary CompanyJaykay Marketing Services (Pvt) Limited

Ceylon Cold Stores PLC (PQ4)