Embed Size (px)
Citation preview
IPEC S. SandikeSteve Sandike, IPEC Jun 2010
C-14 studies at Indian Pointand application in Reg Guide 1.21 reports (1982-2010)

1974Several papers were presented in the early 1970’s identifying C-14 as a legitimate isotope of interest for background studies, as well as emissions from Nuclear Power Plants.
–
Bonka, et al, Germany
–
Magno, et al, AEC Air Cleaning Conf, San Fran
–
Kunz, et al, Health Physics Society, Knoxville
–
Dozens of others, many internationally

Production of C-14
17O (n,α)14C
σth
= 0.24 barns
14N (n,p)14C
σth
= 1.8 barns

PWR assessments prior to 1980From various works, established production rates were widely accepted:
But these did not provide effluent estimates and little or no measurements were made in the US.
Reactor Coolant(assuming 7 ppm N2
)7 Ci/GW (e) yr
Fuel 15 Ci/GW (e) yr
Structural Material 25 Ci/GW (e) yr

1975-1978•
General understandings:–
Most effluent will be via the main plant vent
–
Most of the dose producing form = CO2
•
Rad Science Institute of NY started sampling and publishing findings (Ginna, Rochester, NY)–
11.6 Ci / GW (e) yr
•
Many published reports from light water reactors in Germany, indicating an average of 6 Ci/GW(e) yr.

1980, NY Dept of Health•
Charles Kunz was contracted by the NY DOH to sample and report C-14 in effluents from plants owned by the Power Authority State of NY.–
JA Fitzpatrick, Oswego NY (BWR)
–
Indian Point #3, Westchester Co, NY (PWR)
•
Goal was to determine the following:–
Quantity of C-14 releases,
–
Pathways of release, and,
–
Chemical form of the release.

Sampling at IP #3 (PWR)•
Effluent samplers were operated continuously for 98 weeks, during all phases of operation (including trips and outages).
•
Grab samples were collected:–
Reactor Coolant,
–
Waste water
•
Analyzed for inorganic and organic C-14.

Continuous Monitoring
Sample Point
Indian Point 3
Airborne Effluent
Release Points
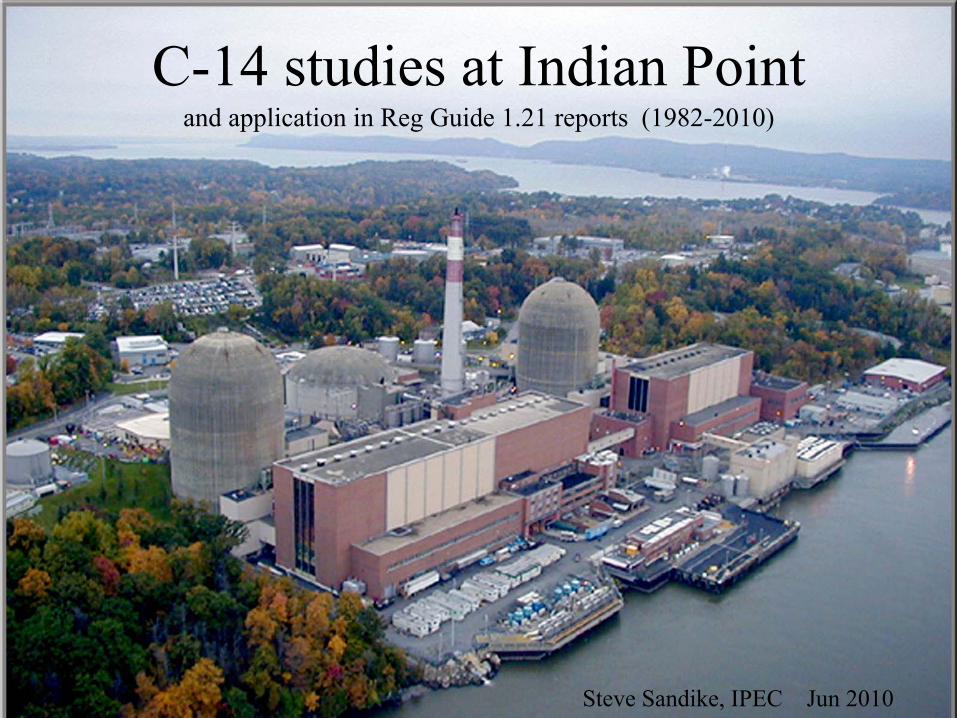
Components for Sampling

AscariteAscarite is a trade name for a form of sodium hydroxide (NaOH) which is coated on non-
fibrous silicate (vermiculite). It rapidly and quantitatively absorbs CO2.
During use, the light brown granules gradually turn white due to absorption of carbon dioxide and formation of sodium carbonate. It is hygro-
scopic and deliquescent when exposed to water.
CO2
absorption capacity is 20 to 30% W/W.

A second sample rig was used on occasion, without the catalyst, to help differentiate the CO2
from total carbon.
The catalyst is required to convert organics to CO2
.

General sampler basics•
100 cc/min thru furnace of palladium and platinum alumina.
•
Oxygen in the vent system is used to convert methyl, ethyl, CO, etc –
for a measure of total carbon, as CO2
.
•
Absorbent (silica gel or Drierite) removes water vapor, which could clog the system and/or contaminate it with Tritium.
•
Ascarite cartridges (NaOH) were used to absorb (trap) the CO2
and make Na2
CO3.
•
Columns were changed out weekly and sent to lab.
•
Ascarite was acidified, CO2
extracted, purified, and an aliquot counted on proportional counters.


Summary of Analytical Method•
Ascarite added to 50 mls of water
•
Helium was bubbled thru, with 50 mls of concentrated HCl, for approx 30 minutes.
•
Gas was condensed thru 2 cold traps to remove water vapor and collect CO2.
•
Volume was measured & an aliquot passed thru a gas chromatograph for purification.
•
Loaded into an internal gas proportional tube for counting. (Liquid Scin techniques were not yet fully developed!)

Calculations•
Amount of air thru column determined from flow rate meters or totalizers.
•
Sample volume determined by measuring the total CO2
collected and comparing C-14 concentration to the cc’s of CO2
.•
Amount of CO2 recovered each week was about the same, the capacity of the Ascarite column. Higher when combustion sources were added to the vent gas.

Other sample points•
Grab samples were taken from –
Plant Vent
–
Containment Vent (during Vents / Purges)–
Gas Decay Tanks (approx 7% of total)
•
Cryogenic and gas chromatograph separation applied to isolate gases and count separately.
•
Reactor Coolant samples were taken before and after the demin bed to try to determine a decontamination factor. These samples required complex radiochem preparation due to the inclusion of so many potential contaminants.

Integrating the C-14 releases (over 98 weeks)

Refueling Outages were by far the most significant interval for C-14 emissions.

Total Curies related to MW (e)
•
Curie totals were compared to average MW produced, normalized annually.
•
This was then corrected for rated MW (e).
•
Release rate for total gaseous C-14 was
9.6 Ci/ GW (e) yr.

Operating vs Shutdown•
During operation, Hydrogen is the cover gas on the primary volume control tank.
•
Under these conditions, carbon is reduced to organic forms (hydrocarbons, methyl and ethyl compounds).
•
At shutdown and peroxide addition, carbon is oxidized to form CO2
.
–
This is also when the greatest volume of airborne activity is released.

Chemical Composition by Origin
Avg: 62% CH4
, 29% C2
H6
, C3
H8
, etc, and 9% CO2C-14 from Gas Decay Tanks contribute approx 7% of total release, annually.
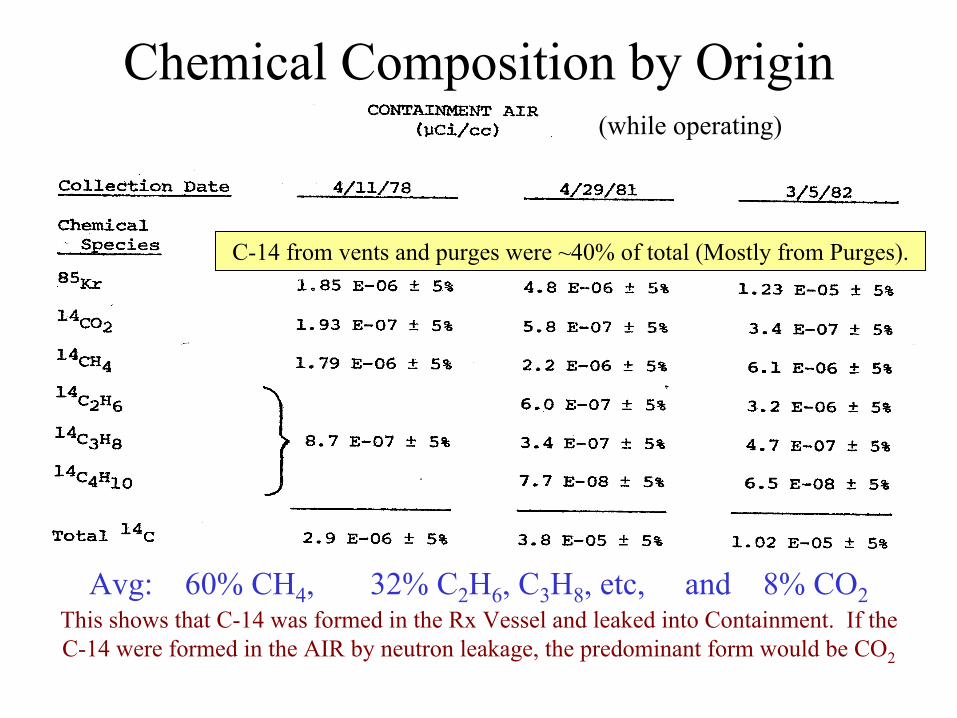
Chemical Composition by Origin
Avg: 60% CH4
, 32% C2
H6
, C3
H8
, etc, and 8% CO2This shows that C-14 was formed in the Rx Vessel and leaked into Containment. If the C-14 were formed in the AIR by neutron leakage, the predominant form would be CO2
(while operating)
C-14 from vents and purges were ~40% of total (Mostly from Purges).

Chemical Composition by Origin
Avg: 46% CH4
, 20% C2
H6
, C3
H8
, etc, and 34% CO2Organic C-14 from primary systems leaking into the aux bldg (VCT, etc),
oxidized & released, making up ~ 15% of total.
No GDTs, no containment releases
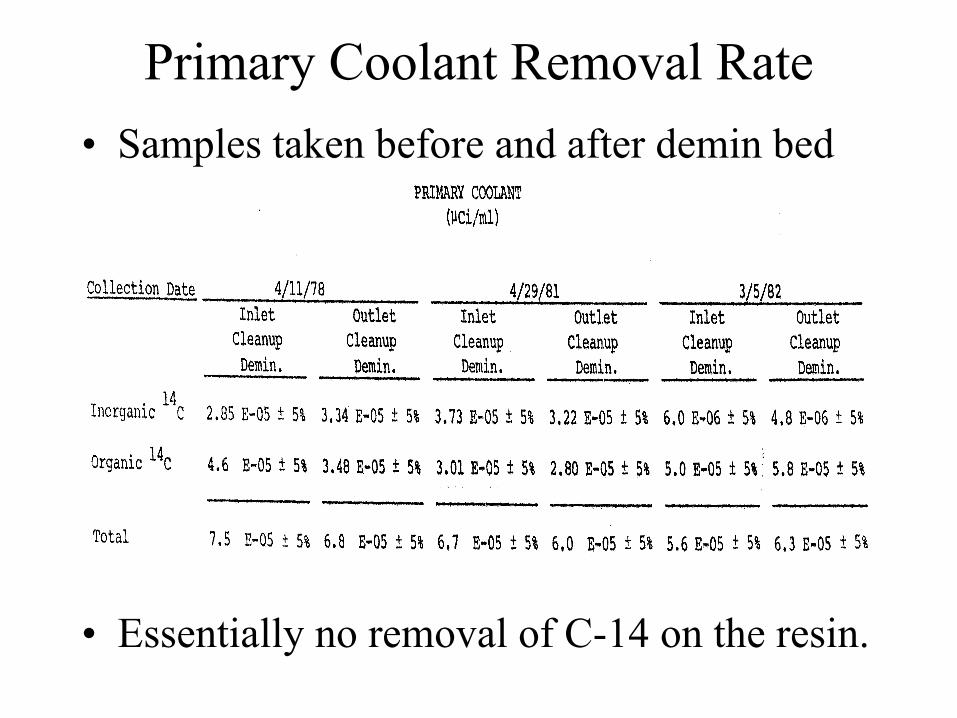
Primary Coolant Removal Rate•
Samples taken before and after demin bed
•
Essentially no removal of C-14 on the resin.
Primary Conclusion
New York Power Authority officially recognized that C-14 was a relatively important contributor to offsite dose.
Determined that it should be reported.

Secondary Conclusions•
The
Plant Vent includes essentially all releases.
•
Measured release of C-14 was 3.8 Ci/yr, with a significant amount of time with the Rx S/D.
•
This corresponds to 9.6 Ci / GW(e) yr @ IP3.–
Avg production rate in the coolant of previously tested PWRs was 7 Ci/GW(e) yr
–
Avg release rate of previously tested PWRs in Germany was 6 Ci/GW(e) yr.
•
Releases from IP3 were 74% organic, 26% CO2

Predominant Pathways•
Approximately 78% of the total releases were from Pressure Reliefs (vents) or Purges from Containment (mostly Purges at shutdown).
•
Approximately 15 % was released from ventilating the aux building.
•
Another 7% came from gas decay tanks.

Vents and Purges from Containment
•
The bulk of all C-14 is released at the initial purge of containment following shutdown.
•
After startup, C-14 releases are low until enough inventory builds up in the vessel and eventually, containment.
Liquid Effluents
•
Discharge of C-14 in solid and liquid effluents was small compared to gaseous.
•
No measurable decontamination factor on the resin bed.
•
Using the concentration of C-14 in the primary coolant and an estimated 0.5 gpm makeup rate, the discharge rate would only be 0.07 Ci/yr.

Dose Calcs•
Not re-inventing new methodology.
• Using RG 1.109 with a few site specific pieces of data.
• Airborne Pathways included:
–
Vegetative Pathway–
Child Ingestion
–
Child Inhalation•
Liquid pathway calculated despite very low values.
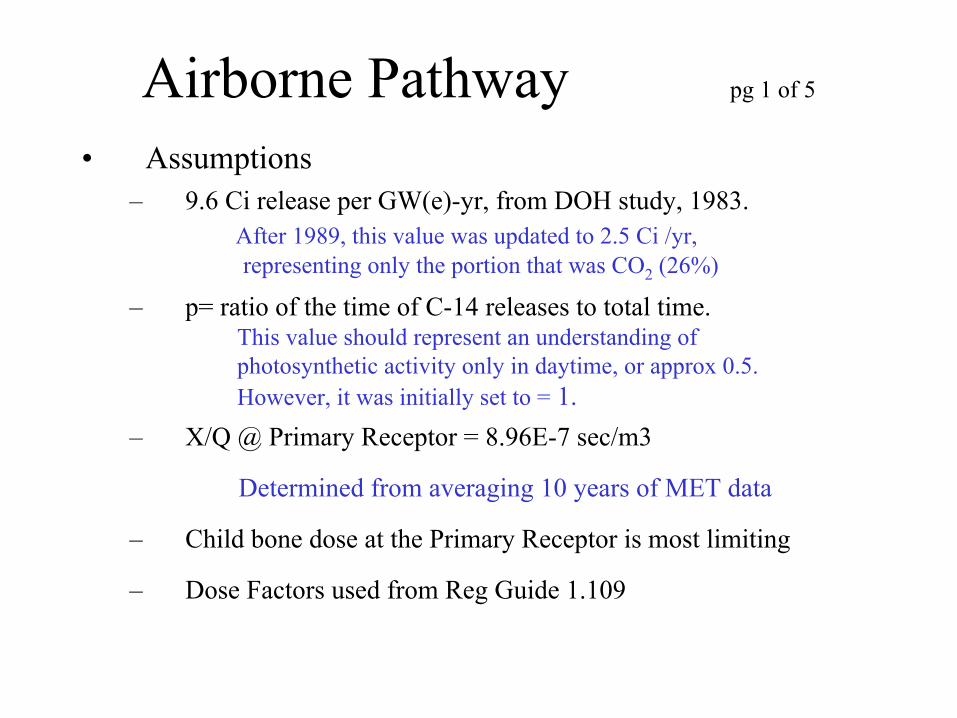
Airborne Pathway pg 1 of 5
• Assumptions
–
9.6 Ci release per GW(e)-yr, from DOH study, 1983. After 1989, this value was updated to 2.5
Ci /yr,representing only the portion that was CO2
(26%)
–
p= ratio of the time of C-14
releases to total time.This value should represent an understanding ofphotosynthetic activity only in daytime, or approx 0.5.However, it was initially set to =
1.–
X/Q
@ Primary Receptor = 8.96E-7 sec/m3
Determined from averaging 10 years of MET data
–
Child bone dose
at the Primary Receptor is most limiting
–
Dose Factors used from Reg Guide 1.109

Airborne Pathway pg 2 of 5
Vegetative
Pathway (RG 1.109, App C)C14 pCi/kg = 3.17E7 (pCi/Ci)(g/kg)(yr/sec) * p * Q * X/Q * (0.11/0.16)
Q
= 2.50 Ci (initially, we used 9.6 !!! )
P = 1 (Total release time per total time where photosynthesis can occur. Noattempt was made to correct for photosynthesis only in daytime).
X/Q= 8.96E-7 sec/m3 (using annual average MET data at garden)
0.11=Default fraction of total plant mass that isnatural carbon (unitless)
0.16=Conc of natural carbon in the atmosphere, g/m3(not yet using site-specific values)
C14 = 49.3 pCi/kg ingested (veg)

Airborne Pathway pg 3 of 5
Child Ingestion
Dose = DF * [ uv * fg + uL ]C14DF = 1.21E-5 mrem/pCi Bone Child
2.42E-6 mrem/pCi TB Childuv = 520 kg/yr (child)uL = 26 kg/yrfg = .76
Child Bone Dose = 1.21E-5 * 20765 = 2.51E-01 mrem/yrChild TB Dose = 2.42E-6 * 20765 = 5.03E-02 mrem/yr
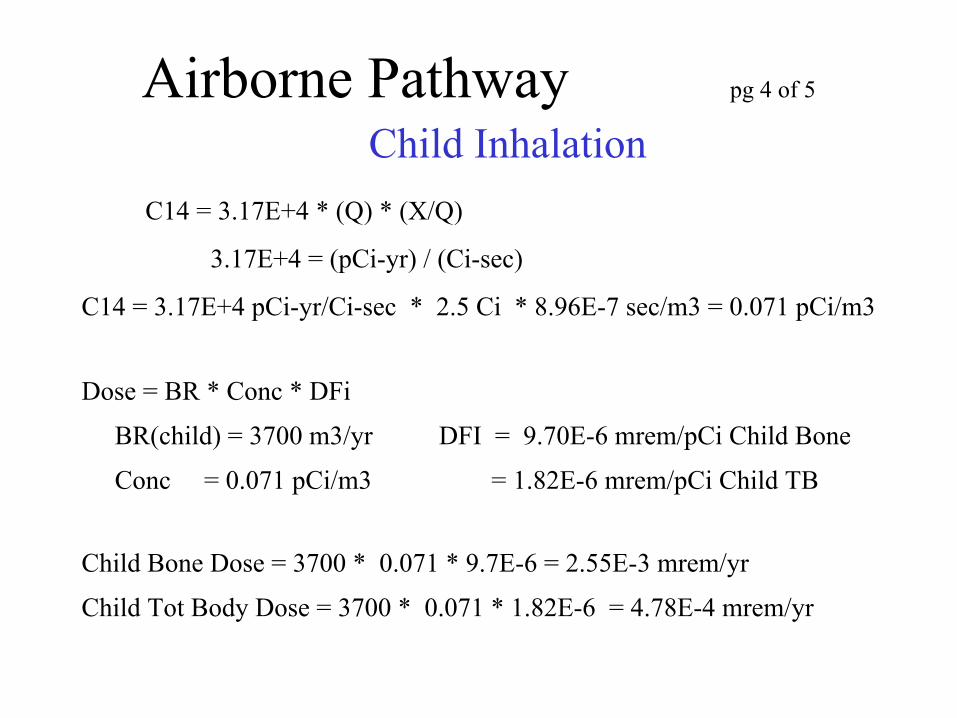
Airborne Pathway pg 4 of 5
Child InhalationC14 = 3.17E+4 * (Q) * (X/Q)
3.17E+4 = (pCi-yr) / (Ci-sec)
C14 = 3.17E+4 pCi-yr/Ci-sec * 2.5 Ci * 8.96E-7 sec/m3 = 0.071 pCi/m3
Dose = BR * Conc * DFi
BR(child) = 3700 m3/yr DFI = 9.70E-6 mrem/pCi Child Bone
Conc = 0.071 pCi/m3 = 1.82E-6 mrem/pCi Child TB
Child Bone Dose = 3700 * 0.071 * 9.7E-6 = 2.55E-3 mrem/yr
Child Tot Body Dose = 3700 * 0.071 * 1.82E-6 = 4.78E-4 mrem/yr

Airborne Pathway pg 5 of 5
Total SummaryTotal Annual Airborne Doses at Primary Receptor (nearest residence):
Child Bone = 0.254 mremChild Total Body = 0.0508 mrem

Liquid DosesAssumptions:•
0.07 Ci of C-14 released per GW (e)-yr, per DOH study, 1983
•
C-14 is released to the river equally over the entire year•
Worst case curie source term assumed each year
•
Avg Waste and Dilution volumes (1987 to 1999, as follows):–
Average Annual Waste Volume = 1.33E6 gal–
Average Annual Dilution Volume = 2.62E11 gal
Undiluted Concentration0.07 Ci * 1E6 uCi/Ci
-------------------------------------- = 1.39E-5 uCi/ml
1.33E6 gal * 3785 ml/gal

Liquid Effluent C-14 -
worst case annual dose
WASTE VOLUME = 1.33000E+06 gal DILUTION VOLUME = 2.62001E+11 galRELEASE DURATION = 525600 minutes DILUTION FLOW RATE =
4.98480E+05 gpmAVG RELEASE RATE = 2.530E+00 gpm total MPCW eff =
3.000E-03CURIES (C-14 only) = 7.000E-02 Ci's BETA CURIES = 7.001E-02 Ci's
----------------------------------------------------------------------------------------------------------------------PRE PRE POST POST MICRO-
DILUTION DILUTION DILUTION DILUTION CURIESuCi/ml CONC/MPC uCi/ml CONC/MPC RELEASED
-----------------------------------------------------------------------------------------------------------------------------------------C-14 1.39E-05 4.64E-03 7.06E-11 2.35E-08 7.00E+04-----------------------------------------------------------------------------------------------------------------------------------------
---------------------------------------------< mrem >-------------------------------------------------AGE BONE LIVER TOTBOD THYROID KIDNEY LUNG GI-LLI
----------------------------------------------------------------------------------------------------------ADULT 4.16E-03 8.31E-04 8.31E-04 8.31E-04 8.31E-04 8.31E-04 8.31E-04TEEN 4.53E-03 9.05E-04 9.05E-04 9.05E-04 9.05E-04 9.05E-04 9.05E-04CHILD 5.83E-03 1.17E-03 1.17E-03 1.17E-03 1.17E-03 1.17E-03 1.17E-03---------------------------------------------------------------------------------------------------------
CRITICAL AGE GROUP : CHILD
CRITICAL ORGAN : BONE

Reporting the curies and dose•
Dose to Man Section of Reg Guide 1.21
•
Included a narrative summarizing the study and our rerported Ci and dose
•
It has been updated a few times over the years, for example, when we realized we only want to report dose as a result of carbon dioxide.
•
Last update was to apply lessons learned from Unit 3 to Unit 2, an identical unit, for IPEC.
•
Included justification why it is reported serparately and not with other dose/curie tables.

Total Dose:In compliance with 40CFR190, the following table indicates the Total Dose, including any measured direct shine component from the site property for 2009:
Whole Body Max Organ
40 CFR 190 limit === IPEC 25 mrem 75 mrem
Routine Airborne Effluents1 Units 1 and 2 2.28E-3 2.28E-3
Routine Liquid Effluents Units 1 and 2 9.00E-4 1.71E-3
Routine Airborne Effluents1 Unit 3 3.36E-3 3.36E-3
Routine Liquid Effluents Unit 3 2.49E-4 4.59E-4
Carbon-14 Totals (Liquid & Airborne releases from IPEC Units 1, 2, & 3) IPEC 1.04E-1 5.20E-1
Ground Water & Storm Drain Totals IPEC2 2.56E-4 1.03E-3
Direct Shine from ISFSI, Radwaste Storage, SG Mausoleum, etc. IPEC3 5 5
Indian Point Energy Center Total Dose, per 40 CFR 190 IPEC 5.11 5.53

Investigating the high doses•
The RG 1.109-based values were quite high compared to published values of global C-14 burden.
•
NCRP-76 (1984) : 6 pCi/g in human tissue.
•
NCRP-81 (1985) : 1.25 mrem/yr, naturally, and approx 1% of this from Nuc Pwr Plants.
•
New York Power Authority, Indian Point #3 decided to take a second look at the Kunz report and newer data, to determine if we should alter the way we are reporting C-14 releases and offsite dose.
•
Contracted the Institute of Env Medicine at NY Univ Medical Center (Dr. Paul Linsalata), in 1989.

Findings from NYU, Institute of Environmental Medicine P. Linsalata, Ph.D
•
Curies were accurately measured and/or modeled from the Kunz study.
•
We were very conservatively calculating the offsite dose component (and well within limits).
•
Still, we could apply numerous site-specific data to be more accurate (lower) with our representation of offsite dose due to C-14.
•
Some values would be difficult and expensive to generate and justify, but some -
simple.

Suggested Improvements from 1989
•
Keep pathways (primarily ingestion and a slight amount from inhalation) but reduce the dose-driven source term to represent only the CO2
portion (26% of total curies).
•
Consider using more modern literature regarding the mean concentration of C-14 in the local atmosphere from a value of 0.16 g/m3
to 0.18 or 0.19 (Gammon,
1986).•
Fraction of total plant mass actually carbon is different for all vegetables/fruits. Site specific value may only involve corn. For the lower Hudson Valley, a more accurate value may be 0.075.

Suggested Improvements 2 of 4
•
Local area has a maximum 6 month growing season, April to September (Killough and Rohwe, HP 34, 1978)
•
Consider site specific ingestion rates, if they can be justified.
•
Consider that photosynthesis occurs only in daylight.

Suggested Improvements 3 of 4
MET data: •
Annual Avg data appears to be very conservative when used for C-14.
•
Look at joint frequency data (preferentially over many years) during DAYLIGHT and only during growing season. –
IPEC calculated X/Q values during daylight and growing season are 50-80% of routine ann avg.

Suggested Improvements 4 of 4
MET data stability:•
Generally there is much more instability during the day. Since non-elevated X/Q goes DOWN with increased instability, lower X/Q is available.–
Killough/Rohwer, HP, 1978 (used elevated only)
–
Eisenbud, 1987 and Hilsmeier & Gillford, 1962 X/Q values may increase with instability shifts at elevated release points, but at ground level, X/Q drops with increased instability.
•
If doses are a real challenge, making the effort to collect and process joint frequencies during the appropriate interval may prove beneficial.

X/Qs from elevated release point, different stability
meters from release point
1E-4
1E-5
1E-6
1E-7

X/Qs from ground level release point, different stability
meters from release point
1E-0
1E-1
1E-2
1E-3
1E-4
1E-5
1E-6
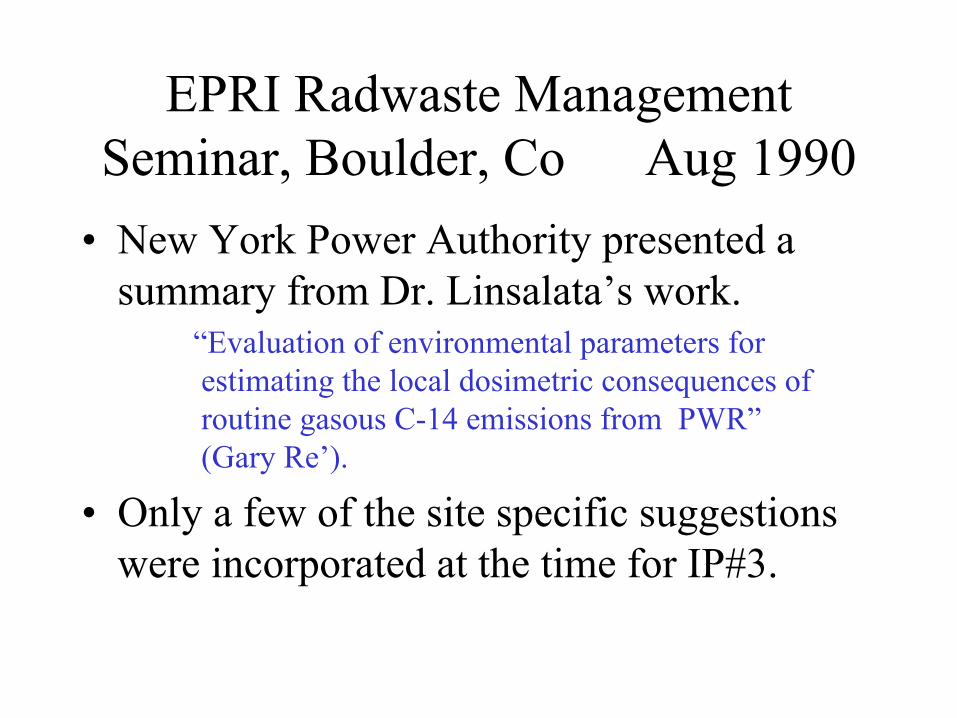
EPRI Radwaste Management Seminar, Boulder, Co Aug 1990
•
New York Power Authority presented a summary from Dr. Linsalata’s work.
“Evaluation of environmental parameters for estimating the local dosimetric consequences of routine gasous C-14 emissions from PWR”
(Gary Re’).
•
Only a few of the site specific suggestions were incorporated at the time for IP#3.

Few Improvements Incorporated•
Immediately applied only 26% of the C-14 curies released used for dose calculations.
•
Collected more detailed MET data used for determining ODCM 10-yr average data, but we did NOT elect to apply any of the new special X/Q data.
•
Limits were not challenged, and our chosen reporting method did not initiate further discussion, so the conservative assessment of 1990 (corrected for using only CO2
) was carried forward to 2004, eventually considered for IPEC’s 2-unit site.

Updates to considerIn addition to updates to the model resulting in a curie value (per GW yr) from EPRI, IPEC is currently considering the following:
–
Use of a 6 month growing season–
Recognition that there are not a lot of fruits/veg being grown or consumed locally (no grain), and that perhaps corn should be the sole source of the value for plant mass percentage that is carbon.
–
Use modern literature defining our region to be closer to 0.19 g/m3
for C-14 mean concentration
in air (vice Reg Guide 1.109 default of 0.16).
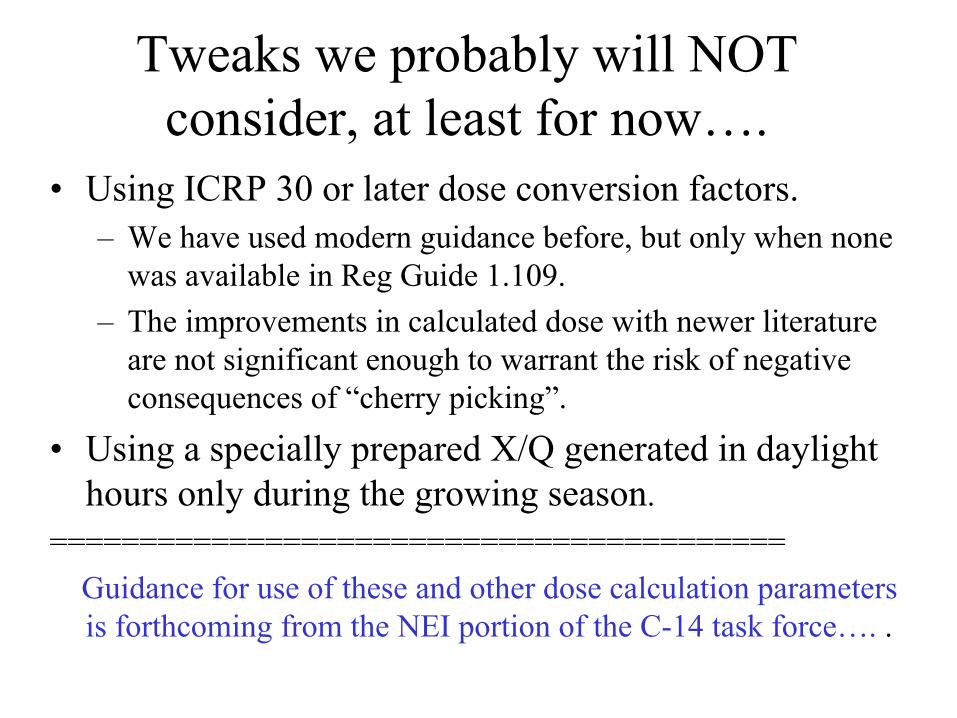
Tweaks we probably will NOT consider, at least for now….
•
Using ICRP 30 or later dose conversion factors.–
We have used modern guidance before, but only when none was available in Reg Guide 1.109.
–
The improvements in calculated dose with newer literature are not significant enough to warrant the risk of negative consequences of “cherry picking”.
•
Using a specially prepared X/Q generated in daylight hours only during the growing season.
=========================================Guidance for use of these and other dose calculation parameters is forthcoming from the NEI portion of the C-14 task force….
.

Veg Dose equations•
Old version:
C14 pCi/kg = 3.17E7 * p * Q * X/Q * (0.11/0.16)
Q = 2.50 Ci, P = 1, X/Q= 8.96E-7 sec/m3
•
Potential new version:
C14 pCi/kg = 3.17E7 * p * Q * X/Q * (0.075/0.19)
Q = 2.50
Ci, P = .25, X/Q= 8.96E-7 sec/m3
–
P represents a growing season of half the year, 12 hrs/day–
0.075 local fraction of total mass of veg that is carbon–
0.19 g/m3
is local concentration of of natural carbon in atmosphereA reduction in dose by an approximate factor of seven
Indian Point from the west