Embed Size (px)
Citation preview

Identifying Community-Level Predictors of Depression Hospitalizations
September 2005
John Fortney Gerard Rushton Scott Wood Lixun Zhang Kathryn Rost Western Interstate Commission for Higher Education Mental Health Program 3035 Center Green Drive Boulder, CO 80301

Depression Hospitalizations - 2 -
Executive Summary
The goal of this research was to identify rural areas that should be targeted for early
adoption of evidence-based depression treatments based on elevated rates of depression related
hospitalizations. Using county-level data from the Statewide Inpatient Database, Census,
Department of Agriculture, and Area Resource File, predictors of elevated hospitalizations rates
were identified using spatial regression models. This investigation demonstrated that: (1) rural
counties have lower rates of depression-related hospitalization than urban counties, (2) rurality
fails to predict depression-related hospitalization in models that control for community-level
demographic, economic and health system risk factors, (3) community-level risk factors explain
a respectable ~30% of the variance in depression-related hospitalization rates, and (4) while
these risk factors identify high risk areas in the 10 states we studied, they cannot be used to
identify high risk areas in other states.
This is the first investigation of potentially preventable mental health hospitalizations in a
high quality database that provides systematically coded information on all public and private
hospitalizations in 10 states across the country. Merging this database with other national
databases allowed us to identify community-level risk factors of unmet need for mental health
care that are otherwise subsumed under the umbrella of ‘rurality’. We identified rural counties
from 10 states with extremely elevated rates of depression related hospitalizations due to
observable community-level risk factors. These counties should be prioritized for
dissemination/implementation of evidence-based treatments for depression using designs that
evaluate whether improved depression treatment produces a cost offset for health plans because
it reduces expensive hospitalizations.

Depression Hospitalizations - 3 -
Introduction
Most efforts to implement best-practices for depression treatment target health systems
serving predominantly urban populations. The goal of this research was to identify rural areas
that should be targeted for early adoption of enhanced depression treatment models based on
unmet need. Unmet need can be measured in a variety of ways, including prevalence rates,
suicide rates, and depression related hospitalization rates. Prevalence rates in small areas must
be collected via survey which would be extremely expensive to collect for a nationally
representative sample. Suicide rates are available from the Centers for Disease Control (National
Vital Statistics).(1) However, it would be difficult to reliably characterize patient need by suicide
rates because, as relatively rare events, suicide rates fluctuate greatly in small areas over short
periods of time. Therefore, in this project, we used depression related hospitalizations as a proxy
for unmet need, recognizing that the delivery of high quality outpatient depression treatment
should lead to decreased rates of depression-related hospitalization.(2)
Geographic variation in the population’s need for improved depression care is
multifaceted and depends on many factors including demographic characteristics of the
population, characteristics of the local economy, and characteristics of the local health care
system. We expected that rural and urban areas would differ with respect to these risk factors
and that rural areas would have greater need for the dissemination and implementation of best-
practices for depression treatment. Although prevalence rates have not been found to differ
across rural and urban areas,(3) we expect that rurality is associated with higher hospitalization
rates due to worse access to outpatient specialty mental health care and poor economic
conditions. We also expect that higher rates of hospitalization would be explained by differences
in demographic, economic, and health care system characteristics. If these community-level risk
factors explain a high proportion of the variance in unmet need, they can be used to identify
geographic areas in rural America that. Four hypotheses were tested.
1. Rural counties will have significantly higher depression related hospitalization rates than
urban counties.
2. Depression related hospitalization rates will be significantly correlated with
demographics (e.g., ethnicity, poverty, and education), economic conditions, and health
system characteristics.
3. Rurality, demographics, economic conditions, and health system characteristics will

Depression Hospitalizations - 4 -
explain a substantial (e.g., >50%) amount of the variation in depression related
hospitalization rates.
4. Predictive models can be used to accurately identify geographic areas with elevated
depression related hospitalization rates.
These hypotheses were tested by conducting an analysis of spatially-referenced datasets
containing county level information about hospitalizations, rurality, demographics, economics,
and health care systems. Our ultimate goal was to identify counties across the U.S. with elevated
rates of depression related hospitalizations. However, because comprehensive inpatient datasets
containing both diagnostic and patient zipcode of origin information are not available at the
national level for all adults, it was necessary to 1) identify a nationally representative sub-set of
U.S. counties with available data, 2) identify significant predictors of depression related
hospitalizations in this sub-set of U.S. counties, 3) determine whether a predictive model with
external validity could be developed, and if so, 4) predict hospitalization rates in all U.S.
counties using nationally available data about rurality, demographics, economics, and health care
systems.
Methods
Data Sources
Depression related hospitalizations were extracted from the Statewide Inpatient Database
(SID) which contains the universe of hospital discharge records from all community hospitals in
participating states. States in the SID with patient zipcode information in 1995 included
Arizona, Colorado, Florida, Iowa, New Jersey, New York, Oregon, South Carolina, Washington
and Wisconsin. By 2000, data were also available from four other states (Kentucky, Maine,
North Carolina, and West Virginia). These states represent all regions of the US and have a wide
range of demographic, economics, and health system characteristics. The SID database includes
one record for each hospitalization and includes data about the age, gender, zipcode and up to 10
primary and secondary diagnoses. Counties were defined as the unit of analysis because
demographic, economic, and health system data are widely available at this unit of analysis and
because a smaller geographical unit would have yielded zero observed hospitalization too
frequently to be analyzed efficiently. Zipcodes were used to identify the patient’s county of

Depression Hospitalizations - 5 -
residence using a geocoding algorithm developed for the Missouri Census Data Center which
identifies the county in which the majority of the land area of the zipcode is contained
(http://mcdc2.missouri.edu/webrepts/geography/ZIP.resources.html). Data about the
demographic, economic and health system characteristics of the counties were obtained from the
U.S. Census, the U.S. Department of Agriculture, and the Area Research File.
Depression Related Hospitalization Rates
Following traditional methods, age-sex adjusted depression related hospitalization rates
in 2000 were calculated for each county.1 Using categories defined by the U.S. Census, each
inpatient was categorized into on of 20 age-sex groups.2 The observed hospitalization rate for
each age-sex group in the ten states was calculated by dividing the number of hospitalizations in
each group by the population in the group as reported in the 2000 U.S. Census. The expected
number of hospitalizations for each county was calculated as the product of the age-sex
hospitalization rate for the ten-state area and the number of persons in the county in the age-sex
category. The indirectly standardized hospitalization rate for each county k (SHRk), is the ratio
of the observed to the expected number of hospitalizations calculated according to the following
equation:(4)
k
k
j jjk
j jkk E
On
xSHR ==
∑∑
λ
where jkn is the population in the thj age-sex group and the thk county, xjk is the number of
depression related hospitalizations in the thj age-sex group and the thk county, and jλ is the
depression rate for in the thj age-sex group in the ten-state area. If kO denotes the observed
number of hospitalizations in each county and kE denotes the expected number of
hospitalizations, the SHR is k
k
EO . Values greater than one indicate a greater number of
hospitalizations than expected and values less than one indicate fewer hospitalizations than
expected. 1 Admissions with primary or secondary diagnoses of ICDN-9 296.2x, 296.3x, 298.0, 300.4 309.1, 311 were extracted from the SID database. These are the diagnostic codes used for the HEDIS depression performance measure. 2 The 10 age groups were 20-24, 25-29, 30-34, 35-44, 45-54, 55-59, 60-64, 65-74, 75-84, and 85+.

Depression Hospitalizations - 6 -
Explanatory Variables
Rurality was measured at the county level using two different indicators. The first was
the Office of Management and Budget’s (OMB) definition of a non Metropolitan Statistical Area
(MSA). The OMB defines a county as a MSA if it contains an urbanized area (population
greater 50,000) or it is adjacent to an MSA county and 25% of the employed population
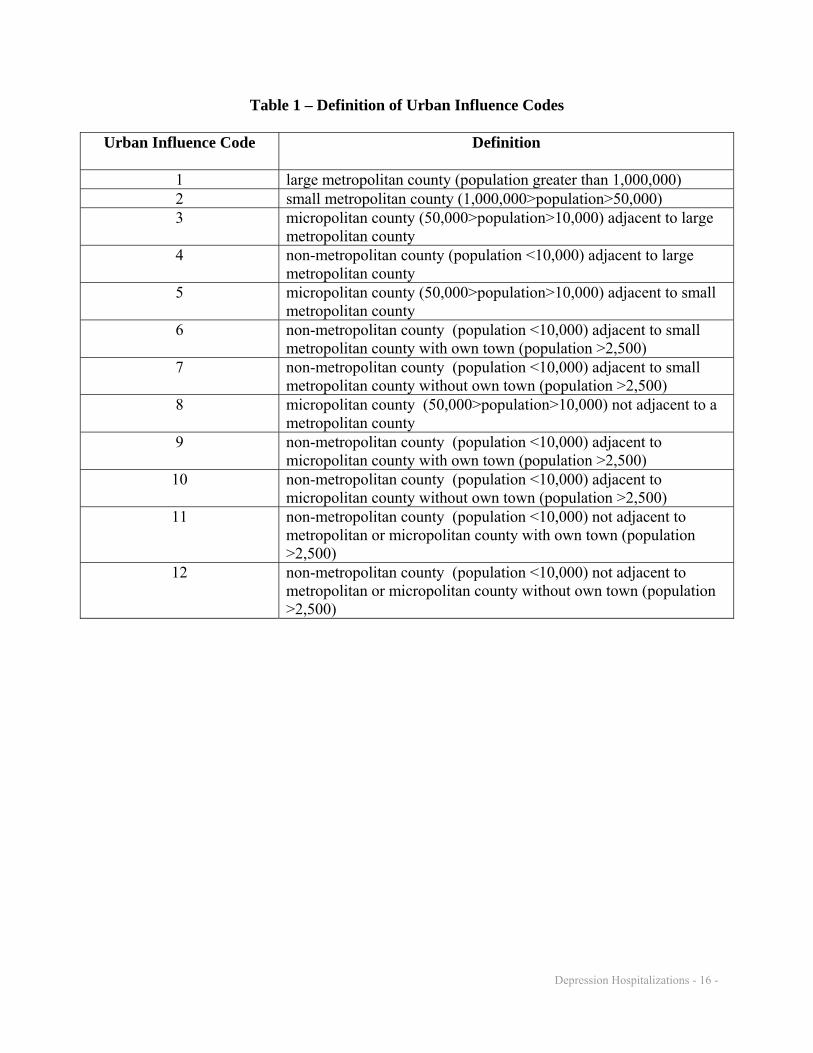
commutes to the urbanized area (or visa versa). The second measure of rurality was Urban
Influence Codes developed by the WWAMI Rural Health Research Center.(5) Counties are
divided into 12 categories according to their population and the proportion of workers
commuting to urban areas (see Table 1).
Demographic variables included percent of population African American, Hispanic,
Asian American, and Native American as defined by the U.S. Census. Other Census variables
included percent of population below the federally designated poverty level, percent with a high
school education, and percent of the population 16 and older who were unemployed. Economic
data generated by the Department of Agriculture included and indicator of housing stress, and six
mutually exclusive dummy variables indicating whether the economy of county was dependent
on farming, mining, manufacturing, federal government, services, or not dependent on a
specialized sector. Health system data from the Area Resource File included the number non-
psychiatrist physicians per 1000 people, the number of psychiatrists per 1000 people, the number
of psychologists per 1000 people, the number of social workers per 1000 people, the number of
hospital beds per 1000 people, and dummy variables indicating whether the county had a
community mental health center, whether the county was federally designated as a health
profession shortage area, and the penetration rate of health maintenance organizations (HMO).
Finally, we also included the longitude and latitude of the county, as the hospitalization rates
varied seem to vary east to west and north to south.
Statistical Analysis
The unit of the ecological regression analysis was the county. The analysis was
conducted in three stages. First, we conducted non-parametric bivariate analyses of the impact
of rurality on depression related hospitalization rates. We used a Kruskal-Wallis Rank Sum
Tests to compare the SHR rankings of MSA and non-MSA counties and to compare the SHR
rankings of the 12 UIC categories of counties. Second, because the spatial regression models
Depression Hospitalizations - 7 -
used in the third stage of the analysis were computationally intensive, it was necessary to first
identify a parsimonious model specification. Therefore, we used backward selection techniques
in conjunction with ordinary least squares regression analysis to first identify significant
predictors of depression related hospitalizations. To remain in the parsimonious specification,
variables had to achieve a significance cutoff level of p<0.2. Because we had no a priori
expectations about how the independent variables would interact to impact hospitalization rates,
we did not test for interaction effects. Because the dependent variable (SHR) does not conform
to the distributional assumptions of ordinary least squares regression, a more flexible spatial
regression model was used to test the hypotheses and generate predictions.
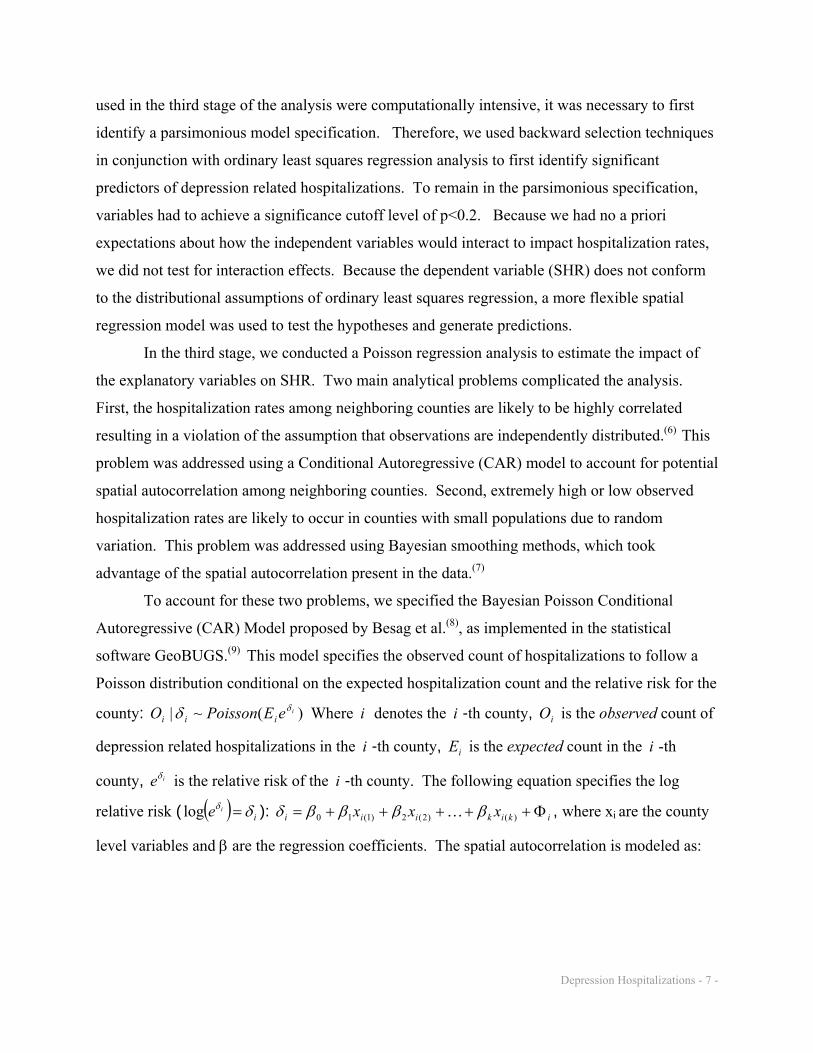
In the third stage, we conducted a Poisson regression analysis to estimate the impact of
the explanatory variables on SHR. Two main analytical problems complicated the analysis.
First, the hospitalization rates among neighboring counties are likely to be highly correlated
resulting in a violation of the assumption that observations are independently distributed.(6) This
problem was addressed using a Conditional Autoregressive (CAR) model to account for potential
spatial autocorrelation among neighboring counties. Second, extremely high or low observed
hospitalization rates are likely to occur in counties with small populations due to random
variation. This problem was addressed using Bayesian smoothing methods, which took
advantage of the spatial autocorrelation present in the data.(7)
To account for these two problems, we specified the Bayesian Poisson Conditional
Autoregressive (CAR) Model proposed by Besag et al.(8), as implemented in the statistical
software GeoBUGS.(9) This model specifies the observed count of hospitalizations to follow a
Poisson distribution conditional on the expected hospitalization count and the relative risk for the
county: )(~| ieEPoissonO iiiδδ Where i denotes the i -th county, iO is the observed count of
depression related hospitalizations in the i -th county, iE is the expected count in the i -th
county, ieδ is the relative risk of the i -th county. The following equation specifies the log
relative risk ( ( ) iie δδ =log ): ikikiii xxx Φ+++++= )()2(2)1(10 ββββδ K , where xi are the county
level variables and β are the regression coefficients. The spatial autocorrelation is modeled as:

Depression Hospitalizations - 8 -
imposed) smoothing of degree the(controlsparameter varianceoverall theof inverse :icounty of neighbors ofnumber :
icounty ofset neighbor :
1
)1,(~
δ
δ
i
i
kk
i
i
i
ii
m
m
mN
i
∂
Φ=Φ
ΦΦ
∑∂∈
External Validation
The predictive validity of the Bayesian Poisson CAR model (with Urban Influence Codes
as the measure of rurality) was determined using additional data from the four states added to the
SID database in 2000. Using the estimated coefficients from the Bayesian Poisson CAR model
and the values of the explanatory variables, the SHR was predicted for each county in Kentucky,
Maine, North Carolina, and West Virginia. Then for each state we used Pearson Rank
Correlations to compare the predicted and actual SHR for each state.
Results
In 2000, the 10 states had 520 counties and a population of 74,422,609. The SID
database contained 9,289,440 hospital discharges for the 10 states. Among the 54,012,886
residents aged 20 and above, 448,752 cases of depression related hospitalizations were recorded
in the SID database. The overall rate of depression related hospitalizations in these 520 counties
was 8.3 per 1000 residents ages 20 and above. This rate is slightly lower than the national
estimates based on the CDC National Hospital Discharge Survey 2002 which reports 9.2
depression related hospitalizations per 1000 residents ages 15 and above (using the same ICD9
codes). Table 1 presents the mean values of the county level risk factors.
The results of the bivariate analyses clearly demonstrate that rural counties have lower
rates of depression related hospitalizations (MSA SHR=1.02 and non-MSA SHR=0.94).
According to the Kruskal-Wallis Rank Sum Test, non-MSA counties have significantly (χ2 =
8.9771, p<0.01) lower rates of hospitalization than MSA counties. Likewise, the 12 UIC
classifications had significantly (χ2 = 36.3379, p<0.01) different rates of depression related
hospitalizations. These findings contradict our first hypothesis that rurality is positively
correlated with depression related hospitalizations.

Depression Hospitalizations - 9 -
The results of the multivariate analysis for the MSA v.s. non-MSA model identified 15
covariates (in addition to rurality) with p-values <0.2 including: demographic characteristics
(percent of population African American and Asian American), economic conditions (percent of
population below the federally designated poverty line, percent of the population 16 and older
who were unemployed, housing stress indicator, manufacturing dependent economy, non-
dependent economy), and health system characteristics (number non-psychiatrist physicians per
1000 people, the number of psychiatrists per 1000 people, the number of hospital beds per 1000
people, the HMO penetration rate, presence of a community mental health center, and federal
designation as a health profession shortage area). Longitude and latitude of the county was also
a significant predictor in the bivariate analyses. Non-MSA status was not a significant predictor
(p>0.2) in the multivariate analysis.
The results of the multivariate analysis for the UIC model also identified 15 covariates
with p-values <0.2. In contrast to the MSA v.s. non-MSA model, the Health Profession
Shortage Area variable dropped out and percent of population with a high school education was
added. Only one of the UIC categories (non-metropolitan county not adjacent to metropolitan or
micropolitan county without own town) was a significant predictor (β<0, p<0.01). No variable
had a variance inflation factor >3.2 suggesting that multi-collinearity among the explanatory
variables was not a problem. The R2 for the MSA model was 0.30 (F= 9.74, p<0.01) and the R2
for UIC model was 0.34 (F=-13.5, p<0.01). While these risk factors explain much of the variance
in rurality’s impact on depression related hospitalization rates, the results do not confirm our
third hypothesis that the explanatory variables can explain >50% of the variation in depression
related hospitalization rates.
The results of the Bayesian Poisson CAR model are depicted in Table 2. The table
presents the median parameter estimate for each explanatory variable. If the upper and lower
confidence limits within which 95% of the parameter estimates are included include zero, the
parameter estimate is not considered statistically significant at the α=0.05 level. Rurality was not
significantly correlated with depression related hospitalization rate in either the MSA v.s. non-
MSA model or the UIC model (although UIC category 12 had a negative and significant
coefficient indicating that the most rural counties had the lowest rates of hospitalization). Both
the MSA v.s. non-MSA model and the UIC models indicate that counties with a higher
percentage of African Americans had significantly (i.e., the parameter estimate was positive 95%

Depression Hospitalizations - 10 -
of the time) lower rates of depression related hospitalization. In the UIC model, counties with
higher proportions of Asian Americans also had significantly lower rates of hospitalization. In
both models, counties with higher poverty rates and counties whose economies were dependent
on manufacturing had significantly higher rates of hospitalization. Results from both models
indicated that the non-psychiatrist MDs per population and the presence of a community mental
health center were positively and significantly correlated with hospitalization rates. In the UIC
model, the number of psychiatrists per population was negatively correlated with hospitalization
rates. In the MSA v.s. non-MSA model, the HMO penetration was positively associated with
hospitalization rates. Overall, these results partially support our second hypothesis that
demographics, economic conditions, and health system characteristics are significantly
correlated with hospitalization rates.
Extreme values of SHR were defined as <0.75 and >1.333. These cutoff values
represent 25% less than the standardized rate and 33% greater than the standardized rate (note
that 1/1.33=0.75). Maps 1 and 2 depict the counties with extreme hospitalization rates based on
the raw data and rates based on predictions from the Bayesian Poisson CAR Model (UIC model
which had a lower deviance information criteria value than the MSA vs. Non-MSA model,
4,842.550 versus 4,850.940). The map of observed SHR depicts a large number of counties with
extreme observations (153 counties with SHR <0.75 and 80 counties with SHR >1.33),
highlighting the problem of estimating hospitalization rates in counties with small populations.
However, the map of estimated SHR from Bayesian Poisson CAR Model depicts fewer counties
with extreme observations (66 counties in the smallest group and 8 in the highest group). This
second map is more reliable for detecting counties with elevated SHRs because it reduces the
risk of identifying counties which have extreme values due to increased random variation
resulting from small populations. Specifically, information form neighboring counties is used to
reduce this random variation. This finding suggests that the predictive models can be used to
identify geographic areas with elevated hospitalization rates for counties included in the analysis,
which partially supports our fourth hypothesis.
The external validation indicated that the model estimated from the 10 states does not
generalize to the four states added to the SID database in 2000. The rank correlation between the
observed SHR and the predicted SHRs from the Bayesian Poisson CAR Model were all small
and insignificant: Kentucky (r=0.09, p=0.32), Maine (r=-0.48, p=0.06), North Carolina (r=0.02,

Depression Hospitalizations - 11 -
p=0.84), and West Virginia (r=0.10, p=0.48). Note that correlation coefficient for Maine was
negative. The correlation coefficient between the observed SHR in the 10 SID states and the
predicted SHRs in the 10 SID states was much higher and statistically significant (r=0.47,
(p<0.01). If the model had external validity to the four states, the correlation coefficients would
have approached this value and level of significance. This finding suggests that the predictive
models cannot be used to identify geographic areas with elevated hospitalization rates for
counties not included in the analysis. This result does not support our fourth hypothesis.
Discussion
This investigation demonstrated that: 1) rural counties have lower rates of depression-
related hospitalization than urban counties, 2) that rurality fails to predict depression-related
hospitalization in models that control for community-level demographics, economic conditions,
and health system risk factors, 3) that these risk factors explain about a third of the variance in
depression-related hospitalization rates, and 4) that while these risk factors identify high risk
areas in the 10 states we studied, they cannot be used to identify high risk areas in other states.
Our finding that rurality is not a risk factor for depression related hospitalizations as
hypothesized is not consistent with a previous study of community residents with depression
which found that those located in rural areas were more likely to be hospitalized.(2) With respect
to demographic characteristics, our finding that depression related hospitalization rates are lower
in counties with higher proportions of African Americans is consistent with epidemiological
studies which find lower prevalence rates of depression and lower treatment seeking rates among
minorities.(13-16) With respect to economic conditions, our finding that poverty rates were
significantly correlated with hospitalization rates is consistent with findings from observational
studies that poverty is a risk factor for depression.(14;17-19) Our finding that unemployment rates
are not correlated with depression related hospitalization rates is not consistent with previous
studies which report that unemployment (measured at the level of the individual) contributes
directly to an increased need for depression treatment.(20-22) The finding that counties with
manufacturing dependent economies have higher rates of depression related hospitalizations has
not been reported previously in the literature.
With respect to health care system characteristics, our findings point to a rather
complicated relationship between outpatient service availability and hospitalizations. On one

Depression Hospitalizations - 12 -
hand, hospitalization rates are higher when the number of non-psychiatrist physicians per person
is higher and when there is a community mental health center in the county. The first finding is
consistent with a study reporting that increased access to primary care (as measured at the level
of the individual) results in higher inpatient admission rates for mental health problems.(23) The
finding that counties with community mental health centers have higher rates of depression
related hospitalizations supports a previous study by Hendryx and Rohland that found that
psychiatric inpatient admission rates were higher in areas closer to a community mental health
center.(12) Hendryx and Rohland suggest that this finding may be due to supplier-induced
demand. It could also be that the greater availability of non-psychiatrist physicians and
Community Mental Health Center staff increases the likelihood that individuals in need of
hospitalization are being detected (a hypothesis also put forth by Hendryx and Rohland). On the
other hand, hospitalization rates are lower when the number of psychiatrists per person is greater,
which indicates that when psychiatrists are available for referral or consultation it reduces the
risk of hospitalization. In contrast, we found no significant relationship between hospitalization
rates and the number of psychologists or social workers per person. Likewise, we found no
relationship between hospitalization rates and the number of hospital beds per person. This latter
finding is inconsistent with Wennberg’s previous findings that bed supply is correlated with
hospitalization rates across a range of physical health diagnoses.(24) Our non-finding may be due
to the fact that we could only observe the total number of hospital beds per person, rather than
the number of psychiatric beds per person. The finding that HMO penetration rates are
positively correlated with hospitalization rates for depression seems counter-intuitive, although
managed care cost containment strategies tend to reduce costs per admission rather number of
admissions.(25;26)
Limitations and Strengths
There are several known limitations to the analysis. The first limitation is the modifiable
areal unit problem, which states that results may differ depending on the geographical unit of
analysis. Although counties are an appropriate geographical unit of analysis, results may have
differed if we had specified zipcodes to be the unit of analysis. In particular, the amount of
border crossing (e.g., individuals using outpatient health services outside the county) decreases
as the size of the geographic unit increases. A second known limitation is edge effects.(27)

Depression Hospitalizations - 13 -
Although the statistical analysis controlled for spatial autocorrelation, we did not account for
hospitalizations in adjacent counties located in states not in the SID database. Although, we
could have imputed hospitalizations from adjacent counties with missing data this would have
complicated the analysis considerably and it is not likely that results would have changed
substantially. The third potential limitation concerns variations and inaccuracies in the diagnosis
of depression during hospitalizations. It is possible that some of the variations and correlations
observed in the data resulted from differences in diagnostic coding procedures across geographic
areas rather than true differences in the need for inpatient services due to depression or
complicated by depression. Fourth, whenever the unit of analysis is a geographic area (e.g.,
county) rather than an individual, there is the potential for the ecological fallacy. While it would
have been preferable to analyze individual level data, this was not feasible because large
nationally representative datasets containing both clinical data and risk factor data measured at
the level of the individual are not available.
Despite the limitations described above, these are the first nationally representative data
that have been presented about the risk factors for depression related hospitalizations. The
analysis was conducted in a high quality database that provided systematically coded information
on all hospitalizations in 10 states across the country. The depression related hospitalizations
rates were very similar to national estimates from the CDC. Using spatial regression techniques,
we were able to successfully identify counties from 10 states with elevated rates of depression
related hospitalizations. These counties should be prioritized for dissemination/implementation
of evidence-based treatments for depression. However, the predictive models were not found to
have external validity when compared to observed hospitalization rates in the four states added to
the SID database in 2000. Therefore, we conclude that these models cannot be used to identify
areas outside the 10 states that are in greatest need for early adoption of evidence-based
depression treatment.

Depression Hospitalizations - 14 -
References:
1. Gibbons RD, Hur K, Bhaumik DK, Mann JJ. The relationship between antidepressant medication use and rate of suicide. Arch Gen Psychiatry. 2005; 62:165-172.
2. Rost K, Zhang M, Fortney J, Smith J, Smith GR, Jr. Rural-urban differences in depression treatment and suicidality. Med Care. 1998; 36(7):1098-1107.
3. Kessler RC, McGonagle KA, Zhao S, Nelson CB, Hughes M, Eshleman S et al. Lifetime and 12-month prevalence of DSM-III-R psychiatric disorders in the United States: Results from the National Comorbidity Survey. Arch Gen Psychiatry. 1994; 51(1):8-19.
4. Gotway C, Waller L. Applied Spatial Statistics for Public Health Data. Hoboken, NJ: John Wiley and Sons, 2004.
5. Hart LG, Larson EH, Lishner DM. Rural definitions for health policy and research. Am J Public Health. 2005; 95(7):1149-1155.
6. Clayton DG, Bernardinelli L, Montomoli C. Spatial correlation in ecological analysis. Int J Epidemiol. 1993; 22(6):1193-1202.
7. Clayton D, Kaldor J. Empirical Bayes estimates of age-standardized relative risks for use in disease mapping. Biometrics. 1987; 43(3):671-681.
8. Besag J, York J, Mollie A. Bayesian image restoration, with two applications in spatial statistics. Annals of the Institute of Statistical Mathematics. 1991; 43:1-59.
9. Thomas A, Best N, Arnold R, Spiegelhalter D. GeoBugs User Manual (Version 1.1 Beta). 2002. Ref Type: Electronic Citation
10. Wisconsin Department of Health and Family Services DoPHMHP. The health of racial and ethnic populations in Wisconsin: 1996-2000. (Wisconsin Minority Health Report). PPH 0281. 2004. Madison, WI, Department of Health and Family Services. Ref Type: Report
11. Richman VV, Richman EM, Richman A. Patterns of hosptial costs for depression in general hosptial wards and specialized psychiatric settings. Psychiatr Serv. 2000; 51(2):179-181.
12. Hendryx MS, Rohland BM. A small area analysis of psychiatric hospitalizations to general hospitals: Effects of community mental health centers. Gen Hosp Psychiatry. 1994; 16:313-318.
13. Kessler RC, Berglund P, Demler O, Jin R, Walters EE. Lifetime prevalence and age-of-onset distributions of DSM-IV disorders in the National Comorbidity Survey Replication. Arch Gen Psychiatry. 2005; 62:593-602.
14. Riolo SA, Nguyen TA, Greden JF, King CA. Prevalence of depression by race/ethnicity: Findings from the National Health and Nutrition Examination Survey III. Am J Public Health. 2005; 95(6):998-1000.
15. Wang PS, Lane M, Olfson M, Pincus HA, Wells KB, Kessler RC. Twelve-month use of mental health services in the United States: Results from the National Comorbidity Survey Replication. Arch Gen Psychiatry. 2005; 62:629-640.
16. Wang PS, Berglund P, Olfson M, Pincus HA, Wells KB, Kessler RC. Failure and delay in initial treatment contact after first onset of mental disorders in the National Comorbidity Survey Replication. Arch Gen Psychiatry. 2005; 62:603-613.
17. Eibner C, Sturn R, Gresenz CR. Does relative deprivation predict the need for mental health services? Journal of Mental Health Policy and Economics. 2004; 7(4):167-175.
18. Egede LE, Zheng D. Independent factors associated with major depressive disorder in a national sample of individuals with diabetes. Diab Care. 2003; 26(1):104-111.
19. Mirowsky J, Ross CE. Age and the effect of economic hardship on depression. J Health Soc Behav. 2001; 42(2):132-150.
20. Dooley D, Cotalano R. Recent research on the psychological effects of unemployment. J Soc Issues. 1988; 44(4):1-12.
21. Fergusson DM, Horwood LJ, Lynskey MT. The effects of unemployment on psychiatric illness during young adulthood. Psychol Med. 1997; 27(2):371-381.
22. Montgomery SM, Cook DG, Bartley MJ, Wadsworth ME. Unemployment pre-dates symptoms of depression and anxiety resulting in medical consultation in young men. Int J Epidemiol. 1999; 28(1):95-100.
23. Fortney J, Steffick D, Burgess J, Maciejewski M, Petersen L. Are primary care services a substitute or complement for specialty and inpatient services? Health Serv Res. In press.

Depression Hospitalizations - 15 -
24. Dartmouth Medical School, Center for the Evaluative Clinical Sciences. The Dartmouth Atlas of Health Care. Chicago: American Hospital Publishing, Inc., 1996.
25. Merrick EL. Treatment of major depression before and after implementation of a behavioral health carve-out plan. Psychiatr Serv. 1998; 49(12):1563-1567.
26. Leslie DL, Rosenheck R. Shifting to outpatient care? Mental health care use and cost under private insurance. Am J Psychiatry. 1999; 156:1250-1257.
27. Vidal Rodeiro C, Lawson A. An evaluation of the edge effects in disease map modeling. Computational Statistics and Data Analysis. 2005; 49:45-62.
Depression Hospitalizations - 16 -
Table 1 – Definition of Urban Influence Codes
Urban Influence Code Definition
1 large metropolitan county (population greater than 1,000,000) 2 small metropolitan county (1,000,000>population>50,000) 3 micropolitan county (50,000>population>10,000) adjacent to large
metropolitan county 4 non-metropolitan county (population <10,000) adjacent to large
metropolitan county 5 micropolitan county (50,000>population>10,000) adjacent to small
metropolitan county 6 non-metropolitan county (population <10,000) adjacent to small
metropolitan county with own town (population >2,500) 7 non-metropolitan county (population <10,000) adjacent to small
metropolitan county without own town (population >2,500) 8 micropolitan county (50,000>population>10,000) not adjacent to a
metropolitan county 9 non-metropolitan county (population <10,000) adjacent to
micropolitan county with own town (population >2,500) 10 non-metropolitan county (population <10,000) adjacent to
micropolitan county without own town (population >2,500) 11 non-metropolitan county (population <10,000) not adjacent to
metropolitan or micropolitan county with own town (population >2,500)
12 non-metropolitan county (population <10,000) not adjacent to metropolitan or micropolitan county without own town (population >2,500)

Depression Hospitalizations - 17 -
Table 2 – Descriptive Statistics
Variables Mean (s.d.)/Proportion Dependent Variable Standardized Hospitalization Ratio 0.96 (0.38)
Explanatory Variables Non-MSA 65.8% Urban Influence Code - 1 15.0% Urban Influence Code - 2 25.6% Urban Influence Code – 3 3.9% Urban Influence Code – 4 1.9% Urban Influence Code – 5 11.2% Urban Influence Code – 6 15.2% Urban Influence Code – 7 5.8% Urban Influence Code – 8 5.4% Urban Influence Code – 9 5.0% Urban Influence Code – 10 3.3% Urban Influence Code – 11 3.7% Urban Influence Code – 12 4.2%
Covariates % African American 6.89 (12.62) % Hispanic 6.97 (10.48) % Asian American 1.12 (1.74) % Native American 1.50 (5.94) % Poverty 11.49 (4.64) % Unemployed 2.10 (1.03) % High School Education 81.38 (7.15) House Stress Indicator 31.35% Mining Dependent 0.96% Farming Dependent 8.65% Federal Government Dependent 12.88% Services Dependent 21.35% Manufacturing Dependent 25.58% Not Dependent 30.58% Health Professional Shortage Area 0.66 (0.67) Physicians Per 1000 Pop 1.38 (1.23) Psychiatrists Per 1000 Pop 0.063 (0.10) Psychologists Per 1000 Pop 0.21 (0.39) Social workers per 1000 Pop 0.84 (1.22) Hospital Beds Per 1000 Pop 3.4 (3.36) CMHC in County 21.2% HMO Penetration Rate 0.17 (0.16) Latitude 39.89 (5.57) Longitude -93.52 (14.97)

Depression Hospitalizations - 18 -
Table 3 – Bayesian Poisson CAR Model Results
Variable Model 1 Coefficients
Model 2 Coefficients
Intercept -0.484* 0.135 Non-MSA -0.023 - UIC - 1 - - UIC - 2 - 0.017 UIC – 3 - 0.041 UIC – 4 - -0.195 UIC – 5 - 0.012 UIC – 6 - -0.053 UIC – 7 - -0.050 UIC – 8 - 0.017 UIC – 9 - -0.04034 UIC – 10 - -0.087 UIC – 11 - -0.178 UIC – 12 - -0.485* % African American -0.006* -0.007* % Asian American -0.019 -0.023* % Poverty 0.019* 0.023* % Unemployed 0.041 0.044 % High School Education _ -0.000 House Stress Indicator -0.077 -0.095* Manufacturing Dependent 0.147* 0.119* Not Dependent 0.106 0.091* HPSA 0.017 - Physicians Per Pop 0.102* 0.090* Psychiatrists Per Pop -0.485 -0.436* Hospital Beds Per Pop 0.007 0.010 CMHC in County 0.112 0.092* HMO Penetration Rate 0.373* 0.254 Latitude -0.008 -0.007 Longitude -0.002 0.004
MSA – Metropolitan Statistical Area UIC – Urban Influence Code * p<0.05

Depression Hospitalizations - 19 -
Map 1 – Indirectly Standardized Depression Related Hospitalization Rate
Legend
Standardized Hospitalization Rates
Lowest – 0.750 0.751 – 1.333 1.334 - Highest

Depression Hospitalizations - 20 -
Map 2 – Depression Related Hospitalization Rates from Bayesian Poisson CAR Model
Legend
Standardized Hospitalization Rates
Lowest – 0.750 0.751 – 1.333 1.334 - Highest

Depression Hospitalizations - 21 -
The WICHE Center for Rural Mental Health Research was established in 2004 to develop and disseminate scientific knowledge that can be readily applied to improve the use, quality and outcomes of mental health care provided to rural populations. As a General Rural Health Research Center in the Office of Rural Health Policy, the WICHE center is supported by the Federal Office of Rural health Policy, Health Resources and Services Administration (HRSA), Public Health Services, grant number U1CRH03713. The WICHE Center selected mental health as its area of concentration because: (1) although the prevalence and entry into care for mental health problems is generally comparable in rural and urban populations, the care that rural patients receive for mental health problems may be of poorer quality, particularly for residents in outlying rural areas and (2) efforts to ensure that rural patients receive similar quality care to their urban counterparts generally requires restructuring treatment delivery models to address the unique problems rural delivery settings face. Within mental health, the Center proposes to conduct the research development/dissemination efforts needed to ensure rural populations receive high quality depression care. Within mental health, the Center will concentrate on depression because: (1) depression is one of the most prevalent and impairing mental health conditions in both rural and urban populations, (2) most depressed patients fail to receive high quality care when they enter rural or urban treatment delivery systems, (3) outlying rural patients are more likely to receive poorer quality care than their urban counterparts, (4) urban team settings are adopting new evidence-based care models to assure that depressed patients receive high quality care for the condition that will increase the rural-urban quality chasm even further, and (5) urban care models can and need to be refined for delivery to rural populations. The WICHE Center is based at the Western Interstate Commission for Higher Education. For more information about the Center and its publications, please contact: WICHE Center for Rural Mental Health Research 3035 Center Green Dr. Boulder, CO 80301 Phone: (303) 541-0311 Fax: (303) 541-0291 http://www.wiche.edu/mentalhealth/ResearchCenter/ResearchCenter.asp
The WICHE Center for Rural Mental Health Research is one of seven Rural Health Research Centers supported by the Federal Office of Rural Health Policy (ORHP), Grant No.
1 U1CRH03713-01. This project is funded by ORHP, Health Resources and Services Administration, U.S. Department of Health and Human Services. The specific content of this
paper is the sole responsibility of the authors.