Embed Size (px)
Citation preview
Effects of chemical control of sagebrush on the occurrence of sage grouse in Southwestern Montanaby Neil Sidney Martin
A thesis submitted to the Graduate Faculty in partial fulfillment of the requirements for the degree ofMASTER OF SCIENCE in Fish and Wildlife ManagementMontana State University© Copyright by Neil Sidney Martin (1965)
Abstract:A study was conducted during the summers of 1962, 1963, and 1964 on a 1,900 acre allotment inSouthwestern Montana. A total of 1,710 acres of the allotment had been sprayed in 1961 with 2,4-D tocontrol sagebrush. A total of 190 acres of the allotment, consisting of three strips approximately oneand one-quarter miles in length and five chains in width, as well as areas along streams, were leftunsprayed. Objectives of my study were to obtain quantitative data on effects of chemical control ofsagebrush on a sage grouse population® Canopy coverage measurements of vegetation in the 1,900acre allotment revealed about 80 percent grasses and 20 percent forbs in sprayed strips and 60 percentgrasses and 40 percent forbs in unsprayed strips. low shrub canopy coverage in sprayed strips wasreduced as compared with unsprayed strips, and 97 percent of the Big Sage plants evaluated wererecorded as dead. Only eight percent were recorded as dead in unsprayed strips.
Sprayed strips provided only four percent of the 415 sage grouse observations made" on the 1,900 acreallotment. Ninty-one percent of the 15 sage grouse observed in sprayed strips were within 95 feet of anunsprayed strip. Canopy coverage measurements of herbaceous vegetation at 137 sage grouselocations, most of which were outside the 1,900 acre allotment, consisted of approximately 60 percentgrasses and 40 percent forbs, Low shrub canopy coverage was similar from year to year, and 92 percentof the Big Sage plants evaluated were recorded as living. The similarity of the vegetation compositionat sage grouse locations and in the unsprayed strips led to the conclusion that the differences innumbers of sage grouse observed in sprayed and unsprayed strips were related to vegetationcomposition. Density, percent crown coverage, and maximum height of Big Sage plants weredetermined at each of 159 sage grouse locations. Broods, six weeks or less of age, were found on areashaving a lesser density and lower percent crown coverage of Big Sage than were older broods andadults. Food habits were determined by analysis of the contents of 35 sage grouse crops. Sagebrush andthree genera of forbs together constituted 94.6 percent of the total volume. Dandelion and sagebrushhad the greatest total percent frequency of occurrence of all food items. These high frequency foodplants were more abundant in unsprayed than in sprayed strips, which strengthened the conclusion thatdifferences in numbers of sage grouse observed in unsprayed and sprayed strips were related tovegetation composition.
/7
EFFECTS OF CHEMICAL CONTROL OF SAGEBRUSH ON THE OCCURRENCE OF SAGE GROUSE IN SOUTHWESTERN MONTANA
byNEIL SIDNEY MARTIN
A thesis submitted to the Graduate Fatuity in partial fulfillment of the requirements for the.degree
of
MASTER OF SCIENCE
in
Fish and Wildlife Management
Approved:
Head^Major Department
______________ ___________________Chairman, Examining Committee
Dean, Graduate Division
MONTANA STATE COLLEGE Bozeman, Montana
June, 1965
/
ill
ACKNOWLEDGEMENTTo the following,.among others, the author wishes to
extend sincere appreciation for their contributions to this
study: Dr. Don C . Quimby, Montana State College, for tech
nical supervision and guidance in preparation of the manu
script ; Dr. Robert L. Eng and Mr.Leroy Ellig, Montana State
Fish and Game Department, for project planning and field as
sistance; Dr. W. E . Booth, Montana State College,., for verifying plant identifications; Mr. Thomas Mussehl and Mr. Robert
Greene, Montana State Fish and Game Department, for field
assistance; Mr. Kenneth Greer, Montana State Fish and Game
Department, for assistance in analysis of crop contents; Mr.
Robert Gibson and Mr. Hubert Humes, District Rangers, and all
the personnel of the Lima District, Beaverhead National Forest, for assistance and use of equipment; his wife, Joellen,
and immediate family for assistance and encouragement; Mr.Gary Mann of Helena for two summer’s aid and cooperation in
field work. During the study, the writer was supported by the
Montana State Fish and Game Department under Federal Aid Pro
jects W-91-R-4, W-91-R-5, W-91-R-6, and the U. S. Forest
Service.
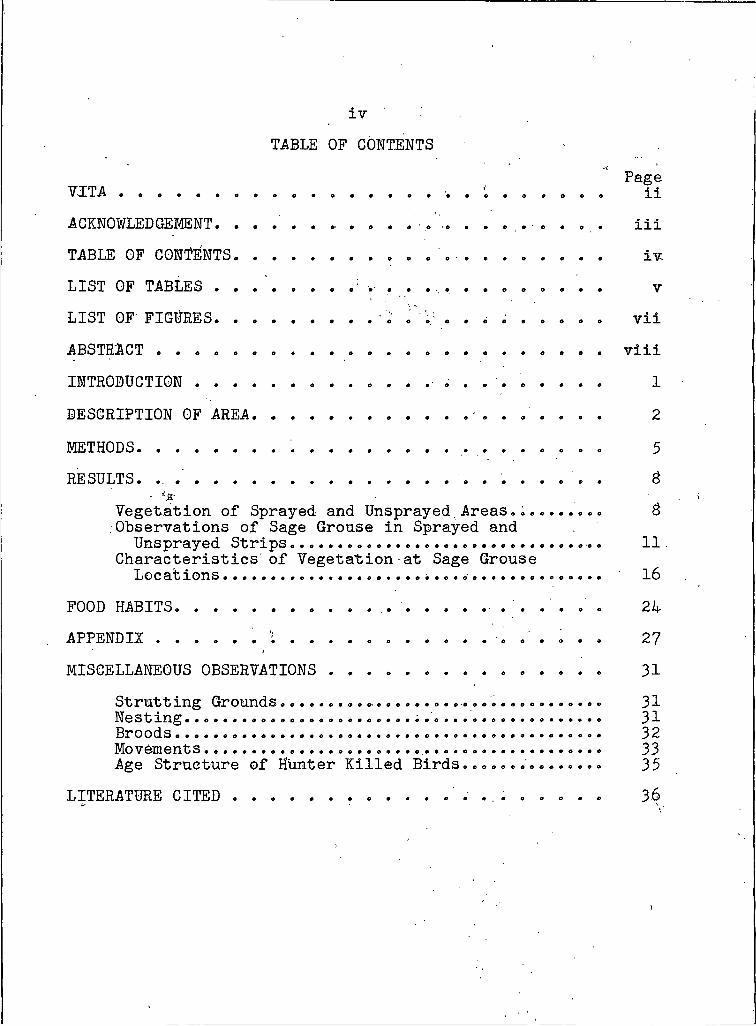
ivTABLE OF CONTENTS
V J T A ........................ ii
ACKNOWLEDGEMENT. . . . . . . . . . . . . . . . . . iii
TABLE OF CONTENTS........................ iv
LIST OF TABLES . . ........... .. v
LIST OF' FIGURES................... vii
ABSTRACT .......................... . . . . . . . . . . . viii
Page
INTRODUCTION ............................ I
DESCRIPTION OF AREA.......................... 2
METHODS................. 5
RESULTS. .. .'.............................. 8• <3-
Vegetation of Sprayed and Unsprayed.Areas........ 8Observations of Sage Grouse in Sprayed and
Unsprayed Strips................................. IICharacteristics of Vegetation at Sage Grouse
Locations....... 16
FOOD HABITS........................ 24
APPENDIX........... ; ...................... .. 2?
MISCELLANEOUS OBSERVATIONS ............................... 31
Strutting Grounds•................................. 31Nesting................ 31Broods.................. 32Movements........................ 33Age Structure of Hunter Killed Birds............. 35
LITERATURE C I T E D .......................... 36
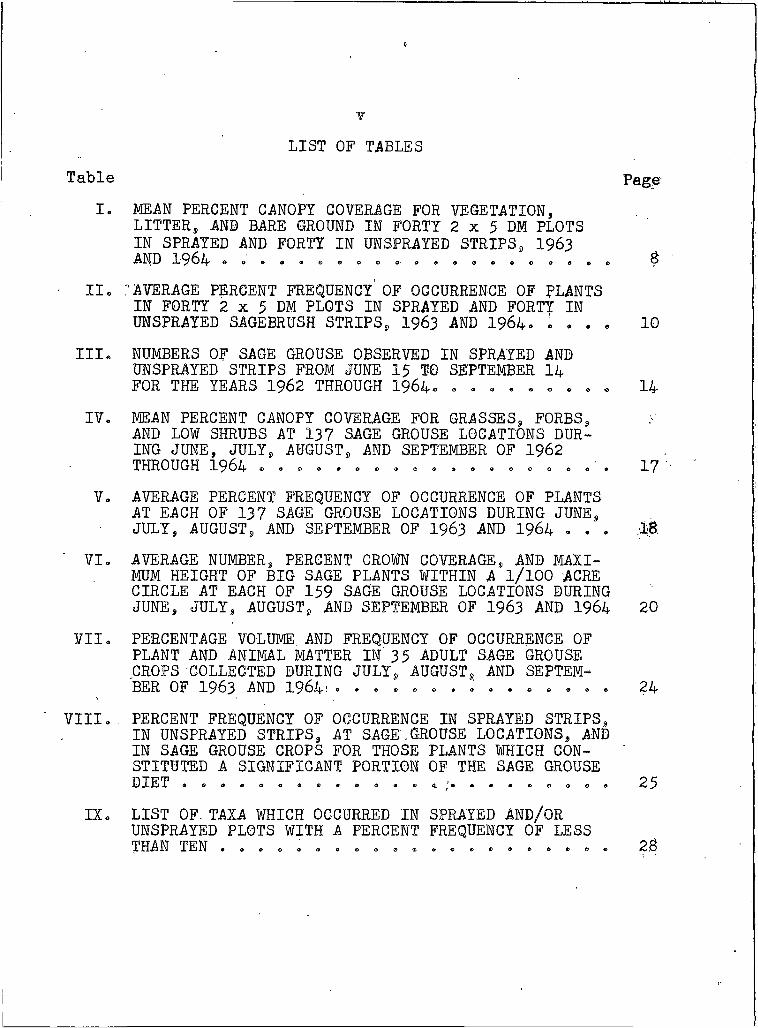
LIST OF TABLES
Table PageI. MEAN PERCENT CANOPY COVERAGE FOR VEGETATION9
LITTER, AND BARE GROUND IN FORTY 2 x 5 DM PLOTSIN SPRAYED AND FORTY IN UNSPRAYED STRIPS, 1963 AND o o e e e o a o o o - » * e o e e e o e $
H e :AVERAGE PERCENT FREQUENCY OF OCCURRENCE OF f LANTS IN FORTY 2 x 5 DM PLOTS IN SPRAYED AND FORTY IN UNSPRAYED SAGEBRUSH STRIPS, 1963 AND 1964. L . . . IO
III* NUMBERS OF SAGE GROUSE OBSERVED IN SPRAYED AND UNSPRAYED STRIPS FROM JUNE 15 TO SEPTEMBER 14 FOR THE YEARS 1962 THROUGH 1964. ................. 14
IV. MEAN PERCENT CANOPY COVERAGE FOR GRASSES, FORBS9 AND LOW SHRUBS AT 137 SAGE GROUSE LOCATIONS DURING JUNE, JULY, AUGUST, AND SEPTEMBER OF 1962 THROUGH 1964 . . C o . . . . . . . . . . . . . . 17 "
V. AVERAGE PERCENT FREQUENCY OF OCCURRENCE OF PLANTS AT EACH OF 137 SAGE GROUSE LOCATIONS DURING JUNE,JULY, AUGUST, AND SEPTEMBER OF 1963 AND 1964 . . . .18
VI. AVERAGE NUMBER, PERCENT CROWN COVERAGE, AND MAXIMUM HEIGHT OF BIG SAGE PLANTS WITHIN A l/lOO ACRE CIRCLE AT EACH OF 159 SAGE GROUSE LOCATIONS DURING JUNE, JULY, AUGUST, AND SEPTEMBER OF I963 AND 1964 20
VII. PERCENTAGE VOLUME AND FREQUENCY OF OCCURRENCE OF PLANT AND ANIMAL MATTER IN 35 ADULT SAGE GROUSE CROPS COLLECTED DURING JULY, AUGUST, AND SEPTEMBER OF 1963 AND 19641 0 . . 0 0 0 . 0 . . o . 0 . 0 24
VIIIo PERCENT FREQUENCY OF OCCURRENCE IN SPRAYED STRIPS, IN UNSPRAYED STRIPS, AT SAGE.GROUSE LOCATIONS, AND IN SAGE GROUSE CROPS FOR THOSE PLANTS WHICH CONSTITUTED A SIGNIFICANT PORTION OF THE SAGE GROUSEDIET 0 0 0 e o o o o e e o o o 6. j e o . o o o o e e
IX. LIST OF. TAXA WHICH OCCURRED IN UNSPRAYED PLOTS WITH A PERCENT THAN TEN . . . . ...........
SPRAYED AND/OR FREQUENCY OF LESS
2.8
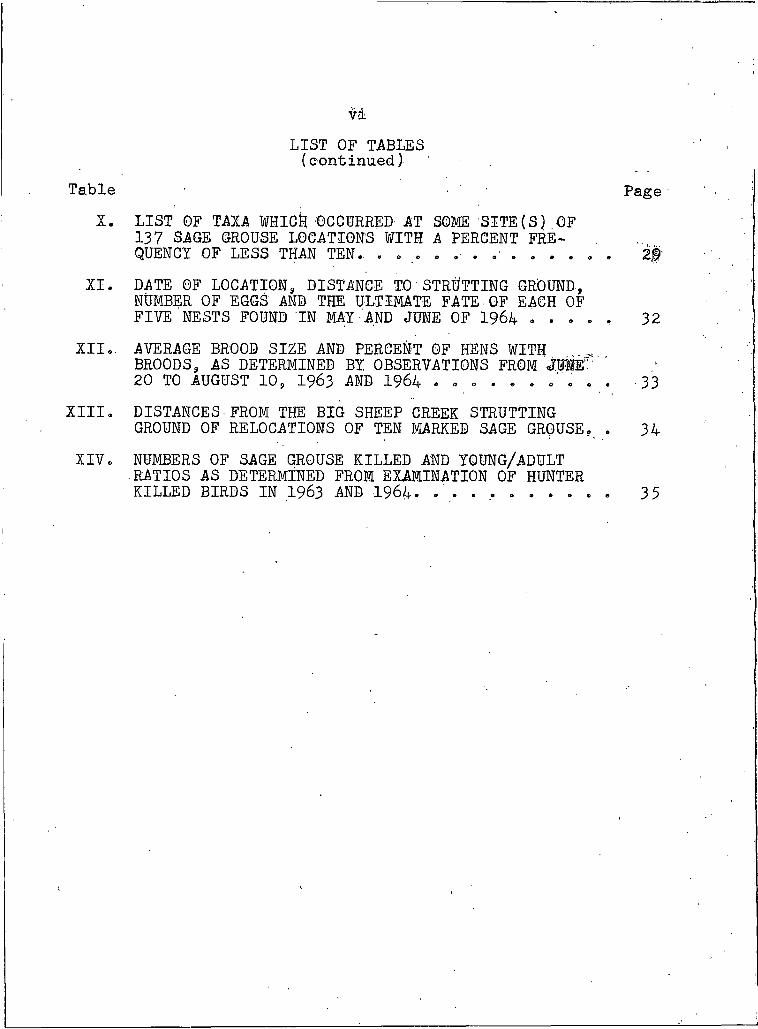
LIST OF TABLES (continued)
vi
I. LIST OF TAXA WHIG)) OCCURRED AT SOME SITE(S) OF 137 SAGE GROUSE LOCATIONS WITH A PERCENT FREQUENCY OF LESS THAN TEN., , . . . . . . . .
XI. DATE OF LOCATION, DISTANCE. TO STRUTTING GROUND, NUMBER OF EGGS AND THE ULTIMATE FATE OF EACH OF FIVE NESTS FOUND IN MAY AND JUNE OF I964 . . . .
XII.. AVERAGE BROOD SIZE AND PERCENT OF HENS WITHBROODS, AS DETERMINED BY OBSERVATIONS FROM jUlE17 20 TO AUGUST 10, 1963 AND 1964
XIII. DISTANCES FROM THE BIG SHEEP CREEK STRUTTINGGROUND OF RELOCATIONS OF TEN MARKED SAGE GROUSE.
XIV. NUMBERS OF SAGE GROUSE KILLED AND YOUNG/ADULTRATIOS AS DETERMINED FROM EXAMINATION OF HUNTER KILLED BIRDS IN 1963 AND 1964. .'...............
Table
I
. " #
, 32
. 33
34
. 35
Page
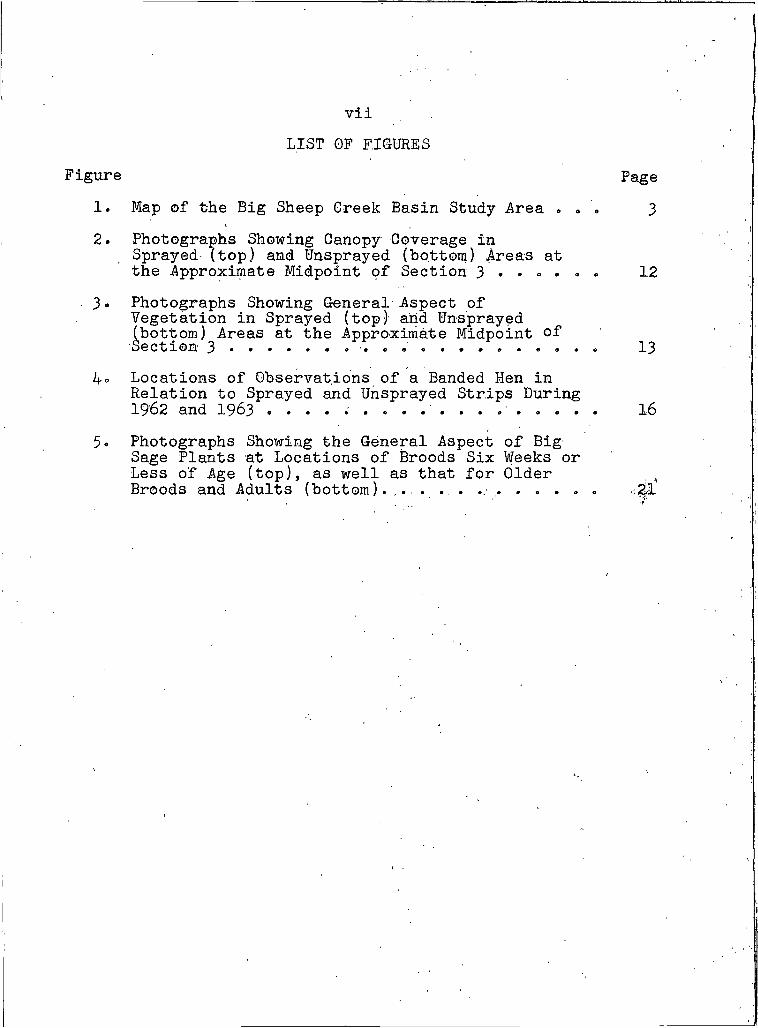
viiLIST GF FIGURES
1. Map of the Big Sheep Greek Basin Study Area . <, . 3
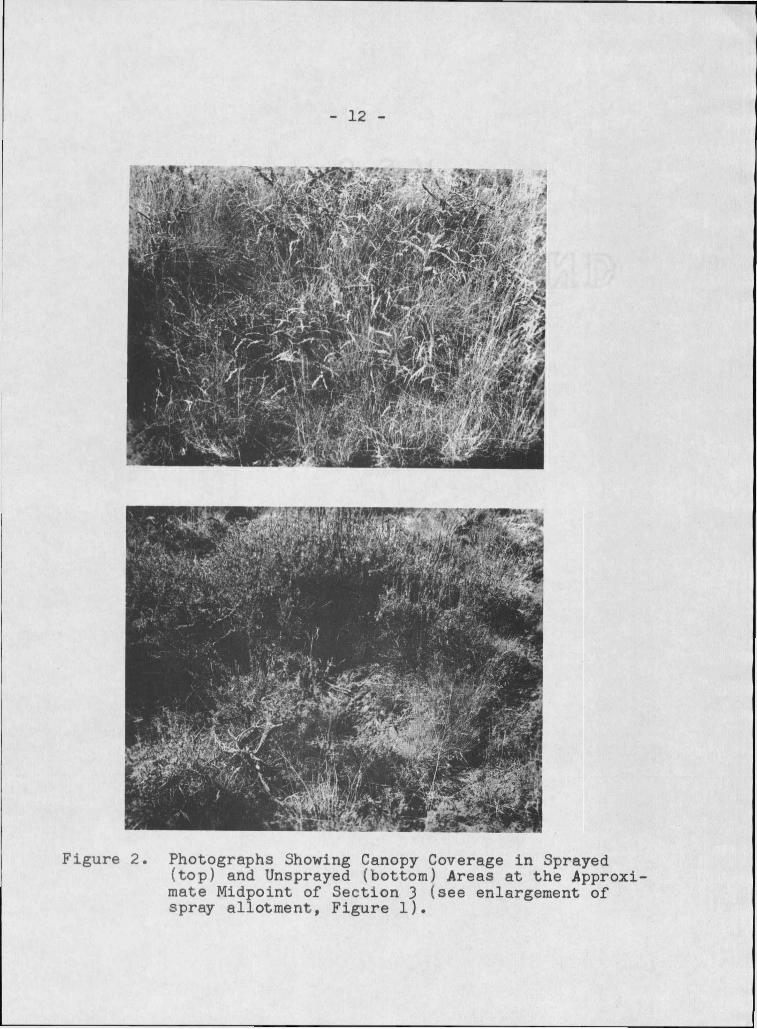
2. Photographs Showing Canopy Coverage in Sprayed (top) and Unsprayed (bottom) Areas atthe Approximate Midpoint of Section 3 ........... 12
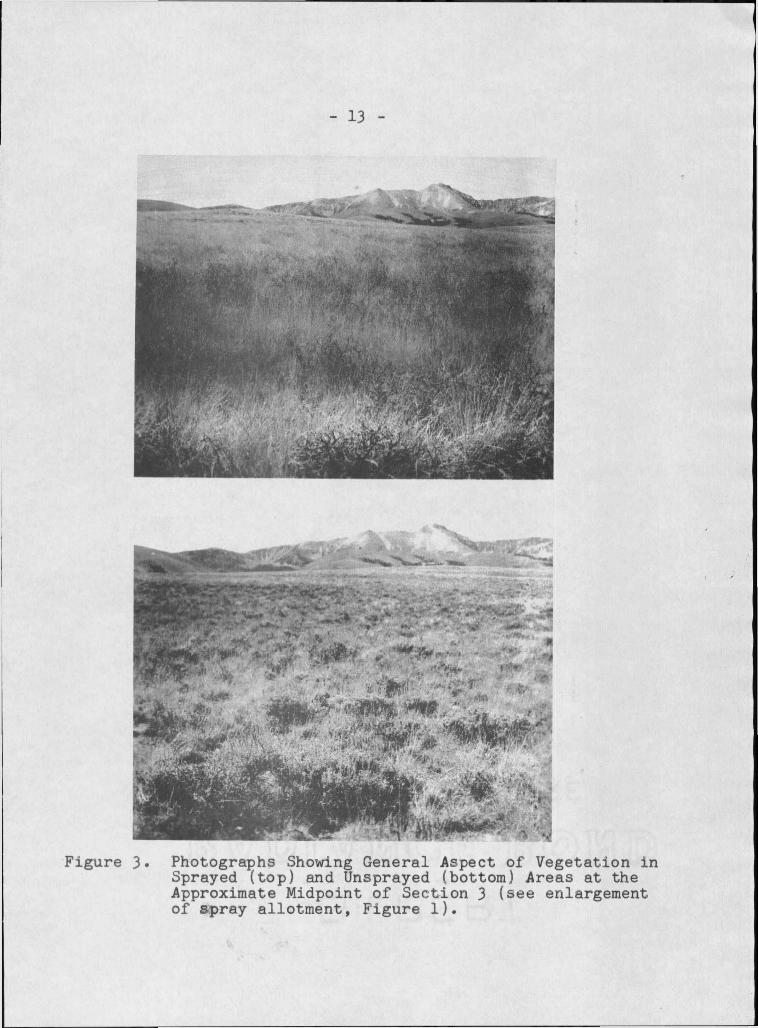
. 3« Photographs Showing General Aspect ofVegetation in Sprayed (top) and Unsprayed(bottom) Areas at the Approximate Midpoint ofSection 3 ............... 13
4° Locations of Observations of a Banded Hen inRelation to Sprayed and Unsprayed Strips During1962 and 1963 . . . . . . . . . . . . . . . . . . 16
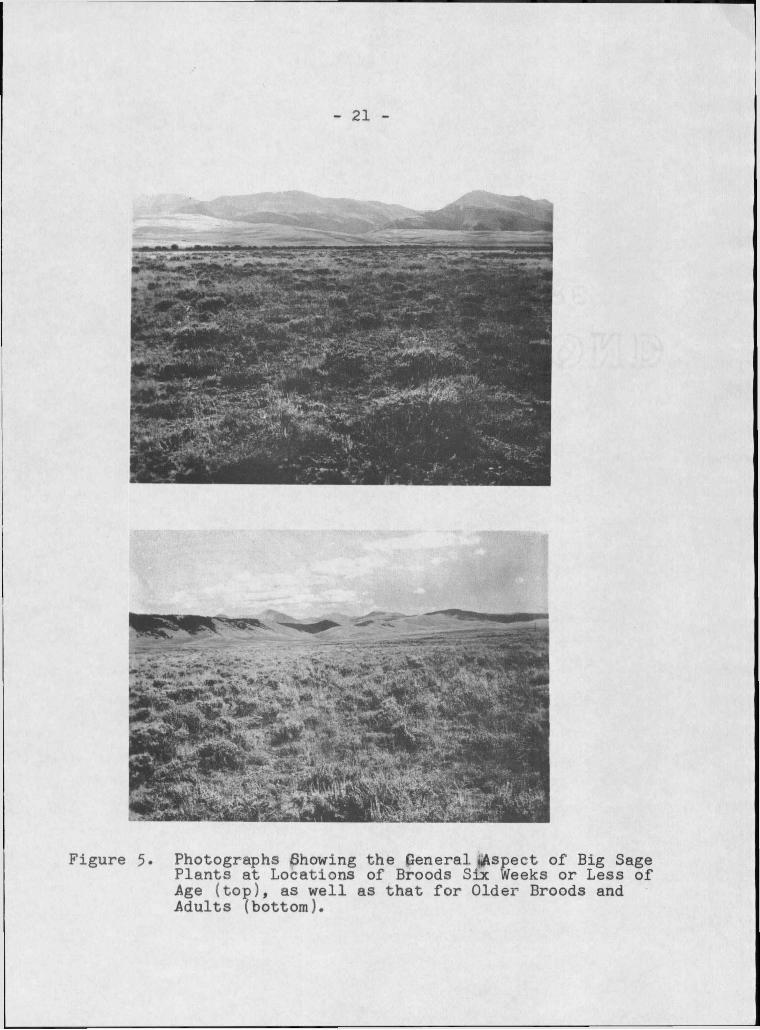
5. Photographs Showing the General Aspect of Big Sage Plants at Locations of Broods Six Weeks or Less of Age (top), as well as that for Older . .Broods and Adults (bottom). .............. 2.1
Figure Page
viiiABSTRACT
A study was conducted during the summers of 1962» 1963» and" 1964 on a i»90Q acre allotment in Southwestern Montana® A total of 1»710-,acres of the allotment had been sprayed in 1961 with 2,4-D to control sagebrush® A total of 190 acres of the allotment, consisting of three strips approximately one and one-quarter miles in length and five chains in width, as well as areas along streams, were left unsprayed® Objectives of my‘ study were to obtain quantitative data on effects of chemical control of sagebrush on a sage grouse population® Canopy coverage measurements of vegetation in the 1,900 acre allotment revealed about #0 percent grasses and 20 percent forbs in sprayed strips and 60 percent grasses and 40 percent forbs in unsprayed strips® 1 low shrub canopy coverage in sprayed strips was reduced as compared with unsprayed strips, and 97 percent of the Big Sage plants evaluated were recorded as dead® Only eight1 percent were recorded as dead in unsprayed strips®Sprayed strips provided only four percent of the 415 sage grouse observations made" on the 1 ,900 acre allotment® 'Ninty- one percent of the 15 sage grouse observed in sprayed strips were within 95 feet of an'unsprayed strip® Canopycoverage measurements of herbaceous vegetation at 137 sage grouse locations, most of which were outside the 1,900 acre'allotment» consisted of approximately 60 percent grasses and 40 percent forbs, .Low shrub canopy coverage was similar from year to year, and 92 percent of the Big Sage plants evaluated were recorded as living. The similarity of the vegetation composition at sage grouse locations and in the unsprayed strips led to the conclusion that the differences in numbers of sage grouse observed in sprayed and pnsprayed strips were related to vegetation composition. Density, percent crown coverage, and maximum height of Big Sage plants ^ere determined at each of 159 sage grouse locations® Broods, six weeks or less of age, were found on areas paving a lesser density and lower percent crown coverage of Big Sage than were older broods and adults® Food habits were determined by analysis of the contents of 35 sage grouse crops® Sagebrush and three genera of forbs together constituted 94*6 percent of the total volume® Dandelion and sagebrush had the greatest total percent frequency of occurrence of all food items® These high frequency food plants were more abundant in unsprayed than in sprayed strips, which strengthened- the conclusion that differences in numbers of sage grouse observed in unsprayed and sprayed strips were related to vegetation composition®
INTRODUCTION
An increasing trend toward sagebrush (Artemisia sppe )■
eradication and/or control on private and public rangelands in Montana and other parts of the western United States has be
come apparent in recent years. The principal objective is to
release the growth of grasses and other herbaceous plants to
improve grazing for domestic livestock. The dependence of
sage grouse (Centrocercus urophaslanus) on sagebrush is well
known (Girard, 1937? Griner, 1939? Patterson, 1952; and
othdrs). In Montana, as elsewhere, many of these sagebrush
ranges provide excellent habitat for this bird. Although
various aspects of the effects of sagebrush control on wild
life populations have been studied, few references relating to
sage grouse are available. Trueblood (1954) and Enyeart ' 1
(1956) evaluated use of reseeded sagebrush - ranges by sage
grouse. Rogers (1964) determined the use of areas by sage,
grouse on which sagebrush had been removed by burning. Some
adverse effects of chemical sagebrush removal on this species
were noted by Rogers (op cit.).
The objective of the present study, conducted during
three concurrent summers (1962 - 1964) in Southwestern
Montana, was to determine effects of chemical manipulation
(control) of sagebrush on a sage grouse population. Data on
life history and ecology of the sage grouse were collected to
aid in interpretation of the results.
DESCRIPTION OF THE ,AREAThe study area (Figure I) encompassed approximately 90
square miles of an extensive mountain valley in southwestern
Beaverhead County, Montana, locally known as Big Sheep Creek
Basin. The area, bordered by the Continental Divide on the
west and the Tendoy Mountains on the east, has numerous rolling
benches rariging in elevation from 6,700 to 8,000 feet above sea
level. It is drained dendritically by tributaries of Big Sheep
Greek. The annual precipitation averages about 14 inches, most
of which falls in winter and spring (Forest Service Report,
1961).The vegetation was characterized by a sagebrush grassland
type which occupied the major portion of the study area.» Pre
dominant shrubs included: Rubber Rabbitbrush (Chrvsothamnusnauseosus.), Green Rabbitbrush (C . viscidiflorus), Low Sage
(Artemisia arbuscu.ia), and Big Sage (A. tridehtata), with the
latter having the greater dehsity in most silWhSlhhs. The
principal grasses were Idaho Fescue (Festuca idahoenis). Blue-
bunch Wheatgrass (Agropyron spicatum). and various species of
Bluegrass (Poa spp.) Pussytoes (Antennaria spp.) Pblox
(Phlox spp.), Western Yarrow (Achillea millefolium), Fringed
Sagbwort (A. frigidia), and Shndwort (Arenaria sppi.) were the
dominant forbs. Various degrees of dominance and association
between grass and forb species existed, particularly on areas
with varying livestock grazing intensity. Stream bpttoms and
moist areas were .characterized by a number of"-grasses, rushes.
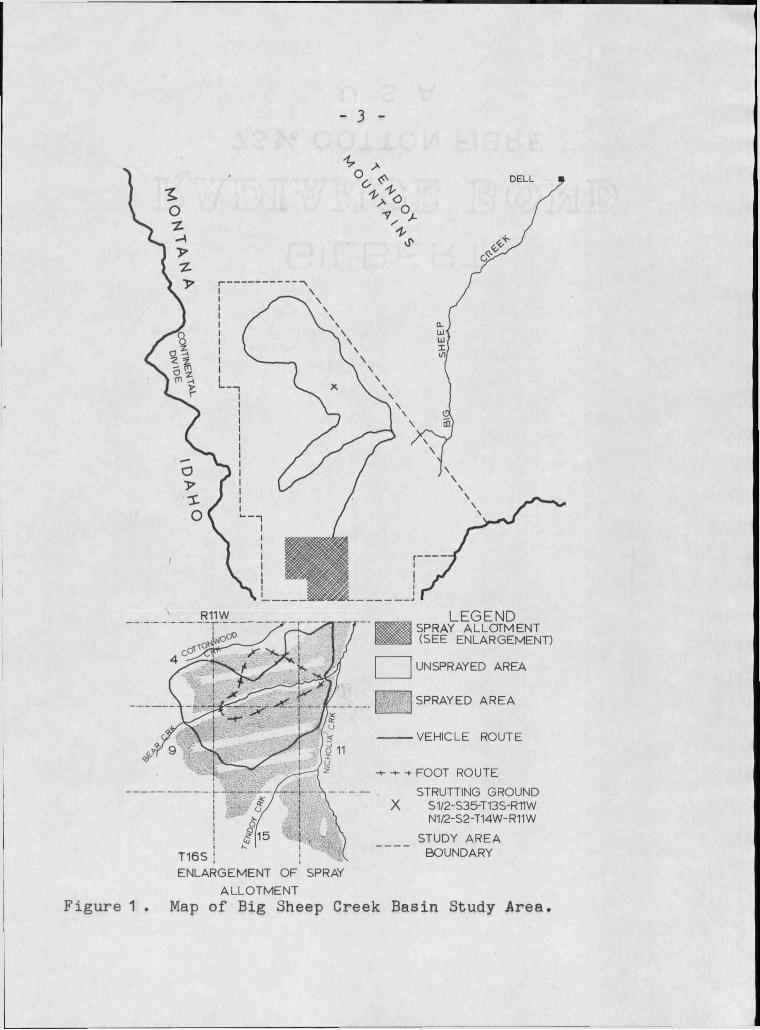
DELL
- 3 -
LEGENDP I P I SPRAY ALLOTMENT E m M (SEE ENLARGEMENT)
UNSPRAYED AREA
. V SPRAYED AREA
■ VEHICLE ROUTE
Figure 1
+ FOOT ROUTE
STRUTTING GROUND S1/2-S35-T13S-RTIW N1/2-S2-T14W-R11W
STUDY AREAT16s i i BOUNDARY
ENLARGEMENT OF SPRAY ALLOTMENT
Map of Big Sheep Creek Basin Study Area.
willows, and succulent forbs. A more quantitative treatment lv
of the vegetation is presented in a later section. The"main - economy of the area was grazing by livestock. Approximately"- I»594 cattle and 3,500 sheep graze on National Forest lands in Big Sheep Greek Basin between July I and November 10, under a pertiiit system.
Principal study was conducted on 1,900 acres of the
area’s southwestern corner, of which 1,710 acres had been
sprayed in 1961 with 2,4-D at the rate of one and three-
fourths pounds, acid equivalent, per acre to control sage
brush (Figure I). Three east-west strips, approximately one
and one-quarter miles in length and five chains in width as
well as strips of 300 feet on each side of streams, were left
unsprayed. Grazing by livestock was deferred on the 1,900
acre spray allotment for two years after spraying.
- 4 -
METHODS
Gannon nets, similar to those described by Dill and
Thornsberry (1950)$ were used to trap mating birds on strut
ting grounds in late April and early May. After hatching, broods were readily captured using hand hoop nets of a type
used by Mussehl (I960). Rectangular metal-supported cotton
mesh nets utilized successfully by Patterson (1952 ) were rela- ,
tively ineffective in this afea. In 1962 and 1963, captured
grouse, 11 weeks and older,, were marked with aniline dyes in
combination with four numbered leg bands of various colors to
permit individual recognition in the fi§l$« 1964, colored
naugahyde neckbands, each with a number, supplemented the anij*
line dyes. Numbered aluminum bands attached to the patagium
of each wing of chicks less than 11 weeks old permitted later
identification in the hand.
Two observation routes, one vehicle and one foot, 7.4 and
4•5 miles long, respectively, were established in the 1,900
acre spray allotment. One vehicle rout£, '37.5 miles long,
traversed most of the basin. Vehicle routes were driven
weekly at 15 mph beginning at sunrise or in the evening start
ing at a time necessary to complete the route just prior to
darkness. Direction and time (morning or evening) of travel
for each route were reversed weekly. The foot route was
traveled once each week beginning at sunrise. A German Short
Hair Pointer accompanied the observer. In addition to the
above routes, all roads and areas passable to vehicle travel
I- 6
wep'p covered, once or more a Week depending upon bird concen
trations® All sage grouse observations were recorded and each
location marked .with a numbered red plastic flag for subse-I "quent vegetation analyses. Observations were made with thb ■"
aid of a 7 x 35 binocular or 2OX spotting scope„ Many sightings , including most broods. -■ and • all nesting hens ,v, were Vlhi--
tially made by the dog.
A measure of vegetation cover at sage grouse locations
was obtained on the same or following day of sightingby'h ■■
modification of DaubenmirefS (1959) canopy coverage method®
Frequency of occurrence and canopy coverage for grasses,
forbs, and low shrubs in twenty 2 x 5 dm plot's, five each,
along 30 foot radial lines of a circlefs cardinal points were
evaluated at each site® Density and average height of sage
brush at bird locations were determined by counting and meas
uring plants in the four quadrants of a l/lOO acre circle
(radius 11®7 feet)® Sagebrush canopy coverage at these same
locations was obtained by the line intercept method, Canfield
(1941)® Canopy of plants was recorded in tenths of a foot
along radial lines of the circlefs cardinal points® A tran
sect, with forty 2 x 5 dm Daubenmire plots, was established
in the sprayed sagebrush strips to measure plant production
changes® A like transect with an equal number of plots was
established in the unsprayed strips® The vegetation in the
plots, located at approximately one chain intervals along the
- I -
transects, was evaluated every two weeks®
During July, August, and September of 1963 and 1964$ a
total of 39 sage grouse were collected to determine food'"'habit preferences® Collections were made in late evening" -...
prior to darkness to obtain birds with full crops. Crops
were examined individually and the percent by volume of iden
tifiable material recorded. The percentage of crop contents
for each month was computed by the aggregate percentage me
thod (Martin, et_ al0, 1946). Four crops, each of which con-.
tained less than 3 cc of material, were not considered in the
evaluation.
Hunter success information and wings from hunter killed •
birds for determining age were collected at a checking sta
tion operated on weekends during September and October.
RESULTS
'H
Vegetation of Sprayed and Unsprayed Areas
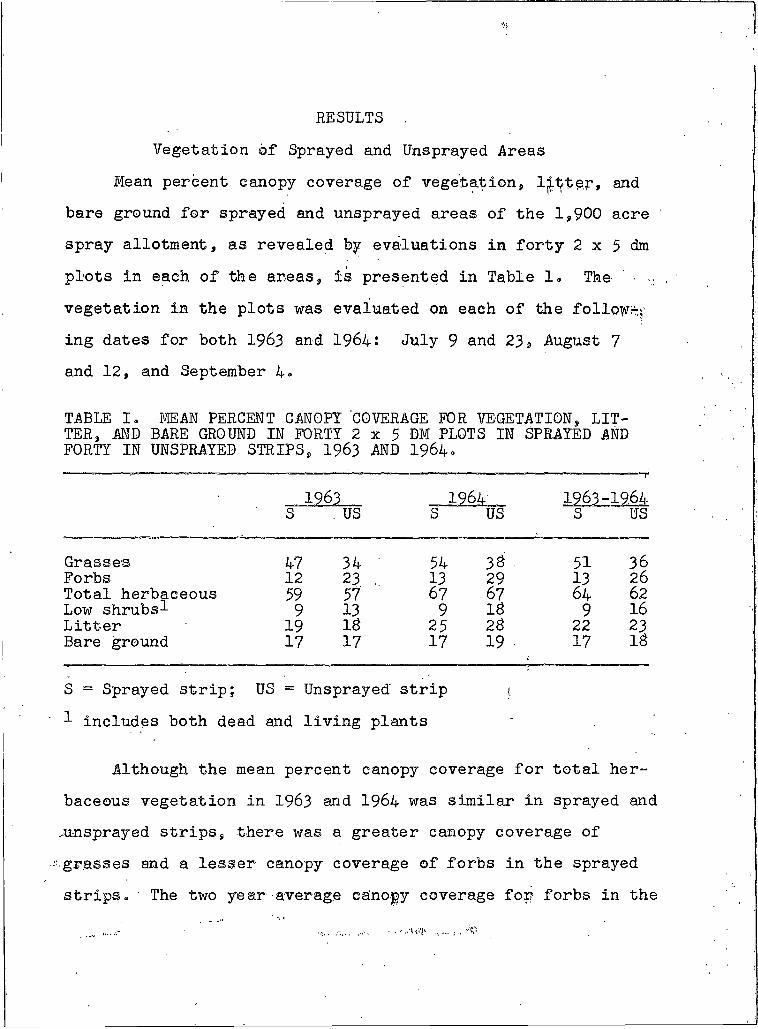
Mean percent canopy coverage of vegetation, IjjL̂ te.r, and
bare ground for sprayed and unsprayed areas of the 1,900 acre
spray allotment, as revealed by evaluations in forty 2 x 5 dm
plots in each of the areas, is presented in Table I. The
vegetation in the plots was evaluated on each of the follow^;
ing dates for both 1963 and 1964: July 9 and 23$ August 7and 12, and September 4»
TABLE I. MEAN PERCENT CANOPY COVERAGE FOR VEGETATION, LITTER, AND BARE GROUND IN FORTY 2 x 5 DM PLOTS IN SPRAYED AND FORTY IN UNSPRAYED STRIPS, 1963 AND 1964.
1963 1964 1963-1964S . US S US S US
Grasses 47 34 54 38 51 36Forbs 12 23 . 13 29 13 26Total herbaceous 59 57 67 67 64 62Low shrubsI 9 13 9 IS 9 16Litter 19 IS 25 28 22 23Bare ground 17 17 17 19 17 18
S = Sprayed strip; US = Unsprayed strip
-L includes both dead and living plants
Although the mean percent canopy coverage for total her
baceous vegetation in 1963 and 1964 was similar in sprayed and ,unsprayed strips, there was a greater canopy coverage of
-'■grasses and a lesser canopy coverage of forbs in the sprayed
strips. ' The two year average canopy coverage for forbs in the
• ■ ' . . ' W J ' . . . . . . ; .
sprayed plots was only about one half that of the unsprayed
plots. Forb reduction or destruction following application of
the chemical 2,4-D to control sagebrush has been reported by
Blaisdellp 1956; Hyder, 1954; and others. The average percent canopy coverage for total herbaceous vegetation increased from
1963 to 1964 in both sprayed and unsprayed plots. The in
crease in unsprayed plots resulted mostly from forbs, while
the increase in sprayed plots was due mainly to grasses.
The somewhat constant percent of shrub canopy coverage in
sprayed strips, as compared with the increase in unsprayed strips for the two year period, was possibly due to impBireld
growth and/or dead sagebrush plants. The latter is suggested
by the percent frequency of Big Sage (Artemisia tridentata)
in sprayed strips (Table II).
Relatively small difference in the average percent can
opy coverage of litter was noted for sprayed and unsprayed
strips. Litter increased from.1963 to 1964 for both the
sprayed and unsprayed strips.
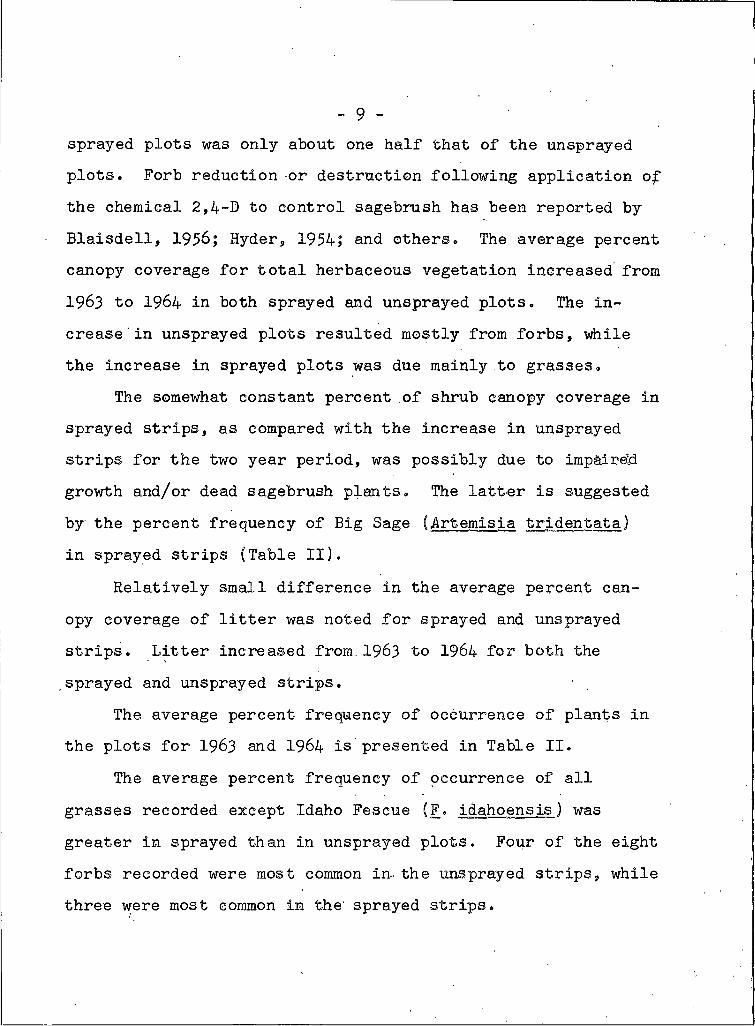
The average percent frequency of occurrence of plants in
the plots for 1963 and 1964 is presented in Table II.
The average percent frequency of occurrence of all
grasses recorded except Idaho Fescue (F. idahoensis) was
greater in sprayed than in unsprayed plots. Four of the eight
forbs recorded were most common in- the unsprayed strips, while
three were most common in the' sprayed strips.
- 9 -
10-TABLE II. AVERAGE PERCENT FREQUENCY OF OCCURRENCE OF "PLANTS IN FORTY 2 x 5 DM PLOTS IN SPRAYED AND FORTY IN UNSPRAYEB SAGEBRUSH STRIPS, 1963 AND 1964»
» 1.963 1964 1963-1964Plant taxa-*- S US S US S US
GRASSESAgropyron spicatum 65 42 68 56 66 51Festuca idahoensis 93 100 93 100 93 100Koelsria- cristata 32 29 33 15 32 23Poa spp. 45 29 50 49 49 39
FORBSAchillea millefolium 17 12 18 10 17 11Antennaria spp.^ . 41 59 41 60 41 59Arenaria congesta Astragalus miser
29 29 24 18 26 .2526 32 28 . 35 27 34
Lupinus sericeus 7 23 9 25 8 24Phlox caespitosa 26 21 22 . 19 24 21Phlox longifolia id 14 11 10 13 13Sedum stenopetalum—" 3 16 4 16 3 . 16\ LOW SHRUBS
Artemisia tridentata^ 4 45 -■4. 56 4 50
1 \x All taxa in both sprayed and unsprayed strips with less than
ten percent frequency of occurrence were excluded (See Table IX, Appendix)„
2 Dead plants were not included
Frequency of occurrence of grasses, except June Grass!(Koele-ria, cristate), increased or remained about constant in
both sprayed an$ unsprayed areas from. 1963 to 1964» June
Grass decreased substantially In--Vunsprayed plots, d&o general pattern was indicated for increase or decrease of the forbs from 1963 to 1964 in either the sprayed or unsprayed plots.
Some increased others decreased«
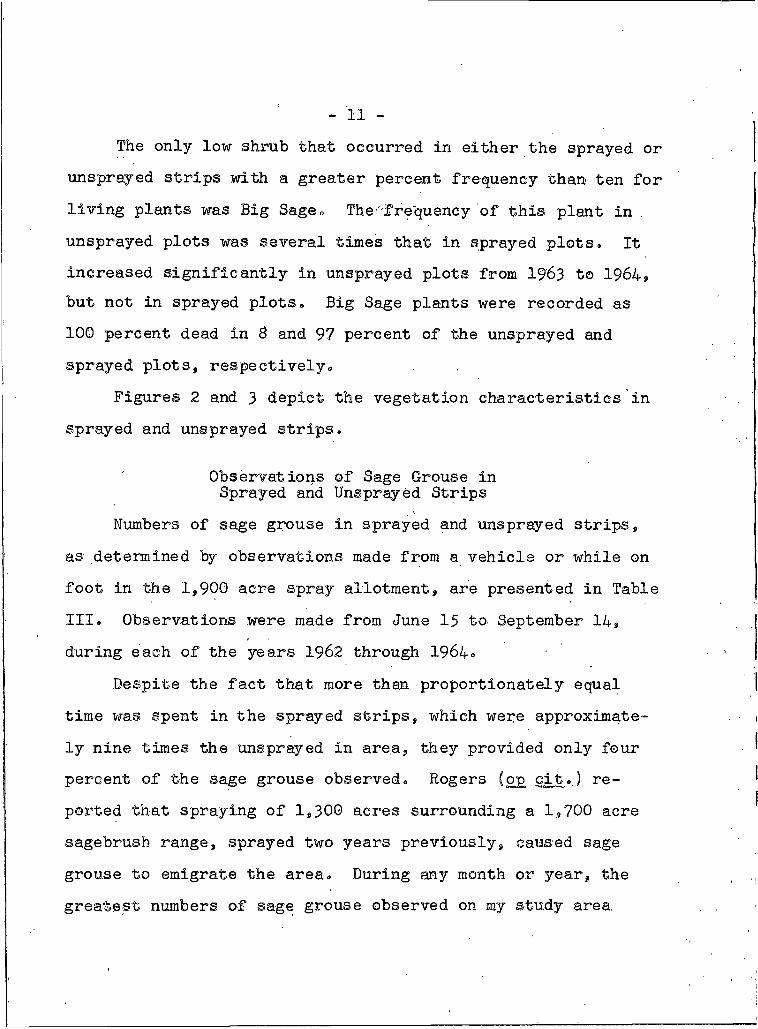
11The only low shrub that occurred in either the sprayed or
unsprayed strips with a greater percent frequency than ten for
living plants was Big Sage= The'-frequency of this plant in .
unsprayed plots was several times that in sprayed plots. It
increased significantly in unsprayed plots from 1963 to 1964, but not in sprayed plots. Big Sage plants were recorded as
100 percent dead in 8 and 97 percent of the unsprayed and
sprayed plots, respectively.
Figures 2 and 3 depict the vegetation characteristics in sprayed and unsprayed strips.
Observations of Sage Grouse in Sprayed and Unsprayed Strips
Numbers of sage grouse in sprayed and unsprayed strips,
as determined by observations made from a vehicle or while on foot in the 1,900 acre spray allotment, are presented in Table
III. Observations were made from June 15 to September 14,
during each of the years 1962 through 1964°
Despite the fact that more than proportionately equal
time was spent in the sprayed strips, which were approximate
ly nine times the unsprayed in area, they provided only four percent of the sage grouse observed. Rogers (op_ cit.) re
ported that spraying of 1,300 acres surrounding a 1,700 acre
sagebrush range, sprayed two years previously, caused sage
grouse to emigrate the area. During any month or year, the
greatest numbers of sage grouse observed on my study area
12
Figure 2. Photographs Showing Canopy Coverage in Sprayed(top) and Unsprayed (bottom) Areas at the Approximate Midpoint of Section 3 (see enlargement of spray allotment. Figure I).
- 13
Figure 3• Photographs Showing General Aspect of Vegetation in Sprayed (top) and Unsprayed (bottom) Areas at the Approximate Midpoint of Section 3 (see enlargement of spray allotment. Figure I).
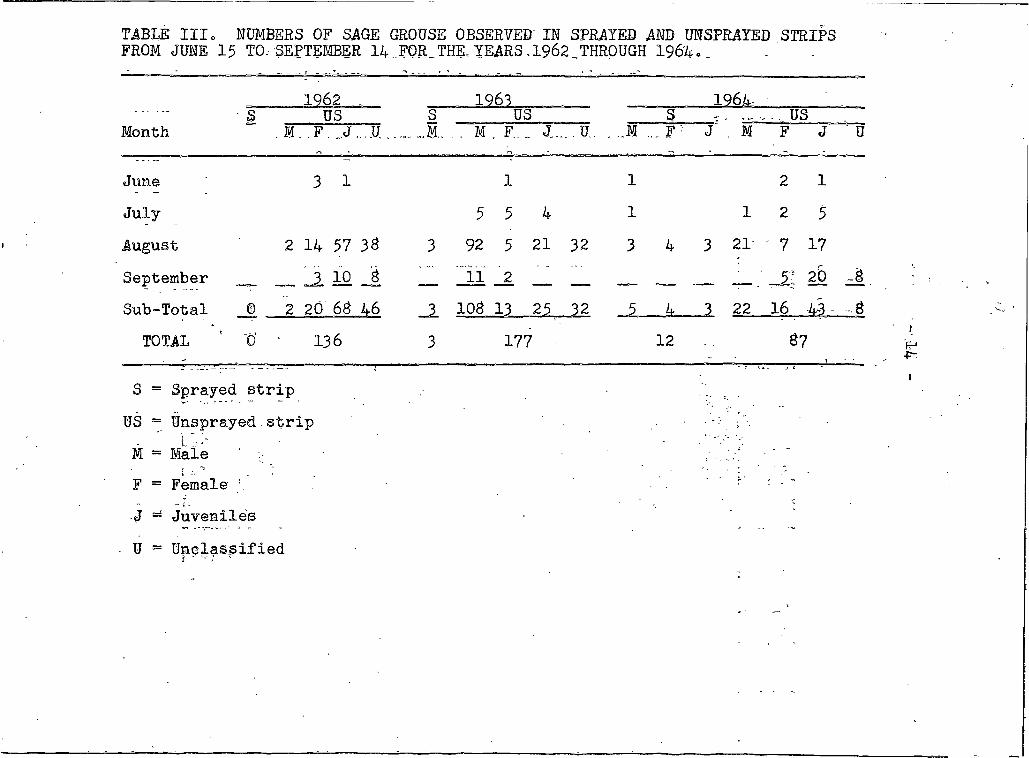
TABLE IIIe NUMBERS OF SAGE GROUSE OBSERVED IN SPRAYED AND UNSPRAYED STRIPS FROM JUNE 15 TO.-SEPTEMBER 14..FOR,THE- YEARS, 1962_THROUGH 196'4._
1962 ic>63 1964-• S US S US S T - T - - U S
Month . M. >. ...J....U... M< H .. V=M > . . M , F. _ J..... .U. . ..M ..,F' J . M F J U
June 3 I I I 2 I
July 5 5 4 I I 2 5
August 2 14 57 33 3 92 5 21 32 3 4 3 21 7 17
September _ J . 1 0 -I 11 III IMll ■ hit ■ i-t t i -i 20 aSub-Total _© 2 20 63 46 103 13 25 32 3 22 16 43 - -.3
TOTAL o' 136 3 177 12 37
S = Sprayed strip
US = Unsprayed.strip. ' I'-;-M = MaleF = Female- — i .
J - Juvenile's
U = Unclassified
i
were in unsprayed strips. The increases in numbers of birds
recorded during August for each year were thought to have rer- flected migrations through the area. Maless females, and
juveniles were included.
During 1963 and 1964» the site of each of the 15 sage
grouse observed in sprayed strips was marked and distance to the nearest unsprayed strip was measured. Distances
ranged from 21 to 210 feet with 91 percent falling between
75 and 95 feet. The type of strip, sprayed or unsprayed, in
which 1$4 sage grouse were seen alighting after flushing was
also recorded. Ninty-four percent of the birds flushed were
observed resettling in unsprayed strips.
Locations of a banded brood-hen in relation to sprayed
and unsprayed strips are shown in Figure 4» The hen captured
in June, 1962, was reobserved twice the same year and three
times during 1963 *
In 1962, the hen was observed with one chick and in 1963
witfy five, four of which were caught and banded. The brood}.■
remained intact during subsequent sightings. Two of the
bandqd chicks were recaptured at 1963 relocations B2 and B3.
Patterson (op cit.) stated that the close relationship between sagebrush distribution and sage grouse abundance is more
than just a casual occurrence.
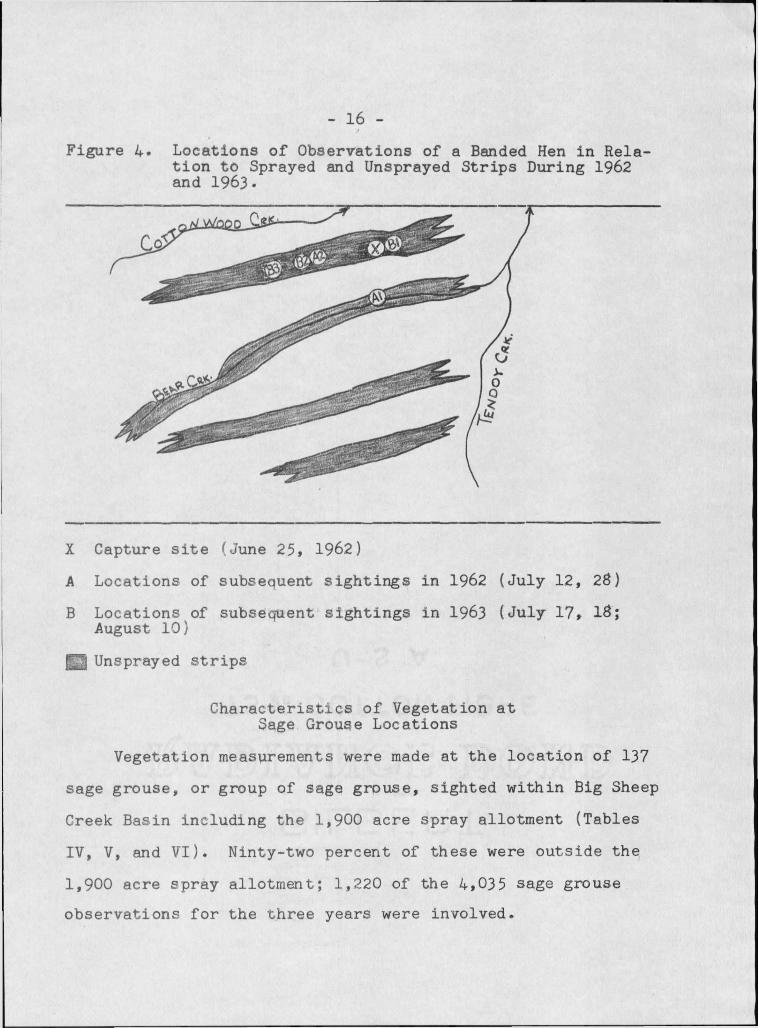
— 16 —Figure 4« Locations of Observations of a Banded Hen in Rela
tion to Sprayed and Unsprayed Strips During 1962 and 1963.
X Capture site (June 25, 1962)
A Locations of subsequent sightings in 1962 (July 12, 28)
B Locations of subsequent sightings in 1963 (July 17, 18; August 10)
O Unsprayed strips
Characteristics of Vegetation at Sage Grouse Locations
Vegetation measurements were made at the location of 137
sage grouse, or group of sage grouse, sighted within Big Sheep
Creek Basin including the 1,900 acre spray allotment (Tables
IV, V, and VI). Ninty-two percent of these were outside the
1,900 acre spray allotment; 1,220 of the 4,035 sage grouse observations for the three years were involved.
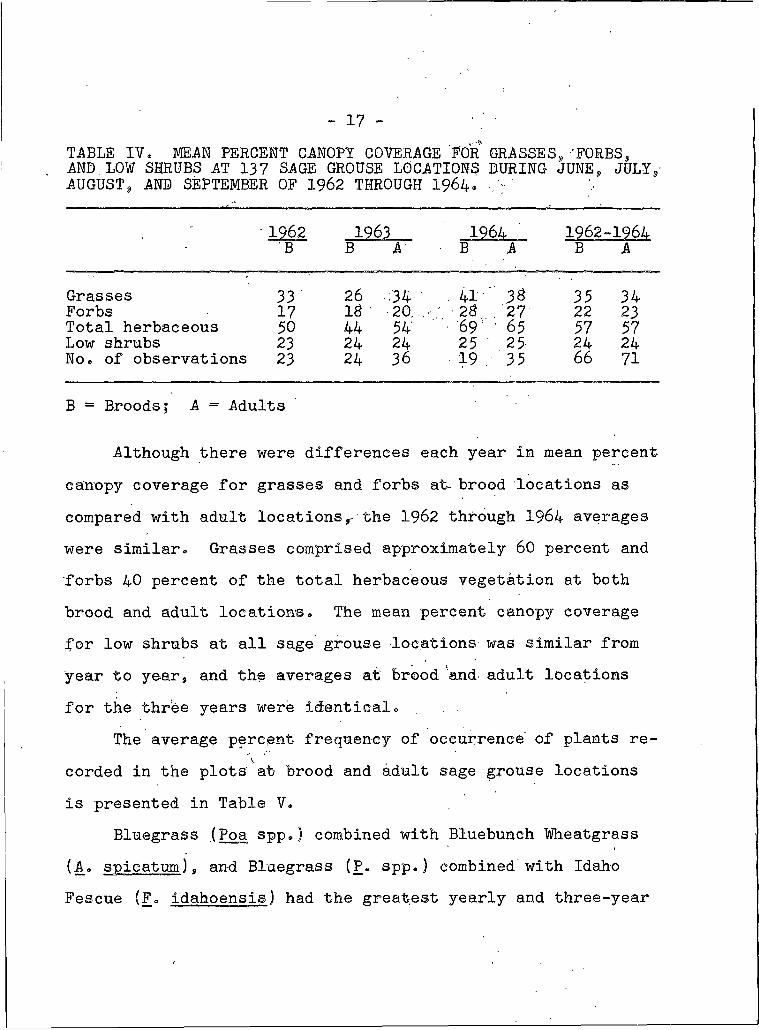
- 17 -TABLE IV, MEAN PERCENT CANOPY COVERAGE EOR GRASSES, 'FORES,AND LOW SHRUBS AT 137 SAGE GROUSE LOCATIONS DURING JUNE, JULY, AUGUST, AND SEPTEMBER OF 1962 THROUGH 1964«
• 1262 1963 1964 1962-1964B B A • B A B A
Grasses 33 26 34 . 41 3# 35 34Forbs 17 18 20. 23,. , 27 22 23Total herbaceous 50 44 54 69' ■ 65 57 57Low shrubs 23 24 24 25 2 5 24 24No. of observations 23 24 36 . 19 . 35 66 71
B = Broods; A = Adults
Although there were differences each year in mean percent
canopy coverage for grasses and forbs at- brood locations as
compared with adult locations the 1962 through 1964 averages
were similar. Grasses comprised approximately 60 percent and
forbs 40 percent of the total herbaceous vegetation at both
brood and adult locations. The mean percent canopy coverage
for low shrubs at all sage grouse locations was similar from
year to year, and the averages at brood and adult locations
for the three years were identical.
The average percent frequency of occurrence of plants re
corded in the plots' at- brood and adult sage grouse locations
is presented in Table V.
Bluegrass (Poa spp.) combined with Bluebunch Wheatgrass
(A. sjoicatum), and Bluegrass (P. spp.) combined with Idaho
Fescue (F. idahoensis) had the greatest yearly and three-year
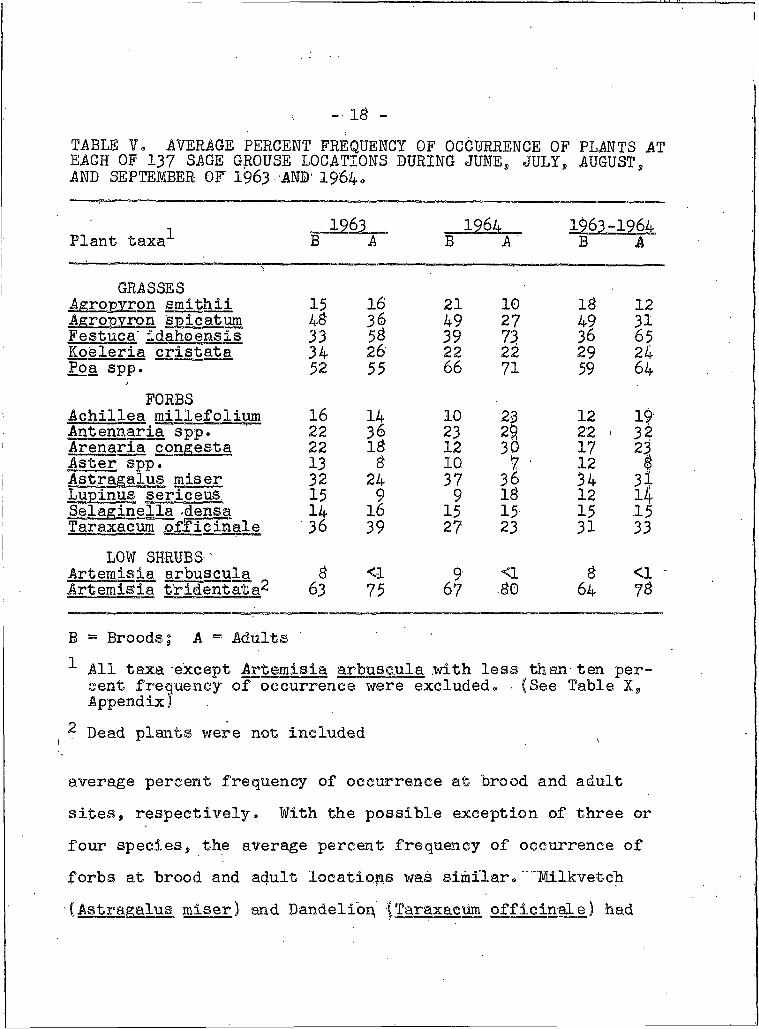
-■ id -TABLE V= AVERAGE PERCENT FREQUENCY OF OCCURRENCE OF PLANTS AT EACH OF 137 SAGE GROUSE LOCATIONS DURING JUNE, JULY, AUGUST, AND SEPTEMBER OF 1963 AND' 1964.
Plant taxaI
GRASSESAgropyron smithii Agroovron soicatum Festuca' Idahoensis Koeleria eristata Poa spp.
FORBSAchillea millefolium Antennaria spp. Arenaria congests Aster spp.Astragalus miser Lupinus sericeus. Selaginella -densa Taraxacum .officinale
LOW SHRUBS-' Artemisia arbuscula Artemisia tridentata^
1963B A
1963-1964B A B A
15 16 21 10 18 1248 49 27 49 3133 58 39 73 36 6534 26 22 22 29 2432 55 66 71 59 64
16 14 10 23 12 1922 23 2^ 22 1 3222 18 12 30 17 2313 8 10 7 ’ 12 832 24 37 34 3115 9 9 18 12 i414 16 15 15 15 1536 39 27 23 31 33
8 <1 9 <1 8 <163 75 67 ,80 64 78
B = Broods; A = Adults
All taxa -except Artemisia arbuscula ,with less than- ten percent frequency of occurrence were excluded® ■ {See Table X, Appendix)
2 Dead plants were not included
average percent frequency of occurrence at brood and adult sites, respectively. With the-possible exception of three or
four species, the average percent frequency of occurrence of
forbs at brood and adult locations was similar..Milkvetch
and Dandelion, -ITaraxacum officinale) had
- 19 —the highest combined frequency of occurrence for the three-
year period at both brood and adult locations.
The single low shrub-that occurred at both brood and adult sage grouse sites with a greater percent frequency than
ten was Big Sage, The average percent frequency of occurrence
was greater in 1964 than in 1963 at both brood and adult Sites9
but was greater at the latter each year. Of the Big Sage
plants evaluated for all years and locations, 92 percent were
recorded as living. Low Sage (A, arbuscula). 90 percent of
which was recorded during June-, and July9 occurred with a
greater average percent frequency at brood locations than at
adult locations each year.
Density9 percent crown coverage, and maximum height of
Big Sage plants at brood and adult locations during 1963 and
brood, adult, and nesting hen locations during 1964 are given in Table 71.
The average number and percent crown coverage of Big Sage
plants during each year was greater at adult locations than at
brood locations. This was -substantiated by the greater aver
age percent frequency of occurrence of Big Sage at adult loca
tions (Table 7). Most of the difference that occurred between
brood and adult locations, each year was attributed to locations
of broods of 6 weeks or less of age. Eighty-eight percent of
these broods, located during June and July of both years, were
found on areas having an average of 36 Big Sage plants per
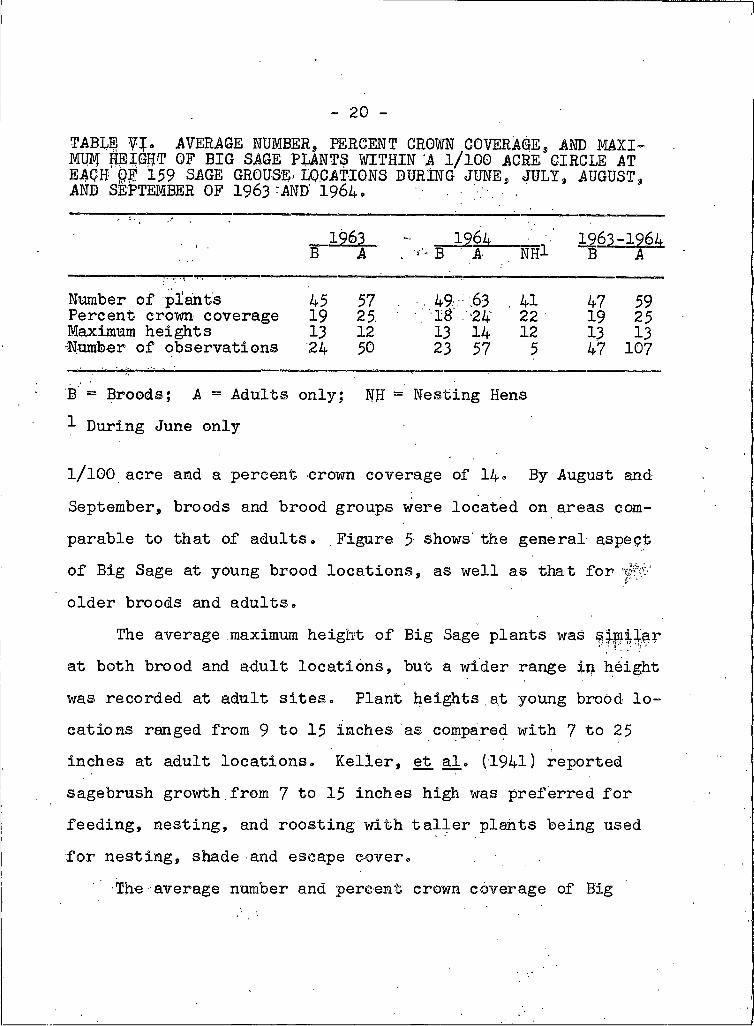
- 20TABI$ VI, AVERAGE NUMBER, PERCENT GROWN COVERAGE, AND MAXI- M # HEP9T OF BIG SAGE PLANTS WITHIN A l/lOO ACRE CIRCLE AT EAGHpP 159 SAGE GROUSE LOCATIONS DURING JUNE, JULY, AUGUST, AND SEPTEMBER OF 196 3rAND 1964.
1963 1964 1963-1964B A „ ,1’“ B A . NHl B A
Number of plants 45 57 , 494 63 . 41 47 59Percent crown coverage 19 25 ■ 18 24 22 19 25Maximum heights 13 12 13 14 12 13 13Number of observations 24 50 23 57 5 47 107
B = Broods; A = Adults only; NH = Nesting Hens
I During June only
l/lOO acre and a percent crown coverage of 14° By August and
September, broods and brood groups were located on areas com
parable to that of adults» Figure 5 shows' the general aspect
of Big Sage at young brood locations, as well as that for V-V'
older broods and adults,
The average maximum height of Big Sage plants was g^il^r
at both brood and adult locations, but a wider range i$ height
was recorded at adult sites. Plant heights,at young brood lo
cations ranged from 9 to 15 inches as compared with 7 to 25
inches at adult locations. Keller, et al. (1941) reported
sagebrush growth,from 7 to 15 inches high was preferred for
feeding, nesting, and roosting with taller plants being used
for nesting, shade and escape cover.
The average number and percent crown coverage of Big
21
Figure 5» Photographs Showing the General ̂ Aspect of Big Sage Plants at Locations of Broods Six Weeks or Less of Age (top), as well as that for Older Broods and Adults (bottom).
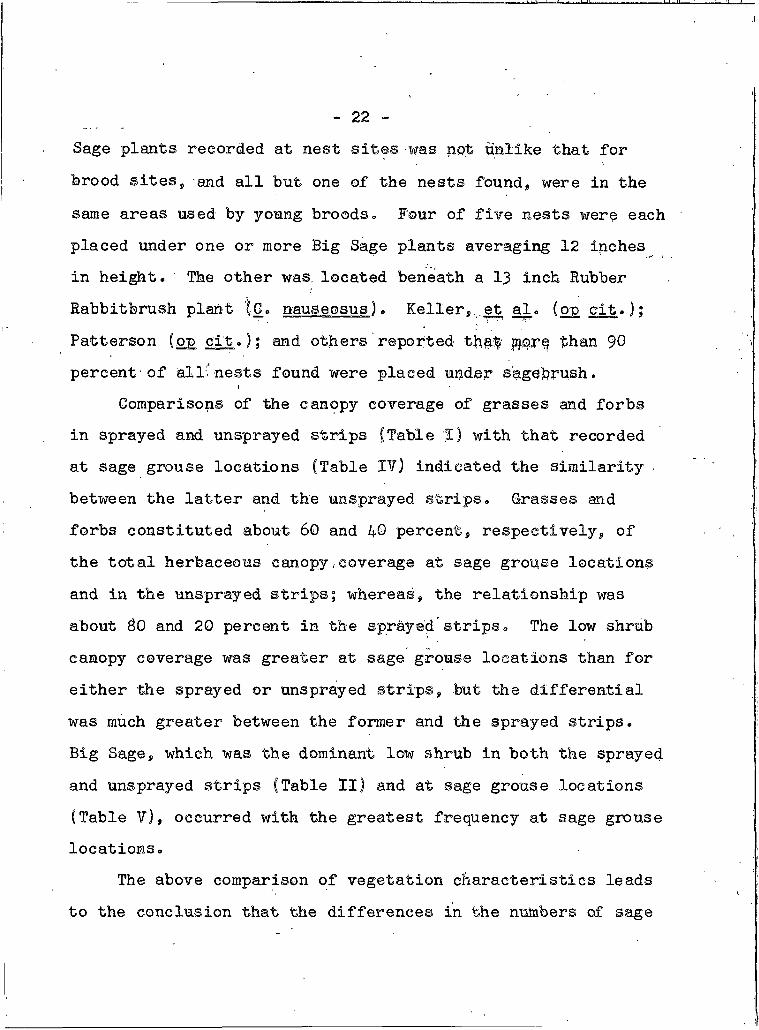
22
Sage plants recorded at nest sites was not unlike that for
brood sites, and all but one of the nests found, were in the
same areas used by young broods» Four of five nests were each
placed under one or more Big Sage plants averaging 12 inches
in height. The other was. located beneath a 13 inch Rubber
Rabbitbrush plant t-G. nauseosus). Keller,, et al. (op cit.):
Patterson (o£ cit.); and others reported t h # jjngre? than 90
percent-of all'nests found were placed under sagebrush.Comparisons of the canopy coverage of grasses and forbs
in sprayed and unsprayed strips (Table I) with that recorded
at sage grouse locations (Table IV) indicated the similarity
between the latter and the unsprayed strips. Grasses and
forbs constituted about 60 and 40 percent, respectively, of
the total herbaceous canopy,coverage at sage grouse locations
and in the unsprayed strips; whereas, the relationship was
about BO and 20 percent in the sprayed strips. The low shrub
canopy coverage was greater at sage grouse locations than for
either the sprayed or unsprayed strips, but the differential
was much greater between the former and the sprayed strips.
Big Sage, which was the dominant low shrub in both the sprayed
and unsprayed strips (Table II) and at sage grouse locations
(Table V), occurred with the greatest frequency at sage grouse locations.
The above comparison of vegetation characteristics leads
to the conclusion that the differences in the numbers of sage
grouse observed in the sprayed strips as compared with un
sprayed strips (Table III) was related to differences in
vegetation composition.
- 23 -
FOOD HABITS
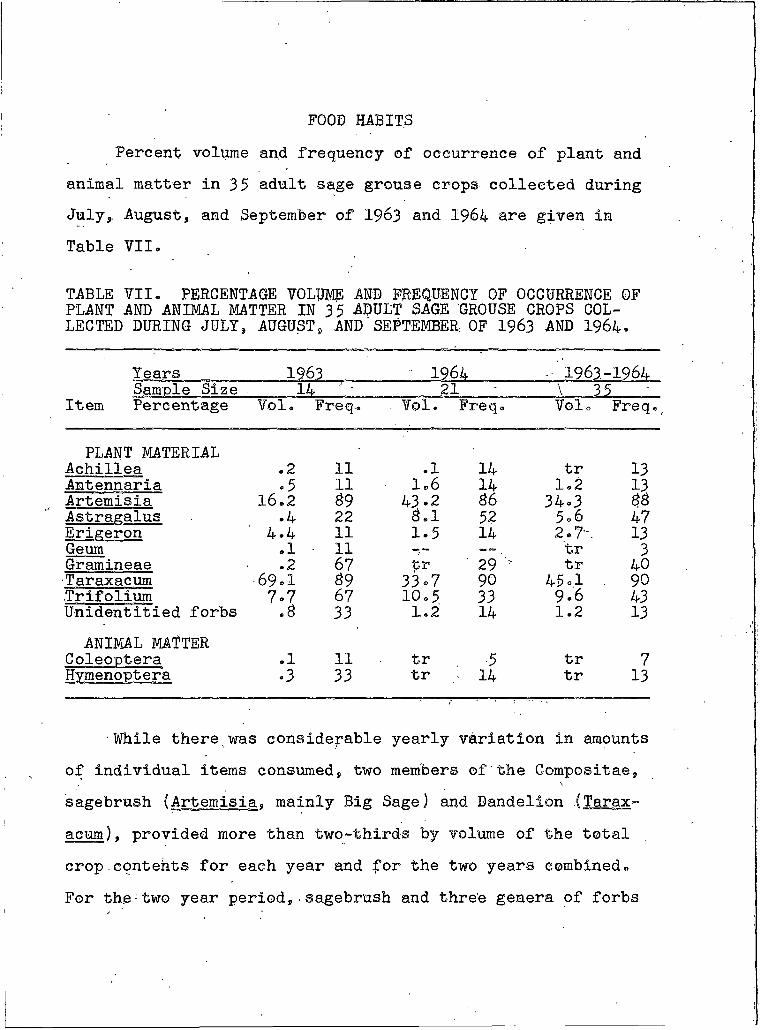
Percent volume and frequency of occurrence of plant and
animal matter in 35 adult sage grouse crops collected during July, August, and September of 1963 and 1964 are given in
Table VII.
TABLE VII. PERCENTAGE VOLUME AND FREQUENCY OF OCCURRENCE OF PLANT AND ANIMAL MATTER IN 35 ADULT SAGE GROUSE CROPS COLLECTED DURING JULY, AUGUST9 AND SEPTEMBER OF 1963 AND 1964.
Item
Years Sample Size 14Percentage Vol
1963-1964
PLANT MATERIALAchillea .2 11 .1 14 tr 13Antennaria .5 11 1.6 14 1.2 13Artemisia 16.2 89 43 .2 86 34.3 $8Astragalus .4 22 8.1 52 5.6 47Erigeron 4 .4 11 1.5 14 2,7~. 13Geum .1 ■ 11 — — tr 3Gramineae .2 67 pr 29 ' tr 40■Taraxacum 69.1 89 33.7 90 45°1 . 90Trifolium 7.7 67 10.5 33 9.6 43Unidentified forbs .B 33 1.2' 14 1.2 13
ANIMAL MATTER Coleoptera .1 11 tr 5 tr 7Hymenoptera • 3 33 tr 14 tr 13
While there was considerable yearly variation in amounts
of individual items consumed, two members of the Compositae,
sagebrush (Artemisia, mainly Big Sage) and Dandelion I Tarax
acum) . provided more than two-thirds by volume of the total
crop.contehts for each year and for the two years combined.
For the two year period,■sagebrush and three genera of forbs
- 25 -together constituted 94«6 percent of the total volpme of identifiable food. Leaves and flower clusters of sagebrush
and dandelion, with the latter having the greater potal per
cent volume", composed 79®4 percent of the crop contents.
Sagebrush and dandelion also had the greatest total percent
frequency of occurrence of all food items. Griner (op eft.)
arid Girard (pp cit.) reported that:plant materials, mainly
dandelion and sagebrush, furnished 95 percent or mpre by
volume of the adult sage grouse summer diet. Patterson (op
cit.) stated that only during the summer months did sagebrush
compose less than SO percent of the total volume of food con
sumed during the year.
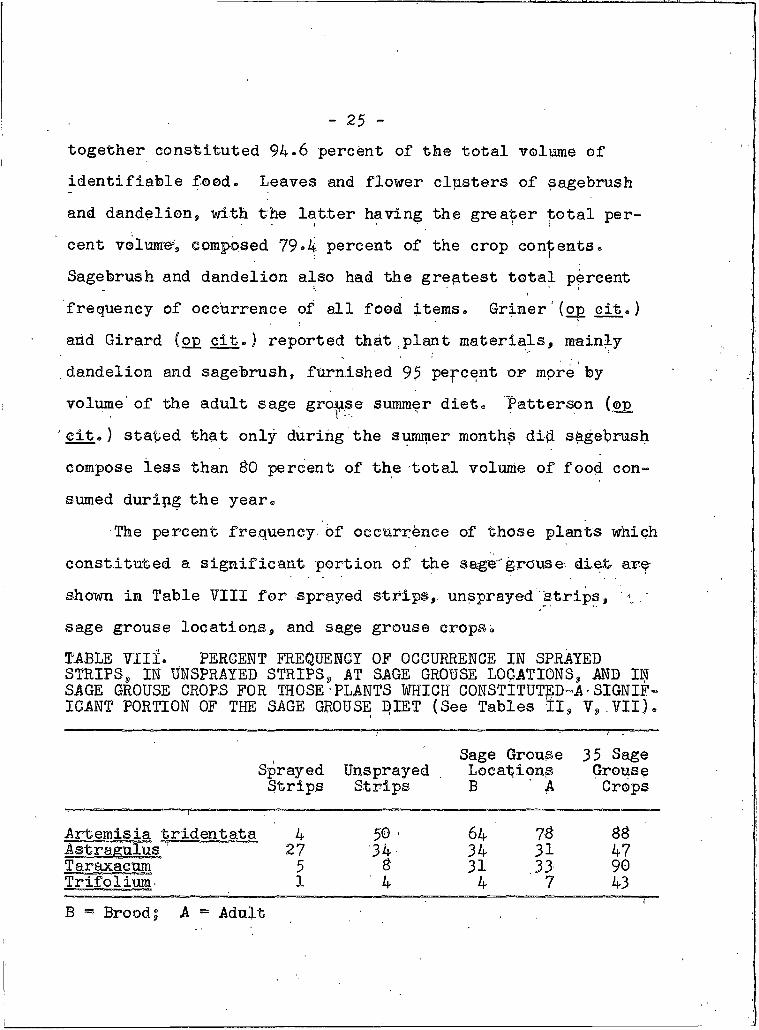
The percent frequency Of occurrence of those plants which
constituted a significant portion of the sage" grouse diet are
shown in Table VIII for sprayed strips,, unsprayed strips,
sage grouse locations, and sage grouse crops.
TABLE VIII. PERCENT FREQUENCY OF OCCURRENCE IN SPRAYED STRIPS, IN UNSPRAYED STRIPS, AT SAGE GROUSE LOCATIONS, AND IN SAGE GROUSE CROPS FOR THOSE PLANTS WHICH CONSTITUTED-A - SIGNIFICANT PORTION OF THE SAGE GROUSE DIET (See Tables IIs V,.VII).
Sage Grouse 35 SageSprayed Unsprayed Locations GrouseStrips Strips B A Crops
IArtemisia tridentata 4 50 ■ 64 78 88Astragulus ' 27 34 34 31 47Taraxacum 5 8 31 .33 90Trifolium- I 4 4 7 43B = Brood; A = Adult
1
r
Considerable differences are apparent* Each bf the
plants listed in Table VIII had a greater percent frequency of occurrence in the sage grouse crops than in any of the
other categories listed® This indicated the selectivity of
sage grouse in feeding® The differential in frequency of
occurrence for Big Sage in the crops as compared with the ■
other categories was less than for the other, plants which in
dicated the importance of this plant® The favored food plants were more abundant in unsprayed than in sprayed Sthips9 sup
porting the conclusion that the greater number of is age grousq
observed in unsprayed strips, as compared with sprayed strips
(Table III), was related to the differences in vegetation
composition®
— 26 "
Miscellaneous Observations
Observations on the life history and ecology bf sage
grouse that were not necessarily pertinent to the main con-̂
s!deration of this study are included in the Appendix®
- 27
APPENDIX
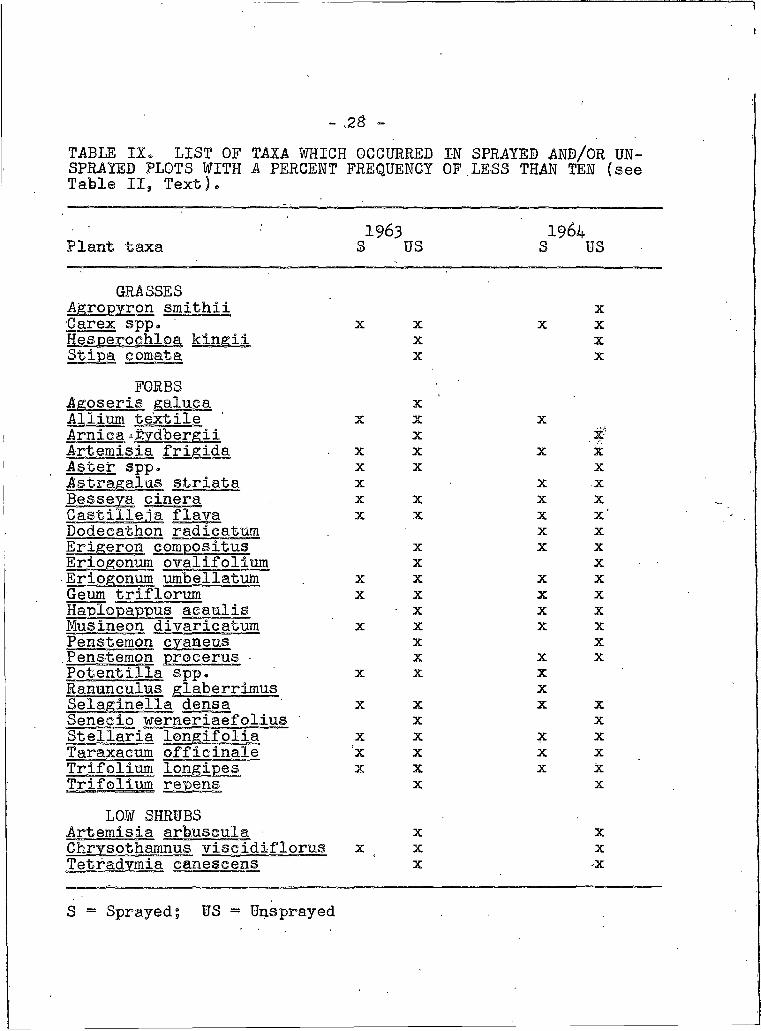
TABLE IZ. LIST OF TAXA WHICH OCCURRED IN SPRAYED AND/OR UNSPRAYED PLOTS WITH A PERCENT FREQUENCY OF.LESS THAN TEN (see Table 11$, Text)®
Plant taxa
GRASSESsmithii
Carex spp.
FORBS Agoseris Allium textile Arnica -Rydbergii Artemisia frigida Aster spp.Astragalus striata Besseya cinera Castilleja flava Dodecathon radieatum Erigeron compositus Eriogonum ovalifolium Eriogonum umbellatutn Geum triflorum
Musineon divarieatum Penstemon eyaneus Penstemon procerus • Potentilla spp, RanunculusSelaginella densa Senecio werneriaefoiius Stellaria longifolia Taraxacum officinale Trifolium Trifolium
LOW SHRUBS Artemisia arb.uscula Chrysothamnus viscidiflorus
canescens
1963 1964S US S US
XX X X X
X XX X
XX X X
X .#X X X XX X XX X XX X X XX X X X
X XX X XX X
X X X XX X X X
X X XX X X X
X XX X X
X X XX
X X X XX X
X X X XX X X XX X X X
X X
X XX X X
X X
S == Sprayed; US = Unsprayed
29 -
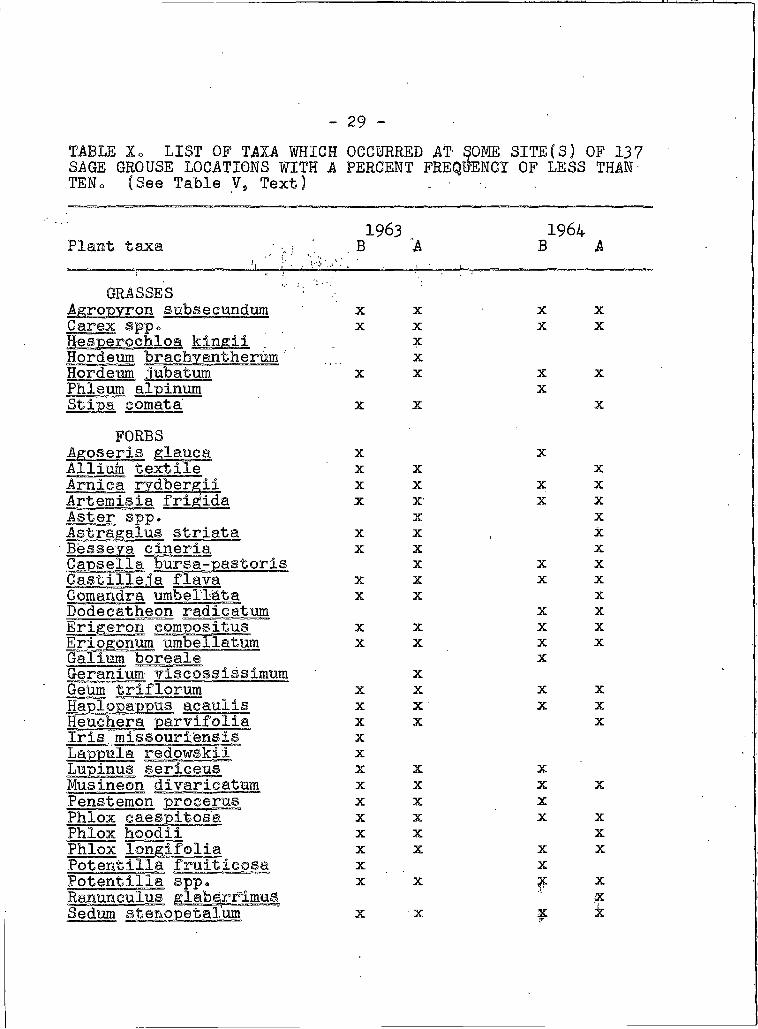
TABLE Xo LIST OF TAXA WHICH OCCURRED AT SOME SITE(S) OF 137 SAGE GROUSE LOCATIONS WITH A PERCENT FREQUENCY OF LESS THAN TENo (See Table Y 9 Text) . ■ .
Plant taxa
GRASSESAgropyron subsecundum Carex spp.
Hordeum brachyantherum ' Hordeum Phleum
comata'
FORBSAgoseris glauca Allium textile
Artemisia frigida Aster spp.
striata_______ cineriaCapsella bursa-pastoris Gastilleja flava Gomandra umbelTata Dodecatheon radieatum
Galium boreale Geranium viseossissimum Geum triflorum
Heuchera parvifolia Iris missourj'ensis
redowskii serieeus
Musineon divaricatum Penstemon PhloxPhlox faoodii Phlox longifolia Potentilla fruitlcosaPotentilla spp. Ranunculus glaberrlmna Sedum stenopetalum
1963 1964B A B A
X X X XX X X X
XX
X X X XX
X X X
X XX X XX X X XX X X X
X XX X XX X X
X X XX X X XX X X
X XX X X XX X X X
XX
X X X XX X X XX X XXXX X XX X X XX X XX X X XX X XX X X XX XX X f X
XX X ¥■ Jc
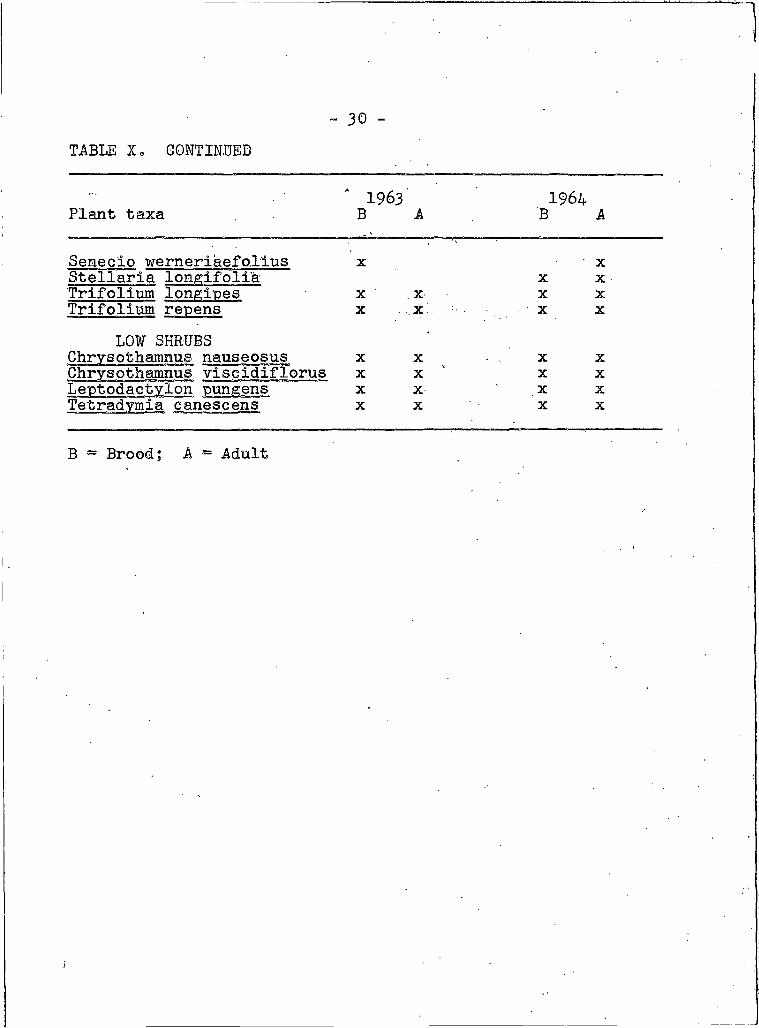
- 30 -TABLE Io CONTINUED
1963 1964Plant taxa B A . B A
Senecio werneriaefo,Ilus Stellaria longifolia Trifolium longipes Trifolium repens
LOW SHRUBSChrysothamnus nauseosus Chrysothamnus viscidiflorus Leptodactylon pungens Tetradymia eaneseens
X XX X
X ■ X X XX X X X
X X X XX X X XX X X XX X X X
B = Brood; A = Adult
MISCELLANEOIJjS OBSERVATIONS
Strutting Grounds
Strutting activity in the basin was apparently confined
to one large centrally located ground (Figure. I) situated on a heavily grazed area adjacent to dense sagebrush® During each of the three years, adverse weather conditions resulted
in sporadic strutting activity; and, with the exception of 175
males recorded in April, 1962, strutting ground counts were
not obtained. The peak of female attendance on the ground
was observed to be the third week of April in 1962 and 1963,
and-the first week of May in 1964» Females moved onto the
strutting ground just prior to daybreak and congregated around
strutting cocks in groups of 40 to 50 or less. By sunrise,
most of the hens had either walked or flown into the heavy
sage bordering the strutting ./ground-. Sage grouse were most
active on clear calm mornings prior to sunrise and were not)rgreatly distrubed when approached by vehicle.
Nesting
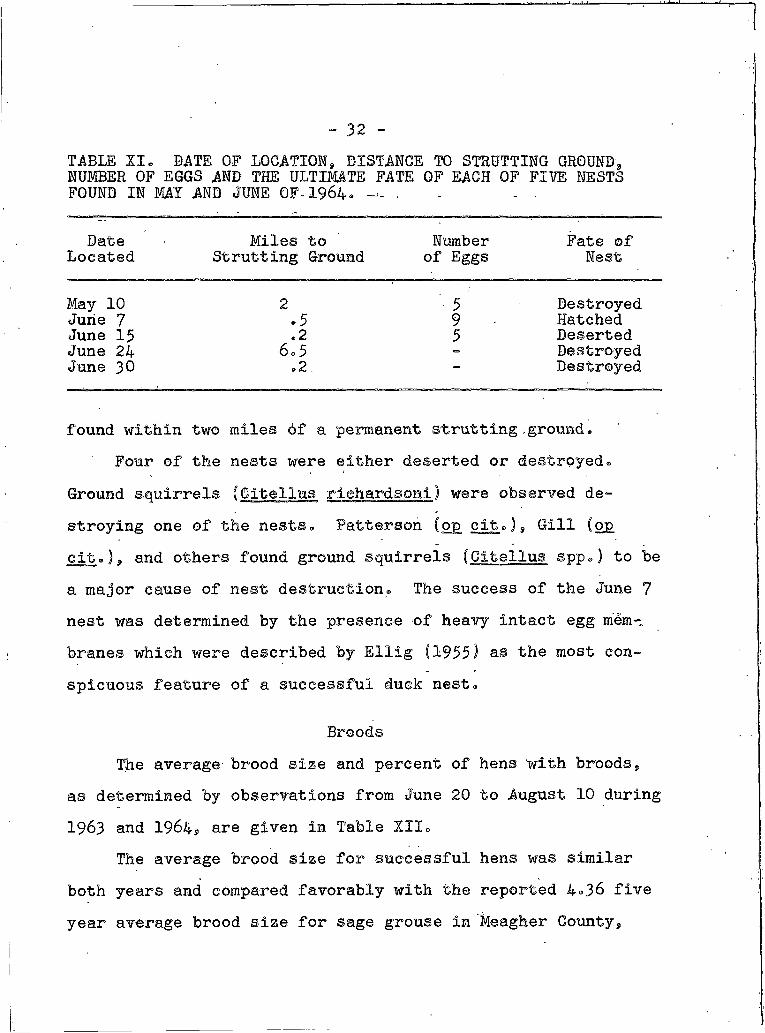
The date of location, distance to strutting ground, num
ber of eggs and the ultimate fate of each of five nests found
in May and June of 1964 are presented in Table XI, :■ ' , ' ' x
Four of the five nests found were within two airline
miles of the strutting ground® The one exception was located
in one of the unsprayed strips in the 1,900 acre Spray allot
ment® Gill (1964) reported S6®9 percent of 23 npsts. were
- 32
TABLE XI. BATE OF LOCATION, DISTANCE TO STRUTTING GROUND, NUMBER OF EGGS AND THE ULTIMATE FATE OF EACH OF FIVE NESTS FOUND IN MAY AND JUNE OF-1964* — ■
DateLocated
Miles to Strutting Ground
Number of Eggs
Fate of Nest
May 10 2 '■ 5 DestroyedJune 7 *5 9 HatchedJune 15 .2 5 DesertedJune 24 6® 5 - DestroyedJune 30 .2 Destroyed
found within two miles of a permanent strutting,ground.
Four of the nests were either deserted or destroyed,®
Ground squirrels (Citellus riehardsoni) were observed de
stroying one of the nests. Patterson (op, cit.) 9 Gill (op
eit.). and others found ground squirrels (Citellus sppe) to be
a major cause of nest destruction® The success of the June 7
nest was determined by the presence of heavy intact egg mem
branes which were described by Ellig (1955) as the most con
spicuous feature of a successful duck nest®
Broods
The average brood size and percent of hens with broods,
as determined by observations from June 20 to August 10 during 1963 and 1964, are given in Table XII®
The average brood size for successful hens was similar
both years and compared favorably with the reported 4=36 five
year average brood size for sage grouse in Meagher County,
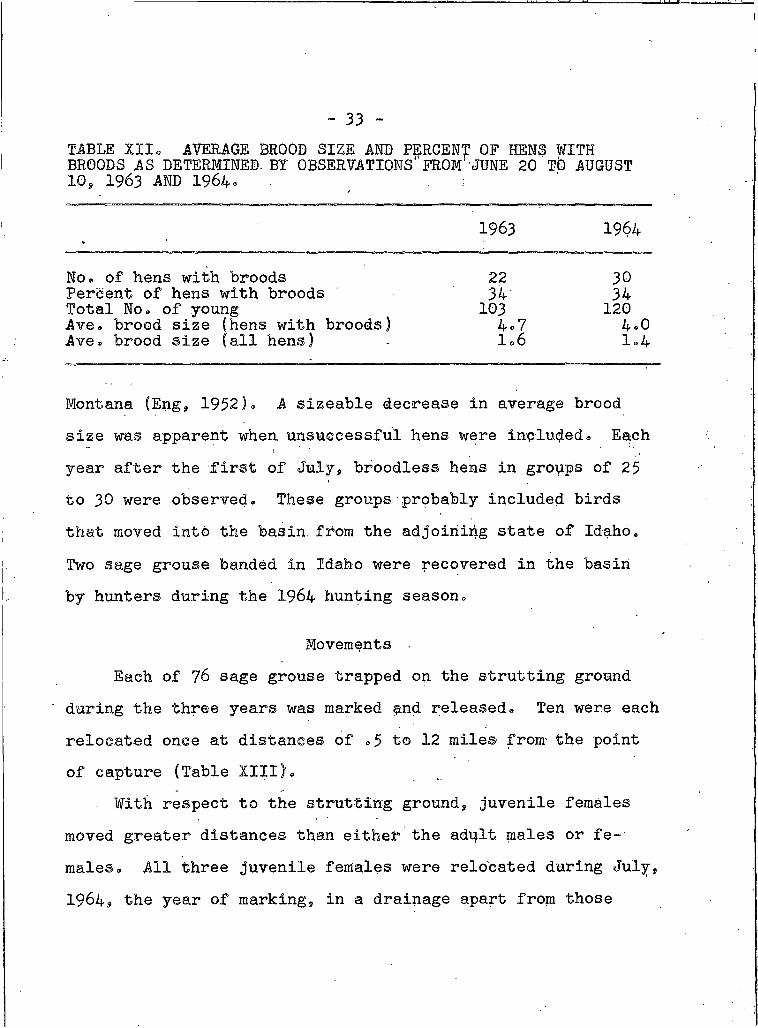
- 33TABLE XIIo AVERAGE BROOD SIZE AND PERCENT OF HENS WITH BROODS AS DETERMINED. BI OBSERVATIONS' FROM JUNE 20 Tfc) AUGUST IOs 1963 AND 1964.
►1963 1964
No® of hens with broods 22 30Percent of hens with broods 34 34Total No. of young 103 120Ave. brood size (hens with broods) 4.7 4®0Ave® brood size (all hens) 1.6 I ®4
Montana (Engs 1952)® A sizeable decrease in average brood
size was apparent when unsuccessful hens were included® Each
year after the first of July, broodless hens in groups of 25
to 30 were observed® These groups probably included birds
that moved into the basin, from the adjoiriihg state of Idaho®
Two sage grouse banded in Idaho were recovered in the basin
by hunters during the 1964 hunting season®
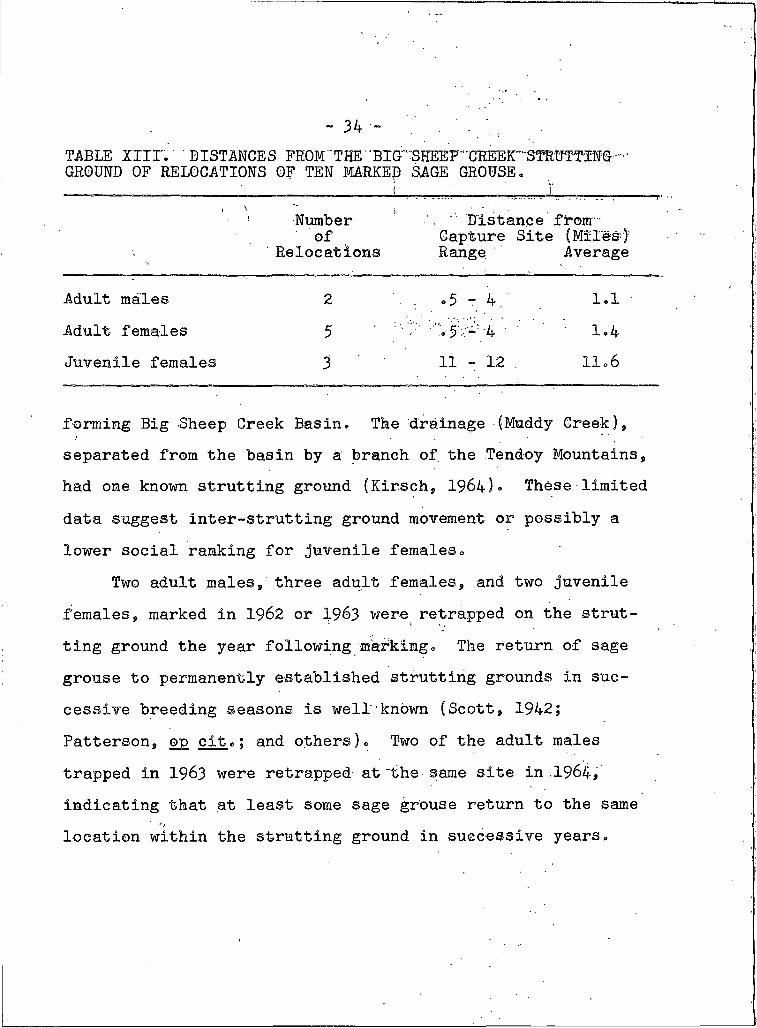
Movements
Each of 76 sage grouse trapped on the strutting ground
during the three years was marked and released® Ten were each
relocated once at distances of ® 5 to 12 miles from- the point
of capture (Table XIII)®With respect to the strutting ground, juvenile females
moved greater distances than either the adult males or fe
males® All three juvenile females were relocated during July,
1964$ the year of marking, in a drainage apart from those
- 34 -
TABLE XIir.' DISTANCES FHGM "THE "BTG'""SHEEP','CEEEr"STROTT3:NG GROUND OF RELOCATIONS OF TEN MARKED SAGE GROUSE._______ _____________________________ __________ _________- L _ ™ ________.. ^ . 1
. \ "" i,Number . " Distance from'
of Capture Site (MIlesr)1' Relocations Range Average
2 . .5 - 4. 1.1
5 ' : 4 ' ' 1.43 11 - 12 . 11.6
forming Big Sheep Creek Basin. The drainage (Muddy Greek),
separated from the basin by a branch of the Tendoy Mountains,
had one known strutting ground (Kirsch, 1964)« These■limited
data suggest inter-strutting ground movement or possibly a
lower social ranking for juvenile females.
Two adult males, three adult females, and two juvenile
females, marked in 1962 or 1963 were retrapped on the strut-
ting ground the year following marking» The return of sage
grouse to permanently established strutting grounds in suc
cessive breeding seasons is well known (Scott, 1942;
Patterson, op cit.; and others). Two of the adult males
trapped in 1963 were retrapped at "the same site in 1964,
indicating that at least some sage grouse return to the same•••location within the strutting ground in successive years.
Adult males
Adult females
Juvenile females
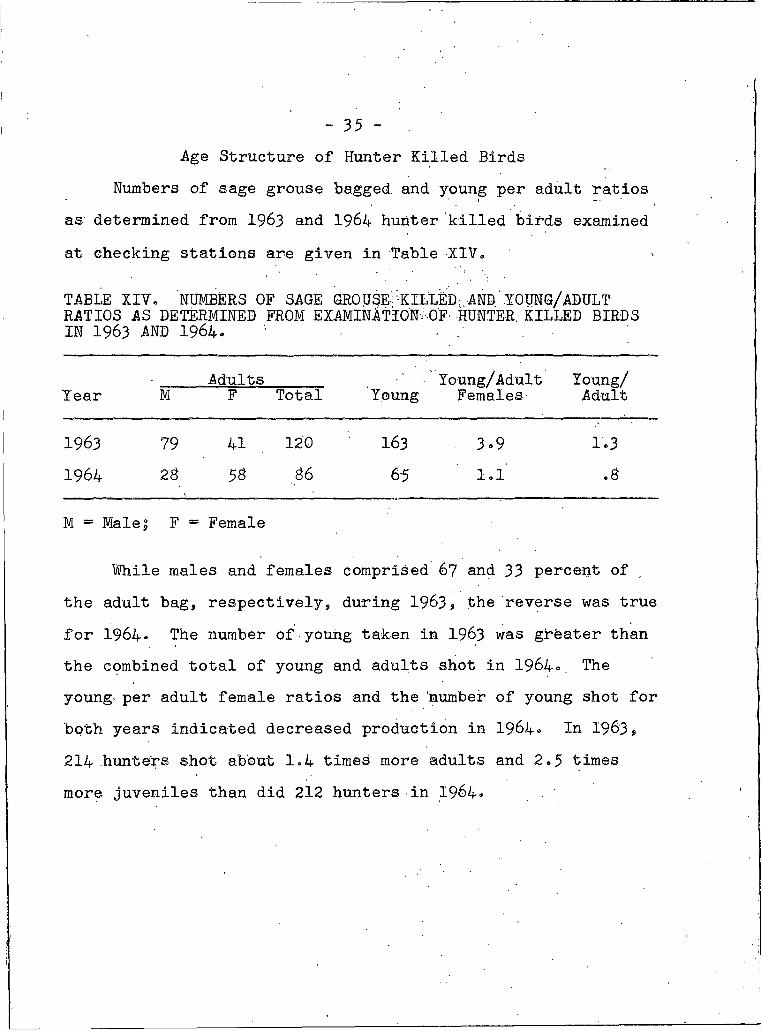
- 35 -Age Structure of Hunter Killed Birds
Numbers of sage grouse bagged and young per adult ratios
as determined from 1963 and 1964 hunter killed birds examined
at checking stations are given in Table XIV.
TABLE XIV. NUMBERS OF SAGE GROUSE^'KILLBD: AND .YOUNG/ADULT RATIOS AS DETERMINED FROM EXAMINATION OF HUNTER. KILLED BIRDSIN 1963 AND :1964.
Year MAdults
F Total YoungYoung/Adult
FemalesYoung/Adult
1963 79 41 120 163 3°9 1.3
1964 23 58 36 65 1.1 .3
M = Male $ F = Female
While males and females comprised .6? and 33 percent of
the adult bag, respectively, during 1963$ the reverse was true
for I964. The number of young taken in 1963 was greater than the combined total of young and adults shot in 1964° The
young per adult female ratios and the number of young shot for
both years indicated decreased production in 1964° In 1963$
214 hunters shot about 1.4 times more adults and 2.5 times
more juveniles than did 212 hunters in 1964°
LITERATURE CITED
Blaisdell, J . P. and W. F. Mue'ggler. 1-9,65'» Effects of 2,4-D on Forbs and Shrubs Associated with Big Sagebrush. J. Range Mgmt. 9(1): 35-40.
Booth, W. E . 1950. Flora of Montana, Part I, Conifers andMonocots. Research Foundation at Montana State College, Bozeman, Montana. 232 pp.
_____________ and J. C . Wright.■ 1959.• Flora. of Montana,Part II, Dicotyledons. Montana State College, Bozeman, Montana. 280 pp. ■
Canfield, R. H. 1941• Application of the line intercept method in sampling range vegetation. J. Forestry 39:385-394.
Dalke, P. D., D . B .. Pyrah, D . C. Stanton, J. E. Crawford, and F. E. Schlatteber• I960. Seasonal movements and breeding behavior of sage grouse in Idaho. Trans. N. Am.Wildl..Conf. 25: 396-406. /
Daubenmire, R. 1959• A canopy-coverage method of yegeta- tional analysis. Northwest Sci.. 33(1): 43-64«
Dill, H. H. and W. H. Thbrnsberry. 1950. A cannon-projectednet trap for capturing waterfowl. J. Wildl» Mgmt.
. 14(2): 132-137.Ellig, L. J. 1955• Waterfowl Relationships to Greenfields
Lake, Teton County, Montana.. Mont. Fish and Game Dept. and Mont. Agr..Expt. Sta® Tech Bulli I. 35 pp.
Eng, R. L. 1952. Population Trends arid Breeding Potential Studies. Mont. Fish and Game P-R. Qtr„ 3(3): 44-49®
____________ 1955« A method for obtaining sage grouse age andsex ratios from wings. J. Wildl. Mgmt. 19(2): 26?-z272«
Enyeart, G. 1956. Responses Of sage grouse to grass reseeding in the Pines area, Garfield County, Utah. M.S. thesis, Utah State Agr® Coll., 55 pp®
Gibson, R. S. 1961. Vegetation Analysis of Cottonwood-Trail Creek Sagebrush Spraying Project No. 541 Beaverhead National Forest. U. S. Forest Service Report,File No. 2620. 3 PP multilith.
I
- 37 -Gill, R. B. 1964» Effects of sagebrush control on the dis
tribution and abundance of sage grouse0 Colo, Coop, Wildl. Res, Unit .Qfcr, Rept, 10(1) 4 pp°
Girard, G, L 0 1937« Life, history, habit, and food of thesage grouse, Gentrdcereus urophasianus Bonaparte, Univ, of Wyo. Pubis., 3(1) s l-$6,
Griner, L. A, 1939• A study of the sage grouse (Centrocercus urophasianus) with special reference.to life history, habitat requirement, and numbers and. distribution. M.S, thesis, Utah State Agr. Coll., 03 pp« ■
Hyder,' D . H., and F. A,. Sneva, 1956. Herbage response tosagebrush spraying. J. Range Mgmt. 9:34-30
Keller, R. J., H. R. Shepherd, and R, N. Randall. 1941°Survey of 1941/North Park, Jackson County, Moffat County, including comparative data of previous seasons. Sage Grouse Surv., Vol. 3, Colo. Game and Fish Dept., 31 pp°
Kirsch, J. 1964. Personal communication,
Martin, A. G., R« H® Gensch, and C . P. Brown. 1946. Alternative methods in upland gamebird food analysis. J .Wildl. Mgmt. 10:0-12.
Mussehl, T. W. i960. Blue Grouse Production, Movements, and Populations in the Bridger Mountains, Montana. J . Wildi. Mgmt. 24(1) 60-60.
Patterson, R. L. 1952. The Sage Grouse in Wyoming. Wyo.Game and Fish Comm., Sage Books, Inc®, Denver, Colorado.341 pp.
Pyrah, D . 1963° Sage Grouse Investigations. Idaho Fish and.Game Dept. Completion Report. Project W 125-R-2.71 pp.
Rogers, G. E. 1964« Sage Grouse Investigations in Colorado. Colo. Game, Fish and Parks Dept., Tech Bull. No. 16.132 pp.
Scott, J. Wo 1942. Mating Behavior of the Sage Grouse. Auk,59(4) 477-490.
Simon, J. R. 1940. Mating Performance of the Sage Grouse.Auk, $7(4) 467-471.
- 3 3 -Trueblbod, R. W. 1954. The Effect of Grass Reseeding, in
Sagebrush Lands on Sage Grouse Populations. M.S. thesis, Utah State Agr. Goll.,-73 PP•.
MONTANA STATE UNIVERSITY LIBRARIES
3 1762 100 4989 5
X
AINvA