Embed Size (px)
Citation preview
NOAA Technical Memorandum NMFS-AFSC-58
U.S. DEPARTMENT OF COMMERCENational Oceanic and Atmospheric Administration
National Marine Fisheries ServiceAlaska Fisheries Science Center
November 1995
Bycatch, Utilization, and Discards inthe Commercial Groundfish Fisheriesof the Gulf of Alaska, Eastern Bering Sea,and Aleutian Islands
by L. E. Queirolo, L. W. Fritz, P. A. Livingston,M. R. Loefflad, D. A. Colpo, and Y. L. deReynier
NOAA Technical Memorandum NMFS
The National Marine Fisheries Service's Alaska Fisheries Science Centeruses the NOAA Technical Memorandum series to issue informal scientific andtechnical publications when complete formal review and editorial processingare not appropriate or feasible. Documents within this series reflect soundprofessional work and may be referenced in the formal scientific and technicalliterature.
The NMFS-AFSC Technical Memorandum series of the Alaska FisheriesScience Center continues the NMFS-F/NWC series established in 1970 by theNorthwest Fisheries Center. The new NMFS-NWFSC series will be used bythe Northwest Fisheries Science Center.
This document should be cited as follows:
Queirolo, L. E., L. W. Fritz, P. A. Livingston, M. R. Loefflad, D. A. Colpo, and Y. L. deReynier. 1995. Bycatch, utilization, and discards in the commercial groundfish fisheries of the Gulf of Alaska, easternBering Sea, and Aleutian Islands. U.S. Dep. Commer., NOAA Tech.Memo. NMFS-AFSC-58, 148 p.
Reference in this document to trade names does not imply endorsement bythe National Marine Fisheries Service, NOAA.
NOAA Technical Memorandum NMFS-AFSC-58
Bycatch, Utilization, and Discards in theCommercial Groundfish Fisheries of theGulf of Alaska, Eastern Bering Sea, and
Aleutian Islands
L. E. Queirolo, L. W. Fritz, P. A. Livingston,M. R. Loefflad, D. A. Colpo, and Y. L. deReynier1
Alaska Fisheries Science Center’7600 Sand Point Way N.E., BIN C-15700
Seattle, WA 98115-0070
University of Washington1
School of Fisheries WH-10Seattle WA 98195
Current mailing address:Fisheries Management Division
Northwest Regional Office
7600 Send Point Way N.E.. BIN C-l 5700. Bldg. 1
Seattle, WA 98115-0070
U.S. DEPARTMENT OF COMMERCERonald H. Brown, Secretary
National Oceanic and Atmospheric AdministrationD. James Baker, Under Secretary and Administrator
National Marine Fisheries ServiceRoland A. Schmitten, Assistant Administrator for Fisheries
November 1995

This document is available to the public through:
National Technical Information ServiceU.S. Department of Commerce5285 Port Royal RoadSpringfield, VA 22161

Notice to Users of this Document
This document is being made available in .PDF format for the convenience of users; however, the accuracy and correctness of the document can only be certified as was presented in the original hard copy format.

Abstract
Total harvest, bycatch, catch utilization, and discards are currently the subjects of considerable
attention and debate worldwide. This report documents reported catch, bycatch, utilization,and discard data and attempts to identify patterns and trends in the commercial groundfishfisheries of the Gulf of Alaska (GOA), eastern Bering Sea, and Aleutian Islands (BSAI) (areaswhich currently make up the United States’ Exclusive Economic Zone off Alaska). The report
identifies existing data sources and examines the historical catch record, as well as current
domestic groundfish fisheries in these areas.
Many factors have contributed to the increased interest in this issue. Among these are: 1)improvements in understanding of basic ecological relationships and fish stock dynamics; 2)
changes in fishing effort, capacity, and technology; 3) the increasing economic and marketimportance of these fisheries; and 4) changes in management capability and authority (e.g.,
extension by the United States of exclusive management authority under the Magnuson Fishery
Conservation and Management Act of 1976).
There are many reasons why groundfish fisheries discard groundfish. Among these are: 1) thedirected fishery for a given species, say species A, may be closed (due to quota or other
restrictions) forcing all other fisheries which catch species A as bycatch to discard it; 2)individual fish in the catch are too small or large for mechanical processors, or are the wrongsex (e.g., males in the rock sole roe fishery); 3) to change the species composition of their
total catch for the reporting week, preventing the vessel from being considered a “participant”
in a particular fishery for that week, and as such, subject to different, possibly more stringent,
prohibited species bycatch rate standards set by the North Pacific Fishery ManagementCouncil; 4) a lack of handling or processing capacity aboard the vessel; or 5) marketlimitations on the utilization or retention of certain species. Particularly for various roundfish
fisheries (e.g. walleye pollock, Pacific cod, Atka mackerel and rockfish), the size composition of the target species population can greatly affect the rate of discard by the fishery. If a pre-
recruited year class is very strong, large catches of fish too small for market may beunavoidable, increasing the rate of discard. Discards are subtracted from catch tonnage prior
to calculation of product recovery rates, but discarded fish are included as part of the totalharvest .
111
An analysis, based upon Weekly Product Reports for 1994, suggest that for all GOA and BSAI
groundfish fisheries combined, approximately 15% of the total catch was discarded in-the-
round. Significantly, the weight of offal returned to the sea was nearly four times as great asthe weight of discards. About 70%) by weight, of “target” catch is returned to the sea asoffal; offal discharges make up almost 60% of “total” catch. Thus, when considering energytransfer in the ecosystem, offal production vastly overshadows discard amounts.
Groundfish discards may have unanticipated and/or undesirable economic implications.
Bycatch discards may, for example, impose direct economic costs on competing groundfishfisheries in the form of foregone catches. Through a series of simplifying assumptions, it was
possible to estimate the “opportunity cost” (as measured at the first wholesale level) to target
fisheries of the foregone catch, attributable to groundfish bycatch discards in individual BSAIand GOA fisheries.
In 1994, all BSAI groundfish fisheries discarded an aggregate total of 162,161 metric tons (t)of allocated groundfish species for which the total allowable catch was binding. The
opportunity cost of these discards exceeded $91,848,000. The total retained catch of allgroundfish species in these fisheries was just over 1,699,500 t and had a value which exceeded$925,229,800. Thus, the ratio of the value of retained catch to discards (Retained/DiscardValue Ratio), weighted by fishery, across all BSAI groundfish fisheries, was 10.1. That is,
for each dollar of bycatch “opportunity cost” imposed, $10.10 of output was produced fromretained catch. Individual rates varied from a high of $29.2 in the pollock target fishery, to a
low of $2.4 in the “other” groundfish target fishery. In the GOA groundfish fisheries,
equivalent discards totaled 15,685 t. The opportunity cost of these discards exceeded$14,661,597. Total retained catch of all groundfish species in these fisheries was just over196,588 t and had a value which exceeded $235,825,000. Thus, the Retained/Discard ValueRatio, weighted by fishery across all GOA groundfish fisheries, was 16.1. That is, for each
dollar of bycatch “opportunity cost” imposed, $16.10 of output was produced from retainedcatch. Individual rates varied from a high of 45.4 in the sablefish target fishery, to a low of
3.4 in the arrowtooth flounder target fishery.
Groundfish discards may also impact markets by affecting product form, supply, and pricewhich, in turn, influence international seafood trade and U.S. market share.
iv
Contents
Abstract....................................................................................................................................iii
Introduction . . . . . . . . . . . . . . . . . . . . . . . . . . . . . . . . . . . . . . . . . . . . . . 1
Trends in Bycatch, Utilization, and Discards, 1972-94 . . . . . . . . . . . . . . . . . . . . . . . . . . 4Foreign, Joint Venture, and Domestic Fisheries, 1972-90 . . . . . . . . . . . . . . . . . . 4
Data Sources and Table Summaries . . . . . . . . . . . . . . . . . . . . . . . . . . . . 4Discussion of Trends . . . . . . . . . . . . . . . . . . . . . . . . . . . . . . . . . . . . . 5
Catch, Bycatch, and Discard by the Domestic Groundfish Fisheries 1990-94 . . . . . . 6Data Sources and Table Summaries . . . . . . . . . . . . . . . . . . . . . . . . . . . . 6Groundfish and Other Allocated Species: Catch Trends . . . . . . . . . . . . . . . 8Prohibited Species: Catch Trends . . . . . . . . . . . . . . . . . . . . . . . . . . . . . . 9Other Species: Catch Trends . . . . . . . . . . . . . . . . . . . . . . . . . . . . . . . 9
Bycatch Discard Mortality . . . . . . . . . . . . . . . . . . . . . . . . . . . . . . . . . . . . . . . . . . 71Review of Literature on Discard Mortality . . . . . . . . . . . . . . . . . . . . . . . . . . . 71Gear-Related Factors Influencing Mortality . . . . . . . . . . . . . . . . . . . . . . . . . . 71Other Factors Influencing Discard Mortality . . . . . . . . . . . . . . . . . . . . . . . . . 75Discard Mortalities in North Pacific Groundfish Fisheries . . . . . . . . . . . . . . . . . . 76
Ecological Impacts . . . . . . . . . . . . . . . . . . . . . . . . . . . . . . . . . . . . . . . . . . 85. . . .Effects of Selective Fishing . . . . . . . . . . . . . . . . . . . . . . . . . . . . . . . . . . . . . 85Consumers of Discards and Fish Processing Offal . . . . . . . . . . . . . . . . . . . . . . . 88Unobserved Mortalities . . . . . . . . . . . . . . . . . . . . . . . . . . . . . . . . . . . . . . . 95
Catch Utilization . . . . . . . . . . . . . . . . . . . . . . . . . . . . . . . . . . . . . . . . . . . . . . . . 98Product Forms . . . . . . . . . . . . . . . . . . . . . . . . . . . . . . . . . . . . . . . . . . . . . . 98
Limits on Production . . . . . . . . . . . . . . . . . . . . . . . . . . . . . . . . . . . . . . . . . . . . 102Technical Limitations . . . . . . . . . . . . . . . . . . . . . . . . . . . . . . . . . . . . . . . 102Market Limitations . . . . . . . . . . . . .. . . . . . . . . . . . . . . . . . . . . . . . . . . . 104
Product Recovery Rates (PRRs) . . . . . . . . . . . . . . . . . . . . . . . . . . . . . . . . . . . . . 106Product Recovery Rates Variability in the Field . . . . . . . . . . . . . . . . . . . . . . . 111
Markets and Estimated Product Value . . . . . . . . . . . . . . . . . . . . . . . . . . . . . . . . . . 112Groundfish Exports . . . . . . . . . . . . . . . . . . . . . . . . . . . . . . . . . . . . . . . . 112Factors Influencing Trade . . . . . . . . . . . . . . . . . . . . . . . . . . . . . . . . . . . . . 125
Estimating the Opportunity Cost of Bycatch . . . . . . . . . . . . . . . . . . . . . . . . . . . . . . 129
Citations . . . . . . . . . . . . . . . . . . . . . . . . . . . . . . . . . . . . . . . . . . . . . . . . . . . 143
V
Introduction
Total harvest, catch utilization, bycatch, and discard levels have become increasinglyimportant considerations in the monitoring and management of the commercial fisheries in theGulf of Alaska and Bering Sea. This report documents reported catch, bycatch, utilization,and discard data and attempts to identify patterns and trends in the commercial groundfishfisheries of the Gulf of Alaska (GOA), eastern Bering Sea, and Aleutian Islands area(combined in BSAI), areas which currently make up the U.S. Exclusive Economic Zone (EEZ)off Alaska..The report also identifies existing data sources and examines the historical catchrecord, as well as current domestic groundfish fisheries in these areas.
Concern about total catch; bycatch, and discards in the groundfish fisheries of the NorthPacific and Bering Sea has increased over time. Many factors have contributed to the
progressive increase in interest in this issue, including improvements in our understanding ofbasic ecological relationships and fish stock dynamics; changes in fishing effort, capacity, andtechnology; the increasing economic and market importance of these fisheries; and changes inmanagement capability and authority, (e.g., extension by the United States of exclusivemanagement authority under the Magnuson Fishery Conservation and Management Act of1976).
Because changes in fishery management and fishing practices have occurred in the last 20years, empirical data on catch, utilization, and discards are not of uniform quality or detail andcome from a variety of sources. For example, data sources for the U.S. groundfish fisheriesoff Alaska include the National Marine Fisheries Service (NMFS) Observer Program, the Stateof Alaska Fish Ticket Database, and the Weekly Production Reports (submitted by theindustry). In general, however, these data increase in detail and reliability with time. Thisreport relies upon these various and variable data sources. The relative strengths andlimitations of particular data sources are noted.
Finally, we attempt to identify patterns and trends in the important commercial groundfishfisheries in the EEZ off Alaska, and place them within a broader ecological, biological, andeconomic context. In this way, the possible implications of changes in total catch, bycatch,utilization, and discards may be more fully understood in terms of 1) their impacts onindividual fish stocks, 2) the linkages to domestic and world markets and, 3) the general healthof the North Pacific ecosystem.
Our report is intended for a general audience, including participants in these fisheries,resource managers, and U.S. citizens, who have an ownership stake in the wise and efficient
utilization of these valuable living marine resources.The report reveals, in general terms,
how and by whom these resources have historically been exploited; how these patterns haveevolved over time; and what ecological, biological, and economic trade-offs may be involvedin their future use. The analysis presented and conclusions drawn should be regarded aspreliminary and subject to modification as improved data become available.
There is an array of data available on the North Pacific groundfish fisheries. These sourcesinclude processor catch reports, processor production reports, State of Alaska fish tickets, andNMFS observer data. While there are several data sources available on historic catch, nonestands alone as the definitive source of groundfish harvest amounts. For example, State ofAlaska fish tickets provide a detailed synopsis of groundfish landings from Alaska waters, butdo not cover all of these vessels which process their fish at sea. In turn, observer data is veryuseful, but observer coverage is not 100% for all vessels, nor are all fish observed on anygiven vessel. Assumptions must be made about unobserved catch. Each year since recordshave been kept on the groundfish fisheries, NMFS has used available data sources to estimatethe annual groundfish catch. This paper relies heavily on those annual estimates. All catchestimates presented represent the best estimates based on the data available from varioussources during any given year. In general terms, data on bycatch, utilization, and discardhave also improved over time, yet continue to have some limitations,
Historically, Alaska groundfish were taken primarily by distant-water fishing fleets fromseveral nations with only limited United States participation in the Pacific cod (Gadusmucrocephalus) fishery. Initial estimates of catch for the foreign vessels were from thevessel’s own reports of catch amounts. While data exist for the years prior to 1977, they areunverified and should be used with appropriate caution. In 1977, an onboard United Statesobserver program was implemented to collect independent data on catch quantities andcomposition. This program developed and expanded such that by the early 1980s, largeportions of the fishing fleets were covered by observers. This increased coverage providedtwo sources of catch data: observer catch estimates combined with the results of catchcomposition sampling and vessel catch reports. Both reports were incorporated into models tobest estimate catches (Nelson et al. 1981).
The nature of the participants in the fisheries changed in the early 1980s as joint venture (JV)operations between United States and foreign nations developed. In JV fisheries, domesticcatcher vessels harvested fish and delivered them to foreign vessels for processing. These JVoperations eventually displaced the directed foreign vessels as the fishery moved toward“Americanization.” The data sources used to estimate total catch, however, remainedessentially the same. Vessel catch reports were used in concert with onboard observer reportsto estimate catch by species.
2
By the mid-1980s a domestic processing fleet began to develop. Initially, this domestic-fleetwas not required by regulation to carry observers and the only catch estimates available werefrom unverified vessel reports and a limited voluntary observer program. In 1990, amandatory domestic observer program was implemented to provide observer coverage over abroad segment of the fleet. The implementation of this domestic observer program coincidedwith regulations mandating production and discard reporting for all processors. In thetransition to the domestic fleet, observer data recording procedures were modified to includeestimations of the portions of the catches by species and species group which were discardedand retained.
Throughout the course of the foreign, JV, and domestic groundfish fisheries, the primaryfocus of data collection activities has been on ascertaining the total catch by species or speciesgroup. The emphasis on total catches is due to the need to quantify removals and managefishery quotas--this focus in data collection continues today.
Less emphasis has been placed on the disposition of catch after harvest. The data available todistinguish between retained and discarded components of catch is limited and only provides arough approximation of what happened to the components of the total catch.
Prior to 1990, no verified data were collected on discard amounts of catch although we canmake certain assumptions about particular species groups. For example, we assume thatspecies whose retention was prohibited were routinely discarded. These include Pacificsalmon (Oncorhynchus spp.), Pacific halibut (Hippoglossus stenolepis), king (Paralithodesspp.) and Tanner (Lithodes spp.) crabs, and Pacific herring (Clupea pallasii). Similarly,catches of species lumped together in the “other” groundfish species category, which includessharks and skates (Elasmobranchi), sculpins (Cottidae), grenadiers (Macrouridae), and smelts(Osmeridae) are assumed to have been largely discarded.
Since 1990, two sources of discard and retained catch data are available; weekly productionreports and domestic observer data. The derivation of discard and retained amounts of catchfrom each source warrants explanation. Weekly production reports are submitted by industryand report the amounts and types of fish products produced for that reporting week, bymanagement area and gear type. The fish products are converted by NMFS to a round weightequivalent by dividing them by an appropriate product recovery rate (PRR). This provides anestimate of retained catch. Included with the production information is the vessel’s ownestimate of the round weight of fish discarded. Summing the two components, discard andretained, provides an estimate of total catch by species from processor information.
3
Observers, in turn, first estimate the total catch by tow or set. They then sample a subset ofthese catches to estimate the species composition. NMFS applies the sampled composition tothe catch estimates to provide an estimate of catch by species. Within the compositionsampling, observers also report the proportions of fish, by species and species groups, thatthey judge were discarded by the vessel’s personnel. These observer discard/retainedproportions are also applied to the total catch estimates. It is important to note that theobserver estimates of the retained/discard percentages are roughly gauged based on what theysee happening, on the vessel. Discard percentages are difficult to estimate because discardsoccur in many ways and places on vessels. Deriving this discard percentage is secondary tothe primary work of an observer, which is obtaining total catch and composition samplingdata. Thus, observer-derived discard estimates are provided as a rough gauge and are not tobe considered absolute. Vessel estimates of discard suffer from similar difficulties inestimation.
In the 1990 domestic data, total domestic groundfish catch and discard amounts are based onlyon the weekly production reports submitted by industry. The amounts of prohibited speciesare estimated by applying observed rates to the total catch estimate derived from theproduction reports. All of the prohibited species amounts were discarded.
Catch estimates from 1991-1994 utilize both observer data and vessel data in a “blend” model.Thus, the catch data represent a combination of the two data sources. However, changes havebeen made to the blend model over time. Catch reported in this paper for these 4 years isbased on the 1994 blend model applied to each year’s respective data. Thus, these catchestimates may differ from those used to manage the fishery, and those reported in a variety ofother sources. Last, this 1994 model uses observer data from shoreside delivering vessels toestimate the proportion of catch which is discarded at sea prior to delivery. This proportion isadded to reported landings to estimate total catch.
Trends in Bycatch, Utilization, and Discards, 1972-94
Foreign, Joint Venture, and Domestic Fisheries, 1972-90
Data Sources and Table Summaries -- The data presented are NMFS’ best estimates of catchfor each year that data exist for the foreign and joint venture fisheries. Foreign data for theyears 1972-1976 are as reported by Murai et al. (1981) and Forrester et al. (1983). Foreignand JV catch statistics for the years 1977-1990 are as reported in Berger et al. (1986), Bergeret al. (1987), Berger et al. (1988), Berger and Weikart (1988), Berger and Weikart (1989),Guttormsen et al. (1990), and Guttormsen et al. (1992). Prior to 1990, domestic catch is
4
based on the Pacific Fisheries Information Network (project of the Pacific States MarineFisheries Commission, Gladstone, OR) landings data derived from processor vessel estimatesand State of Alaska fish tickets as reported in Kinoshita et al. (1995); domestic catches ofPacific cod from 1977-83 were obtained from Thompson (1994) and Thompson and Zenger(1994). Since 1977, observer data were available and incorporated in catch estimation. Theseprocedures are described by Nelson et al. (1981), with updates by Berger et al. (1986). Theseestimates of total catch (both retained and discarded) are summarized in Tables 1 and 2; nodata exist on the proportion discarded. Since the catch data from. 1972-1976 rely solely onnumbers supplied by foreign nations, data on fish removals should not be considered asaccurate as data collected from foreign, joint-venture, and domestic operations when U.S.observers were on a large percentage of the fishing vessels. Catches of prohibited species byforeign and JV groundfish fisheries are listed in Tables 3 and 4. All catches of herring andshrimp in the BSAI and GOA, and most of the halibut catches from the GOA in Tables 3 and4 were from the directed, non-groundfish fisheries of the United States and Canada (combinedin the category called All Others). These data were included because it was impossible toseparate the directed catches of herring, shrimp, and halibut from the bycatch of these speciesin the small domestic directed groundfish fisheries (principally for Pacific cod).
Discussion of Trends -- During the 1970s, groundfish off Alaska were caught almostexclusively. by the distant-water fleets of Japan, Russia (formerly the Soviet Union), Republicof Korea (South Korea), Poland, and Republic of China. In the BSAI (Tables 1 and 3), Japanand Russia targeted on the same species of groundfish currently sought by domestic fisheries:walleye pollock (Theragra chalcogramma), Pacific cod (Gadus macrocephalus), sablefish(Anoplopoma fimbria), and various flatfish (Pleuronectiformes) and rockfish (Sebastes spp.)species. In these fisheries, Japan and Russia had “bycatches” of Pacific halibut and herring,the latter of which for the Russians were as high as 54,000 metric tons (t) in 1972. Catches of“other” species were also considerably higher by foreign fisheries in the 1970s than theycurrently are for domestic fisheries, due in part to inclusion of current groundfish targets suchas Atka mackerel (Pleurogrammus monopterygius) in the “other” species category, but alsopresumably because of greater reliance on bottom trawls to catch semi-demersal species suchas pollock. In the GOA (Tables 2 and 4), total fish removals were about 5-10 times less thanin the BSAI. Japanese trawl vessels in the GOA chiefly targeted Pacific ocean perch (Sebastesalutus) through 1976, when they switched to pollock, cod, and flatfish; Japanese longlinerstargeted sablefish and Pacific cod in the GOA through the 1970s and 1980s. Russian vesselsprimarily targeted pollock and Atka mackerel using trawls. Interestingly, there were onlysmall reported catches of Pacific halibut by Russian vessels, and no reported catches of herringby any foreign vessels fishing the GOA in the 1970s, which is clearly an inaccuraterepresentation of their total catch.
5
Joint-ventures between foreign processing ships and U.S. domestic catcher vessels beganoperating in 1978 in the GOA, and in 1980 in the BSAI. Targeted groundfish speciesremained the same throughout the 1980s. Allocations of pollock, cod, Atka mackerel, flatfishand rockfish to domestic production elements (which included JV) in both the BSAI and GOAincreased through the 1980s. Bycatch of prohibited species was increasingly controlledthrough time and area groundfish fishery closures, exclusion of certain gear types from criticalareas, and ultimately, caps on the amounts of halibut, crab, salmon, and herring that could beincidentally caught by groundfish fisheries.
Fritz (in press) reviewed the bycatch rates of juvenile pollock by groundfish fisheries in theBSAI and GOA from 1964-1991. The current U.S. domestic fishery and the joint-venturefisheries of the 1980s in the BSAI generally retained pollock greater than 30 cm in length, buttargeted larger fish, and discarded fish smaller-than 30 cm (Wespestad and Dawson 1991).Catch rates (catch in numbers of 2-3 year-olds divided by their population size) of 2-3 year-oldBSAI pollock (approximately 20-35 cm in length) averaged only about 2% from 1980-90.Foreign fisheries in the mid- to late 1970s (1973-79), however, caught an average of 20% ofthe 2-3 year-old BSAI pollock each year. Targeting on small fish, particularly the strong 1972year class, may have occurred during this period, but the amount of discards is unknown.
Catch, Bycatch, and Discard By the Domestic Groundfish Fisheries 1990-94
Data Sources and Table Summaries -- The data presented are NMFS’ best estimates of catchfrom 1990-1994 for domestic fisheries. Data since 1991 is based on a blend modelincorporating observer data and weekly processor reports. The blend model has developedover time. For the 1991-1994 data, the 1994 blend model is applied to all years. A blendmodel was not constructed in 1990. Instead, weekly production reports serve as the basis forthe groundfish catch data. For all years since 1990, the estimated catch of prohibited speciesis based on observed bycatch rates applied to the total catch estimate.
The blended catch statistics contain the estimated amounts (in metric tons) of each allocatedgroundfish species and species group that was retained or discarded by each target fishery,processing mode (at-sea or shoreside processor, or mothership), and gear type, and withineach area (three-digit statistical area) and week. Data on total and discarded catch, and discardrates (discarded/total catch) of each groundfish species and species group by year (1990-94),region (BSAI and GOA), target species fishery, and gear type from these sources aresummarized in Tables 5-34, and in Figures 1-2. In these and the tables summarizingprohibited and “other species” bycatches (Tables 35-52), the following guidelines were usedfor reporting and aggregating data into target species/gear groups:
6
. the target fishery definitions developed by the NMFS Alaska Regional Office (AKR)are used; to ensure this, the “blend” (1991-94) or the weekly processor report data(1990) were run through a target fishery algorithm (which uses the same criteriaestablished by AKR, except for rock sole (Pleuronectes bilineatus) - other flatfish
fisheries) at the NMFS Alaska Fisheries Science Center, Seattle. This ensured a dataset with consistent target fishery assignments;
. all catches of rockfish and thornyheads (Sebastolobus spp.) were summed and reportedas one category (Rockfish);
. AKR assigns pollock target fishery types (pelagic or bottom trawl) to catch data basedon the percentage of pollock in the catch rather than by reported gear type. If the total
catch is composed of at least 95% pollock then a pelagic trawl pollock target is(assigned; if pollock is the major species caught but comprises less than 95% of theretained catch, then bottom pollock fishery is assigned;
l squid (molluscan order Decapoda) and other species are combined in the “other”category;
. recently created flatfish target fisheries in the GOA (rex sole (Errex zachirus) andflathead sole (Hippglossoides elassodon)) were included with Deepwater Flatfish.
. Atka mackerel in the GOA was included with “other” species until 1993.
Catches of prohibited species by each target fishery in the BSAI and GOA by gear in 1990-94are summarized in Tables 35-44. Halibut and herring are listed in these tables by weight (t) ofcatch, while salmon and crab are listed in numbers of animals caught. For halibut, the weightlisted is that caught, not the estimated mortality.
The “other” species category listed in Tables 5-34 consists of squids; octopi (molluscan orderOctopoda), smelts, sharks, skates, and sculpins, among others. These species have acollective allocation or catch quota in both the BSAI and the GOA. Currently there is nosignificant directed fishing on these species in the BSAI and GOA. Records of catches of“other” species exist in observer sample data as well as in weekly processor reports and fishtickets. To investigate the species composition of the “other” species category and how this isaffected by gear and target fishery, catch rates of each of the species groups listed above (andmore, including grenadiers, eelpouts (Zoarcidae), snipe eels (Macroramphosidae), greenlings(Hexagrammidae), lumpsuckers (Cyclopteridae), hagfish (Myxinidae), ratfish(Chimaeriformes), and poachers (Agonidae)) by each target fishery and gear were obtainedfrom the observer database. These rates were then applied to the target species/gear catches inthe “blend” file to obtain estimates of the catch weights of each “other” species group in theBSAI and GOA in 1990-93 (Tables 45-52). In theory, the total obtained using this methodshould be similar to the total listed in the “other” species category in Tables 5-34 for the same
time/area/fishery/gear cell.
7
Groundfish and other allocated species: catch trends -- Total discard rates (sum of totaldiscards/sum of total catch) by the domestic groundfish fisheries in the BSAI ranged between12% and 16% in 1990-94. In the GOA, discard rates for the same period were slightlyhigher, ranging between 17% and 21% (this may, in part, be due to the classification asdiscards of some pollock from shoreside plants that was converted to fish meal). However,the total tonnage discarded has been much greater in the BSAI (ranging between 197,660 t and314,585 t in 1990-94) than in the GOA (ranging between 41,360 t and 60,760 t) due to themuch larger size of the fishery. In the BSAI, the majority of the discards (by weight) has beenpollock (between 37% and 60% of the total discards), with rock sole discards generally thesecond largest by weight (6-14%). Pollock and rock sole discards combined have accountedfor not less than 50% of the total groundfish and “other” species discards each year from 1990to 1994 in the BSAI. In the GOA, discards of arrowtooth flounder (Atheresthes stomias)comprised more than one-third of the total discards each year from 1990 to 1994 (34-50%),with pollock discards generally second, ranging from 16% to 30%.
Pollock fisheries in the BSAI and GOA have had the lowest total discard rates (discards of allallocated groundfish and “other” species divided by total catches) of any North Pacificgroundfish fishery from 1990 to 1994, ranging from only 3% to 9% in the BSAI and 4% to10% in the GOA. In the BSAI, the rock sole fishery has had the highest rate of total discard,ranging from 60-70% in 1990-94, while in the GOA, it has been the deepwater flatfish fisherythat has had the highest total discard rates, ranging from 52% to 72% of their total annualcatch.
Despite their low rates of total discard, BSAI pollock fisheries have discarded the mostgroundfish and “other” species of any BSAI groundfish fishery, averaging over 93,000 t peryear in 1990-94. Trailing the BSAI pollock fishery in total discards were the BSAI yellowfmsole and Pacific cod fisheries, which have each averaged about 60,000 t per year. In theGOA, total discards by the deepwater flatfish (average of 13,000 t per year) and Pacific cod(average of 12,200 t per year) fisheries have accounted for about half of the total annualdiscards by all GOA groundfish fisheries in 1990-94.
Target species discard rates have generally been higher for flatfish than roundfish fisheries inboth the BSAI and GOA. In the BSAI, target species discard rates in 1990-94 by each of thetwo largest flatfish fisheries, yellowfin and rock sole, ranged from 21% to 28%) and 34% to58%) respectively. In fact, the BSAI directed rock sole fishery had the highest rates of targetspecies discard of any fishery in the BSAI or GOA. By contrast, target species discard ratesin the same period-by each of the two largest directed BSAI roundfish fisheries, pollock andPacific cod, ranged from 2% to 6%, and 2% to 9%) respectively. In the GOA, 1990-94 targetspecies discard rates by deepwater and shallow flatfish fisheries ranged from 9% to 18%, and6% to 26%) respectively, while the two largest GOA roundfish fisheries, pollock and Pacific
8
cod, discarded between 2% and 8%, and 2% and 4%) respectively of their target speciescatches. In the GOA, the rockfish fishery has had the highest rate of target species discardrelative to its total catch, discarding between 11% and 30% in 1990-94. For this report,however, the rockfish fishery includes all Sebastes and Sebastolobus spp. targets, and as such,the reported discard rates for individual species or group targets may be misleading. Thelowest rates of target species discard have been achieved by the sablefish fisheries in the BSAIand GOA, which have discarded less than 2% (by weight) of all their sablefish caught in bothareas each year from 1990-94.
Prohibited Species: Catch Trends -- Total catch and discard amounts and rates listed in Tables5-34 do not include the mandatory discards of Pacific halibut, Pacific herring, salmon, and allking and Tanner crabs by groundfish fisheries (Tables 3544). Groundfish fisheries areprohibited from retaining these species’ to eliminate any incentive to target on them. In 1994,inclusion of the discards of prohibited species with the discards of groundfish and otherspecies by all BSAI groundfish fisheries increases the estimates of total discards and total catchby 18,812 t (to 313,551 and 2,013,081 t, respectively2), and the total discard rate by 1% (to16%). Similarly, in the GOA, the estimates of total discards and total catch increase by 10,889t (to 54,315 and 250,904 t, respectively) and the total discard rate by 4% (to 22%)3.
In groundfish fisheries, trawls capture not only the majority of the groundfish catch, but alsomost of the bycatch of herring (primarily pelagic trawl pollock), salmon (trawl fisheries forpollock and cod) and crabs (bottom trawl fisheries for flatfish, cod and pollock). Halibut arecaught as bycatch principally in the trawl fisheries for pollock, cod and some flatfish, but inthe hook and line fisheries for cod as well.
Other Species: Catch Trends -- In both the BSAI and GOA, almost, all of the “other” speciescaught are discarded (Tables 25-34). As listed in Tables 45-52, the “other” species categoryconsists primarily of skates and sculpins in the BSAI (with lesser amounts of grenadiers,
1 Beginning in January 1993, Pacific salmon bycatches have been retained in the BSAIgroundfish trawl fisheries under an experimental program whereby it is processed anddelivered to agencies which distribute food to the needy through food bank programs.
2 Applying average weights of 4.3 kg/chinook salmon (Oncorhynchus tshawytscha),2.8 kg/other salmon, 1.6 kg/red king crab (Paralithodes camtschaticus), 1.1 kg/other kingcrab, 0.3 kg/bairdi Tanner crab (Chionoecetes bairdi), and 0.1 kg/other Tanner crab in BSAIto numbers caught in Table 39; 1994 NMFS observer data.
3 Applying average weights of 3.6 kg/chinook salmon, 3.2 kg/other salmon, 1.4kg/red king crab, 0.2 kg/other king crab, 0.4 kg/bairdi Tanner crab, and 0.6 kg/other Tannercrab in GOA to numbers caught in Table 44; 1994 NMFS observer data.
9
squid, octopus, and smelts), while in the GOA, grenadiers have been the principal “other”species caught followed by skates and sculpins. The total “other” species catches listed inTables 45-52 do not match those in Tables 5-34 because they were not computed in the samemanner. The data in Tables 5-34 represent the blend estimates of total “other” speciescatches, which are not broken out by species or species groups. The observer data in Tables45-52 were obtained by looking specifically at catch rates of individual species or speciesgroups, and multiplying the observed rate per target species catch by the target species catch.
In the BSAI, annual blend estimates and expanded observer estimates of other species catcheswere similar, both varying between about 16,000-33,000 t for 1990-93. Squid was caughtprimarily by the pelagic pollock trawl fishery, octopuses by the bottom pollock and codfisheries, smelts by the yellowfin sole trawl fishery, grenadiers by the hook and line fisheriesfor sablefish and Greenland turbot (Reinhardtius hippoglossoides), and skates and sculpins byalmost every fishery, particularly those using trawls, in the BSAI This fairly close agreementbetween the two data sets may reflect the relatively high rate of observer coverage on theBSAI fishing fleet.
In the GOA, blend estimates were always less than the expanded observer estimates of “other”species catches: in 1992 and 1993 the blend estimate was considerably less than one-half theexpanded observer estimate. Based on the data in Tables 49-52 and 10-14, almost all of thedifferences between the two totals is due to sablefish hook and line fishery bycatches ofgrenadiers. In 1990-93, the blend estimates of total “other” species bycatches by the GOAsablefish fishery (almost all hook and line) totaled 688 t, 709 t, 815 t, and 1,109 t,respectively. By contrast, the expanded observer estimates of grenadier bycatch alone by theGOA sablefish fishery for these years were 8,386 t, 4,724 t, 11,843 t, and 15,522 t,respectively. Apparently, there may be under-reporting of the catch of other species in theGOA by unobserved vessels. The GOA sablefish fishery has had one of the lowest rates ofobserver coverage (about 10% or less of the target species catch has been observed) in theNorth Pacific because of the large number of vessels that are either exempt from observercoverage ( < 65 ft in length) or are only required to have an observer on 30% of their fishingdays (65-125 ft in length). Thus, the expansion factors to correct “other” species catches forthat caught by the unobserved portion of the fleet were large (10 or larger) for the GOAsablefish fishery, which could have introduced an upward bias in the “other” species catchestimates. However, using these expanded estimates, grenadier bycatch by the sablefish hookand line fishery has accounted for 50% or more of the estimated "other” species bycatch in theGOA in 1990-93. For the remaining “other” species; squid has been caught principally by therockfish and pollock trawl fisheries; octopus by the cod pot fishery; smelts by trawl fisheriesfor rockfish and pollock; and skates, sharks, and sculpins by a wide variety of primarily-trawlfisheries.
10
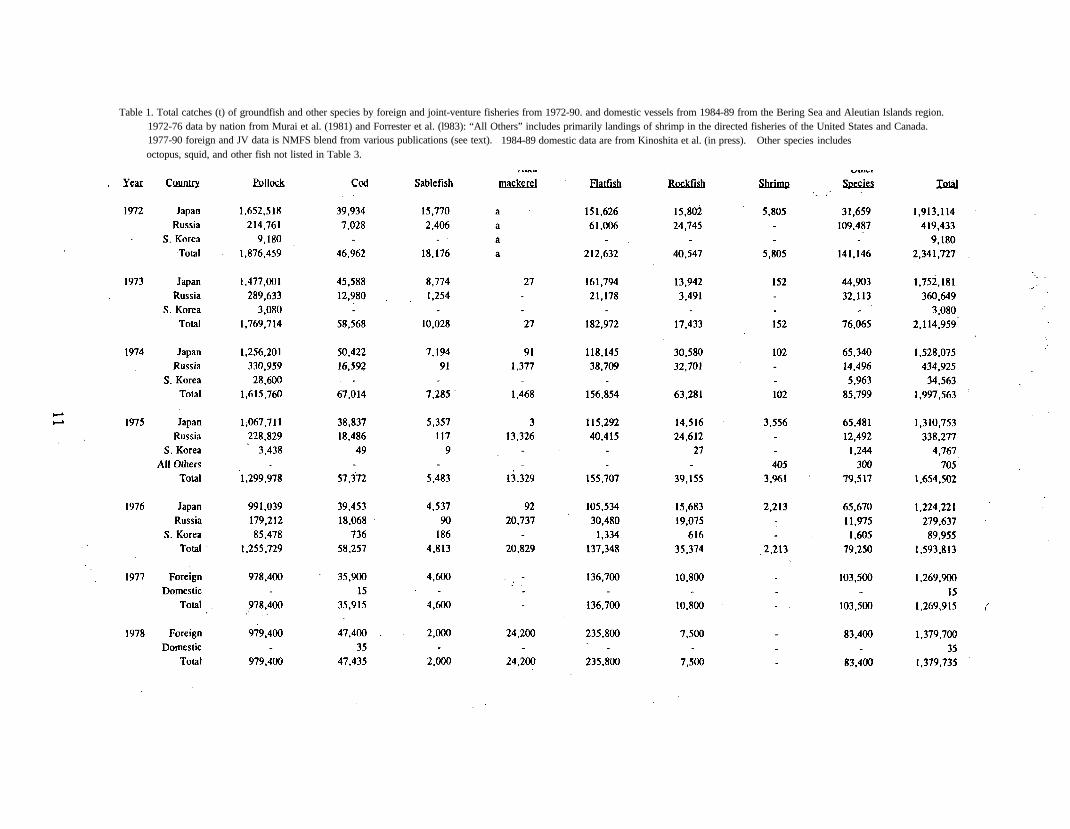
Table 1. Total catches (t) of groundfish and other species by foreign and joint-venture fisheries from 1972-90. and domestic vessels from 1984-89 from the Bering Sea and Aleutian Islands region.1972-76 data by nation from Murai et al. (1981) and Forrester et al. (l983): “All Others” includes primarily landings of shrimp in the directed fisheries of the United States and Canada.1977-90 foreign and JV data is NMFS blend from various publications (see text). 1984-89 domestic data are from Kinoshita et al. (in press). Other species includesoctopus, squid, and other fish not listed in Table 3.
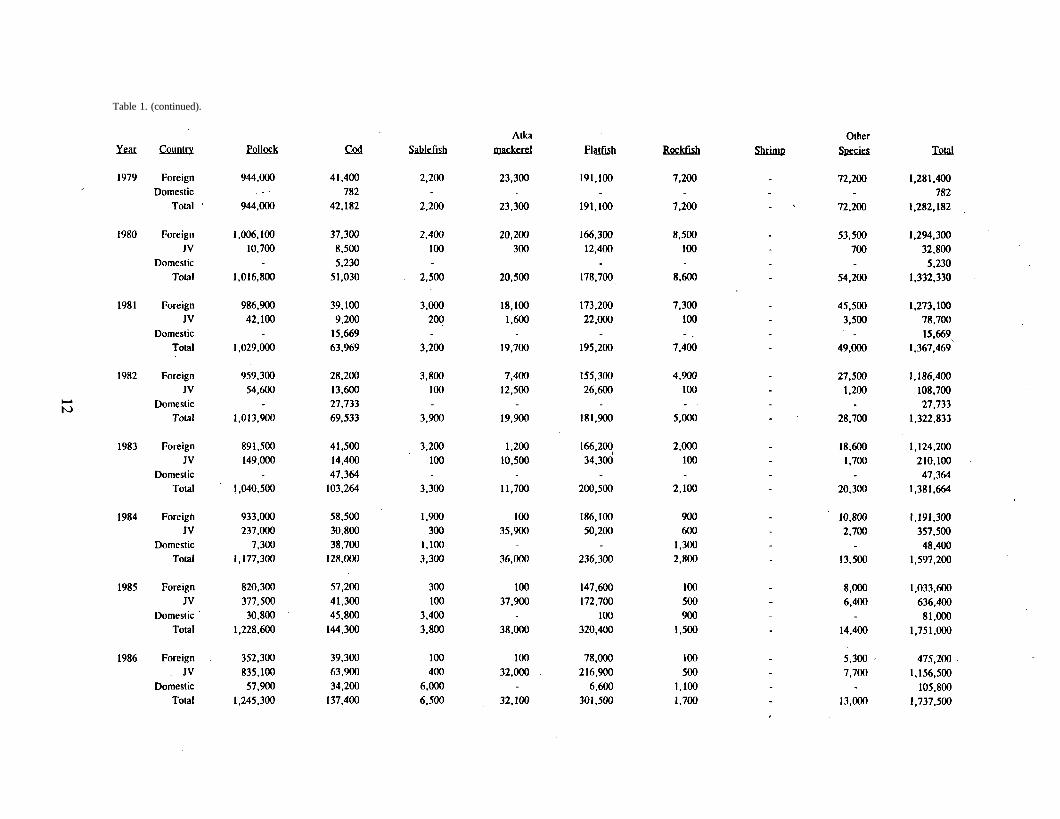
Table 1. (continued).
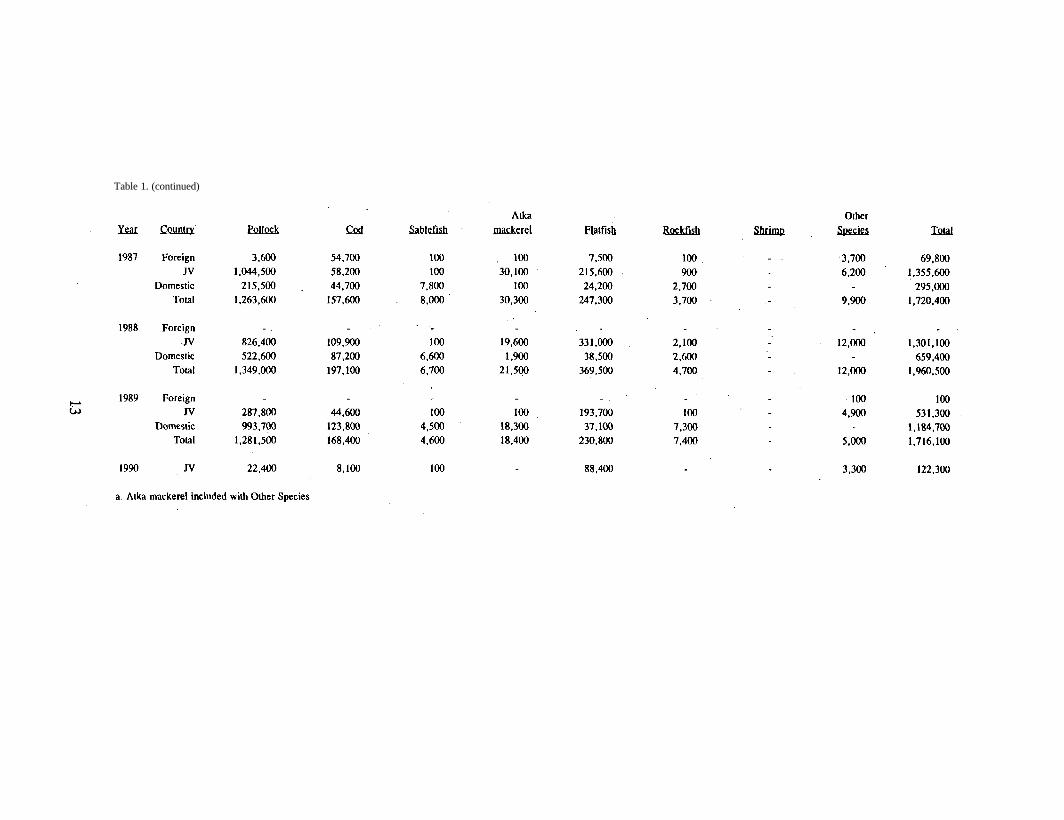
Table 1. (continued)
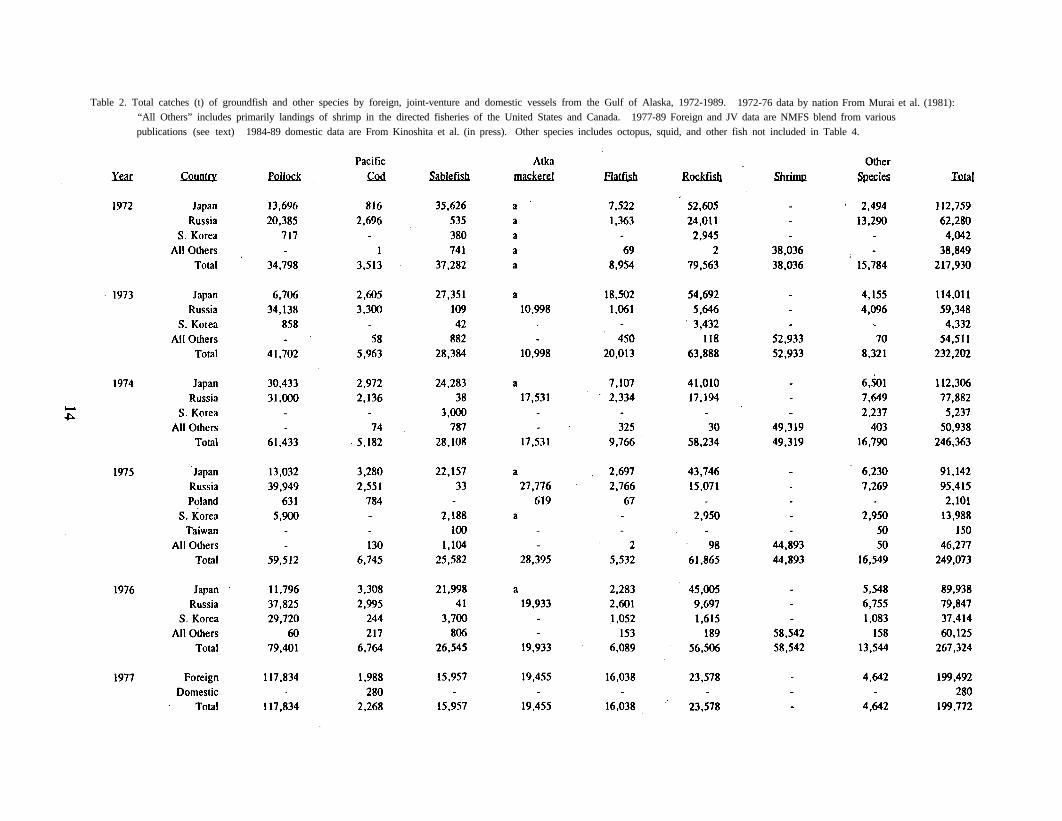
Table 2. Total catches (t) of groundfish and other species by foreign, joint-venture and domestic vessels from the Gulf of Alaska, 1972-1989. 1972-76 data by nation From Murai et al. (1981):“All Others” includes primarily landings of shrimp in the directed fisheries of the United States and Canada. 1977-89 Foreign and JV data are NMFS blend from variouspublications (see text) 1984-89 domestic data are From Kinoshita et al. (in press). Other species includes octopus, squid, and other fish not included in Table 4.
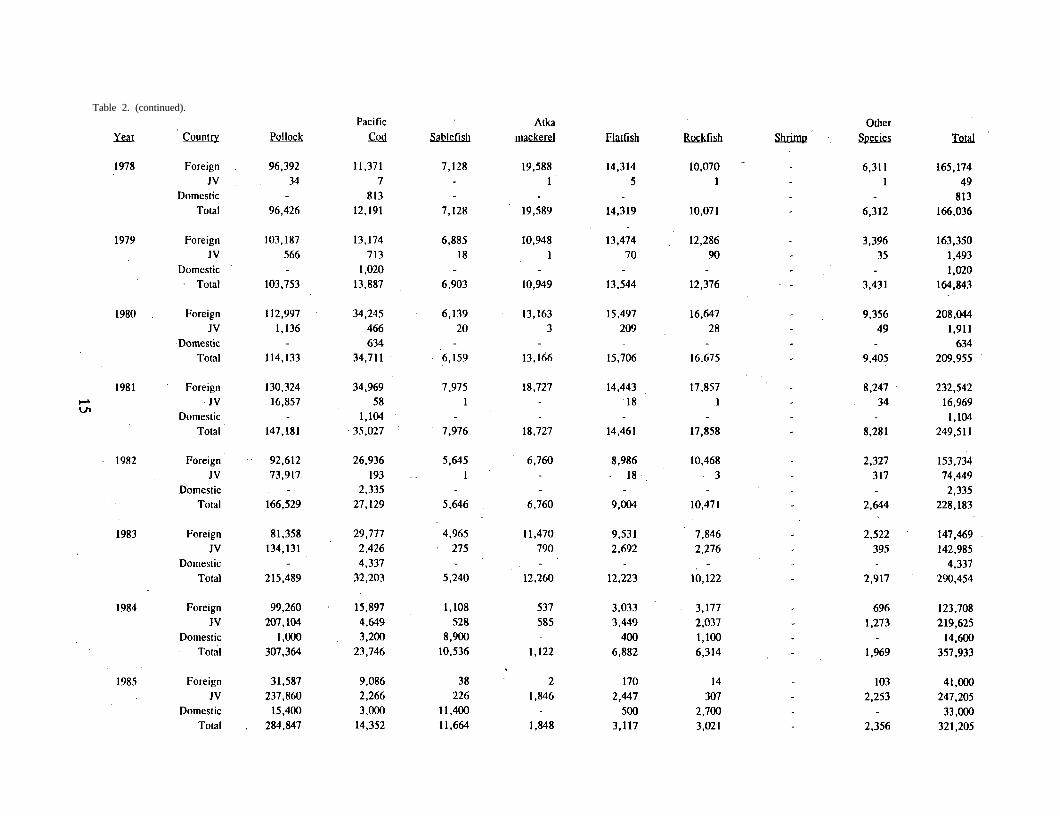
Table 2. (continued).
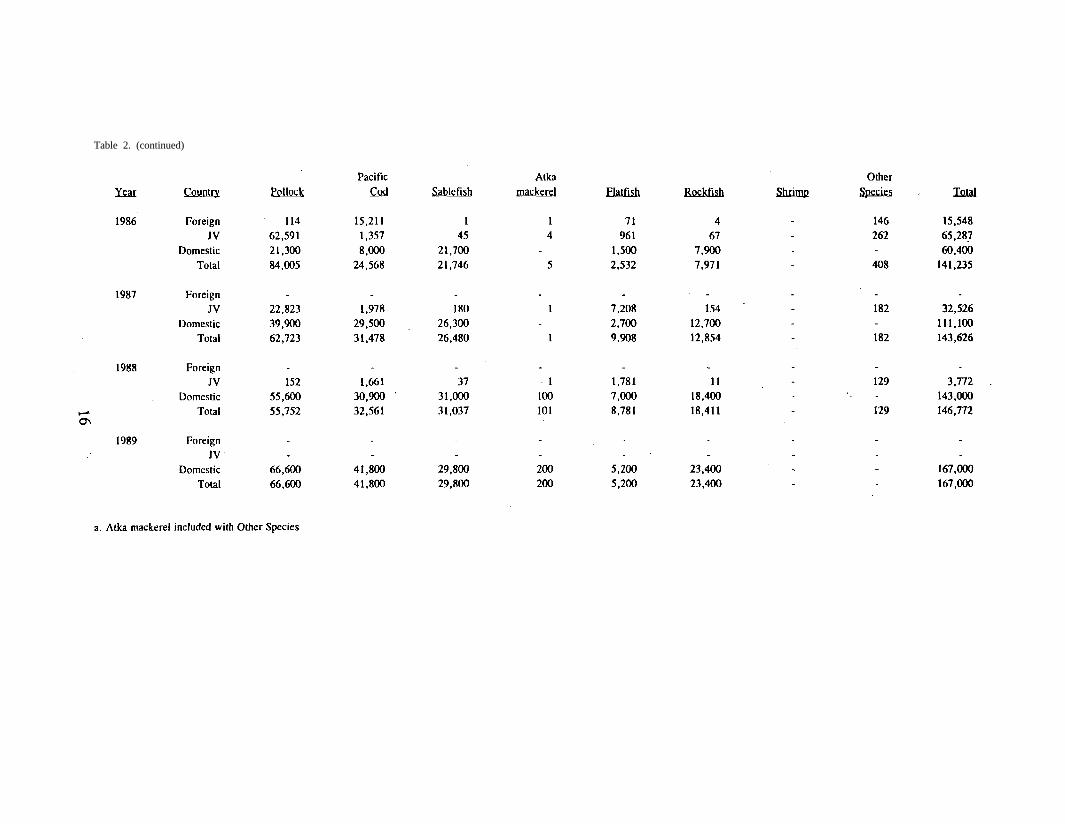
Table 2. (continued)
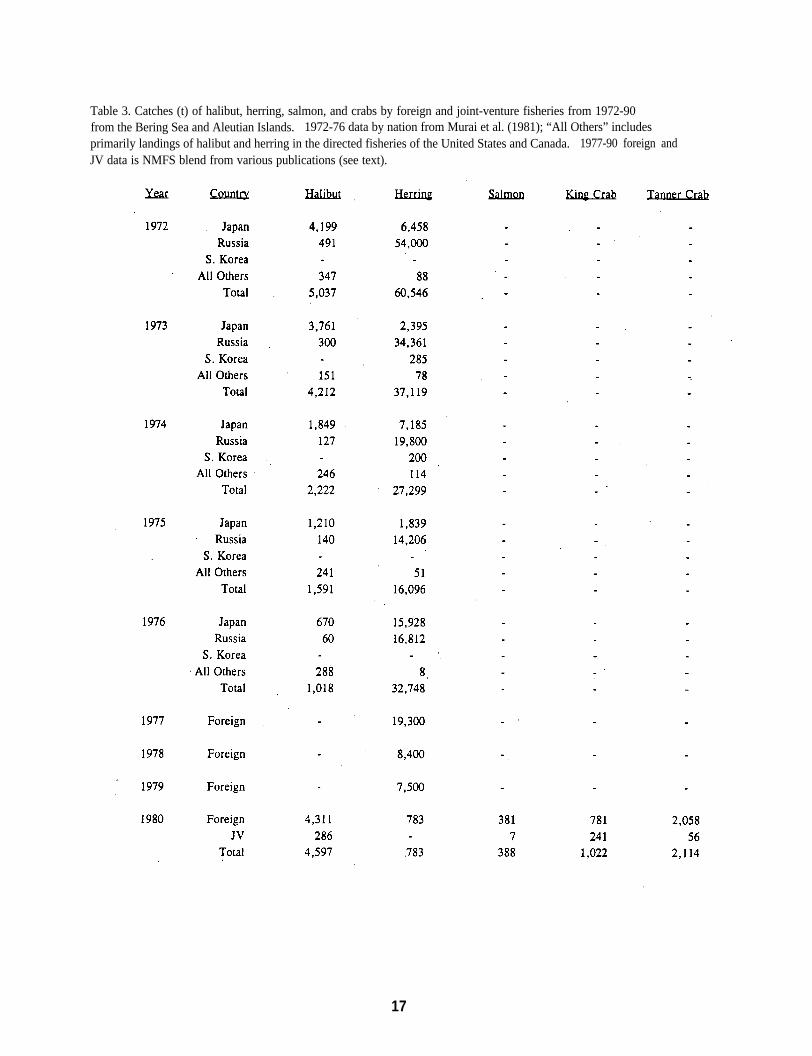
Table 3. Catches (t) of halibut, herring, salmon, and crabs by foreign and joint-venture fisheries from 1972-90from the Bering Sea and Aleutian Islands. 1972-76 data by nation from Murai et al. (1981); “All Others” includesprimarily landings of halibut and herring in the directed fisheries of the United States and Canada. 1977-90 foreign andJV data is NMFS blend from various publications (see text).
17
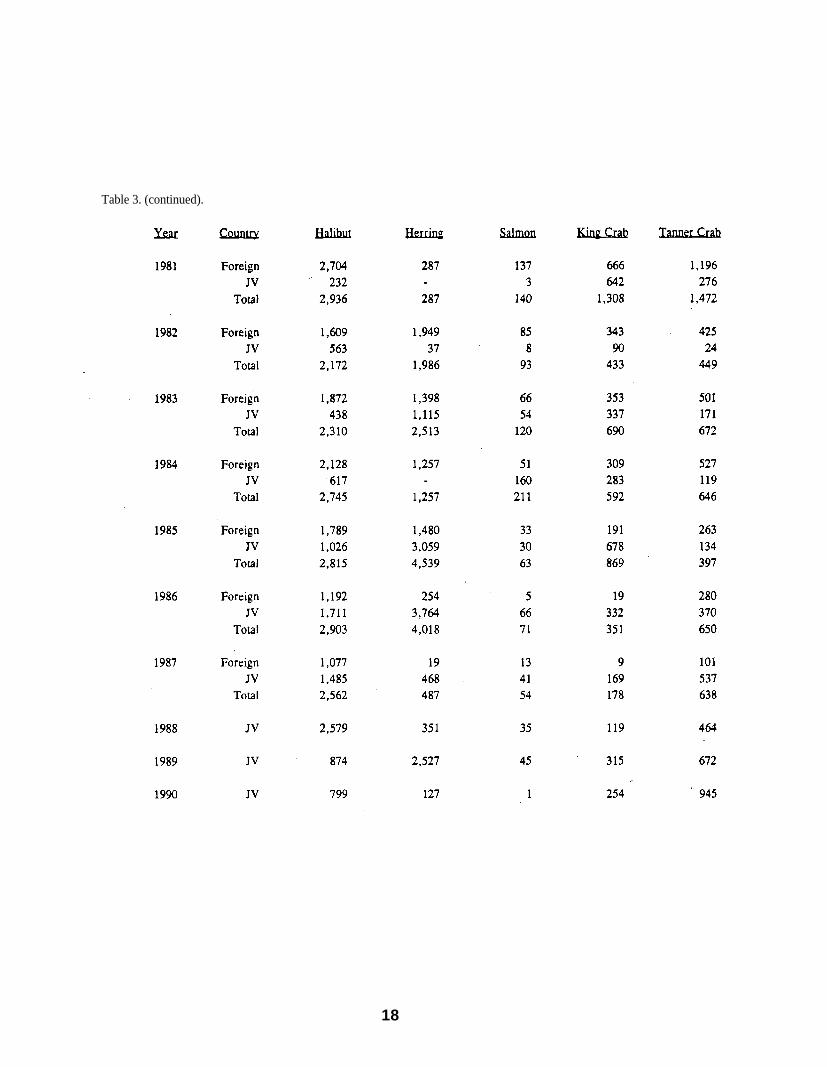
Table 3. (continued).
18
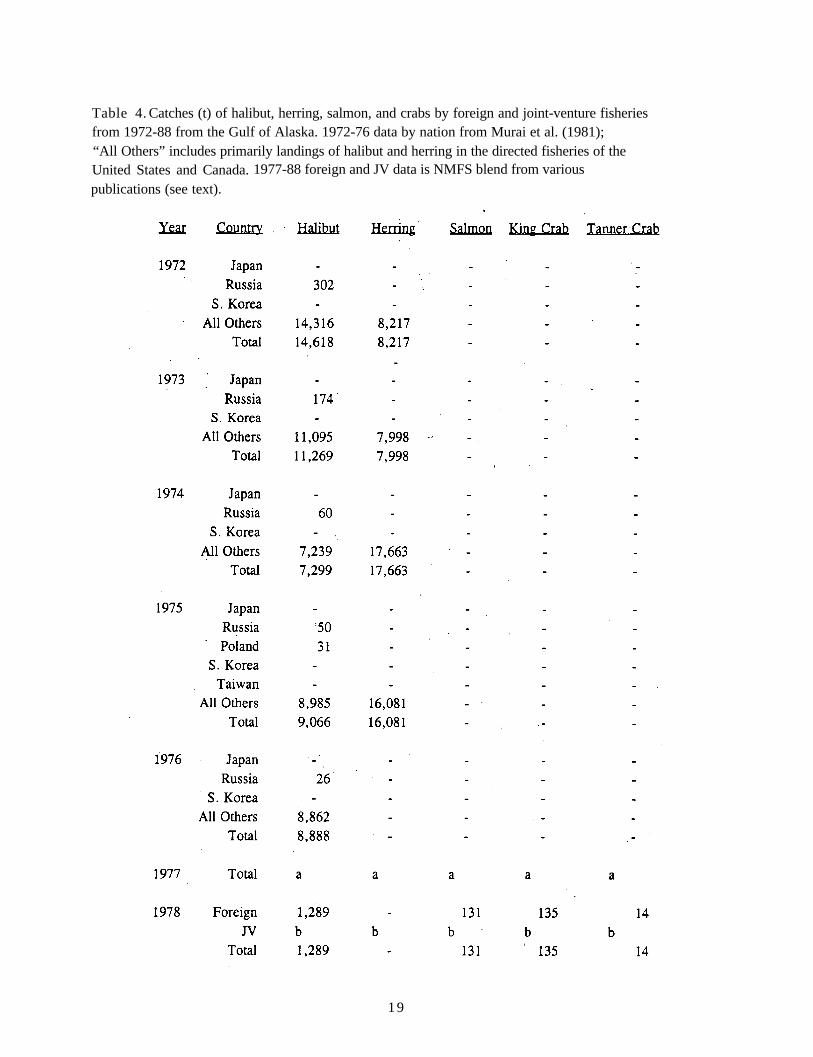
Table 4. Catches (t) of halibut, herring, salmon, and crabs by foreign and joint-venture fisheriesfrom 1972-88 from the Gulf of Alaska. 1972-76 data by nation from Murai et al. (1981);“All Others” includes primarily landings of halibut and herring in the directed fisheries of theUnited States and Canada. 1977-88 foreign and JV data is NMFS blend from variouspublications (see text).
19
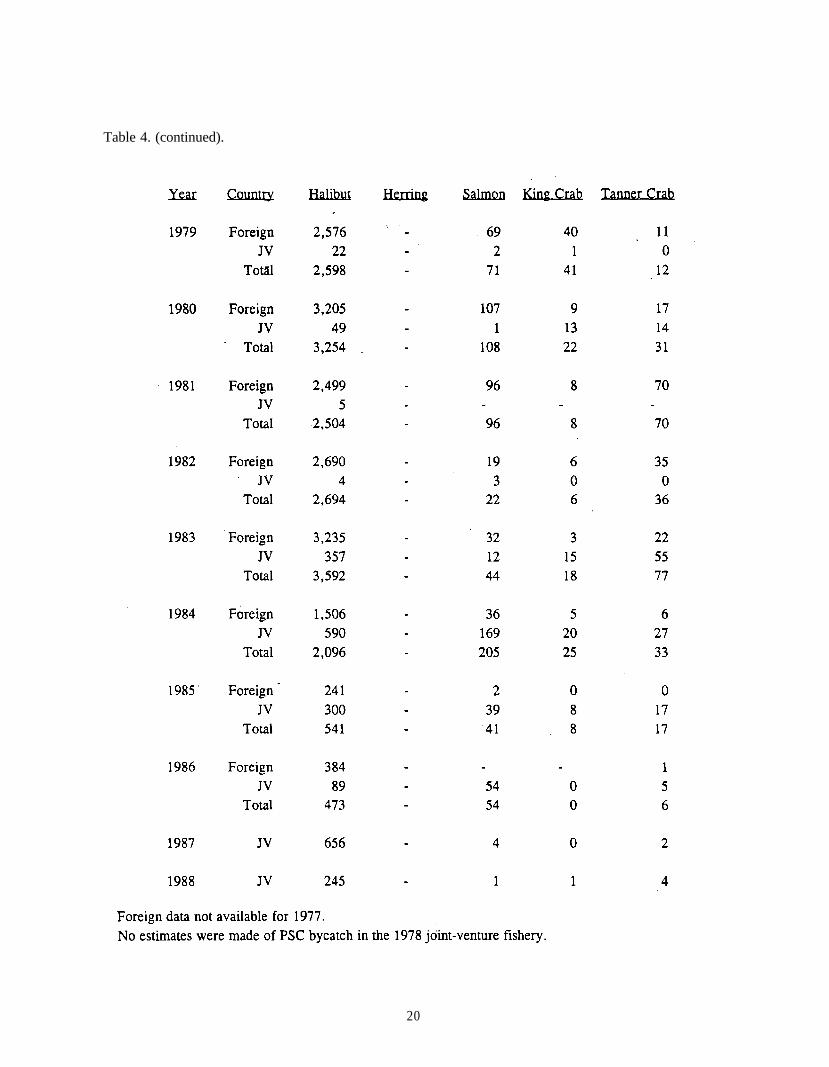
Table 4. (continued).
20
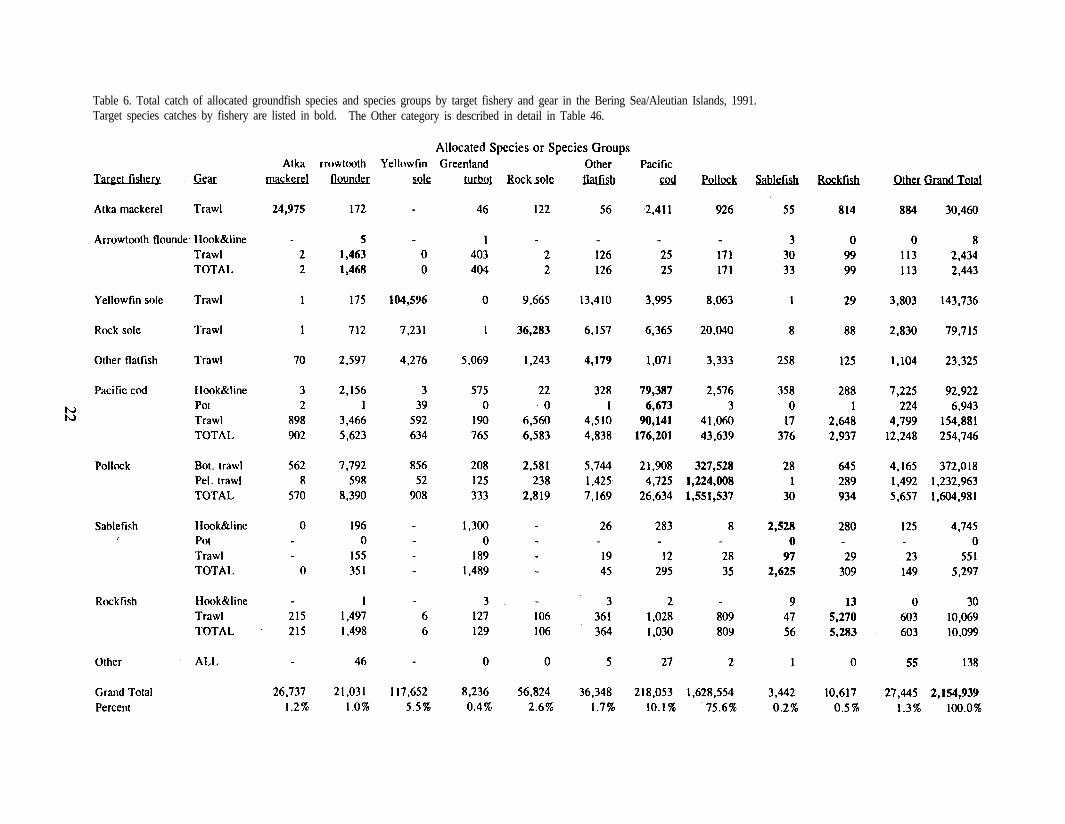
Table 6. Total catch of allocated groundfish species and species groups by target fishery and gear in the Bering Sea/Aleutian Islands, 1991.Target species catches by fishery are listed in bold. The Other category is described in detail in Table 46.
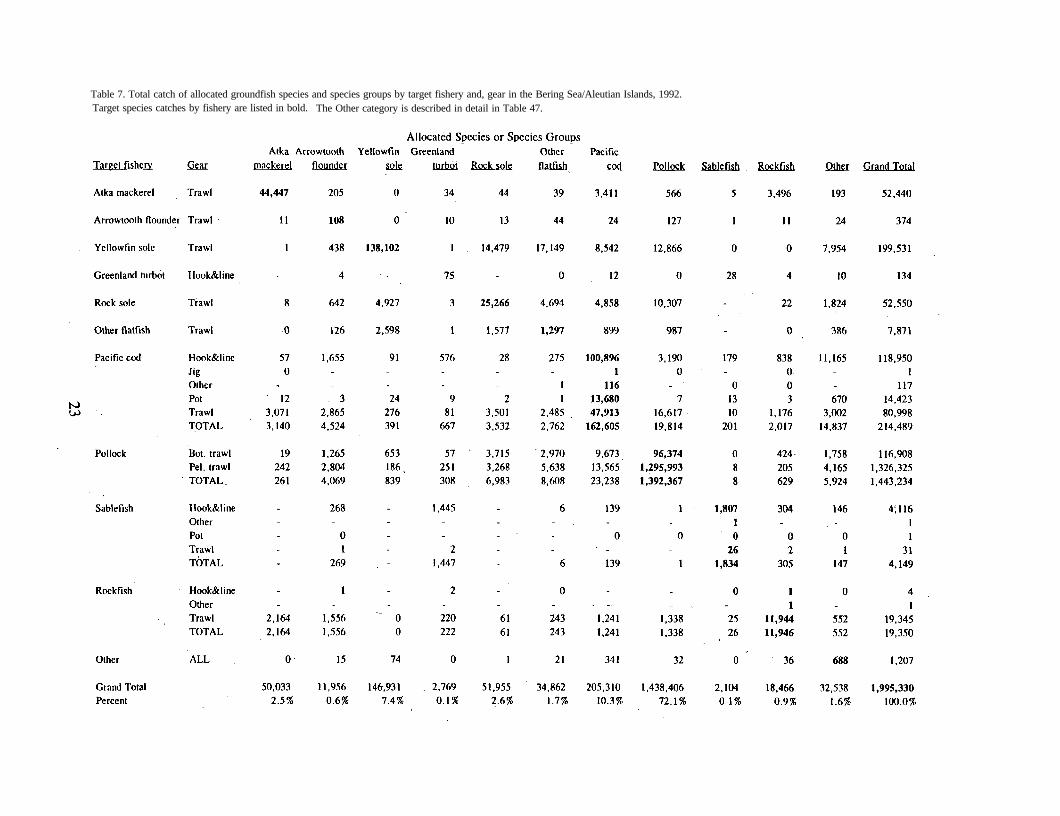
Table 7. Total catch of allocated groundfish species and species groups by target fishery and, gear in the Bering Sea/Aleutian Islands, 1992.Target species catches by fishery are listed in bold. The Other category is described in detail in Table 47.
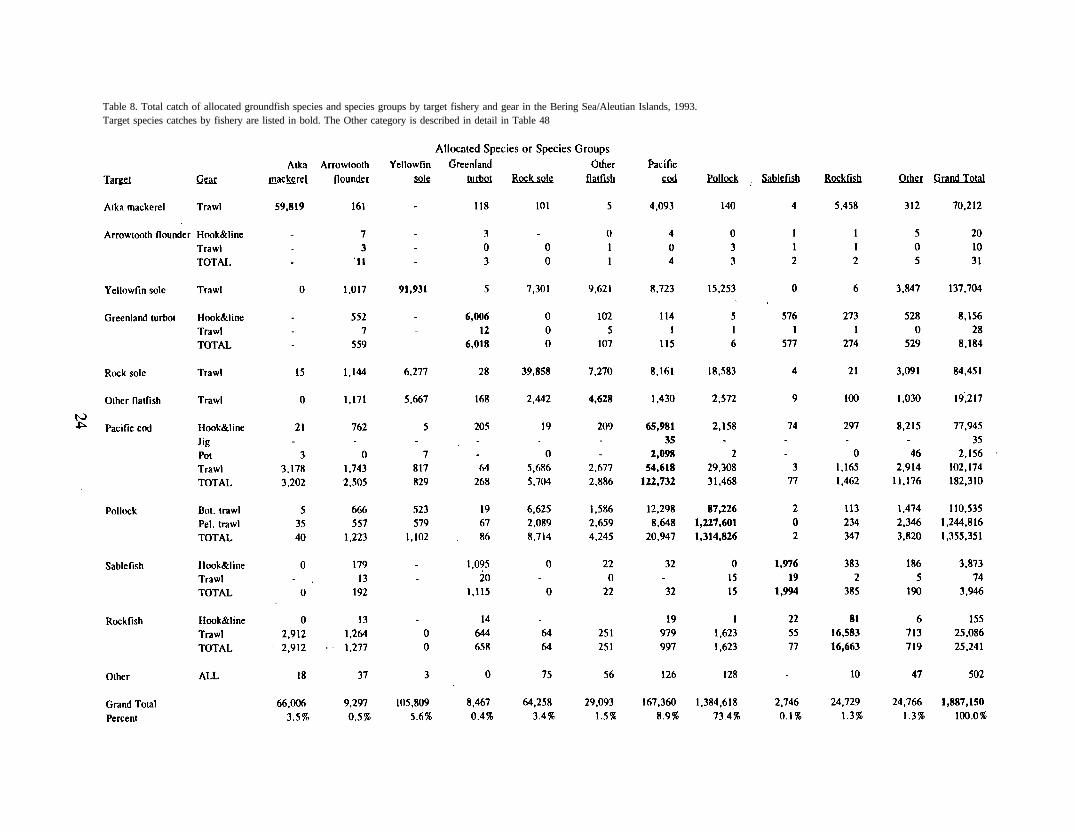
Table 8. Total catch of allocated groundfish species and species groups by target fishery and gear in the Bering Sea/Aleutian Islands, 1993.Target species catches by fishery are listed in bold. The Other category is described in detail in Table 48
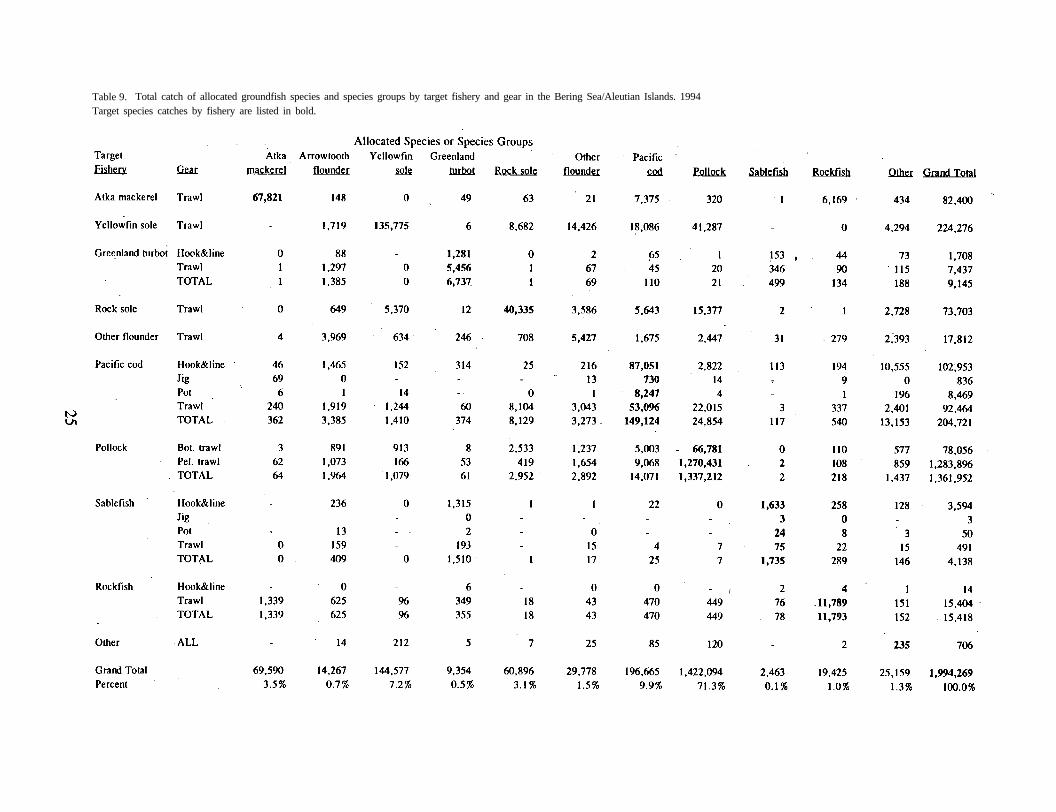
Table 9. Total catch of allocated groundfish species and species groups by target fishery and gear in the Bering Sea/Aleutian Islands. 1994Target species catches by fishery are listed in bold.
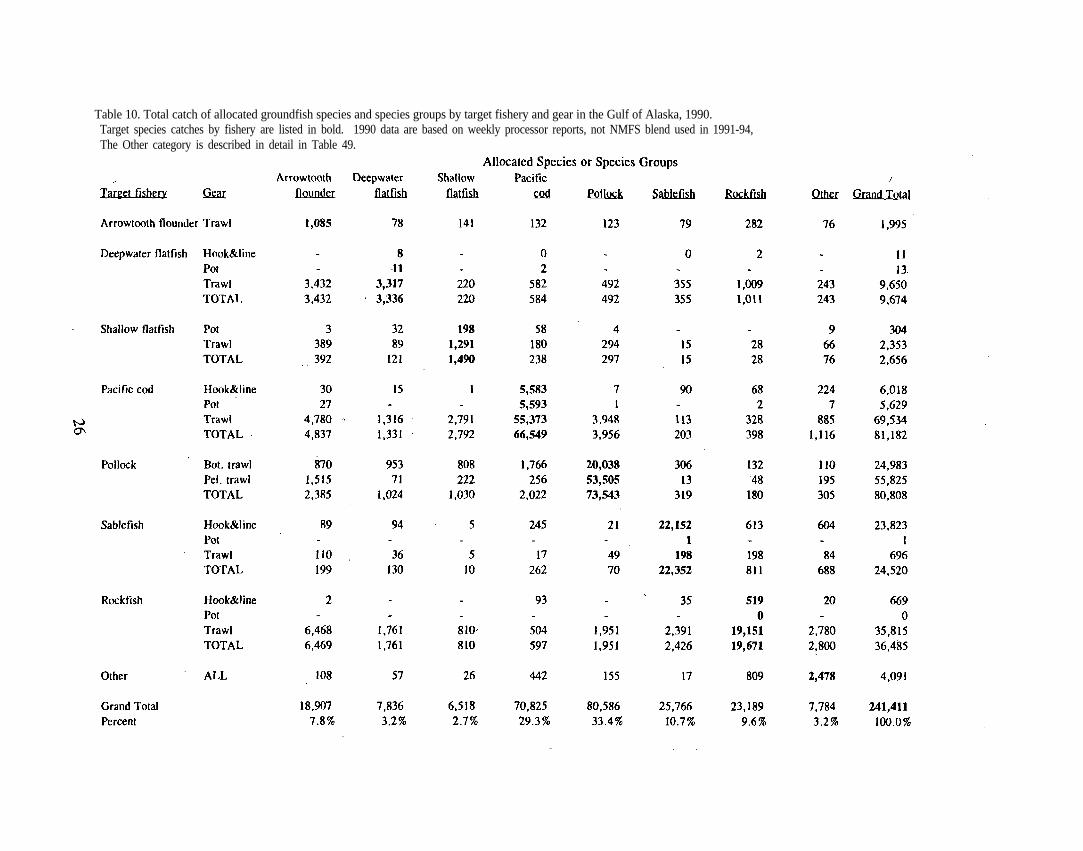
Table 10. Total catch of allocated groundfish species and species groups by target fishery and gear in the Gulf of Alaska, 1990.Target species catches by fishery are listed in bold. 1990 data are based on weekly processor reports, not NMFS blend used in 1991-94,The Other category is described in detail in Table 49.
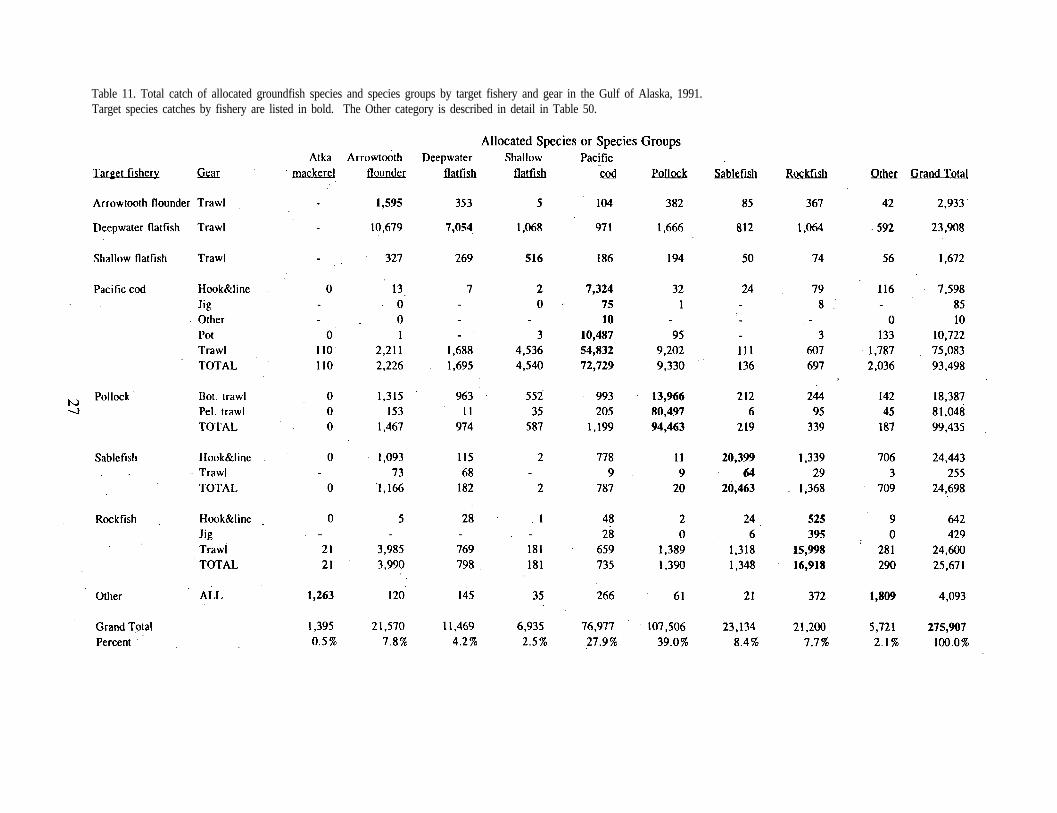
Table 11. Total catch of allocated groundfish species and species groups by target fishery and gear in the Gulf of Alaska, 1991.Target species catches by fishery are listed in bold. The Other category is described in detail in Table 50.
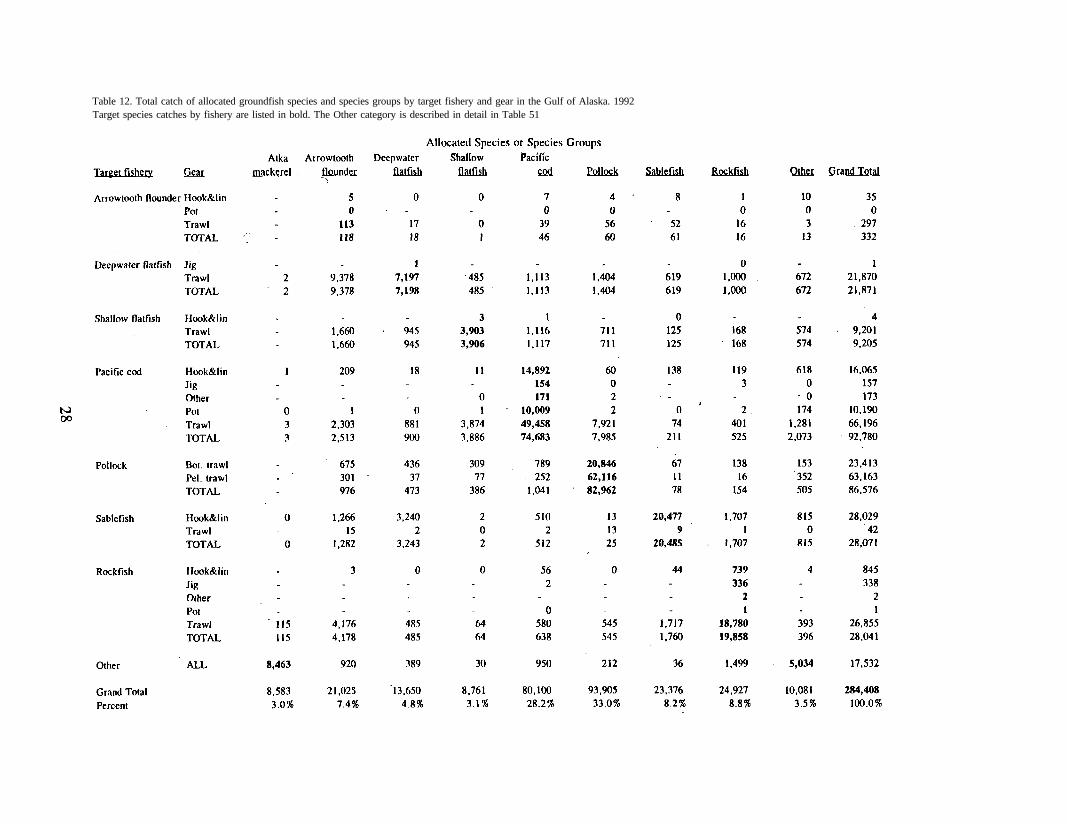
Table 12. Total catch of allocated groundfish species and species groups by target fishery and gear in the Gulf of Alaska. 1992Target species catches by fishery are listed in bold. The Other category is described in detail in Table 51
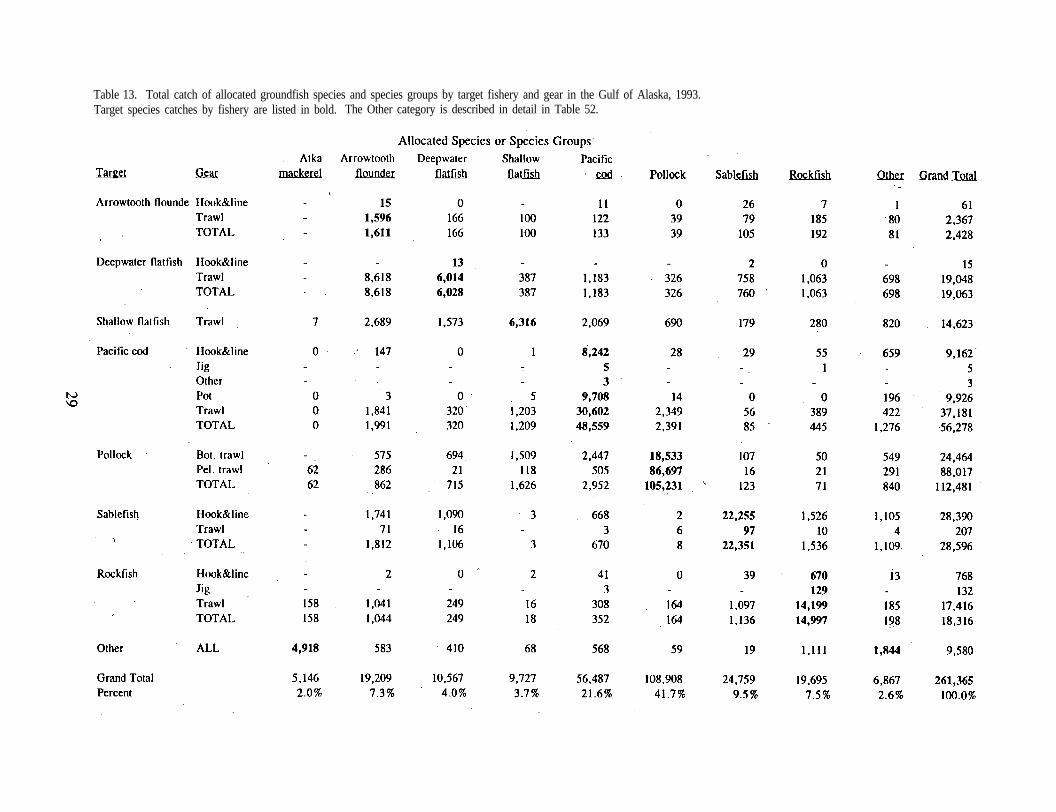
Table 13. Total catch of allocated groundfish species and species groups by target fishery and gear in the Gulf of Alaska, 1993.Target species catches by fishery are listed in bold. The Other category is described in detail in Table 52.
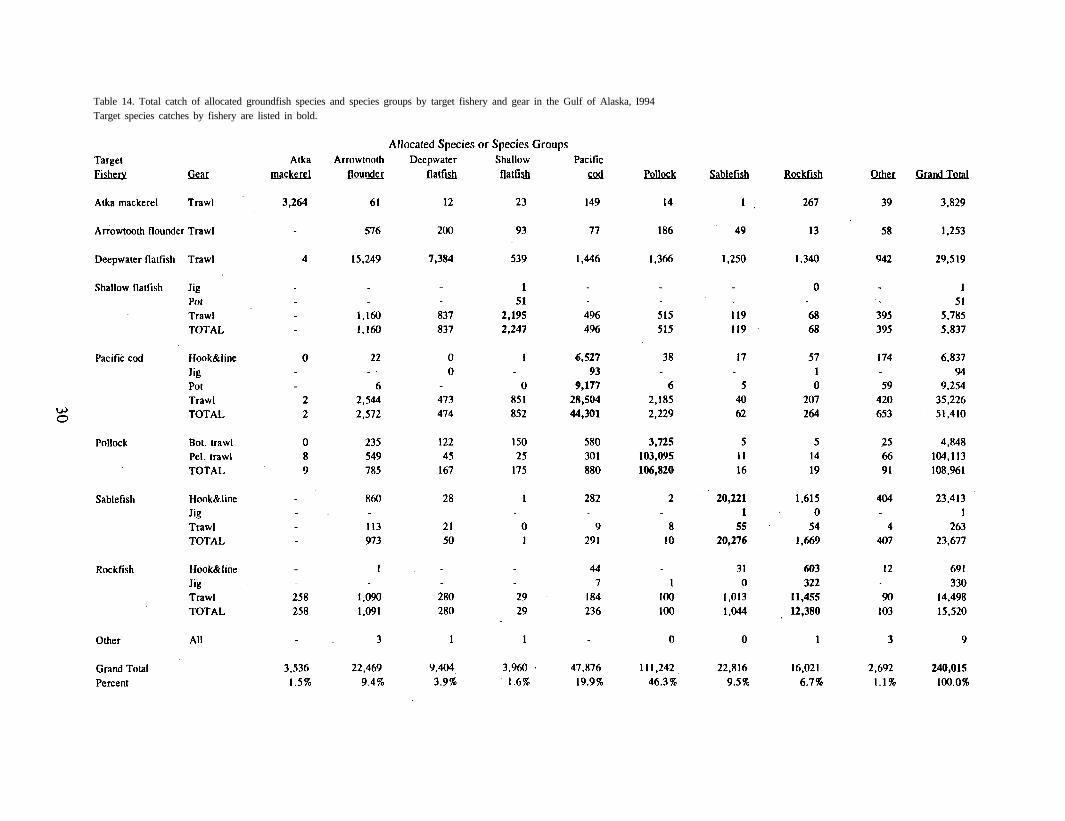
Table 14. Total catch of allocated groundfish species and species groups by target fishery and gear in the Gulf of Alaska, I994Target species catches by fishery are listed in bold.
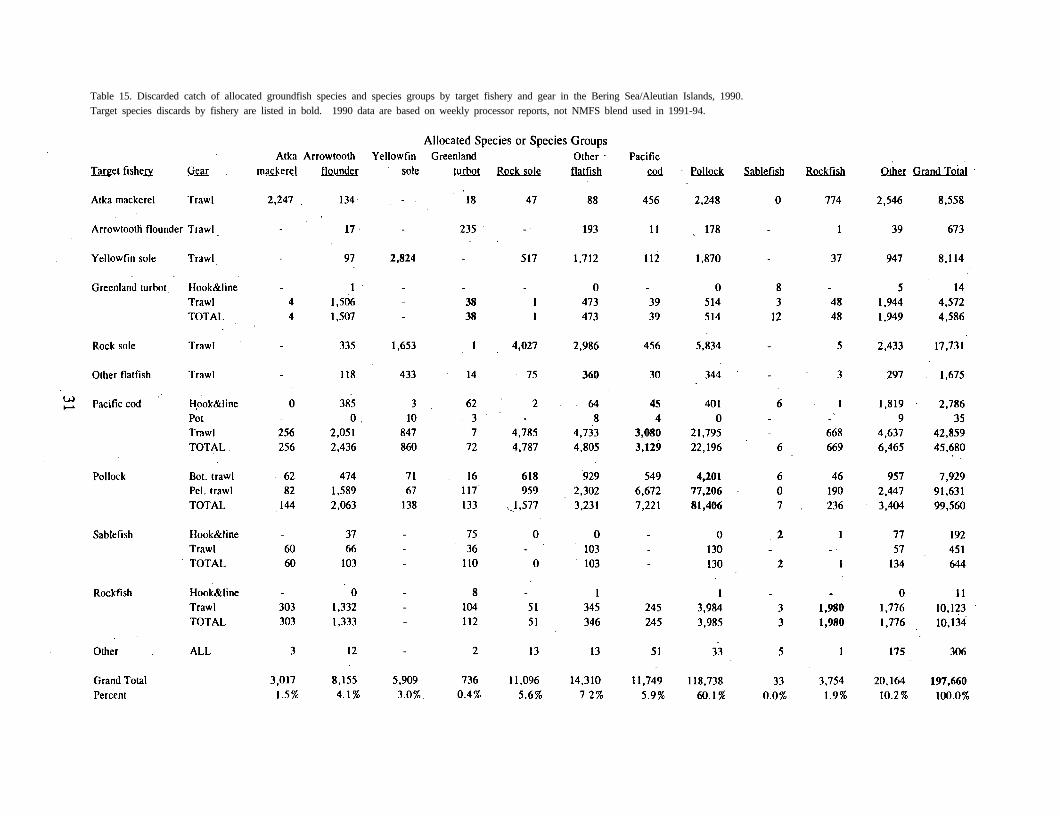
Table 15. Discarded catch of allocated groundfish species and species groups by target fishery and gear in the Bering Sea/Aleutian Islands, 1990.Target species discards by fishery are listed in bold. 1990 data are based on weekly processor reports, not NMFS blend used in 1991-94.
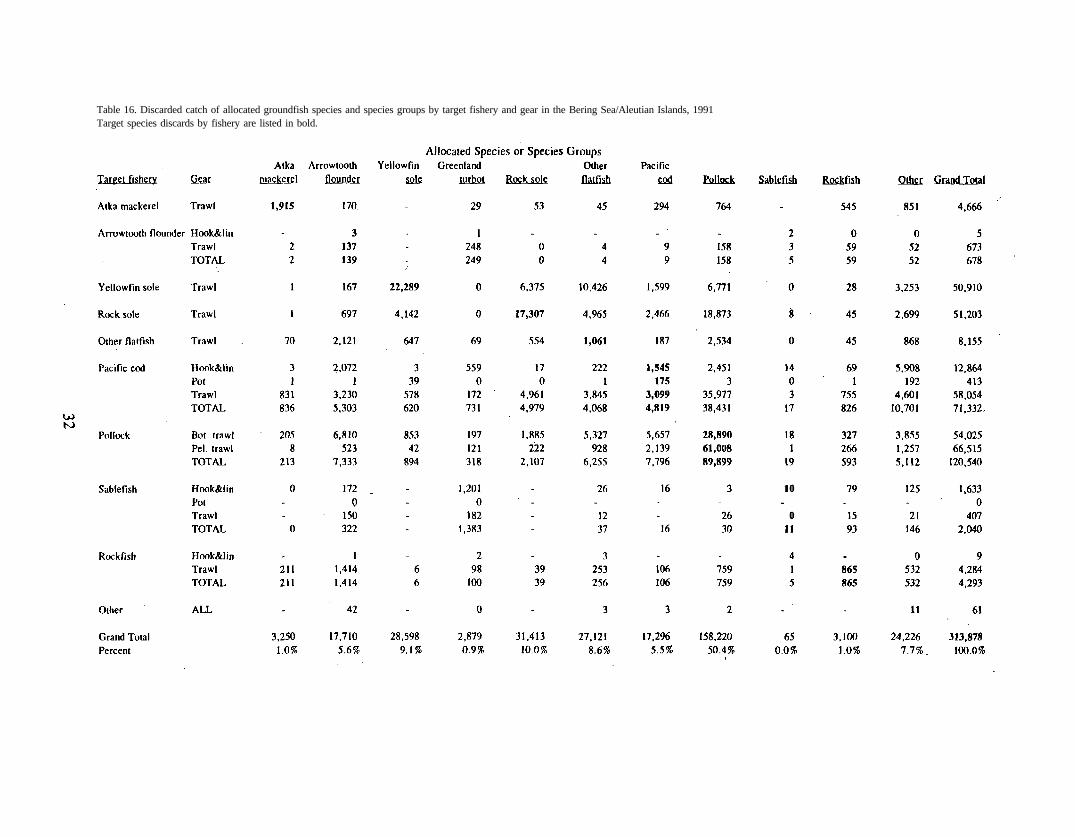
Table 16. Discarded catch of allocated groundfish species and species groups by target fishery and gear in the Bering Sea/Aleutian Islands, 1991Target species discards by fishery are listed in bold.
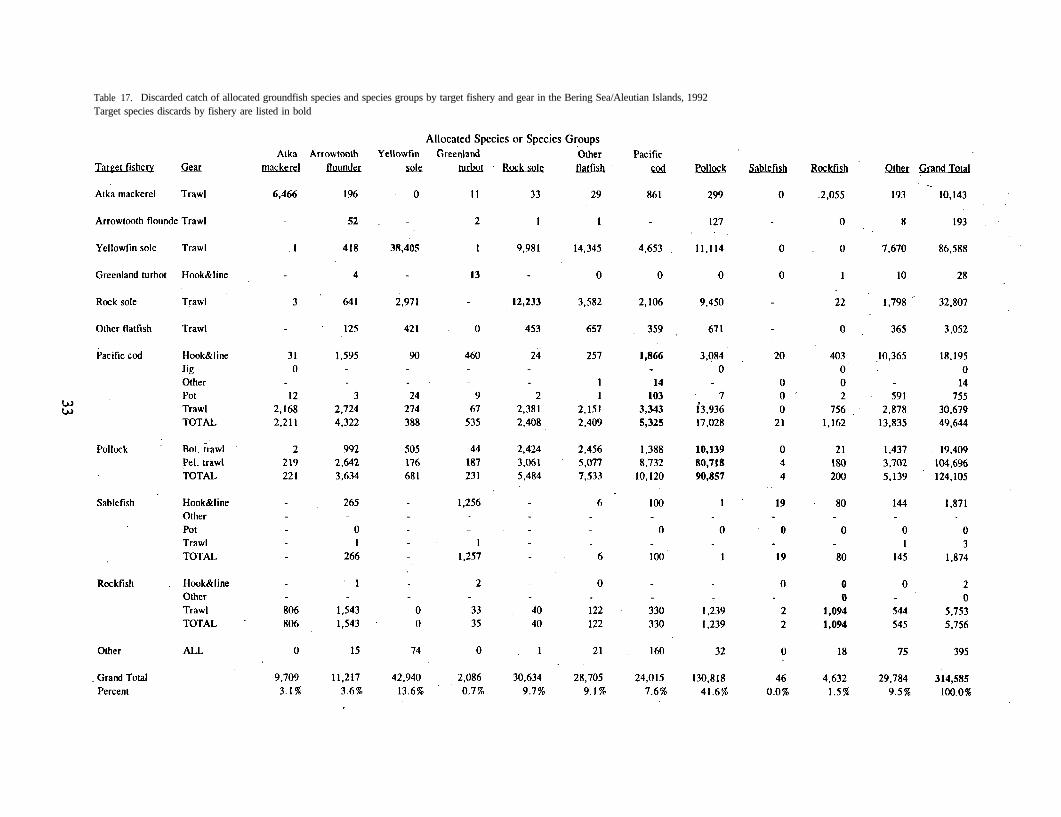
Table 17. Discarded catch of allocated groundfish species and species groups by target fishery and gear in the Bering Sea/Aleutian Islands, 1992Target species discards by fishery are listed in bold
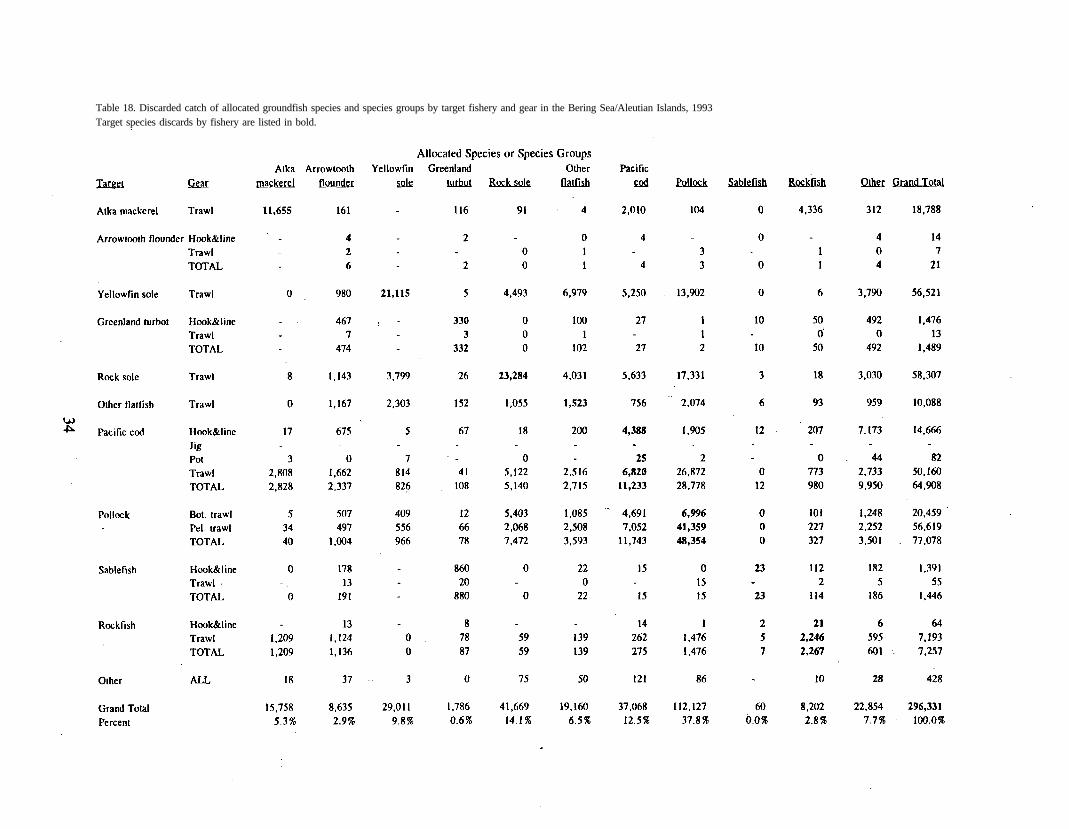
Table 18. Discarded catch of allocated groundfish species and species groups by target fishery and gear in the Bering Sea/Aleutian Islands, 1993Target species discards by fishery are listed in bold.
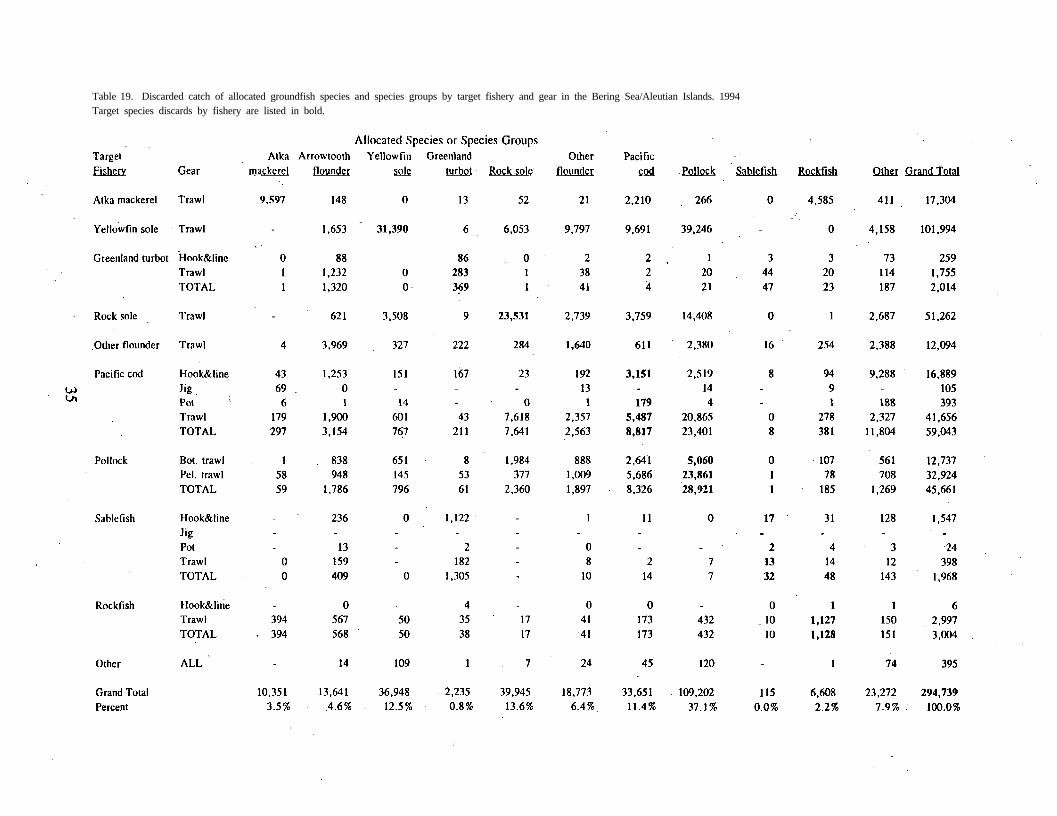
Table 19. Discarded catch of allocated groundfish species and species groups by target fishery and gear in the Bering Sea/Aleutian Islands. 1994Target species discards by fishery are listed in bold.
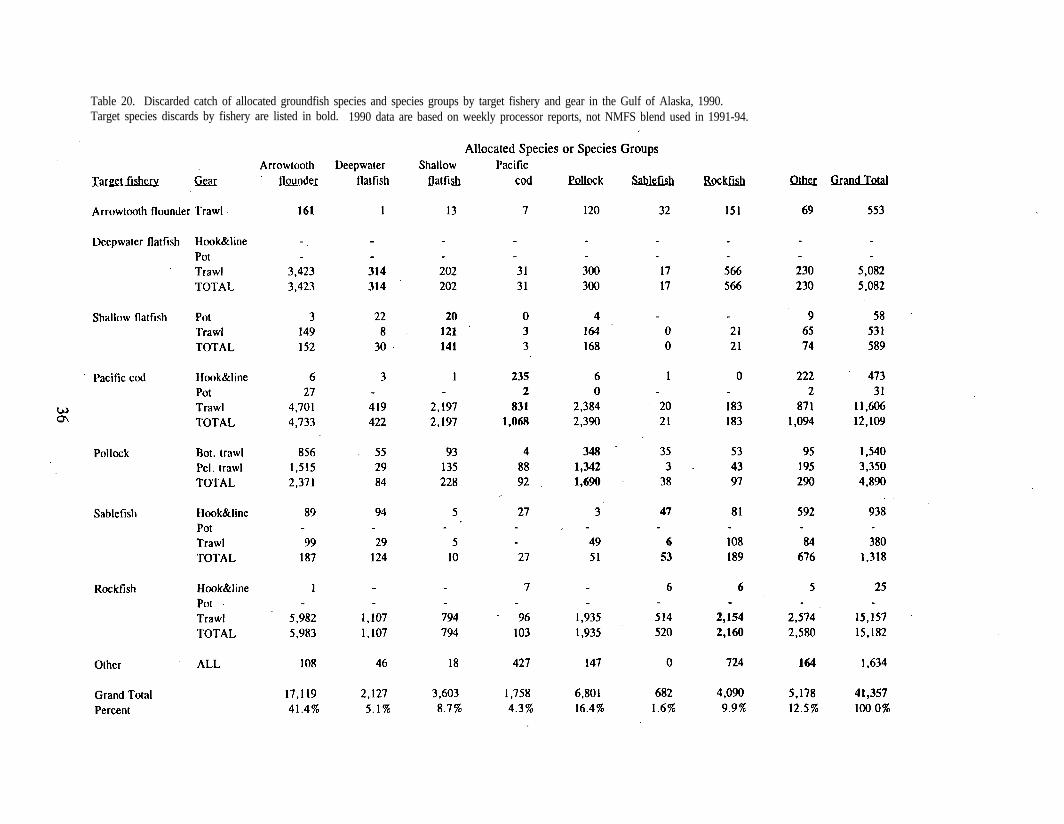
Table 20. Discarded catch of allocated groundfish species and species groups by target fishery and gear in the Gulf of Alaska, 1990.Target species discards by fishery are listed in bold. 1990 data are based on weekly processor reports, not NMFS blend used in 1991-94.
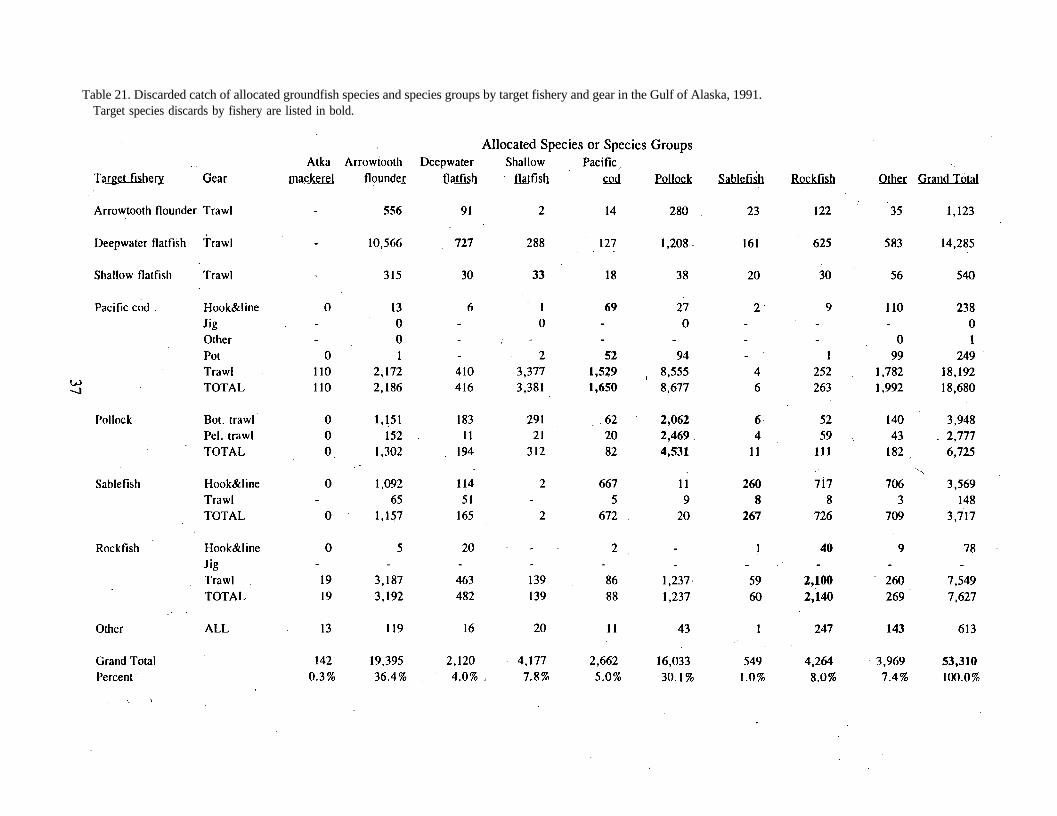
Table 21. Discarded catch of allocated groundfish species and species groups by target fishery and gear in the Gulf of Alaska, 1991.Target species discards by fishery are listed in bold.
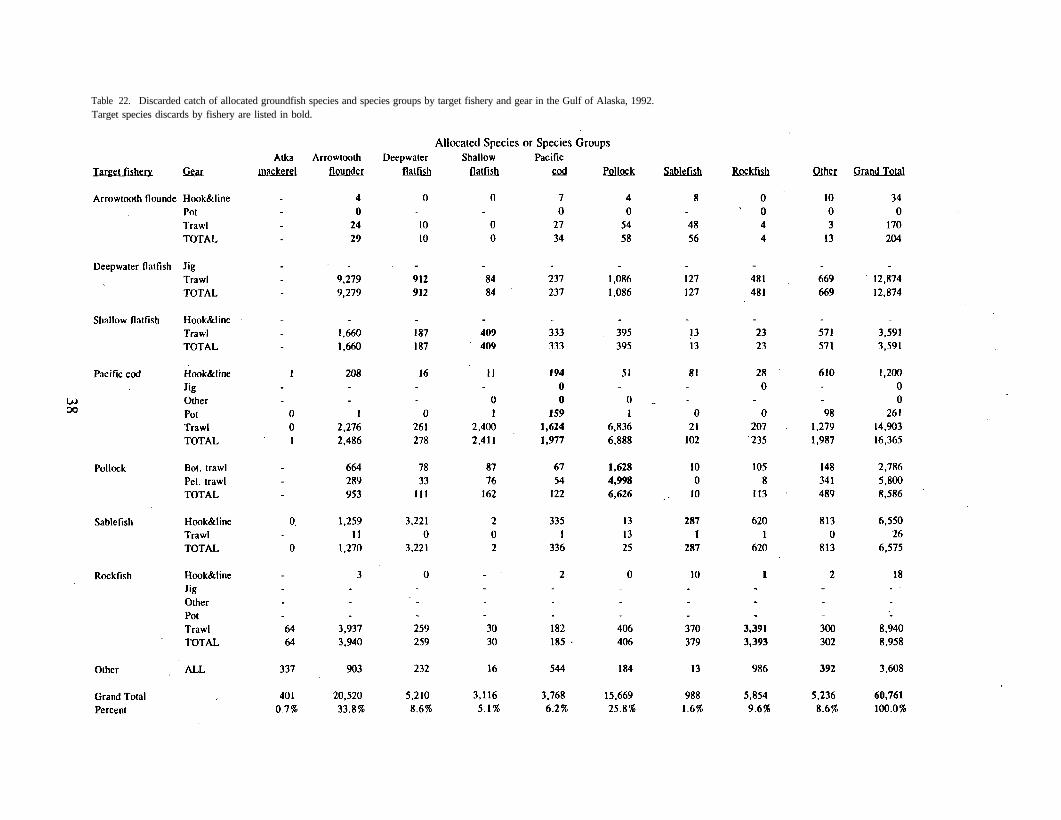
Table 22. Discarded catch of allocated groundfish species and species groups by target fishery and gear in the Gulf of Alaska, 1992.Target species discards by fishery are listed in bold.
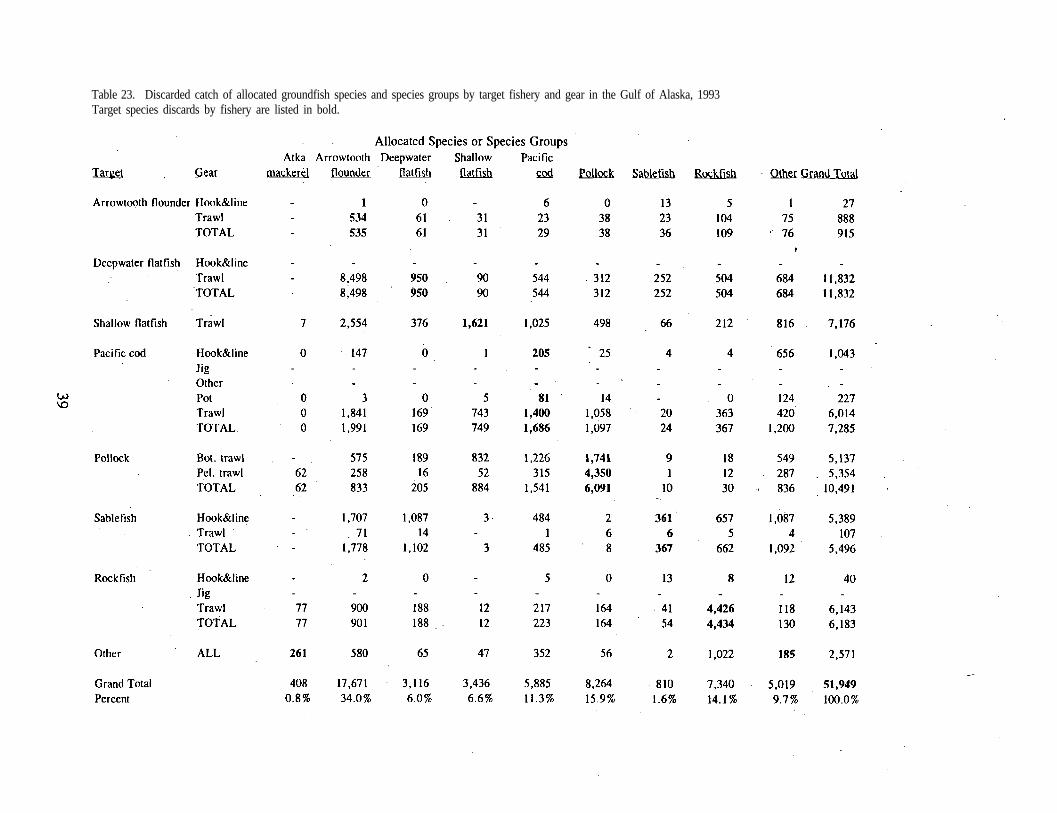
Table 23. Discarded catch of allocated groundfish species and species groups by target fishery and gear in the Gulf of Alaska, 1993Target species discards by fishery are listed in bold.
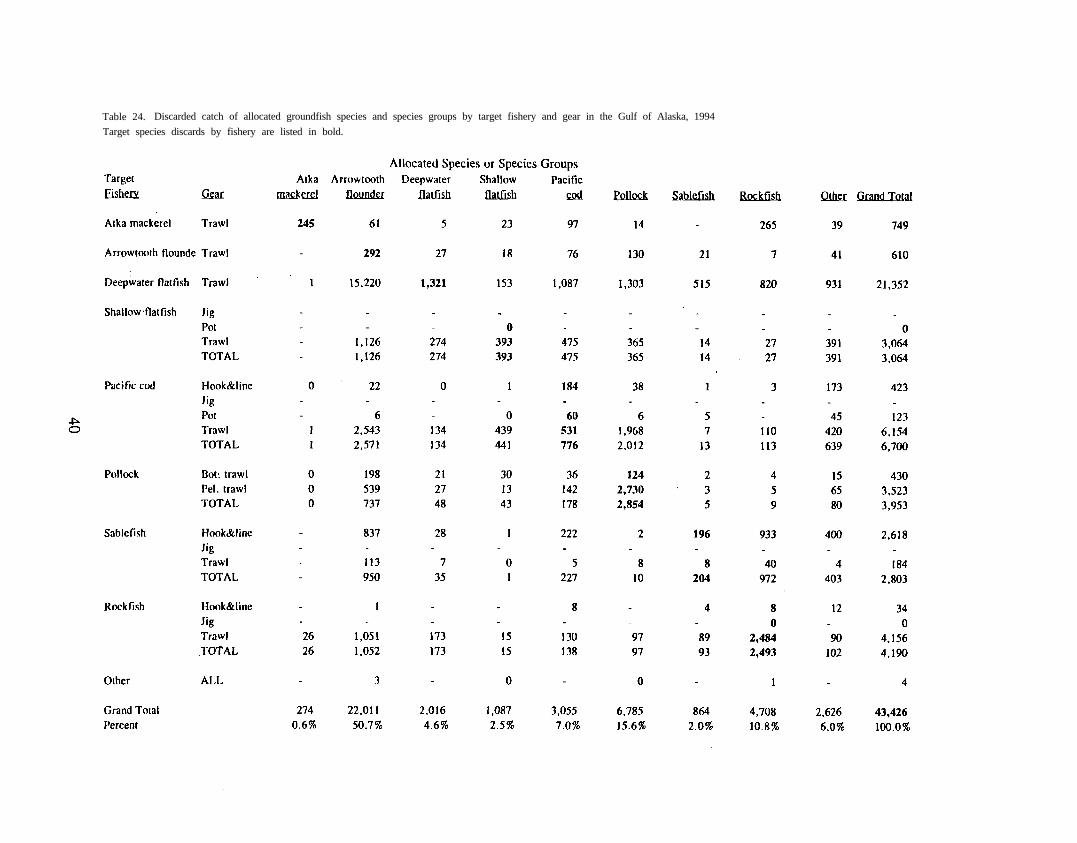
Table 24. Discarded catch of allocated groundfish species and species groups by target fishery and gear in the Gulf of Alaska, 1994
Target species discards by fishery are listed in bold.
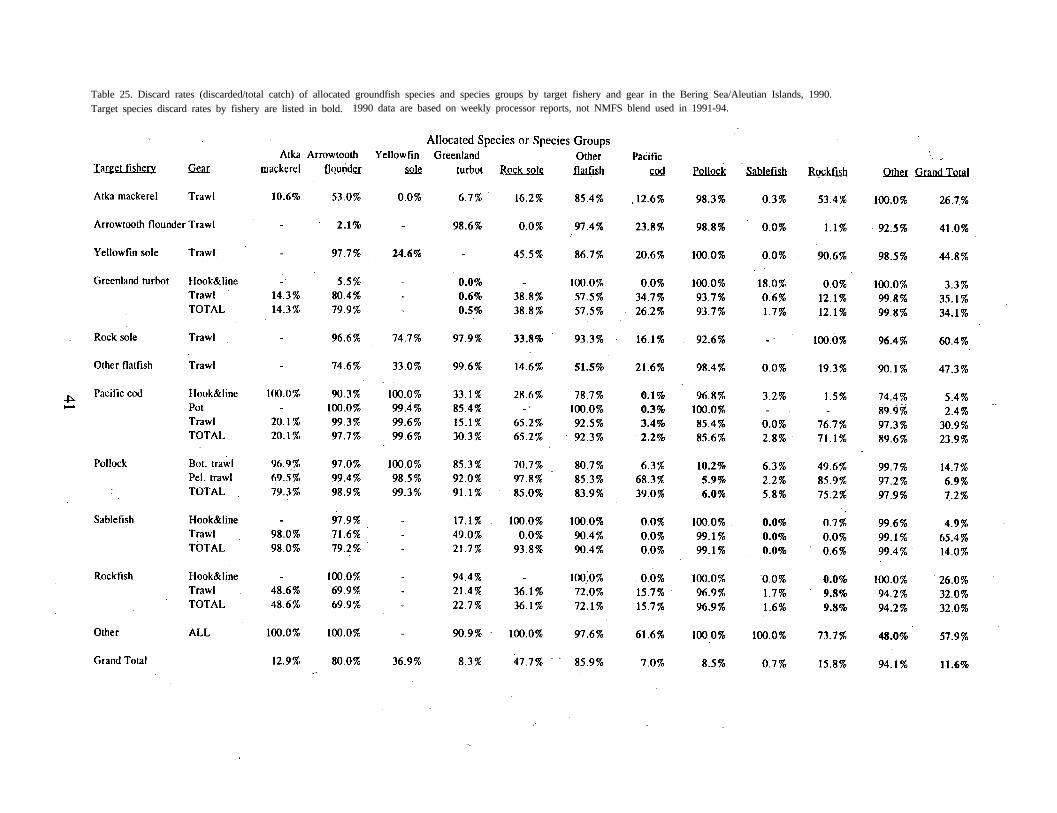
Table 25. Discard rates (discarded/total catch) of allocated groundfish species and species groups by target fishery and gear in the Bering Sea/Aleutian Islands, 1990.Target species discard rates by fishery are listed in bold. 1990 data are based on weekly processor reports, not NMFS blend used in 1991-94.
Target species discard rates by fishery are listed in bold.
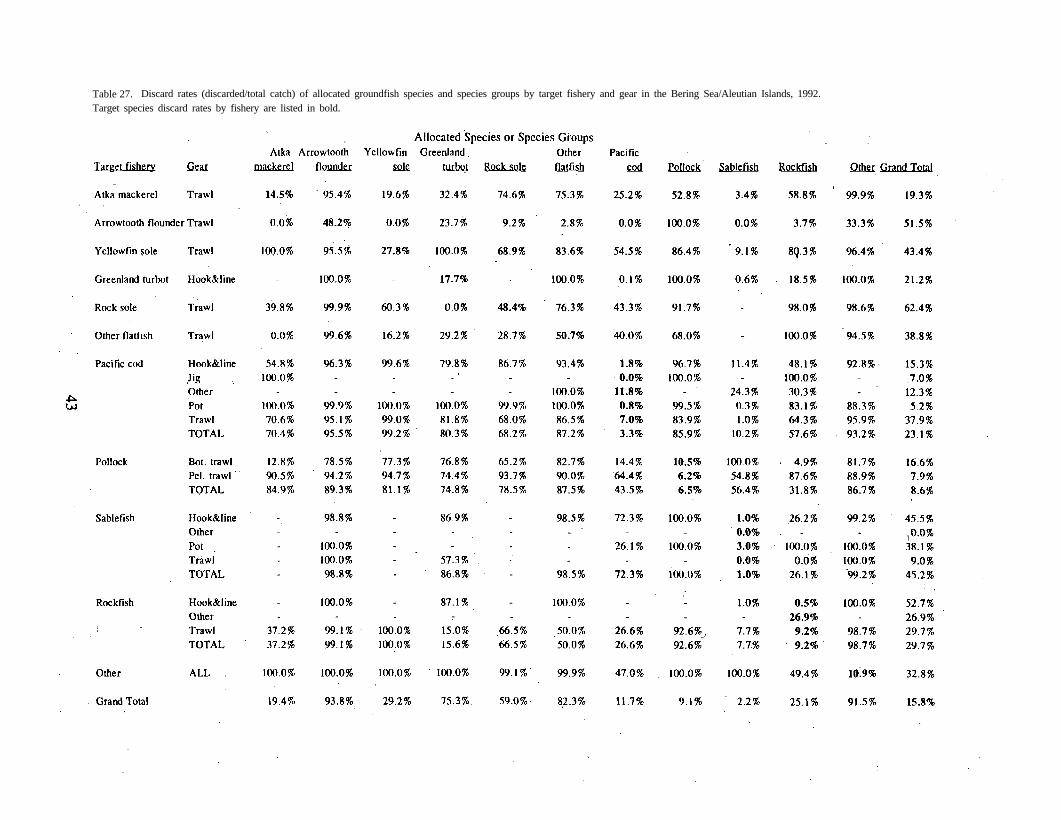
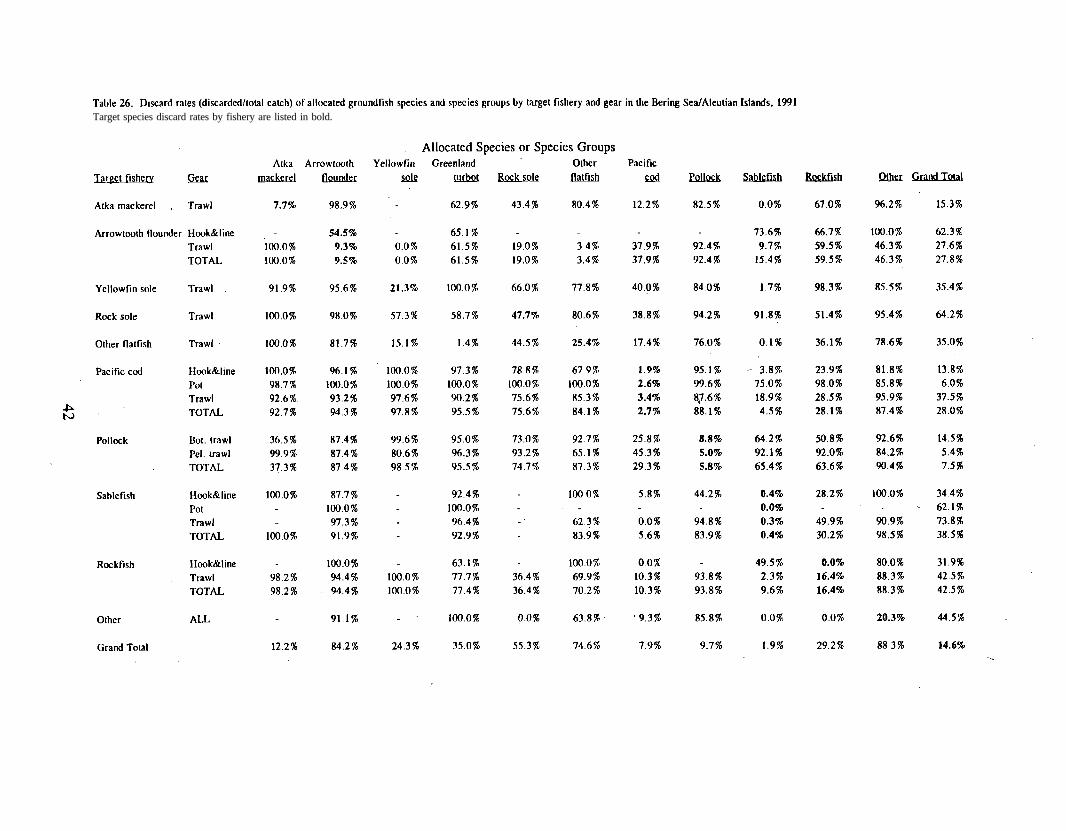
Table 27. Discard rates (discarded/total catch) of allocated groundfish species and species groups by target fishery and gear in the Bering Sea/Aleutian Islands, 1992.Target species discard rates by fishery are listed in bold.
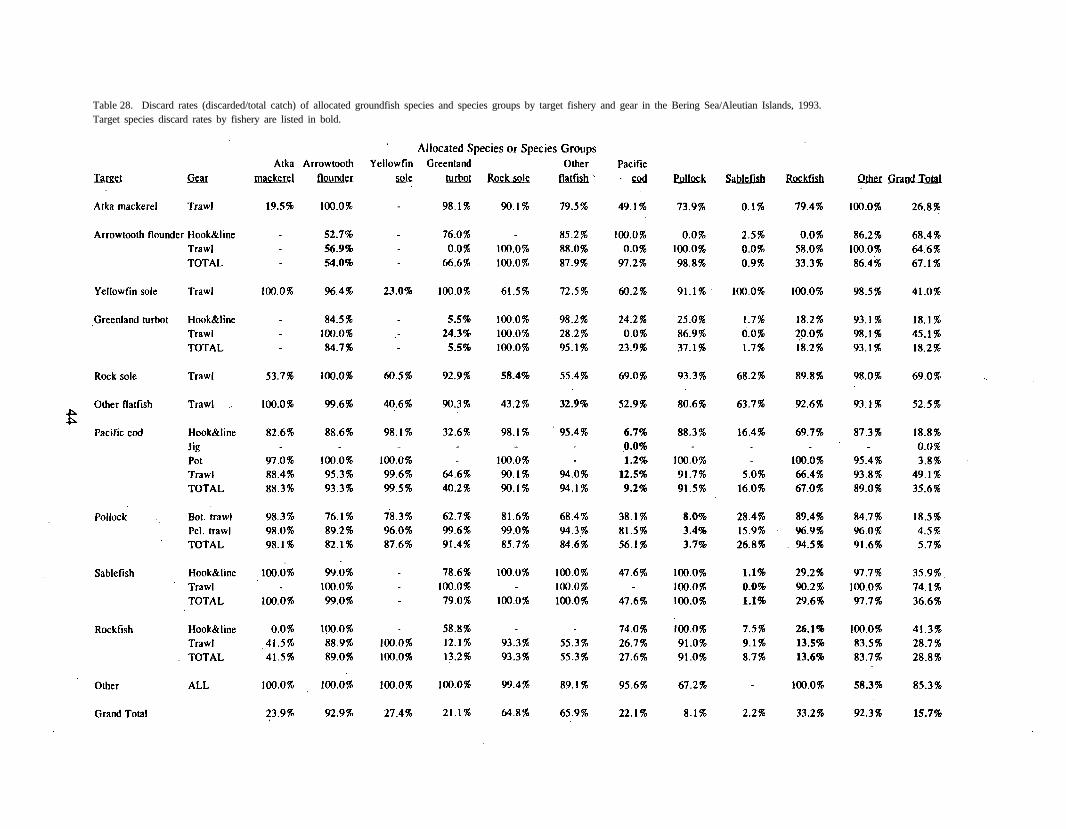
Table 28. Discard rates (discarded/total catch) of allocated groundfish species and species groups by target fishery and gear in the Bering Sea/Aleutian Islands, 1993.Target species discard rates by fishery are listed in bold.
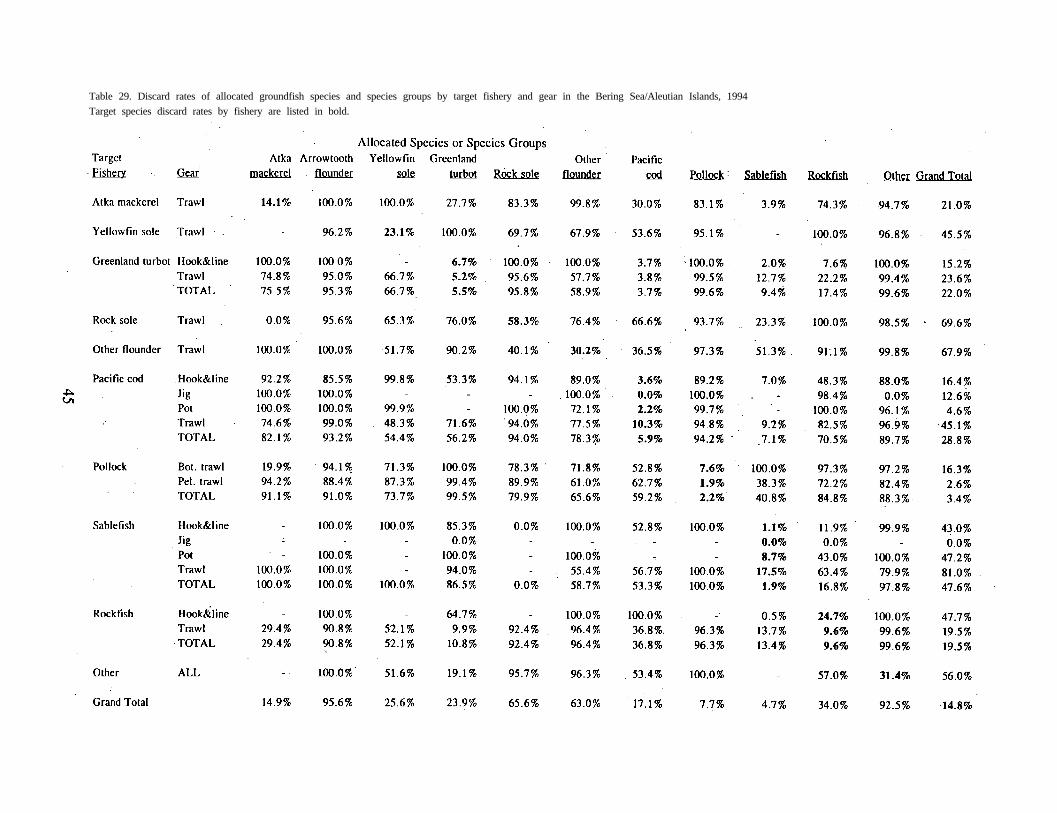
Table 29. Discard rates of allocated groundfish species and species groups by target fishery and gear in the Bering Sea/Aleutian Islands, 1994
Target species discard rates by fishery are listed in bold.
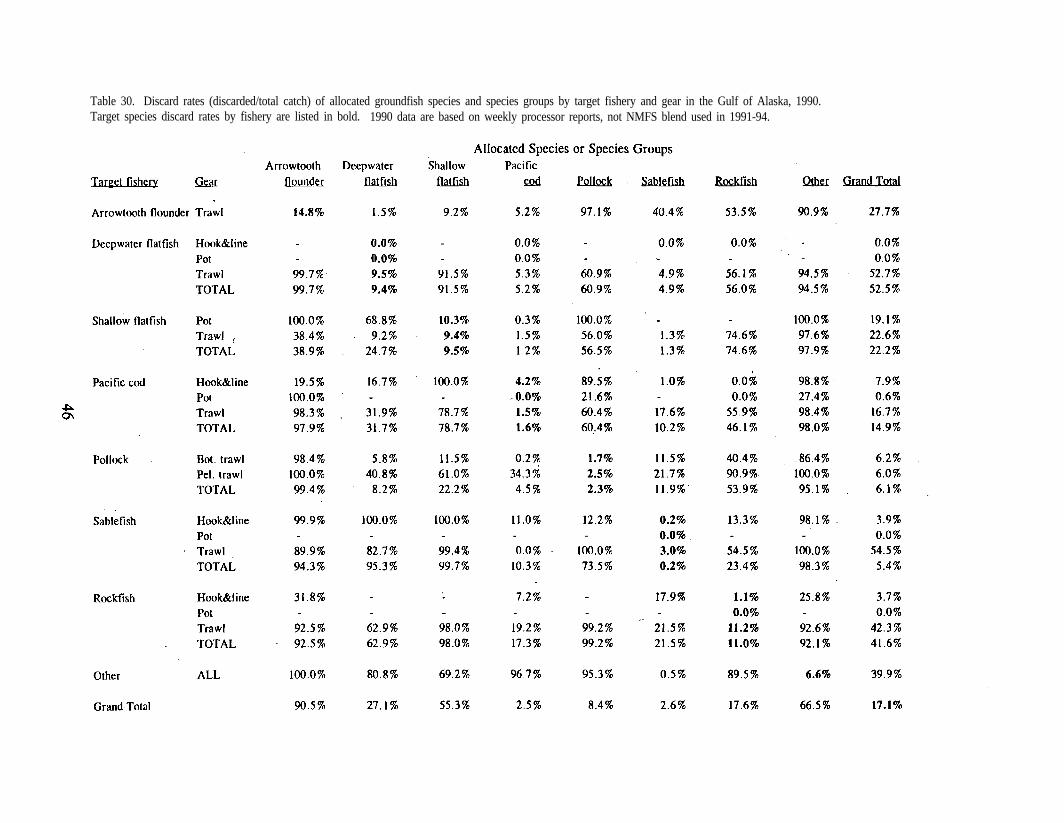
Table 30. Discard rates (discarded/total catch) of allocated groundfish species and species groups by target fishery and gear in the Gulf of Alaska, 1990.Target species discard rates by fishery are listed in bold. 1990 data are based on weekly processor reports, not NMFS blend used in 1991-94.
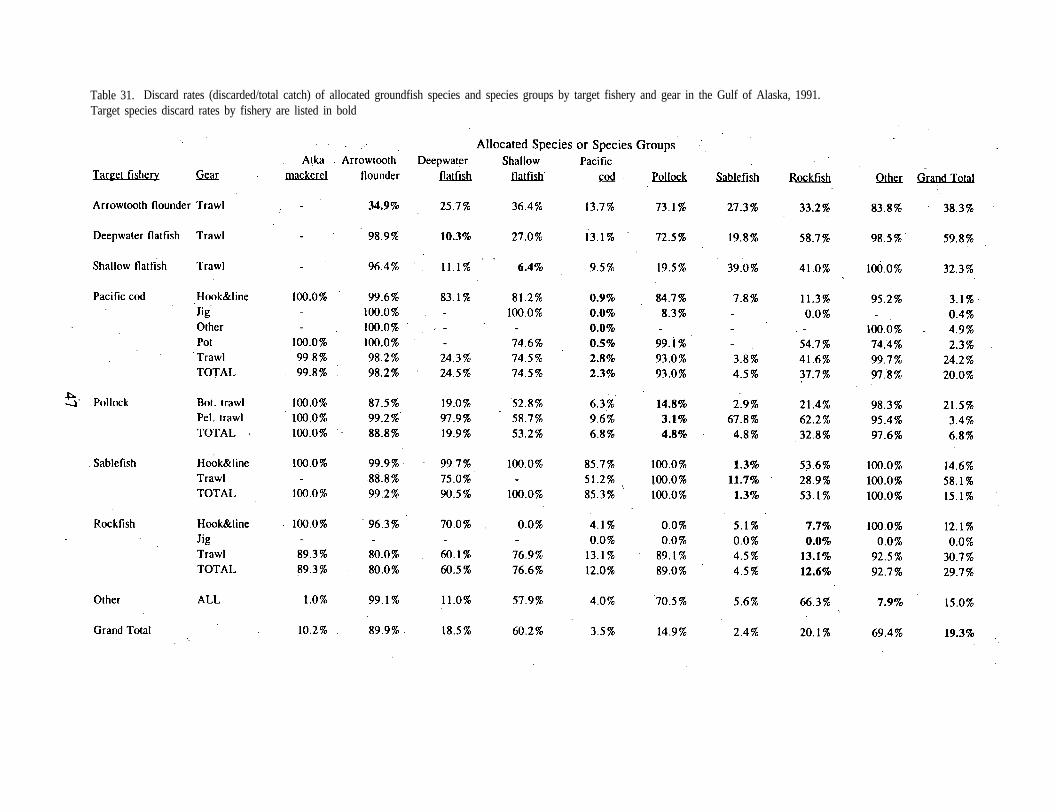
Table 31. Discard rates (discarded/total catch) of allocated groundfish species and species groups by target fishery and gear in the Gulf of Alaska, 1991.Target species discard rates by fishery are listed in bold
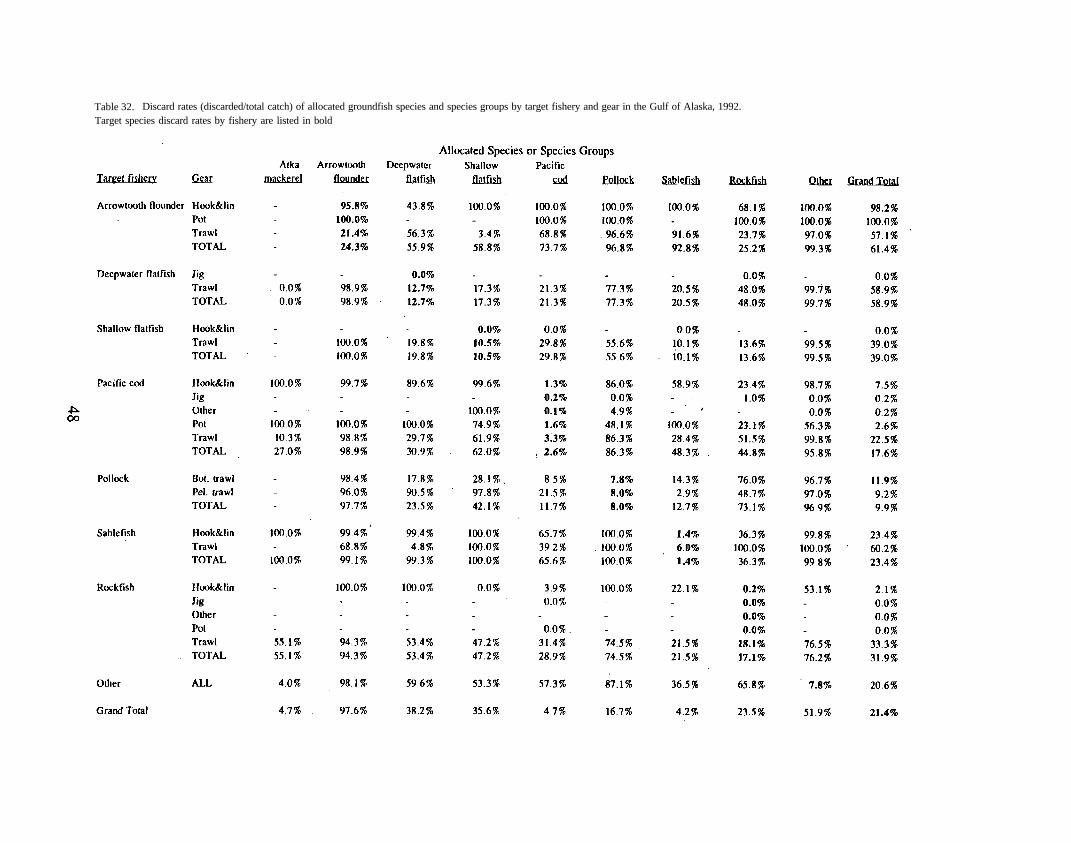
Table 32. Discard rates (discarded/total catch) of allocated groundfish species and species groups by target fishery and gear in the Gulf of Alaska, 1992.Target species discard rates by fishery are listed in bold
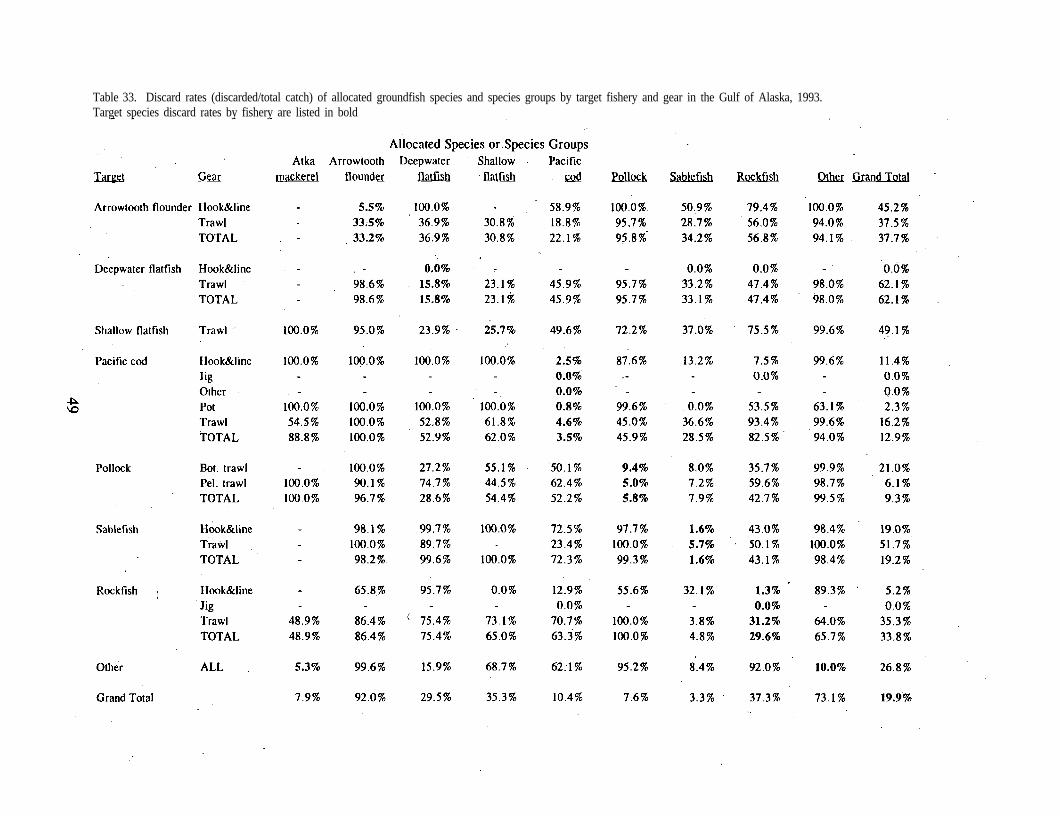
Table 33. Discard rates (discarded/total catch) of allocated groundfish species and species groups by target fishery and gear in the Gulf of Alaska, 1993.Target species discard rates by fishery are listed in bold
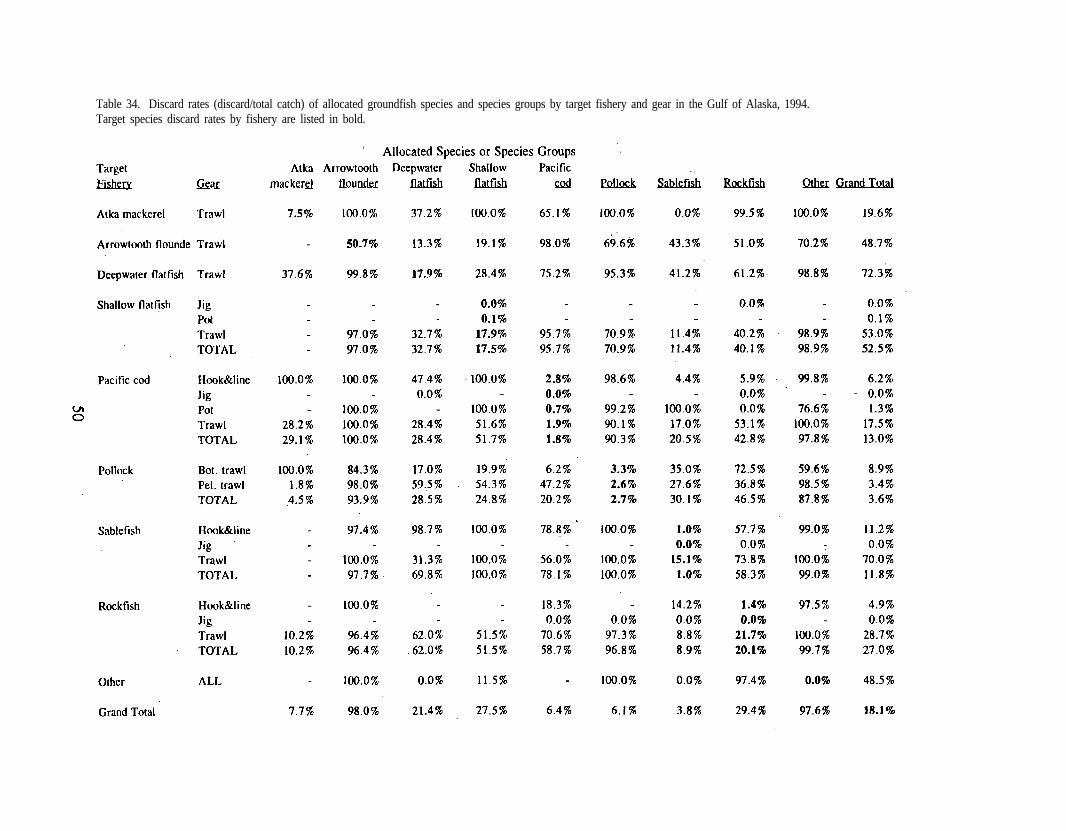
Table 34. Discard rates (discard/total catch) of allocated groundfish species and species groups by target fishery and gear in the Gulf of Alaska, 1994.Target species discard rates by fishery are listed in bold.
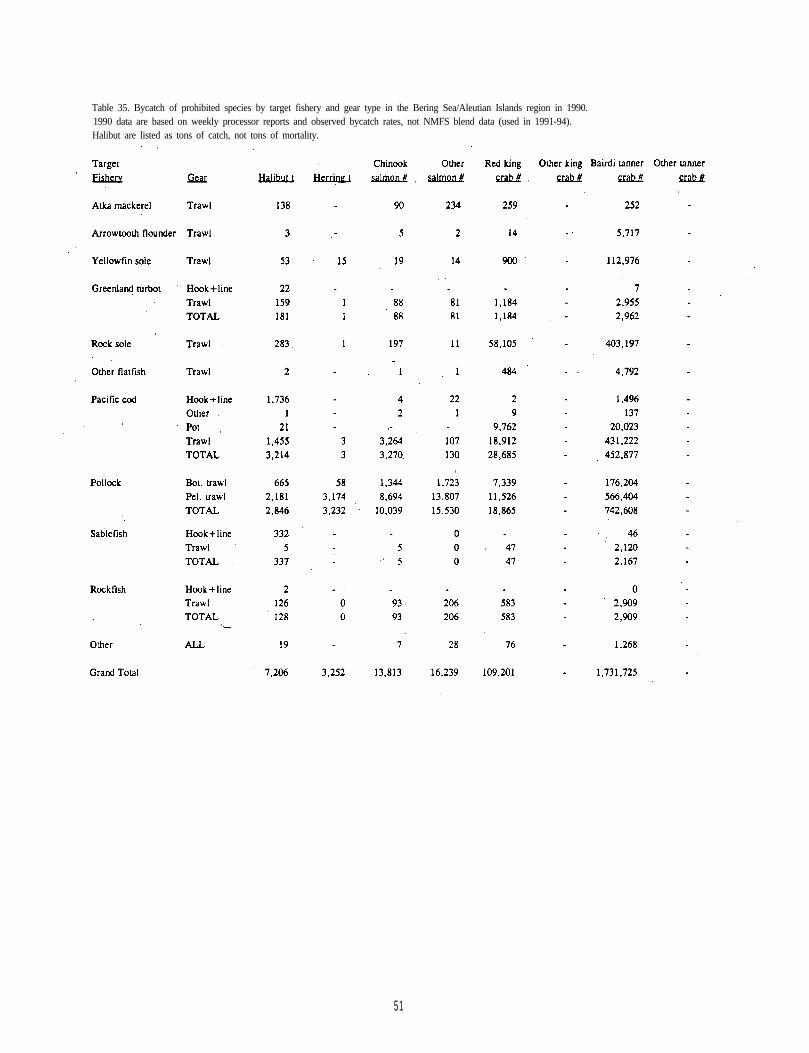
Table 35. Bycatch of prohibited species by target fishery and gear type in the Bering Sea/Aleutian Islands region in 1990.1990 data are based on weekly processor reports and observed bycatch rates, not NMFS blend data (used in 1991-94).Halibut are listed as tons of catch, not tons of mortality.
51
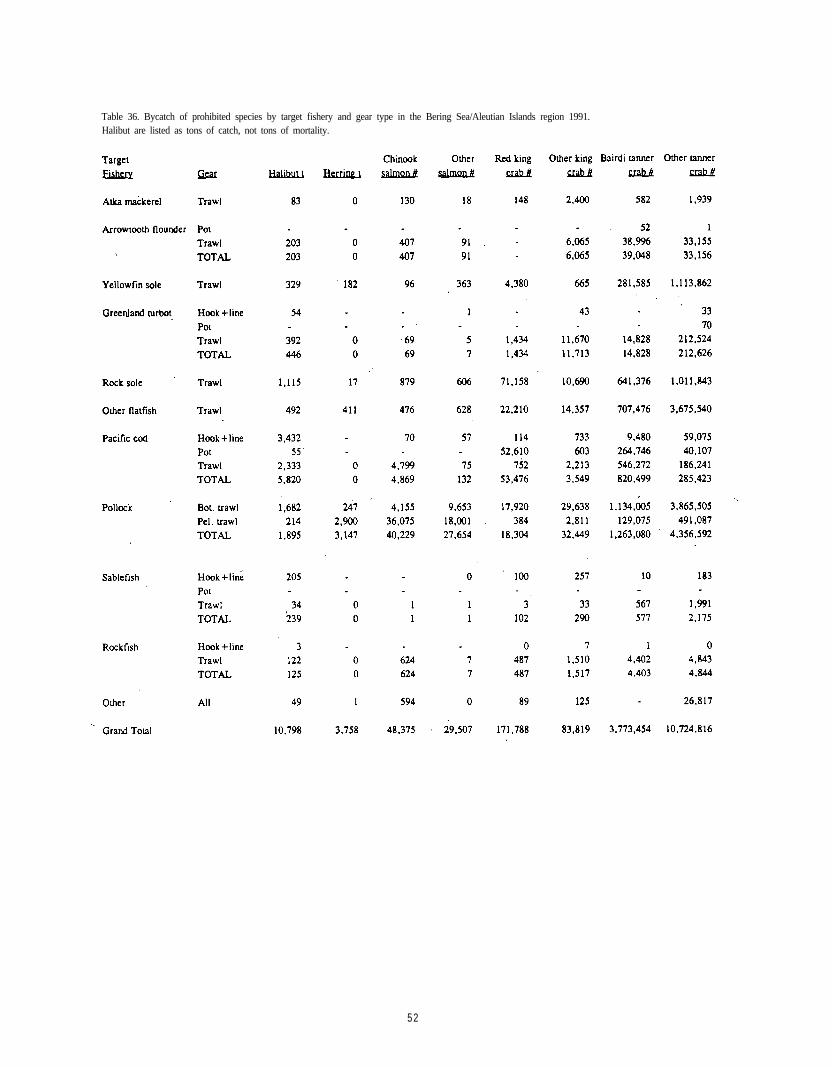
Table 36. Bycatch of prohibited species by target fishery and gear type in the Bering Sea/Aleutian Islands region 1991.Halibut are listed as tons of catch, not tons of mortality.
52
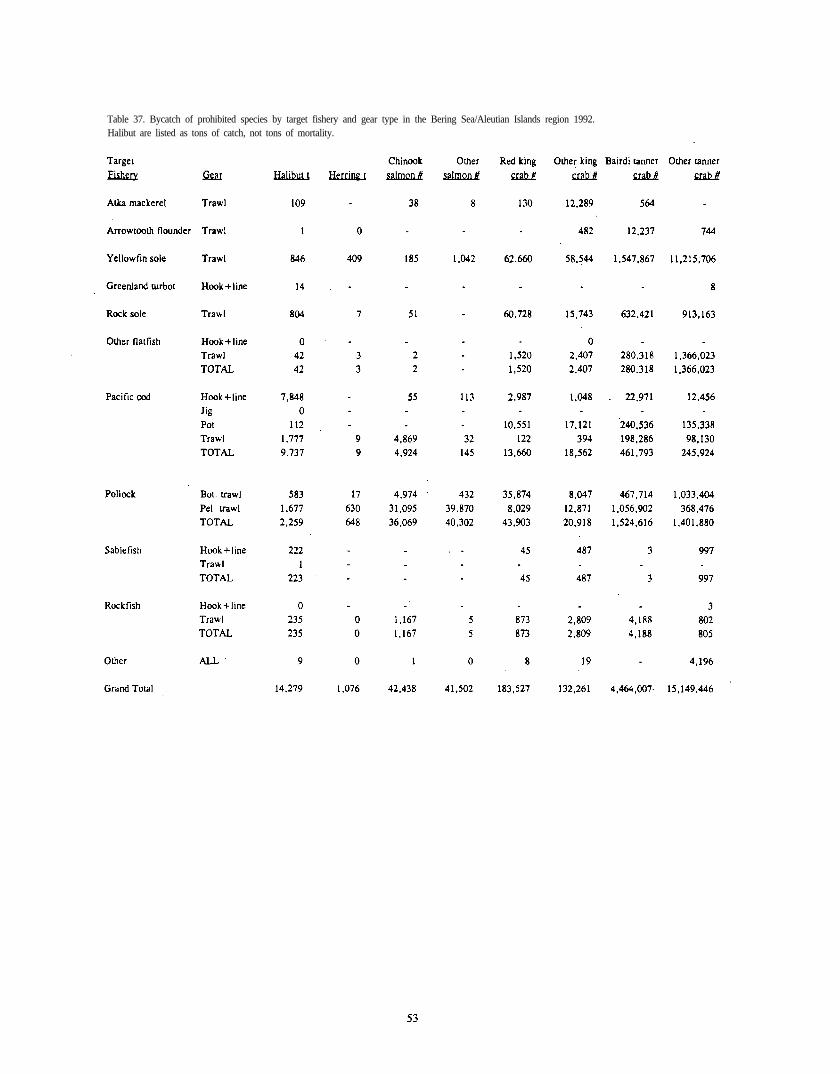
Table 37. Bycatch of prohibited species by target fishery and gear type in the Bering Sea/Aleutian Islands region 1992.Halibut are listed as tons of catch, not tons of mortality.
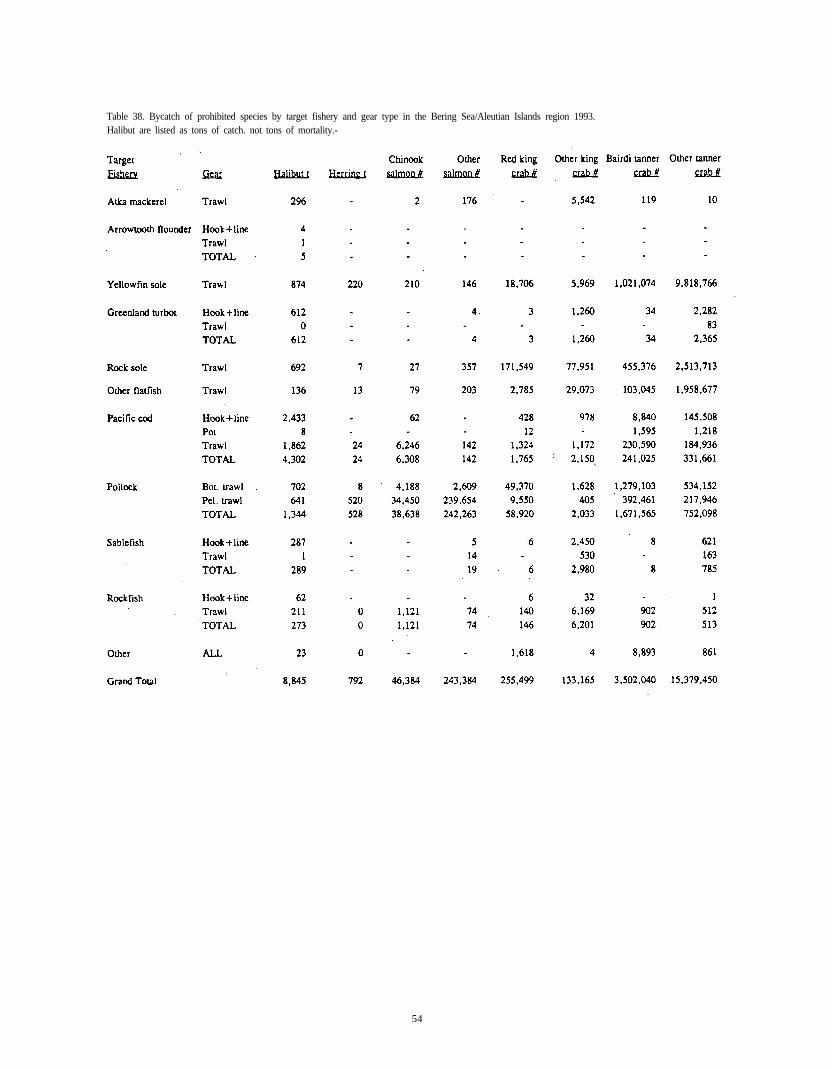
Table 38. Bycatch of prohibited species by target fishery and gear type in the Bering Sea/Aleutian Islands region 1993.Halibut are listed as tons of catch. not tons of mortality.-
54
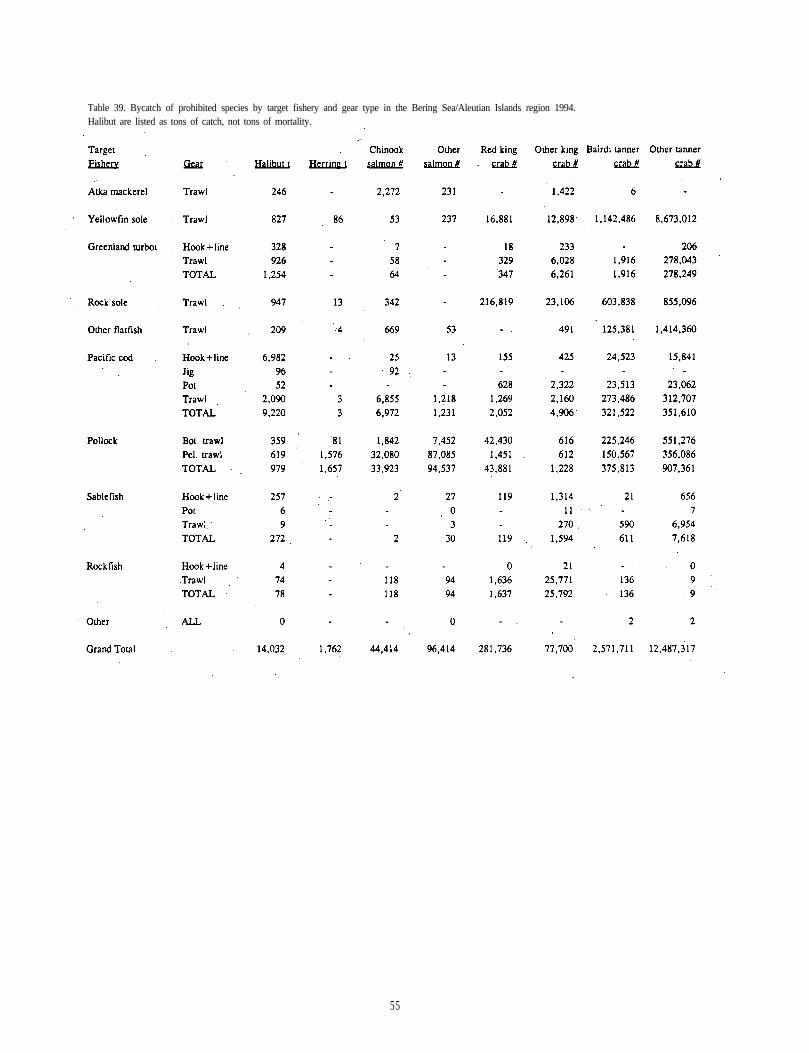
Table 39. Bycatch of prohibited species by target fishery and gear type in the Bering Sea/Aleutian Islands region 1994.Halibut are listed as tons of catch, not tons of mortality.
55
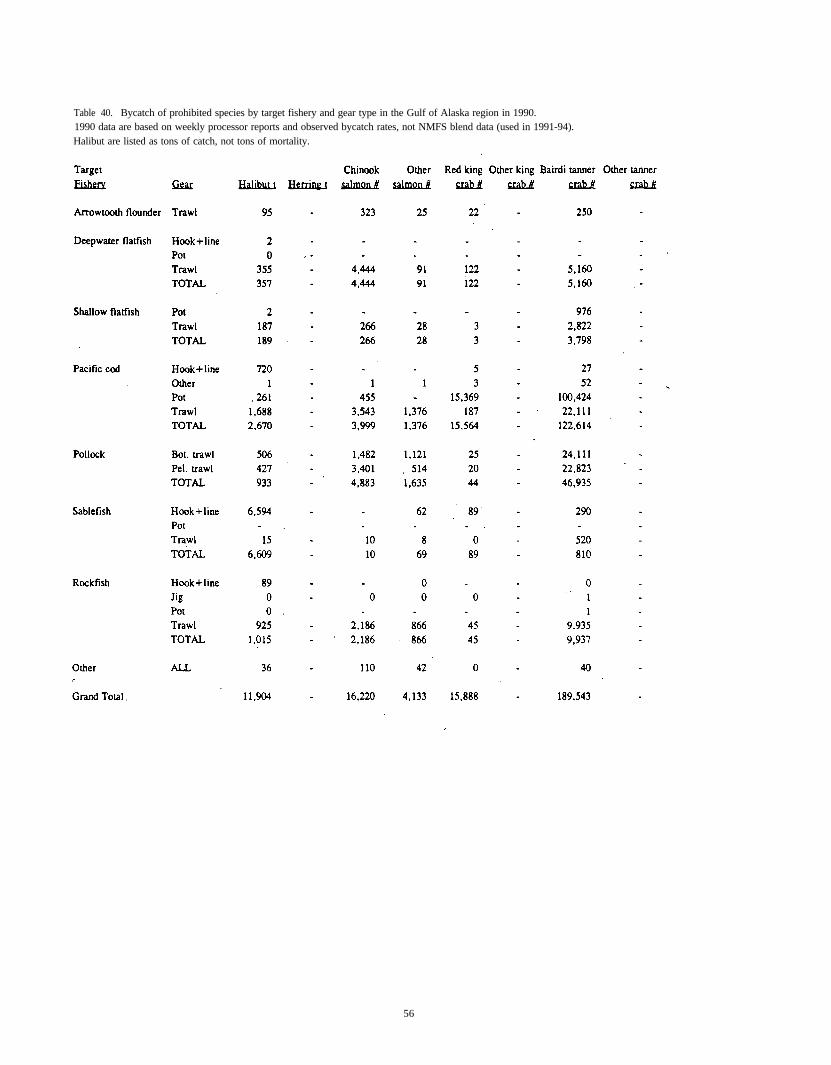
Table 40. Bycatch of prohibited species by target fishery and gear type in the Gulf of Alaska region in 1990.1990 data are based on weekly processor reports and observed bycatch rates, not NMFS blend data (used in 1991-94).Halibut are listed as tons of catch, not tons of mortality.
56
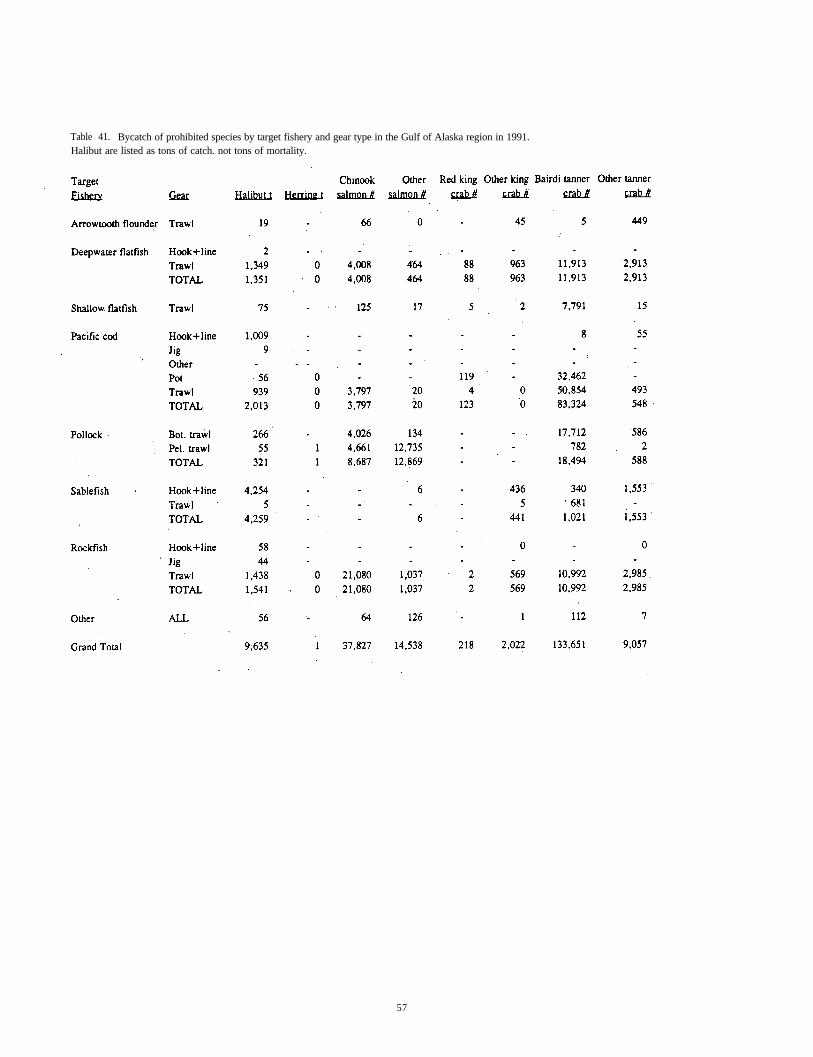
Table 41. Bycatch of prohibited species by target fishery and gear type in the Gulf of Alaska region in 1991.Halibut are listed as tons of catch. not tons of mortality.
57
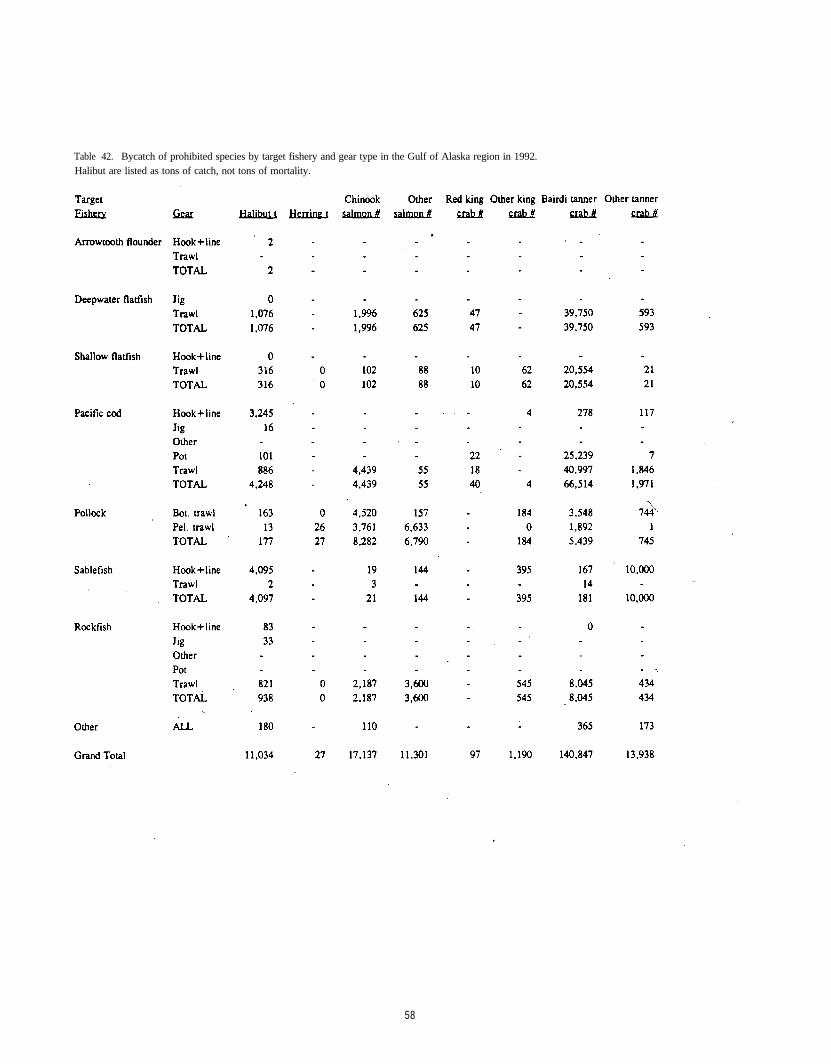
Table 42. Bycatch of prohibited species by target fishery and gear type in the Gulf of Alaska region in 1992.Halibut are listed as tons of catch, not tons of mortality.
58
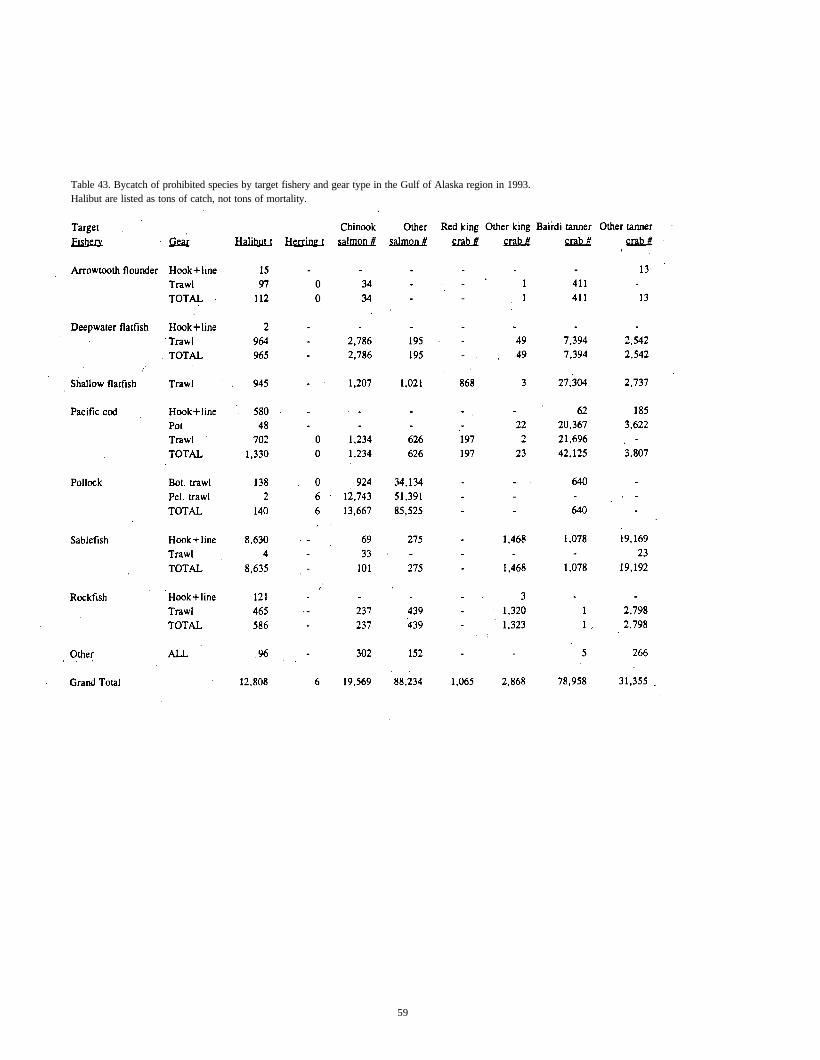
Table 43. Bycatch of prohibited species by target fishery and gear type in the Gulf of Alaska region in 1993.Halibut are listed as tons of catch, not tons of mortality.
59
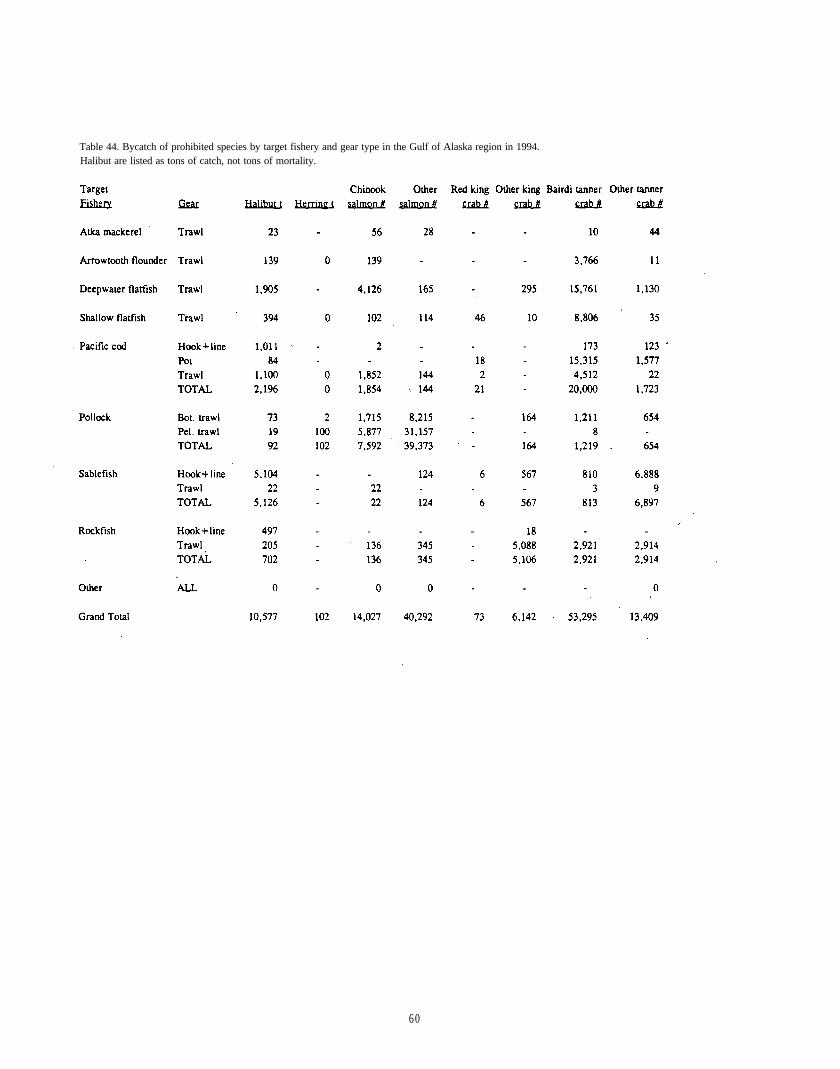
Table 44. Bycatch of prohibited species by target fishery and gear type in the Gulf of Alaska region in 1994.Halibut are listed as tons of catch, not tons of mortality.
60
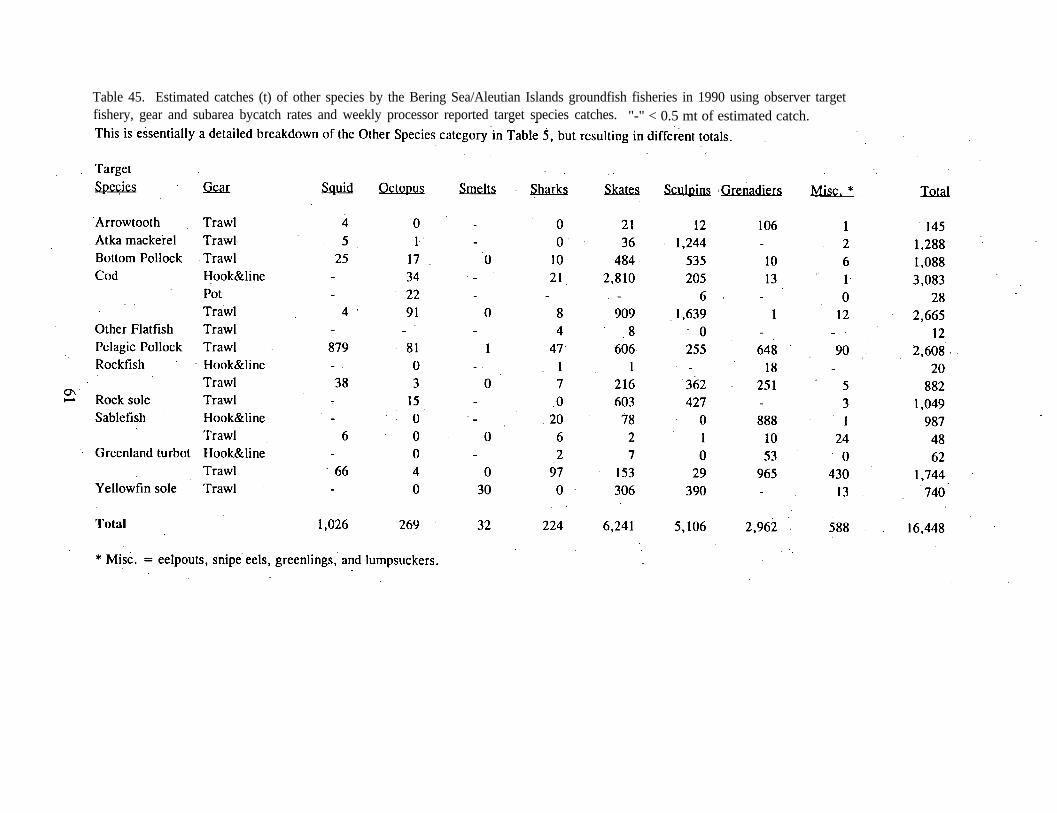
Table 45. Estimated catches (t) of other species by the Bering Sea/Aleutian Islands groundfish fisheries in 1990 using observer targetfishery, gear and subarea bycatch rates and weekly processor reported target species catches. "-" < 0.5 mt of estimated catch.
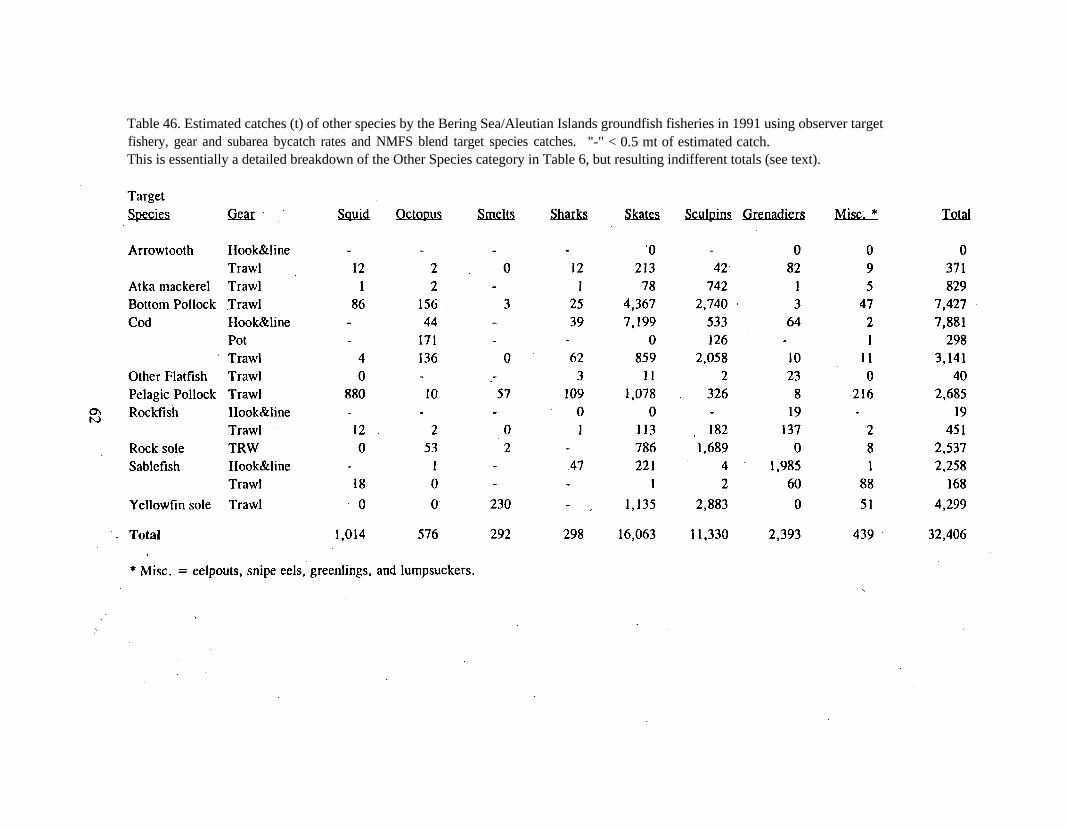
Table 46. Estimated catches (t) of other species by the Bering Sea/Aleutian Islands groundfish fisheries in 1991 using observer targetfishery, gear and subarea bycatch rates and NMFS blend target species catches. "-" < 0.5 mt of estimated catch.This is essentially a detailed breakdown of the Other Species category in Table 6, but resulting indifferent totals (see text).
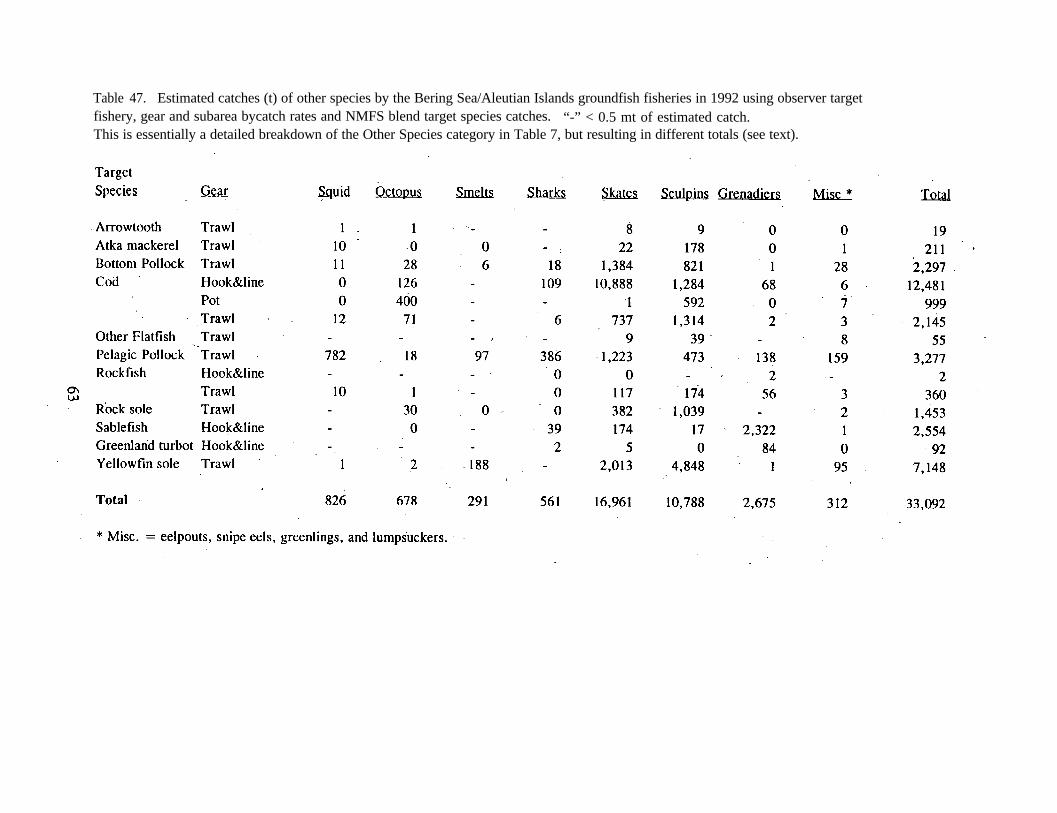
Table 47. Estimated catches (t) of other species by the Bering Sea/Aleutian Islands groundfish fisheries in 1992 using observer targetfishery, gear and subarea bycatch rates and NMFS blend target species catches. “-” < 0.5 mt of estimated catch.This is essentially a detailed breakdown of the Other Species category in Table 7, but resulting in different totals (see text).
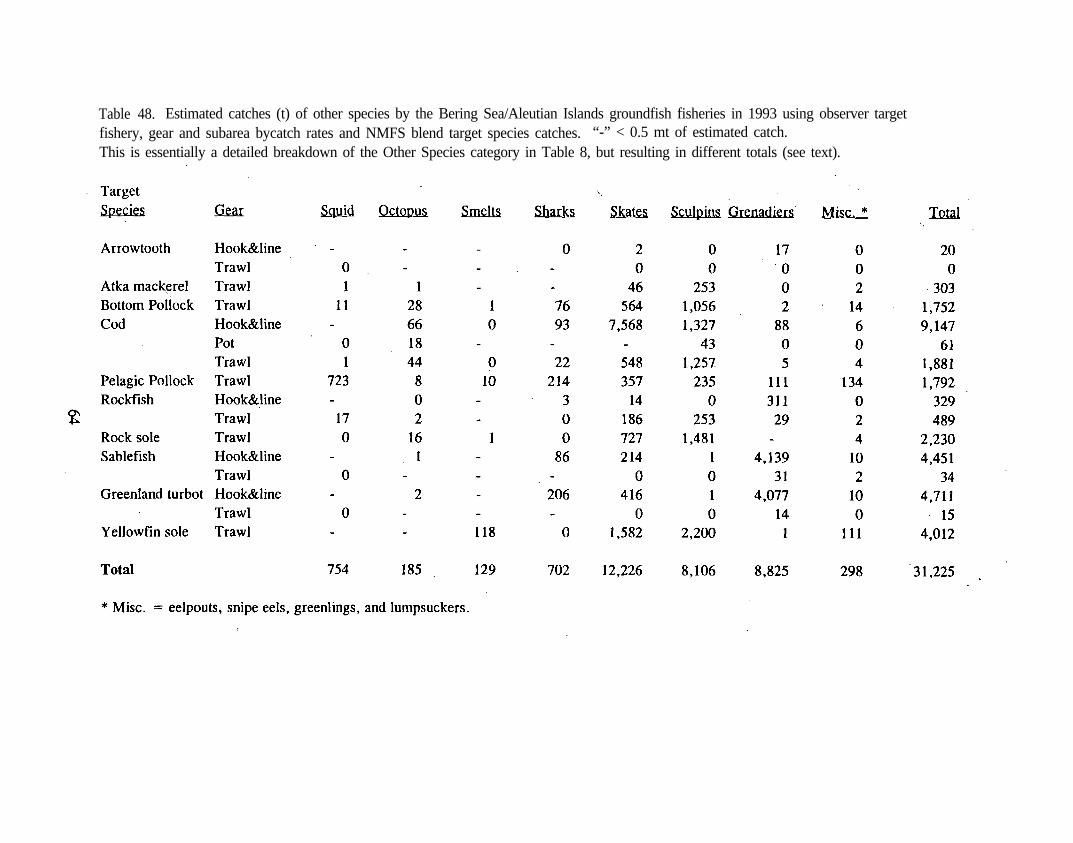
Table 48. Estimated catches (t) of other species by the Bering Sea/Aleutian Islands groundfish fisheries in 1993 using observer targetfishery, gear and subarea bycatch rates and NMFS blend target species catches. “-” < 0.5 mt of estimated catch.This is essentially a detailed breakdown of the Other Species category in Table 8, but resulting in different totals (see text).
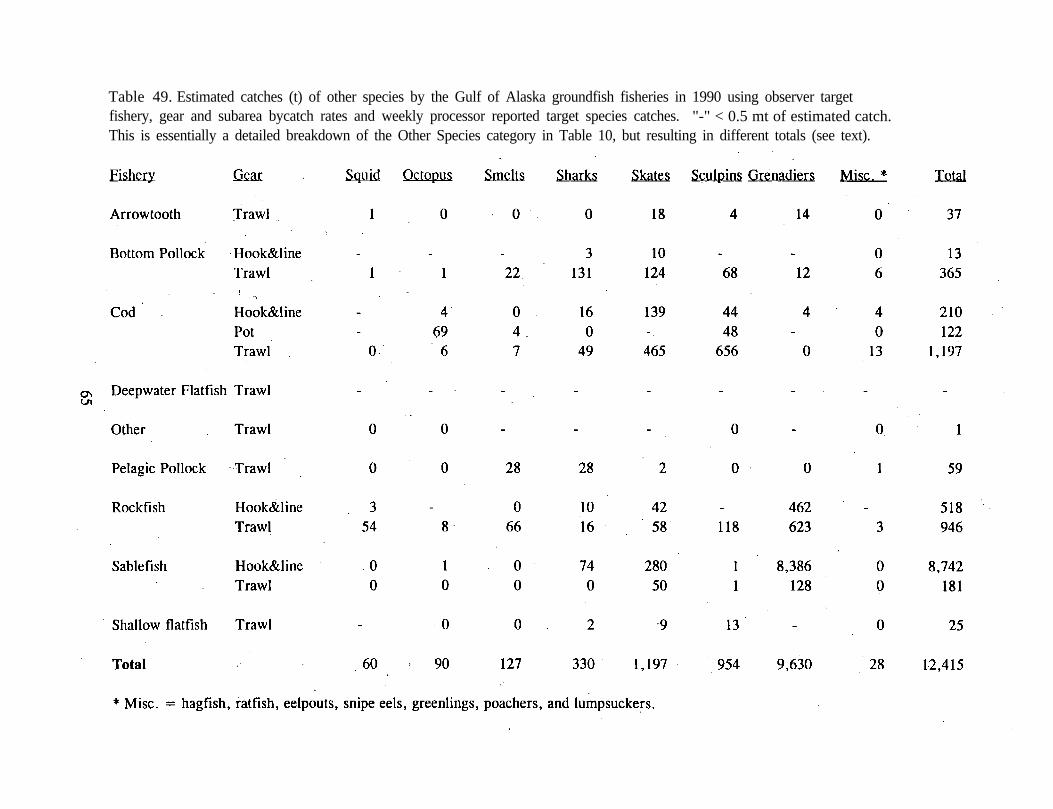
Table 49. Estimated catches (t) of other species by the Gulf of Alaska groundfish fisheries in 1990 using observer targetfishery, gear and subarea bycatch rates and weekly processor reported target species catches. "-" < 0.5 mt of estimated catch.This is essentially a detailed breakdown of the Other Species category in Table 10, but resulting in different totals (see text).
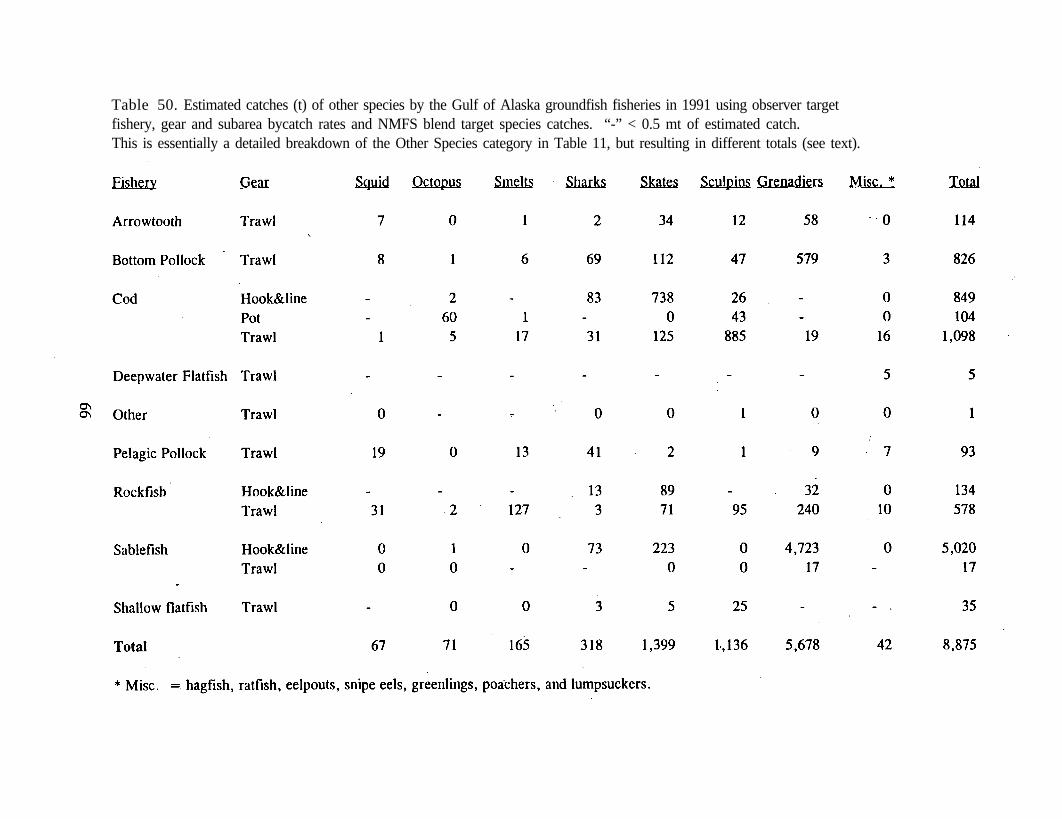
Table 50. Estimated catches (t) of other species by the Gulf of Alaska groundfish fisheries in 1991 using observer targetfishery, gear and subarea bycatch rates and NMFS blend target species catches. “-” < 0.5 mt of estimated catch.This is essentially a detailed breakdown of the Other Species category in Table 11, but resulting in different totals (see text).
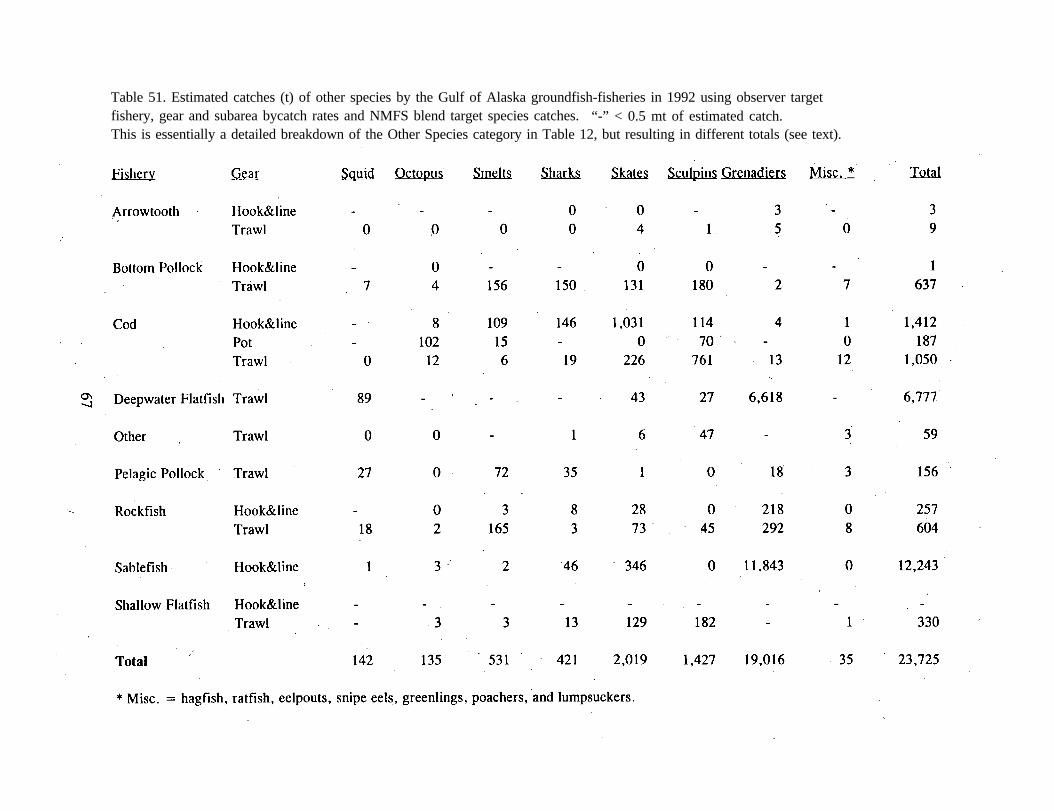
Table 51. Estimated catches (t) of other species by the Gulf of Alaska groundfish-fisheries in 1992 using observer targetfishery, gear and subarea bycatch rates and NMFS blend target species catches. “-” < 0.5 mt of estimated catch.This is essentially a detailed breakdown of the Other Species category in Table 12, but resulting in different totals (see text).
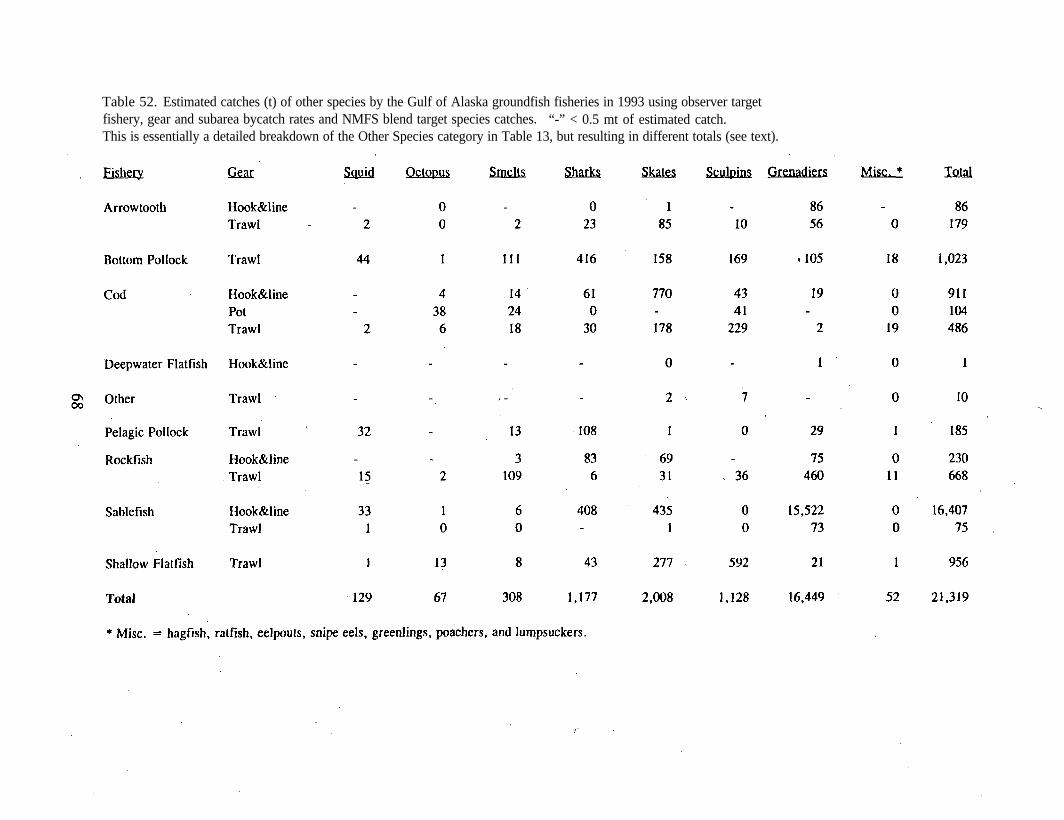
Table 52. Estimated catches (t) of other species by the Gulf of Alaska groundfish fisheries in 1993 using observer targetfishery, gear and subarea bycatch rates and NMFS blend target species catches. “-” < 0.5 mt of estimated catch.This is essentially a detailed breakdown of the Other Species category in Table 13, but resulting in different totals (see text).
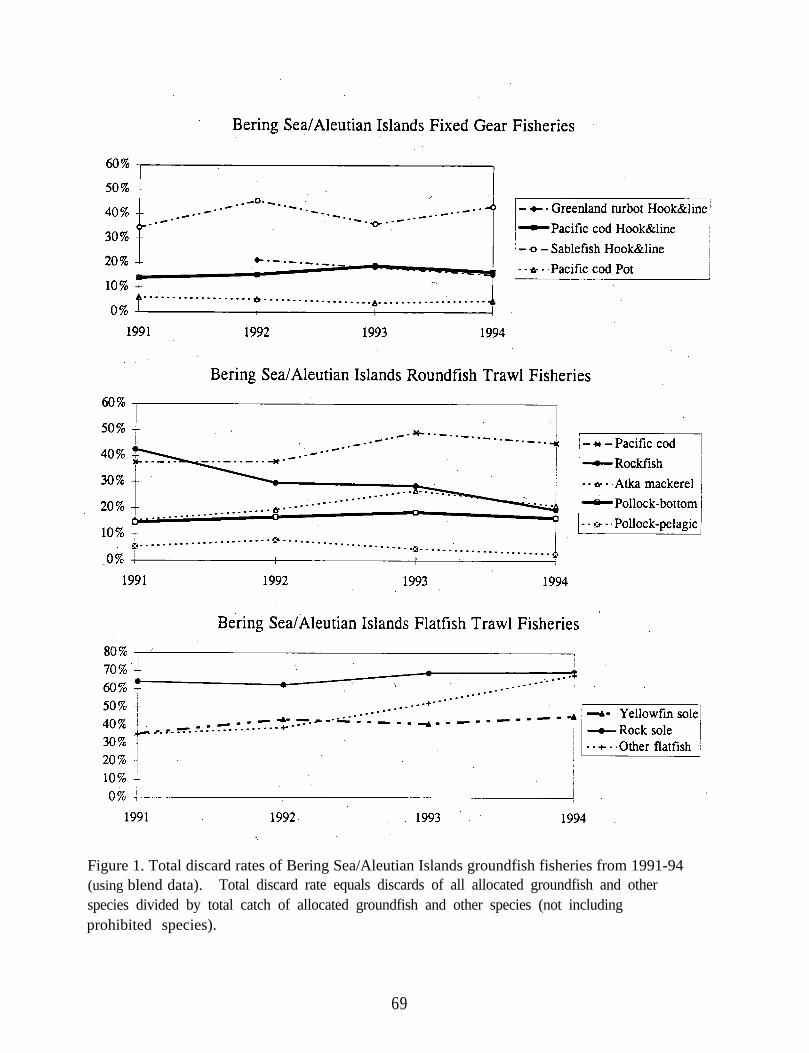
Figure 1. Total discard rates of Bering Sea/Aleutian Islands groundfish fisheries from 1991-94(using blend data). Total discard rate equals discards of all allocated groundfish and otherspecies divided by total catch of allocated groundfish and other species (not includingprohibited species).
69
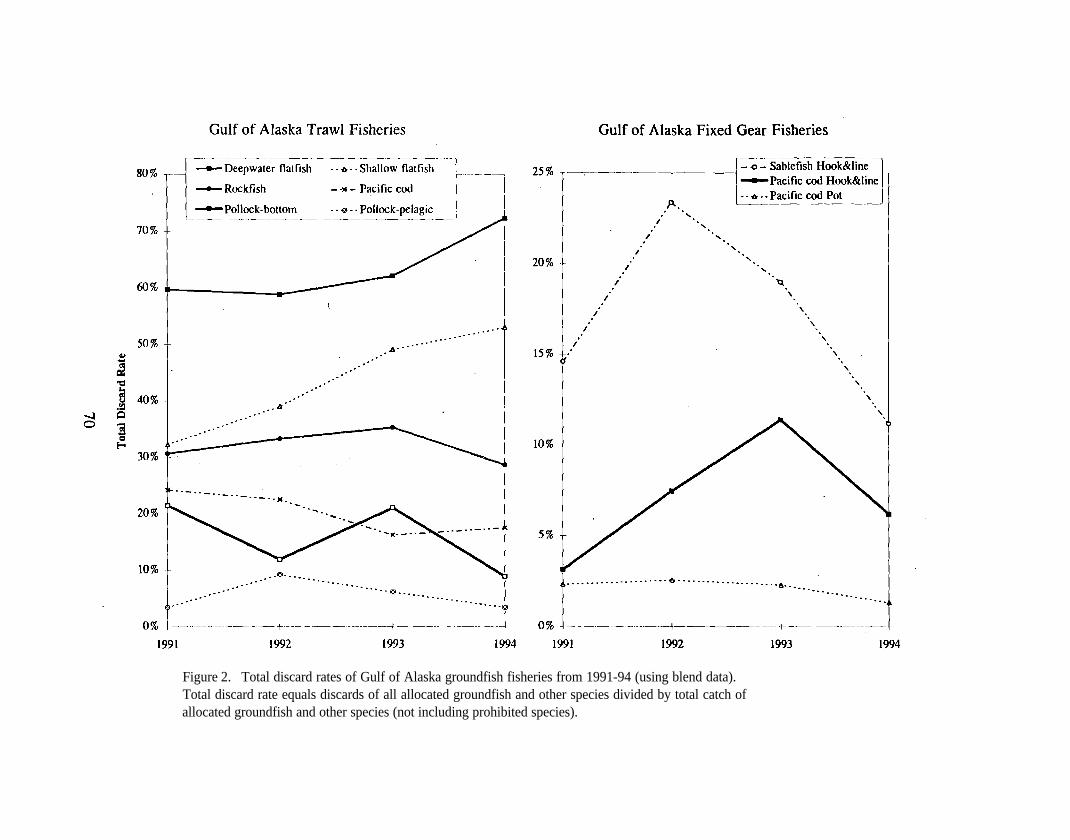
Figure 2. Total discard rates of Gulf of Alaska groundfish fisheries from 1991-94 (using blend data).Total discard rate equals discards of all allocated groundfish and other species divided by total catch ofallocated groundfish and other species (not including prohibited species).
Bycatch Discard Mortality
Review of Literature on Discard Mortality
Discarded catch, whether an undesirable species or size, contributes to the fishing-relatedmortality of many marine living resources. Discard mortalities vary-with gear types and
deployment duration, surface exposure duration and sorting methods, weight of catch for netfisheries, and environmental conditions (Alverson et al. 1994). In general, fish species
mortality rates decrease with increasing size, and crustacean species mortality rates are
relatively high during molting or softshell stages (Wassenberg and Hill, 1989; Stevens, 1990).
High discard mortality rates also tend to increase energy flows to the scavenger species thatconsume fisheries-generated waste.
Quantitative estimates of discard mortality rates are fairly limited in number and ingeographical representation (Table 53). A large amount of discard mortality research has beengenerated by the International Council for the Exploration of the Sea (ICES), which focuses on
the northern Atlantic Ocean. Outside of the North Atlantic, much of the relevant research isdedicated to incidental catch in shrimp and prawn fisheries, primarily because those fisherieshave been associated with some of the highest bycatch rates in the world. In domesticfisheries off the coast of Alaska, fisheries managers and scientists have addressed the mortality
rates of halibut, salmon, and king and Tanner crab in groundfish fisheries. This researchpattern follows the North Pacific trend of separating and protecting halibut, salmon, and crab
from fisheries bycatch and discard. However, assessment scientists now include discards intheir estimates of total catch for all managed groundfish species in the GOA and eastern
Bering Sea, assuming 100% mortality rates for the discards. Expanded discard research in the
North Pacific would provide estimates of mortality effects on a given marine ecosystem, andimprove long-term fish population productivity through fishing gear and method modificationsuggestions.
Gear-Related Factors Influencing Mortality
Trawl gear is often associated with high discard mortality rates. Fish caught in trawl nets may
be fatigued from trying to swim with the speed of the net, crushed by the weight of the towedcatch, have scales removed by net abrasions, or suffer damage under close proximity to spiny
or predatory fish. Discard mortality rate increases are often directly related to the length oftrawl time primarily because long tow times raise the overall weight of the catch and the
71
pressure of that weight on each individual in the catch (van Beek et al. 1989). Hard-shell
crustaceans generally suffer less discard mortality than fish or cephalopods, particularly if they
do not lose limbs during the trawl (Wassenberg and Hill, 1990).
Longline gear does not cause as much overall body damage to fish as trawl gear, but the hooksdo inflict puncture wounds to the head area (Neilson et al. 1989). Hook injuries have alsobeen noted in troll fisheries for Pacific salmon, where survival rates were greatly improvedwith the introduction of barbless hooks (Alverson et al. 1994). One advantage of longline gear
in reducing discard mortalities is that fish caught by longlines tend, to have shorter handling
times than those caught by trawl gear. The length of time that bycatch lies exposed on deckusually relates directly to discard mortality rates (Neilson et al. 1989; van Beek et al. 1989;
Evans et al. 1994). Longline gear allows fishing crews to deal with each individual as it
comes out of the water, limiting deck exposure for both target and non-target species.
However, longline gear may have longer capture times and increased mortality may result.
Pot gear is associated with low discard mortality rates for fish and crab, although the rates
vary with the frequency of pot retrieval. Once fish begin to gather inside the pots, their closeproximity to each other increases the spread of scale infections or puncture wounds inflictedby spiny fish. Death by scale. infections may also be a pitfall, for researchers holding
incidentally caught fish in tanks in order to determine discard mortality over time (Millner et
al., 1993). Direct body damage, however, is limited in pot fisheries, because the crushingweight of the trawl and the puncture of the hook are eliminated. In the intensive North Pacificcrab pot fisheries, the effects of repeated captures and surface exposures may compound crabmortality rates (Shirley, 1990). Although discard mortality rates for crab in pot gear are
low, the total number of discarded crab in Bering Sea pot fisheries is very high, and total
mortality of discarded crab in pot fisheries may exceed that of trawl fisheries (Stevens andMacIntosh, l993).
72
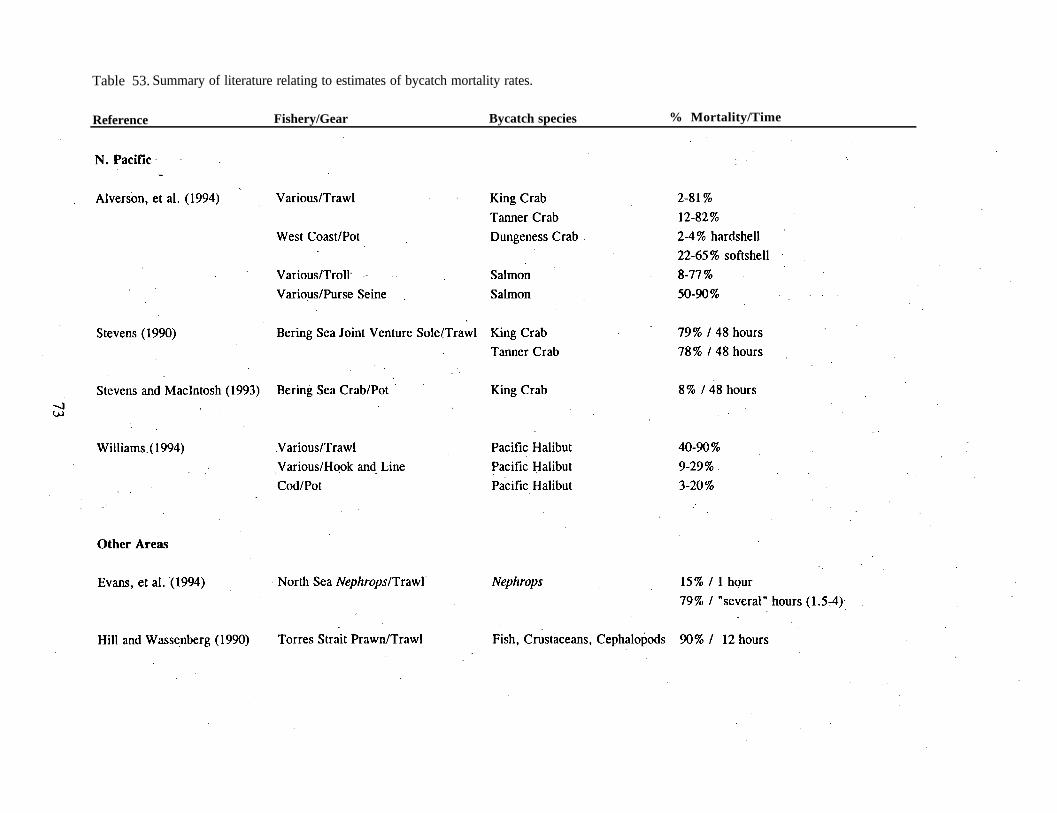
Table 53. Summary of literature relating to estimates of bycatch mortality rates.
Reference Fishery/Gear Bycatch species % Mortality/Time
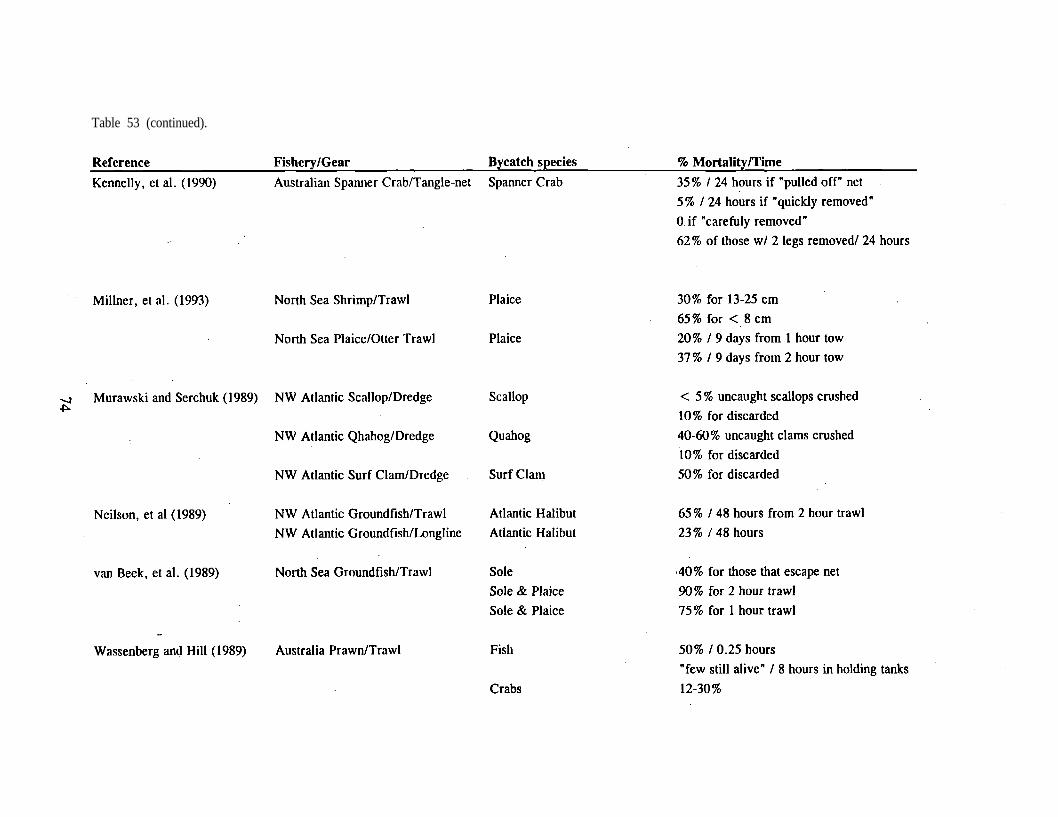
Table 53 (continued).
A gear type that is particularly damaging to crabs is the tangle-net, used in the Australianspanner crab fishery and formerly used in the Alaska crab fisheries. This fishing method uses
bait to entice crabs to walk across an entangling mesh net, where they are trapped until theyare brought to the surface. If the crabs are removed from the net with care, they are far more
likely to survive the discard process. Unfortunately, researchers noted that fishermengenerally took less care in removing undersized crabs from the tangle nets, since they wereunmarketable (Kennelly et al., 1990). This experiment is relevant to other gear types becauseit shows increased mortality rates for those crabs that had lost legs or dactyli due to brusque
removal from the net. Fisheries that risk entangling or removing crustacean limbs should beviewed as inherently dangerous to crustacean bycatch survival rates.
Murawski and Serchuk (1989) experimented with the mortality rates associated with the
dredge gear fisheries for U.S. Atlantic scallop (Phacopecten magellanicus), quahog (Arctica
islandica) and surf clam (Spisula solidissima) fisheries. Dredges that skim just above thebottom for scallops tend to either catch or miss the scallops without crushing them. Thehydraulic dredges used to harvest quahogs and surf clams, however, can be quite destructiveand crush many of the bivalves that are not caught in the dredges. Dredges and certain typesof trawl gear have also been noted for their destructive impacts to benthic environments.(Murawski and Serchuk, 1989; van Beek et al., 1989).
Other Factors Influencing Discard Mortality
Fisheries discard mortality rates can be affected by post-catch sorting methods, particularlywith regard to the length of time organisms spend out of the water. Neilson et al. (1989)found that for Atlantic halibut survival as incidental catch, the length of handling time had amultiplicative effect with the length of trawl tow time in determining mortality rates. Longtow times coupled with long handling times were exponentially more likely to result in halibutdeath than short tow times coupled with short handling times. Conversely, Wassenberg and
Hill (1989) found that, in an Australian prawn fishery, handling time had little effect onmortality because the extreme mortality rate caused by the trawling process preempted anymeasurement of the effects of prolonged deck exposure. Once deck-time begins to affectPacific halibut survival, survival rates of Pacific halibut decrease to zero after about 20
minutes (Pikitch and Erickson, 1993).
75
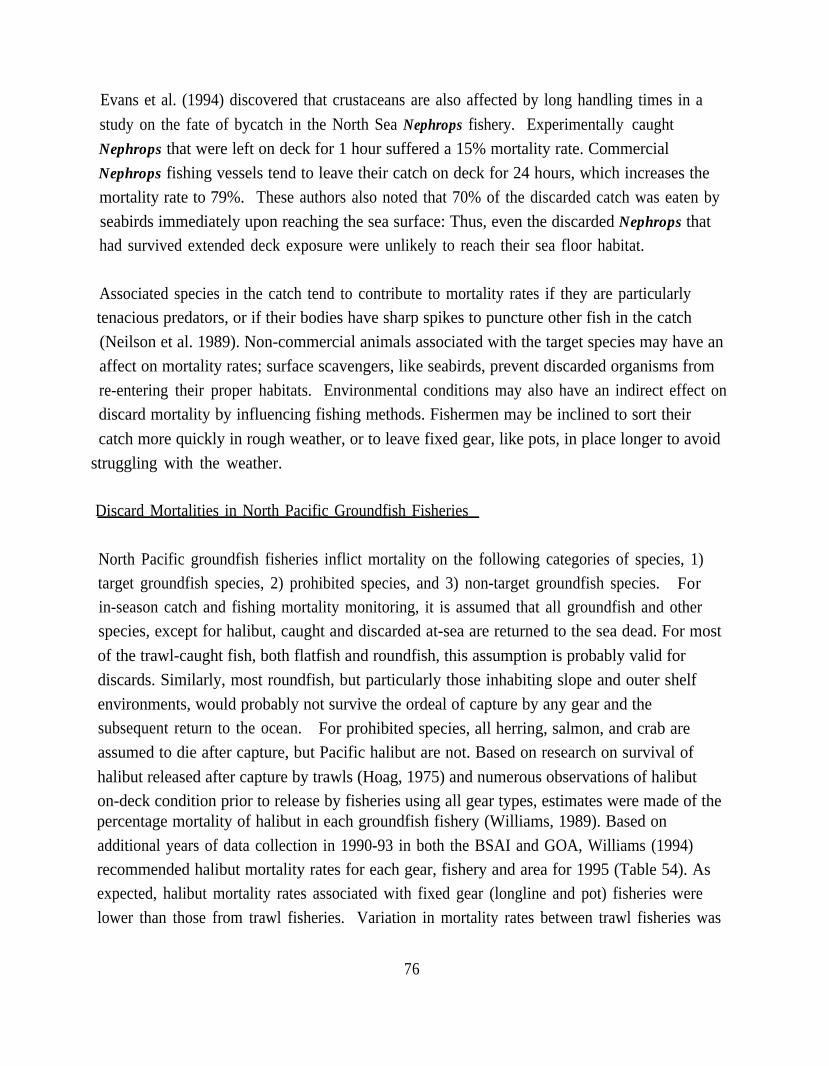
Evans et al. (1994) discovered that crustaceans are also affected by long handling times in a
study on the fate of bycatch in the North Sea Nephrops fishery. Experimentally caught
Nephrops that were left on deck for 1 hour suffered a 15% mortality rate. Commercial
Nephrops fishing vessels tend to leave their catch on deck for 24 hours, which increases the
mortality rate to 79%. These authors also noted that 70% of the discarded catch was eaten by
seabirds immediately upon reaching the sea surface: Thus, even the discarded Nephrops thathad survived extended deck exposure were unlikely to reach their sea floor habitat.
Associated species in the catch tend to contribute to mortality rates if they are particularly tenacious predators, or if their bodies have sharp spikes to puncture other fish in the catch
(Neilson et al. 1989). Non-commercial animals associated with the target species may have an
affect on mortality rates; surface scavengers, like seabirds, prevent discarded organisms from
re-entering their proper habitats. Environmental conditions may also have an indirect effect ondiscard mortality by influencing fishing methods. Fishermen may be inclined to sort their
catch more quickly in rough weather, or to leave fixed gear, like pots, in place longer to avoid
struggling with the weather.
Discard Mortalities in North Pacific Groundfish Fisheries
North Pacific groundfish fisheries inflict mortality on the following categories of species, 1)target groundfish species, 2) prohibited species, and 3) non-target groundfish species. Forin-season catch and fishing mortality monitoring, it is assumed that all groundfish and otherspecies, except for halibut, caught and discarded at-sea are returned to the sea dead. For most
of the trawl-caught fish, both flatfish and roundfish, this assumption is probably valid for
discards. Similarly, most roundfish, but particularly those inhabiting slope and outer shelf
environments, would probably not survive the ordeal of capture by any gear and thesubsequent return to the ocean. For prohibited species, all herring, salmon, and crab areassumed to die after capture, but Pacific halibut are not. Based on research on survival of
halibut released after capture by trawls (Hoag, 1975) and numerous observations of halibuton-deck condition prior to release by fisheries using all gear types, estimates were made of thepercentage mortality of halibut in each groundfish fishery (Williams, 1989). Based on
additional years of data collection in 1990-93 in both the BSAI and GOA, Williams (1994)recommended halibut mortality rates for each gear, fishery and area for 1995 (Table 54). Asexpected, halibut mortality rates associated with fixed gear (longline and pot) fisheries were
lower than those from trawl fisheries. Variation in mortality rates between trawl fisheries was
76
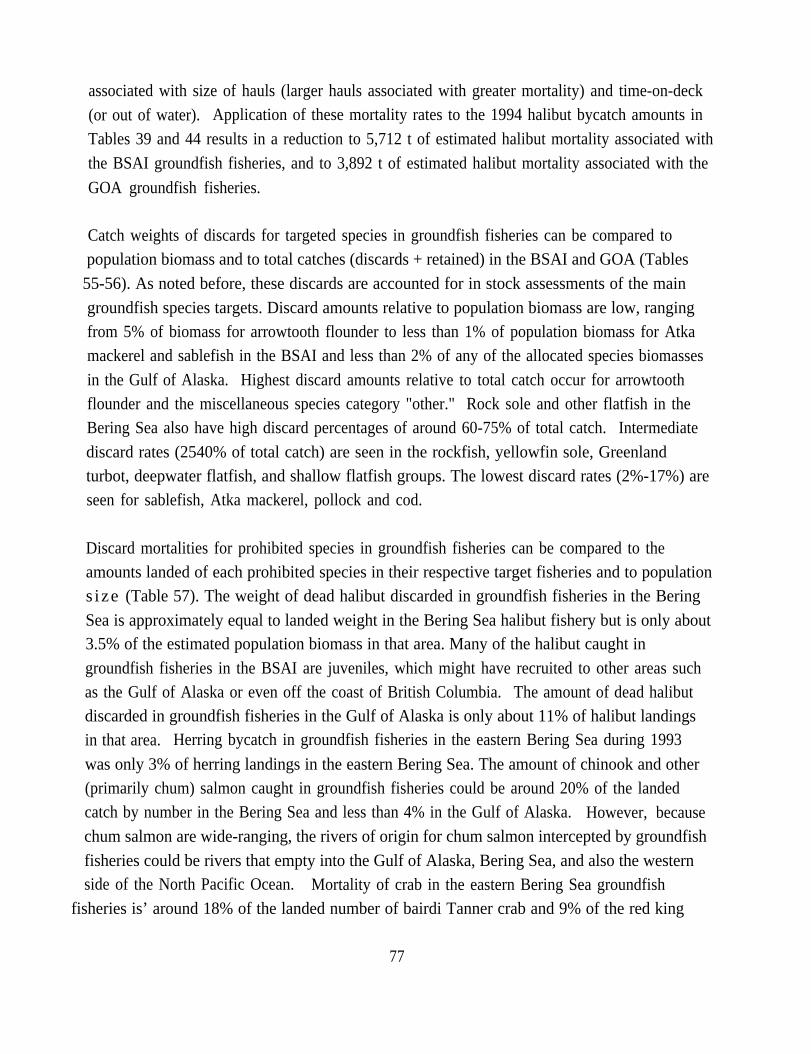
associated with size of hauls (larger hauls associated with greater mortality) and time-on-deck
(or out of water). Application of these mortality rates to the 1994 halibut bycatch amounts in
Tables 39 and 44 results in a reduction to 5,712 t of estimated halibut mortality associated with
the BSAI groundfish fisheries, and to 3,892 t of estimated halibut mortality associated with the
GOA groundfish fisheries.
Catch weights of discards for targeted species in groundfish fisheries can be compared topopulation biomass and to total catches (discards + retained) in the BSAI and GOA (Tables
55-56). As noted before, these discards are accounted for in stock assessments of the main
groundfish species targets. Discard amounts relative to population biomass are low, rangingfrom 5% of biomass for arrowtooth flounder to less than 1% of population biomass for Atkamackerel and sablefish in the BSAI and less than 2% of any of the allocated species biomasses
in the Gulf of Alaska. Highest discard amounts relative to total catch occur for arrowtoothflounder and the miscellaneous species category "other." Rock sole and other flatfish in theBering Sea also have high discard percentages of around 60-75% of total catch. Intermediate
discard rates (2540% of total catch) are seen in the rockfish, yellowfin sole, Greenlandturbot, deepwater flatfish, and shallow flatfish groups. The lowest discard rates (2%-17%) areseen for sablefish, Atka mackerel, pollock and cod.
Discard mortalities for prohibited species in groundfish fisheries can be compared to theamounts landed of each prohibited species in their respective target fisheries and to population s ize (Table 57). The weight of dead halibut discarded in groundfish fisheries in the Bering
Sea is approximately equal to landed weight in the Bering Sea halibut fishery but is only about3.5% of the estimated population biomass in that area. Many of the halibut caught in
groundfish fisheries in the BSAI are juveniles, which might have recruited to other areas suchas the Gulf of Alaska or even off the coast of British Columbia. The amount of dead halibutdiscarded in groundfish fisheries in the Gulf of Alaska is only about 11% of halibut landingsin that area. Herring bycatch in groundfish fisheries in the eastern Bering Sea during 1993
was only 3% of herring landings in the eastern Bering Sea. The amount of chinook and other(primarily chum) salmon caught in groundfish fisheries could be around 20% of the landedcatch by number in the Bering Sea and less than 4% in the Gulf of Alaska. However, becausechum salmon are wide-ranging, the rivers of origin for chum salmon intercepted by groundfish
fisheries could be rivers that empty into the Gulf of Alaska, Bering Sea, and also the westernside of the North Pacific Ocean. Mortality of crab in the eastern Bering Sea groundfish
fisheries is’ around 18% of the landed number of bairdi Tanner crab and 9% of the red king
77

crab landings in that area. Because some of the bairdi Tanner crab caught by groundfish
fisheries are pre-recruit crab, the actual number of those pre-recruits that would have survived
to enter the directed crab fishery is less than the number caught by groundfish fisheries.
78
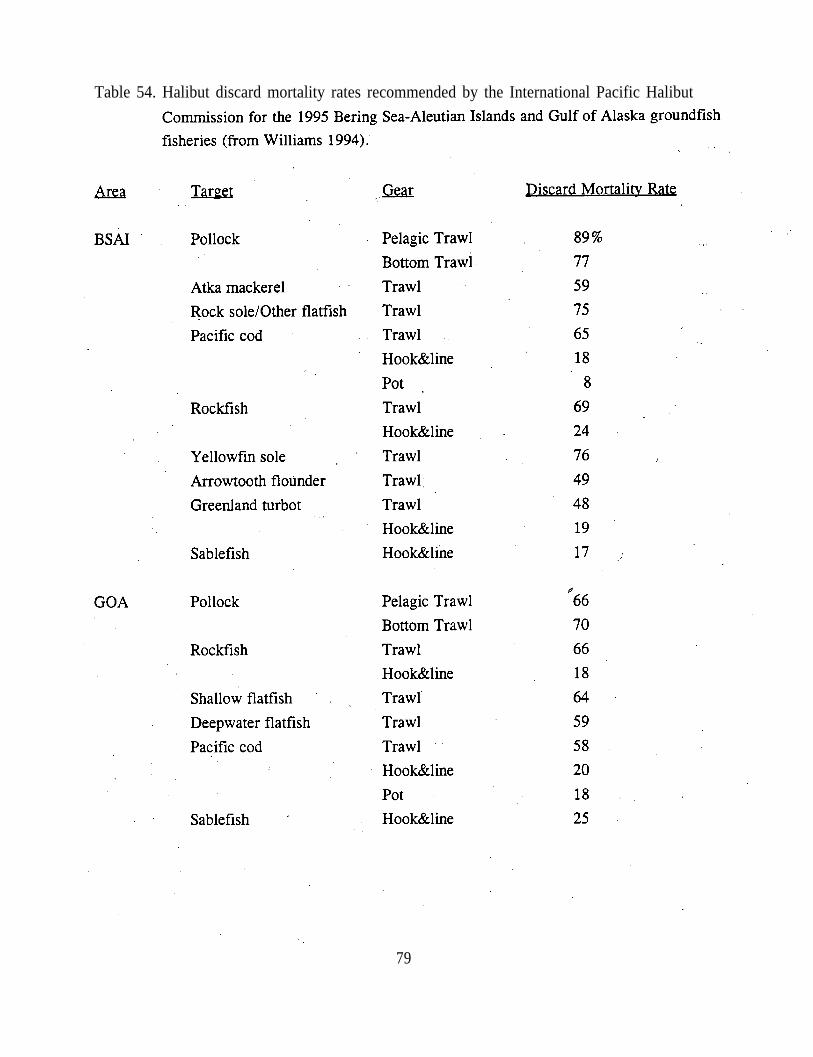
Table 54. Halibut discard mortality rates recommended by the International Pacific Halibut
79
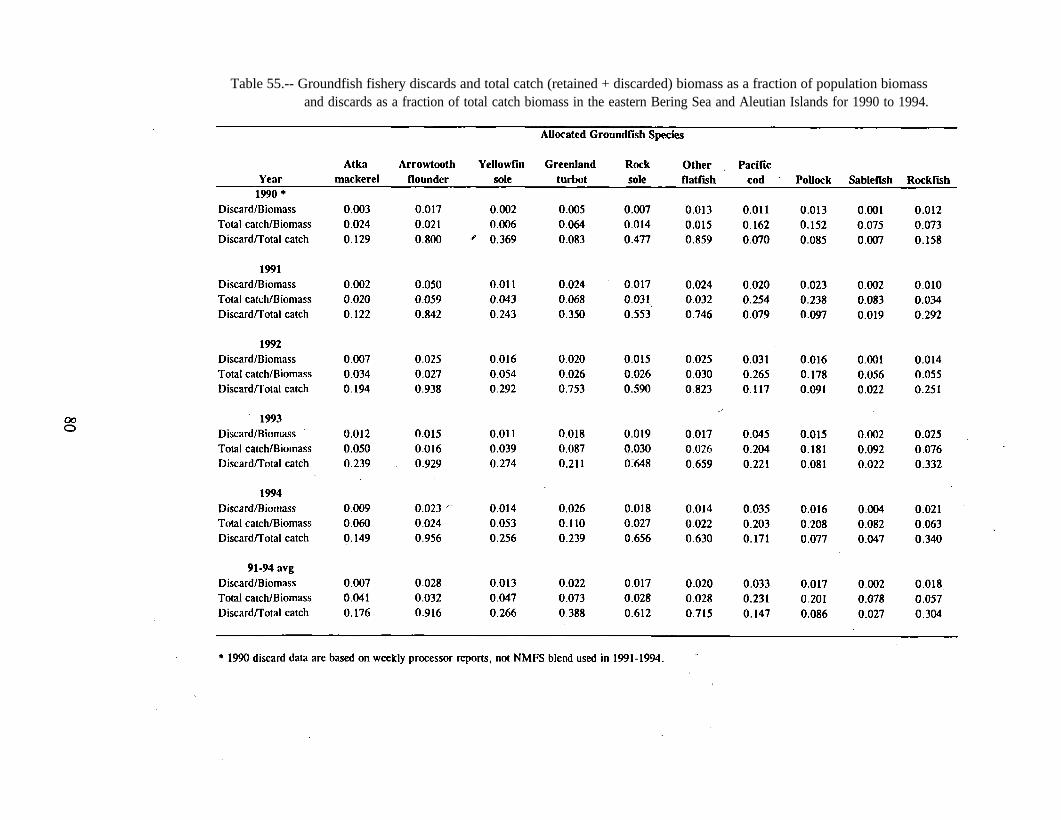
Table 55.-- Groundfish fishery discards and total catch (retained + discarded) biomass as a fraction of population biomassand discards as a fraction of total catch biomass in the eastern Bering Sea and Aleutian Islands for 1990 to 1994.
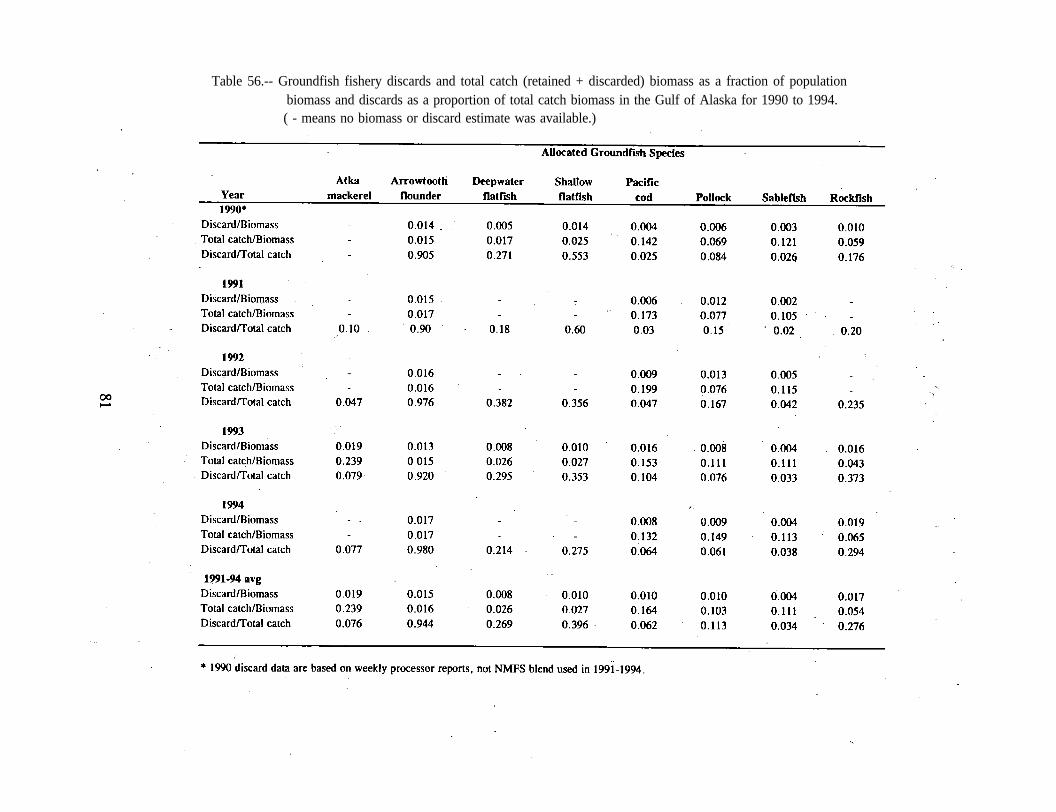
Table 56.-- Groundfish fishery discards and total catch (retained + discarded) biomass as a fraction of populationbiomass and discards as a proportion of total catch biomass in the Gulf of Alaska for 1990 to 1994.( - means no biomass or discard estimate was available.)
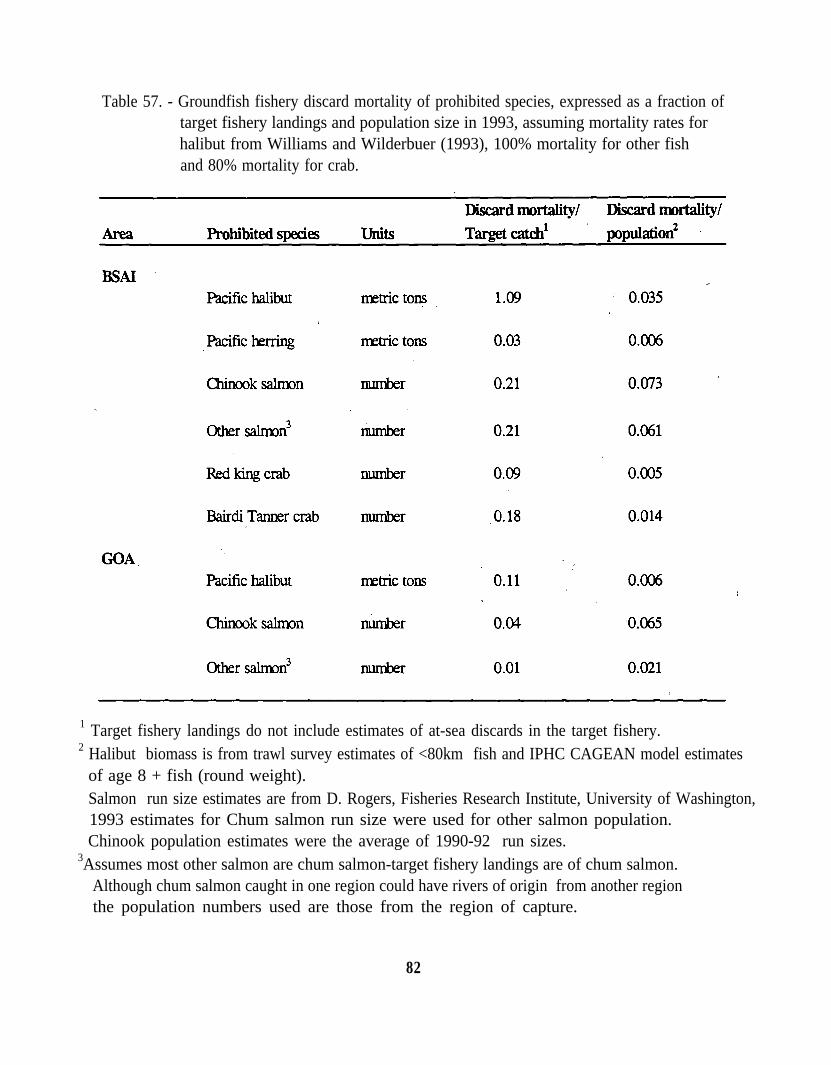
Table 57. - Groundfish fishery discard mortality of prohibited species, expressed as a fraction oftarget fishery landings and population size in 1993, assuming mortality rates forhalibut from Williams and Wilderbuer (1993), 100% mortality for other fishand 80% mortality for crab.
1 Target fishery landings do not include estimates of at-sea discards in the target fishery.2 Halibut biomass is from trawl survey estimates of <80km fish and IPHC CAGEAN model estimates
of age 8 + fish (round weight).Salmon run size estimates are from D. Rogers, Fisheries Research Institute, University of Washington,1993 estimates for Chum salmon run size were used for other salmon population.Chinook population estimates were the average of 1990-92 run sizes.
3Assumes most other salmon are chum salmon-target fishery landings are of chum salmon.Although chum salmon caught in one region could have rivers of origin from another regionthe population numbers used are those from the region of capture.
82
Estimates of mortality due to discards in the target fisheries or in other non-groundfishfisheries are not available for all prohibited species. However, these discard mortalities can be
larger than those induced by groundfish fisheries. For example, the bycatch of bairdi Tanner
crab in crab pots during the 1993 bairdi crab season was estimated to be 68,910,000 crabs. If
a mortality factor of 8% (from Table 53) is applied to these, then discard mortality of bairdicrab in crab pot fisheries was about 36% of the landed number of bairdi crab, which was15,317,000 crabs. Similarly, for red king crab in 1992 the crab pot fishery discarded around7,320,000 crabs. If mortality is again assumed to be around 8%) then crab pot fishery discard
mortality of red king crab was around 40% of the red king crab landings, which were1,415,000 crabs, or about four times larger than the mortality induced by groundfish fisherydiscards shown in Table 57.
Finally, it is possible that the amount of “other” species caught and discarded in groundfishfisheries could be an important source of mortality for those species. The mortality of groups
such as skates, sculpins and grenadiers, which make up the largest bycatch amount for “other”species in groundfish fisheries, has not been explicitly considered in the past. The amount of
these “other” species groups discarded in groundfish fisheries can be compared to biomassestimates of these species to get an idea of the impact of fisheries on these groups (Table 58).Exploitation rates (catch biomass/population biomass) are low for skates and sculpins in the
BSAI and GOA areas, ranging from 14%. The exploitation rate for grenadiers in the Gulf of
Alaska appears high (32 %) but biomass estimates of grenadiers are severely underestimated bybottom trawl surveys in the GOA that only cover bottom depths up to 500 m since the majorityof grenadier biomass is found in deeper waters. It is likely the true exploitation rate of
grenadiers is close to those of skates and sculpins.
83
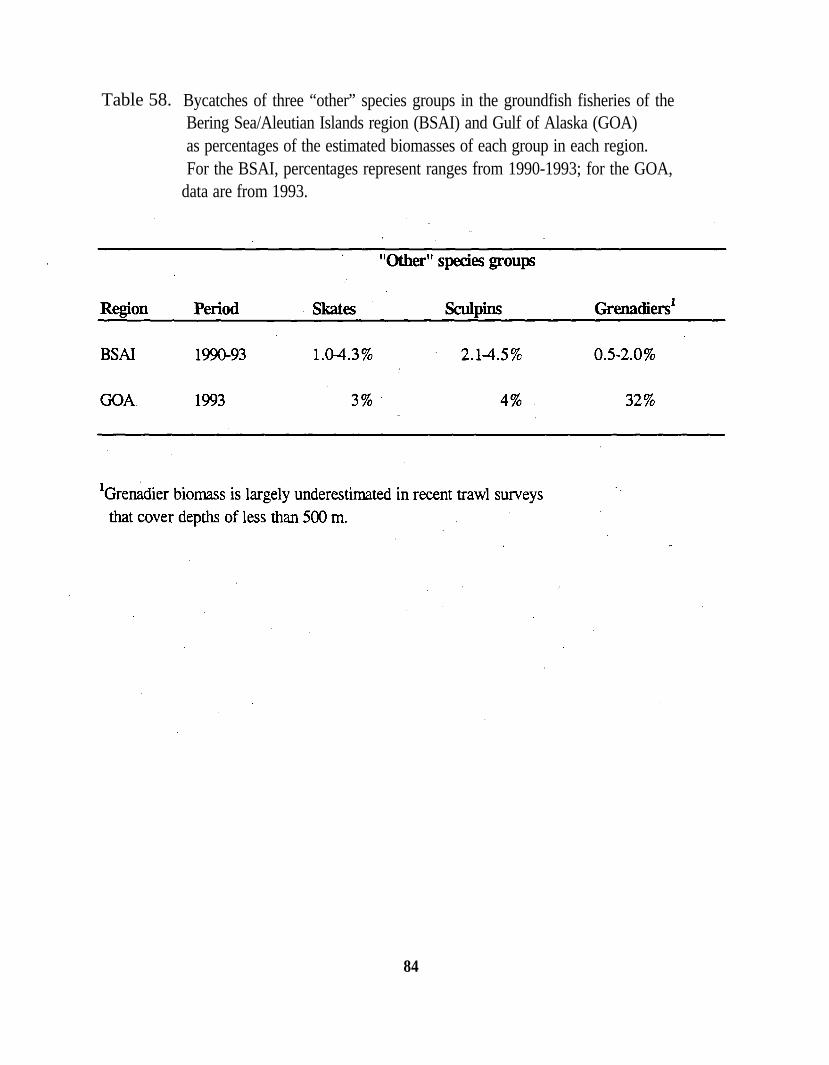
Table 58. Bycatches of three “other” species groups in the groundfish fisheries of theBering Sea/Aleutian Islands region (BSAI) and Gulf of Alaska (GOA)as percentages of the estimated biomasses of each group in each region.For the BSAI, percentages represent ranges from 1990-1993; for the GOA,
data are from 1993.
84
Ecological Impacts
Several aspects of the current fishing, discarding, and processing practices of North Pacificgroundfish fisheries have the potential to alter the regular paths of energy flow and balance in
the BSAI and GOA. Although estimated mortality due to direct removals and discard ofutilized groundfish species is accounted for in the stock assessment process, little is knownabout the ecosystem-level effects, of selective harvesting on only a small number of species.Also, fishing removes biomass from the system but discarding and fish processing return some
biomass back to the system. The recipients, locations, and forms of this returned biomass maydiffer from those in an unfished system. Finally, the fishing process itself may cause
unobserved mortalities in animals escaping through the trawl mesh or caught by abandonedpots or longlines. Mortality of bottom-dwelling animals can also be caused by the mechanical,
action or weight of fishing gear on the bottom.
Effects of Selective Fishing
The fishing process selectively removes certain species and sizes of fish. This selectionprocess could alter the balance between predators and prey and thus the species composition of
the ecosystem. If the species composition is much different from the “natural” state the systemcould be more unstable. Another concern expressed in recent years is the negative effects of
“fishing-down” the food web, or the practice of intensively harvesting top-predators and thenmoving down the food web to harvest forage of top-predators (Christie, 1993). Yieldenhancements expected through this fishing-down process have not materialized in regionswhere this practice has been implemented. In fact, the recent steps taken toward multispecies
management in the northwest Atlantic Ocean (Shelton, 1992) and in the Southern Ocean have
been directed at limiting the target catches of forage species such as capelin (Mallotus villosus)
and krill (Euphausiidae).
In a review of marine regions where species replacement changes occurred, Daan (1980) noted
that overfishing was a likely trigger. He found that changes in species compositionin other regions where overfishing was not occurring were more likely environmentally driven
cyclic fluctuations. An analysis of trends in species composition in the eastern Bering Sea
(Livingston et al., 1994) showed that although there have been fluctuations in species biomass
in some groups over the last 15 years, these fluctuations do not appear to be linked to
exploitation rates. Exploitation rates in this region have been conservative when compared toregions where replacement changes due to overfishing have occurred.
85
To determine whether North Pacific fisheries were “fishing-down” the food web, the trophic
level of the catch in the eastern Bering Sea, Aleutian Islands, and Gulf of Alaska areas was
calculated bydeterminin g the trophic level of each species in the catch from published
accounts of diet for non-groundfish species and the food habits database of the AlaskaFisheries Science Center for groundfish species. Trophic level (e.g., 1 for phytoplankton, 2for consumers of primary production, 3 for consumers of secondary production) of the totalcatch was determined by weighting the trophic level of each species in the catch by the
proportion (by weight) of that species in the total catch and summing the weighted trophic
levels in each year. Stability in the trophic level of the total fish and invertebrate catches inthe eastern Bering Sea, Aleutian Islands, and Gulf of Alaska (Fig. 3) are an indication that the“fishing-down” effect is not occurring in these regions. Catch biomass in the eastern BeringSea has consisted mainly of pollock since the late 1960s. In the Aleutian Islands area catcheswere mostly Pacific ocean perch in the 1960s and walleye pollock, Pacific cod, and Atkamackerel in the late 1970s to the present. Gulf of Alaska catches in the 1960s were dominatedby rockfish and changed to pollock-dominated catches in the 1980s with declining
contributions of pollock to the total catch in the 1990s. Although, there has been a generalincrease in the amount of catch since the late 1960s in all areas, the trophic level of the catch
has been high and stable over the last 25 years. A trophic level of 4 indicates the dominanceof top-level predators in the catch.
The combination of relatively conservative exploitation rates and high trophic level of thecatches over the last 15 years, at least in the eastern Bering Sea, could be responsible for therelative stability of overall community composition over this recent period shown by
Livingston et al. (1994). A study of the trophic levels of the catch in the North Sea (Yang,
1982) showed the apparent stability of the North Sea ecosystem during a period when thetrophic level of the catch was high. Recent analysis of the North Sea community structure(Anon., 1994) confirms the stability of community diversity of that area even though fishing
has apparently changed the shape of the size spectrum via the removal of large predators.
However, these factors cannot explain the obvious changes that have occurred in theabundance of several species in the North Pacific, notably the declines in red king crab and
some piscivorous bird species in the Bering Sea and Steller sea lions in the Gulf of Alaska.
There have also been large declines in whale and fur seal populations prior to 1979.
Environmental changes or localized habitat alteration by fishing have been suggested as
possible explanations but no conclusive evidence exists to identify the causative factor(s).
86
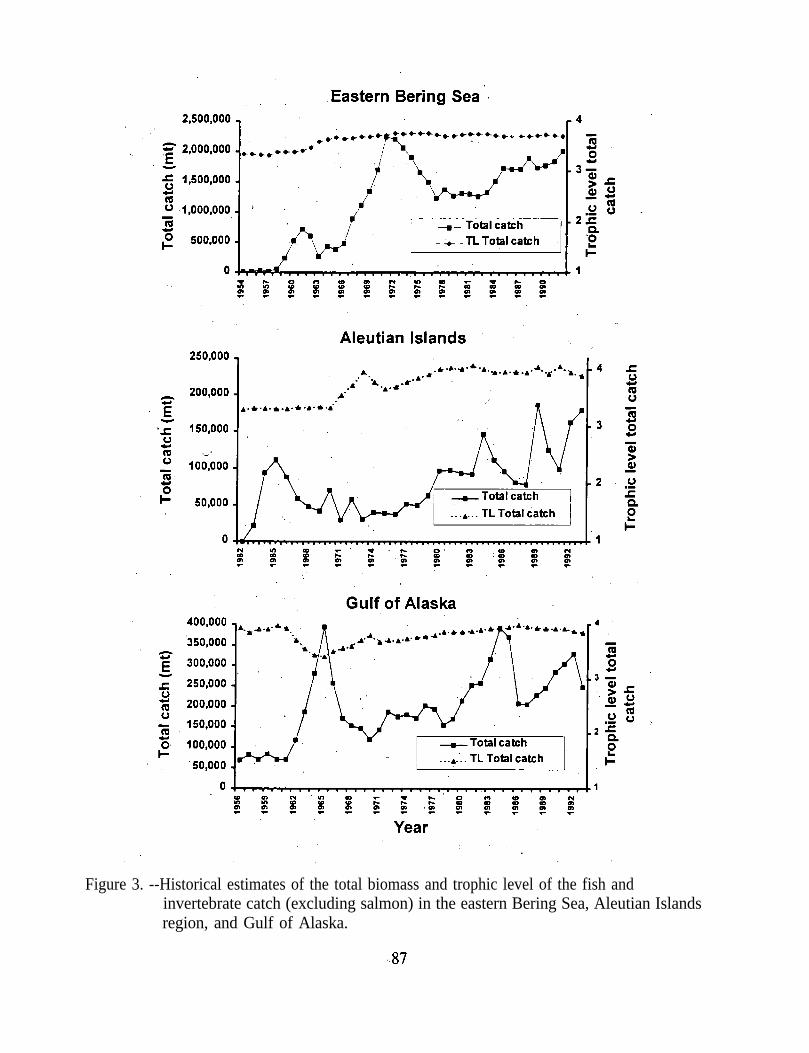
Figure 3. --Historical estimates of the total biomass and trophic level of the fish andinvertebrate catch (excluding salmon) in the eastern Bering Sea, Aleutian Islandsregion, and Gulf of Alaska.
Consumers of Discards and Fish Processing Offal
Several years of groundfish food habits data collected by the Trophic Interactions Program at
the Alaska Fisheries Science Center confirm the consumption of fish processing offal by fish
in the eastern Bering Sea, Aleutian Islands region, and Gulf of Alaska. Estimates ofgroundfish consumption of offal in the Bering Sea during the main feeding season show a level
of offal consumption by several species of groundfish approaching 200,000 t/yr (Table 59).Although the estimated total amount of offal consumed by pollock is fairly high at around
45,000 t/yr, the percentage of offal in the diet is less than 1% by weight. It is the large
biomass of pollock relative to other predators that brings its estimated consumption up to thislevel. Pacific cod consumed the most offal compared to other groundfish in 1990 and 1991.The percentage by weight of offal in the diets of Pacific cod and skates is higher than the other
groundfish species sampled in the eastern Bering Sea.
Diet information on groundfish from the Gulf of Alaska and Aleutian Islands region (Yang,1993 and 1995) also show several species consuming unground offal (Table 60). In the Gulf
of Alaska, sablefish had the largest percentage by weight of offal in the diet (29%), followed
by Pacific cod (13%) and Pacific halibut (7%). The amount of offal in the diet of groundfish
from the Aleutian Islands region is low, except for northern rockfish (Sebastes polyspinis) (9%
of the diet by weight). It should be noted that the diet percentages for the Gulf of Alaska and
Aleutian Islands region were derived from grouping all food habits data for a species over the
whole region. Lower percentages would likely result from predator-size and area stratificationof the diet information.
An estimate of the amount of offal returned to the sea by at-sea and onshore processors can beobtained from subtracting the total round weight of the groundfish catch retained andprocessed from the product weight, which is available for 1994 (see Table 61). Estimated at-
sea offal production in the GOA and BSAI is 862,483 t (= round weight of the catch(1,240,858 t) - product weight (378,375 t)) and shoreside offal production is 477,312 t.
Presumably, the majority of offal produced at sea is in the Bering Sea and consists of pollockparts. Based on the estimates in Table 59, it appears that groundfish in the eastern Bering Sea
consume at least 20% of offal production. This compares to an estimate of about 11% of totaldiscards consumed by fish and crab in a study area off Australia (Wassenburg and Hill, 1990).
88
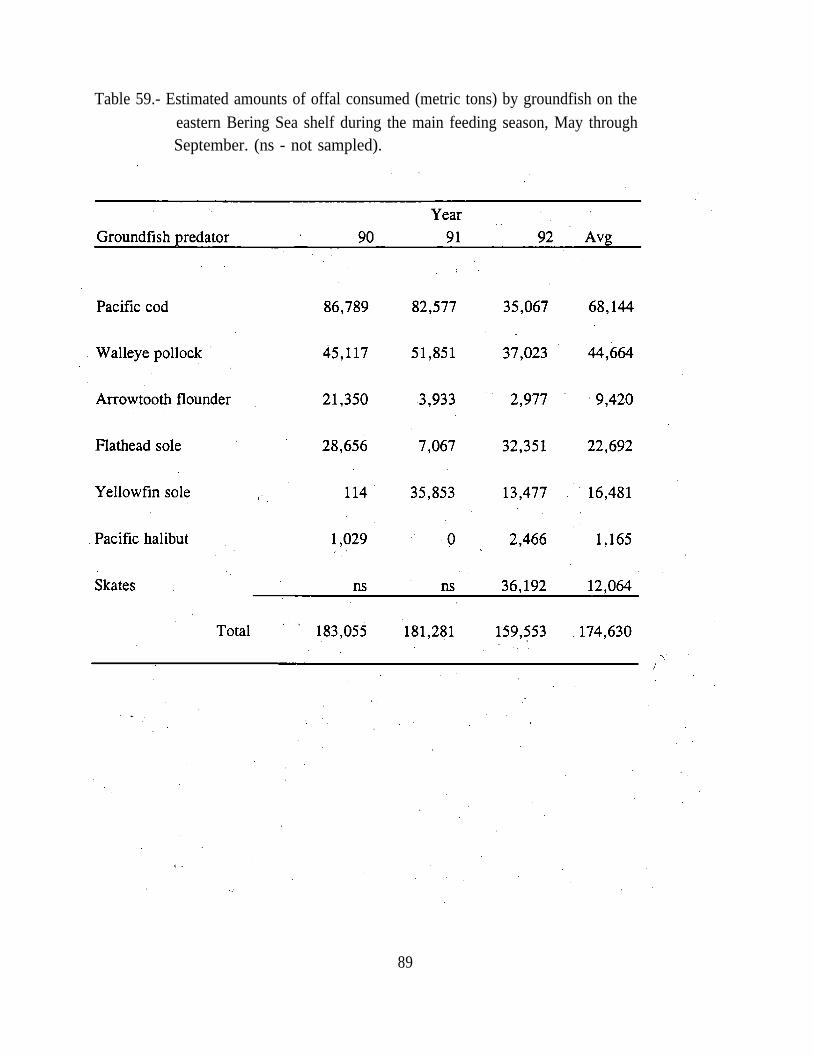
Table 59.- Estimated amounts of offal consumed (metric tons) by groundfish on theeastern Bering Sea shelf during the main feeding season, May throughSeptember. (ns - not sampled).
89
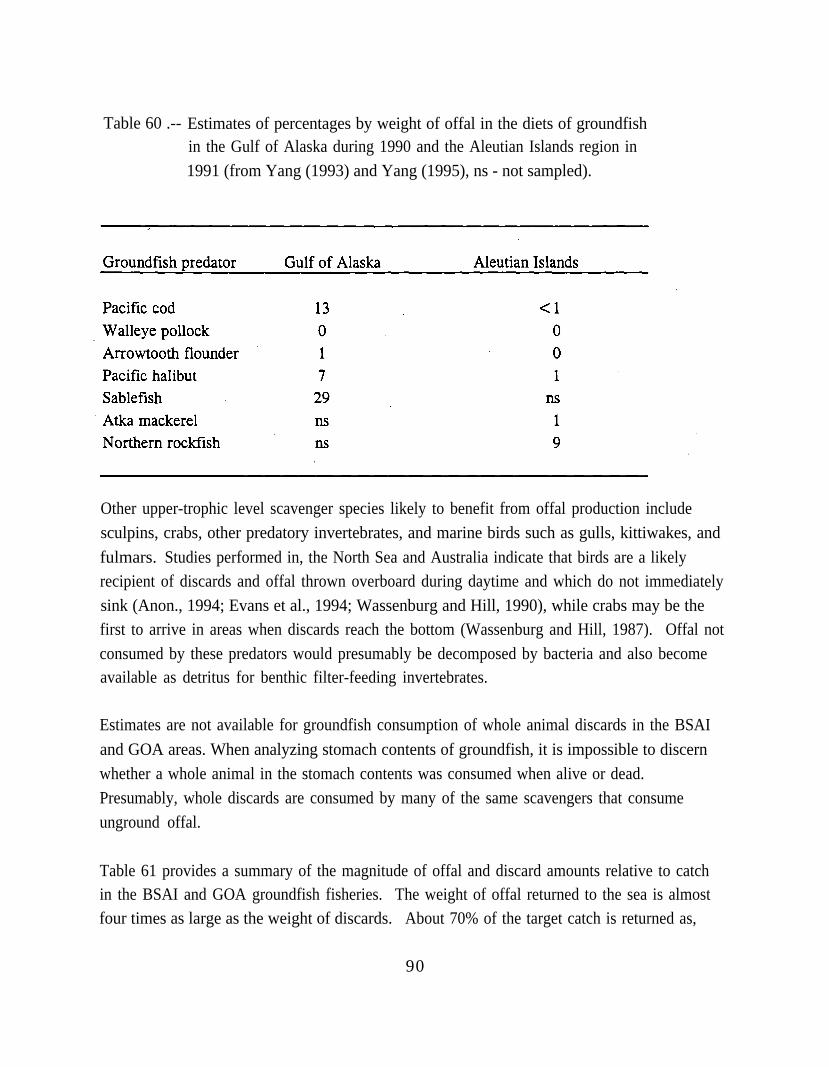
Table 60 .-- Estimates of percentages by weight of offal in the diets of groundfishin the Gulf of Alaska during 1990 and the Aleutian Islands region in
1991 (from Yang (1993) and Yang (1995), ns - not sampled).
Other upper-trophic level scavenger species likely to benefit from offal production include
sculpins, crabs, other predatory invertebrates, and marine birds such as gulls, kittiwakes, and
fulmars. Studies performed in, the North Sea and Australia indicate that birds are a likelyrecipient of discards and offal thrown overboard during daytime and which do not immediately
sink (Anon., 1994; Evans et al., 1994; Wassenburg and Hill, 1990), while crabs may be thefirst to arrive in areas when discards reach the bottom (Wassenburg and Hill, 1987). Offal not
consumed by these predators would presumably be decomposed by bacteria and also becomeavailable as detritus for benthic filter-feeding invertebrates.
Estimates are not available for groundfish consumption of whole animal discards in the BSAI
and GOA areas. When analyzing stomach contents of groundfish, it is impossible to discern
whether a whole animal in the stomach contents was consumed when alive or dead.
Presumably, whole discards are consumed by many of the same scavengers that consume
unground offal.
Table 61 provides a summary of the magnitude of offal and discard amounts relative to catchin the BSAI and GOA groundfish fisheries. The weight of offal returned to the sea is almostfour times as large as the weight of discards. About 70% of the target catch is returned as,
90
offal. Almost 60% of the total catch becomes offal while only 15% of the total catch isdiscarded whole. Obviously, when considering energy transfer in the ecosystem, offal
production overshadows discard amounts. The large proportion of the total catch returned tothe sea as offal and discards could reduce any potential impacts of fishing to energy loss in
these areas. However, availability of the returned energy (as offal and discards) to various
ecosystem components may differ from that of the undisturbed energy form (live fish).
Ecosystem level concerns about discards and offal production primarily center on the
possibility that these fishery practices might alter the regular paths of energy flow and enhancethe growth of scavenger populations. In the eastern Bering Sea, at least one-half of thediscards and most of the offal produced are from pollock. Most of the remaining discardstends to be flatfish such as yellowfin sole (Pleuronectes asper) and rock sole. All of thegroundfish species found to be consumers of offal (Table 60) are also predators of pollock,and some of them (Pacific cod and halibut) also consume flatfish (Livingston et al., 1993).
The scavenging birds (gulls, fulmars, kittiwakes), are also documented predators of pollock(Hunt et al., 1981). The annual consumptive capacity of these scavenging birds, groundfish,
and crab in the eastern Bering Sea alone is over an order of magnitude larger than the total
amount of offal and discards in the BSAI and GOA (Livingston, unpublished data). Sincemany of the main predators of pollock are consuming offal and discards, it appears that thepractice of returning them to the ocean may not significantly disrupt regular paths of energy
flow when the geographic location of the return to the sea is close to the capture location.Although fishing removes some biomass from the system, the actual amount removed in theBSAI and GOA is much less than the total catch would indicate. A large proportion of thetotal catch is, in-fact, returned and apparently consumed by predators.
Even if offal and discards are not used by the upper trophic level scavengers that are a regular
part of the energy pathway for pollock and flatfish, the total amount of dead organic material(detritus) that would reach the bottom is’ small relative to other natural sources of detritus.
Walsh and McRoy (1986) estimate detrital flow to the middle and outer shelf of the eastern
Bering Sea to be 188 gCm2 yr-1 and 119 gCm2 yr-1, respectively. When converted to biomassover the whole area4, an estimated 337.7 million t of naturally-occurring detritus goes to the
bottom each year. Approximately 40% (142.9 million t), is unused (Walsh and McRoy, op.
4Assuming 0.4 gC/1g dry weight and 0.5 g dry weight/lg wet weight, and total middleshelf area = 4 x 10⁵ km2 and outer shelf area = 2.2 x 10⁵ km2.
91
cit.). The total offal and discard production in the BSAI and GOA as estimated for 1994 (1.3million t; Table 61) is only 1% of the estimate of unused detritus already going to the bottom.Simulation model results of discard effects on energy cycling in the Gulf of Mexico (Browder,
1983) confirmed that discards tend to be a small portion of the dead organic material on the
bottom. However, depending on model assumptions, changing the amount of discards through
full utilization or through selective fishing methods had the potential to change populations ofshrimp and its fish competitors. Uncertainty about the predation rates and assumptions about
alternate prey utilization indicated a need for further research to fully understand and predict
responses of populations to changes in food availability.
92
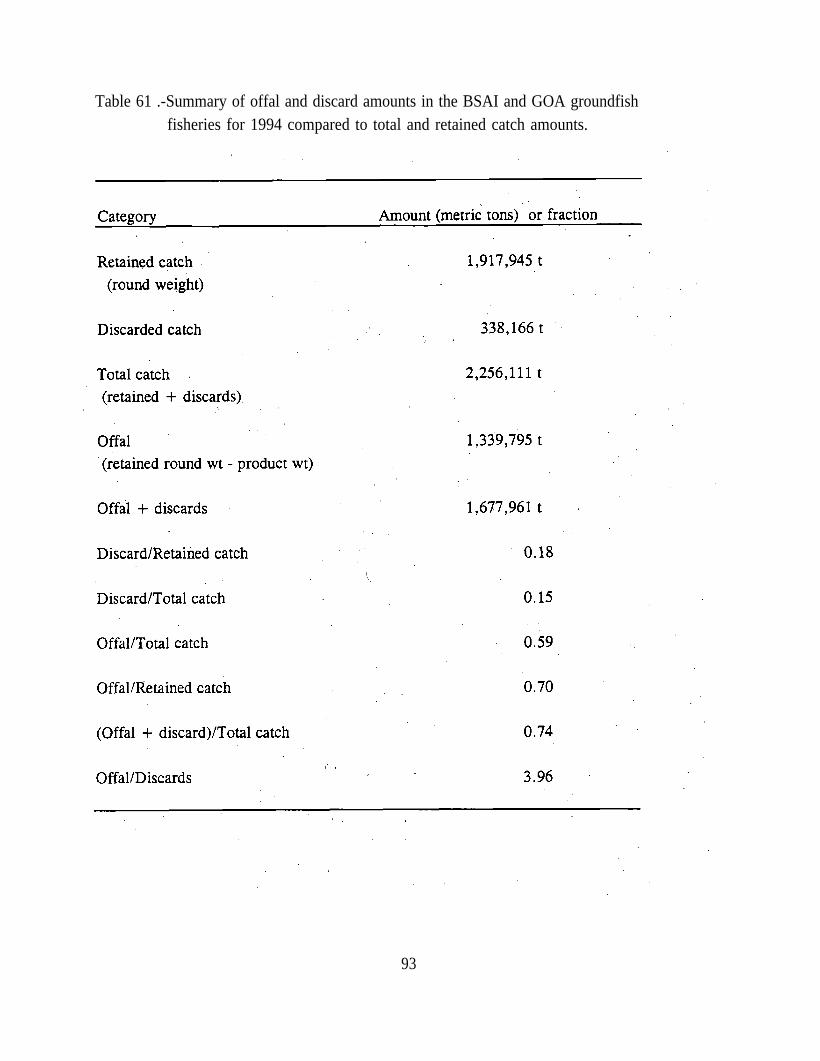
Table 61 .-Summary of offal and discard amounts in the BSAI and GOA groundfishfisheries for 1994 compared to total and retained catch amounts.
93
Local enrichment and change in species composition in some areas might occur if discards oroffal returns are concentrated there. There is evidence that such effects have been seen inOrca Inlet in Prince William Sound and in Dutch Harbor, Alaska. Poor water quality and
undesirable species composition have been cited (Thomas, 1994) as the result of the current
policy for grinding fish offal released in inshore areas and the inadequate tidal flushing in thatregion. However, deepwater waste disposal of offal in Chiniak Bay of Kodiak Island has notshown such problems (Stevens and Haaga, 1994). No apparent species composition changes,anaerobic conditions, or large accumulations of offal occurred in Chiniak Bay where such
wastes have been dumped for over a decade. Local ocean properties (water depth and flow)
and amount of waste discharged per year could be important factors determining the effect ofnearshore disposal on local marine habitat and communities.
So far, most of the scavenger populations are not showing obvious signs of increase related tooffal production. Kittiwake populations that nest on the Pribilof Islands have apparentlydeclined from 1979 to 1989 (Hatch et al., 1993). Decline in food availability has been cited asa possible reason for the decrease in productivity for both kittiwake species. The distribution
and timing of the pollock catch processing has shifted away from a predominance of fishing
during summer around the outer shelf to a winter (A season) and summer (B season) fisherythat occurs farther south in the outer and middle shelf areas (Fritz, 1993). This shift in fishingdistribution away from summer bird foraging areas did not occur until about 1987 (Fritz et al.,
1994) and cannot explain the population decline. Northern fulmar (Fulmarus glacialis)
population size at the Pribilof Islands is showing a possible increase, particularly from 1989 to1992. However, there is large variability around fulmar counts that makes determination ofthe population trend uncertain (Climo, 1993; Dragoo and Sundseth, 1993). Kittiwake
population increases have been noted in Chiniak Bay, the site of offal disposal at KodiakIsland. The increases there occurred between the late 1970s and mid-1980s (Hatch et al., op
cit.); apparently before offal disposal at that site began. Some of the main scavengers in the
groundfish community of the eastern Bering Sea such as Pacific cod, skates, halibut andsculpins have shown a combined biomass of around 1.2 million t in 1979 to over 1.3 million tin 1993 (Livingston et al., 1994). The only member of that group that might be exhibiting a
constant increasing trend in biomass is the skates, whose biomass has doubled between 1982
and 1993. Little is known about the skate population, such as size or age-frequency over time,that might provide clues to why this change in biomass has occurred.
94
Unobserved Mortalities
The fishing process itself may cause unobserved mortalities in animals that escape through the
mesh of trawls or that are damaged by the action of the trawl passing over them. In addition,
longline and pot gear may continue to fish after being lost or abandoned. A recent review of
studies on the condition of fish escaping from fishing gear (Chopin and Arimoto, 1995) found
a wide range of estimated mortalities. The percent age mortality of fish escaping from trawlgear ranged’ from 9% to 90% depending on the fish species, size of fish, and conditions of the
experiment. Fish with an opercular circumference of the same or larger size as the mesh maysustain more physical damage than smaller fish but stress inflicted due to the capture process(e.g., long sustained periods of swimming) can also be an important source of mortality for allfish. The authors suggest that standard protocol for conducting survival experiments,
including longer term studies to estimate survival due to stress ‘are required beforeknowledgeable decisions regarding the effect of mesh size restrictions can be evaluated. Theyadvise that management measures undertaken to increase escapement of immature fish byincreasing minimum mesh size could also increase mortality and conclude that such measures
may not be the best method for protecting immature fish.
The evidence regarding the mortalities of animals in or on the bottom and possible long-term
changes in the sea floor due to fishing gear shows mixed conclusions. Comparison of gear-induced mortality rates with natural mortality rates of the benthos in the heavily fished North
Sea indicated that natural mortality rates were much larger than those from fishing (Daan,1991), suggesting that fisheries exert a relatively small influence on the biomass of benthos.Most studies agree, however, that the larger, longer-lived animals in the sediments such as
some clams are likely to be the most affected (Daan, 1991; Anon., 1994). Long-term changesin the benthos and persistence of trawl tracks have been found particularly in very deep water
(Jones, 1992). Even though direct contact with gear may not inflict direct mortality, the gearaction can expose burrowing animals and make them more vulnerable to predation (Kaiser and
Spencer, 1994). It has been hypothesized that intensive fishing in an area could promote long-term changes in benthic communities by promoting populations of opportunistic fish species
that migrate into fished areas to feed on animals disturbed by the fishing process.
Diet of a benthic-feeder, yellowfin sole, was examined during the period from 1984 to 1991 to
determine if any changes have been apparent and could be linked to fishing activities in the
eastern Bering Sea (Fig. 4). Prey composition was analyzed in two adjacent areas, a no-trawl
95
zone (North Pacific Fishery Management Council area 512 where trawling has been excludedsince 1986) and a trawl zone ( a similar size area just west of area 512 where trawling still
occurs in the eastern Bering Sea). No definitive trends in diet composition could be seenbetween the two areas. Polychaete worm consumption was similar between the two areas and
consumption of echiuran worms increased in the trawled area compared to the no-trawl area.Echiurans are relatively short-lived worms that burrow into the sediment. Trawling couldexpose these animals and make them more vulnerable to predation immediately after a trawlpassed through. If trawling were responsible for the increase in predation on echiurans, it
would have been expected that the fraction of echiurans in the diet would have been
consistently high in the trawl zone over the whole time series and would have declined in theno-trawl zone during the years when no-trawling was in effect (1986-91). Other studies havefound an increase in amphipod predation due to the effects of trawling (Kaiser and Spencer,
1994) but our data indicate slightly higher predation on amphipods in the no-trawl zone than in
the trawl zone. It is difficult to know whether changes have occurred in the eastern BeringSea benthos without detailed study of the benthos and its biomass and composition before andafter trawling. Yellowfin sole do not consume large, longer-lived clams or colonial ascidians
that could be more sensitive indicators of the effects of fishing. However, there does not
appear to be any major changes in certain species based on their amounts in the yellowfin soled i e t .
96
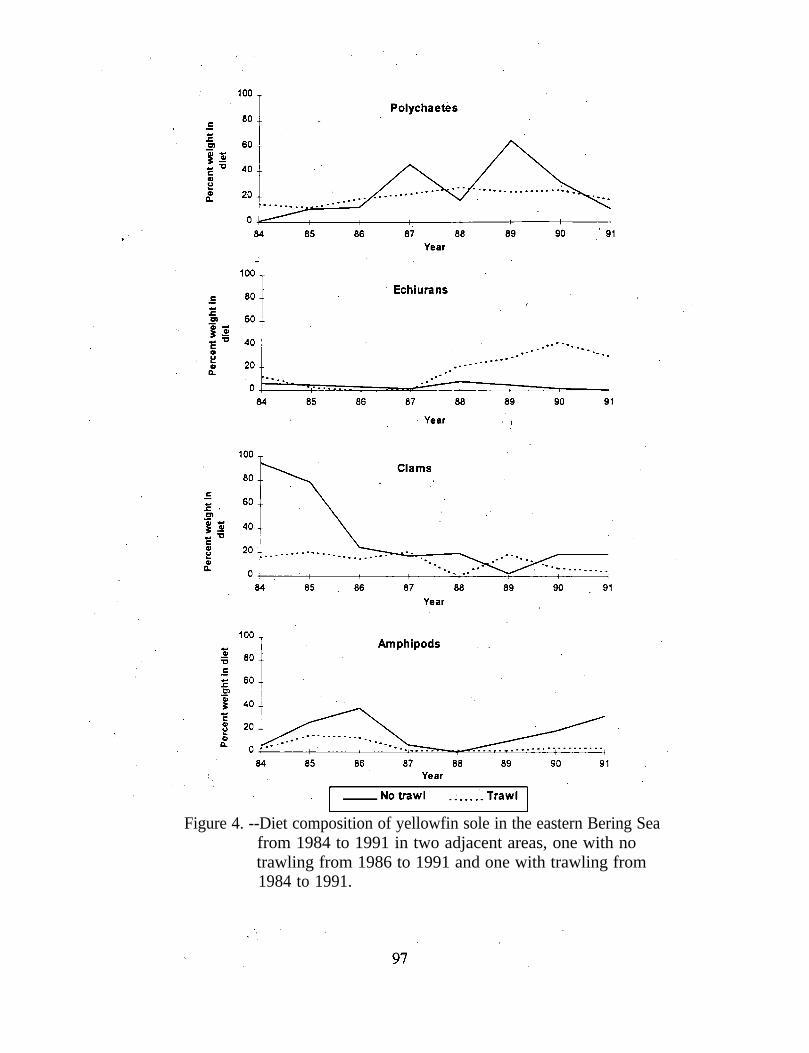
Figure 4. --Diet composition of yellowfin sole in the eastern Bering Seafrom 1984 to 1991 in two adjacent areas, one with notrawling from 1986 to 1991 and one with trawling from1984 to 1991.
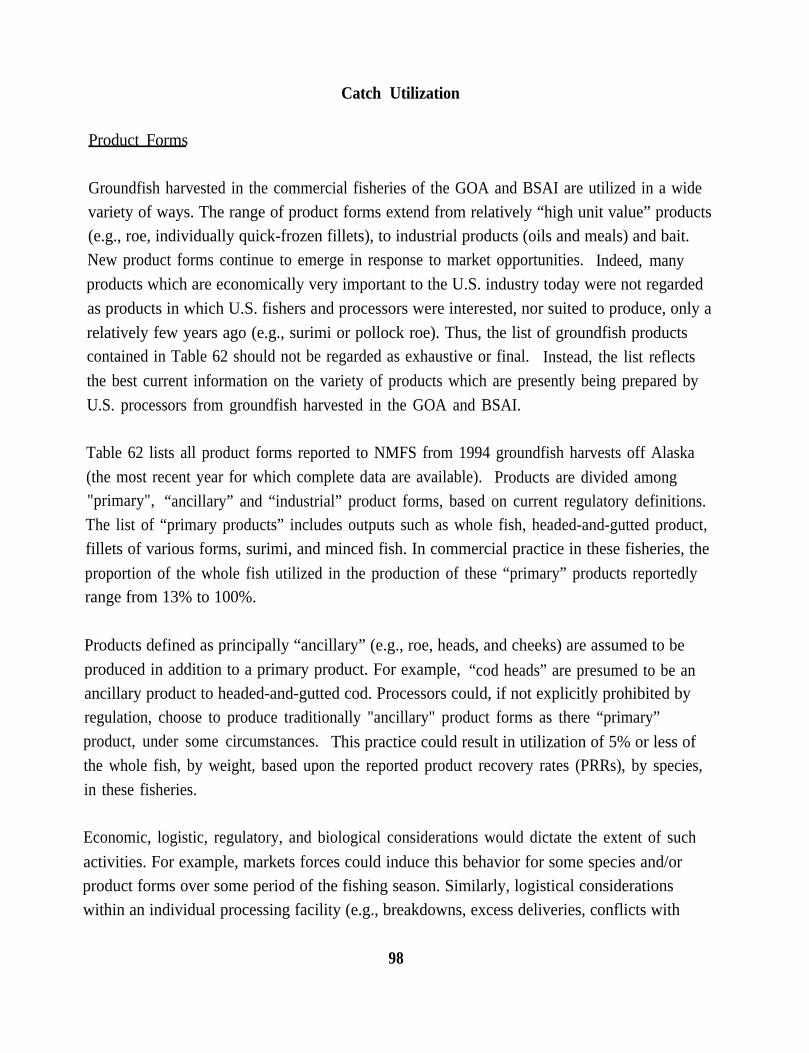
Catch Utilization
Product Forms
Groundfish harvested in the commercial fisheries of the GOA and BSAI are utilized in a widevariety of ways. The range of product forms extend from relatively “high unit value” products(e.g., roe, individually quick-frozen fillets), to industrial products (oils and meals) and bait.New product forms continue to emerge in response to market opportunities. Indeed, manyproducts which are economically very important to the U.S. industry today were not regarded
as products in which U.S. fishers and processors were interested, nor suited to produce, only a
relatively few years ago (e.g., surimi or pollock roe). Thus, the list of groundfish productscontained in Table 62 should not be regarded as exhaustive or final. Instead, the list reflectsthe best current information on the variety of products which are presently being prepared by
U.S. processors from groundfish harvested in the GOA and BSAI.
Table 62 lists all product forms reported to NMFS from 1994 groundfish harvests off Alaska
(the most recent year for which complete data are available). Products are divided among"primary", “ancillary” and “industrial” product forms, based on current regulatory definitions.The list of “primary products” includes outputs such as whole fish, headed-and-gutted product,fillets of various forms, surimi, and minced fish. In commercial practice in these fisheries, the
proportion of the whole fish utilized in the production of these “primary” products reportedlyrange from 13% to 100%.
Products defined as principally “ancillary” (e.g., roe, heads, and cheeks) are assumed to be
produced in addition to a primary product. For example, “cod heads” are presumed to be anancillary product to headed-and-gutted cod. Processors could, if not explicitly prohibited byregulation, choose to produce traditionally "ancillary" product forms as there “primary”product, under some circumstances. This practice could result in utilization of 5% or less ofthe whole fish, by weight, based upon the reported product recovery rates (PRRs), by species,
in these fisheries.
Economic, logistic, regulatory, and biological considerations would dictate the extent of such
activities. For example, markets forces could induce this behavior for some species and/orproduct forms over some period of the fishing season. Similarly, logistical considerationswithin an individual processing facility (e.g., breakdowns, excess deliveries, conflicts with
98
other fisheries such as salmon, halibut, and crab) could result in diverting fish into productforms generally regarded as “ancillary” (or discarding them altogether). Regulations may also
dictate such production decisions. For example, a short duration opening may result in
processors maximizing “through put” of a particular species, rather than “utilization” (e.g.,
roe stripping of pollock), before it was banned. In other circumstances, the “poor condition”of a species during some periods of the year may prompt its use only for “ancillary” productforms.
The specific output form and product mix in the BSAI and GOA groundfish fisheries is highly
variable. Production characteristics (i.e., form, grade, and product mix) may vary in responseto, among other factors, the type of processing operation (e.g., m-shore or at-sea); the seasonof the year (e.g., the presence or absence of roe); regulatory restrictions (e.g., roe-stripping
prohibition, bycatch-only or non-discretionary discard status); and the nature of the market
(e.g., surimi prices are low relative to fillets). It would be incorrect, therefore, to attribute,
for example, “high” recovery rates, particular product forms, or specific quality or grades
with ‘one specific operational type or configuration. Influenced by these biological,
technological, regulatory, and economic factors, performance may diverge from operation tooperation between and within each category, and even within any given operation, from seasonto season, and fishery to fishery.
It should be noted that the comparison of physical measures of product output (e.g., PRRs orquantity of output) as a measure of utilization may be misleading. The appropriate comparisonis the value of the product produced. For example, if the greatest product recovery from each
fish were the correct measure by which to compare alternative product forms, then fish “sold-in-the-round” would always be the preferred form of utilization. Clearly, this is not the case.Instead, the unit value of each product provides an efficient means of making comparisons
across product forms and across species. Product price serves as an efficient mechanism tocompare the “value” of utilizing a fish to produce, say, a unit of pollock fillets and a unit of
pollock headed and gutted (II&G).
5 Value net of production costs would be the theoretically correct measure with whichto make these comparisons. Often net values are not available, in which case gross values areemployed.
99
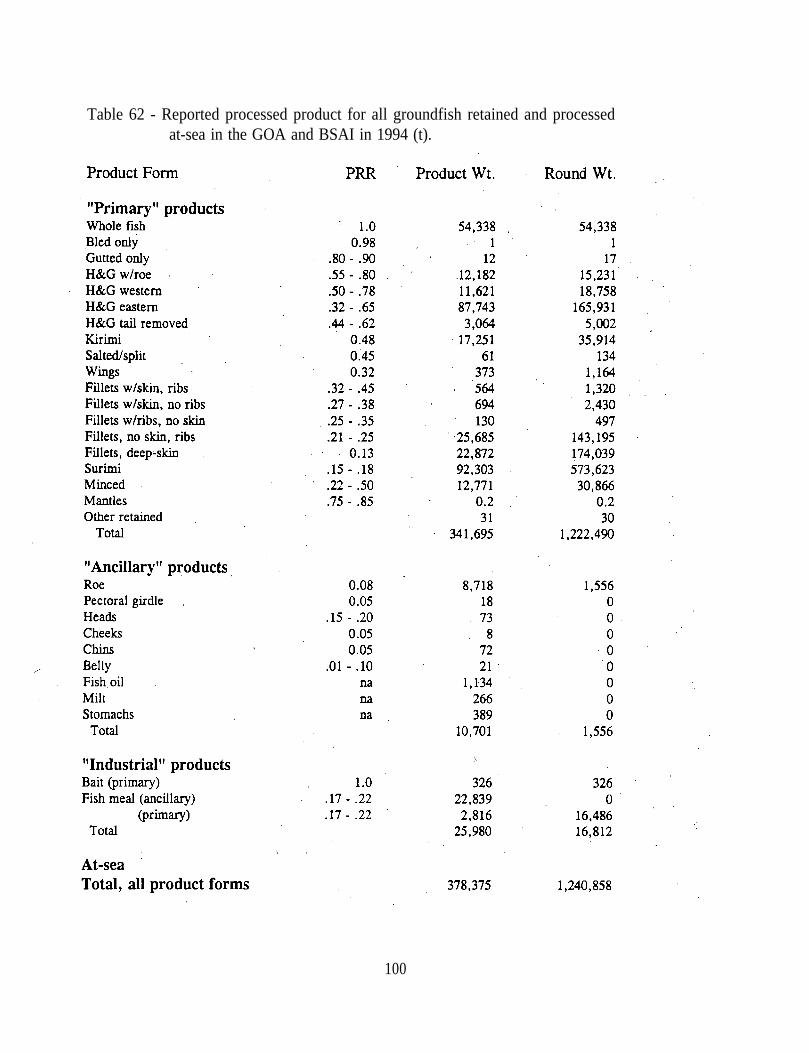
Table 62 - Reported processed product for all groundfish retained and processedat-sea in the GOA and BSAI in 1994 (t).
100
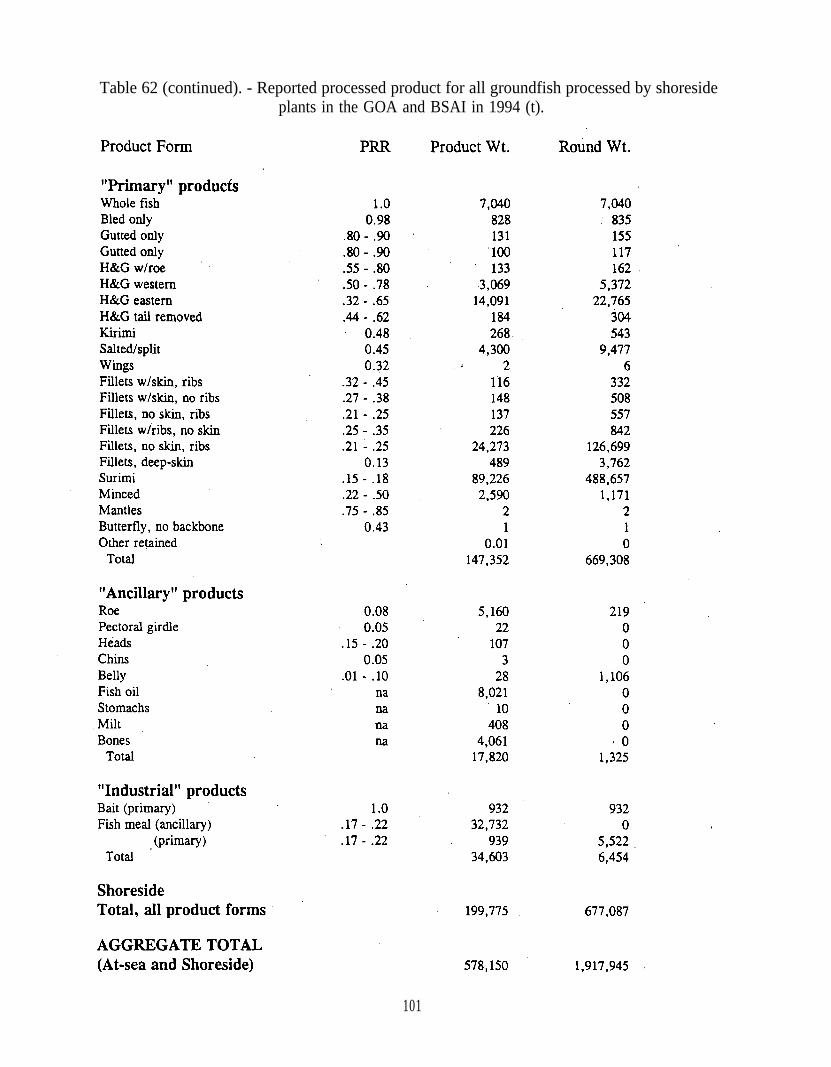
Table 62 (continued). - Reported processed product for all groundfish processed by shoresideplants in the GOA and BSAI in 1994 (t).
101
Limits on Production
Technical Limitations
Changes in industry standards of retention and utilization of catch involve adjustment costs.Historically some groundfish discards in the BSAI and GOA fisheries have been required by
regulations, economic considerations (e.g., lack of markets or lower values than the primary
target species, etc.), or other discards that may have occurred for “technical” reasons.
Existing mechanical processing technology imposes both effective and absolute limits on the
size (and to perhaps a lesser extent, species) of fish which can be efficiently converted into amarketable product form (excluding, of course, meal reduction). From the standpoint ofassessing changes in processed product form or recovery rates, existing production capacityand technology can be regarded as fixed, in the short-run, and only marginally flexible in theintermediate-run. While each operation in the BSAI and GOA groundfish fisheries is uniquein terms of configuration, capacity, and technology, all are constrained by similartechnological and market limitations on what can be produced from the raw catch. These
limitations may be useful indicators of the potential for change in catch retention and
utilization patterns.
Size frequencies and species composition in the BSAI and GOA fisheries vary significantly.Some of the most pronounced year-to-year variability can be explained by the presence of an
exceptionally strong (or weak) cohort, which can be seen to move through the fishery in
successive years. So, for example, when an unusually abundant year class first recruits into afishery, the proportion of “small fish” to total catch of a given species may increasedramatically. As this year class grows and matures, it represents a greater share of each
year’s total catch of that species. Over time, the proportion of “small fish” to total landingsfalls. Therefore, in any given year, for any given species, the range of size of fish, and theproportional composition of each size class to the total may be different. Because size andmaturity are important aspects of some product forms for some species, these biologically-
related externalities can directly affect catch utilization, product mix, and value,
An example of how the population dynamics of a groundfish stock can affect catchcomposition, and thus utilization, is presented below. While the example selected focuses on
102
the BSAI mid-water pollock fishery, a similar dynamic would apply to most other directed
groundfish fisheries in this region.
In the case of the BSAI mid-water pollock fishery, utilizing a 5-year mean from 1989 through1993, pollock ranging in size from 11 cm (about 12 gm) to over 83 cm (more than 4,000 gm)are reported in the catch. For the same period, approximately 25% of the catch was equal toor less than 40 cm (approximately 465 gm) in size, approximately 25% was between 41 cm
and 45 cm (up to 650 gm), 25% was between 46 cm and 49 cm (up to 830 gm), and roughlythe final 25% was greater than 50 cm (up to 3,800 gm),
Industry sources and others knowledgeable about this sector of the fish processing industry,
report that, at the present time, the at-sea processing sector fillet and surimi production reliesheavily on Baader processing technology (e.g., Baader 182, 190, and 212 filleting machines).
The shorebased operators rely upon the same technology, although additional Toyo processingcapacity exists in this sector.
Technical information, provided by Baader Fish Processing Machinery, suggests that each ofthese filleting machines have absolute limits on the size of pollock which can be processed.
For the Baader 190, the limits range from 33 to 66 cm. For the Baader 212, which also
allows the extraction of roe, the bounds are 35 to 55 cm. The 182 Baader machine, in its
standard configuration, can process pollock in the range of 27 to 42 cm; although in its morecommonly used alternative configuration, with mechanical modifications, the machine can
process fish of 35 cm to 52 cm.
These mechanical limits define the boundaries of possible production for specific product
forms without modification to the machines. Utilizing these technical limits, in combinationwith historical size composition data for the BSAI mid-water pollock fishery, it appears that,
on average, approximately 1.75% of the catch (in numbers of fish) will be below the minimumsize for mechanical processing for operations employing the factory configured Baader 182
machines. With the more common modification to utilize 35 to 55 cm fish, 7.4% of the
pollock catch would be too small for the Baader 182. Just over 5% of total pollock catch will
be too small to process using Baader 190s and 7.4% will be below the lower size limit for useof the Baader 212 machine. Reportedly, Toyo machines will process pollock as small as 27
cm, equivalent to the lower bound of the standard Baader 182 configuration.
103
Market Limitations
Technology, currently available to the industry, does not provide a means to utilize a fish at
the lower end of the size range taken in the pelagic trawl fishery for anything but meal
reduction purposes.6 One operator reported that, “you put the really small fish into thesystem and they just fall through the grates ‘in the machines. ”
At the upper-limits, using the standard factory configuration of the Baader 182 would mean
that, in the pelagic trawl pollock fishery, nearly 59.5% of the total pollock catch would be toolarge for these machines. In the modified configuration which accommodates fish as large as
52 cm, just over 10% of the pollock catch would be too large for the machines. For operatorswith Baader 190 machines, less than 0.25% of the catch could not be processed by machine.
The Baader 212, with an upper bound of 55 cm, could handle all but about 4.4% of the
pollock caught. Toyo machines reportedly have an upper-bound limit of 2,000 gm or about 66
cm. This is equivalent to the Baader 196 limit. Very large fish, which cannot be
mechanically processed, could perhaps be processed by hand.7
Beyond the technological limits of the existing physical plant in these fisheries, there arelimits which dictate how (or if) a particular processor will utilize delivered catch. In a sense,
the technological limits describe what “can” be processed, while markets define what “should”be processed, at least in the short-run, from the perspective of the plant operator.
If a profit-maximizing firm expends scarce productive resources (e.g., labor, capital), to
produce a product for which there is no market, that firm will not remain in business for long.It is important, therefore, to consider what “market” limitations (in addition to the
6 Obviously, very small fish could be frozen in-the-round, however, it is unlikely amarket could be found for such a product.
7 A vessel may undertake actions which exert some control over the size compositionof its catch, although trawling is; by definition, a non-selective technology. Further, if spacewere no limitation, a mixture of machines could permit mechanical processing of most of thepollock. However, physical limitations do constrain the options available to most vessels andcost considerations, touched on in the next section, also dictate utilization decisions.
104
“technological limitation”) may confront the domestic groundfish industry in the short-run.
Continuing to use the BSAL mid-water pollock fishery as an example, industry sources suggest
that current markets dictate the following limits. For pollock fillet production the “minimum”size fish that can be used to produce a marketable product is about 350 gm round weight (orroughly 36 cm). For surimi production, the lower limit is about 300 gm (approximately 34cm). Pollock H&G requires a fish of no less than 350 gm. Another industry source reported
that, as a rule, his operation did not buy pollock of less than 450 gm (approximately 40 cm),
although fish of as small as 400 gm (about 38 cm) would be the lower limit for surimiproduction. Deep-skin blocks and individually quick frozen fillets required fish of 600 gm
(roughly 44 cm). Small fish under the identified minimums could not be utilized to produce a
“saleable” product (other than meal) in existing markets.
These market limits, when compared to average size composition data for the BSAI mid-waterpollock fishery, cited above, suggest that the range of useable pollock is somewhat narrower
than the range dictated by technology, all else equal. Operations producing fillets or H&Gproduct may not be able to market “primary” product from the smallest 9.4% of the totalcatch, that is, fish less than 36 cm in length. Surimi producers may not be able to producemarketable primary product from as much as 6% of the pollock catch. Obviously, for thoseproducts and producers which “require” larger fish, even more of the average pollockproduction would be unsuited to primary product production, (e.g., deep-skin block).
While the BSAI mid-water trawl fishery catch is consistently made up of 99% pollock, the
catch does contain other species. Pacific cod with small amounts of flatfish make up most of
the catch balance. Species other than that “targeted” by an operator potentially presentsignificant additional problems, both technical and market-related. For example, a processing
facility configured and equipped to process, say, pollock surimi would be ill-equipped to
convert flatfish into a marketable product form. Likewise, that same surimi processor mightdiscover that handling, packaging, and marketing an unfamiliar product form, that is, flatfish
fillets, is unprofitable.
105
Historically, NMFS found it necessary, for management, monitoring, and enforcement
purposes, to define, in formal regulation, standard product types and associated PRRs for the
groundfish fisheries of the BSAI and GOA. Used to estimate round weight equivalents ofgroundfish catches, standardized PRRs assume a fixed proportion of the amount of primary
processed product to be derived during processing. Additional products obtained from the
same fish are classified as ancillary products.
Beginning in 1990 and continuing through 1991, NMFS monitored groundfish catches in theBering Sea and Gulf fisheries solely on the basis of standard PRRs, by applying the
appropriate “standard” recovery rate to the amount of processed product reported by industry through the Weekly Production Reports. In 1992, NMFS began the monitoring of deliveries
of groundfish to onshore processors on the basis of landed weight, thus avoiding for the mostpart the use of PRRs for this sector of the industry. However, catches, of groundfish in the
offshore processing sector continued to be monitored on the basis of product weights and
standard PRRs.
An important exception to this rule was made in for the pollock fishery. In 1992, NMFS
utilized a “blend” system for at-sea pollock catches which compared observer estimates of totalcatch with that reported by the operator in the Weekly Production Report. If the two sources
were within 10% of one another, the Weekly Production Report was employed. If they variedby more than 10%) the observer estimate was used. The single exception to this rule came in
the case where the Weekly Production Report was more than 20% higher than the observerestimate, in which case the Weekly Production Reportwas accepted. While the “blend”
procedure reduced the relative importance of standardized PRRs, they continue to beemployed, in combination with the Weekly Production Report data, in this estimation method.
The following year, 1993, the “blend” estimation procedure was adopted for all at-sea
groundfish processors. The “decision threshold” which dictated the use of observer
information or the Weekly Production Report was lowered to 5%. In 1994, the “blend”model was again modified, such that, in the pollock fishery only, the threshold for selecting
the Weekly Production Report estimates when the observer data are significantly lower, waschanged from 20% to 30%. For all other species, the threshold remained at 20%.
106
Consistent estimation of total catch remains a critical consideration in assuring optimum
utilization of the groundfish resource, over tune. While direct use of PRRs has diminished in
importance for catch monitoring, accurate determination of round weight equivalent catch
estimates, derived by backcasting from processed product utilizing PRRS, continues to be anecessary means of in-season catch monitoring and enforcement. In this way the fullest
possible harvest may be obtained, while minimizing the risk of overfishing these valuable
resources.
Standardized PRRs are also used to estimate the round weight equivalent of retained speciesfor purposes of assigning vessels to specific fisheries for monitoring bycatch allowances ofprohibited species (PSC), or monitoring compliance with fishery specific standards under
Vessel Incentive Programs to reduce PSC rates.
At present, NMFS has established a total of 30 standard product types for these fisheries.With each standard product type, for each listed species, there is associated a single standard
PRR (with the exception of pollock surimi for which two PRRs are prescribed: one for the A-
season and one for the B-season). The official PRRs are listed in Table 63.
107
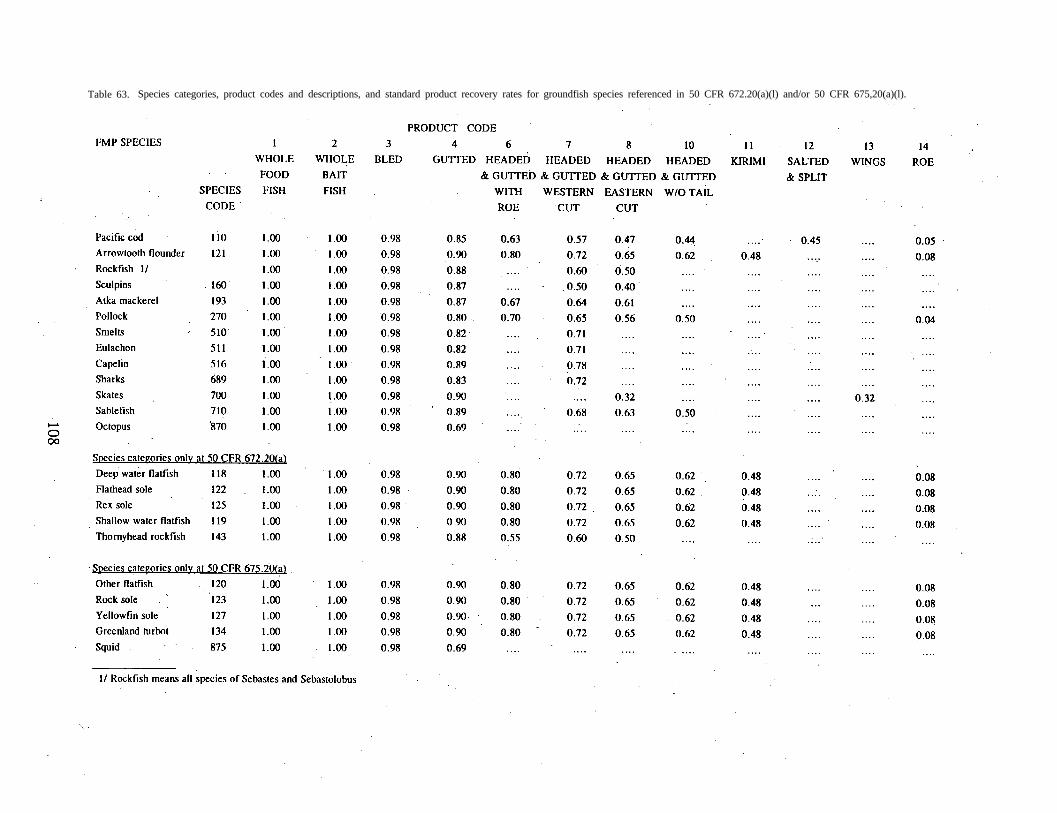
Table 63. Species categories, product codes and descriptions, and standard product recovery rates for groundfish species referenced in 50 CFR 672.20(a)(l) and/or 50 CFR 675,20(a)(l).
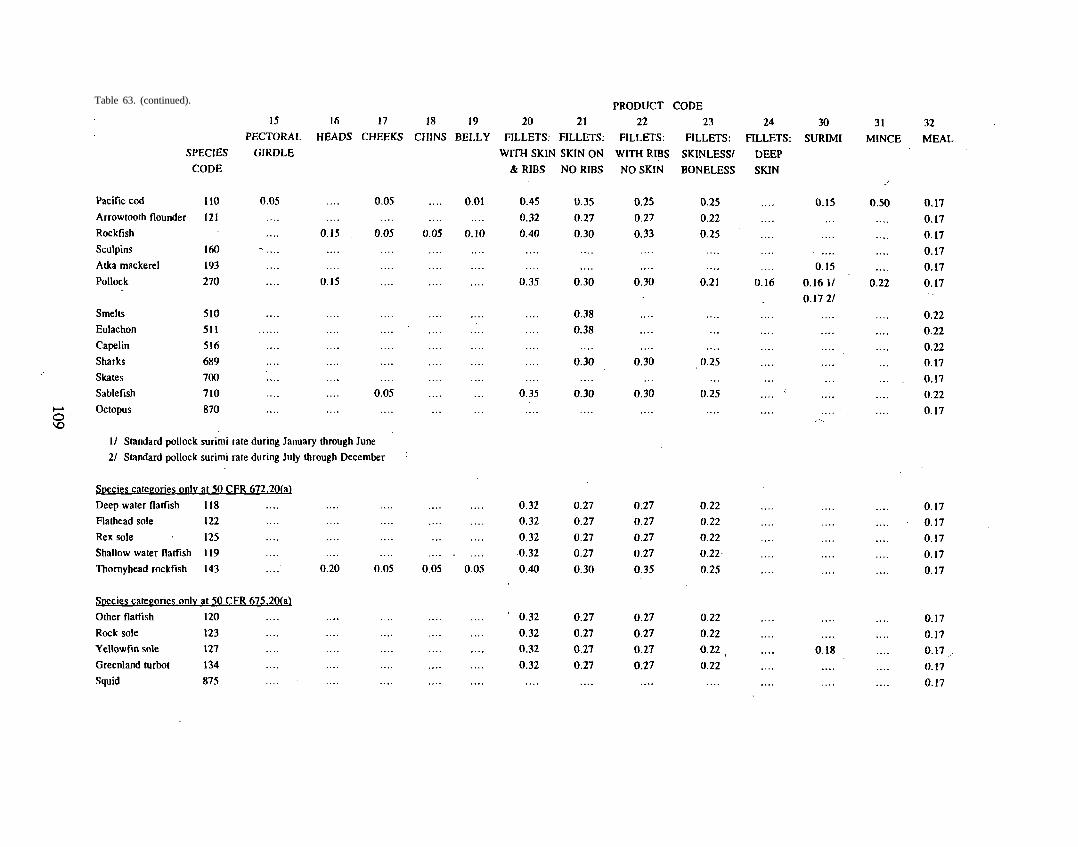
Table 63. (continued).
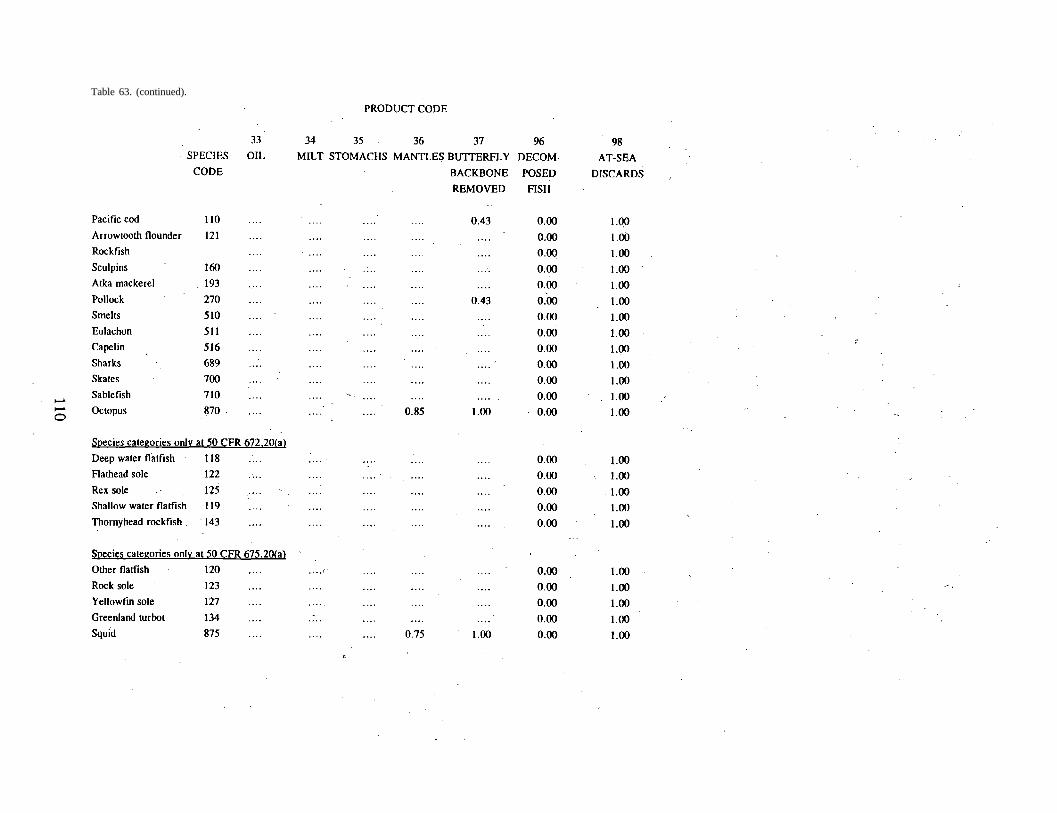
Table 63. (continued).
Product Recovery Rates Variability in the Field
The foregoing discussion suggests the importance of establishing accurate “standard” PRRs, byspecies and product form. A standard PRR set too high has the potential to result in theoverharvesting of the resource, while if set too low could inappropriately restrict catches andimpose unjustified costs on users.
However, because the groundfish resources in the North Pacific and Bering Sea are so diverse,numerous product forms have emerged to take advantage of specific attributes of the catch andto meet particular market needs and demands. Operationally, PRRs are highly variable andmay differ from operation to operation, or period to period, depending on such factors asproduct mix, fish size and condition, market demand, and species/gender composition.
Some PRRs, by definition, are very low (e.g., heads, cheeks, and milt). Others may bevariable over the course of a fishing season or in response to biological or market conditions(e.g., roe or surimi). The actual rate of recovery attained in an operation may be linked to anumber of competing considerations. For example, the “maximum” PRR attainable is 1.0(i.e., a “whole” fish). This product form may not, however, yield the highest product value.
Even within a particular product type, there may be a direct trade-off between recovery rateand value. Consider the case of pollock surimi. A processor which has the capability toproduce a range of grades of surimi will find that the recovery rate for very high gradeproduct (e.g., SA grade), may be somewhat lower than that for a lower grade product (e.g., Aor B grade). However, the value of the higher quality product may more than off-set thereduction in output. In this case, reliance on comparative PRRs to judge the relative efficiencyof an operation may be inappropriate. As suggested, the physical measure of output, in theabsence of information on relative economic value, ignoresquantity and quality, and may lead to inefficient decisions.
the inherent trade-off between
The groundfish biomass in the BSAI and GOA is relatively abundant and diverse. Thisresource base has traditionally provided a wide array of production opportunities and productoptions. It is reasonable to assume that new uses and product forms will continue to emerge inresponse to market opportunities and changing consumer preferences. As new markets,innovative uses of groundfish, or additional products develop, managers will be challenged torespond with programs which simultaneously facilitate development opportunities, whileensuring the sustainability of the resource base.
111
Markets and Estimated Product Value
The majority of the groundfish harvested in the United States EEZ off Alaska finds its way
into export markets (Kinoshita et al., 1994). Many of the principal groundfish products areexported after undergoing only primary processing in the United States and are reprocessed
into final products, by secondary processors, outside the United States.
Groundfish from the U.S. EEZ off Alaska are exported to many countries. The principal
export markets include Japan, the Republic of Korea, Canada, the People’s Republic of China,and the European community8. Numerous other countries also purchase Alaska groundfish
products, but in much smaller quantities.
In 1990, exports of groundfish products, deriving from fish harvested in the U.S. EEZ offAlaska, totaled more than 432,700 t, with an estimated value of $775,180,000. In 1994, thetotal quantity of these exports had risen only slightly, to 433,959 t, but with an estimated value
of $870,275,000.
The following tables summarizes 1) the reported quantities of these groundfish products, by
primary product form and species category, exported to each of the principal markets, for
1990 through 1994, and 2) their associated value. These data are drawn from United States
Department of Commerce, Bureau of the Census sources for customs districts in Alaska andWashington. To the maximum extent practicable, only products deriving from groundfish
harvested off Alaska are included in the reported export quantities.
The world seafood market was fundamentally changed with the. wide-spread implementation ofExtended Jurisdiction Zones in the early-to-mid 1970s (Queirolo, Johnston and Zhang, l995).
The U.S. fishing industry, and particularly those of the. Pacific Northwest and Alaska, was
among the principal beneficiaries of much of this change, expanding into new markets andsupplying new product forms.
8 The European community, in this context, is distinct from the European Union (EU),here including Denmark, Sweden, Norway, Germany, United Kingdom, Netherlands,Portugal, Spain, France, Italy, and Ireland.
112
In an effort to respond to these institutional changes, official statistical data on U.S. exportproduct categories have changed over time, although there often is a significant lag in this
response. These changes have been made ostensibly to provide greater detail by species and
product form. However, as a result, not all products appear as distinct export categoriesin
each year, although the product may have been present in substantial quantities. For example,“surimi” was not a separate product category until 1992. Prior to that time, export quantitiesof surimi may have been recorded under product categories, “fish, meat/minced”, “fish,
minced”, or “fish balls, cake, pudding”. Despite these difficulties, these export data
demonstrate the wide variety of product forms which derive from the utilization of groundfish
harvested in the U.S. EEZ off Alaska. They also demonstrate the important contribution thesegroundfish resources make to U.S. seafood export trade, and by extension to the economic
well-being of the region, and the world’s supply of seafood products.
Groundfish exports from fisheries in the U.S. EEZ off Alaska varied between 1990 and 1994,both in terms of specific product categories and total quantity. As the data in Table 64
illustrate, total 1990 groundfish exports were 432,744 t for these fisheries. This totalincreased by 8.62% in 1991, to 470,061 t, and by 2.71%, to 482,807 t, in 1992. In both 1993
and 1994, total groundfish exports, attributable to the U.S. fisheries in the EEZ off Alaska,actually declined, first by 5.62% in 1993, then by 7.18% in 1994.
An indication of the increasing product value associated with these groundfish exports isrevealed in Table 65. For example, while the quantity of total exports of these products grew
by 8.62% from 1990 to 1991, the total value increased by 40%. A portion of this increase can
be attributed to a general increase in the world price for groundfish products. In particular,the price of Alaska-origin exports in categories “roe” (up on average $l/lb., from $2.79 to
$3.79), and the “other products” category (primarily surimi, nearly doubling from $.76/lb. to$1.33/lb.) were sharply higher. 9 Additional factors influencing this sharp increase in total
export value may have included growth in U.S. processing capacity and capability to produceoutputs with higher “value-added” characteristics, as well as the changing structural
relationship in seafood trade between, in particular, the United States and Japan, its principal
9Source: R. Kinoshita, A. Greig, and J. Terry, Economic status of the groundfishfisheries off Alaska, 1994. U.S. Dep. Commer., NOAA Tech Memo. NMFS-AFSC-00, xxP. (In prep).
113
market (see, Sproul and Queirolo, 1994).
Total export value for this region increased again, by 3.36%, between 1991 and 1992. In
1993, however, the estimated export value moved sharply lower, declining in aggregate by24%, The principal source of this decline was attributable to a 36.6% drop in surimi prices(from an average $1.45/lb. to $.92/lb.) in that year10
The value of exports rose only slightly,by approximately
2.5%, in 1994.
10 Currency exchange rates and world supply of "substitute" products, includingamong others meat, poultry, and seafood, influence international trade, and thus U.S. exports,in a major way. Over the period of interest, currency, exchange rates have changed rapidly,especially between the U.S. dollar and the Japanese yen. Because Japan is the largest singlemarket for groundfish products deriving from the fisheries off Alaska, the influence has bemagnified with respect to this region’s export statistics.
114
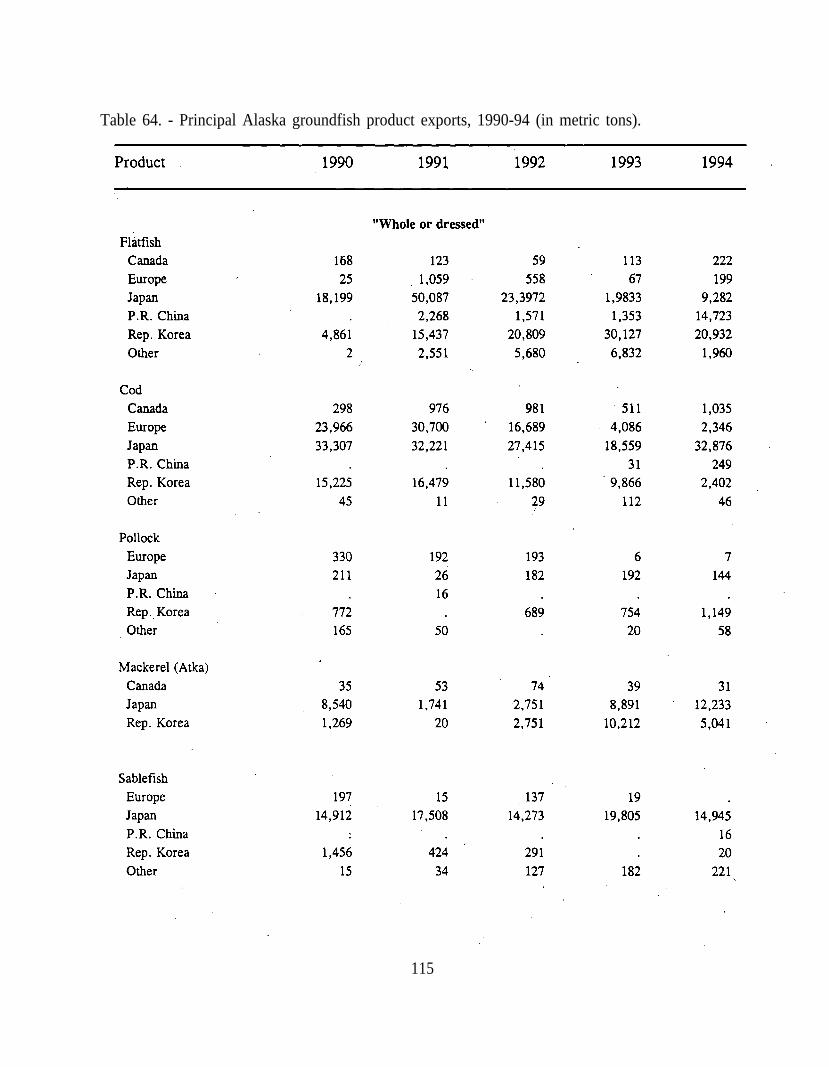
Table 64. - Principal Alaska groundfish product exports, 1990-94 (in metric tons).
115
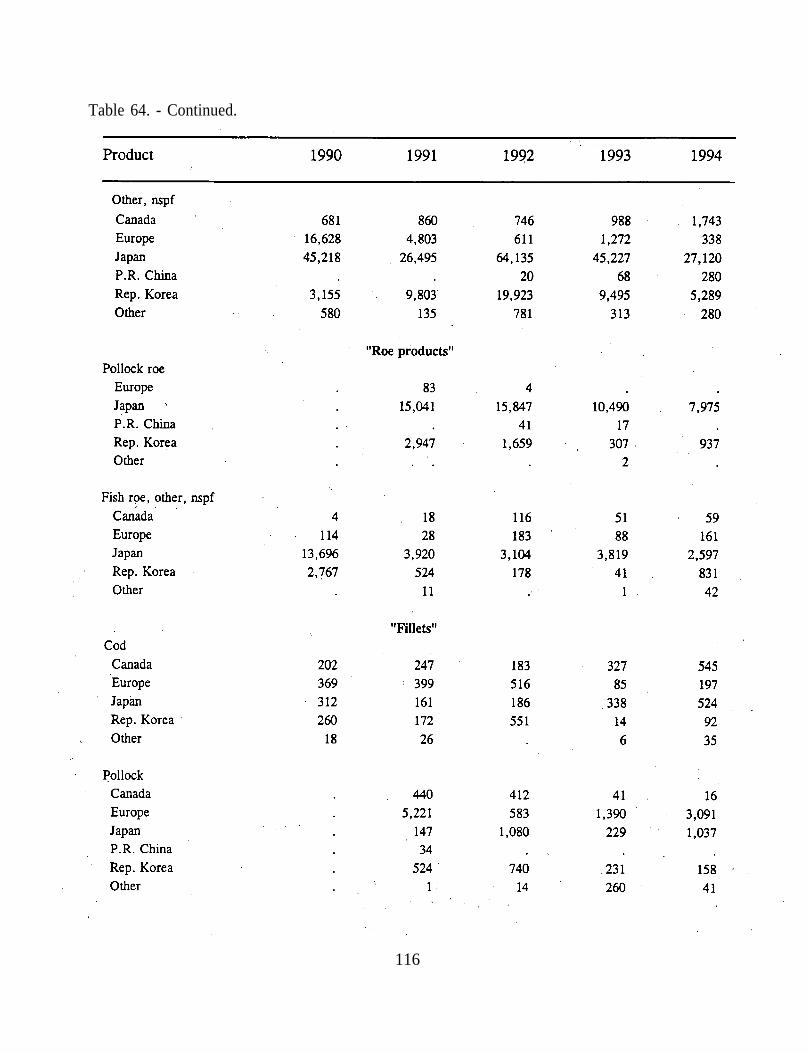
Table 64. - Continued.
116
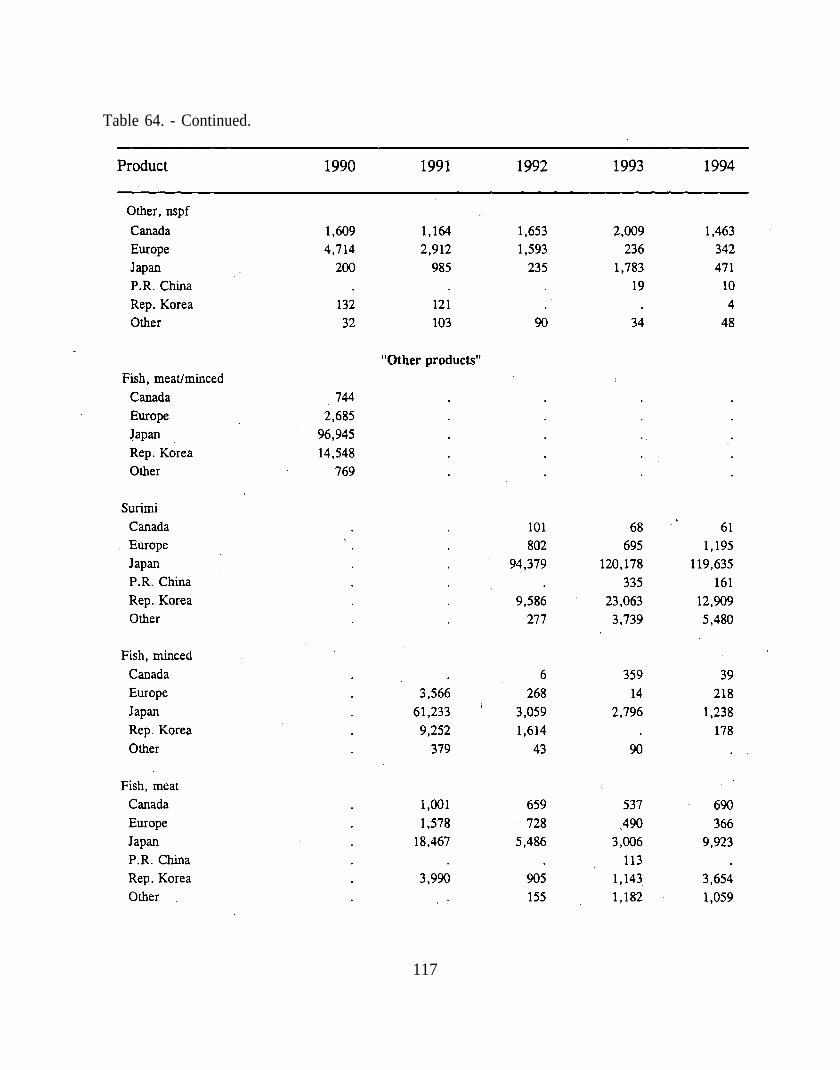
Table 64. - Continued.
117
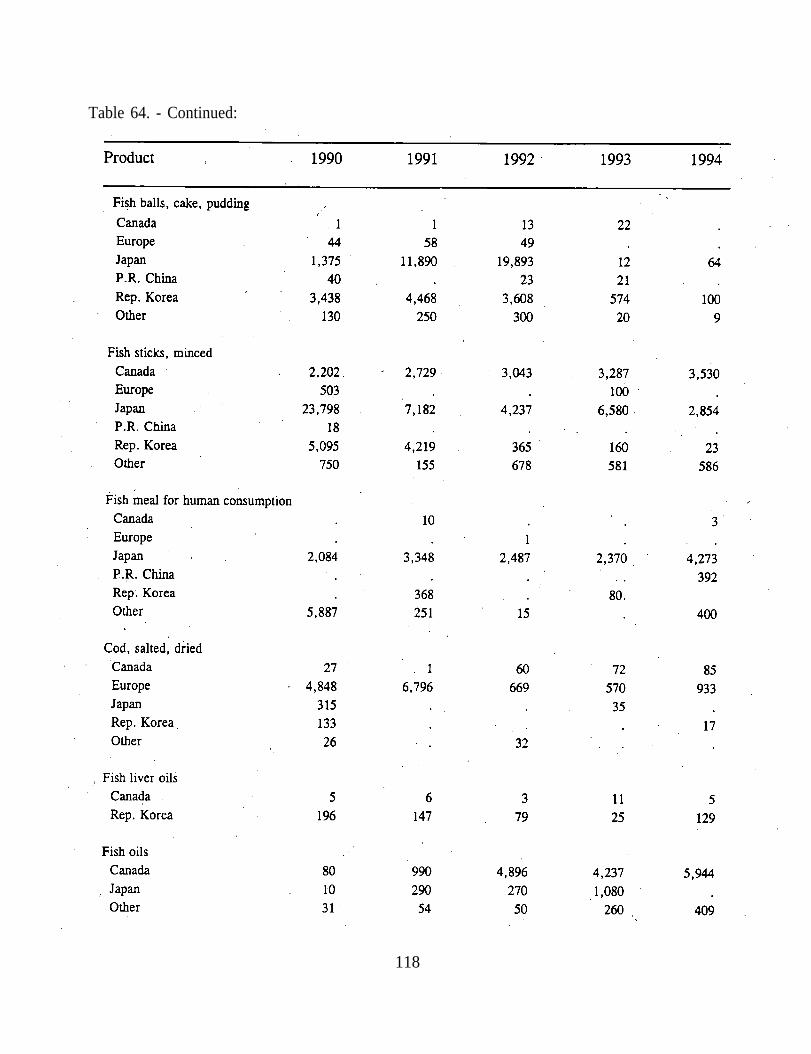
Table 64. - Continued:
118
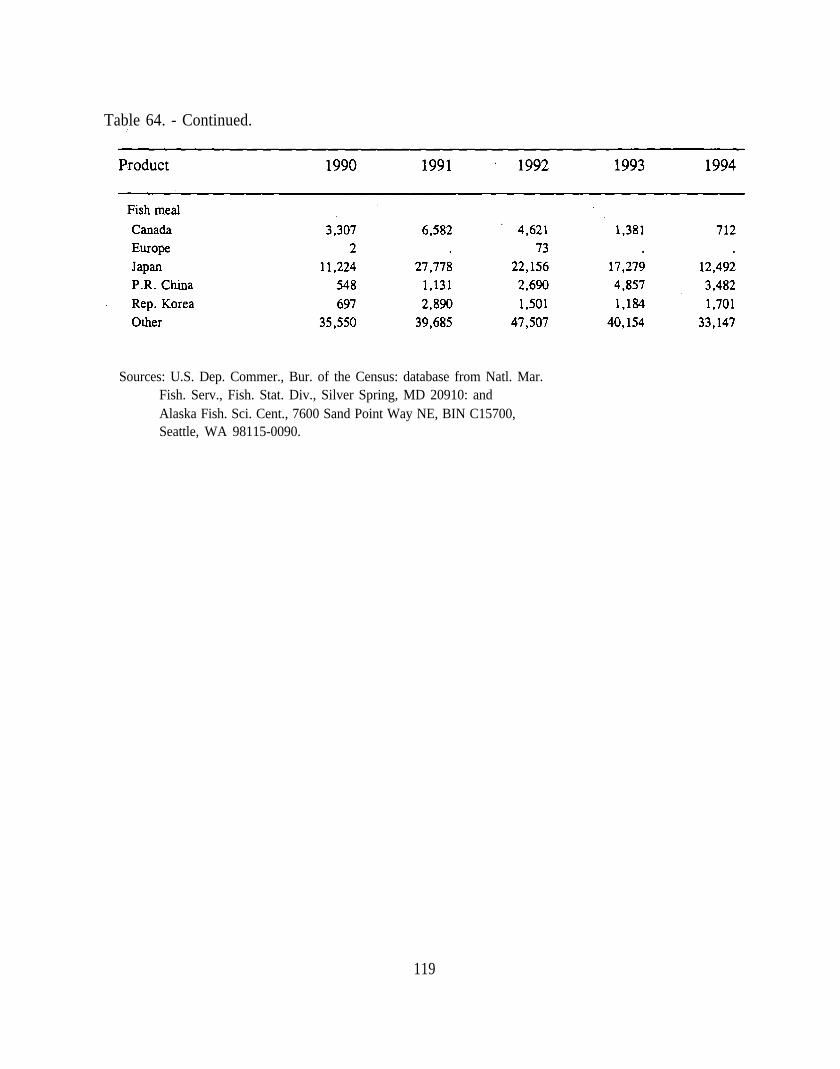
Table 64. - Continued.
Sources: U.S. Dep. Commer., Bur. of the Census: database from Natl. Mar.Fish. Serv., Fish. Stat. Div., Silver Spring, MD 20910: andAlaska Fish. Sci. Cent., 7600 Sand Point Way NE, BIN C15700,Seattle, WA 98115-0090.
119
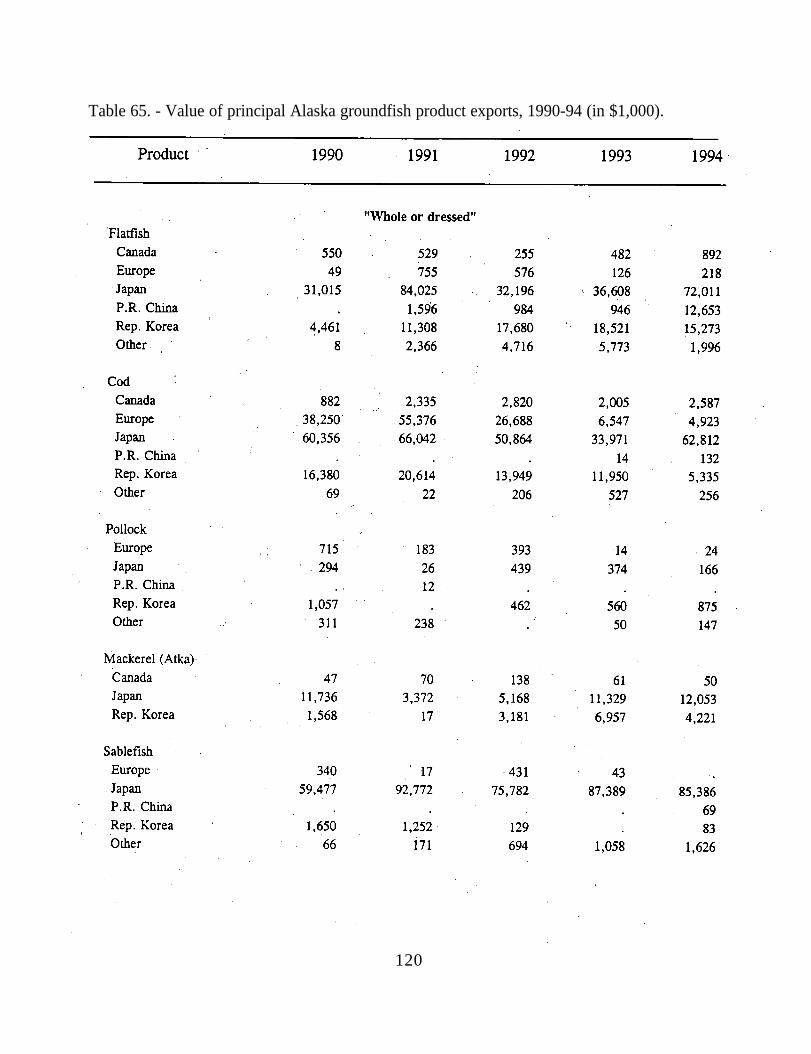
Table 65. - Value of principal Alaska groundfish product exports, 1990-94 (in $1,000).
120
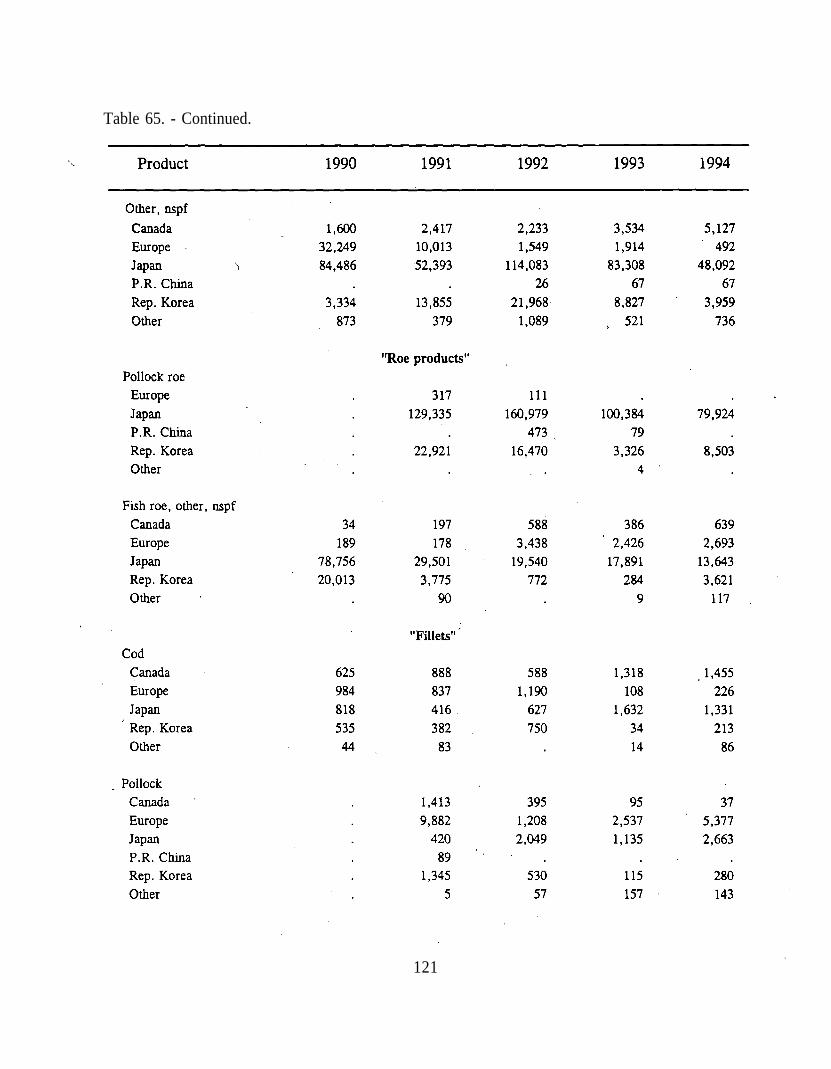
Table 65. - Continued.
121
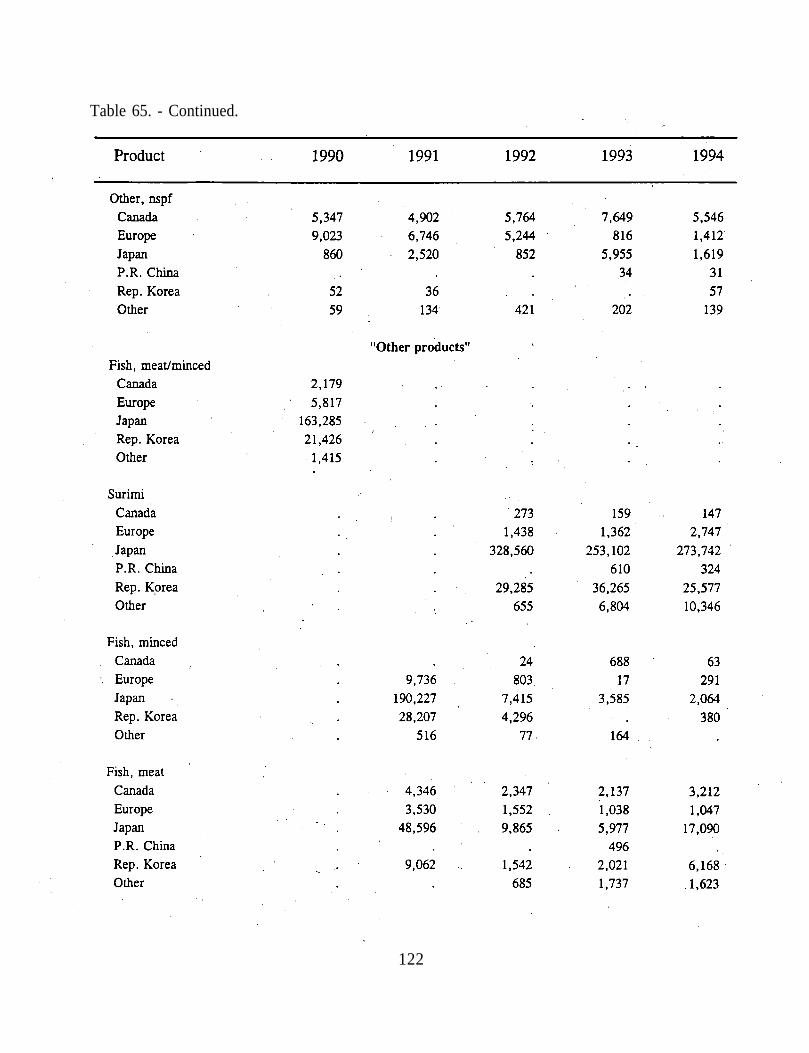
Table 65. - Continued.
122
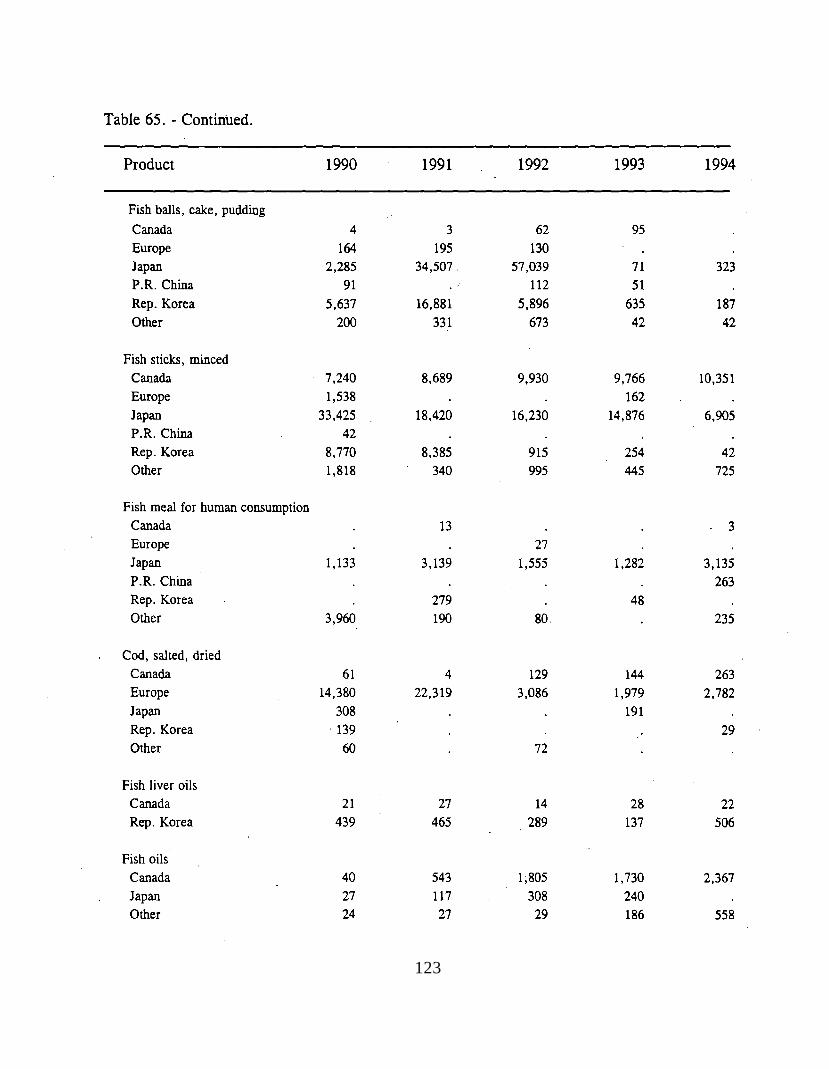
123
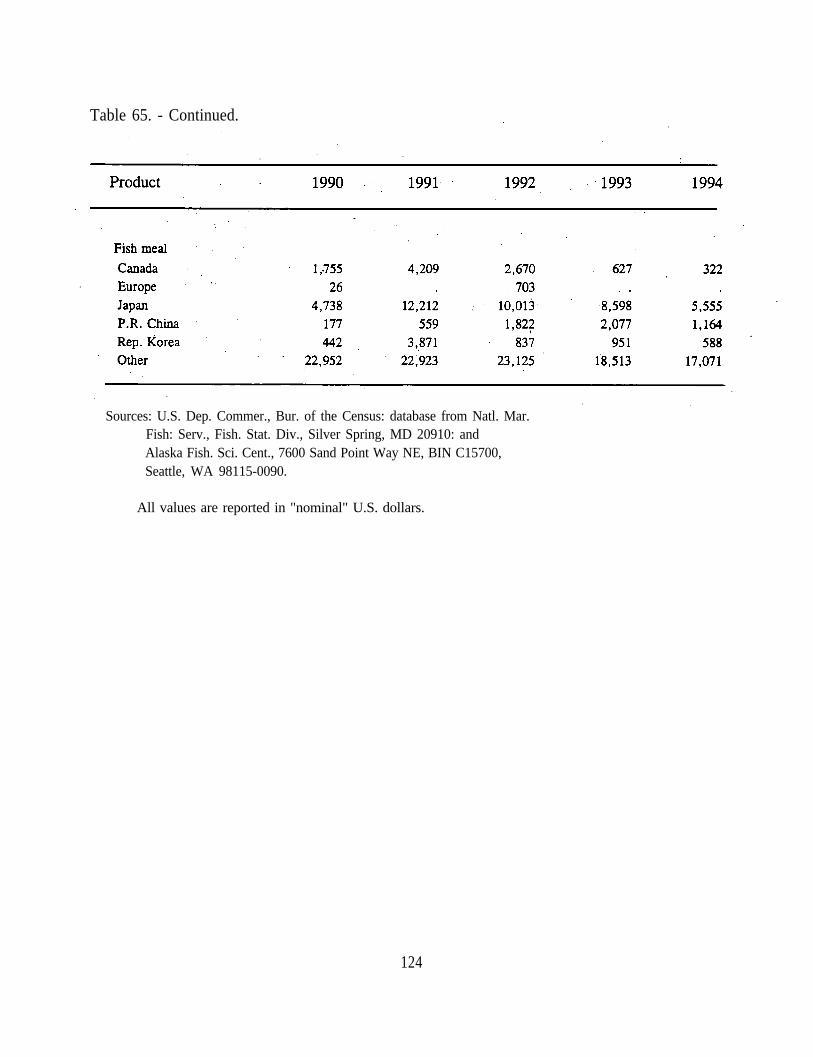
Table 65. - Continued.
Sources: U.S. Dep. Commer., Bur. of the Census: database from Natl. Mar.Fish: Serv., Fish. Stat. Div., Silver Spring, MD 20910: andAlaska Fish. Sci. Cent., 7600 Sand Point Way NE, BIN C15700,Seattle, WA 98115-0090.
All values are reported in "nominal" U.S. dollars.
124
Factors Influencing TradeSeveral exogenous factors influence international seafood trade. Among the most significantare currency exchange rates and world supplies of fishery products. The large quantities ofgroundfish products exported by U.S. producers, especially from fisheries off Alaska, as wellas the substantial quantities of fish products supplied by foreign producers (a significantamount of which is imported into U.S. markets) place the U.S. and foreign seafood suppliers in competition with one another in the world marketplace. International currency exchangerates play a very important role in determining the respective economic performance (i.e.,market-share) of each by affecting relative prices.
International exchange rates, particularly between the U.S. dollar and the currencies of itsmajor seafood trading partners, have been extremely volatile over the period 1990 to thepresent (Table 66). In 1990, for example, the U.S. dollar was relatively strong against theJapanese yen, with the dollar buying as many as 158.5 yen in April of that year. However,from that relative high point, the dollar has moved in an almost uninterrupted downward slide,reaching post-World War II historical low levels against the yen, in recent years. By the endof the first quarter of 1995, the U.S. dollar would buy only 90.8 yen, a decline in purchasingpower of almost 43%. Because Japan has traditionally been the principal market for fisheryproducts from the United States (and particularly from Alaska and the Pacific Northwest), theyen-dollar volatility has been especially important. In general, the U.S. dollar's relativeweakness against the yen has the effect of making U.S. exports, such as groundfish from theEEZ off Alaska, appear relatively “inexpensive” to Japanese purchasers.
Over the same period, however, the U.S. dollar actually strengthened against the currencies ofother major seafood trading partners (and competitors). In January of 1990, for example, theU.S. dollar would buy 1.171 Canadian dollars. Over the next 5 years, the U.S. dollarstrengthened relative to the Canadian currency until, in January of 1995, the U.S. dollarpurchased 1.413 Canadian dollars, an increase of nearly 21%. Similarly, the relative value ofthe U.S. dollar and Republic of Korea won changed markedly over this period. In early 1990,the U.S. dollar bought 683.4 Korean won. By 1994, the dollar was trading at more than 800won, up roughly 18% in relative value.
While the dollar moved cyclically down, then up, then back down over this period against theBritish pound, it ended at about the same level in the first quarter of 1995 as it had in Januaryof 1990; 0.625 pounds per dollar and 0.606 pounds, respectively. The dollar’s performanceagainst the Norwegian kroner was very similar, moving from 6.54 kroners per dollar inJanuary of 1990, principally downward through the early-1991, recovering through late-1991,
125
then moving lower through late-1992. During 1993 and 1994, the U.S. dollar was relativelystrong. By the end of the first quarter of 1995; the kroner/dollar exchange rate was once againin the range seen in early 1990. Indeed, this general pattern is reflected in a number of othercurrency exchange rates from western Europe.
The effect of these relative exchange rate changes has been, 1) to make U.S. exports(including groundfish products) relatively more expensive in Canada and South Korea, 2) to
make Canadian and Korean exports into the U.S. market relatively “less expensive”, and 3) tomake Canadian and Korean products more “price competitive” with U.S. products in the worldseafood marketplace.
International exchange rate volatility introduces an important external factor of “uncertainty”into the decision-making process for domestic groundfish producers as they assess utilization,product mix, and marketing options and opportunities.
There is also uncertainty concerning future harvest quotas because of the condition of theresource base. These concerns are associated both with the condition of stocks for the targetgroundfish species themselves, as well as those of “prohibited bycatch species”, such asPacific halibut, king and Tanner crabs, Pacific salmon, and Pacific herring.
Uncertainty about access to harvestable groundfish resources in the EEZ off Alaska alsosurrounds the interaction of these fish stocks and marine mammals, especially those marinemammal species which are listed as “depleted” or “threatened” under the U.S. MarineMammal Protection Act.
All of these exogenous factors, and perhaps others not yet apparent, will influence the patternof development and continued growth of the U.S. groundfish industry harvesting, processing,and exporting product from the EEZ off Alaska. Historical trends may provide someindication of where this important industry has come from, and where it may be headed.
Nonetheless, the natural volatility in the ecological, biological, and economic environmentsdemand continued careful examination of this important natural resource of the United Stat&.
1 2 6
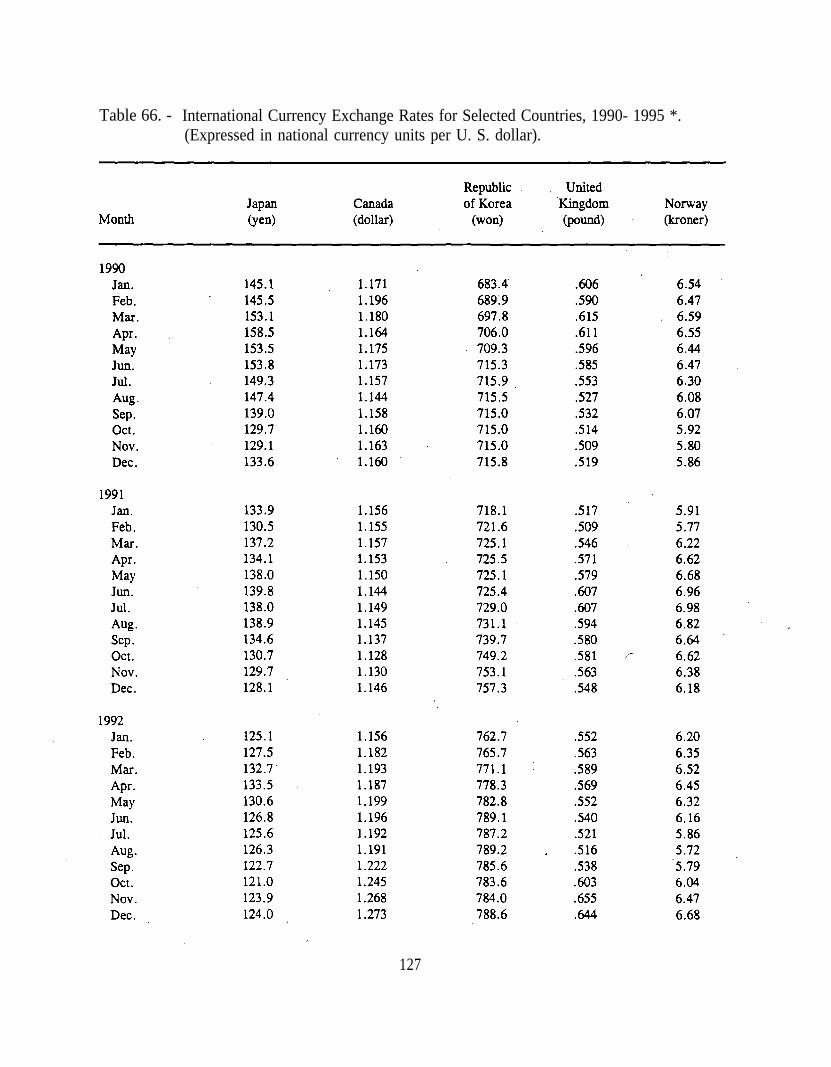
Table 66. - International Currency Exchange Rates for Selected Countries, 1990- 1995 *.(Expressed in national currency units per U. S. dollar).
127
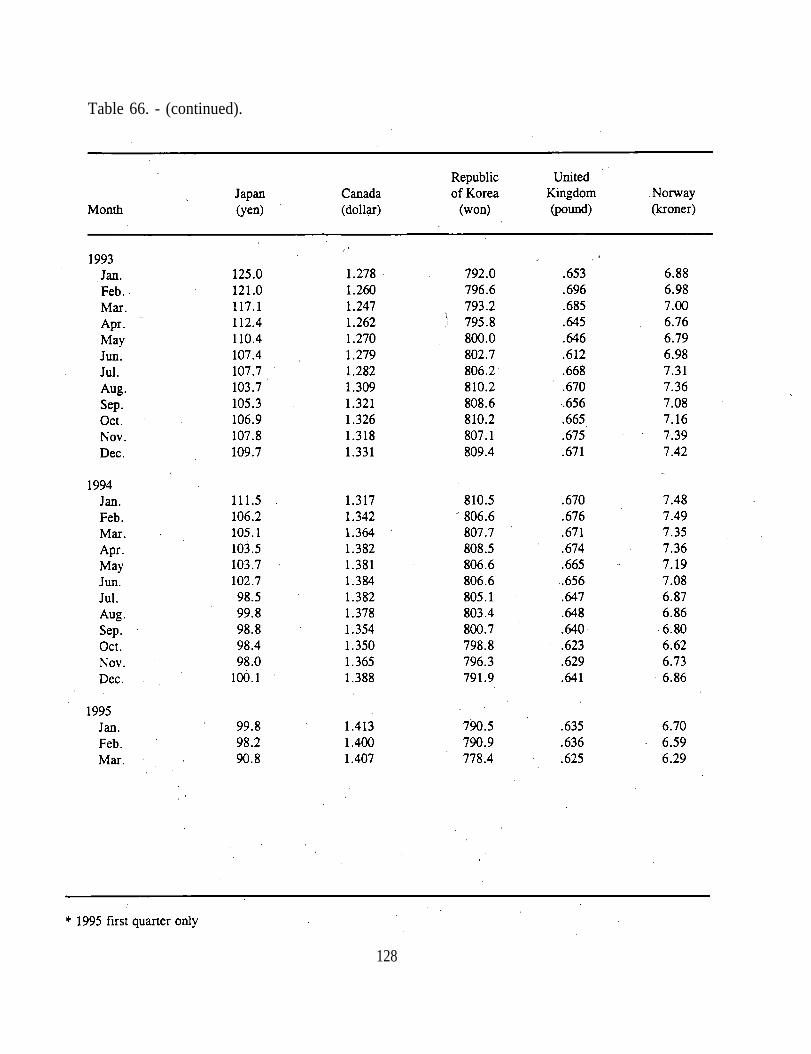
Table 66. - (continued).
128
Estimating the Opportunity Cost of Bycatch
As noted in the foregoing discussion, the ecological and biological impacts of groundfishdiscards in the GOA and BSAI groundfish fisheries, while difficult to quantify, may be
minimal. Fish which are intercepted as unwanted bycatch by one fishery, and ultimately
discarded, may, absent their loss as bycatch, have been harvested and utilized to produce amarketable product in another fishery. Their capture and subsequent disposal, therefore, may
impose direct economic costs on segments of the industry which target the species.
If a series of simplifying assumptions are made, it is possible to estimate the approximatevalue of the foregone catch of fish taken as bycatch and discarded in BSAI and GOA
groundfish fisheries. For purposes of the following analysis, it is assumed that the 1994 catch
utilization and discard patterns in the BSAI and GOA groundfish fisheries are typical, and thatprices and product mixes remain constant.; Further, it is assumed that bycatch mortality for
discarded groundfish is 100%.
It must be acknowledged that not all groundfish discards represent foregone catches inalternative fisheries. Two categories where this is so can be immediately identified. First, atpresent some species (e.g., bearded eel pout) are not regarded as having economic value as
retained catch. Therefore, the discard of these bycatch species cannot reasonably beconsidered to have imposed costs on other fisheries. Second, some groundfish species for
which markets do exist, nonetheless, are not fully utilized by fishermen, e.g., arrowtoothflounder. Thus, if the Total Allowable Catch (TAC) of a species is not taken during the
fishing year, bycatch discards of that species in one fishery can be regarded as surplus to theneeds of any other fishery targeting that species. Therefore, such discards cannot be said to
impose economic costs on the target fisheries for the discarded species. For all other species,
however, it is reasonable to conclude that bycatch mortality does impose economic costs on
target fisheries, and these costs should be recognized and accounted for, if possible.
One caveat must precede the derivation of these estimated losses. The economic value of
bycatch discards can be thought of as having two components. The first is the opportunity
cost of the bycatch mortality, measured, in this case, as the value of the products foregone intarget fisheries which would have harvested and utilized the fish, had it not been taken asbycatch. The second component is the. value of the bycatch as a variable input to production
129
of the target species catch (and subsequent product output), in the intercepting fishery. Thatis, if Pacific cod, for example, is caught in the bottom pollock fishery and discarded as
unwanted bycatch, the value of that discarded cod has two economic components. First, if thediscarded cod would have been harvested and utilized in a cod target fishery, the value of theforegone cod in that use is its opportunity cost.11 In addition, however, if some cod bycatch isunavoidable in order to catch pollock, then the cod used as bycatch also has an economic value
as an input in the harvest and utilization of pollock. It should be noted that these economicvalue components are not additive.
The value of bycatch discards as a variable input to production may be larger or smaller thanthe estimated opportunity cost derived below, depending upon the species discarded, the target
fisheries in question, and the respective market values of the outputs produced and foregone.It is not possible at this time to estimate the value of the bycatch discard as an input toproduction for the BSAI and GOA groundfish fisheries. It is possible, however, by employinga series of simplifying assumptions, to make a crude estimate of the opportunity cost of the
groundfish discards in these fisheries.
By utilizing 1994 catch, production, and product price data, an estimate was made of the first
wholesale value (for a round weight equivalent ton), weighted by product form and mix, for
11 By definition, “opportunity cost” is the value of the resource in its next best use. Itis a measure of “social”, not “private” cost. As the groundfish fisheries in the U.S. EEZ ofthe North Pacific and Bering Sea are currently managed, it is reasonable to assume that the“opportunity cost” of bycatch of a given species is appropriately measured as the foregonerevenue from its use in the fishery targeting that species. This is so because the TAC is thesum of both retained and discarded catch. Thus, when a ton of catch is discarded, it reducesby a ton the total amount that can be retained. Only in the case where, for example, thebycatch occurs in fishery A, the target fishery is B, and a third fishery, say C, is limited in thecatch of its target because the TAC for the species targeted in fishery B and discarded infishery A is taken, would it be possible for the “opportunity cost” to be other than as assumed.Few such examples exist in the BSAI or GOA groundfish fisheries.
130
each groundfish species, with an allocated TAC for which that TAC was binding. 12 These
round weight equivalent wholesale values were then applied to the estimated discards, by
species, by target fishery, under the assumption that, absent the bycatch loss, an equal quantity
of catch of the discarded species would have accrued to other fisheries targeting and retainingthat species. That is, if a ton of sablefish was-caught and discarded, for example, in the GOA“deepwater flatfish” fishery, by assumption, the opportunity cost of that ton of discardedsablefish would be the weighted product value per ton of retained sablefish catch in the GOA
target sablefish fishery. All groundfish discards, by species, for each directed fishery weretreated in the same way. They were then summed across species to yield the total estimated
value of the foregone groundfish production attributable to that target fishery. These estimatesare reported, by target fishery, by BSAI and GOA management areas, in Tables 67 and 68,
respectively.
To place these bycatch discard opportunity cost, estimates in context, a ratio was prepared foreach target fishery, which portrays the relationship between the value of the total product of
the target fishery, with the opportunity cost imposed by that fishery on other target fisheries,
as a result of bycatch discards. These ratios are also presented in Tables 67 and 68 for therespective management areas.. They may be interpreted, subject to the limitations of the
estimation procedure cited above, as the value of output obtained per dollar of bycatch
opportunity cost imposed. That is, say fishery A has a retained/discard value ratio of 5.5.This suggests that, for target fishery A, for each dollar of bycatch opportunity cost it imposes
on other fisheries, target fishery A produces $5.50 of product output value from its retainedcatch.
In 1994, there were six target groundfish fisheries in the BSAI management area for which theTAC was binding. There were five target groundfish fisheries in GOA which met thiscriterion. Since, by assumption, opportunity costs attributable to bycatch discards can only
accrue if a species TAC is attained (and thus no unutilized surplus quantity of that species isavailable to the fishery), these eleven target fisheries are the only ones for which an
12 “Wholesale” product value was employed rather than “exvessel” value because manyof these fisheries have significant participation by catcher/processors, for which an exvesselprice is neither available nor particularly relevant. Use of wholesale values also avoids theproblem of “post-season” price adjustments from processor to fisherman, which may not becaptured in the available exvessel price data.
131
opportunity cost estimate, and retained/discard value ratio can be made.13
In 1994, all BSAI groundfish fisheries taken together, discarded 162,161 mt of allocated
groundfish species for which the TAC was binding (hereafter referred to as AGFS). The
opportunity cost of the AGFS discards exceeded $91,848,000. Total retained catch of all
groundfish species in these fisheries taken as a whole was just over 1,699,500 t. Theaggregate retained value of this catch exceeded $925,229,800. Thus, the Retained/Discard
Value Ratio, weighted by fishery across all BSAI groundfish fisheries, was 10.1. That is, for
each dollar of bycatch opportunity cost imposed, $10.10 of output was produced from retainedcatch. Individual rates varied from a high of 29.2 in the pollock target fishery, to a low of 2.4in the “other” groundfish target fishery.
In the GOA groundfish fisheries, taken as a whole, AGFS discards totaled 15,685.4 t. Theopportunity cost of the AGFS discards exceeded $14,661,597. Total retained catch of allgroundfish species in these fisheries, taken as a whole, was just over 196,588 t. The
aggregate retained value of this catch exceeded $235,825,000. Thus, the Retained/Discard
Value Ratio, weighted by fishery across all GOA groundfish fisheries, was 16.1. That is, for
each dollar of bycatch opportunity cost imposed, $16.10 of output was produced from retainedcatch. Individual rates varied from a high of 45.4 in the sablefish target fishery, to a low of
3.4 in the arrowtooth flounder target fishery.
The individual estimates presented in these tables should be regarded as only “preliminary. ”
However, they do suggest that the value of the retained catch associated with current levels of
bycatch discards consistently, exceeds the estimated attributable opportunity cost imposed ontarget groundfish fisheries. This should not be interpreted to suggest that current discard
levels are somehow “optimal. ” Indeed, if bycatch discards could be reduced without adverselyaffecting total retained catch, the Retained/Discard Value Ratio would be even higher than
estimated below. Because some bycatch is virtually unavoidable, given available fishingtechnology, it is not clear by how much bycatch discards can be reduced, without a
13 Discard and retained quantity estimates are derived from 1994 “blend” data.Weighted “first wholesale” price estimates are derived from Alaska Region product value files,which utilize the National Marine Fisheries Service-Alaska Department of Fish and GameProcessor Survey. These data are reported annual prices, by species and product form, byeither BSAI or GOA management area, No gear-type differentiation has been included.
132

simultaneous reduction in the value of the retained catch. This trade-off between the foregonevalue of discards and the revenue stream deriving from retained catch is key to maximizing the
benefits that flow from this resource.
133
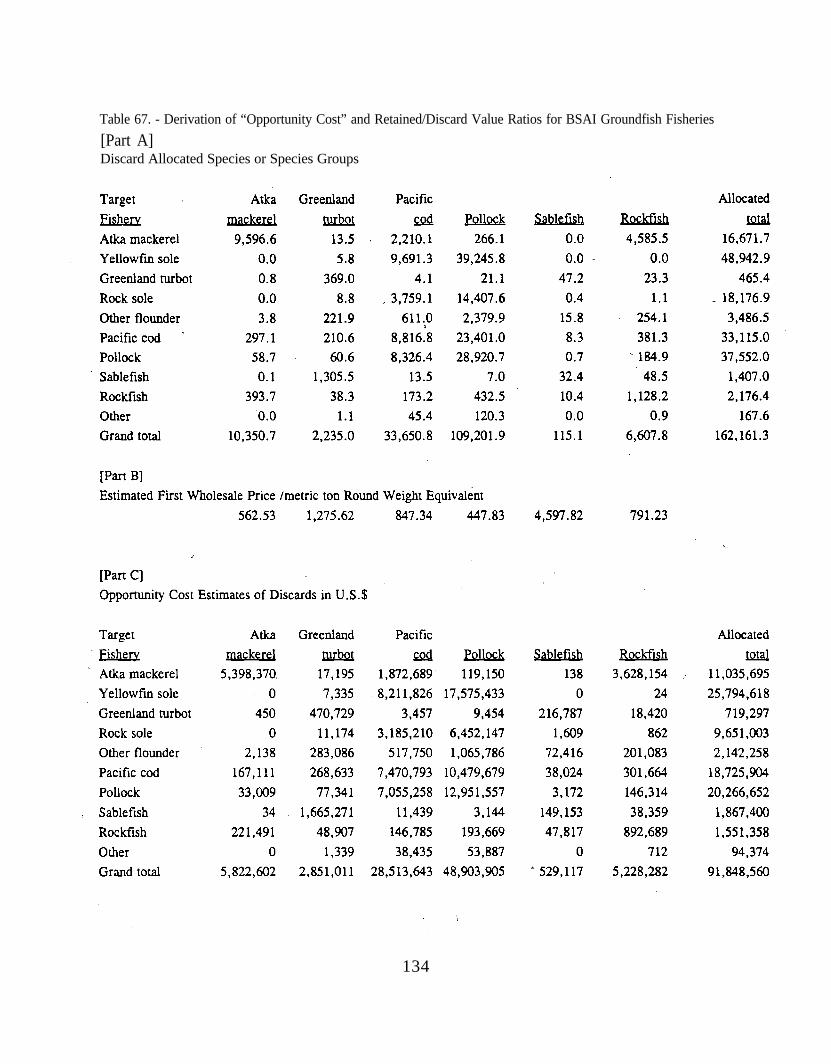
Table 67. - Derivation of “Opportunity Cost” and Retained/Discard Value Ratios for BSAI Groundfish Fisheries
[Part A]Discard Allocated Species or Species Groups
134
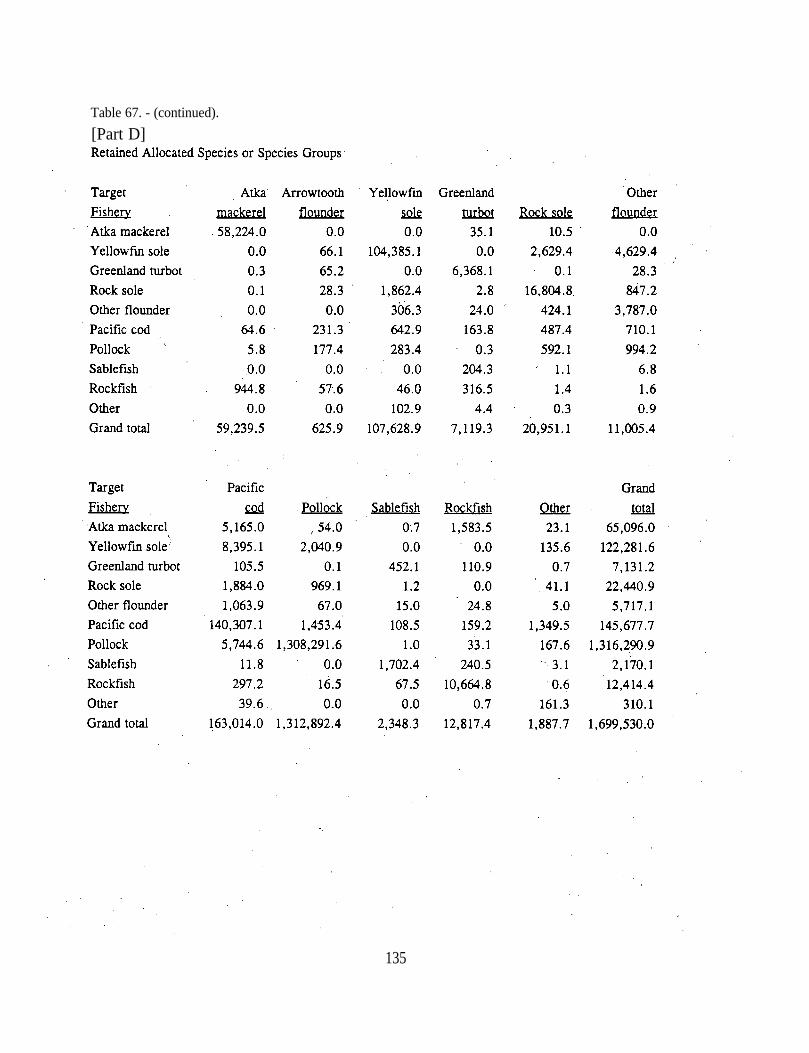
Table 67. - (continued).
[Part D]
135
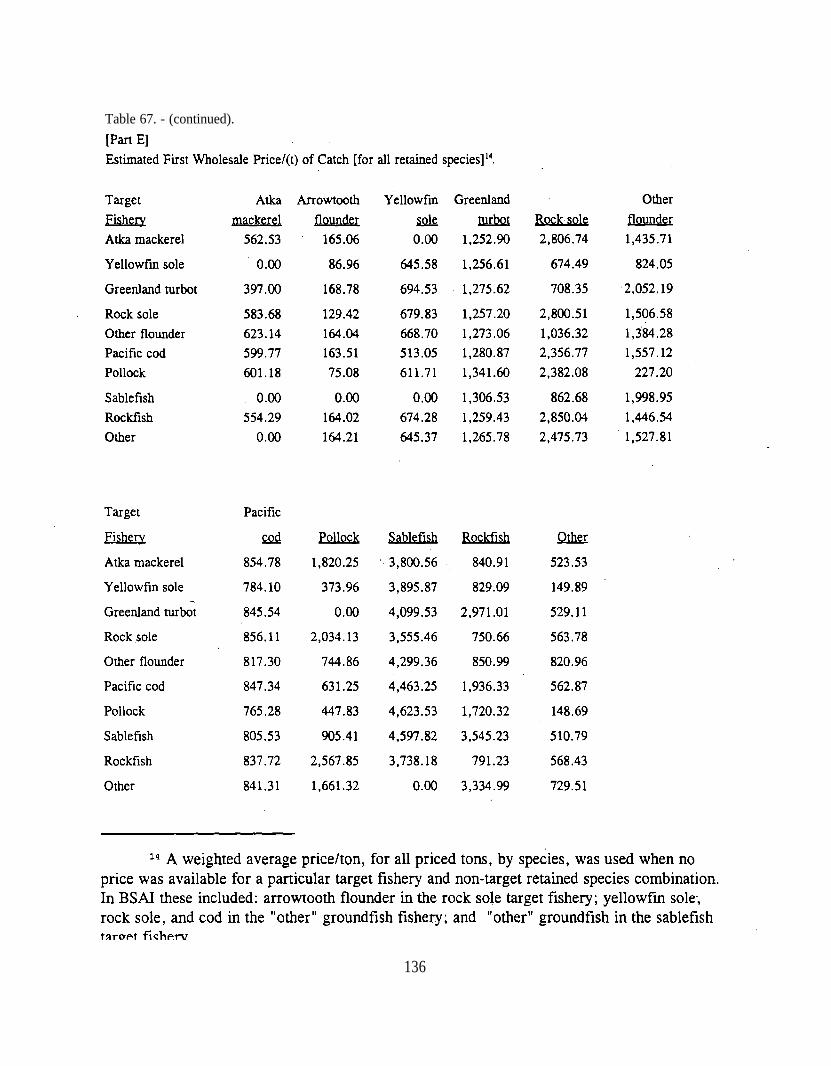
Table 67. - (continued).
136
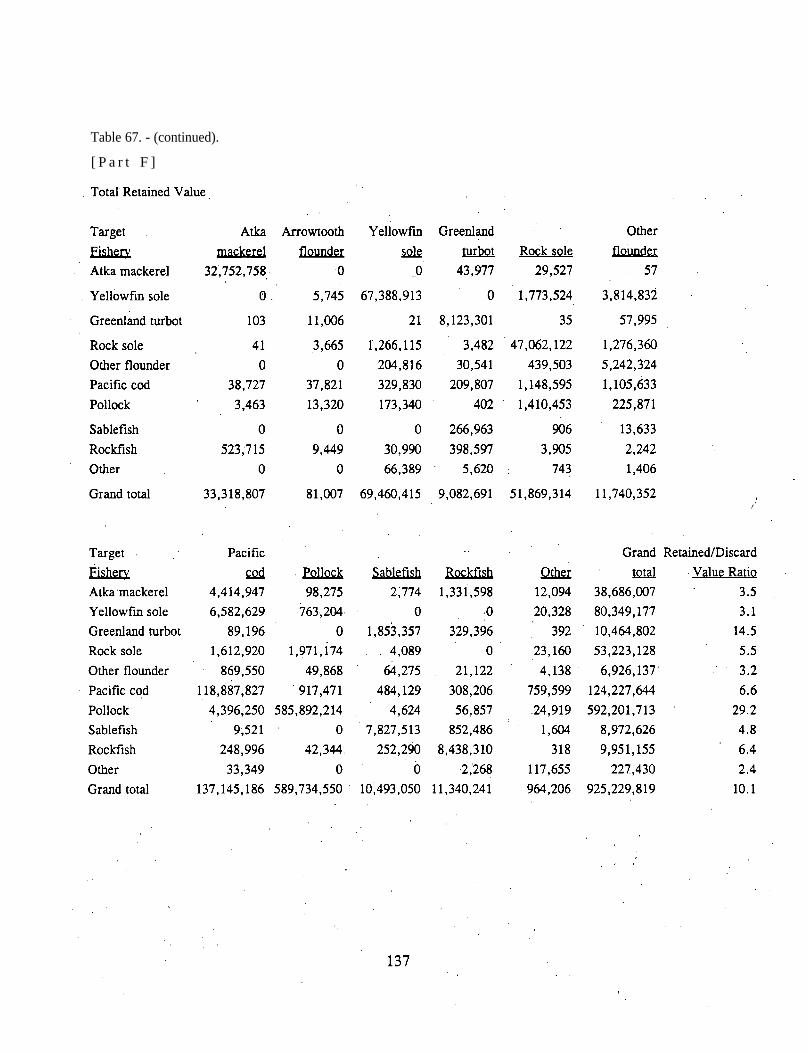
Table 67. - (continued).
[ P a r t F ]
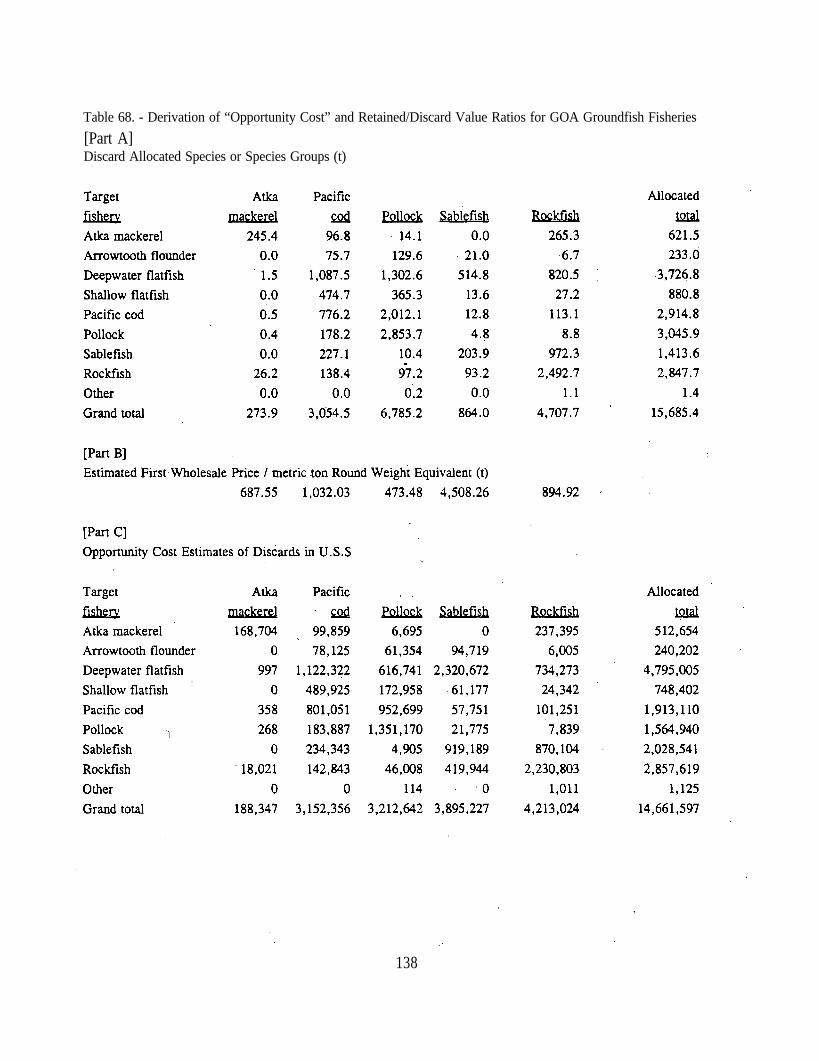
Table 68. - Derivation of “Opportunity Cost” and Retained/Discard Value Ratios for GOA Groundfish Fisheries
[Part A]Discard Allocated Species or Species Groups (t)
138
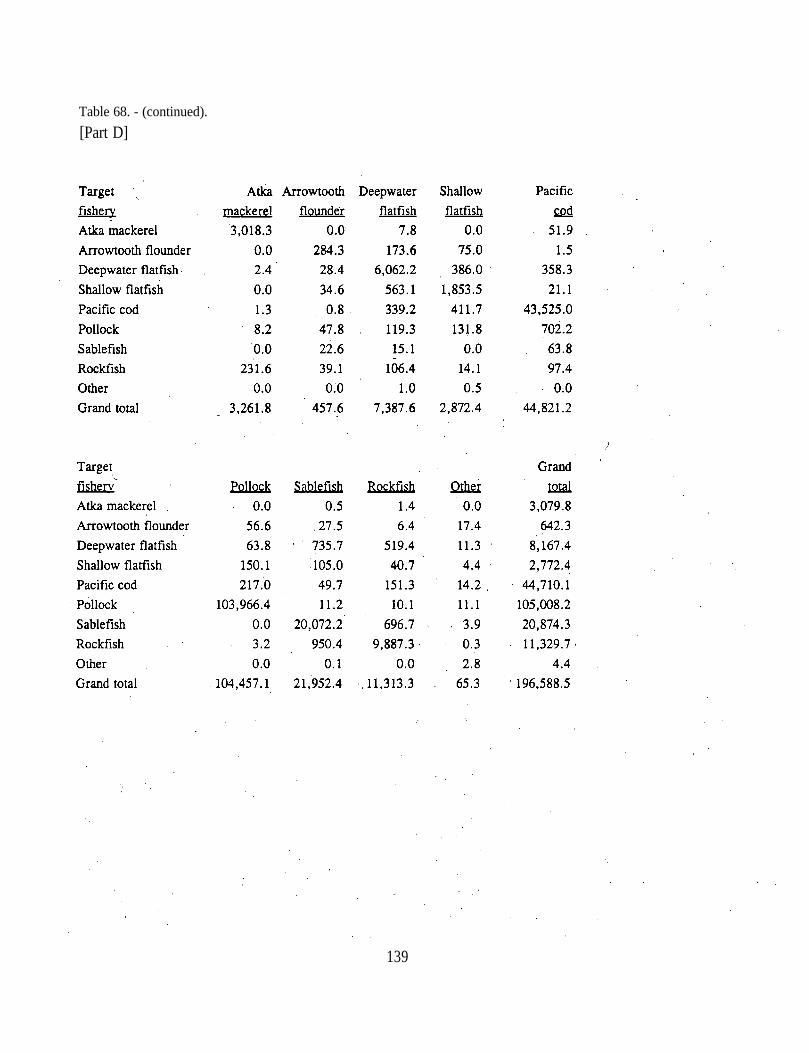
Table 68. - (continued).
[Part D]
139
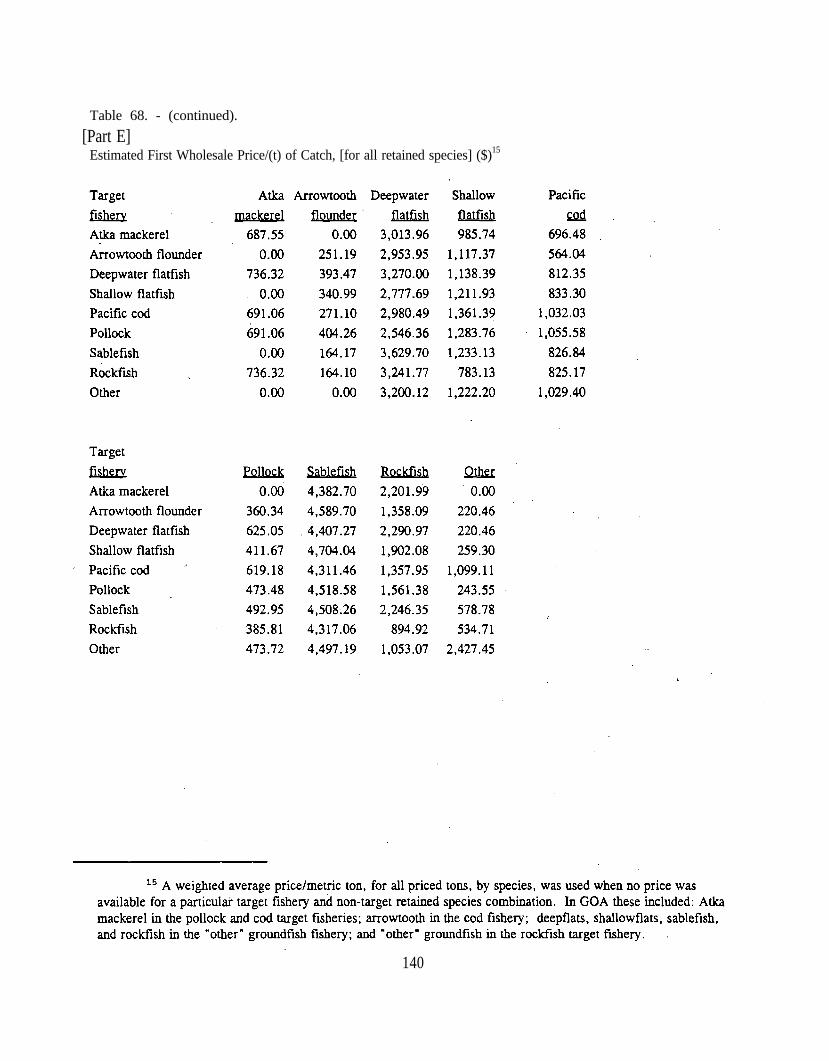
Table 68. - (continued).
[Part E]Estimated First Wholesale Price/(t) of Catch, [for all retained species] ($)15
140
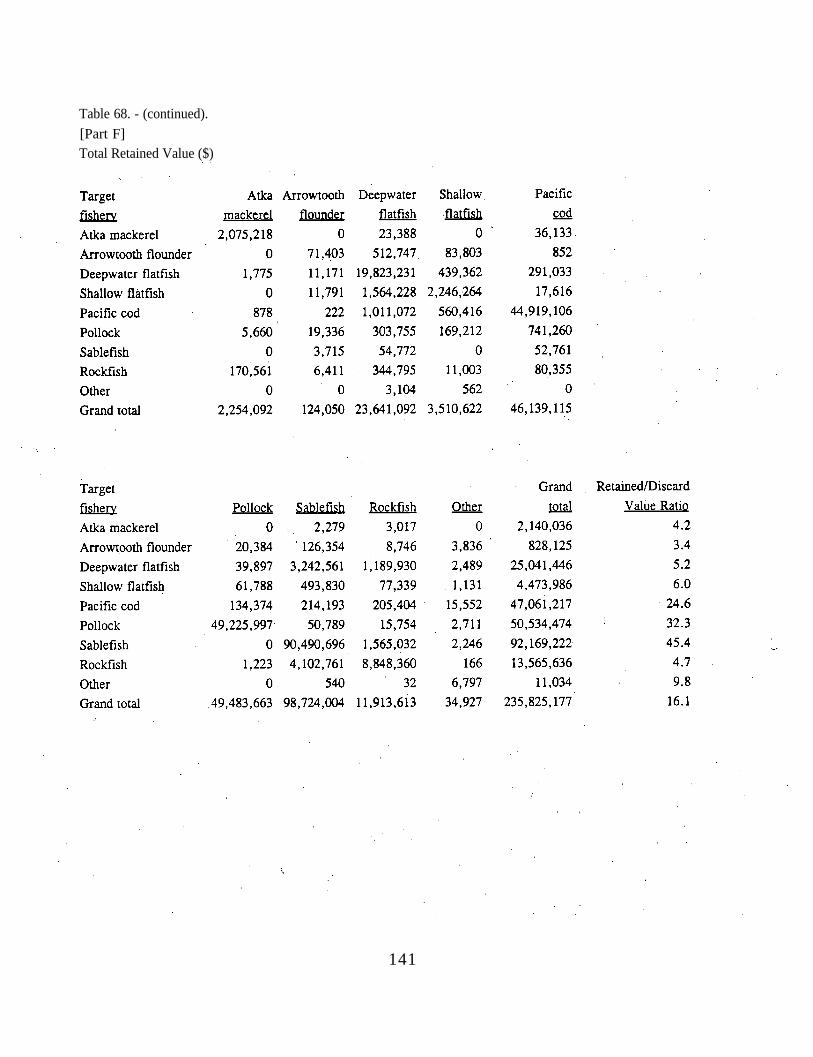
Table 68. - (continued).
[Part F]Total Retained Value ($)
141

THIS PAGE INTENTIONALLY LEFT BLANK
Citations
Alverson, D. L., M. H. Freeberg, S. A. Murawski, and J. G. Pope. 1994. A globalassessment of fisheries bycatch and discard. FAO Fisheries Tech. Pap. 339. Rome,FAO, 233 p .
Anon. 1994. Report of the working group on ecosystem effects of fishing activities.International Council for the Exploration of the Sea, ICES CM 1994/Assess/Env:1,109 p.
Baumol, W.J. 1977. Economic Theory and Operations Analysis. Prentice-Hall, Inc.
Berger, J. D,. , R. Nelson, Jr., J. Wall, H. Weikart, and B. Maier. 1988. Summary of U.S.observer sampling of foreign and joint-venture fisheries in the northeast Pacific Oceanand eastern Bering Sea, 1986. U.S. Dep. Commer., NOAA Tech. Memo. NMFS-F/NW&128, 167 p.
Berger, J. D., J,. E. Smoker, and K. A. King. 1986. Foreign and joint venture catches andallocations in the Pacific Northwest and Alaska fishing area under the MagnusonFishery Conservation and Management Act, 1977-84. U.S. Dep. Commer., NOAATech. Memo. NMFS-F/NWC-99, 53 p.
Berger, J. D., J. Wall, and R. Nelson, Jr. 1987. Summary of U.S. observer sampling offoreign and joint-venture fisheries in the northeast Pacific Ocean and eastern BeringSea, 1985. U.S. Dep. Commer., NOAA Tech. Memo. NMFS-F/NWC-112, 169 p.
Berger, J., and H. Weikart. 1988. Summary of U.S. observer sampling of foreign and joint-venture fisheries in the northeast Pacific Ocean and eastern Bering Sea, 1987. U.S.Dep. Commer., NOAA Tech. Memo. NMFS-F/NWC-148, 141 p.
Berger, J., and H. Weikart. 1989. Summary of U.S. observer sampling of foreign and joint-venture fisheries in the northeast Pacific Ocean and eastern Bering Sea, 1988. U.S.Dep. Commer., NOAA Tech. Memo. NMFS-F/NWC-172, 118 p.
Browder, J.A. 1983. A simulation model of a near-shore marine ecosystem of the north-central Gulf of Mexico. In: K.W. Turgeon (ed.), Marine ecosystem modeling:proceedings from a workshop held April 6-8, 1982 in Frederick, MD, by the U.S., p.179-222.
Chopin, F.S. , and T. Arimoto. 1995. The condition of fish escaping from fishing gears--areview. Fish. Res. 21:315-327.
143
Christie, W .J. 1993. Developing the concept of sustainable fisheries. J. Aquat. EcosystemHealth 2:99-109.
Climo, L. 1993. The status of cliff-nesting seabirds at St. Paul Island, Alaska in 1992. U.S.Fish and Wildl. Serv. Rep., AMNWR 93/15. Homer, AK 53 p.
Daan, N. 1980. A review of replacement of depleted stocks by other species and themechanisms underlying such replacement. Rapp. P.-v. Reun. Cons. int. Explor. Mer177:405421.
Dragoo, B.K. and K. Sundseth. 1993. The status of northern fulmars, kittiwakes, and murresat St. George Island, Alaska, in 1992. U.S. Fish and Wildl. Serv. Rep., AMNWR93/10. Homer, AK. 92 p.
Evans, S.M., J.E. Hunter, Elizal, and R.I. Wahju. 1994. Composition and fate of the catchand bycatch in the Fame Deep (North Sea) Nephrops fishery. ICES J. Mar. Sci.51:155-168.
Forrester, C. R., R. G. Bakkala, K. Okada, and J. E. Smith. 1983. Groundfish, shrimp, andherring fisheries in the Bering Sea and Northeast Pacific - historical catch statistics,1971-1976. International North Pacific Fisheries Commission Bull. No. 41, 6640Northwest Marine Drive, Vancouver, Canada, V6T 1X2, 100 p.
Fritz, L. W. 1993. Trawl locations of walleye pollock and Atka mackerel fisheries in theBering Sea, Aleutian Islands and Gulf of Alaska from 1977-92. U.S. Dep. Commer.,NOAA, NMFS,. AFSC Processed Rep. 98-08, 162 p.
Fritz, L. W. In press. Juvenile walleye pollock (Theragra chalcogramma) bycatch incommercial groundfish fisheries in Alaskan waters. Proceedings of a workshop on theImportance of pre-recruit walleye pollock to the Bering Sea and north Pacificecosystems. NOAA Tech. Rep.
Fritz, L.W., R.C. Ferrero, and R.J. Berg. 1994. The threatened status of Steller sea lions(Eumetopias jubatus) under the Endangered Species Act: effects on Alaska groundfishfisheries management. Manuscript presented at the Fisheries Management: GlobalTrends Symposium, June 1994, Seattle, WA.
Guttormsen, M., R. Narita, and J. Berger. 1990. Summary of U.S. observer sampling offoreign and joint-venture fisheries in the northeast Pacific Ocean and eastern BeringSea, 1989. U.S. Dep. Commer., NOAA Tech. Memo. NMFS-F/NWC-189, 84 p.
144
Guttormsen, M., R. Narita, and J. Berger. 1992. Summary of U.S. observer sampling ofjoint-venture fisheries in the northeast Pacific Ocean and eastern Bering Sea, 1990.U.S. Dep. Commer., NOAA Tech. Memo. NMFS-AFSC4, 78 p.
Hatch, S.A., G.V. Byrd, D.B. Irons, and G.L. Hunt, Jr. 1993. Status and ecology ofkittiwakes (Rissa tridactyla and R. brevirostris) in the North Pacific. In: K.Vermeer,K.T. Briggs, K.H. Morgan, and D. Siegel-Causey (eds). The status, ecology, andconservation of marine birds of the North Pacific. Can. Wildl. Serv. Spec. Publ.,Ottawa.
Hill, B. J., and T. J. Wassenberg. 1990. Fate of Discards from Prawn Trawlers in TorresStrait. Australian Journal of Marine and Freshwater Research 41: 53-64.
Hoag, S.H. 1975. Survival of halibut released after capture by trawls. Int. Pac. Hal. Comm.Sci. Rep. 57, 18p.
Hunt, G.L., Jr., B. Burgeson, and G.A. Sanger. 1981. Feeding ecology of seabirds of theeastern Bering Sea. pp. 629-648. In: D.W. Hood, and J.A. Calder (eds), The easternBering Sea shelf: oceanography and resources, Vol. II. Office of Marine PollutionAssessment, National Oceanic and Atmospheric Administration.
Jones, J.B. 1992. Environmental impact of trawling on the seabed:, a review. N. Z. J. Mar.Freshwater Res. 26:59-67.
Kaiser, M. J., and B.E. Spencer. 1994. Fish scavenging behavior in recently trawled areas.Mar. Ecol. Prog. Ser. 112:41-49.
Kennelly, S. J., D. Watkins, and J. R. Craig. 1990. Mortality of discarded spanner crabsRanina ranina (Linnaeus) in a tangle-net fishery -- laboratory and field experiments.Journal of Experimental Marine Biology and Ecology 140: 39-48.
Kinoshita, R. K., A. Grieg, and J. M. Terry. 1995. Economic status of the groundfishfisheries off Alaska, 1993. U.S. Dep. Commer., NOAA Tech. Memo. NMFS-AFSC-54, 108 p.
Kinoshita, et al., Economic Status of the. Groundfish Fisheries Off Alaska, 1994, U.S. Dep.Commer., NOAA Tech. Memo. NMFS-AFSC-00, XX p. (In prep.).
Livingston, P.A., A. Ward, G.M. Lang, and M-S. Yang. 1993. Groundfish food habits andpredation on commercially important prey species in the eastern Bering Sea from 1987to 1989. U.S. Dep. Commer., NOAA Tech. Memo. NMFS-AFSC-11, 192p.
145
Livingston, P.A., L-L. Low, and R.J. Marasco. 1994. Eastern Bering Sea ecosystem trends.Paper presented at the Oct. 8-11, 1994, Symposium on Large Marine Ecosystems ofthe Pacific, Qingdao,China.
Murai, S., H. A. Gangmark, and R. R. French. 1981. All-nation removals of groundfish,herring, and shrimp from the eastern Bering Sea and northeast Pacific Ocean, 1964-80. US. Dep. Commer., NOAA Tech. Memo. NMFS-F/NWC-14, 40 p.
Murawski, S. A., and F. M. Serchuk. 1989. Environmental Effects of Offshore DredgeFisheries for Bivalves. ICES C.M. 1989/K: 27.
Neilson, J. D., K. G. Waiwood, and S. J. Smith. 1989. Survival of Atlantic halibut(Hippoglossus hippoglossus) caught by longline and otter trawl gear. CanadianJournal of Aquatic Sciences 46: 887-897.
Nelson, R. Jr., R. French, and J. Wall. 1981. Sampling by U. S. observers on foreignfishing vessels in the eastern Bering Sea and Aleutian Islands region, 1977-78. Mar.Fish. Rev. 43(5): 1-19.
Niggol, K. 1982. Data on fish species from Bering Sea and Gulf of Alaska. U.S. Dep.Commer., NOAA Tech. Memo. NMFS-F/NWC-29, 125 p.
Pikitch, E.K., and D.L. Erickson. 1993. Development and evaluation of a methodologicalapproach for estimating the post-capture survival of trawl-caught Pacific halibut. FRI-UW-9304.
Queirolo, L. E. 1986. A Methodology for Evaluating the Economic Impact on DirectedFisheries of By-catch Losses in the Foreign and Joint-Venture Groundfish Fisheries.(Ph.D. dissertation) Oregon State University. 179p.
Queirolo, L. E., R. S. Johnston, and Z. Zhang. Competition and the market for access underextended jurisdiction. N. J. Bus. Econ. (In review).
Shelton, P.A. 1992. Detecting and incorporating multispecies effects into fisheriesmanagement in the northwest and southeast Atlantic. In: A.I.L. Payne, Brink, K.H.,Mann, K.H., and R. Hilbom (eds), Benguela Trophic Functioning. S. Afr. J. mar.Sci. 12:723-737.
Shirley, T. 1990. Handling mortality of Dungeness crabs. Final report to Alaska Dept. Fishand Game, 15 April, 1990. Project No. R/06-29.
Sproul, J. T., and L. E. Queirolo. 1994. Trade and management: Exclusive economic zonesand the changing Japanese surimi market. Mar. Fish. Rev,. 56(1):31-39.
146
Stevens, B. G. 1990. Survival of king and tanner crabs captured by commercial sole trawls.Fishery Bulletin 88: 731-744.
Stevens, B.G., and J.A. Haaga. 1994. Ocean dumping of seafood processing wastes:Comparisons of epibenthic megafauna sampled by submersible in impacted and non-impacted Alaskan bays and estimation of waste decomposition rate. Unpublishedmanuscript, National Marine Fisheries Service, Kodiak Laboratory, P.O. Box 1638,Kodiak, AK 99615.
Stevens, B.G., and R.A. MacIntosh. 1993. Estimation of mortality rates for king crabcaptured in finfish trawl and crab pot fisheries. Presented at the NMFS StockAssessment Workshop, Woods Hole, MA, July 19-22, 1993.
Thomas, G.L. 1994. Economically and ecologically responsible fish waste recycling in OrcaInlet, Prince William Sound, Alaska. Research proposal by Prince William SoundScience Center, P.O. Box 705, Cordova, AK 99574.
Thompson, G. G. 1994. Pacific cod. In Stock assessment and fishery evaluation report forthe groundfish resources of the Bering Sea/Aleutian Islands region as projected for1995. North Pacific Fishery Management Council, 605 W. 4th Ave., Rm. 306,Anchorage, AK, 99501-2252, 31 p.
Thompson, G. G, and H. H. Zenger. 1994. Pacific cod. In Stock assessment and fisheryevaluation report for the groundfish resources of the Gulf of Alaska as projected for1995. North Pacific Fishery Management Council, P.0 Box 103136, Anchorage,
AK, 99510, 39 p.
van Beek, F. A., P. I. van Leeuwen, and A. D. Rijnsdorp. 1989. On the survival of plaice,and sole discards in the otter trawl and beamtrawl fisheries in the North Sea. ICESC.M. 1989/G: 46.
Walsh, J.J., and C.P. McRoy. 1986: Ecosystem analysis in the southeastern Bering Sea.Cont. Shelf Res. 5:259-288.
Wassenburg, T-J., and B.J. Hill. l987. Feeding by the sand crab, Portunus pelagicus, onmaterial discarded from prawn trawlers in Moreton Bay, Australia. Mar. Biol.95:387-393.
Wassenberg, T. J., and B. J. Hill. 1989. The effect of trawling and subsequent handling onthe survival rates of the by-catch of prawn’ trawlers in Moreton Bay, Australia.Fisheries Research 7: 99-110.
147
Wassenburg, T.J., and B.J. Hill. 1990. Partitioning of material discarded from prawntrawlers in Moreton Bay. Aust. J. Mar. Freshwat. Res. 41:27-36.
Wespestad, V., and P. Dawson. 1991. Walleye pollock. In Stock assessment and fisheryevaluation report for the groundfish resources of the Bering Sea/Aleutian Islandsregion as projected for 1992. North Pacific Fishery Management Council, 605 W. 4thAve., Rm. 306, Anchorage, AK, 99501-2252, 27 p.
Williams, G.H. 1989. Analysis of halibut bycatch condition data for discard mortality rateestimation. In: Stock assessment and fishery evaluation report for the 1990 Gulf ofAlaska groundfish fishery. North Pacific Fishery Management Council, P.O. Box103136, Anchorage, AK 99510
Williams, G.H. 1994. Pacific halibut discard mortality rates in the 1993 groundfish fisheriesoff Alaska. In: Stock assessment and fishery evaluation report for the groundfishfisheries of the Bering Sea/Aleutian Islands regions as projected for 1995. NorthPacific Fishery Management Council, P.O. Box 103136, Anchorage, AK 99510
Williams, G.H. and T.K. Wilderbuer. 1993. Pacific halibut discard mortality rates in the1990-1992 groundfish fisheries off Alaska, with recommendations for 1994. In: Stockassessment and fishery evaluation report for the groundfish resources of the BeringSea/Aleutian Islands regions as projected for 1994. North Pacific FisheryManagement Council, P.O. Box 103136, Anchorage, AK 99510.
Yang, J. 1982. A tentative analysis of the trophic levels of North Sea fish. Mar. Ecol. Prog.Ser . 7 :247-252 .
Yang, M-S. 1993. Food habits of the commercially important groundfishes in the Gulf ofAlaska in 1990. U.S. Dep. Commer., NOAA Tech. Memo. NMFS-AFSC-22, 150 p.
Yang, M-S. 1995. Diets of the commercially important groundfishes in the Aleutian Islandsin 1991. Unpublished manuscript. Alaska Fisheries Science Center, 7600 Sand PointWy. NE, Bldg. 4, Seattle, WA 98115.
148
RECENT TECHNICAL MEMORANDUMS
Copies of this and other NOAA Technical Memorandums are available from theNational Technical Information Service, 5285 Port Royal Road, Springfield, VA 22167(web site: www.ntis.gov). Paper and microfiche copies vary in price.
AFSC-
57 SMALL, R. J., and D. P. DEMASTER. 1995. Alaska marine mammal stock assessments 1995-57, 93p.NTIS No. PB95-274734.
56 DORN, M. W., S. M. FITZGERALD, M. A. GUTTORMSEN, and M. R. LOEFFLAD. 1995. An evaluationof North Pacific groundfish observer program methods of haul weight estimation, 31 p. NTIS No. PB95-271151.
55 PELLA, J., R. RUMBAUGH, and M. DAHLBERG. 1995. Incidental catches of salmonids in the 1991North Pacific squid driftnet fisheries, 33 p. NTIS No. PB95-252722.
54 KINOSHITA, R. K., A. GRIEG, and J. M. TERRY. 1995. Economic status of the groundfish fisheries offAlaska, 1993, 108 p. NTIS No. PB95-252714.
53 WING, B. L., and D. J. KAMIKAWA. 1995. Distribution of neustonic sablefish larvae and associatedichthyoplankton in the eastern Gulf of Alaska, May 1990, 48 p. NTIS No. PB95-241519.
52 HONKALEHTO, T., and N. WILLIAMSON. 1995. Echo integration-trawl survey of walleye pollock(Theragra chalcogramma) in the southeast Aleutian Basin during February and March, 1994, 39 p. NTISNo. PB95-219424.
51 CLARY, J. C. (editor). 1995. Poster abstracts and manuscripts from the Third International Conferenceon Marine Debris, May 8-13, 1994, Miami, Florida, 108 p. NTIS No. PB95-210837.
50 MUNRO, P. T., and R. Z. HOFF. 1995. Two demersal trawl surveys in the Gulf of Alaska: Implicationsof survey design and methods, 139 p. NTIS No. PB95-195061.
49 STARK, J. W., and D. M. CLAUSEN. 1995. Data Report: 1990 Gulf of Alaska bottom trawl survey, 221p. NTIS No. PB95-194825.
48 NARITA, R., M. GUTTORMSEN, J. GHARRETT, G. TROMBLE, and J. BERGER. 1994. Summary ofobserver sampling of domestic groundfish fisheries in the northeast Pacific Ocean and eastern BeringSea, 1991, 540 p. NTIS No. PB95-190963
47 DORN, M. W., E. P. NUNNALLEE, C. D. WILSON, and M. E. WILKINS. 1994. Status of the coastalPacific whiting resource in 1993, 101 p. NTIS No. PB95-176467.
46 SINCLAIR, E. H. (editor). 1994. Fur seal investigations, 1993, 93 p. NTIS No. PB95-178943.
45 SINCLAIR, E. H. (editor). 1994. Fur seal investigations, 1992, 190 p. NTIS No. PB95-173472.
44 KINOSHITA, R. K., and J. M. TERRY. 1994. Oregon, Washington, and Alaska exports of ediblefishery products, 1993, 52 p. NTIS No. PB95-165924.
43 FERRERO, R. C., and L. W. FRITZ. 1994. Comparisons of walleye pollock, Theragra chalcogramma,harvest to Steller sea lion, Eumetopias jubatus, abundance in the Bering Sea and Gulf of Alaska, 25 p.NTIS No. PB95-155602.
42 ZIMMERMANN, M. , M. E. WILKINS, R. R. LAUTH, and K. L. WEINBERG. 1994. The 1992 Pacificwest coast bottom trawl survey of groundfish resources: Estimates of distribution, abundance, and lengthcomposition, 110 p. plus Appendices. NTIS No. PB95-154159.