Embed Size (px)
Citation preview

1
COMPOSITE SCAFFOLDS FOR BONE TISSUE ENGINEERING
By
TITILAYO MOLOYE
A DISSERTATION PRESENTED TO THE GRADUATE SCHOOL OF THE UNIVERSITY OF FLORIDA IN PARTIAL FULFILLMENT
OF THE REQUIREMENTS FOR THE DEGREE OF DOCTOR OF PHILOSOPHY
UNIVERSITY OF FLORIDA
2012

2
© 2012 Titilayo Moloye

3
To my mom, dad, and sisters

4
ACKNOWLEDGMENTS
I would like to thank my family. Through the ups and down you guys have always
been there for me, and for that, I am eternally grateful. I would like to thank my lab mates
who have been so kind and generous throughout this journey. I would especially like to
thank Pinky Chung for the “conversations.” I would also like to thank Dr. Jonathan Earle for
his guidance. I would like to thank Dr. Angela Lindner who was always to there to lend a
hand. I would especially like to thank my “Gator Mom” Mrs. Margie Williams. A special
thank you to my committee members- Dr. Banks, Dr. Ghivizzani and Dr. Keselowsky.
Thank you for providing your time, expertise and advice for this project. A special thank
you to Dr. Batich for his guidance, advice and encouragement throughout my time at UF.
5
TABLE OF CONTENTS page
ACKNOWLEDGMENTS .................................................................................................. 4
LIST OF TABLES ............................................................................................................ 9
LIST OF FIGURES ........................................................................................................ 10
LIST OF DEFINITIONS ................................................................................................. 13
ABSTRACT ................................................................................................................... 14
CHAPTER
1 INTRODUCTION .................................................................................................... 16
2 TISSUE ENGINEERING ......................................................................................... 18
Introductory Remarks .............................................................................................. 18
Cell Selection .......................................................................................................... 20 Material Selection.................................................................................................... 22
Natural Polymers .............................................................................................. 23
Synthetic Polymers ........................................................................................... 23 Scaffold Fabrication Methods .................................................................................. 25
Background ...................................................................................................... 25 Rapid Prototyping/ Fused Deposition Modeling ................................................ 26
Solvent Casting/ Porogen Leaching Method ..................................................... 27
3 BONE TISSUE ENGINEERING .............................................................................. 30
Bone Physiology ..................................................................................................... 30
The Cells of the Bone ....................................................................................... 31 Bone Type ........................................................................................................ 32 Bone Modeling and Remodeling: Osteoblast and Osteoclast Interaction ......... 34
Bone Specific Markers ...................................................................................... 35 Bone Morphogenic Proteins ............................................................................. 38
Fracture Healing and Bone Repair .......................................................................... 39
Bone Grafts and Bone Graft Substitutes ................................................................. 42 Biologically-Based Graft Replacements ............................................................ 45 Polymer and Polymer Based Graft Replacements............................................ 47 Ceramic and Ceramic-Based Graft Replacements ........................................... 48
FDA Approval .......................................................................................................... 49 Summary................................................................................................................. 50
4 MATERIALS AND METHODS ................................................................................ 51

6
C2C12 cells ............................................................................................................. 51
Demineralized Bone Matrix ..................................................................................... 52 Polycaprolactone .................................................................................................... 57 Solvent Casting/ Porogen Leaching Method ........................................................... 60
5 PRELIMINARY DATA, SCAFFOLD OPTIMIZATION AND SPECIFIC AIMS .......... 62
Osteoinductivity and DBM Grade ............................................................................ 62
Results .................................................................................................................... 63 Scaffold Preparation and Optimization .................................................................... 65
Washing Temperature Modification .................................................................. 71 Results.............................................................................................................. 72 Aggressive Leaching using Sonication ............................................................. 73
Results.............................................................................................................. 74 Discussion ............................................................................................................... 76
6 COMPOSITE SCAFFOLDS: SYNTHESIS, DEGRADATION AND CALCIUM PHOSPHATE DEPOSITION ................................................................................... 78
Introductory Remarks .............................................................................................. 78 Materials and Methods ............................................................................................ 79
Scaffold Preparation ......................................................................................... 79 Degradation Media ........................................................................................... 81 Scaffold Weight Change ................................................................................... 81
Calcium Ion Release ........................................................................................ 81 Von Kossa Staining .......................................................................................... 82
Phosphorous Ion Release ................................................................................ 82 pH of Simulated Body Fluid .............................................................................. 83
Scanning Electron Microscopy with Energy Dispersive Spectroscopy ............. 83 Statistics ........................................................................................................... 83
Results .................................................................................................................... 84
Mass of Scaffolds ............................................................................................. 84 Calcium Ion Release .......................................................................................... 86 Von Kossa Staining .......................................................................................... 88
Phosphorous Ion Concentration ....................................................................... 89 pH of Simulated Body Fluid .............................................................................. 91 Scanning Electron Microcopy w/ Elemental Dispersive Spectroscopy ............. 92 Discussion ........................................................................................................ 93
7 IN VITRO EVALUATION OF THE EFFECTS OF CALCIUM SULFATE, HYDROXYAPATITE, AND DEMINERALIZED BONE MATRIX ADDITION TO POLYCAPROLACTONE SCAFFOLDS ................................................................ 101
Introductory Remarks ............................................................................................ 101 Materials and Methods .......................................................................................... 103
Scaffold Preparation ....................................................................................... 103 Degradation Media ......................................................................................... 104
7
Water uptake and Mass Loss of Scaffolds...................................................... 105
Bioactivity Analysis ......................................................................................... 105 X ray Diffraction .............................................................................................. 107 Mechanical Testing ......................................................................................... 107 Contact angle ................................................................................................. 108 Viability Analysis ............................................................................................. 108
Statistics ......................................................................................................... 108 Results .................................................................................................................. 109
Mass Loss and Water Absorption ................................................................... 109 Mineralization ................................................................................................. 111 Contact Angle Analysis ................................................................................... 115
Viability Analysis ............................................................................................. 116 Mechanical Compression ............................................................................... 117
Discussion ............................................................................................................. 119
8 ANALYSIS OF OSTEOINDUCTIVE ACTIVITY OF POROUS POLYCAPROLACTONE- DEMINERALIZED BONE MATRIX SCAFFOLDS FOR BONE REPAIR: A PRELIMINARY STUDY ........................................................... 124
Introductory Remarks ............................................................................................ 124 Scaffold Preparation ....................................................................................... 124
Sample Preparation .............................................................................................. 125
Cell Culture ..................................................................................................... 125 Statistics ......................................................................................................... 126 Alkaline Phosphatase Activity (ALP) ............................................................... 126
Alizarin Red S Staining ................................................................................... 127
Calcium Assay ................................................................................................ 127 SEM Analysis ................................................................................................. 128
Results .................................................................................................................. 128
Alkaline Phosphatase Expression .................................................................. 129 Alizarin Red S Staining ................................................................................... 130
Quantification of mineralization ....................................................................... 132
Scanning Electron Microscopy ....................................................................... 133 Discussion ............................................................................................................. 134
9 SUMMARY AND FUTURE DIRECTIONS ............................................................. 139
Introductory Remarks ............................................................................................ 139
Synthesis, Characterization and In Vitro Evaluation of Composite Scaffolds . 140 In Vitro Evaluation of the Effects of adding common bone void fillers to a
Polycaprolactone scaffold............................................................................ 141
C2C12 Cell Proliferation and Differentiation on Composite Scaffolds ............ 143 Final Conclusions and Future Directions............................................................... 144
APPENDIX: PROTOCOLS ......................................................................................... 145
LIST OF REFERENCES ............................................................................................. 147

8
BIOGRAPHICAL SKETCH .......................................................................................... 164
9
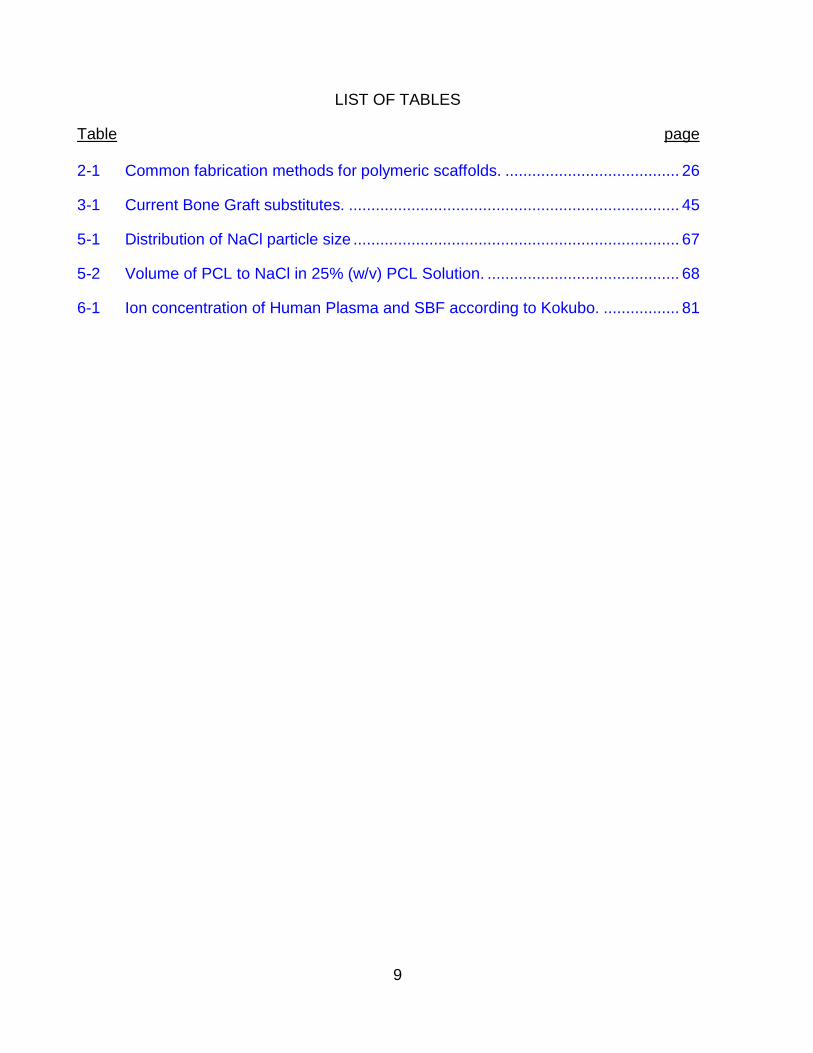
LIST OF TABLES
Table page 2-1 Common fabrication methods for polymeric scaffolds. ....................................... 26
3-1 Current Bone Graft substitutes. .......................................................................... 45
5-1 Distribution of NaCl particle size ......................................................................... 67
5-2 Volume of PCL to NaCl in 25% (w/v) PCL Solution. ........................................... 68
6-1 Ion concentration of Human Plasma and SBF according to Kokubo. ................. 81

10
LIST OF FIGURES
Figure page 2-1 The essentials of tissue engineering ................................................................... 19
2-2 Schematic of Tissue Engineering ....................................................................... 19
2-3 Mesenchymal stem cells induced to differentiate in vitro. ................................... 21
2-4 Fabrication method for solvent casting/ particulate leaching ............................... 29
2-5 Schematic of scaffold fabricated through the solvent casting/ particulate leaching method. ................................................................................................ 29
3-1 Compact bone and spongy bone ........................................................................ 33
3-2 The stages of secondary healing ........................................................................ 42
3-3 Allogro® .............................................................................................................. 46
3-4 Immix Extenders® .............................................................................................. 48
3-5 Osteoset ® 2 ....................................................................................................... 49
4-1 The demineralization of bone ............................................................................. 55
4-2 Commercially available DBM products ............................................................... 56
4-3 Percentage of DBM in commercially available DBM products ............................ 56
4-4 Degradation of PCL through bulk erosion and surface erosion. ......................... 58
4-5 PCL degradation via hydrolysis ......................................................................... 59
4-6 Crystalline fragmentation of PCL. ....................................................................... 59
5-1 Alkaline phosphatase activity .............................................................................. 64
5-2 Osteopontin Production . .................................................................................... 64
5-3 Scanning electron micrograph of PCL scaffold ................................................... 66
5-4 Porosity of PCL scaffolds as a function of NaCl content ..................................... 70
5-5 SEM micrographs of scaffolds washed at various temperatures ........................ 72
5-6 Porosity of PCL scaffolds as a function of washing temperature ....................... 73
11
5-7 SEM micrographs of scaffolds leached at various sonication times.................... 74
5-8 Porosity of the PCL scaffolds as a function of sonication ................................... 75
6-1 SEM Micrographs of Demineralized Bone Matrix. .............................................. 80
6-2 Schematic of solvent casting/ salt leaching technique ........................................ 80
6-3 Mass loss of scaffolds over 7 weeks ................................................................... 85
6-4 Calcium ion concentration in simulated body fluid .............................................. 87
6-5 Von Kossa staining of scaffolds .......................................................................... 88
6-6 Calcium and phosphorous ion concentrations of SBF of pure PCL scaffolds.and 25% DBM ........................................................................................................... 89
6-7 Phosphorous ion concentration in simulated body fluid ...................................... 90
6-8 pH of immersion liquid (SBF) for the various scaffolds. ...................................... 92
6-9 Scanning electron micrographs of pure PCL and composite scaffolds ............... 92
6-10 Heterogeneous nucleation of calcium phosphate on demineralized bone matrix.95
7-1 Dissolution and Reprecipitation of amorphous calcium phosphate on Hydroxyapatite.. ................................................................................................ 102
7-2 Molecular Structure of Alizarin Red S dye. ....................................................... 106
7-3 Mass loss of scaffolds immersed in SBF for 20 days. ....................................... 110
7-4 Water absorption of scaffolds immersed in SBF for 20 days. ........................... 111
7-5 Alizarin Red S staining ...................................................................................... 112
7-6 Absorbance values for stained scaffolds. ......................................................... 113
7-7 SEM w/EDS analysis of scaffolds ..................................................................... 114
7-8 XRD of fillers before and after immersion in SBF ............................................. 115
7-9 Contact angle results ........................................................................................ 116
7-10 The viability of cells on PCL, 35% DBM, 35% HA, 35% CS scaffolds and Tissue Culture Plate at 4 days. ................................................................................... 117
7-11 Before and After Stress Strain Analysis of Composite Scaffolds Immersed in SBF ................................................................................................................... 118
12
7-12 Ultimate Compressive Strength of Scaffolds before (B) and After(A) immersion in SBF. .............................................................................................................. 121
7-13 XRD of bone demineralized for various hours ................................................. 123
8-1 Differentiation of C2C12 cells cultured on tissue culture plate .......................... 129
8-2 Alkaline Phosphatase activity on scaffolds ....................................................... 130
8-3 Cell-seeded scaffolds at 14 days. ..................................................................... 131
8-4 Quantification of mineralization on scaffolds ..................................................... 132
8-5 Surface of cell-seeded 35% DBM scaffold. ....................................................... 133
8-6 Surface of cell-seeded 35% DBM scaffold. ....................................................... 134
8-7 Composite picture of modified protocol for both ALP expression and mineralization quantiification ............................................................................. 136
13
LIST OF DEFINITIONS
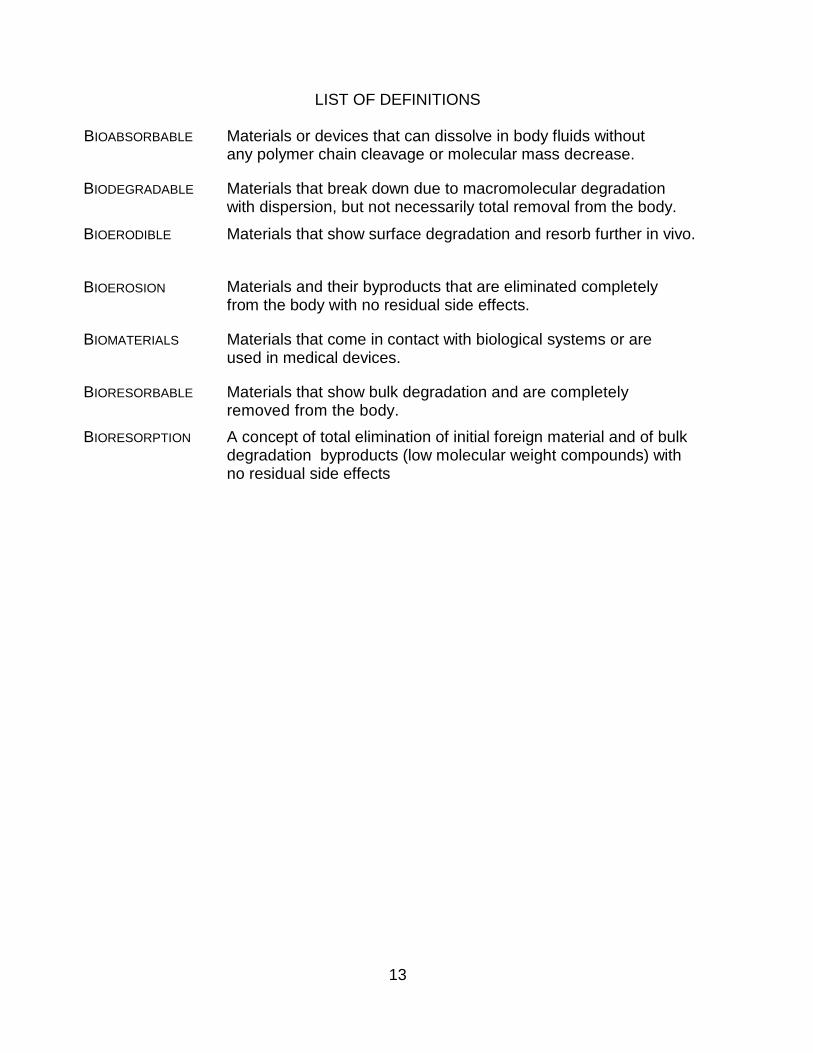
BIOABSORBABLE Materials or devices that can dissolve in body fluids without any polymer chain cleavage or molecular mass decrease.
BIODEGRADABLE
Materials that break down due to macromolecular degradation with dispersion, but not necessarily total removal from the body.
BIOERODIBLE Materials that show surface degradation and resorb further in vivo.
BIOEROSION
Materials and their byproducts that are eliminated completely from the body with no residual side effects.
BIOMATERIALS
Materials that come in contact with biological systems or are used in medical devices.
BIORESORBABLE
Materials that show bulk degradation and are completely removed from the body.
BIORESORPTION
A concept of total elimination of initial foreign material and of bulk degradation byproducts (low molecular weight compounds) with no residual side effects

14
Abstract of Dissertation Presented to the Graduate School of the University of Florida in Partial Fulfillment of the Requirements for the Degree of Doctor of Philosophy
COMPOSITE SCAFFOLDS FOR BONE TISSUE ENGINEERING
By
Titilayo Moloye
August 2012 Chair: Christopher Batich Major: Biomedical Engineering
Diseases, accidents, and aging are the leading causes of bone defects that can
weaken the bone’s natural anatomy and, as a result, impair its function. 5-10% of the 6
million defects occurring each year require further treatment for compromised healing
due to loss of bone, metabolic disturbances, and impairment of blood supply. Currently,
the standard solution for fixing such defects requires multiple surgeries and the removal
of healthy tissue.
An effective and viable tissue-engineered bone scaffold would provide a platform
for bone formation as well as an intrinsic signal for pluripotent cells to differentiate into
bone forming cells. In this study, a composite scaffold of polycaprolactone (PCL) and
demineralized bone matrix (DBM) is proposed, using a solvent casting and particulate
leaching technique. The broad hypothesis behind the construct of this composite
scaffold was simple; the combination of an osteoinductive/osteoconductive material
coupled with a biocompatible polymer would yield a scaffold that 1) delivers growth
factors to a targeted site, 2) encourages and enhances the formation of mineral deposits
on its surface, and 3) allows the proliferation and differentiation of undifferentiated cells
on its surface.

15
Initially, composite scaffolds of three different DBM concentrations, 25, 35, and 50
wt %, were prepared to evaluate scaffold degradation and surface mineralization.
Scaffolds containing 35% DBM both loss and gained mass over the 7 week study. This
gain was likely due to mineral being deposited on its surface. Moreover, analysis of the X
ray diffraction patterns of the DBM particles before and after immersion in SBF revealed
reprecipitation on its surface after 20 day However, despite the additional ions released
from the DBM into the simulated body fluid available for reprecipitation, we report no
correlation in DBM concentration and surface mineralization. Lastly, analytical assays of
alkaline phosphatase and total calcium content revealed high values of expression on
composite scaffolds when compared to the pure PCL scaffolds.
The work described herein provides strong support for a composite scaffold with
the potential of bonding to bone in vivo and inducing the differentiation of undifferentiated
cells into an osteoblastic lineage.

16
CHAPTER 1 INTRODUCTION
It is estimated that by 2030 there will be about 72.1 million individuals over the age
of 65 in the United States, which is more than double the 2000 estimate [1]. With the
increasing percentage of an aging population, the need for viable bone substitutes is also
increasing. While major strides have been made in the development of functional bone
substitutes – in particular bone grafting and metal implants – they are not without
drawbacks. Many patients undergo surgeries in which autologous bone harvested from
donor sites, such as the iliac crest, is used to replace the bone defect. Although these
grafts offer a nominal replacement for the bone defect, they fall short on a number of
accounts. First, these autologous grafts require the patient’s tissue. In an elderly
individual, viable host tissue may not be available. Moreover, the site from which the
donated tissue is drawn is subjected to “donor site morbidity” – a term coined for any
consequences that result from the harvesting of the patient’s own bone [2-5].
While the bone is capable of self-repair, the ability for new bone to form usually
dwindles with age, and peaks at the age of 30. After 30, the only way for new bone to
form is through “resorption” – a term that refers to the process by which osteoclasts break
down old bone, thereby releasing its mineral content into the blood stream [6-8].
Osteoblasts then use the minerals (calcium) in the blood stream to form new bone.
Essentially, osteoclasts break down the house to get the raw materials for the osteoblasts
to build a new house [9, 10].
Another solution to bone replacement is the use of bone received from donors,
otherwise known as allogenic bone. In this case, the cadaver bone is thoroughly
cleansed, free from surface proteins, cells, or any biological entities that might precipitate
17
an immunogenic response [11]. The cleansing does, however, expose the influencing
growth factors (bone morphogenic proteins) within the bone [12]. Although this approach
is considered a viable alternative to autografts, it also falls short of being a first rate
method, primarily because allogenic bone hinges on the availability of cadaveric bones. In
addition, according to Haimi et al. [13], the caustic ingredients (harsh chemicals) that
obliterate the biological contaminants on the bone produce an adverse effect on the
mechanical integrity of the bone, leaving it in a weakened state [14].
For the above reasons, an approach that does not use host tissue and is not
dependent on the availability of cadaveric bones is greatly needed. Several new methods
are currently being explored, including the combination of growth factors, stem cells, and
synthetic materials to develop a novel scaffold for repairing bone defects.
The engineering of bone tissue requires an effective and productive relationship
between the osteoinductive growth factors, the osteoblastic or osteoprogenitor cells, and
the osteoconductive scaffold. The osteoconductive matrix/scaffold could serve as a
mechanical support system and as a platform for the attachment and growth of the
cellular component, thus guiding the newly formed bone tissue in addition to operating as
a delivery vehicle for the cells or growth factors. Growth factors are important because
they can recruit, differentiate, and aid in the proliferation of the appropriate cell types at
the defect site. The cells, donated or autologous, are directly responsible for helping form
the newly engineered bone tissue [15-18]. Hence, these three factors (osteoconductive
matrices, osteoinductive growth factors, and osteoblastic/osteoprogenitor cells) and their
subsequent combination constitute the foundation to a successful tissue-engineered bone
substitute.

18
CHAPTER 2 TISSUE ENGINEERING
Introductory Remarks
Tissue Engineering applies the principles of engineering and life sciences to the
development of biological substitutes that restore, maintain, or repair tissue function [19].
The emergence of tissue engineering can be directly attributed to the problems
associated with donated tissue. These problems include severe rejection of the donated
tissues, inflammation of the area in which the donated tissue was implanted, and the
critical shortage of organ donation [20]. Millions of people suffer from end-stage organ
failure or tissue loss each year. An average of 17 people die each day from the lack of
available organs for transplant [21]. The field of tissue engineering seeks to remedy these
problems by engineering compatible tissues capable of replacing damaged tissue.
Tissue Engineering combines living cells with a support structure that degrades in
vivo, leaving behind a 3D assembly that is functionally, structurally, and mechanically
equal to – or better than – the native tissue it replaced [22]. Cell selection and material
selection are two key components for a successful tissue engineered replacement.
Material selection can be further divided to include signaling molecules within the material
and fabrication method by which the material is used to make the scaffold. Figure 2-1
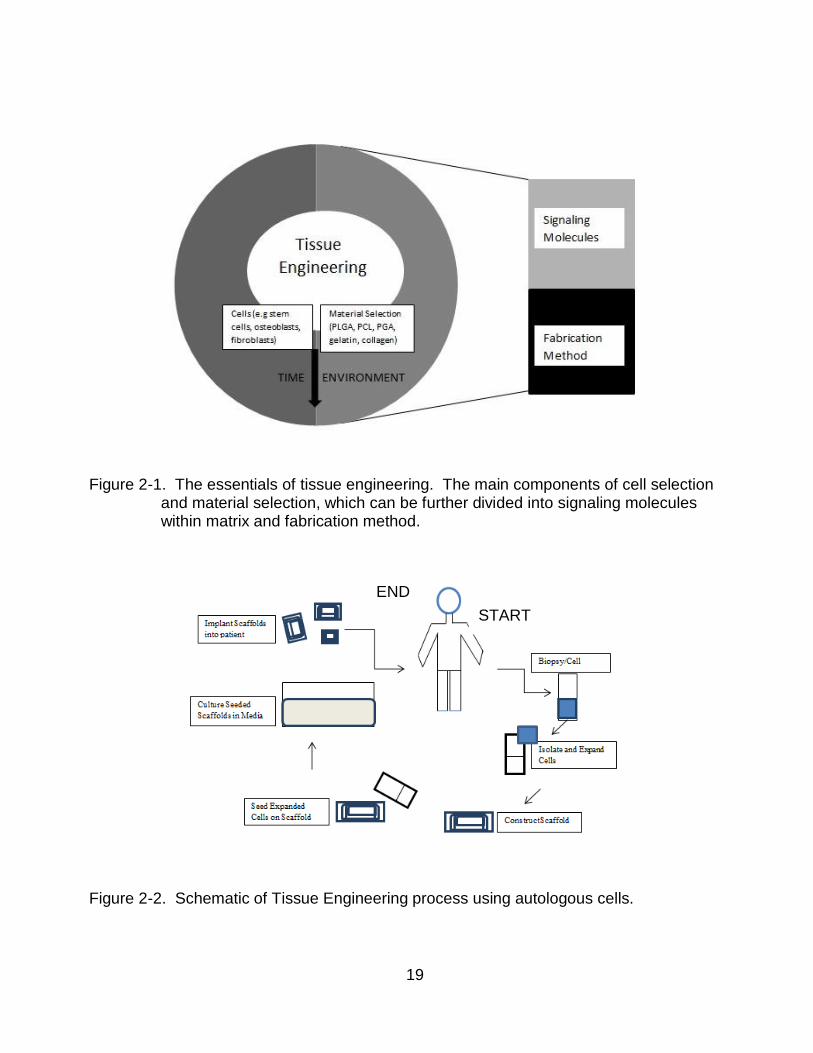
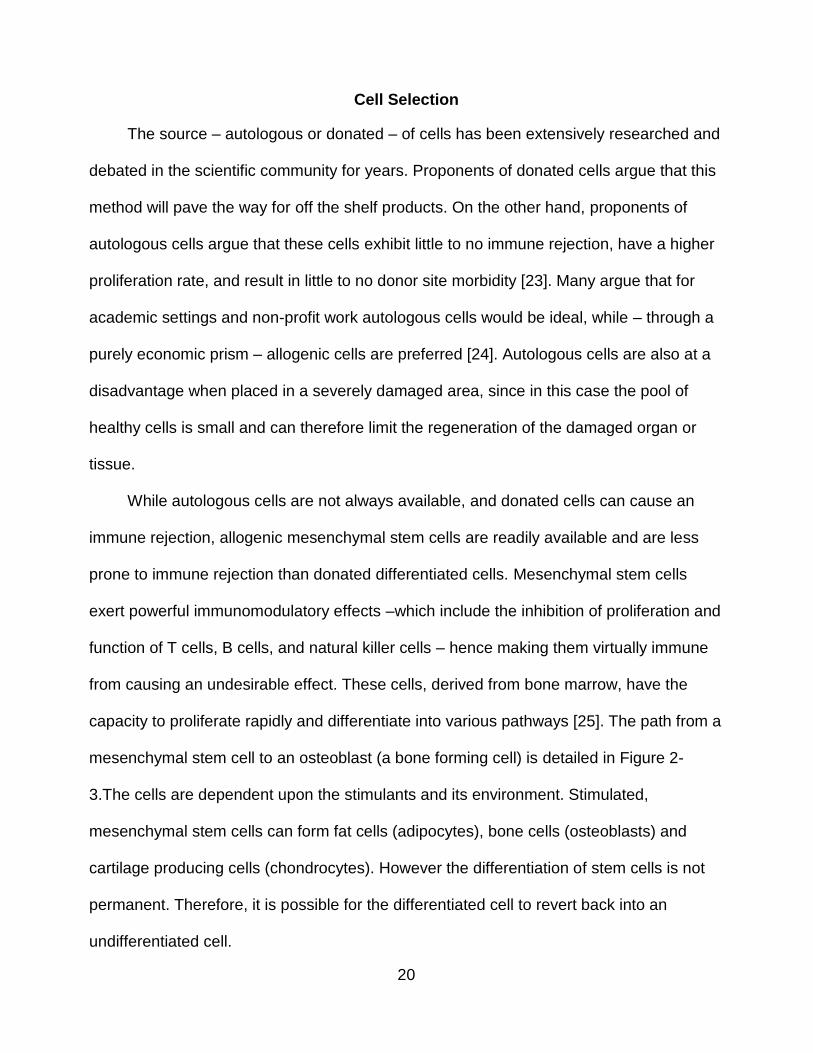
illustrates the components of tissue engineering. Figure 2-2 details the overall concept of
tissue engineering. It also highlights the main components of tissue engineering
19
Figure 2-1. The essentials of tissue engineering. The main components of cell selection
and material selection, which can be further divided into signaling molecules within matrix and fabrication method.
Figure 2-2. Schematic of Tissue Engineering process using autologous cells.
START
END
20
Cell Selection
The source – autologous or donated – of cells has been extensively researched and
debated in the scientific community for years. Proponents of donated cells argue that this
method will pave the way for off the shelf products. On the other hand, proponents of
autologous cells argue that these cells exhibit little to no immune rejection, have a higher
proliferation rate, and result in little to no donor site morbidity [23]. Many argue that for
academic settings and non-profit work autologous cells would be ideal, while – through a
purely economic prism – allogenic cells are preferred [24]. Autologous cells are also at a
disadvantage when placed in a severely damaged area, since in this case the pool of
healthy cells is small and can therefore limit the regeneration of the damaged organ or
tissue.
While autologous cells are not always available, and donated cells can cause an
immune rejection, allogenic mesenchymal stem cells are readily available and are less
prone to immune rejection than donated differentiated cells. Mesenchymal stem cells
exert powerful immunomodulatory effects –which include the inhibition of proliferation and
function of T cells, B cells, and natural killer cells – hence making them virtually immune
from causing an undesirable effect. These cells, derived from bone marrow, have the
capacity to proliferate rapidly and differentiate into various pathways [25]. The path from a
mesenchymal stem cell to an osteoblast (a bone forming cell) is detailed in Figure 2-
3.The cells are dependent upon the stimulants and its environment. Stimulated,
mesenchymal stem cells can form fat cells (adipocytes), bone cells (osteoblasts) and
cartilage producing cells (chondrocytes). However the differentiation of stem cells is not
permanent. Therefore, it is possible for the differentiated cell to revert back into an
undifferentiated cell.

21
Figure 2-3. Mesenchymal stem cells induced to differentiate in vitro. Stimulated with
various biological agents, MSCs can form fat cells (adipocytes); bone forming cells (osteoblasts); or cartilage producing (chondrocytes) [25].
22
Material Selection
One of the major components of a viable tissue-engineering alternative is the
material used to make the scaffold. Henceforth, this material will be referred to as a
biomaterial. The biomaterial should be non-carcinogenic, elicit little to no inflammatory
response, be compatible and, preferably, be biodegradable and bioresorbable [26]. The
biomaterial should also be accommodating to certain parameters warranted for each
scaffold, such as pore size and scaffold shape-ability. The scaffold plays a critical role in
the overall effectiveness of the tissue-engineered product. The function of the scaffold is
to direct the growth of cells seeded either within the porous structure of the scaffold or
migrating from surrounding tissue [22]. Scaffolding materials must also be able to serve
as a conduit for the consistent release of growth factors, antibiotics and other therapeutic
agents [27].
Such materials can be natural polymers, synthetic polymers, ceramics, or a
combination of polymer/ceramic. Grafting – the process of moving tissue from one area of
the body to another – is the standard operating procedure for replacing damaged tissues.
There are three types of grafting procedures: autografting, allografting, and xenografting
[28]. Autografts are tissue that comes directly from the host. In the replacement of bone,
tissue is removed from the iliac crest and transferred to the diseased site [29].
Consequently, this creates a new defect site, and for many patients this site causes more
pain than the site in which the tissue is to be transplanted. Secondly, this procedure
increases hospital time and – because it is essentially two surgeries – increases costs.
Allografting uses donated cadaveric tissue to replace or repair a damaged tissue. One of
the drawbacks of allografts is that by using donated tissue, it increases the likelihood of
an immunological rejection and/or an infection. A significant amount of research has gone
23
into sterilization methods that decrease adverse reactions in the recipient [30-32].
Xenografting – the process of using tissue from one species to an unlike species – is a far
less common grafting procedure. The most prevalent problem with xenograft, as with
allograft, is immunological rejection. Moreover, there are a number of ethical issues
surrounding xenotransplantation [33]. Possibly due to the above-mentioned reasons,
autografts are often touted as the “gold standard” [34].
The general idea behind tissue engineering is to create an autograft, thereby
eliminating all of its related problems. There are a number of biomaterials that have been
used for tissue engineering purposes: metals, ceramics, and polymers (natural and
synthetic). For the purpose of this project, we will focus on natural and synthetic polymers.
Natural Polymers
There are a number of naturally occurring polymers that are used for tissue
engineering. Examples of natural occurring polymers include starches, proteins, the
extracellular matrix (ECM), alginate, gelatin, chitosan, dextran, silk, chondroitin
6-sulfate and albumin. These polymers have good biocompatibility and offer fewer
regulatory constraints-compared to synthetic polymers [35-36]. Natural polymers possess
the ability to present receptor-binding ligands to cells, are bioactive, and remodel
naturally. One of the few drawbacks of natural polymers is that, unlike synthetic polymers,
they are not as easily able to conform to certain parameters such as porosity or attain a
level of mechanical strength needed for the implant area.
Synthetic Polymers
Natural polymers are relatively inexpensive. However, they can vary widely
depending on processing, and are more likely to be contaminated from unknown viruses
or diseases, in comparison to synthetic polymers [37]. Synthetic polymers can be easily
24
manufactured, generally have no immunogenicity, and their physical attributes – such as
molecular weight and molecular structure – can be easily controlled [38]. Their processing
also reduces variability amongst batches and can be supplied in large quantities [39]. In
designing scaffolds for tissue engineering, the material must be both biodegradable and
bioresorbable. These terms, as well as other tissue engineered related terms, are defined
in the “LIST OF DEFINITIONS.”
Most of the widely used polymers currently utilized in tissue-engineered products are
synthetic biodegradable polymers because, through their degradation, they lead to the
formation of natural tissue and they curtail the adverse chronic foreign body reaction
some natural and synthetic non-biodegradable polymers produce [22].
The properties of the ideal material are as follows:
Biocompatible
Mechanical properties that similar/consistent with the tissue it is replacing
Bioresorbable
Degrade at a pace that matches new tissue formation
Possess the ability to change and manipulate structure properties such as pore size, porosity, pore connectivity
Despite the progress made on polymers and their use in tissue-engineered
products, many problems still remain. Concerns over migration, encapsulation by fibrous
tissue and distortion are well documented in synthetic polymers used in cardiovascular
treatments [40].
Additionally, the effectiveness of the material selected also depends on whether the
material possesses signaling molecules, either native to the material or physically and/or
chemically embedded in the polymer. Signaling molecules – such as growth factors,
morphogens and adhesins – promote and/or prevent cell adhesion, proliferation,

25
migration and differentiation by upregulating or downregulating the synthesis of protein,
growth factors, and receptors [41]. Moreover, the adhesiveness of the material is
important. The majority of mammalian cell types are anchorage dependent, meaning that
they will die if an adhesive surface is not provided [42].
The method of scaffold fabrication is also important in how well the material
behaves. Certain cell types thrive at different pore sizes. For example, studies have
demonstrated the varying pore sizes in which osteoblasts (380–405 μm), chondrocytes
(380–405 μm), and fibroblasts (186–200 μm) thrive [43]. The surface to volume ratio of
the scaffold is another important aspect that needs to be taken into consideration. The
scaffold with a high surface to volume ratio typically favors cell adhesion, proliferation,
and differentiation [44].
Scaffold Fabrication Methods
Background
Perhaps no factor of tissue engineering is as important as the scaffolding of the
matrix. While the type of material is very significant, how the scaffold is fabricated is of
equal importance. Scaffolds designed to regenerate body tissue by seeding cells into
porous matrices allow the growth of cells and tissue modeling through a combination of
structure and signaling. The construction of pore size and pore distance can be very
useful in letting nutrients and cells to seep into the matrix; these can also function as a
buffer by preventing waste and bacteria from flowing into the scaffold [45].
Compared to 2D constructs, culturing cells in 3D constructs results in a
microenvironment that more closely resembles that found in vivo. This is mainly due to
the fact that seeded cells respond to mechanical and biological cues from the 3D
locations to promote cell adhesion, proliferation, and differentiation. The ability to engineer
26
a scaffold and dictate parameters (porosity, pore distance, pore size, hydrophilicity)
enhances the functionalities of cells and tissues to support adhesion and growth. Porous
structures provide space, permit cell suspension, promote ECM production, transport
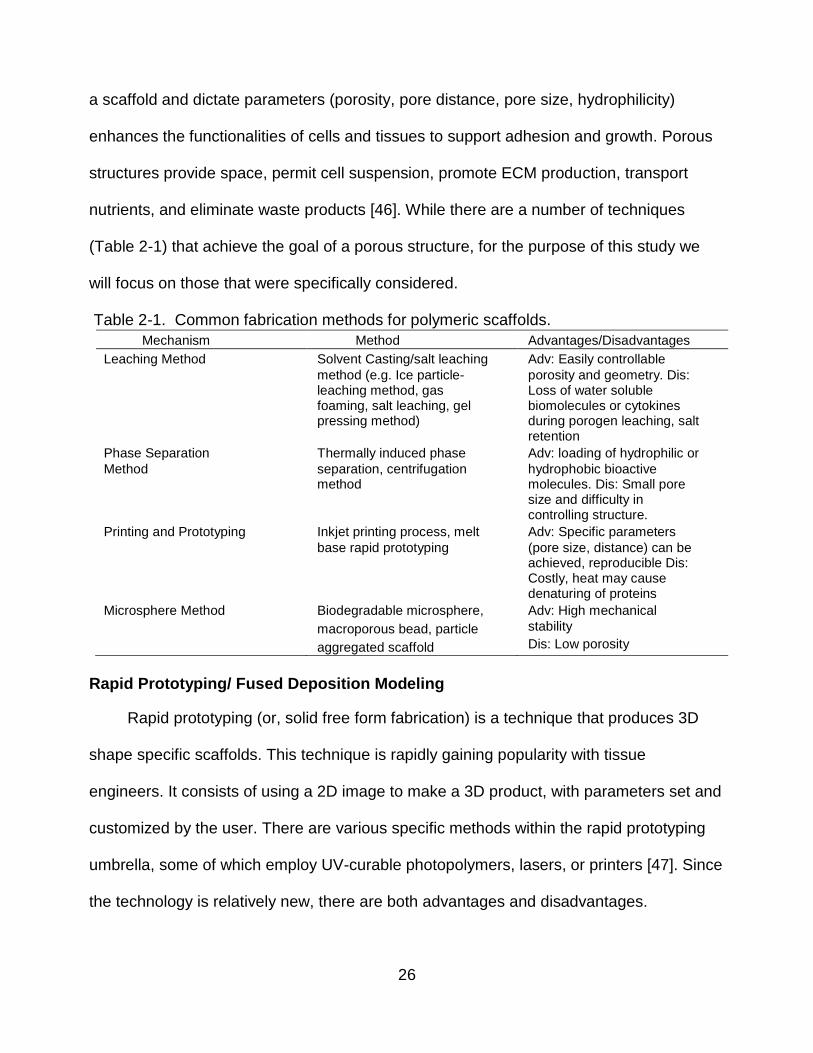
nutrients, and eliminate waste products [46]. While there are a number of techniques
(Table 2-1) that achieve the goal of a porous structure, for the purpose of this study we
will focus on those that were specifically considered.
Table 2-1. Common fabrication methods for polymeric scaffolds.
Mechanism Method Advantages/Disadvantages
Leaching Method Solvent Casting/salt leaching
method (e.g. Ice particle- leaching method, gas foaming, salt leaching, gel pressing method)
Adv: Easily controllable
porosity and geometry. Dis: Loss of water soluble biomolecules or cytokines during porogen leaching, salt retention
Phase Separation
Method
Thermally induced phase
separation, centrifugation method
Adv: loading of hydrophilic or
hydrophobic bioactive molecules. Dis: Small pore size and difficulty in controlling structure.
Printing and Prototyping Inkjet printing process, melt
base rapid prototyping
Adv: Specific parameters
(pore size, distance) can be achieved, reproducible Dis: Costly, heat may cause denaturing of proteins
Microsphere Method Biodegradable microsphere,
macroporous bead, particle
aggregated scaffold
Adv: High mechanical
stability
Dis: Low porosity
Rapid Prototyping/ Fused Deposition Modeling
Rapid prototyping (or, solid free form fabrication) is a technique that produces 3D
shape specific scaffolds. This technique is rapidly gaining popularity with tissue
engineers. It consists of using a 2D image to make a 3D product, with parameters set and
customized by the user. There are various specific methods within the rapid prototyping
umbrella, some of which employ UV-curable photopolymers, lasers, or printers [47]. Since
the technology is relatively new, there are both advantages and disadvantages.
27
In the related literature, 3D printing is perhaps the most ubiquitous concept.
Founded at MIT, it involves a layer-by-layer process in which the sliced 2D profile of a
computer model is printed on a fresh layer of powder via deposition of a suitable binder
[48-49]. Successive layers are deposited on top of the previous layer until the model is
complete. One of the disadvantages of this method is that it does not produce a strong
bond between the particles on the model – which can produce an ill-fitted scaffold and
collapse in vivo. In addition, the cost of fabricating a scaffold using a 3D machine is fairly
expensive.
Fused Deposition Modeling (FDM) operates along the same layer-by-layer pathway
as 3D printing. A plastic filament or metal wire is unwound from a coil and it supplies
material to an extrusion nozzle, which can turn the flow on and off. The nozzle is then
heated to melt the material and can be moved along both horizontal and vertical
directions by a numerically controlled mechanism [50]. One of the drawbacks of FDM is
the large amount of material needed to make a scaffold, which can make for an expensive
and unrealistic alternative to bone grafts.
Solvent Casting/ Porogen Leaching Method
As a result of the large amount of material needed, the solvent casting/ salt leaching
method was chosen. This technique can produce polymeric scaffolds with a high porosity
and varying pore sizes. A suitable porogen is initially combined with a polymer solution in
a mold for the assembly of solid polymer scaffolds. The porogen is then subsequently
leached out to form highly porous sponges for the cultivation of cells. One of the
advantages of this technique is that the porogen (sodium chloride, sodium bicarbonate) is
not soluble in the organic solvents typically used to dissolve the biodegradable polymer
[51]. Nevertheless, an accumulation of un-dissolvable porogen could lead to an uneven

28
distribution of pores on the scaffold. Care must be taken to make sure the porogen is
evenly dispersed within the polymer solution. After casting the polymer porogen mixture,
the porogen can be further purged by a washing series using distilled water. Once the
washing step is completed, what is left is a highly porous, water insoluble scaffold.
The purpose of this research was to develop a highly porous scaffold for the
cultivation of cells. Since the porogen leaching technique achieves the end result without
the use of a large amount of polymer, we decided to fabricate our scaffolds using this
technique. Moreover, porogen leaching is mainly useful for biomaterials in the
developmental stage. Figure 2-4 and Figure 2-5 represent the preparation and processing
of the polymeric scaffold using the solvent casting/ porogen leaching method.

29
Figure 2-4. Fabrication method for solvent casting/ particulate leaching. The polymer and particulate (sodium chloride) are dissolved in an organic solvent and cast in a drying mold. The sodium chloride is then leached out of the scaffold using a washing series. The porous scaffold is freeze-dried and then placed in a vacuum oven
Figure 2-5. Schematic of scaffold fabricated through the solvent casting/ particulate leaching method.
30
CHAPTER 3 BONE TISSUE ENGINEERING
Bone Physiology
Bone is a dynamic organ. Formation, growth, maintenance, healing, and repair of
the skeleton require that bone be formed throughout the life of an individual [52]. Bone
serves five distinct purposes in the human body: it offers mechanical support, it anchors
muscle attachments, it functions as a safeguard for internal organs and marrow, and it
provides storage for certain elements (mostly calcium) [53].
Bone can be generally classified into two types: cortical and cancellous (trabecular)
bone. They are classified in part on their porosity, rigidity, and microstructure. Cortical
bone accounts for 80% of bone, and cancellous bone accounts for the other 20%. On a
microscopic level, bone is composed of several different cell types, each possessing a
function and extracellular matrix (ECM) [54, 55]. The ECM is mostly composed of Type I
collagen, along with small traces of types III and V collagens at different stages of bone
formation. Proteoglycans (5%) and noncollagenous proteins are also included in the
ECM. The noncollagenous proteins can be divided into several categories. These include
proteoglycans, glycosylated proteins, and glycosylated proteins with potential cell-
attachment activities [56, 57].
Two thirds of bone matrix are made up of calcium phosphate (Ca3 (PO4)2). Calcium
phosphate reacts with calcium hydroxide (Ca (OH)2) to form crystals of hydroxyapatite
(Ca10(PO4) 6 (OH)2). The remainder of the bone matrix (approximately one third) is
collagen. Bone cells only make about 2% of bone mass [58].
31
The Cells of the Bone
The cell types associated with bone development include osteoblasts, osteocytes,
bone lining cells and osteoclasts. Below is a list of key bone cells and their definitions.
Osteoblasts: Immature bone cells that secrete the matrix by the process of
osteogenesis (secretion of proteins and other inorganic compounds of the matrix). The
role of these secreted proteins is not clearly understood. Many have attributed their
function to include the regulation of bone mineral deposition and turnover, and the
regulation of bone cell activity [59]. Osteoblasts originate from bone marrow stromal cells
or mesenchymal stem cells, proliferating and differentiating first into preosteoblasts, and
then to mature osteoblasts. They can be found on the lining areas of newly formed and
unmineralized tissue (mostly type I collagen) [60].
Osteocytes: When immature bone cells (osteoblasts) are surrounded by bone they
become osteocytes. One can think of osteocytes as cells that help “maintain” the bone
matrix. This is during both synthesis and resorption of the matrix. Osteocytes live in
lacunae between layers of the mineralized matrix; they have extensive filopodial
processes that lie within the canaliculi in mineralized bone and allow them to maintain
connection with each other and with the bone surface [61]. Osteocytes do not turn over
and may live for decades in the human bone. It has also been suggested that the
presence of empty lacunae in aging bone means that osteocytes undergo apoptosis [62,
63].
Bone lining cells: Perhaps the least understood of the cell types are Bone Lining
Cells (BLCs). The surface of bones, which is not under remodeling or formation, is
covered by BLCs. Characteristic of the BLCs is their elongated, thin, and flat appearance.
At the heart of the confusion surrounding BLCs is their function. Some studies have
32
speculated that BLCs play an integral part in the marrow stromal system and have
important functions in hematopoiesis, while others suggest that BLCs help in the
maintenance of bone fluids and in the fluxes of ions between the bone fluid and the
interstitial fluid compartments of mineral homeostasis. BLCs have also been marked as
inactivated osteoblasts [64-66].
Osteoclasts: Differentiated from hematopoietic stem cells found in the circulating
blood, osteoclasts are the cells responsible for the resorption of bone. Histologically, they
are roughly 20-100 µm in size. Osteoclasts can have a number of different shapes,
ranging from flat to rounded shaped cells, depending on the phase of the resorption cycle
they are in [67]. They possess two distinct plasma membrane areas: a ruffled border and
a clear zone (also known as a sealing zone). The clear zone surrounds the ruffled border
area facing the resorption lacunae. Through the ruffle border, the osteoclasts secrete
hydrochloric acid and collagenase to dissolve the inorganic matrix. This slightly acidic, pH
4.0-4.5, secretion dissolves the hydroxyapatite crystals that form the mineralized
extracellular bone matrix. Next, the various enzymes and collagenases released
decimate the collagen matrix, thereby securing the hydroxyapatite crystals to the bone.
The degradation products are then removed from the resorption lacunae and released
into the extracellular matrix [68-71].
Bone Type
Due to the rigidity and hardness of bone, there is a perception that bone is not
“alive.” Quite the contrary, bone is made of “living” and “nonliving elements.” Cortical
bone is made up of osteons, which are cells composed of frail layers of the membrane
called lamellae. The membrane protects the blood and nerves of the internal core of the
compact bone. All osteons in long bones run the length of the bone, strengthening the
33
bone in that direction [72]. Cortical bone is quite dense and has a porosity of 5-10% [54].
It is 80-90% mineralized. Cortical bone is very strong – with the elastic modulus and yield
strength of the cortical bone ranging between a reported 10-40 GPa and 90-140 MPa
respectively [73] – and its main function is to maintain the mechanical and protective
requirements of the skeleton.
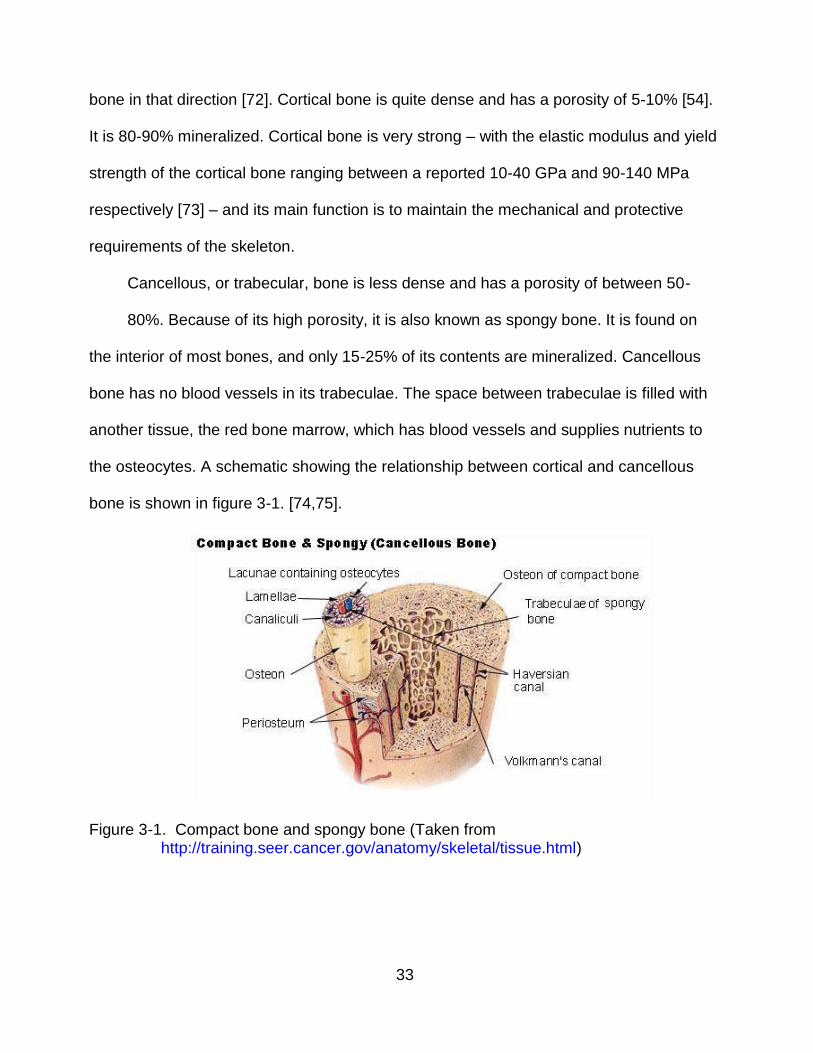
Cancellous, or trabecular, bone is less dense and has a porosity of between 50-
80%. Because of its high porosity, it is also known as spongy bone. It is found on
the interior of most bones, and only 15-25% of its contents are mineralized. Cancellous
bone has no blood vessels in its trabeculae. The space between trabeculae is filled with
another tissue, the red bone marrow, which has blood vessels and supplies nutrients to
the osteocytes. A schematic showing the relationship between cortical and cancellous
bone is shown in figure 3-1. [74,75].
Figure 3-1. Compact bone and spongy bone (Taken from http://training.seer.cancer.gov/anatomy/skeletal/tissue.html)
34
Bone Modeling and Remodeling: Osteoblast and Osteoclast Interaction
Bone Modeling refers to alterations in bone shape through the independent actions
of osteoblasts and osteoclasts. In skeletal growth, removal (osteoclasts) and
replacement (osteoblasts) occur at a fairly rapid pace. The rate of turnover of the
skeleton approaches roughly 100% in the first year of life, and dramatically decreases to
about 10% per year in late childhood to early teens. This rate is further reduced as time
progresses. As a matter of fact, by the age of 25, most women hit their maximum bone
peak mass, and by the age of 30 most men hit this peak as well. Therefore, most – but
not all – of the turnover of bone during growth occurs from bone modeling. Bone
remodeling accounts for skeletal growth from adulthood to death [76-78].
While bone modeling is based on the independent, coordinated actions of
osteoclasts and osteoblasts, bone remodeling is possible through a dependent and
coordinated interaction between osteoclasts and osteoblasts. In an adult skeleton,
osteoclasts and osteoblasts belong to an assembly recognized as a basic multicellular
unit or a BMU. The BMU is composed of osteoclasts (located in the front), osteoblasts
(located in the rear), a nerve supply, a central vascular capillary, and connective tissue.
The BMU, beginning at a certain origin, progresses towards its target for bone
replacement and continues a distance thereafter until it self-terminates. There is a
difference in bone remodeling in cortical and cancellous bone. The BMU travels through
the bone in the cortical bone, hollowing out a tunnel. However, in cancellous bone, the
BMU is largely a superficial surface process – more of a trench than a tunnel [79-82].
More specifically, the activation of preosteoclastic cells in the bone marrow initiates
the bone remodeling process. Interluekin-1 (IL-1), Parathyroid Hormone (PTH), and a
few other cytokines are released from inactive bone lining cells. The
35
preosteoclastic cells then migrate to the surface of the bone. These cells mature
into osteoclasts which then develop a ruffle border. The osteoclasts cover a space on the
matrix surface and secrete hydrogen ions and cathepsin into that space. They in turn
resorb the mineral (Ca 2+) on the surface of cancellous (trench) and cortical bone
(tunnel). The formation or reconstruction of bone begins when PTH stimulates the
osteoblasts to produce IL-6 and other cytokines that stimulate osteoclasts to resorb
bone. This occurs alongside the activation of the preosteoclastic cell by IL- 1. This
stimulation of osteoclasts produces channels in which blood capillaries grow. The
osteoblasts, in turn, line the tunnels so that blood may flow to the bone. The osteoblasts
secrete type 1 collagen and various matrix proteins [83-86]. The collagen, now
polymerized, forms triple stranded fibers to create an osteoid. When the osteoid is about
6 microns thick, it begins to mineralize [87]. Eventually, the mineralization of calcium and
phosphate ions precipitates to create crystals of hydroxyapatite (HA). Lastly, the HA
traps the osteoblasts into this newly formed bone matrix where they mature into
osteocytes [64].
Bone Specific Markers
While there are no specific markers that are exclusively produced by bone in both
its modeling and remodeling processes, there are a number of proteins in varying
concentrations that exist only in bone. A brief description of the most common markers is
included below.
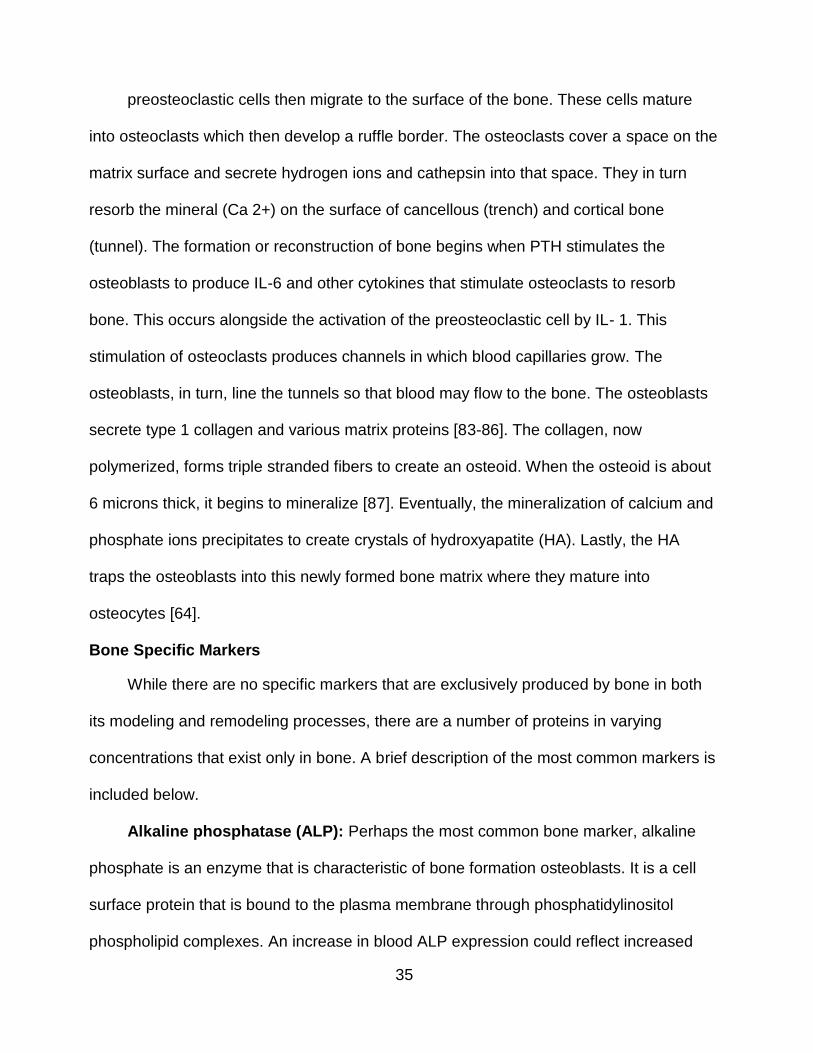
Alkaline phosphatase (ALP): Perhaps the most common bone marker, alkaline
phosphate is an enzyme that is characteristic of bone formation osteoblasts. It is a cell
surface protein that is bound to the plasma membrane through phosphatidylinositol
phospholipid complexes. An increase in blood ALP expression could reflect increased
36
bone formation. However ALP expression is not limited to bone. The synthesis of ALP in
the liver, kidney, placenta, intestine, serum and other tissues makes it commonplace in
the body, which subsequently makes it fairly difficult to take measurements and interpret
changes. In an adult’s normal functioning liver, roughly 50% of the total alkaline
phosphatase activity arises from the liver and the remaining 50% stems from the bone
[88]. Although the exact function of ALP in bone is not completely understood, there are
a number of theories that speculate on its possible role. Primarily, ALP expression has
been recognized as playing an important part in skeletal mineralization. It is suggested
that ALP hydrolyzes an unknown phosphate ester that increases the local concentration
of inorganic phosphate. This substantial increase in available phosphate is purported to
facilitate the formation of the bone mineral hydroxyapatite. Moreover, some studies have
suggested that ALP hydrolyzes a calcification inhibitor identified as inorganic
pyrophosphate. Others state that ALP may act as a transporter for inorganic phosphate
to bind to Ca 2+ to help accelerate calcium phosphate precipitation [89-92].
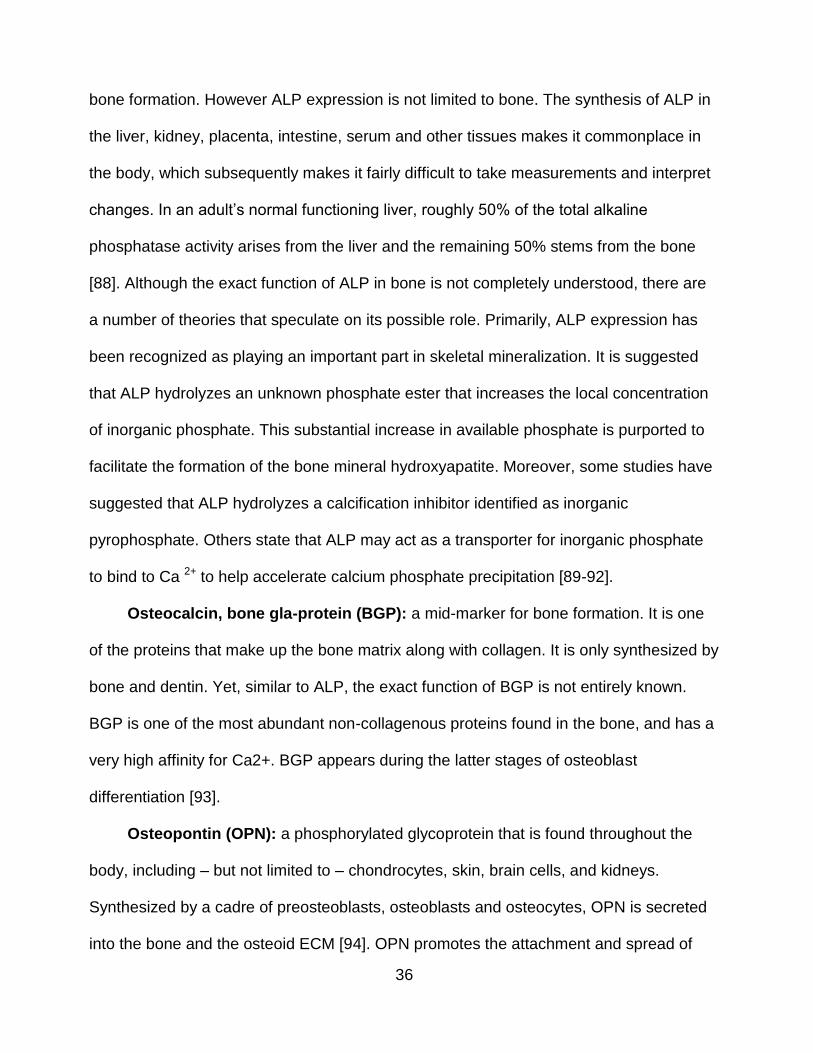
Osteocalcin, bone gla-protein (BGP): a mid-marker for bone formation. It is one
of the proteins that make up the bone matrix along with collagen. It is only synthesized by
bone and dentin. Yet, similar to ALP, the exact function of BGP is not entirely known.
BGP is one of the most abundant non-collagenous proteins found in the bone, and has a
very high affinity for Ca2+. BGP appears during the latter stages of osteoblast
differentiation [93].
Osteopontin (OPN): a phosphorylated glycoprotein that is found throughout the
body, including – but not limited to – chondrocytes, skin, brain cells, and kidneys.
Synthesized by a cadre of preosteoblasts, osteoblasts and osteocytes, OPN is secreted
into the bone and the osteoid ECM [94]. OPN promotes the attachment and spread of

37
osteoblasts to and through the ECM. Some researchers have found that OPN production
occurs before osteocalcin, which would suggest it is a part of bone resorption. In studies
that researched bone growth, OPN was found in large amounts at the borders of growth
plates in growing bone. In studies that dealt with bone healing, OPN was found in the
borders of a defect between new and native bone. Finally, in studies that focused on
bone growth between a foreign object and native bone, OPN was detected between the
implant (foreign object) and the existing bone [95, 96].
Bone sialoprotein (BSP): a phosphorylated and glycosylated protein that mediates
cell attachment to the ECM. Similar to other markers, it is not specific to bone. It can be
found in chondrocytes, hypertrophic cartilage, and osteoclasts [97]. It can also be found
in mature osteoblasts and osteocytes during the beginning stage of mineralization.
Furthermore, it has high affinity for calcium ions [98].
Osteonectin: Also known as “secreted protein acidic and rich in cysteine”
(SPARC), osteonectin is a glycoprotein that is expressed in osteoblasts, vascular smooth
muscle cells, endothelial cells, megakaryocytes, chondrocytes, steroidogenic cells, and
placental trophoblasts [99]. Similar to the other bone markers, it can bind to calcium ions,
hydroxyapatite, and collagen. Studies have shown that osteonectin regulates cellular
progression through the cell cycle. It has also been documented that osteonectin may be
involved in the binding of growth factors to cells [100-101].
Collagen type I: Collagen type I is the most abundant protein found in bone,
comprising 95% of the extracellular matrix of bone. Its triple helix structure gives
bone its high strength. It is not specific to bone and can be found in tendons, ligaments,
and skin [102].

38
Bone Morphogenic Proteins
Growth factors are defined as polypeptides that provide two functions: they
stimulate cell proliferation and provide major growth-regulatory molecules for cells in
culture and in vivo [103]. Bone contains many growth factors including – but not limited to
– transforming growth factor beta (TGF- β), insulin-like growth factor, fibroblast growth
factor and bone morphogenic proteins (BMPS) [104]. For the purpose of this research,
we will focus on BMPs.
BMPs are a subgroup of the TGF- β super family. BMPs are only accessible and
available when bone has been demineralized. Initially, BMPS were identified by Urist as
molecules that induce bone when implanted in an ectopic site in a rat model [105]. A
number of ensuing studies conducted on BMPs have found them to be able to recruit and
stimulate mesenchymal cell progenitors to differentiate into osteoblasts, therefore
suggesting that BMPs are also indirectly involved in bone remodeling and healing [106-
108].
BMPs are extracellularly regulated by Noggin, Chordin and DAN, two BMP-binding
proteins. Through signaling transduction, BMPs bind to a heterodimeric complex of two
transmembrane serine-threonine kinase receptors: BMP receptor type (BMPR) I and II.
Type I and II receptor kinases phosphorylate the transcription factors Smad 1, 5, and 8.
These phosphorylated Smads then form a heterodimeric complex with Smad 4 in the
nucleus and activate the expression of various genes [109-113]. There have been at
least 15 BMPs identified in mammals [114]. BMP2 and BMP-4 have been the most
studied and catalogued. They are also the BMPs which have been shown to induce the
most bone formation in an ectopic site [115,116].
39
Fracture Healing and Bone Repair
Bone is not a static organ; rather, it is constantly remodeling itself. Even when
damaged, bone can repair and heal itself. The healing of a fractured bone occurs via a
primary or secondary healing, with the latter process consisting of several stages
[117,118].
Primary healing, also known as direct healing, is only initiated under the most
optimal of biological conditions. In this type of healing, the cortex seeks to re-establish
itself after damage. Also, unlike secondary healing, no external callus is formed;
however, it requires an environment of rigid stabilization [119]. Yet, since most fractures
require some sort of motion (sling or cast immobilization, external or intramedullary
fixation) to heal, primary healing is atypical [120]. We can further divide primary healing
into two groups: gap healing and contact healing.
In gap healing, the entire gap is filled with direct bone formation. Initially, formation
is accomplished with woven bone, followed by parallel-fibered and/or lamellar bone for
support. Within the gap, there are no traces of fibrocartilage or connective tissue. The
orientation of this new bone formation is transverse to the original (native) lamellar bone
orientation. After several weeks, longitudinal Harvesian remodeling rebuilds the necrotic
fracture ends and replaces the woven/lamellar bone with osteons of the original
orientation. Gap healing results in a bone that is fairly similar to the bone it replaced [121-
124].
In contact healing, healing occurs where fragments are in direct apposition to each
other and osteons grow across the fracture site and parallel to the long axis of the bone.
This is accomplished without the intermediary step of new bone being formed transverse
to the original bone (via gap healing). First, the osteoclasts resorb irreparably damaged/
40
necrotic bone on one side of the fracture site- noted as a “tunneling resorptive
response”. The tunneling allows the penetration of capillaries and leads to new
Haversian systems. Along with these blood vessels are endothelial cells and
osteoprogenitor cells for osteoblasts. Finally, this leads to the production of osteons
across the fracture site. The end result of gap healing and contact healing is regeneration
of native, pre-fractured bone architecture [122, 125-127].
Secondary bone healing: Secondary healing, far more likely than primary healing,
occurs when there is no rigid fixation of the fractured bone ends. Secondary healing
leads to an external callus formation. Due to its complexity, there are three distinct
stages of secondary healing: an initial inflammatory phase, an intermediary reparative
phase, and a remodeling phase [128]. There are a number of growth factors involved,
some which were detailed in Sec 3.1.4. For the purpose of this research, we will briefly
highlight the key points in secondary healing.
Stage I - Inflammation: Before the inflammation stage can begin, a fracture must
occur. Fracturing of the bone occurs when the bone absorbs energy beyond its modulus
of elasticity (MOE) [129]. The impact damages the local bone marrow, the periosteum,
neighboring soft and hard tissue, and also disrupts blood vessels. Due to the disruption
of blood vessels, a hematoma occurs [130, 131]. The ends of the vessels undergo
thrombosis, formation of a blood clot inside the vessel. Once this occurs, lysosomal
enzymes are released. A steep drop in pH results in an acidic environment. Since this is
a largely cellular event, a group of cells respond to the fracture site. Macrophages,
platelets, monocytes and other inflammatory cells begin the cleanup and repair process
[118].
41
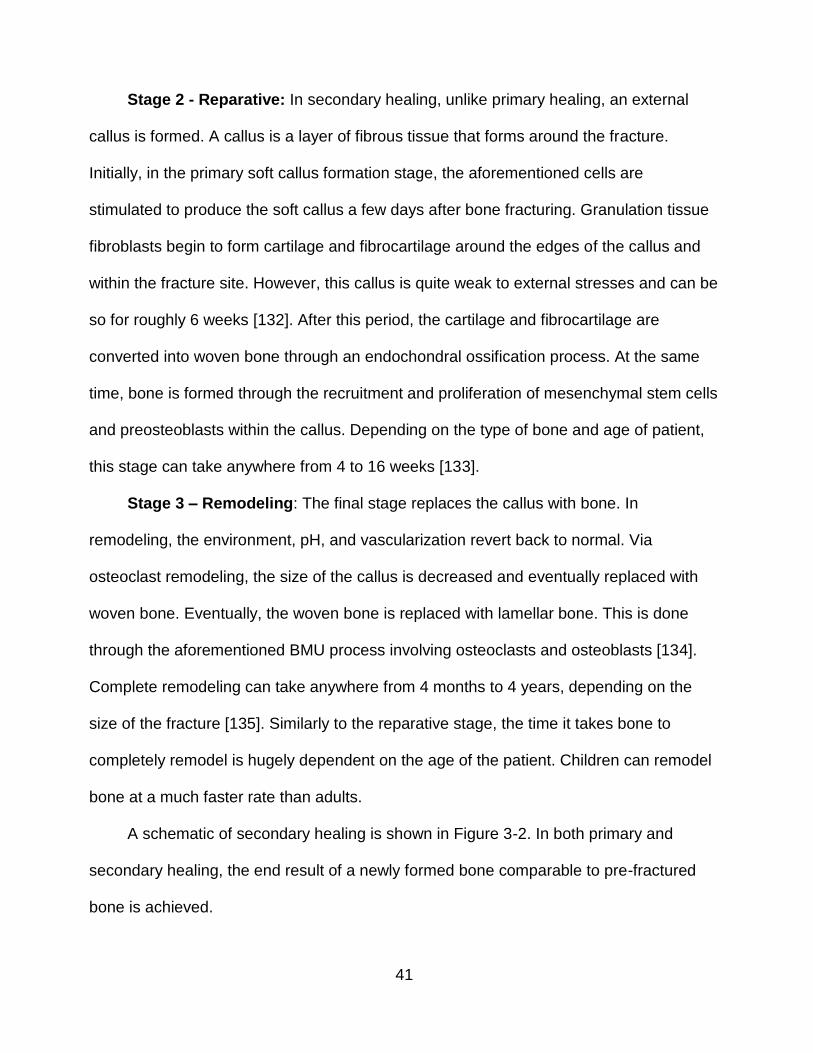
Stage 2 - Reparative: In secondary healing, unlike primary healing, an external
callus is formed. A callus is a layer of fibrous tissue that forms around the fracture.
Initially, in the primary soft callus formation stage, the aforementioned cells are
stimulated to produce the soft callus a few days after bone fracturing. Granulation tissue
fibroblasts begin to form cartilage and fibrocartilage around the edges of the callus and
within the fracture site. However, this callus is quite weak to external stresses and can be
so for roughly 6 weeks [132]. After this period, the cartilage and fibrocartilage are
converted into woven bone through an endochondral ossification process. At the same
time, bone is formed through the recruitment and proliferation of mesenchymal stem cells
and preosteoblasts within the callus. Depending on the type of bone and age of patient,
this stage can take anywhere from 4 to 16 weeks [133].
Stage 3 – Remodeling: The final stage replaces the callus with bone. In
remodeling, the environment, pH, and vascularization revert back to normal. Via
osteoclast remodeling, the size of the callus is decreased and eventually replaced with
woven bone. Eventually, the woven bone is replaced with lamellar bone. This is done
through the aforementioned BMU process involving osteoclasts and osteoblasts [134].
Complete remodeling can take anywhere from 4 months to 4 years, depending on the
size of the fracture [135]. Similarly to the reparative stage, the time it takes bone to
completely remodel is hugely dependent on the age of the patient. Children can remodel
bone at a much faster rate than adults.
A schematic of secondary healing is shown in Figure 3-2. In both primary and
secondary healing, the end result of a newly formed bone comparable to pre-fractured
bone is achieved.
42
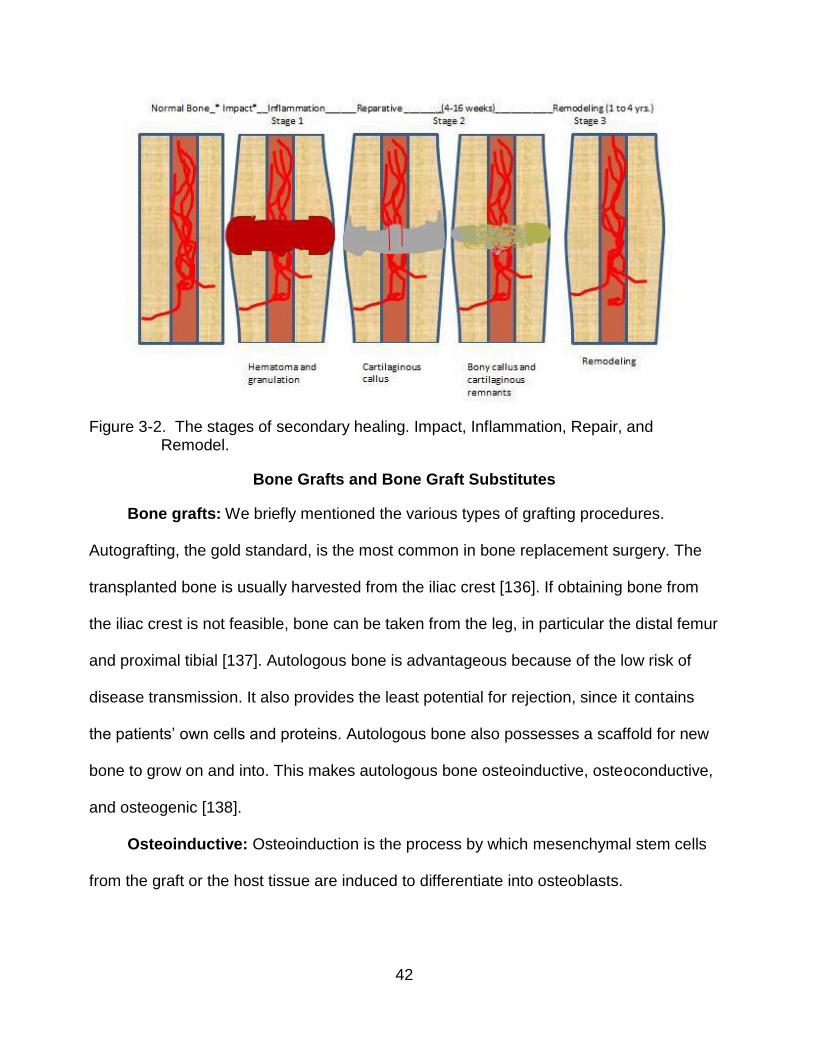
Figure 3-2. The stages of secondary healing. Impact, Inflammation, Repair, and
Remodel.
Bone Grafts and Bone Graft Substitutes
Bone grafts: We briefly mentioned the various types of grafting procedures.
Autografting, the gold standard, is the most common in bone replacement surgery. The
transplanted bone is usually harvested from the iliac crest [136]. If obtaining bone from
the iliac crest is not feasible, bone can be taken from the leg, in particular the distal femur
and proximal tibial [137]. Autologous bone is advantageous because of the low risk of
disease transmission. It also provides the least potential for rejection, since it contains
the patients’ own cells and proteins. Autologous bone also possesses a scaffold for new
bone to grow on and into. This makes autologous bone osteoinductive, osteoconductive,
and osteogenic [138].
Osteoinductive: Osteoinduction is the process by which mesenchymal stem cells
from the graft or the host tissue are induced to differentiate into osteoblasts.
43
Osteoconductive: Osteoconduction is the process by which the graft provides a
three dimensional structure that facilitates the ingrowth of capillaries and mesenchymal
stem cells to support new bone formation on the graft.
Osteogenic: Osteogenesis is the process of new bone formation by cells from the
host or the graft.
While it is considered the gold standard, autologous bone grafting has several
major drawbacks, the biggest being donor site morbidity. Joshi and Kostakis [139] found
10% of the patients who underwent iliac crest bone grafts for intra-oral augmentation had
pain for 16 weeks post-operatively. This group included those who experienced gait
difficulties and required the use of a walking stick, deformity at the hip site, hematomas,
infection, and stress fracturing. While the 10% who suffered post-operative pain is a fairly
significant percentage, autografting offers the best and most effective chance of
replacement.
Allografting: While not optimal, is another source for replacement bone. Allograft
bone comes from donor tissue, usually from bone banks that harvest cadaver bone.
These bones are cleansed and sterilized to reduce the possibility of disease transmission
from donor to recipient. While allografts possess a scaffold for cells to grow into and
onto, it may or may not provide an incentive for mesenchymal stem cells to differentiate
into osteoblasts. So, while osteoconductive, allograft bone is not necessarily
osteoinductive nor osteogenic. While the cells and proteins may be present in an
allograft, they are not native and could possibly cause an immune rejection.
Moreover, the mechanical strength of allografts is significantly decreased due to the
sterilization process, especially if gamma radiation is used. The purpose of the radiation
is to cleanse the graft of bacteria and fungi, but in heavier doses it can significantly
44
weaken the graft by degrading the collagen in the bone matrix [140]. Clearly, the
elimination of harvesting donor bone and all of its associated problems is a key
advantage in allografting. However, the threat of a possible disease being transmitted
from donor to recipient is a big reason allografting is not as common as autografting.
Disease transmission in allografting is rare, but can occur. Established screening
methods and sterilization protocols have greatly reduced the risk of transmission of
diseases in donated cadaveric tissue. The risk of a person contracting HIV from the use
of donated bone allografts is roughly 1 in 1.67 million. The probability that a bone
allograft might contain HIV has been estimated at 1 in 2.8 billion [141].
Bone graft substitutes: Since allograft, autogenous grafts, and the less common
xenografts, have significant downsides; the field of bone tissue engineering has gained
prominence. Bone tissue engineering seeks to create substitutes that are biologically
and mechanically comparable to native bone. While most of those currently on the
market provide some of these attributes, there are none that can regenerate bone results
comparable to those seen in autografting.
There are a number of different materials that are used in orthopedic surgeries to
repair bone fractures or defects. These substitutes can be naturally or synthetically
derived. Many substitutes combine both types of materials in order to improve the
effectiveness of the substitute. Synthetic materials that are currently on the market
include metals, alloys, certain polymers and ceramics. These can be further categorized
into biodegradable and non-biodegradable, with each category having distinct
advantages and disadvantages. Naturally derived materials that are currently on the
market include hydroxyapatite, demineralized bone matrix, and collagen. In order to be
an effective substitute, these materials must be osteoconductive, osteoinductive, and
45
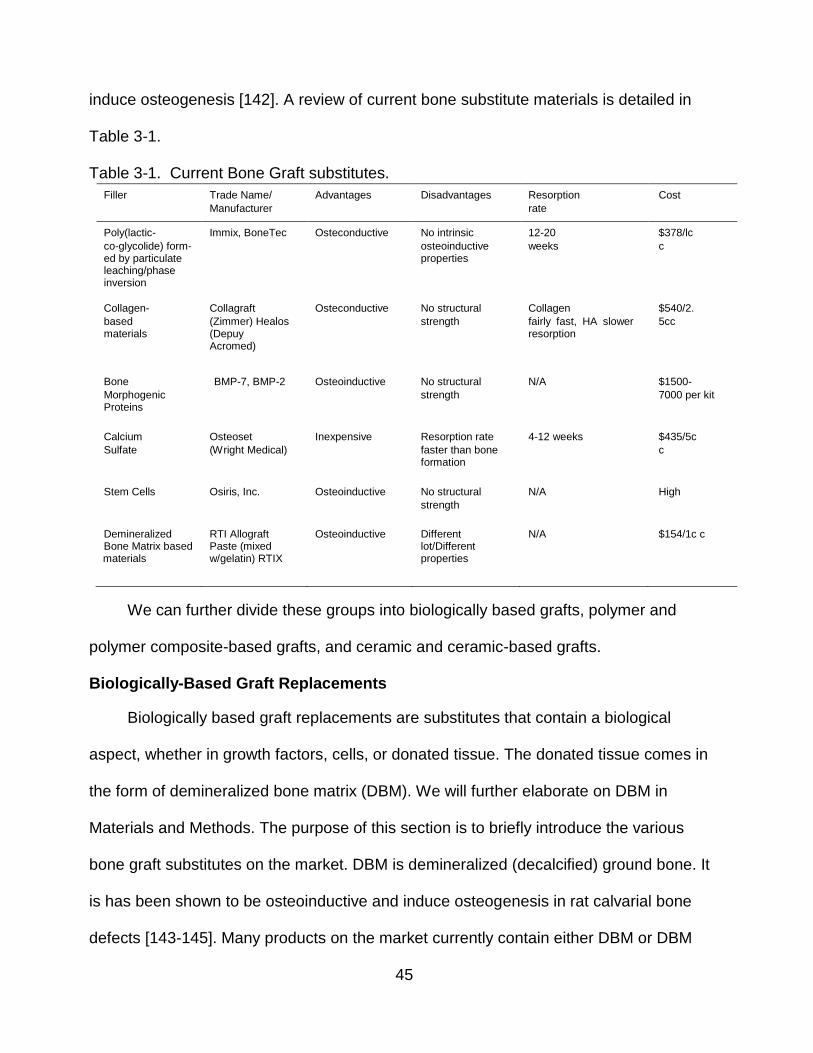
induce osteogenesis [142]. A review of current bone substitute materials is detailed in
Table 3-1.
Table 3-1. Current Bone Graft substitutes.
Filler Trade Name/
Manufacturer
Advantages Disadvantages Resorption
rate
Cost
Poly(lactic-
co-glycolide) form- ed by particulate leaching/phase inversion
Immix, BoneTec Osteconductive No intrinsic
osteoinductive properties
12-20
weeks
$378/lc
c
Collagen-
based materials
Collagraft
(Zimmer) Healos (Depuy Acromed)
Osteconductive No structural
strength
Collagen
fairly fast, HA slower resorption
$540/2.
5cc
Bone
Morphogenic Proteins
BMP-7, BMP-2 Osteoinductive No structural
strength
N/A $1500-
7000 per kit
Calcium
Sulfate
Osteoset
(Wright Medical)
Inexpensive Resorption rate
faster than bone formation
4-12 weeks $435/5c
c
Stem Cells Osiris, Inc. Osteoinductive No structural
strength
N/A High
Demineralized Bone Matrix based
materials
RTI Allograft Paste (mixed w/gelatin) RTIX
Osteoinductive Different lot/Different properties
N/A $154/1c c
We can further divide these groups into biologically based grafts, polymer and
polymer composite-based grafts, and ceramic and ceramic-based grafts.
Biologically-Based Graft Replacements
Biologically based graft replacements are substitutes that contain a biological
aspect, whether in growth factors, cells, or donated tissue. The donated tissue comes in
the form of demineralized bone matrix (DBM). We will further elaborate on DBM in
Materials and Methods. The purpose of this section is to briefly introduce the various
bone graft substitutes on the market. DBM is demineralized (decalcified) ground bone. It
is has been shown to be osteoinductive and induce osteogenesis in rat calvarial bone
defects [143-145]. Many products on the market currently contain either DBM or DBM
46
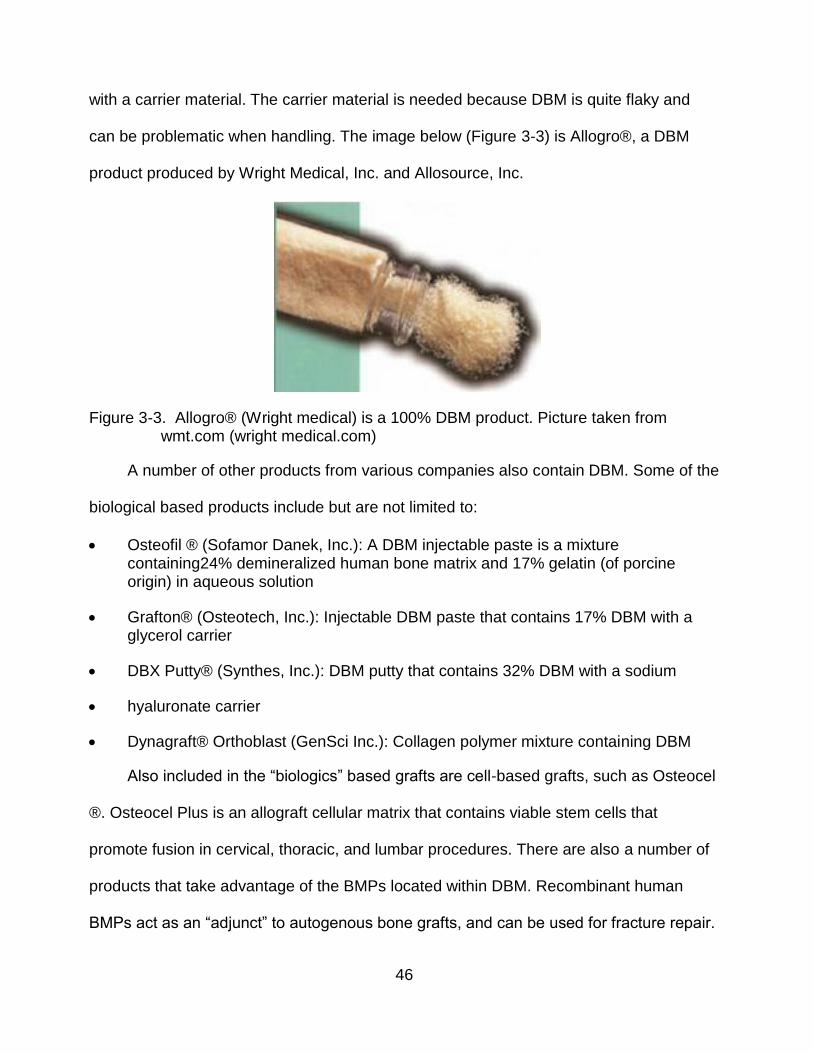
with a carrier material. The carrier material is needed because DBM is quite flaky and
can be problematic when handling. The image below (Figure 3-3) is Allogro®, a DBM
product produced by Wright Medical, Inc. and Allosource, Inc.
Figure 3-3. Allogro® (Wright medical) is a 100% DBM product. Picture taken from wmt.com (wright medical.com)
A number of other products from various companies also contain DBM. Some of the
biological based products include but are not limited to:
Osteofil ® (Sofamor Danek, Inc.): A DBM injectable paste is a mixture containing24% demineralized human bone matrix and 17% gelatin (of porcine origin) in aqueous solution
Grafton® (Osteotech, Inc.): Injectable DBM paste that contains 17% DBM with a glycerol carrier
DBX Putty® (Synthes, Inc.): DBM putty that contains 32% DBM with a sodium
hyaluronate carrier
Dynagraft® Orthoblast (GenSci Inc.): Collagen polymer mixture containing DBM
Also included in the “biologics” based grafts are cell-based grafts, such as Osteocel
®. Osteocel Plus is an allograft cellular matrix that contains viable stem cells that
promote fusion in cervical, thoracic, and lumbar procedures. There are also a number of
products that take advantage of the BMPs located within DBM. Recombinant human
BMPs act as an “adjunct” to autogenous bone grafts, and can be used for fracture repair.
47
Polymer and Polymer Based Graft Replacements
Polymer replacements can be categorized as natural and synthetic and can be
further split into degradable or nondegradable. Some of the positive attributes to using
polymeric replacements over grafting include: no donor site morbidity and virtually no
chance of contracting a disease. An effective polymeric replacement would be
biocompatible, biodegradable, and bioresorbable. It is important that we clarify this point
because a material that is biodegradable is not necessarily bioresorbable as well. As
explained earlier, the ability of a material to resorb means that it is completely and
naturally removed from the body. Polymer based replacements can be combined with
other materials to strengthen the substitute or be inserted with biologics to make the
material osteoinductive. Some of the current polymer based products include but are not
limited to:
OPLA® (THM Biomedical, Inc.) Polylactide based material
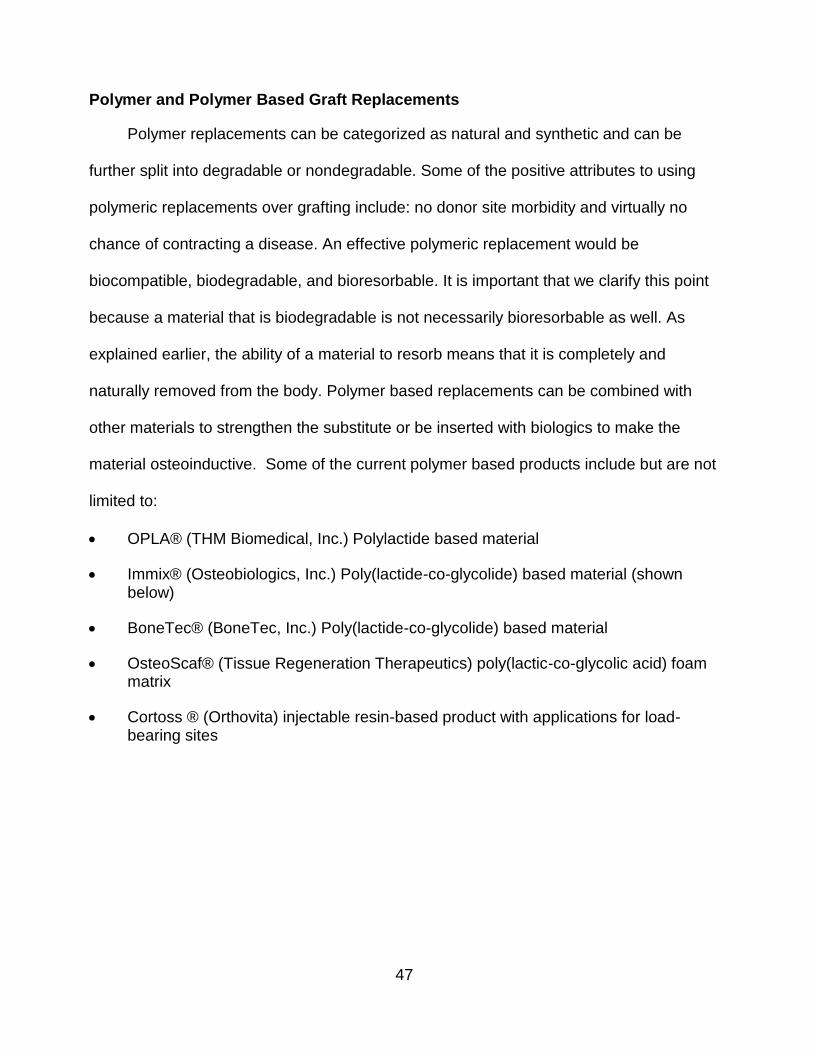
Immix® (Osteobiologics, Inc.) Poly(lactide-co-glycolide) based material (shown below)
BoneTec® (BoneTec, Inc.) Poly(lactide-co-glycolide) based material
OsteoScaf® (Tissue Regeneration Therapeutics) poly(lactic-co-glycolic acid) foam matrix
Cortoss ® (Orthovita) injectable resin-based product with applications for load- bearing sites
48
Figure 3-4. Immix Extenders® (Osteobiologics, Inc) is a particulate leached poly (lactic- co-glycolic acid) product which is used as a graft extender. Picture taken from Smith and Nephew (http://global.smith-nephew.com/master/6600.htm)
Ceramic and Ceramic-Based Graft Replacements
There has been a lot of interest in ceramic-based materials, mostly due to their high
mechanical strength. Calcium phosphate, and calcium sulfate or its derivatives are some
ceramics that can be used alone or in combination with other type of grafts. The
biological rationale for using calcium phosphate is that hydroxyapatite, a subgroup under
calcium phosphate, accounts for 70% of bone [146]. Some of the current ceramic-based
materials include but are not limited to:
Osteograf ® (Ceramed): Synthetic hydroxyapatite particles and blocks
Norian SRS® (Skeletal Repair System) (Syntheses, Inc.): Ceramic-based Calcium phosphate cement
Actifuse ® (ApaTech Limited): Silicate substituted calcium phosphate
As stated earlier, there has been an increase in ceramic-based bone graft
substitutes in terms of both availability and use. For instance, the United States Army’s
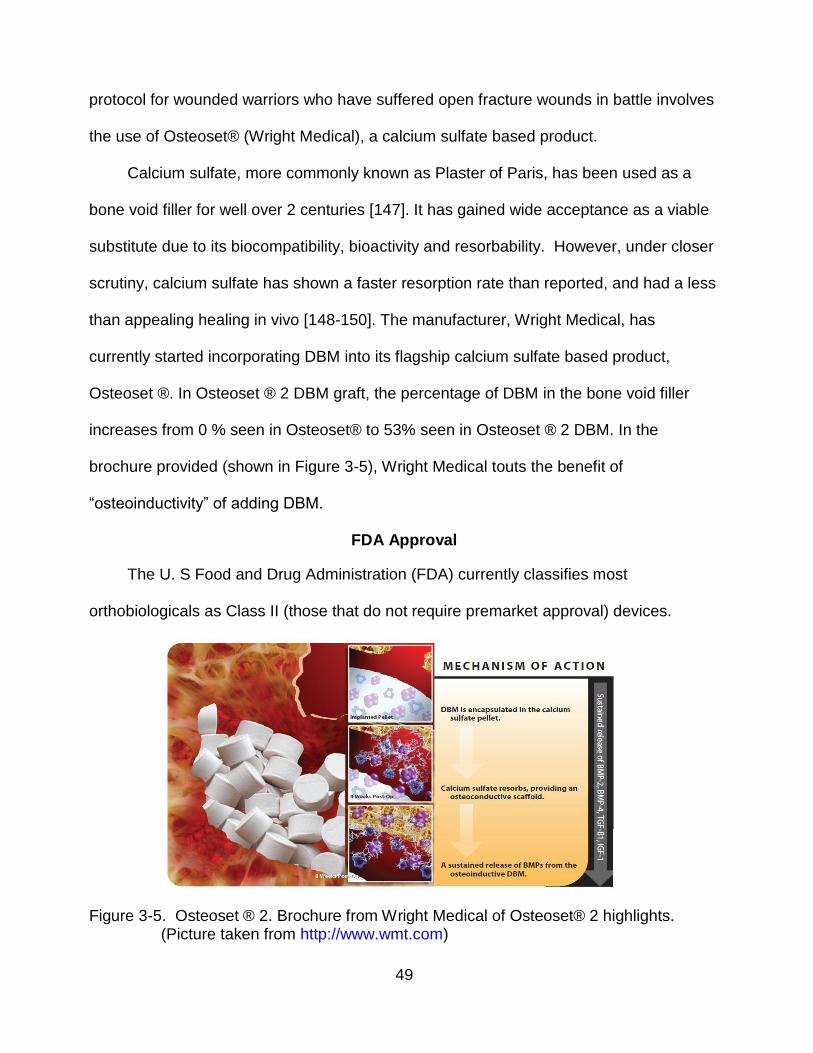
49
protocol for wounded warriors who have suffered open fracture wounds in battle involves
the use of Osteoset® (Wright Medical), a calcium sulfate based product.
Calcium sulfate, more commonly known as Plaster of Paris, has been used as a
bone void filler for well over 2 centuries [147]. It has gained wide acceptance as a viable
substitute due to its biocompatibility, bioactivity and resorbability. However, under closer
scrutiny, calcium sulfate has shown a faster resorption rate than reported, and had a less
than appealing healing in vivo [148-150]. The manufacturer, Wright Medical, has
currently started incorporating DBM into its flagship calcium sulfate based product,
Osteoset ®. In Osteoset ® 2 DBM graft, the percentage of DBM in the bone void filler
increases from 0 % seen in Osteoset® to 53% seen in Osteoset ® 2 DBM. In the
brochure provided (shown in Figure 3-5), Wright Medical touts the benefit of
“osteoinductivity” of adding DBM.
FDA Approval
The U. S Food and Drug Administration (FDA) currently classifies most
orthobiologicals as Class II (those that do not require premarket approval) devices.
Figure 3-5. Osteoset ® 2. Brochure from Wright Medical of Osteoset® 2 highlights. (Picture taken from http://www.wmt.com)
50
Several are cleared through the 510 (K) process. The DBM and cell based
substitutes are categorized as human tissue and do not need clinical trials or FDA
clearance for marketing [151-152].
Summary
The purpose of bone graft substitutes is to offer an alternative to the use of bone
grafts. Because of the wide array of materials available, they are able to repair, restore,
or regenerate bone. Currently, none of the substitutes mentioned provide a comparable
result to autografting. Autografts provide an osteoconductive surface, contain
osteoinductive factors, and induce osteogenesis. Because of this, it would take an array
of materials to attain the advantages autologous bone provides. Reaching this “ideal
scaffold” is the goal of bone tissue engineering.
51
CHAPTER 4 MATERIALS AND METHODS
C2C12 cells
The C2C12 cell line is a murine myoblastic cell line which, under appropriate culture
conditions, differentiates rapidly, forming contractile skeletal myotubes and producing
characteristic muscle proteins. Although C2C12 cells are considered to be a myogenic
lineage–committed cell line, it is known that treatment of C2C12 cells with bone
morphogenic proteins (BMP) (such as BMP-2, BMP-7) induces their transdifferentiation
into osteoblasts (bone forming cells) [153]. Although they possess the ability to
differentiate into a number of tissues like mesenchymal stem cells, they cannot be
passed forever and eventually stop differentiating.
In an informative study by Cheng et al. [154], fourteen of the human BMPs were
isolated and introduced to the different cell lines to determine the osteogenic activity of
each BMP. The cell lines used were the pluripotent mesenchymal progenitor cell line
(C2H10T1/2), the preosteoblastic cell line C2C12, and osteoblastic TE-85 cell line.
Alkaline phosphatase activity, osteocalcin production and matrix mineralization were
assessed to determine the BMPs’ potential. As expected, the committed osteoblastic cell
line (TE-85) tested positive for alkaline phosphatase activity produced by each bone
morphogenic protein. The progenitor cell line, C2H10T1/2, was much more
discriminating, and elicited a detectable amount of ALP activity with BMP-2, 6, and 9.
C2C12 cells tested positive for alkaline phosphatase activity in five out of the fourteen
BMPs (BMP-2, 4, 6, 7, and 9). In part, C2C12 cells are very attractive because –
although they can alter their pathway to an osteoblastic pathway in the presence of DBM
52
– they do so only if a high enough volume of specific BMPs are present within the
sample.
Demineralized Bone Matrix
Demineralized bone matrix (DBM) is derived from cortical bone (human or bovine)
and is prepared by removing the mineralized components of bone. This removal leaves
behind a network of organic and protein elements. While the demineralization process
reduces bone to powder, the ground bone possesses a structure that provides a platform
for bone formation~ making it osteoconductive [155]. Perhaps the most important
component of DBM is the bone morphogenic proteins (BMPs) located within the matrix. A
member of transforming growth factor-beta (TGF-β) superfamily of glycoproteins, BMPs
provide an osteoinductive trigger for cell differentiation. While more than 12 isoforms of
BMPs have been identified, BMP-2, 3 and 7 have been shown to play a critical role in
bone healing [156, 157].
The osteoinductive potential of DBM was first discovered by Marshall Urist in
1965. By implanting demineralized bone in rat muscle, Urist discovered ectopic bone
formation, through the formation of a new ossicle in the implanted area. This further led
Urist to investigate the cause of bone formation, which led him to discover BMPs
(initially labeled by Urist as the “bone-induction principle”) [158]. A number of researchers
have confirmed and expanded on the work initiated by Urist. Wozney and colleagues
[159] determined the genetic sequence of BMPs, which led to the identification of its
various forms. Utilizing recombinant gene technology, it is now possible to mass-produce
the individual BMPs.
While the production of individual BMPs using recombinant technology added to the
significant body of work on DBM, there still exists no universal method of measuring
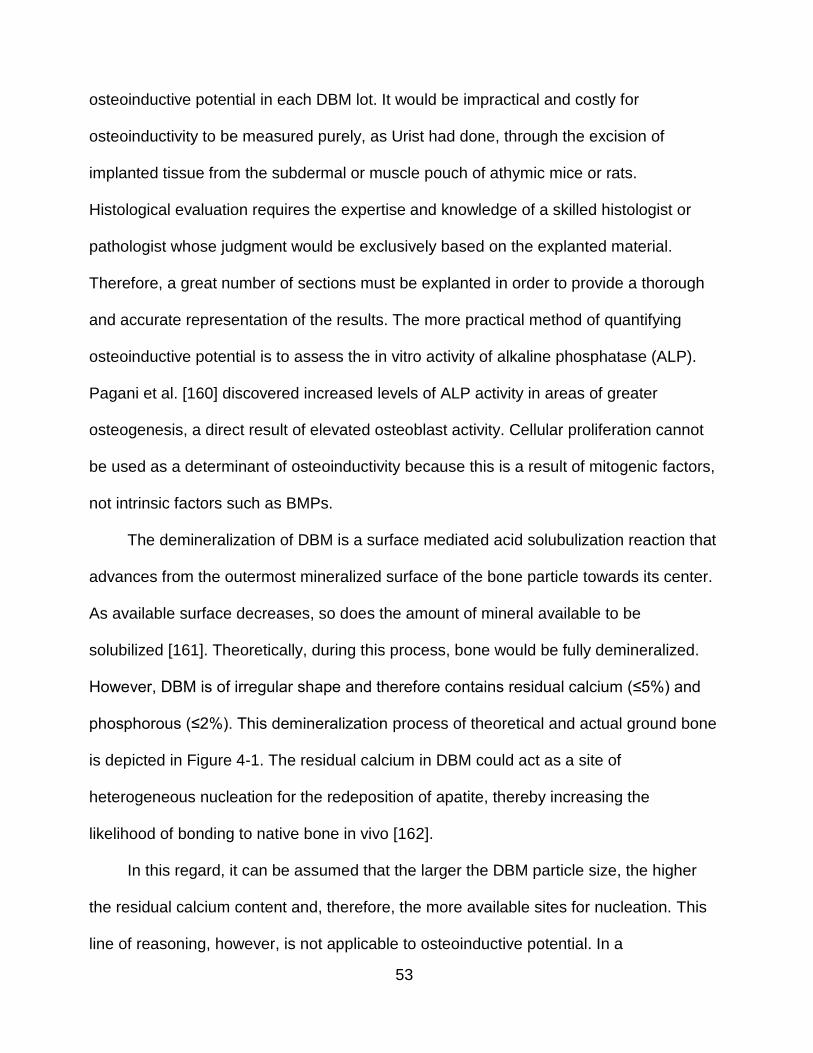
53
osteoinductive potential in each DBM lot. It would be impractical and costly for
osteoinductivity to be measured purely, as Urist had done, through the excision of
implanted tissue from the subdermal or muscle pouch of athymic mice or rats.
Histological evaluation requires the expertise and knowledge of a skilled histologist or
pathologist whose judgment would be exclusively based on the explanted material.
Therefore, a great number of sections must be explanted in order to provide a thorough
and accurate representation of the results. The more practical method of quantifying
osteoinductive potential is to assess the in vitro activity of alkaline phosphatase (ALP).
Pagani et al. [160] discovered increased levels of ALP activity in areas of greater
osteogenesis, a direct result of elevated osteoblast activity. Cellular proliferation cannot
be used as a determinant of osteoinductivity because this is a result of mitogenic factors,
not intrinsic factors such as BMPs.
The demineralization of DBM is a surface mediated acid solubulization reaction that
advances from the outermost mineralized surface of the bone particle towards its center.
As available surface decreases, so does the amount of mineral available to be
solubilized [161]. Theoretically, during this process, bone would be fully demineralized.
However, DBM is of irregular shape and therefore contains residual calcium (≤5%) and
phosphorous (≤2%). This demineralization process of theoretical and actual ground bone
is depicted in Figure 4-1. The residual calcium in DBM could act as a site of
heterogeneous nucleation for the redeposition of apatite, thereby increasing the
likelihood of bonding to native bone in vivo [162].
In this regard, it can be assumed that the larger the DBM particle size, the higher
the residual calcium content and, therefore, the more available sites for nucleation. This
line of reasoning, however, is not applicable to osteoinductive potential. In a
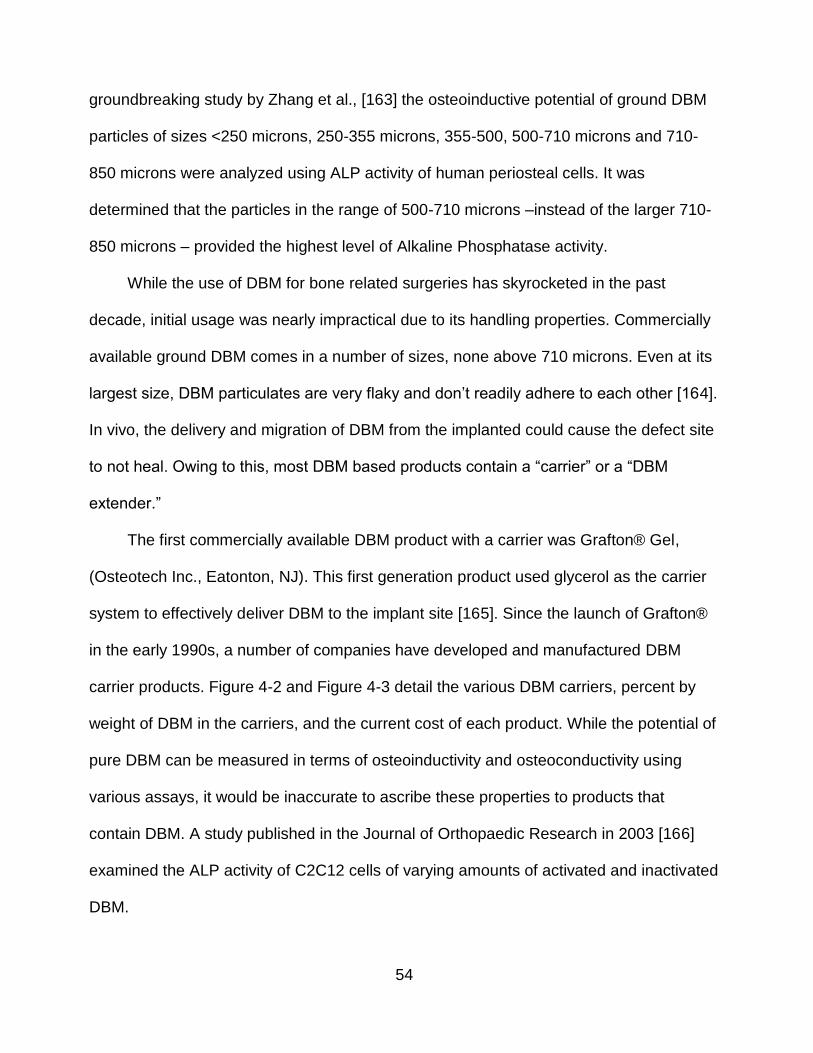
54
groundbreaking study by Zhang et al., [163] the osteoinductive potential of ground DBM
particles of sizes <250 microns, 250-355 microns, 355-500, 500-710 microns and 710-
850 microns were analyzed using ALP activity of human periosteal cells. It was
determined that the particles in the range of 500-710 microns –instead of the larger 710-
850 microns – provided the highest level of Alkaline Phosphatase activity.
While the use of DBM for bone related surgeries has skyrocketed in the past
decade, initial usage was nearly impractical due to its handling properties. Commercially
available ground DBM comes in a number of sizes, none above 710 microns. Even at its
largest size, DBM particulates are very flaky and don’t readily adhere to each other [164].
In vivo, the delivery and migration of DBM from the implanted could cause the defect site
to not heal. Owing to this, most DBM based products contain a “carrier” or a “DBM
extender.”
The first commercially available DBM product with a carrier was Grafton® Gel,
(Osteotech Inc., Eatonton, NJ). This first generation product used glycerol as the carrier
system to effectively deliver DBM to the implant site [165]. Since the launch of Grafton®
in the early 1990s, a number of companies have developed and manufactured DBM
carrier products. Figure 4-2 and Figure 4-3 detail the various DBM carriers, percent by
weight of DBM in the carriers, and the current cost of each product. While the potential of
pure DBM can be measured in terms of osteoinductivity and osteoconductivity using
various assays, it would be inaccurate to ascribe these properties to products that
contain DBM. A study published in the Journal of Orthopaedic Research in 2003 [166]
examined the ALP activity of C2C12 cells of varying amounts of activated and inactivated
DBM.
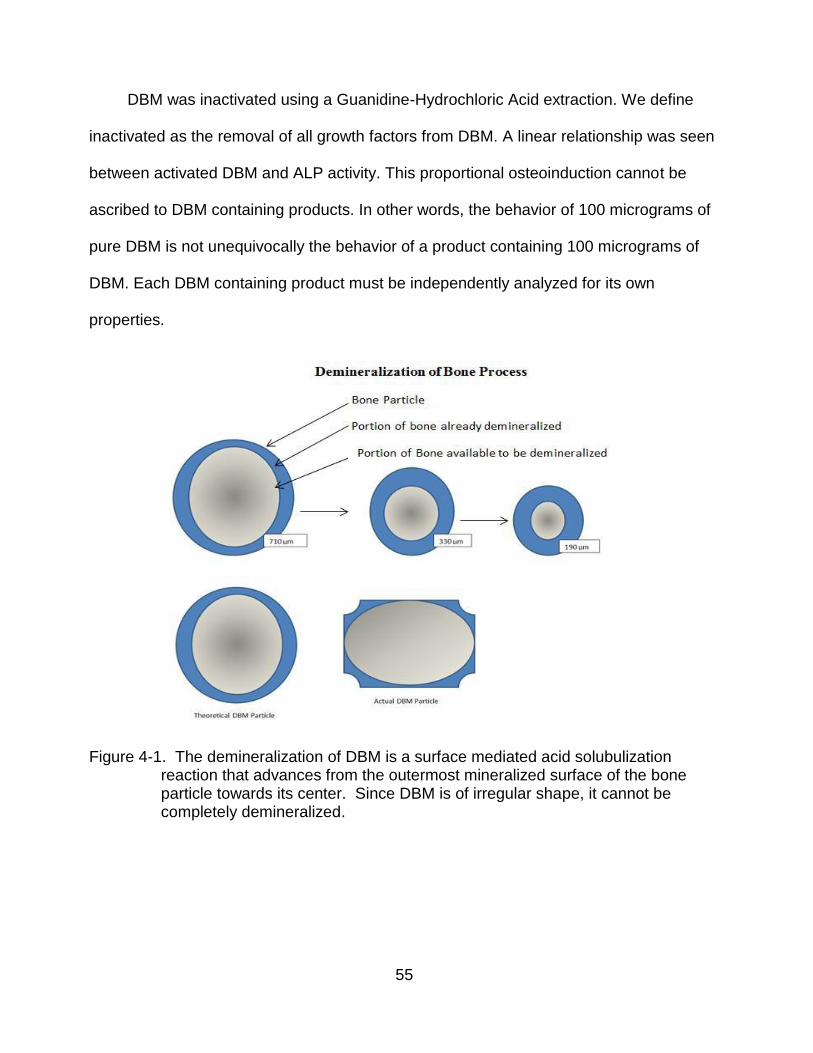
55
DBM was inactivated using a Guanidine-Hydrochloric Acid extraction. We define
inactivated as the removal of all growth factors from DBM. A linear relationship was seen
between activated DBM and ALP activity. This proportional osteoinduction cannot be
ascribed to DBM containing products. In other words, the behavior of 100 micrograms of
pure DBM is not unequivocally the behavior of a product containing 100 micrograms of
DBM. Each DBM containing product must be independently analyzed for its own
properties.
Figure 4-1. The demineralization of DBM is a surface mediated acid solubulization reaction that advances from the outermost mineralized surface of the bone particle towards its center. Since DBM is of irregular shape, it cannot be completely demineralized.
56
Figure 4-2. Commercially available DBM products
Figure 4-3. Percentage of DBM in commercially available DBM products
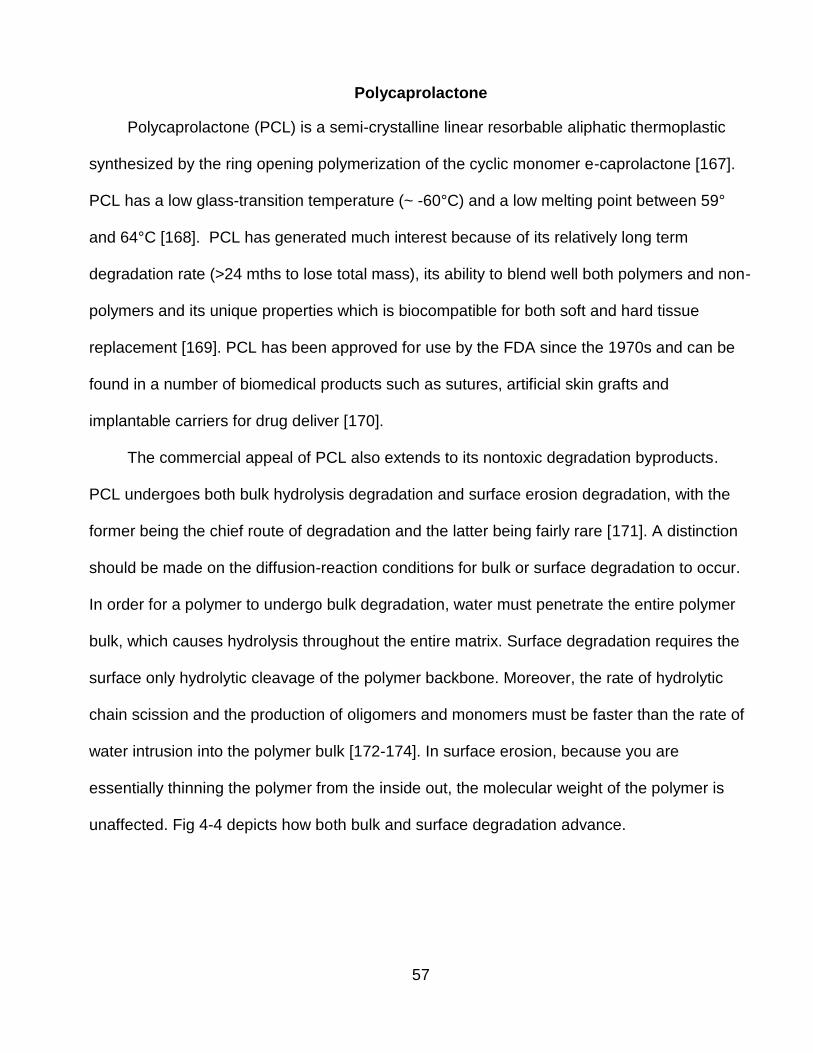
57
Polycaprolactone
Polycaprolactone (PCL) is a semi-crystalline linear resorbable aliphatic thermoplastic
synthesized by the ring opening polymerization of the cyclic monomer e-caprolactone [167].
PCL has a low glass-transition temperature (~ -60°C) and a low melting point between 59°
and 64°C [168]. PCL has generated much interest because of its relatively long term
degradation rate (>24 mths to lose total mass), its ability to blend well both polymers and non-
polymers and its unique properties which is biocompatible for both soft and hard tissue
replacement [169]. PCL has been approved for use by the FDA since the 1970s and can be
found in a number of biomedical products such as sutures, artificial skin grafts and
implantable carriers for drug deliver [170].
The commercial appeal of PCL also extends to its nontoxic degradation byproducts.
PCL undergoes both bulk hydrolysis degradation and surface erosion degradation, with the
former being the chief route of degradation and the latter being fairly rare [171]. A distinction
should be made on the diffusion-reaction conditions for bulk or surface degradation to occur.
In order for a polymer to undergo bulk degradation, water must penetrate the entire polymer
bulk, which causes hydrolysis throughout the entire matrix. Surface degradation requires the
surface only hydrolytic cleavage of the polymer backbone. Moreover, the rate of hydrolytic
chain scission and the production of oligomers and monomers must be faster than the rate of
water intrusion into the polymer bulk [172-174]. In surface erosion, because you are
essentially thinning the polymer from the inside out, the molecular weight of the polymer is
unaffected. Fig 4-4 depicts how both bulk and surface degradation advance.
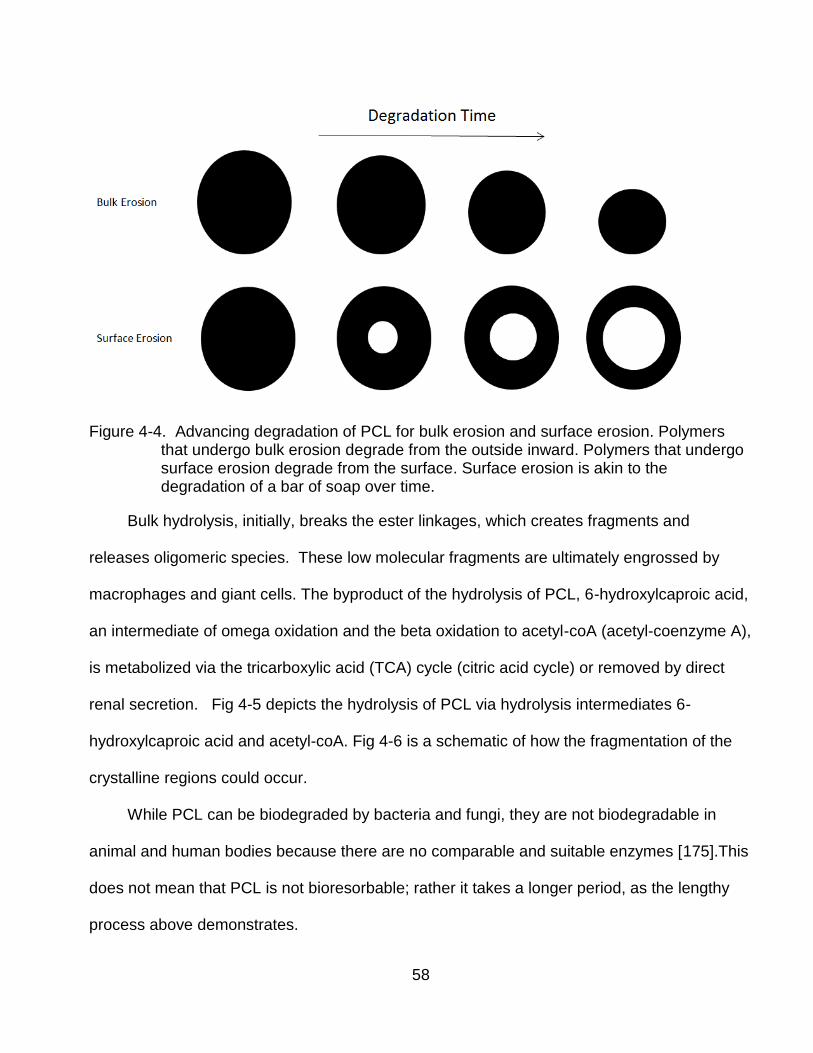
58
Figure 4-4. Advancing degradation of PCL for bulk erosion and surface erosion. Polymers that undergo bulk erosion degrade from the outside inward. Polymers that undergo surface erosion degrade from the surface. Surface erosion is akin to the degradation of a bar of soap over time.
Bulk hydrolysis, initially, breaks the ester linkages, which creates fragments and
releases oligomeric species. These low molecular fragments are ultimately engrossed by
macrophages and giant cells. The byproduct of the hydrolysis of PCL, 6-hydroxylcaproic acid,
an intermediate of omega oxidation and the beta oxidation to acetyl-coA (acetyl-coenzyme A),
is metabolized via the tricarboxylic acid (TCA) cycle (citric acid cycle) or removed by direct
renal secretion. Fig 4-5 depicts the hydrolysis of PCL via hydrolysis intermediates 6-
hydroxylcaproic acid and acetyl-coA. Fig 4-6 is a schematic of how the fragmentation of the
crystalline regions could occur.
While PCL can be biodegraded by bacteria and fungi, they are not biodegradable in
animal and human bodies because there are no comparable and suitable enzymes [175].This
does not mean that PCL is not bioresorbable; rather it takes a longer period, as the lengthy
process above demonstrates.
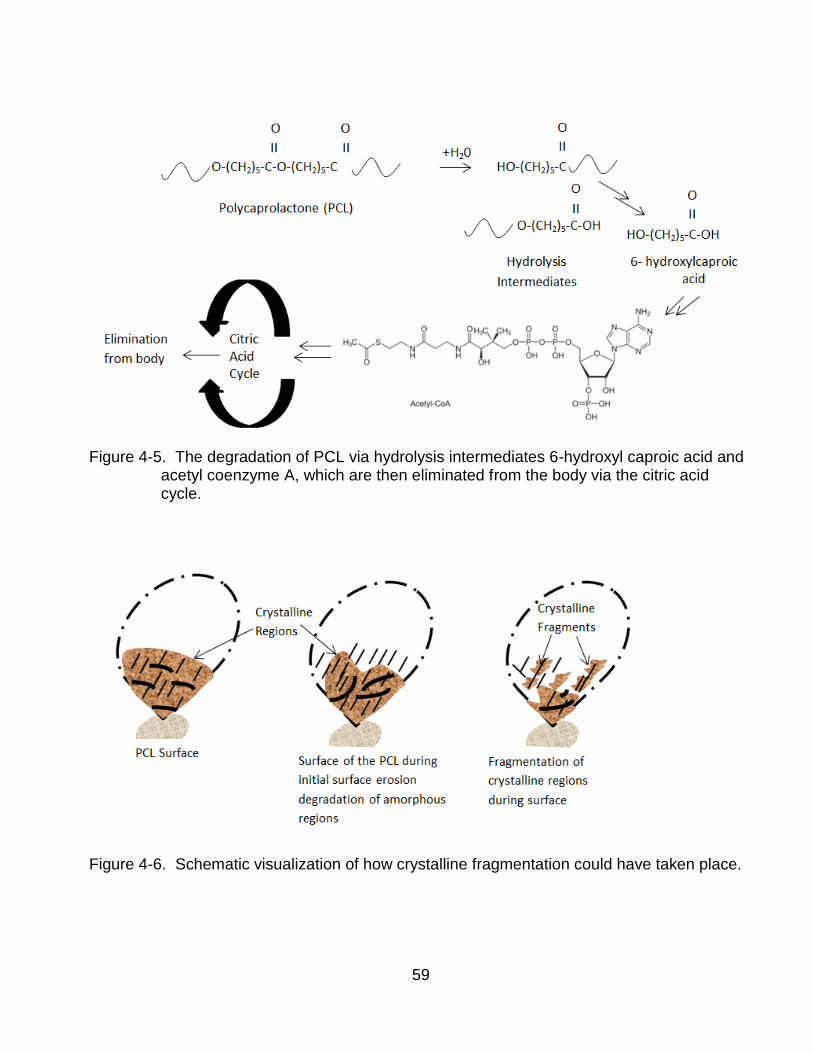
59
Figure 4-5. The degradation of PCL via hydrolysis intermediates 6-hydroxyl caproic acid and
acetyl coenzyme A, which are then eliminated from the body via the citric acid cycle.
Figure 4-6. Schematic visualization of how crystalline fragmentation could have taken place.
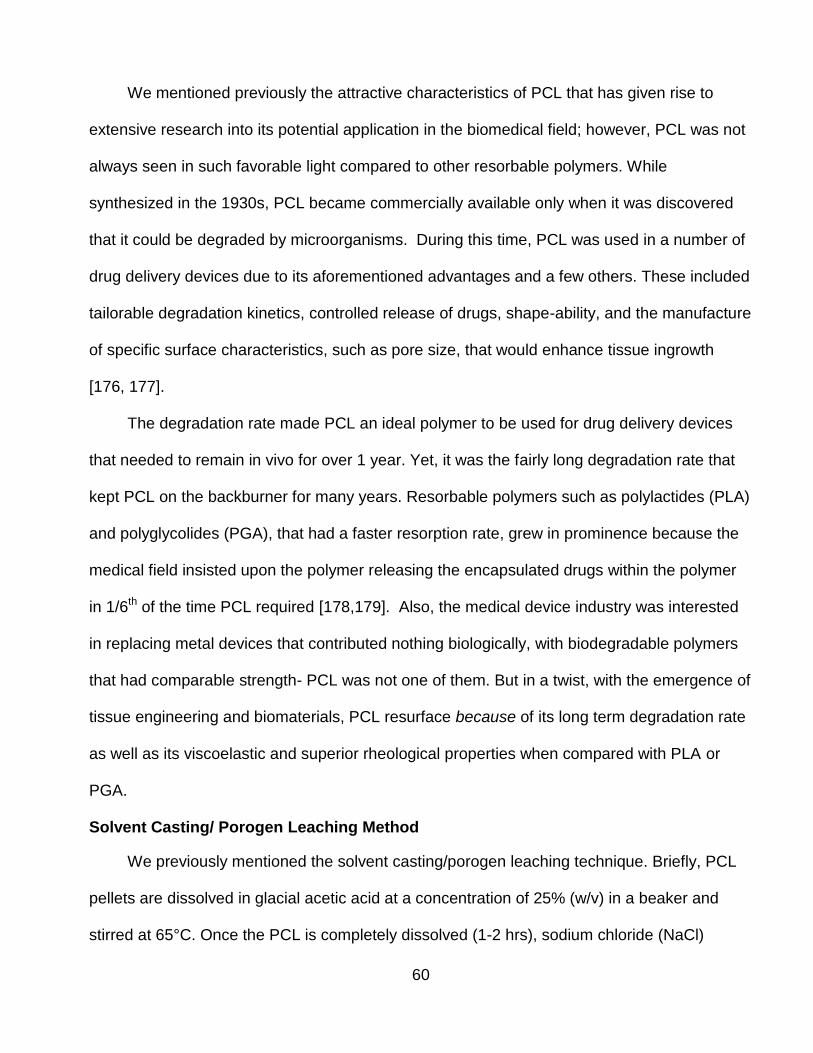
60
We mentioned previously the attractive characteristics of PCL that has given rise to
extensive research into its potential application in the biomedical field; however, PCL was not
always seen in such favorable light compared to other resorbable polymers. While
synthesized in the 1930s, PCL became commercially available only when it was discovered
that it could be degraded by microorganisms. During this time, PCL was used in a number of
drug delivery devices due to its aforementioned advantages and a few others. These included
tailorable degradation kinetics, controlled release of drugs, shape-ability, and the manufacture
of specific surface characteristics, such as pore size, that would enhance tissue ingrowth
[176, 177].
The degradation rate made PCL an ideal polymer to be used for drug delivery devices
that needed to remain in vivo for over 1 year. Yet, it was the fairly long degradation rate that
kept PCL on the backburner for many years. Resorbable polymers such as polylactides (PLA)
and polyglycolides (PGA), that had a faster resorption rate, grew in prominence because the
medical field insisted upon the polymer releasing the encapsulated drugs within the polymer
in 1/6th of the time PCL required [178,179]. Also, the medical device industry was interested
in replacing metal devices that contributed nothing biologically, with biodegradable polymers
that had comparable strength- PCL was not one of them. But in a twist, with the emergence of
tissue engineering and biomaterials, PCL resurface because of its long term degradation rate
as well as its viscoelastic and superior rheological properties when compared with PLA or
PGA.
Solvent Casting/ Porogen Leaching Method
We previously mentioned the solvent casting/porogen leaching technique. Briefly, PCL
pellets are dissolved in glacial acetic acid at a concentration of 25% (w/v) in a beaker and
stirred at 65°C. Once the PCL is completely dissolved (1-2 hrs), sodium chloride (NaCl)
61
particles at 90% w/w of PCL are added. The polymer solution is allowed to cool at room
temperature for 30 minutes. Once the temperature of the polymer solution reaches 37°C, the
polymer solution is cast into well culture microplates (Corning Life Sciences). This allows for
evaporation of the solvent, glacial acetic acid. After the evaporation of the solvent at 23°C
(RT) overnight, the resulting solidified scaffolds are placed in 50 mL conical tubes containing
15 mLs of distilled water, with a ratio of sample surface to DI volume of 0.5 cm2/mL. Residual
solvent, contaminants and more importantly, sodium chloride particles are removed in this
washing sequence. Thus, leaving behind a porous polymer structure. To further remove any
remaining solvent and/or distilled water, the scaffolds are freeze dried overnight [51].
62
CHAPTER 5 PRELIMINARY DATA, SCAFFOLD OPTIMIZATION AND SPECIFIC AIMS
Osteoinductivity and DBM Grade
Preliminary work was carried out to test: 1) the osteoinductive behavior of DBM on
human osteoblasts, 2) test and analyze the efficacy of the scaffold design, and to 3)
provide a framework for the work to be undertaken. Analytical assays of early and mid-
bone marker, alkaline phosphate (ALP), and osteopontin (OP) were employed to gauge
the influence of three grades of DBM on human osteoblasts (hOB). Based on industry
standard procedures, using histological techniques, DBM was graded according to the
amount of ectopic bone formation in nude mice. Following analysis of the explanted
DBM, the lot from which the implanted DBM originated was then given a (0,1) (2,1) or
(4,1) score. (4,1) being the DBM with the most ectopic bone formation in vivo and (0, 1)
being the least. (2, 1) DBM is usually reserved for commercial use. The grades are
known as their osteoinductive (OI) score.
50 mg of sterilized bovine demineralized bone matrix of grades (0,1) (2,1) and
(4,1) were placed in 24 well culture plates (Corning Costar Corp.). A day prior to cell
seeding, the DBM was supplemented with 2 mls of media (Dulbecco’s Minimum
Essential Medium (DMEM) (Invitrogen, Carlsbad, CA) supplemented with 10% fetal
bovine serum (FBS) (Mediatech, Herdon, VA) and 5.0% Antibiotic-Antimitotic
(Invitrogen)). This supplemented medium will be denoted as basal media. After 24
hours, basal media was aspirated out of the DBM and hOB (CRL-11372, ATCC, VA,
USA) cells at a density of 4 x 10⁵ cells/well at passage 4 was added to each well, along
with 2 mls of fresh basal media. Basal media was devoid of known osteogenic inductors
such β- glycerosphosphate and ascorbic acid 2 phosphate to assess the osteoinductive

63
behavior of the various DBM grades only. The well plates were placed in an incubator
under standard conditions of 37ºC and 5% CO2. Fresh basal media was replaced every
3 days for the 17 day study.
The metabolic activity of the cells was assessed initially every 4 hours for a period
of 24 hours using an Alamar Blue™ dye (BioSource International, Camarillo, CA). This
was a routine analysis to observe the viability and proliferation of cells, hence no data is
reported. Following the manufacture’s protocol as prescribed in Sigma (#104) ALP
biochemical assay, samples were pipetted in triplicate in 200 μL quantities into a 96-well
plate. The absorbance was measured, as directed in the manufacture protocol, at 405
nm using a Microplate reader (Molecular Devices). The ALP activity of the hOB is show
in Figure 5-1. Data comparing the scaffolds was examined using two- way analysis of
variance (ANOVA) with statistical significance at p<0.05 (n=3).
Results
The ALP activity expressed in each of the three grades of DBM was statistically the
same. It was interesting to note that (2,1) DBM had a higher OD (optical density) reading
than (4,1) DBM. As a matter of fact, (4,1) DBM had a lower OD reading than (0,1) DBM,
though not a statistically significant difference. Yet, this is a significant finding because,
as previously mentioned, a DBM grade of (4,1) conveys a better than average level of
ectopic bone formation in vivo. A (0, 1) DBM grade represents a less than average level
of ectopic bone formation in vivo. Therefore, based on these results, the OI score does
not seem to be a forecaster of ALP activity in vitro.
Osteopontin (OPN) expression was analyzed using an enzyme linked
immunosorbent assay (ELISA) kit specific for human osteoblasts (R&D Systems
Minneapolis, MN). Aliquots of media from appropriate samples were added to the
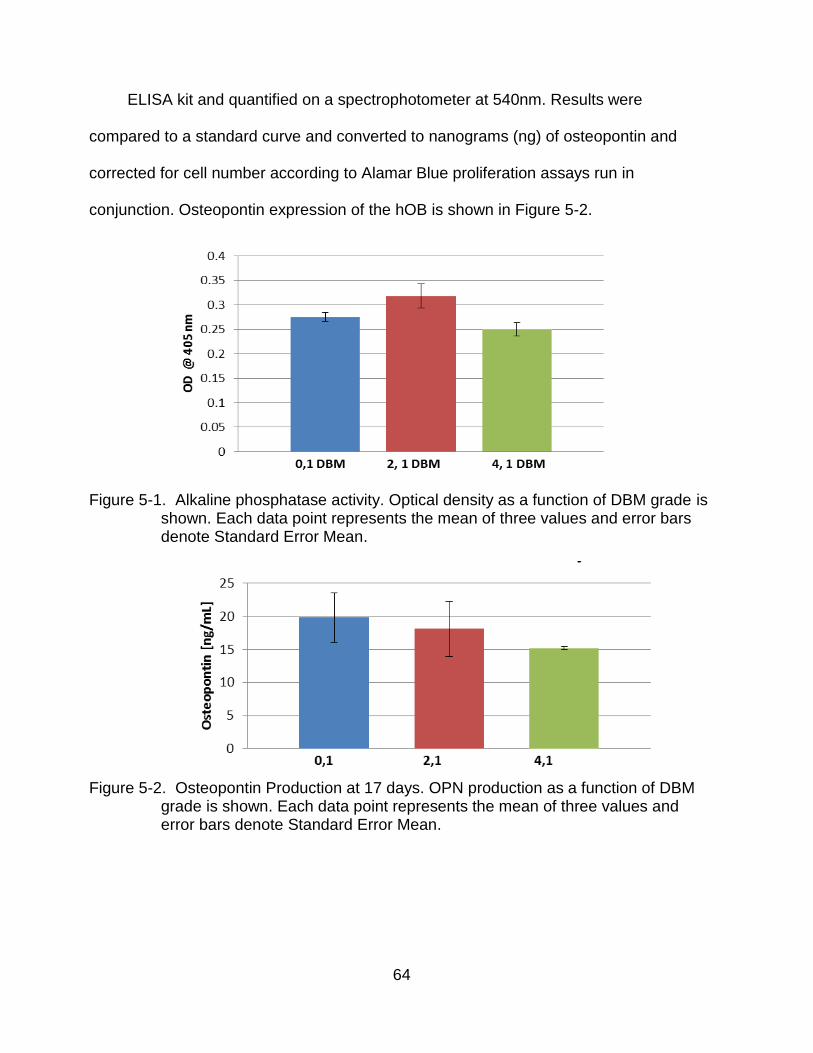
64
ELISA kit and quantified on a spectrophotometer at 540nm. Results were
compared to a standard curve and converted to nanograms (ng) of osteopontin and
corrected for cell number according to Alamar Blue proliferation assays run in
conjunction. Osteopontin expression of the hOB is shown in Figure 5-2.
Figure 5-1. Alkaline phosphatase activity. Optical density as a function of DBM grade is shown. Each data point represents the mean of three values and error bars denote Standard Error Mean.
Figure 5-2. Osteopontin Production at 17 days. OPN production as a function of DBM
grade is shown. Each data point represents the mean of three values and error bars denote Standard Error Mean.

65
However, similarly to ALP production, there was not a correlation between OI and
OPN production. Cells seeded on (0, 1) DBM expressed the highest levels of OPN, while
4,1 DBM had the lowest –although, based on the two way ANOVA analysis, the
difference between the two was not statistically significant. There was a large variability in
OPN production within the grades (0,1) and (2,1) but not (4,1). While variability was
expected between the grades, it was not expected within the grades.
As previously mentioned, the OI score of a batch of DBM is given by assigning a
grade to the explanted tissue of a nude mouse model using histological techniques.
Calcium contents of explants, as indicators of new bone formation, are used in this
assessment. This in vivo experiment can take more than 8 weeks, after which the mice
are sacrificed. It is probable that the short duration of the in vitro experiments (>3 weeks)
could have a neutralizing effect on the grades of DBM. Meaning that, 50 mg of (0, 1)
DBM is osteoinductively equal to 50 mg of (4, 1) DBM- at least for ALP production and
OPN expression in vitro. If a (4, 1) DBM grade indicates a better than average level of
ectopic bone formation in vivo, it could be assumed that it has a higher concentration of
BMPs with bone forming potential. Yet, based on these results, the potency (bone
forming potential) of the BMPs within each DBM grade may not have as great an effect
on the cells in vitro as it does in vivo.
Scaffold Preparation and Optimization
In addition to analyzing the effects of DBM grade on bone markers, we also wanted
to test the efficacy of our scaffold. The method chosen for the construction of the
scaffolds was the solvent casting/salt leaching technique utilizing polycaprolactone
(PCL). Sieved sodium chloride (<100 um) particles were selected as the porogen. PCL
(molecular weight 80 kDa) and the solvent, glacial acetic acid, were both purchased from
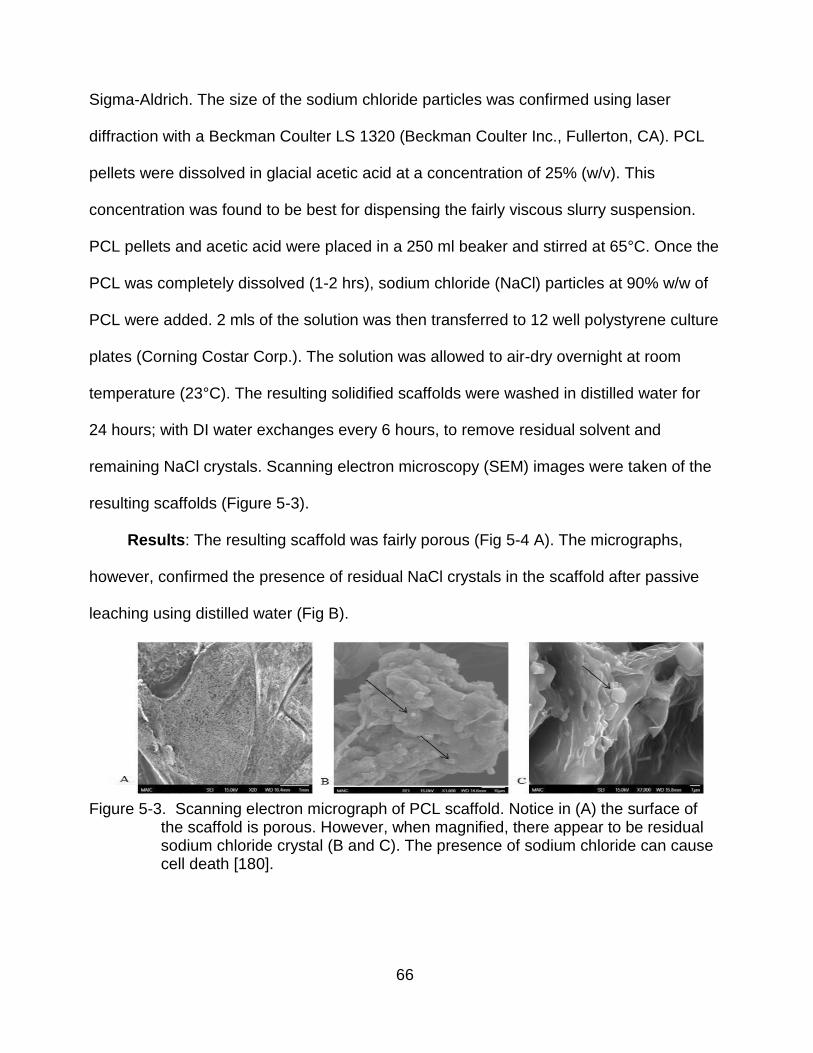
66
Sigma-Aldrich. The size of the sodium chloride particles was confirmed using laser
diffraction with a Beckman Coulter LS 1320 (Beckman Coulter Inc., Fullerton, CA). PCL
pellets were dissolved in glacial acetic acid at a concentration of 25% (w/v). This
concentration was found to be best for dispensing the fairly viscous slurry suspension.
PCL pellets and acetic acid were placed in a 250 ml beaker and stirred at 65°C. Once the
PCL was completely dissolved (1-2 hrs), sodium chloride (NaCl) particles at 90% w/w of
PCL were added. 2 mls of the solution was then transferred to 12 well polystyrene culture
plates (Corning Costar Corp.). The solution was allowed to air-dry overnight at room
temperature (23°C). The resulting solidified scaffolds were washed in distilled water for
24 hours; with DI water exchanges every 6 hours, to remove residual solvent and
remaining NaCl crystals. Scanning electron microscopy (SEM) images were taken of the
resulting scaffolds (Figure 5-3).
Results: The resulting scaffold was fairly porous (Fig 5-4 A). The micrographs,
however, confirmed the presence of residual NaCl crystals in the scaffold after passive
leaching using distilled water (Fig B).
Figure 5-3. Scanning electron micrograph of PCL scaffold. Notice in (A) the surface of
the scaffold is porous. However, when magnified, there appear to be residual sodium chloride crystal (B and C). The presence of sodium chloride can cause cell death [180].
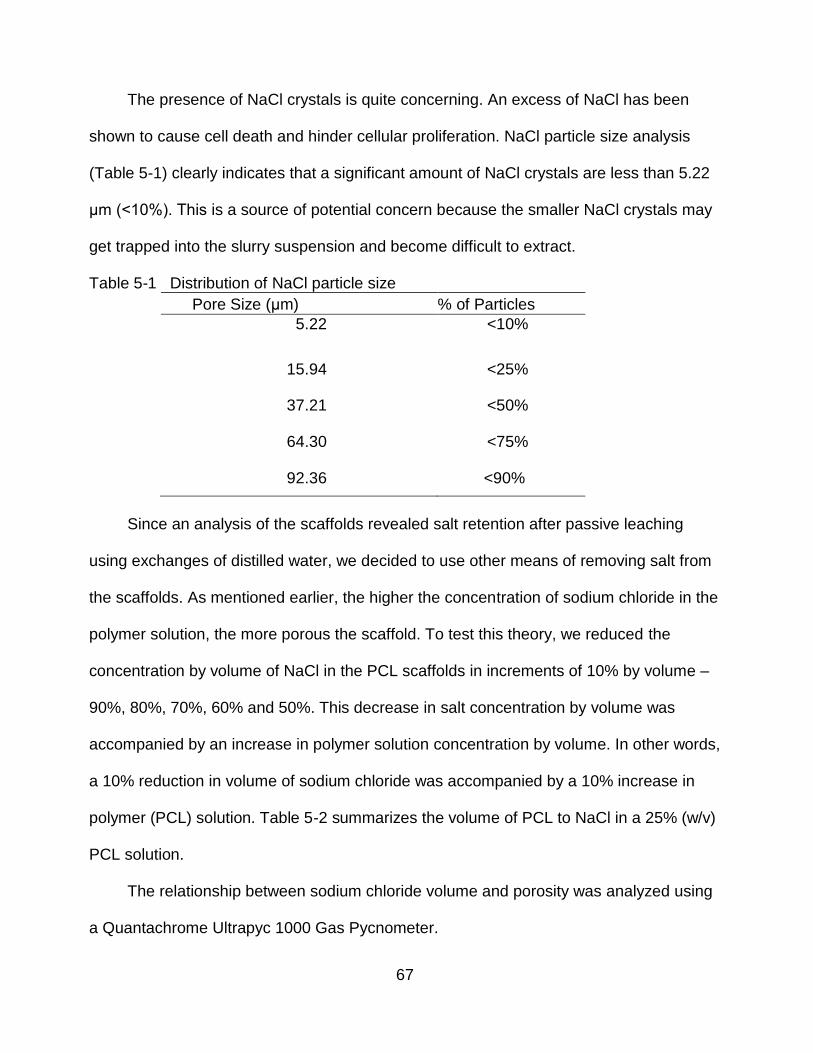
67
The presence of NaCl crystals is quite concerning. An excess of NaCl has been
shown to cause cell death and hinder cellular proliferation. NaCl particle size analysis
(Table 5-1) clearly indicates that a significant amount of NaCl crystals are less than 5.22
μm (<10%). This is a source of potential concern because the smaller NaCl crystals may
get trapped into the slurry suspension and become difficult to extract.
Table 5-1 Distribution of NaCl particle size
Pore Size (μm) % of Particles
5.22 <10%
15.94 <25%
37.21 <50%
64.30 <75%
92.36 <90%
Since an analysis of the scaffolds revealed salt retention after passive leaching
using exchanges of distilled water, we decided to use other means of removing salt from
the scaffolds. As mentioned earlier, the higher the concentration of sodium chloride in the
polymer solution, the more porous the scaffold. To test this theory, we reduced the
concentration by volume of NaCl in the PCL scaffolds in increments of 10% by volume –
90%, 80%, 70%, 60% and 50%. This decrease in salt concentration by volume was
accompanied by an increase in polymer solution concentration by volume. In other words,
a 10% reduction in volume of sodium chloride was accompanied by a 10% increase in
polymer (PCL) solution. Table 5-2 summarizes the volume of PCL to NaCl in a 25% (w/v)
PCL solution.
The relationship between sodium chloride volume and porosity was analyzed using
a Quantachrome Ultrapyc 1000 Gas Pycnometer.
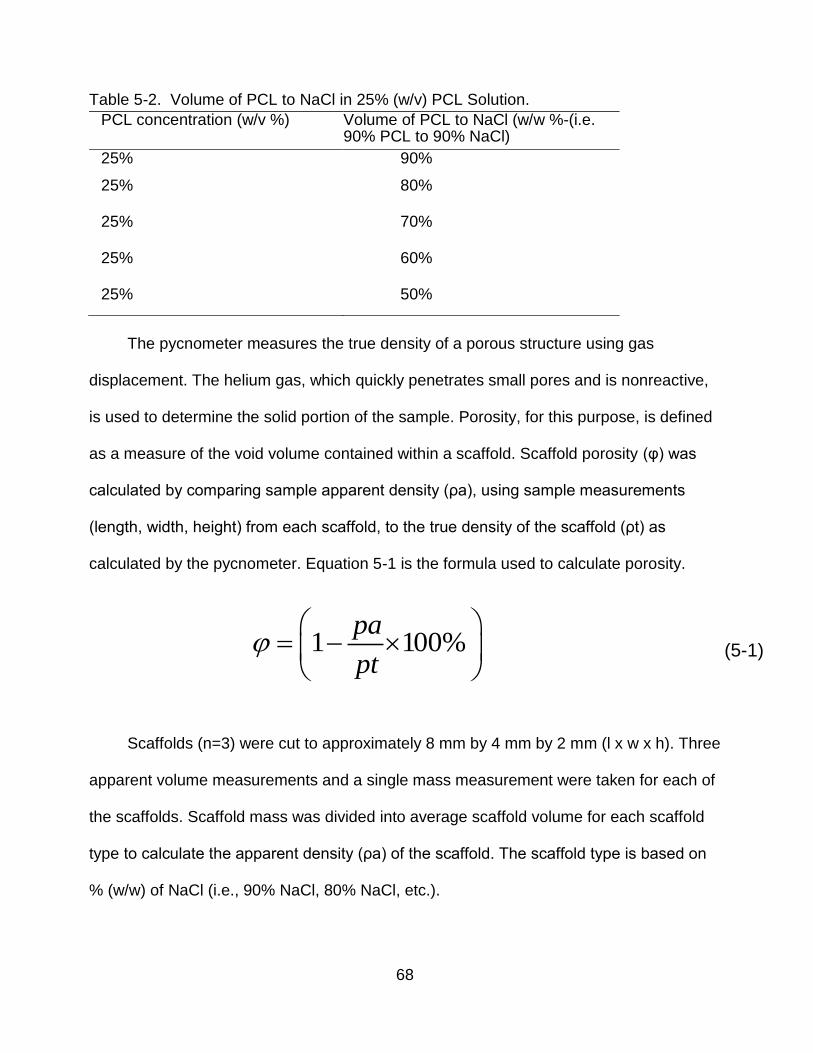
68
Table 5-2. Volume of PCL to NaCl in 25% (w/v) PCL Solution.
PCL concentration (w/v %) Volume of PCL to NaCl (w/w %-(i.e. 90% PCL to 90% NaCl)
25% 90%
25% 80%
25% 70%
25% 60%
25% 50%
The pycnometer measures the true density of a porous structure using gas
displacement. The helium gas, which quickly penetrates small pores and is nonreactive,
is used to determine the solid portion of the sample. Porosity, for this purpose, is defined
as a measure of the void volume contained within a scaffold. Scaffold porosity (φ) was
calculated by comparing sample apparent density (ρa), using sample measurements
(length, width, height) from each scaffold, to the true density of the scaffold (ρt) as
calculated by the pycnometer. Equation 5-1 is the formula used to calculate porosity.
Scaffolds (n=3) were cut to approximately 8 mm by 4 mm by 2 mm (l x w x h). Three
apparent volume measurements and a single mass measurement were taken for each of
the scaffolds. Scaffold mass was divided into average scaffold volume for each scaffold
type to calculate the apparent density (ρa) of the scaffold. The scaffold type is based on
% (w/w) of NaCl (i.e., 90% NaCl, 80% NaCl, etc.).
1 1 00%
pa
pt
(5-1)
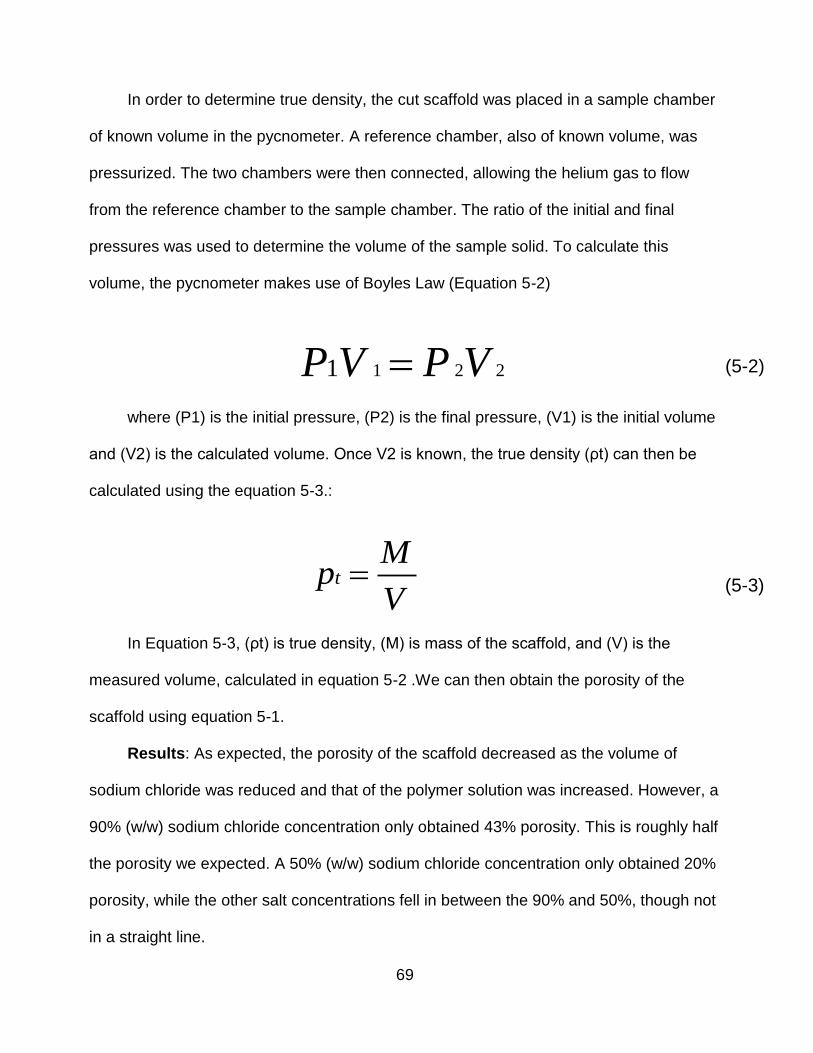
69
In order to determine true density, the cut scaffold was placed in a sample chamber
of known volume in the pycnometer. A reference chamber, also of known volume, was
pressurized. The two chambers were then connected, allowing the helium gas to flow
from the reference chamber to the sample chamber. The ratio of the initial and final
pressures was used to determine the volume of the sample solid. To calculate this
volume, the pycnometer makes use of Boyles Law (Equation 5-2)
where (P1) is the initial pressure, (P2) is the final pressure, (V1) is the initial volume
and (V2) is the calculated volume. Once V2 is known, the true density (ρt) can then be
calculated using the equation 5-3.:
In Equation 5-3, (ρt) is true density, (M) is mass of the scaffold, and (V) is the
measured volume, calculated in equation 5-2 .We can then obtain the porosity of the
scaffold using equation 5-1.
Results: As expected, the porosity of the scaffold decreased as the volume of
sodium chloride was reduced and that of the polymer solution was increased. However, a
90% (w/w) sodium chloride concentration only obtained 43% porosity. This is roughly half
the porosity we expected. A 50% (w/w) sodium chloride concentration only obtained 20%
porosity, while the other salt concentrations fell in between the 90% and 50%, though not
in a straight line.
1 2 21 P V P V
(5-2)
tM
pV
(5-3)

70
Figure 5-4. Porosity of PCL scaffolds as a function of NaCl content. Shown in the figure are the theoretical (expected) and actual porosities of the scaffold as a function of NaCl. Notice that the actual porosity fell far below what we expected.
Based on these results, we hypothesize that the sodium chloride was entrapped
within the scaffold. Thus, as a consequence, these trapped particles do not create a pore
that would allow for the penetration of water during the leaching process and therefore
would not remove the remaining NaCl crystals. Moreover, this reduces the overall
porosity of the scaffold. Equally as important, this creates a high sodium chloride
environment for the cells. This would validate the residual NaCl crystals we observed in
the scanning electron micrographs. In an attempt to increase the porosity and remove
residual sodium chloride from the scaffolds, we modified the washing temperature and
the leaching process. Sonication was included in the leaching process.

71
Washing Temperature Modification
Temperature modification of the washing process was conducted in attempt to
reduce salt retention. While the air drying process removes the solvent, the washing
process removes the residual salt content. Since the standard washing temperature at
23°C (Room Temperature) produced a scaffold with a high salt concentration, we
decided to wash the scaffolds at temperatures of 37°C, 45 °C, and 55°C. Three scaffolds
of 90% NaCl (w/w) were each placed in a 37°C, 45 °C, and 55°C in a 50 ml conical tube
containing 25 mls of DI water.
The scaffolds were incubated overnight using gentle rotation at 6 rpm in a
Hybridization Incubator (Robbins Scientific, Model 400).After the washing period, the
scaffolds were removed and NaCl content was analyzed using SEM with elemental
Energy-dispersive X-ray spectroscopy (EDS). After being cut to approximately 8 mm by 4
mm by 2 mm ( l x w x h) (n=3), the porosity of the scaffold was analyzed using the gas
pycnometer. The pycnometer measurements were taken three times for complete
accuracy. While the pycnometer gave both density and volume measurements, only
volume measurements were recorded.
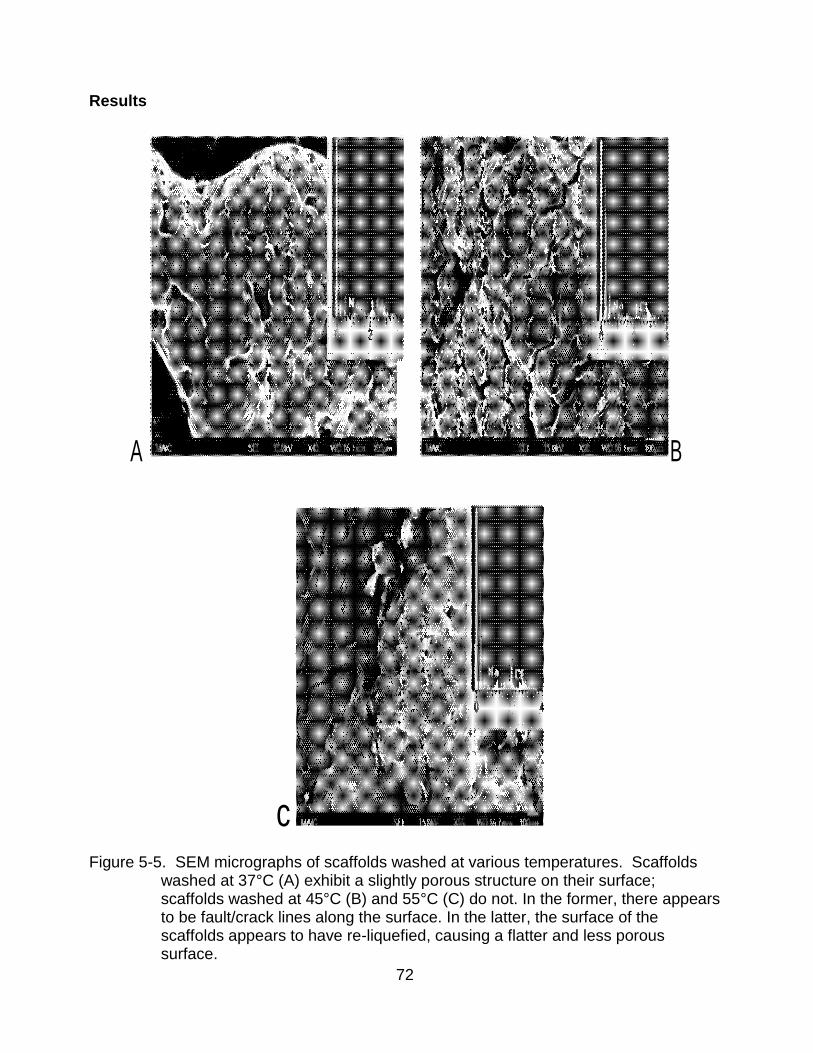
72
Results
A B
c Figure 5-5. SEM micrographs of scaffolds washed at various temperatures. Scaffolds
washed at 37°C (A) exhibit a slightly porous structure on their surface; scaffolds washed at 45°C (B) and 55°C (C) do not. In the former, there appears to be fault/crack lines along the surface. In the latter, the surface of the scaffolds appears to have re-liquefied, causing a flatter and less porous surface.
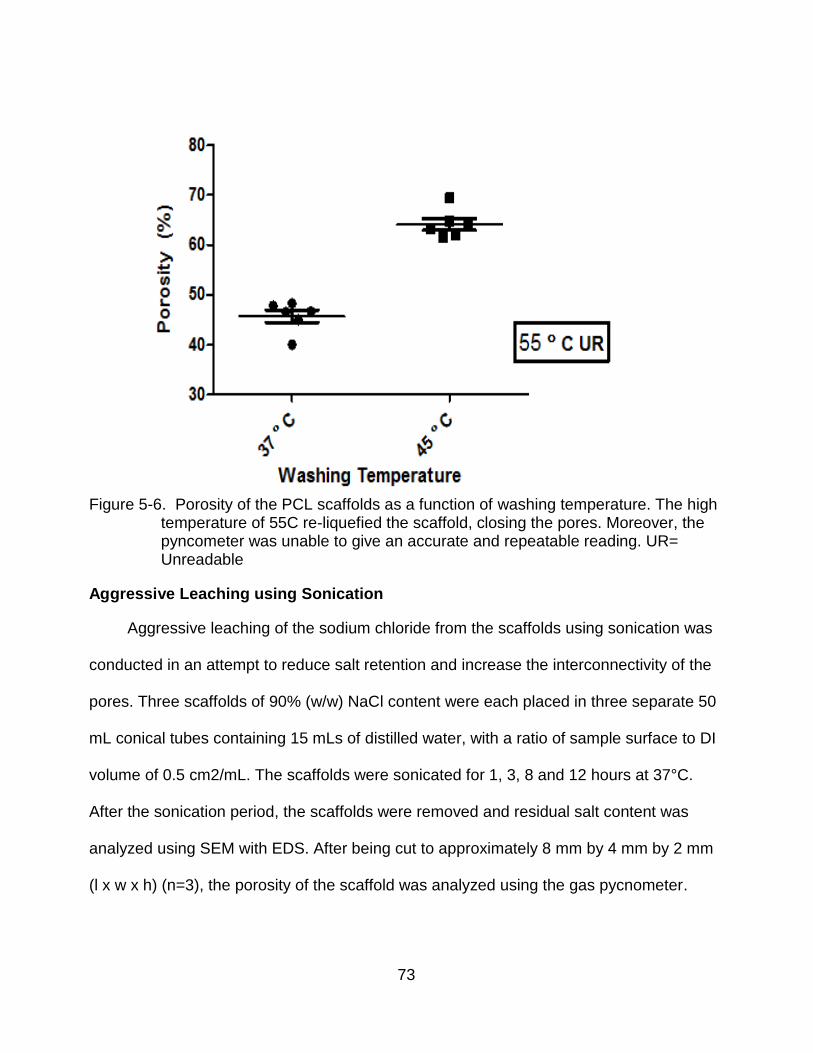
73
Figure 5-6. Porosity of the PCL scaffolds as a function of washing temperature. The high
temperature of 55C re-liquefied the scaffold, closing the pores. Moreover, the pyncometer was unable to give an accurate and repeatable reading. UR= Unreadable
Aggressive Leaching using Sonication
Aggressive leaching of the sodium chloride from the scaffolds using sonication was
conducted in an attempt to reduce salt retention and increase the interconnectivity of the
pores. Three scaffolds of 90% (w/w) NaCl content were each placed in three separate 50
mL conical tubes containing 15 mLs of distilled water, with a ratio of sample surface to DI
volume of 0.5 cm2/mL. The scaffolds were sonicated for 1, 3, 8 and 12 hours at 37°C.
After the sonication period, the scaffolds were removed and residual salt content was
analyzed using SEM with EDS. After being cut to approximately 8 mm by 4 mm by 2 mm
(l x w x h) (n=3), the porosity of the scaffold was analyzed using the gas pycnometer.

74
Results
An analysis by SEM with EDS revealed reduced salt retention in all samples when
compared with scaffolds washed at 23°C. In particular, no salt particles were observed on
the surface of the scaffold. Also, the sonicated scaffolds exhibited an interconnectivity not
previously encountered.
Figure 5-7. SEM micrographs of scaffolds leached at various sonication times. Scaffolds sonicated for 1 hour (A) exhibit a porous structure on its surface. These pores were circular in nature and appeared to be widespread across the surface of the scaffold. Scaffolds sonicated for 3 hours (B) revealed a highly porous structure. The pore sizes of the scaffold ranged from 10 μm to 100μms. There was also an increased level of interconnectivity between the pores. Scaffolds sonicated for 8 hours (C) displayed a porous structure, but one that lacked depth. Perhaps the increasing sonication time and the consequent slight increase in temperature caused the surface to re-liquefy and close in on the pores.
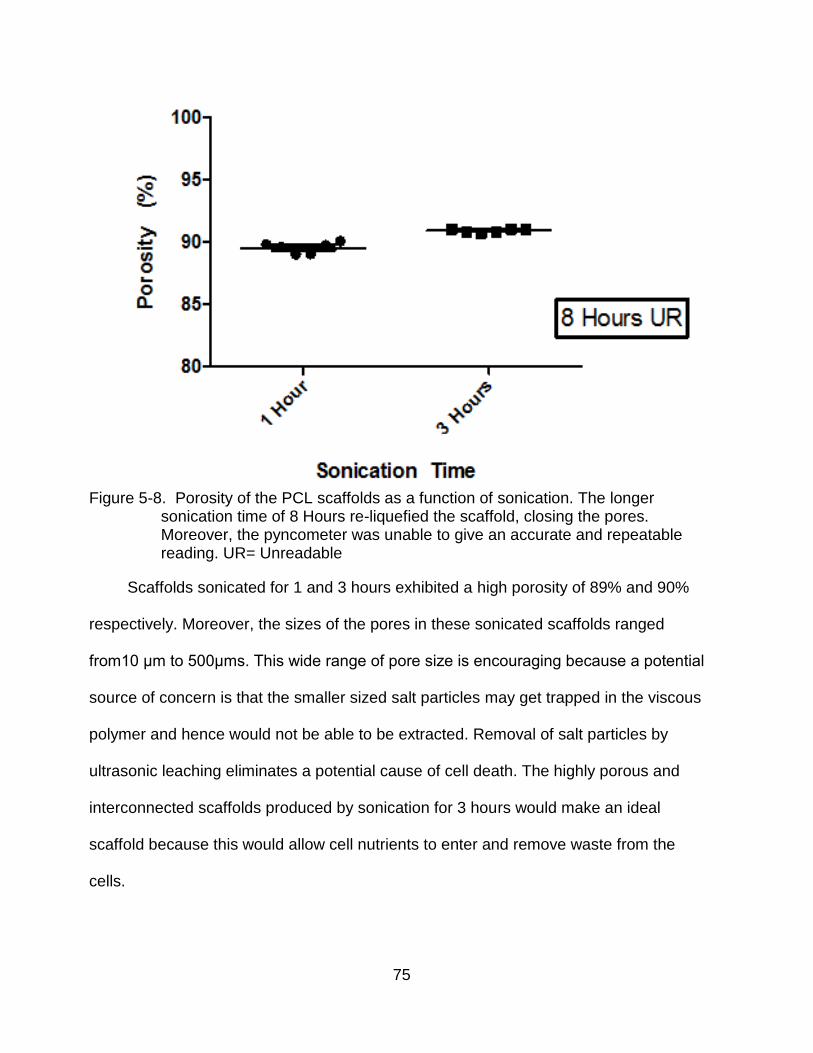
75
Figure 5-8. Porosity of the PCL scaffolds as a function of sonication. The longer
sonication time of 8 Hours re-liquefied the scaffold, closing the pores. Moreover, the pyncometer was unable to give an accurate and repeatable reading. UR= Unreadable
Scaffolds sonicated for 1 and 3 hours exhibited a high porosity of 89% and 90%
respectively. Moreover, the sizes of the pores in these sonicated scaffolds ranged
from10 μm to 500μms. This wide range of pore size is encouraging because a potential
source of concern is that the smaller sized salt particles may get trapped in the viscous
polymer and hence would not be able to be extracted. Removal of salt particles by
ultrasonic leaching eliminates a potential cause of cell death. The highly porous and
interconnected scaffolds produced by sonication for 3 hours would make an ideal
scaffold because this would allow cell nutrients to enter and remove waste from the
cells.

76
Sonication for 8 hours caused the scaffolds to re-liquefy and become quite gummy.
The pores produced by the scaffolds sonicated for 8 hours lacked the depth seen in the
scaffolds sonicated for 1 and 3 hours. Similar to the scaffolds washed at 55°C, we were
unable to obtain the porosity of the scaffold sonicated for 8 hours. Compared to the
scaffolds sonicated for 1 and 3 hours, the scaffolds sonicated for 8 hours exhibited higher
peaks on the EDS spectrum for both sodium and chlorine. We believe that the longer
sonication time increased the temperature of the water bath, which in turn increased the
temperature of the distilled water the scaffolds were immersed in. Furthermore, this
increase in temperature re-liquefied the scaffold causing the pores to close. The water
bath temperature was measured with a non-mercury thermometer and verified with the
digital temperature display of the water bath.
Discussion
Visually, SEM micrographs confirmed the absence of sodium chloride particles
within scaffolds sonicated for 1 and 3 hours and those washed at 37°C and 45°C. The
EDS spectra confirmed the absence or reduction of sodium chloride particles. The
confirmation by EDS is perhaps more important than the SEM micrographs. EDS is a
technique that is used for identifying the elemental composition of a particular area of
interest on the scaffold. In the EDS analysis, the scaffold was bombarded with an
electron beam inside the SEM microscope. These electrons collide with the scaffold
atoms’ own electrons, thereby knocking some of them off in the process. A higher energy
electron occupies the position ejected by the inner shell electron. However, in order to
execute this, the higher energy electron must give up some of its energy by emitting an
X-ray. The amount of energy present in the X-rays is then used to identify the atom from
which the X-ray was emitted. This is then translated into an EDS spectrum composed of

77
peaks, which plots how frequently an X ray is received for each energy level. Each peak
corresponds to a unique atom and, hence, to a single element. The more concentrated
an element is in a scaffold, the higher its peak will be in the spectrum. Based on these
results, the 90% w/w NaCl scaffolds sonicated for 3 hours at 37°C present the ideal
characteristics sought in an ideal scaffold- high porosity and interconnectivity between the
pores.
78
CHAPTER 6 COMPOSITE SCAFFOLDS: SYNTHESIS, DEGRADATION AND CALCIUM PHOSPHATE
DEPOSITION
Introductory Remarks
We previously developed a three-dimensional interconnected porous PCL scaffold. The
pore size of the scaffold ranged from 10 μm to 500 μms. Studies have shown osteoblasts to
thrive and proliferate at a pore size range of 380–405 μm. Using scanning electron microscopy
(SEM) with energy dispersive spectroscopy (EDS), we confirmed the removal of the porogen,
sodium chloride. The removal of sodium chloride eliminates a potential cause for cell death.
Our overarching goal in this project is to develop a composite scaffold of
polycaprolactone polymer and demineralized bone matrix particles. We hypothesize that the
design of this biodegradable polymeric scaffold that incorporates DBM particles will enhance
the efficacy of an otherwise purely polymeric scaffold. By enhance, we mean that the
incorporated DBM will add nucleation sites for the deposition of calcium phosphate and
provide signals for the differentiation of pluripotent cells.
Specifically, the goal of this study was to examine both the degradation characteristics
and the deposition of calcium phosphate on the composite scaffold. We assessed the
degradation characteristics using the scaffolds’ mass change and changes in pH value of the
degradation solution. To evaluate whether DBM increases the deposition of calcium phosphate
on the surface of the scaffold, we compared a pure polycaprolactone scaffold to a composite
scaffold of 25 % DBM (w/w), 35 % DBM (w/w), and 50 % DBM (w/w). Henceforth, these
scaffolds will be denoted as low, mid, and high composite scaffold respectively. These
scaffolds were assessed using the following parameters: calcium ion release into the
degradation solution, qualitative assessment of calcium phosphate deposition through SEM
w/EDS, and a Von Kossa staining.
79
Materials and Methods
Scaffold Preparation
PCL (molecular weight 80 kDa) and the solvent, glacial acetic acid, were sourced
commercially (Sigma-Aldrich). Sieved sodium chloride particles (<100 μm) were selected as
the porogen. Demineralized Bone Matrix (mean size 687 μm) was generously donated by
Regeneration Technologies (RTIX, Alachua, FL).The sizes of the DBM and sodium chloride
particles were confirmed using laser diffraction with a Beckman Coulter LS 1320 (Beckman
Coulter Inc., Fullerton, CA). PCL/DBM composite scaffolds were formed by using a solvent
casting/porogen leaching technique. Initially, PCL pellets were dissolved in glacial acetic acid
at a concentration of 25% (w/v) in a beaker and stirred at 65°C.
Once the PCL was completely dissolved (1-2 hrs), sodium chloride (NaCl) particles at
90% w/w of PCL were added. The polymer solution was allowed to cool at room temperature
for 30 minutes. Once the temperature of the polymer solution reached 37 °C, the polymer
solution was cast into well culture microplates (Corning CoStar Corp.). Demineralized bone
matrix was then added to the resulting scaffolds. Since the proteins within DBM are
deactivated at high temperatures (65 °C and higher), it is important to allow the polymer
suspension to cool [181].
Four types of scaffolds were formed: pure polymeric scaffolds, PCL/DBM scaffolds that
contained approximately 25% DBM (w/w), PCL/DBM scaffolds that contained approximately
35% DBM (w/w), and PCL/DBM scaffolds that contained approximately 50% DBM (w/w). After
the evaporation of the solvent at 23°C (RT) overnight, the resulting solidified scaffolds were
placed in 50 mL conical tubes containing 15 mLs of distilled water, with a ratio of sample
surface to DI volume of 0.5 cm2/mL. The scaffolds were sonicated for 3 hours at 37°C. After,
they were freeze dried overnight. The overall process is shown in Fig 6-2.

80
Figure 6-1. SEM Micrographs of Demineralized Bone Matrix. Figure (A) illustrates the irregular
shape of the particles, which contributes to the residual mineral (<5% calcium and phosphorous) left in the particle. The mean size of the particles was 687 μm. Figure B illustrates the surface of each DBM particle.
Figure 6-2. Schematic of solvent casting/ salt leaching technique. The porogen is added to a 25% PCL solution. Once the temperature of the polymer solution cools to 37°C, the polymer solution is cast and the polymer solution begins to solidify. Before the solution solidifies, and while it is a slurry-like paste, DBM particles are added. DBM is added at this time for two reasons: first, the proteins in DBM are denatured at temperatures above 65 C and second, adding the particles while the solution is still a slurry like paste, allows for uniform distribution of DBM particles throughout the scaffold. Scaffolds are then freeze dried to remove residual solvent.
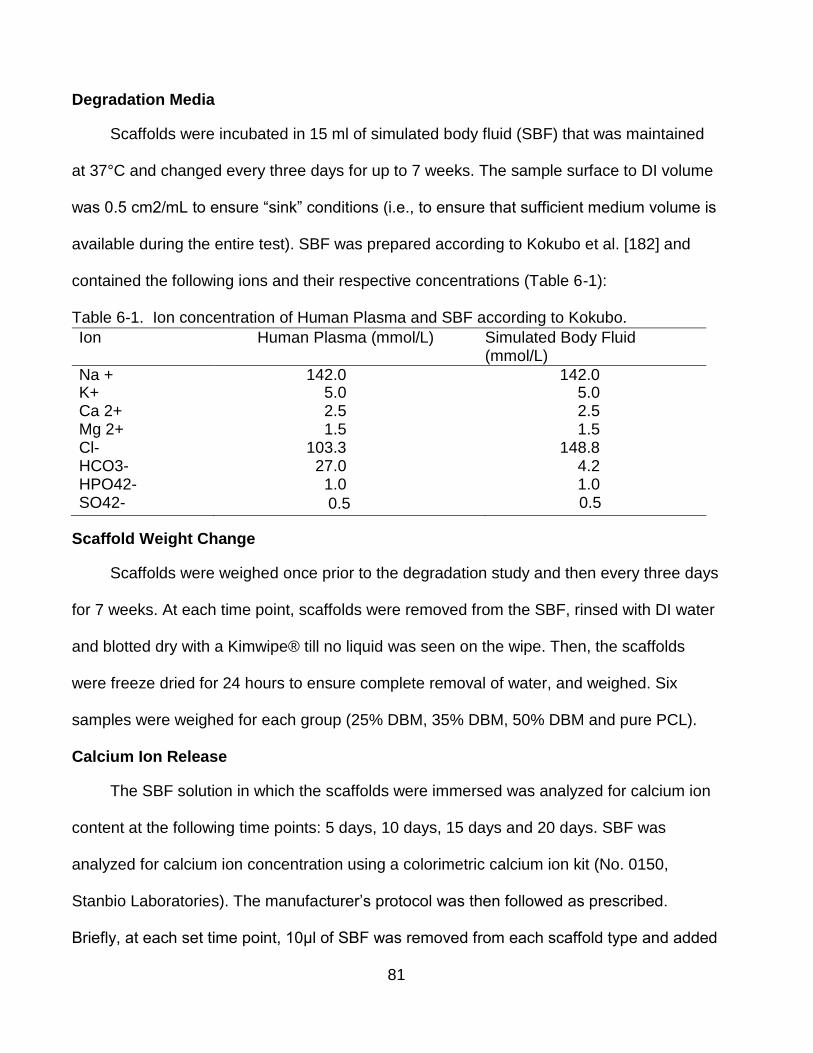
81
Degradation Media
Scaffolds were incubated in 15 ml of simulated body fluid (SBF) that was maintained
at 37°C and changed every three days for up to 7 weeks. The sample surface to DI volume
was 0.5 cm2/mL to ensure “sink” conditions (i.e., to ensure that sufficient medium volume is
available during the entire test). SBF was prepared according to Kokubo et al. [182] and
contained the following ions and their respective concentrations (Table 6-1):
Table 6-1. Ion concentration of Human Plasma and SBF according to Kokubo.
Ion Human Plasma (mmol/L) Simulated Body Fluid (mmol/L)
Na + 142.0 142.0 K+ 5.0 5.0 Ca 2+ 2.5 2.5 Mg 2+ 1.5 1.5 Cl- 103.3 148.8 HCO3- 27.0 4.2 HPO42- 1.0 1.0
SO42- 0.5 0.5
Scaffold Weight Change
Scaffolds were weighed once prior to the degradation study and then every three days
for 7 weeks. At each time point, scaffolds were removed from the SBF, rinsed with DI water
and blotted dry with a Kimwipe® till no liquid was seen on the wipe. Then, the scaffolds
were freeze dried for 24 hours to ensure complete removal of water, and weighed. Six
samples were weighed for each group (25% DBM, 35% DBM, 50% DBM and pure PCL).
Calcium Ion Release
The SBF solution in which the scaffolds were immersed was analyzed for calcium ion
content at the following time points: 5 days, 10 days, 15 days and 20 days. SBF was
analyzed for calcium ion concentration using a colorimetric calcium ion kit (No. 0150,
Stanbio Laboratories). The manufacturer’s protocol was then followed as prescribed.
Briefly, at each set time point, 10μl of SBF was removed from each scaffold type and added
82
to 1 ml of reagent (0.5 ml Color reagent and 0.5 ml Base reagent). Six samples of each type
of scaffold were analyzed for calcium ion concentration. The SBF was then analyzed for
optical density using a spectrophotometer (Shimadzu, Japan) at a wavelength of 550 nm.
Per manufacturer, optical density was normalized to a known calcium ion concentration and
reported as mg/dl. SBF, not exposed to scaffold, was used as the control.
Von Kossa Staining
Von Kossa staining was used to detect mineral deposition on the scaffold. Briefly, the
scaffolds were washed three times with Phosphate Buffered Saline (PBS), fixed in 3.7%
formaldehyde in PBS for 10 minutes, washed again in distilled (DI) water three times,
incubated in .5% silver nitrate solution (Sigma-Aldrich) for 1 hour. Upon removal, the
scaffolds were washed in DI water three times, incubated in 0.3% sodium thiosulfate
pentahydrate (Sigma-Aldrich) solution for 3 minutes and, finally, air-dried. The stained
scaffolds were then observed under light microscopy.
Phosphorous Ion Release
The SBF solution in which the scaffolds were immersed was analyzed for
phosphorous ion content at the following time points: 5 days, 10 days, 15 days and 20 days.
SBF was analyzed for phosphorous ion concentration using a colorimetric phosphorous ion
kit (No. 0830, Stanbio Laboratories). The reaction to determine phosphorous content is
based on the reaction of the phosphate ion with a molybdate compound. This reaction
results in a reduced colorless hexavalent molybdenum phosphate complex. Per
manufacturer’s procedure, the technique employed in this kit measures the absorbance of
the unreduced complex at 340 nm. The manufacturer’s procedure was followed as
prescribed. Briefly, at each set time point, 10μl of SBF was removed from each scaffold
type and added to 1 ml of reagent. Six samples of each type of scaffold were analyzed for
83
phosphorous ion concentration. The SBF was then analyzed for optical density using a
spectrophotometer (Shimadzu, Japan) at a wavelength of 340 nm. Per manufacturer,
optical density was normalized to a known phosphorous ion concentration and reported as
mg/dl. SBF, not exposed to scaffold, was used as the control.
pH of Simulated Body Fluid
The pH of the SBF in which the liquids were immersed were analyzed at the following
time points: 1 hour, 4 hours, 24 hours, 5 days, 15 days, 25 days, 35 days and 45 days. The
SBF was analyzed using both pH test strips and a pH meter (Corning, LS 430). Again, six
samples from each scaffold type were analyzed.
Scanning Electron Microscopy with Energy Dispersive Spectroscopy
Calcium phosphate precipitation was qualitatively evaluated at 14 days post
immersion using scanning electron micrographs (JEOL JSM-6335F) at an acceleration
voltage of 15kV. The samples were coated with gold prior to analysis.
Statistics
Six samples were analyzed for each scaffold type at the various time points for mass
change, calcium ion release, phosphorous ion release and pH change. Three samples from
each scaffold type were analyzed for Von Kossa staining. All statistical analysis was
conducted using the GraphPad Instat program. The data within each scaffold type was
examined between time points and analyzed using a one-way analysis of variance
(ANOVA) with statistical significance at p<0.05. Further, data comparing the scaffolds was
examined using two- way analysis of variance (ANOVA) with statistical significance at
p<0.05. Post-hoc analysis was conducted using the Tukey test. The values were
expressed as the mean± standard error (n=6).
84
Results
Mass of Scaffolds
The mass of the pure PCL scaffolds were remarkably stable over the course of the 7
week experiment. As previously mentioned, PCL is a hydrophobic polymer and its
susceptibility to hydrolytic degradation is diminished by this property. On the contrary,
scaffolds containing DBM exhibited a significant mass loss over the duration of the
experiment. 25% DBM (Low) scaffolds mass loss tracked closely with pure PCL scaffolds,
but statistical significance was observed between the 20 and 25 day mark. Both 35% DBM
(Med) and 50% DBM (High) experienced a statistically significant mass loss in the first five
days.
In the first five days the scaffolds were immersed in SBF, 35% DBM exhibited a 4%
drop in mass while 50% DBM exhibited 18% drop in mass. 35% DBM exhibited a slight
increase in mass between 15 and 20 days. This course was slightly reversed later,
beginning at day 25 and then throughout the experiment. 50% DBM exhibited another
significant drop between the 15 and 20 day time points. This was followed by a statistically
significant increase between day 45 and 50. From this data, it appears that the percent
content of DBM in the scaffolds greatly mattered in evaluating mass loss. Scaffolds with a
higher DBM content experienced far more mass loss than those with little or none. This was
expected for two reasons. The DBM is only physically blended with the PCL and, thusly,
occupies random space within the scaffold. Secondly, DBM is hydrophilic. Therefore, its
interaction with the immersion liquid could increase the chances of its dislodgement from
the scaffold.
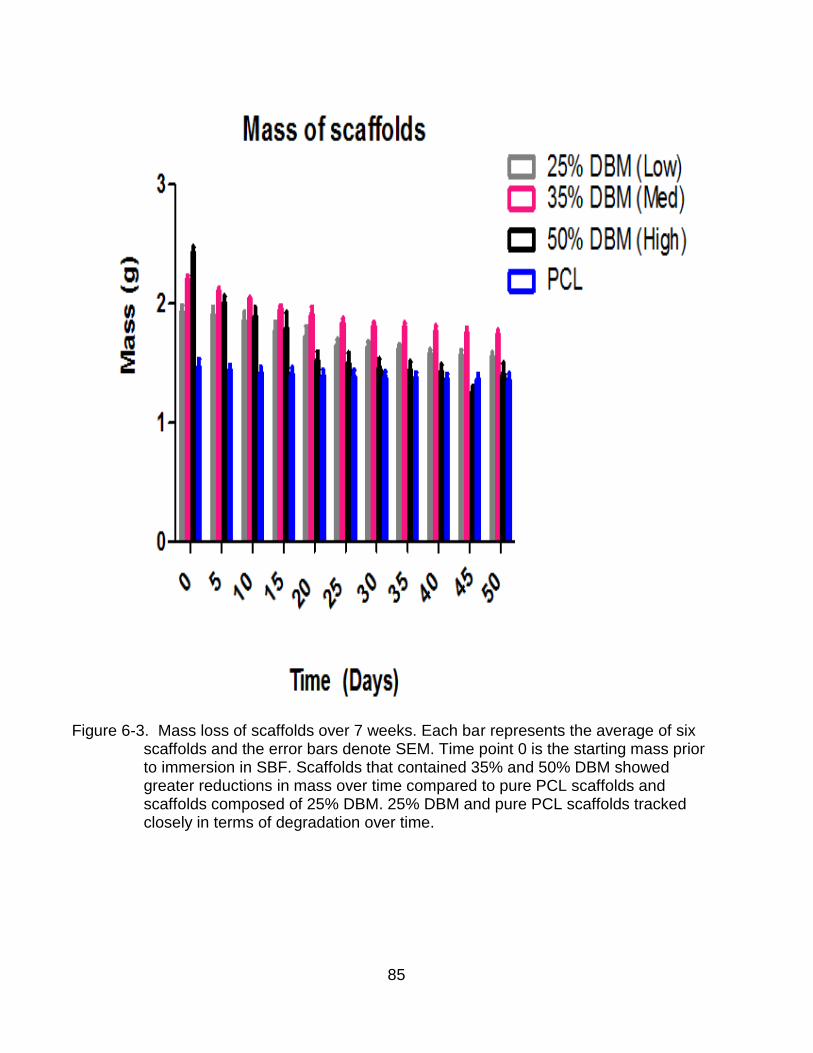
85
Figure 6-3. Mass loss of scaffolds over 7 weeks. Each bar represents the average of six
scaffolds and the error bars denote SEM. Time point 0 is the starting mass prior to immersion in SBF. Scaffolds that contained 35% and 50% DBM showed greater reductions in mass over time compared to pure PCL scaffolds and scaffolds composed of 25% DBM. 25% DBM and pure PCL scaffolds tracked closely in terms of degradation over time.
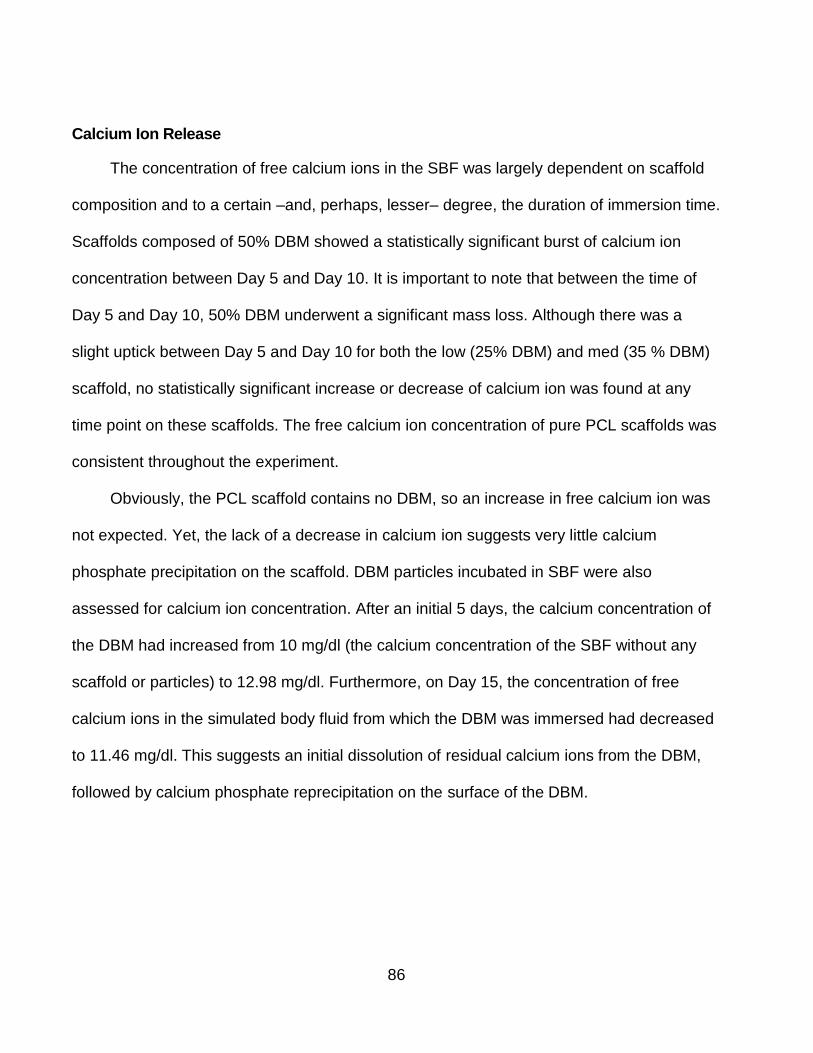
86
Calcium Ion Release
The concentration of free calcium ions in the SBF was largely dependent on scaffold
composition and to a certain –and, perhaps, lesser– degree, the duration of immersion time.
Scaffolds composed of 50% DBM showed a statistically significant burst of calcium ion
concentration between Day 5 and Day 10. It is important to note that between the time of
Day 5 and Day 10, 50% DBM underwent a significant mass loss. Although there was a
slight uptick between Day 5 and Day 10 for both the low (25% DBM) and med (35 % DBM)
scaffold, no statistically significant increase or decrease of calcium ion was found at any
time point on these scaffolds. The free calcium ion concentration of pure PCL scaffolds was
consistent throughout the experiment.
Obviously, the PCL scaffold contains no DBM, so an increase in free calcium ion was
not expected. Yet, the lack of a decrease in calcium ion suggests very little calcium
phosphate precipitation on the scaffold. DBM particles incubated in SBF were also
assessed for calcium ion concentration. After an initial 5 days, the calcium concentration of
the DBM had increased from 10 mg/dl (the calcium concentration of the SBF without any
scaffold or particles) to 12.98 mg/dl. Furthermore, on Day 15, the concentration of free
calcium ions in the simulated body fluid from which the DBM was immersed had decreased
to 11.46 mg/dl. This suggests an initial dissolution of residual calcium ions from the DBM,
followed by calcium phosphate reprecipitation on the surface of the DBM.
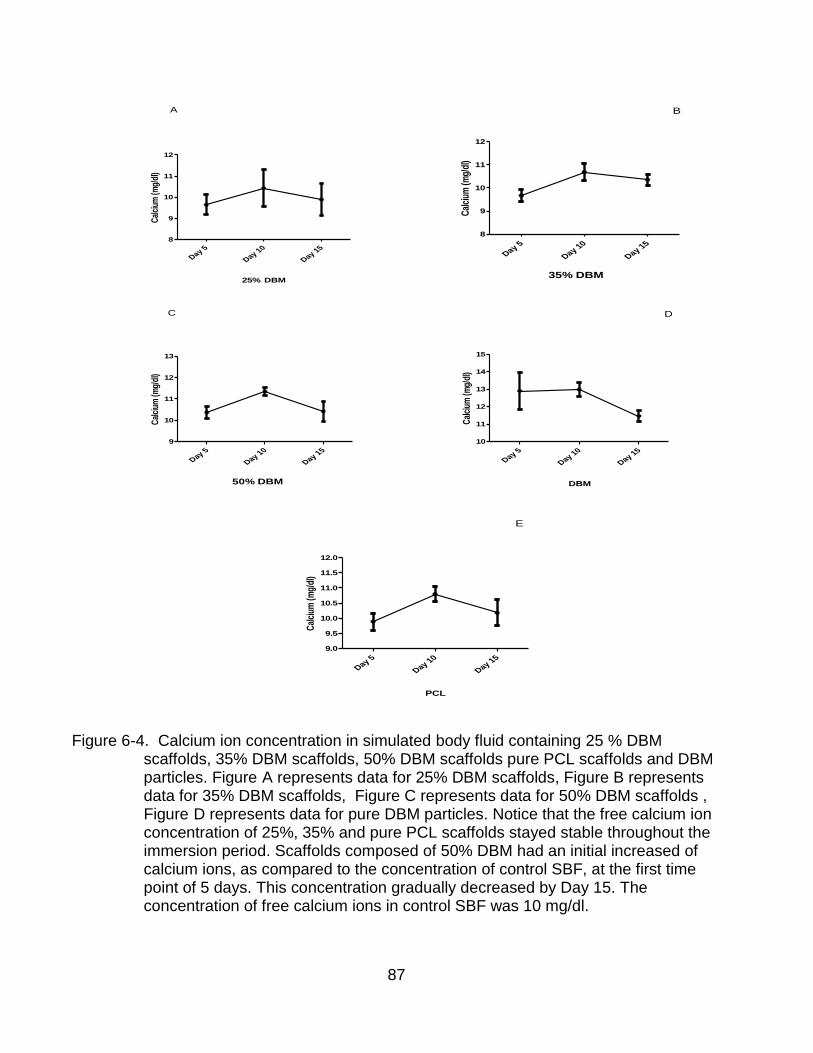
87
25% DBM
Cal
cium
(m
g/dl
)
Day 5
Day 10
Day 15
8
9
10
11
12
A
35% DBM
Cal
cium
(m
g/dl
)
Day 5
Day 10
Day 15
8
9
10
11
12
B
50% DBM
Cal
cium
(m
g/dl
)
Day 5
Day 10
Day 15
9
10
11
12
13
C
DBM
Cal
cium
(m
g/dl
)Day 5
Day 10
Day 15
10
11
12
13
14
15
D
PCL
Cal
cium
(m
g/dl
)
Day 5
Day 10
Day 15
9.0
9.5
10.0
10.5
11.0
11.5
12.0
E
Figure 6-4. Calcium ion concentration in simulated body fluid containing 25 % DBM scaffolds, 35% DBM scaffolds, 50% DBM scaffolds pure PCL scaffolds and DBM particles. Figure A represents data for 25% DBM scaffolds, Figure B represents data for 35% DBM scaffolds, Figure C represents data for 50% DBM scaffolds , Figure D represents data for pure DBM particles. Notice that the free calcium ion concentration of 25%, 35% and pure PCL scaffolds stayed stable throughout the immersion period. Scaffolds composed of 50% DBM had an initial increased of calcium ions, as compared to the concentration of control SBF, at the first time point of 5 days. This concentration gradually decreased by Day 15. The concentration of free calcium ions in control SBF was 10 mg/dl.
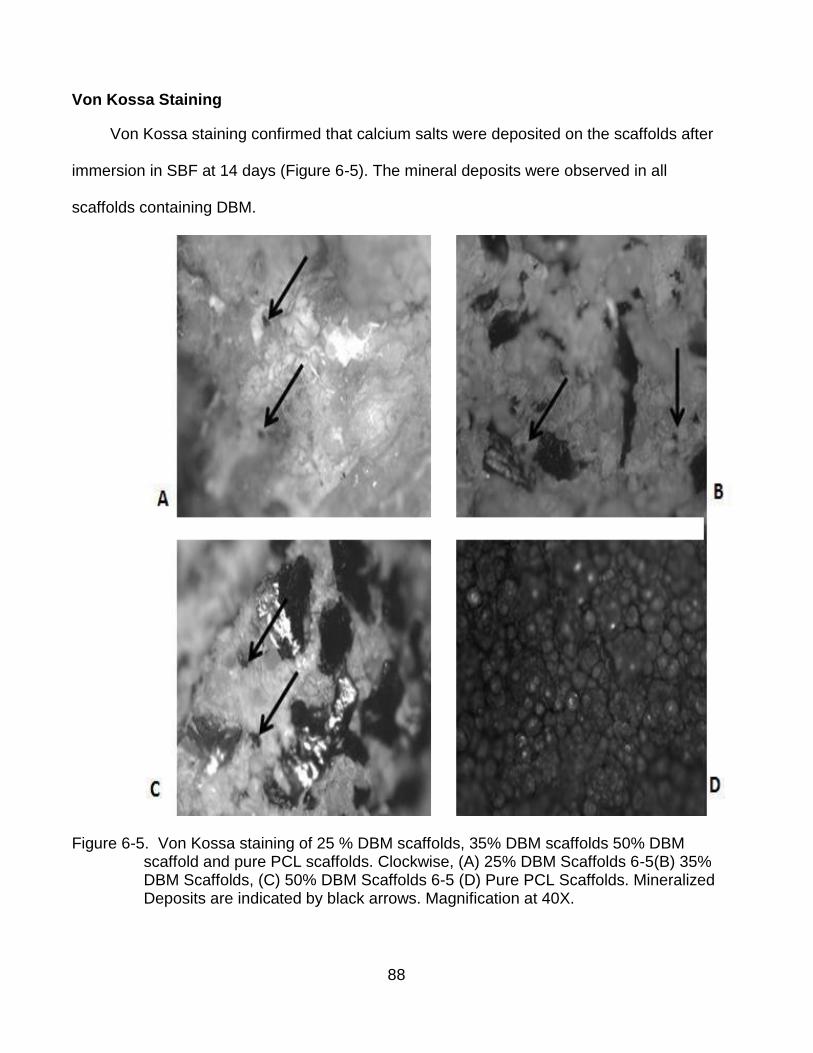
88
Von Kossa Staining
Von Kossa staining confirmed that calcium salts were deposited on the scaffolds after
immersion in SBF at 14 days (Figure 6-5). The mineral deposits were observed in all
scaffolds containing DBM.
Figure 6-5. Von Kossa staining of 25 % DBM scaffolds, 35% DBM scaffolds 50% DBM
scaffold and pure PCL scaffolds. Clockwise, (A) 25% DBM Scaffolds 6-5(B) 35% DBM Scaffolds, (C) 50% DBM Scaffolds 6-5 (D) Pure PCL Scaffolds. Mineralized Deposits are indicated by black arrows. Magnification at 40X.
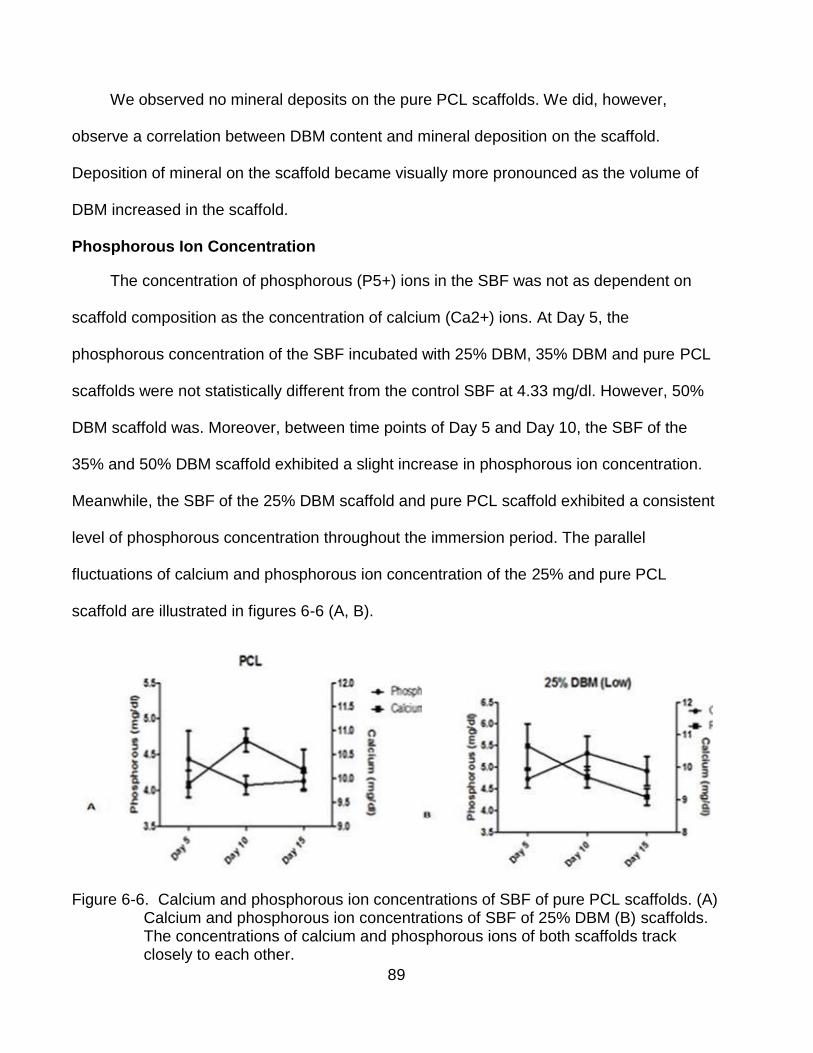
89
We observed no mineral deposits on the pure PCL scaffolds. We did, however,
observe a correlation between DBM content and mineral deposition on the scaffold.
Deposition of mineral on the scaffold became visually more pronounced as the volume of
DBM increased in the scaffold.
Phosphorous Ion Concentration
The concentration of phosphorous (P5+) ions in the SBF was not as dependent on
scaffold composition as the concentration of calcium (Ca2+) ions. At Day 5, the
phosphorous concentration of the SBF incubated with 25% DBM, 35% DBM and pure PCL
scaffolds were not statistically different from the control SBF at 4.33 mg/dl. However, 50%
DBM scaffold was. Moreover, between time points of Day 5 and Day 10, the SBF of the
35% and 50% DBM scaffold exhibited a slight increase in phosphorous ion concentration.
Meanwhile, the SBF of the 25% DBM scaffold and pure PCL scaffold exhibited a consistent
level of phosphorous concentration throughout the immersion period. The parallel
fluctuations of calcium and phosphorous ion concentration of the 25% and pure PCL
scaffold are illustrated in figures 6-6 (A, B).
Figure 6-6. Calcium and phosphorous ion concentrations of SBF of pure PCL scaffolds. (A)
Calcium and phosphorous ion concentrations of SBF of 25% DBM (B) scaffolds. The concentrations of calcium and phosphorous ions of both scaffolds track closely to each other.

90
Figure 6-7. Phosphorous ion concentration in simulated body fluid containing 25 % DBM
scaffolds, 35% DBM scaffolds, 50% DBM scaffolds, pure PCL scaffolds, and DBM particles. Figure A represents data for 25% DBM scaffolds, Figure B represents data for 35% DBM scaffolds, Figure C represents data for 50% DBM scaffolds, , Figure D represents data for pure DBM particles and , Figure E represents data for pure PCL scaffolds. Notice that phosphorous ion concentration of 25% and pure PCL scaffolds stayed stable throughout the immersion period. Scaffolds composed of 35% and 50% DBM had a slight and steady increase of phosphorous ion concentration at both Day 5 and Day 10. At Day 15, the concentration had reversed course and decreased. The concentration of phosphorous ions of the control SBF (SBF without any scaffold or particles immersed) was 4.33 mg/dl.
91
The uptick in phosphorous ion concentration seen at Day 10 for 35% and 50 %
DBM scaffolds could be a result of dissolution of residual phosphorous ions from the
DBM. This uptick is followed by a statistically significant decrease at Day 15. This
suggests calcium phosphate deposition on the surface of the scaffolds. Once again, the
lack of a decrease in phosphorous ion suggests very little calcium phosphate
precipitation on the pure PCL scaffold. DBM particles incubated in SBF were also
assessed for phosphorous ion concentration. After an initial increase in phosphorous ion
concentration, as compared to the control SBF (4.33 mg/dl), there was a significant
decrease in phosphorous ion concentration at Day 10. However, by Day 15, the ion
concentration had slightly increased. This is unlike calcium ion concentration, in which
we saw a slight decrease from Day 10 to Day 15. Figures 6-7 (A-E) illustrate the
fluctuations in the phosphorous concentrations of the scaffolds. Notice that the PCL
stayed stagnant throughout the entire 15 day experiment.
pH of Simulated Body Fluid
The pH of the simulated body fluid containing 25% DBM scaffolds, 35% DBM
scaffolds, 50% DBM scaffolds, and pure PCL scaffolds were reported as deviations from
control SBF which contained no scaffold (pH 7.1). Scaffolds containing DBM showed the
greatest deviations from control SBF. In particular, scaffolds containing 50% DBM. Pure
PCL scaffolds, and to a lesser extent, 25% DBM scaffolds demonstrated slight fluctuation
in pH from Day 0 to Day 50. Scaffolds containing 50% DBM exhibited a sharp drop in pH
in the first five days. This was followed by a moderate decrease in pH from Day 10 to
Day 20. At Day 30, a slight increase in pH was observed. The pH of the 50% DBM
remained stable until Day 50. Figure 6-8 illustrates the change in pH of the SBF over
time.

92
Figure 6-8. pH of immersion liquid (SBF) for the various scaffolds.
Scanning Electron Microcopy w/ Elemental Dispersive Spectroscopy
Figure 6-9. Scanning electron micrographs of (A) pure polymeric PCL scaffolds,
scaffolds with 25% DBM content (C), 35 % DBM post 14 days immersion (B), and 50% DBM scaffolds (D). Pure PCL scaffolds showed no evidence of precipitation, while those containing DBM contained various amounts of calcium phosphate precipitation.
93
SEM analysis indicated very little Calcium and Phosphorous deposition on the
surface of the PCL scaffold (Figure 6-9A). Calcium and Phosphorous deposition on the
scaffolds steadily increased as DBM content increased. Noticeably, there exists very
little difference in the signal lines for Calcium and Phosphorous when comparing 35 %
DBM (Figure 6-9C) and 50% DBM (Figure 6-9D).
Discussion
The purpose of this chapter is to explore the physical and chemical characteristics
of the various scaffolds as well as analyze the deposition of a calcium phosphate layer
on its surface. In this chapter, we explore properties such as rate of degradation and
pH. The degradation of a scaffold is perhaps the most important feature in designing a
scaffold. We previously discussed the importance of tailoring a scaffold’s properties to
match the properties of the tissue it was restoring. An ideal scaffold would provide a
biochemical and mechanical support system until the damaged tissue was fully
regenerated. An ideal scaffold would completely biodegrade at a rate consistent and in
line with tissue regeneration. This prevents a pseudo healing, in which the scaffold has
completely degraded but the tissue generated is not yet at full functionality.
Furthermore, scaffold degradation that is slower than tissue generation could inhibit or
disrupt new tissue functionality.
Equally as important to the success of an orthopedic scaffold is a layer of calcium
phosphate mineralization on its surface. The coating of calcium phosphate on an
implant has been shown to increase its ability to bond in vivo with native bone [146].
The success of an orthopedic implant is inherently linked to its ability to bond to native
bone in vivo. This bonding promotes osseointegration, the formation of a direct interface
between an implant and bone, without intervening soft tissue [183,184]. The
94
encapsulation of orthopedic implants by fibrous tissue is well documented [185-188] and
is one of the leading causes of implant failure. Implant loosening is an indirect result
usually due to mechanical or wear debris causing fibrous tissue to isolate the implant
from the native bone. While surface characteristics such as surface roughness, surface
chemistry and topography play an important role in developing good osseointegration,
so too does a surface layer of calcium phosphate mineralization.
While DBM is by definition mineral free, it does contain less than 5% mineral. We
believe that the residual calcium and phosphorous ions leech out of DBM and
reprecipitate on the surface of the DBM to create new mineral. In essence, DBM is able
to remineralize. This is not unlike how bone is formed. When the blood stream lacks
calcium, the parathyroid gland is stimulated to release parathyroid hormone (PTH). The
PTH then signals osteoclasts to break down the bone tissue and subsequently, release
calcium salts into the bloodstream. Afterward, the osteoblasts form new extracellular
matrix using the calcium salts released into the bloodstream by the osteoclasts. We can
liken this sequence to builders demolishing a house and retrieving its raw materials to
build a new house. This reprecipitation of calcium phosphate on the scaffold allows for
bonding and integration of the scaffold and native bone.
However, there are varying theories on how bone (mineralized or not)
reprecipitates. It is hypothesized that exposed phosphate (PO43-) and hydroxyl groups
(-OH) from the mineral layer elicit a negative charge [189-191] on the surface of the
material. This attracts the positively charged calcium ions, leeched from the bone, to the
surface of the bone. This then attracts the negatively charged phosphate ions, which
results in reprecipitation on the surface. This is known as heterogeneous nucleation. A
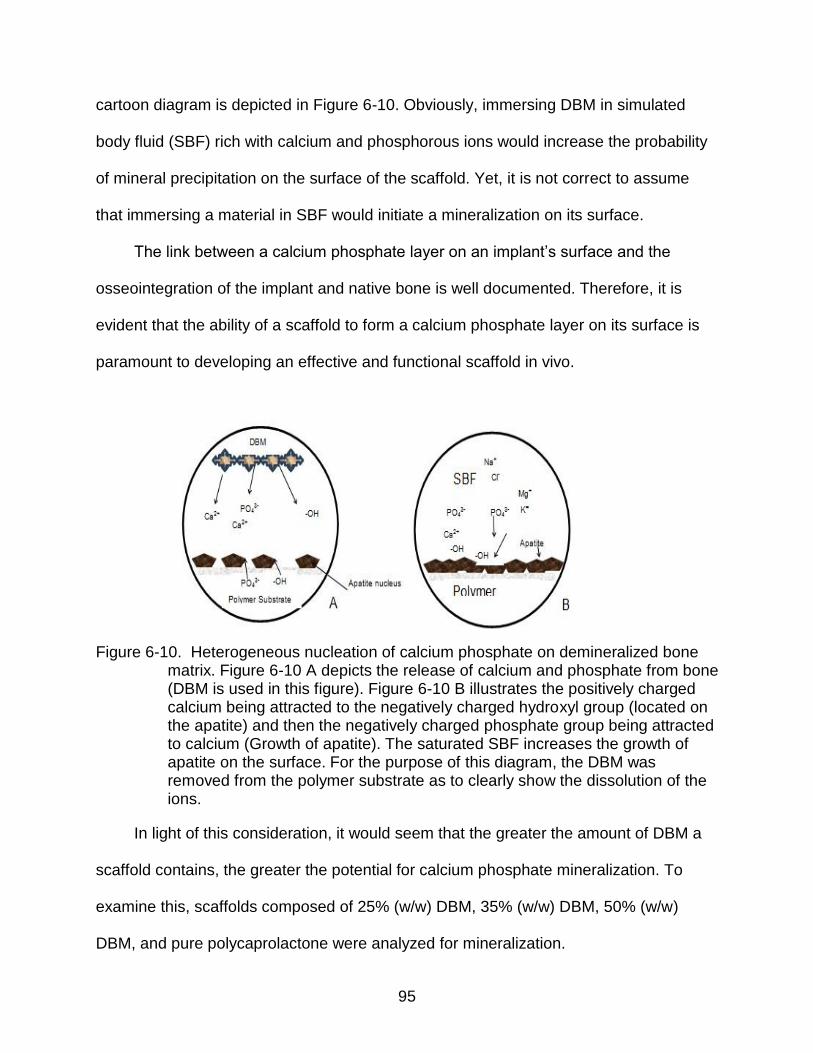
95
cartoon diagram is depicted in Figure 6-10. Obviously, immersing DBM in simulated
body fluid (SBF) rich with calcium and phosphorous ions would increase the probability
of mineral precipitation on the surface of the scaffold. Yet, it is not correct to assume
that immersing a material in SBF would initiate a mineralization on its surface.
The link between a calcium phosphate layer on an implant’s surface and the
osseointegration of the implant and native bone is well documented. Therefore, it is
evident that the ability of a scaffold to form a calcium phosphate layer on its surface is
paramount to developing an effective and functional scaffold in vivo.
Figure 6-10. Heterogeneous nucleation of calcium phosphate on demineralized bone matrix. Figure 6-10 A depicts the release of calcium and phosphate from bone (DBM is used in this figure). Figure 6-10 B illustrates the positively charged calcium being attracted to the negatively charged hydroxyl group (located on the apatite) and then the negatively charged phosphate group being attracted to calcium (Growth of apatite). The saturated SBF increases the growth of apatite on the surface. For the purpose of this diagram, the DBM was removed from the polymer substrate as to clearly show the dissolution of the ions.
In light of this consideration, it would seem that the greater the amount of DBM a
scaffold contains, the greater the potential for calcium phosphate mineralization. To
examine this, scaffolds composed of 25% (w/w) DBM, 35% (w/w) DBM, 50% (w/w)
DBM, and pure polycaprolactone were analyzed for mineralization.

96
In our degradation studies, the scaffolds were immersed in SBF solution prepared
according to Kokubo. The ionic concentration of the SBF was similar to that of human
plasma. Moreover, SBF was used to assess bioactivity –namely, calcium phosphate
deposition– on the surface of the scaffolds. In particular, we investigated whether
increasing the volume of DBM in a scaffold’s composition would increase the calcium
phosphate mineralization on its surface.
The mass of all scaffold types declined over the 7 week experiment; however,
some declined more than others. The mass of the 50% DBM declined by nearly 43%,
while those of the pure PCL scaffolds only declined by 7%. Since the DBM was only
physically blended into the scaffold, we expected a decline in scaffold mass. PCL is
hydrophobic and, therefore, its surface precludes liquid penetration into the scaffold.
Significant mass loss was experienced in the composite scaffolds due to the interaction
between the hydrophilic DBM and the SBF. During the period between Days 15, 20, 30,
and 35, 35% DBM exhibited a slight increase in mass. This possibly could have been
due to reprecipitation on its surface. However, the mass loss of the composite scaffolds
makes it fairly difficult to ascertain mass gained as a consequence of mineral
deposition.
The pH of the SBF solution for the composite scaffolds dipped slightly through the
7 week experiment. The SBF solution that contained pure PCL scaffolds remained
stable throughout. The fluctuations of the pH of the composite scaffolds can be
explained in a number of ways. It is entirely possible that residual acidic solvent
remained in the scaffold. We were able to achieve a porosity of nearly 90% with the
pure PCL scaffolds. However, the larger sized DBM particles made it difficult to obtain
97
such a high porosity. The porosity of the composite scaffolds was as follows: 37% for
the 50% DBM, 51% for the 35% DBM, and 56% for the 25% DBM. Pulverizing the DBM
to a finer size would have both increased the porosity of the composite scaffold and
allowed the penetration of water to remove any residual solvent from within the scaffold.
Subsequently, it would also have reduced the scaffolds’ osteoinductivity.
For the purpose of this research, we decided to use DBM particles that provided
the most osteoinductive potential, those within a range of 510 to 710 microns. It is also
conceivable that the composite scaffolds’ drop in pH stemmed from dissolution of
calcium, phosphate, and hydroxyl ions from the DBM within the scaffold. At Day 10, the
calcium ion concentration for the SBF that held 35 and 50% DBM scaffolds as well as
pure DBM particles was higher than that of the control SBF, 10 mg/dl. The calcium
concentration for 50% DBM scaffolds and pure DBM particles was significantly higher.
This suggests that residual calcium ions were released from the DBM at, or at least up
until, Day 10. Moreover, it was in these first 10 days that we saw a significant amount of
mass loss associated with scaffolds containing 35 % and 50% DBM. However, by Day
15, the concentration of calcium ions in the composite scaffolds and pure DBM had
decreased and returned to the calcium concentration of control SBF. It was also
interesting to note that, at Day 15, the mass loss of the composite scaffolds had begun
to subside, save for a temporary drop in the 50% DBM at Day 20.
It is plausible that as the calcium ions were released, they proceeded to
reprecipitate on the scaffolds’ surface, forming a calcium phosphate layer by binding
with the also leeched phosphate . This could also explain the small mass increase we
saw in the composite scaffolds. This is seen in both the Von Kossa Staining [Figure 6-5]
98
and SEM imaging [Figure 6-9]. It is particularly pronounced in the 35% and 50% DBM
scaffolds. Alongside its binding with phosphate ions, the calcium ions could have been
binding with hydroxyl ions to form CaOH2 as a precipitate. This would have decreased
the amount of OH- ions in the SBF and would have resulted in a net increase of H+ ions
and a decrease in pH.
In the same respect, we noticed an increase in phosphorous ion concentration, as
compared to control SBF, starting at, or lasting until, Day 10. Furthermore, by Day 15,
the concentration had returned to that of control SBF, 4.33 mg/dl. Again, the availability
and leeching of both calcium and phosphorous ions make reprecipitation on the
scaffolds plausible. And while both 35% and 50% DBM eluted a significant amount of
calcium and phosphorous ions, based on the SEM images, we did not detect a
significant difference in mineralization on the 35% and 50% DBM scaffolds. There was,
however, a lack of mineralization on both the PCL polymer and the 25% DBM scaffold.
The dip in pH lasted for roughly two weeks for the composite scaffolds, namely the
35 and 50%. Notwithstanding the temporary blip at Day 20 for the 35% DBM scaffold,
the pH steadied and began to increase thereafter. Both the decrease and increase can
be explained by considering the fact that the mass loss followed an identical trend. As
mentioned, the decrease in pH can be explained by the dissolution of the residual
calcium phosphate within the DBM. Notice that the scaffold that produced the highest
increase in calcium and phosphorous ion concentration was the 50% DBM scaffold.
Likewise, 50% DBM scaffolds also had the most mass loss over the 7 week experiment.
While both the calcium and phosphorous ion concentration data illustrated a
difference amongst the various composite scaffolds, the SEM images were not as
99
expressive. Consider, for instance, the EDS analysis of the 35% and 50% DBM
scaffold. While the signal was higher for both calcium and phosphorous for 50% DBM
scaffold, it was not significantly different from that of the 35% DBM scaffold. One theory
that could explain this occurrence is the pH drop found in the SBF solution of the 50%
DBM scaffold. It is known that calcium phosphate degrades at an acidic pH. It is
possible that the dip in pH caused dissolution of synthesized calcium phosphate. In
other words, as quickly as calcium phosphate reprecipitated on the 50% DBM scaffold,
it began to dissolve due to the low pH. This cycle continued until at least Day 15, when
the pH steadied and began to rise. Since the SEM images were only taken at Day 15, it
is possible that calcium phosphate began to reprecipitate at a faster clip than that of
35% DBM scaffold after this time point. This is a finding that requires further analysis.
As mentioned, post Day 15, the pH of the composite scaffolds began to rise. The
reprecipitation of calcium phosphate on the surface of the scaffold would have had an
increasing effect on the pH. Less calcium available would have meant less calcium
hydroxide formed and more OH- ions in the SBF solution. Since there are more
hydroxide ions than hydrogen ions present, the pH of the solution would increase –
which we saw in our experiment.
The formation of a calcium phosphate layer on an implant is integral to its bonding
to native bone in vivo, and thus its osseointegration. Osseointegration is defined as the
formation of a direct interface between an implant and bone, without intervening soft
tissue. The purpose of this study was to analyze whether the amount of DBM contained
in a scaffold was proportional to the amount of mineralization deposited on its surface.
The results proved to be mixed.

100
In summation, we set out to develop a composite scaffold of demineralized bone
matrix and polycaprolactone that supports and promotes mineralization. We developed
three types of composite scaffolds and a pure polymeric scaffold. The composite
scaffolds contained 25% DBM (w/w), 35% DBM (w/w) and 50% DBM (w/w). We
developed these composite scaffolds to determine if mineral reprecipitation was
proportional to percent volume of DBM in a scaffold. We report the results as mixed
because, even though the concentration of calcium and phosphorous ions increased in
the SBF solution of the composite scaffolds that contained a higher volume of DBM with
respect to PCL in the scaffold, mineralization on the surface of the scaffold was not
proportional to DBM content.
From this data, we can conclude that both the 35% and 50% DBM scaffolds
supported and promoted calcium phosphate mineralization on its surface. Moreover,
since no significant difference in mineralization was detected on the surface of the 35
and 50% DBM scaffold, we believe that continuing with the 35% DBM scaffold for this
project is appropriate.
101
CHAPTER 7 IN VITRO EVALUATION OF THE EFFECTS OF CALCIUM SULFATE,
HYDROXYAPATITE, AND DEMINERALIZED BONE MATRIX ADDITION TO POLYCAPROLACTONE SCAFFOLDS
Introductory Remarks
Bone is a dynamic tissue. An effective bone substitute would need to possess both
the requisite biological and mechanical properties of bone. Given that, bone substitutes
are rarely single material products. Rather, they usually combine a biodegradable
polymer with an additive that provides a biological and/or mechanical supplement.
There has been a lot of interest in using ceramic-based materials for tissue engineering,
mostly due to their high mechanical strength or their similarities with bone. Calcium
sulfate and calcium phosphate, or their derivatives, are ceramics that have been heavily
explored for use in bone tissue engineering.
The biological rationale for using calcium phosphate is that hydroxyapatite (HA), a
subgroup under calcium phosphate, accounts for 70% of bone [146]. An inorganic
mineral, hydroxyapatite, is mostly crystalline but is quite brittle. Owing to this, it is mostly
used as coating for heavy duty materials such as titanium alloy. This is typically done by
plasma spraying, which produces predominantly amorphous HA coating [192].
Calcium phosphate crystallizes in a number of crystal structures that possess
different mechanical, thermal, and chemical stabilities [193]. Certain structures include
amorphous calcium phosphate (ACP), brushite, β-tricalcium phosphate (TCP),
octacalcium phosphate and finally, hydroxyapatite (HA). Amorphous calcium phosphate
is widely associated with being a metastable precursor for the formation of the more
thermodynamically stable and advanced stages of calcium phosphate, octacalcium
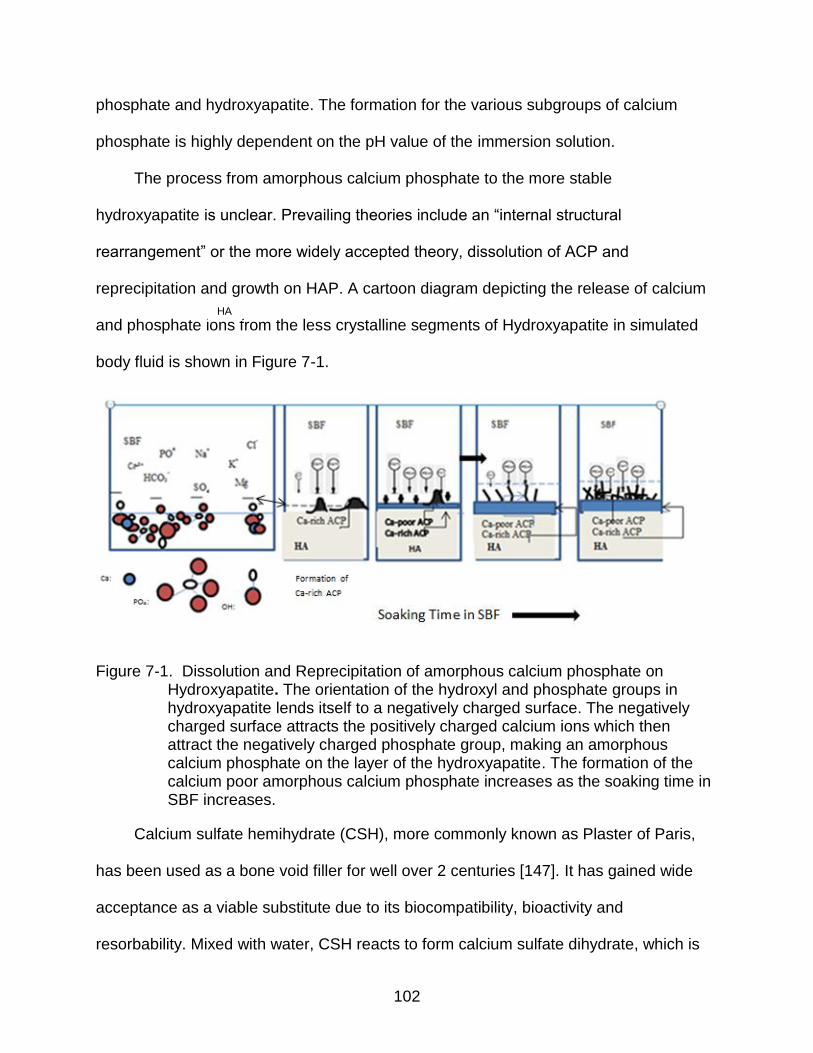
102
phosphate and hydroxyapatite. The formation for the various subgroups of calcium
phosphate is highly dependent on the pH value of the immersion solution.
The process from amorphous calcium phosphate to the more stable
hydroxyapatite is unclear. Prevailing theories include an “internal structural
rearrangement” or the more widely accepted theory, dissolution of ACP and
reprecipitation and growth on HAP. A cartoon diagram depicting the release of calcium
and phosphate ions from the less crystalline segments of Hydroxyapatite in simulated
body fluid is shown in Figure 7-1.
Figure 7-1. Dissolution and Reprecipitation of amorphous calcium phosphate on Hydroxyapatite. The orientation of the hydroxyl and phosphate groups in hydroxyapatite lends itself to a negatively charged surface. The negatively charged surface attracts the positively charged calcium ions which then attract the negatively charged phosphate group, making an amorphous calcium phosphate on the layer of the hydroxyapatite. The formation of the calcium poor amorphous calcium phosphate increases as the soaking time in SBF increases.
Calcium sulfate hemihydrate (CSH), more commonly known as Plaster of Paris,
has been used as a bone void filler for well over 2 centuries [147]. It has gained wide
acceptance as a viable substitute due to its biocompatibility, bioactivity and
resorbability. Mixed with water, CSH reacts to form calcium sulfate dihydrate, which is
HA

103
also known as gypsum. This paste, also known as bone cement, is widely used due to
its ability to conform to the size and shape of the defect and its lack of inflammatory
response in vivo.
Currently the United States Army’s protocol for wounded soldiers who have
suffered open fracture wounds in battle involves the use of Osteoset® (Wright Medical),
a calcium sulfate based product. However, under closer scrutiny, calcium sulfate has
shown a faster resorption rate than reported, and had a less than appealing healing in
vivo [148-150]. The manufacturer, Wright Medical, has currently started incorporating
demineralized bone matrix (DBM) into its flagship calcium sulfate based product,
Osteoset ®. In Osteoset ® 2 DBM graft, the percentage of DBM is increased from 0 %
seen in Osteoset® to 53% in Osteoset ® 2. According to the manufacturer, the addition
of DBM was intended to increase the bioactivity of the calcium sulfate based disks.
The purpose of this study was to compare the effects of adding calcium sulfate,
hydroxyapatite and demineralized bone matrix to a polycaprolactone scaffold using the
following parameters: mineralization, adhesion analysis through contact angle
measurement, cellular viability, and mechanical testing.
Materials and Methods
Scaffold Preparation
PCL (molecular weight 80 kDa) and the solvent, glacial acetic acid, were both
purchased from Sigma-Aldrich. Sieved sodium chloride particles (<100 μm) were
selected as the porogen. Demineralized Bone Matrix (mean size 687 μm) was
generously donated by Regeneration Technologies (RTIX, Alachua, FL). Spheroidal
hydroxylapatite powder was obtained from BDH Chemicals (Poole, England). Calcium
Sulfate hemihydrate powder was purchased from DAP Inc (Baltimore, MD). A 25 wt%
104
PCL solution was prepared to which 35% by wt of the appropriate filler (DBM, CS, HA)
was added to the mixture. The scaffolds were prepared according to the protocol in
Chapter 6.
Briefly, PCL pellets were dissolved in glacial acetic acid at a concentration of 25%
(w/v) in a beaker and stirred at 65°C. Once the PCL was completely dissolved (1-2 hrs),
sodium chloride (NaCl) particles at 90% w/w of PCL were added. The polymer solution
was allowed to cool at room temperature for 30 minutes. Once the temperature of the
polymer solution reached 37°C, the polymer solution was cast into well culture
microplates (Corning Life Sciences). Demineralized bone matrix was then added to the
resulting scaffolds. Four types of scaffolds were formed; pure polymeric scaffolds,
PCL/DBM scaffolds that contained approximately 35% DBM (w/w), PCL/CS scaffolds
that contained approximately 35% Calcium Sulfate (w/w), and PCL/HA scaffolds that
contained approximately 35% Hydroxyapatite (w/w). After the evaporation of the solvent
at 23°C (RT) overnight, the resulting solidified scaffolds were placed in placed in 50 mL
conical tubes containing 15 mLs of distilled water, with a ratio of sample surface to DI
volume of 0.5 cm2/mL. The scaffolds were sonicated for 3 hours at 37°C and were
freeze dried overnight.
Degradation Media
Scaffolds were incubated in 15 ml of simulated body fluid (SBF) that was
maintained at 37°C and changed every three days for up to 20 days. The sample
surface to DI volume was 0.5 cm2/mL to ensure “sink” conditions; that sufficient medium
volume is available during the entire test. SBF was prepared according to Kokubo.
105
Water Uptake and Mass Loss of Scaffolds
Scaffolds were weighed once prior to the degradation study and then every five
days for 20 days. At each time points, scaffolds were removed from the SBF, weighed
to measure water uptake, rinsed with DI water and blotted dry with a Kimwipe® till no
liquid was seen on the wipe. After, the scaffolds were freeze dried for 24 hour to ensure
complete removal of water, and weighed. Six samples were weighed for each group
(35% DBM, 35% CS, 35% HA and pure PCL). Water absorption was measured using
equation 7-1
= 100%Ww Wd
Wd
(7-1)
where Ww (wet weight) and Wd (dry weight) are specimen weight after and before
immersion in SBF respectively. Mass loss of the scaffold was measured using equation
7-2.
= 100%Wi Wf
Wi
(7-2)
where Wi (initial weight) and Wf (final weight) are specimen weight before and
after immersion in SBF, respectively. pH of the scaffolds was also taken.
Bioactivity Analysis
Mineralization on the scaffolds was monitored systematically by collecting the
supernatants and analyzing the levels of ionized calcium and phosphorus using Stanbio
Laboratory, L.P. Kits No. 150 and No. 160, respectively (Boerne, TX). This was done at
time periods of 14 and 21 days post-immersion in simulated body fluid (SBF) at 37°C.
The ionic concentration of SBF (mM) is as follows: Na+, 142.0; K+, 5.0; Ca2+, 2.5;
Mg2+, 1.5; Cl-, 148.8; HCO3-, 4.2; HPO42-, 1.0; SO42-, 0.5. Morphological changes on
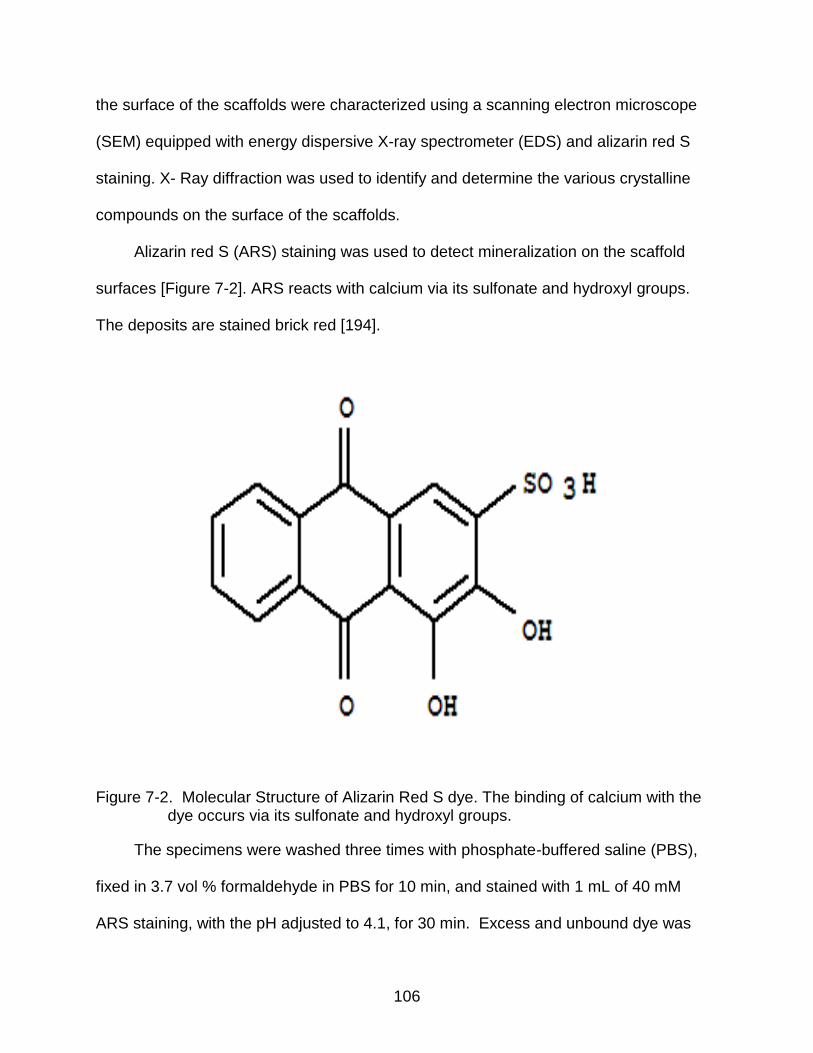
106
the surface of the scaffolds were characterized using a scanning electron microscope
(SEM) equipped with energy dispersive X-ray spectrometer (EDS) and alizarin red S
staining. X- Ray diffraction was used to identify and determine the various crystalline
compounds on the surface of the scaffolds.
Alizarin red S (ARS) staining was used to detect mineralization on the scaffold
surfaces [Figure 7-2]. ARS reacts with calcium via its sulfonate and hydroxyl groups.
The deposits are stained brick red [194].
Figure 7-2. Molecular Structure of Alizarin Red S dye. The binding of calcium with the dye occurs via its sulfonate and hydroxyl groups.
The specimens were washed three times with phosphate-buffered saline (PBS),
fixed in 3.7 vol % formaldehyde in PBS for 10 min, and stained with 1 mL of 40 mM
ARS staining, with the pH adjusted to 4.1, for 30 min. Excess and unbound dye was
107
rinsed off the scaffolds using DI water and blotting paper. One set of stained scaffolds
was then mounted on cover slides to observe using an optical microscope. The other
set of stained scaffolds was transferred into 10 mL conical tubes containing 1.5 mL of .5
M Acetic Acid. The dye bound on the scaffolds was allowed to dissolve in the acetic
acid for ~12 h. 500 μL of the solubilized stain was then pipetted into a 2 mL cuvette.
The pH of the stain was adjusted to 4.1 by adding 600 μL of 1M NaOH. The
absorbance was measured at 550 nm using a spectrophotometer (Shimadzu, Japan).
X ray Diffraction
X- Ray diffraction was used to identify and determine the various crystalline
compounds on the surface of the scaffolds, before and after immersion in SBF. The
sample spectra were collected using a Phillips diffractometer operating in the Bragg–
Brentano configuration with Co K_ (_ = 1.54056 Å) radiation at a current of 20 mA and
an accelerating voltage of 40 kV. Spectra were recorded in the range 5◦ <x < 90◦ for
DBM and HA, 10◦ <x < 70◦ for CS and at a scanning speed of 1◦/min and step size of
0.02◦.
Mechanical Testing
Cylindrical dried scaffolds were measured for mechanical strength in terms of
compressive stress and strain using a texture analyzer (TA.XT2 Texture technologies)
by applying uniaxial initial strain set of 20% of the original height and a constant
crosshead speed of 1.0 mm/min, using a 1/2" dia. AOAC cyl., acrylic, 35mm tall probe.
Since these scaffolds were porous and subject to degradation, and thusly possessed
frayed edges, 5 points in the center scaffold were used to determine an average of data
points.
108
Contact angle
The surface of the scaffold influences cell adhesion by providing a receiving or
inhibiting environment for anchorage dependent mammalian cells. The “wettability” or
adhesiveness of a material can be characterized based on the surface tension between
a solvent drop at its interface and the homogenous surface. Due to large deviations that
can be caused by a non-homogenous surface, non-porous scaffolds were used to
measure the contact angle. Contact angle was determined by the sessile drop method
with a Rame Hart Goniometer. The contact angle is an average of 5 measurements on
the scaffold.
Viability Analysis
Biocompatibility of scaffolds were evaluated using an in vitro viability test with the
mouse skeletal muscle myoblast C2C12 cell line. The cells were cultured for 4 days in
Dulbecco’s modified Eagle’s medium (DMEM), supplemented with 10% (v/v) fetal
bovine serum and 5% (v/v) 10 U/ml penicillin/streptomycin. All cell culture reagents
were bought from Sigma-Aldrich. Scaffolds without cells were used as blanks and cell
seeded tissue culture wells served as the controls. After 4 days, AlamarBlue analysis
was performed to study the viability and proliferation of the cells on the scaffolds.
Scaffolds were incubated with Alamar Blue dye (final concentration 10% in medium v/v)
for four hours at 37°C in 5% CO2 incubator. The color change was read on a
SpectraMax M (Molecular Devices) microplate reader. Absorbance was read at 570 nm
wavelength. Results were expressed in terms of optical density.
Statistics
Six scaffolds were analyzed for each scaffold type at the various time points for
mass change, water absorption, calcium ion release, phosphorous ion release and pH

109
change. Three samples from each scaffold type were analyzed for Alizarin Red S
staining and Viability/ Toxicity tests. All statistical analysis was conducted using the
GraphPad Instat program. The data within each scaffold type was examined between
time points and analyzed using a one-way analysis of variance (ANOVA) with statistical
significance at p<0.05. Further, data comparing the scaffolds was examined using two-
way analysis of variance (ANOVA) with statistical significance at p<0.05. Post-hoc
analysis was conducted using the Tukey test. The values were expressed as the
mean± standard error.
Results
Mass Loss and Water Absorption
Scaffold degradation in SBF is a good indicator of how scaffolds will behave in
vivo. PCL is a semi crystalline hydrophobic polymer whose complete degradation can
take upwards of 2 years. It is then no surprise that the scaffold that lost the least amount
of mass was pure PCL with less than 9% loss Scaffolds with Demineralized Bone Matrix
(DBM) lost 34% of mass, Hydroxylapatite (HA) lost 41% of mass, and scaffolds with
calcium sulfate (CS) lost 56% of mass. In preparation of the scaffolds, the dense
calcium sulfate tended to sink towards the bottom of the suspension and not mix
homogenously with the polycaprolactone- therefore it’s’ degradation rate would have
been likely faster than that of DBM which had a fairly uniform mix with PCL.
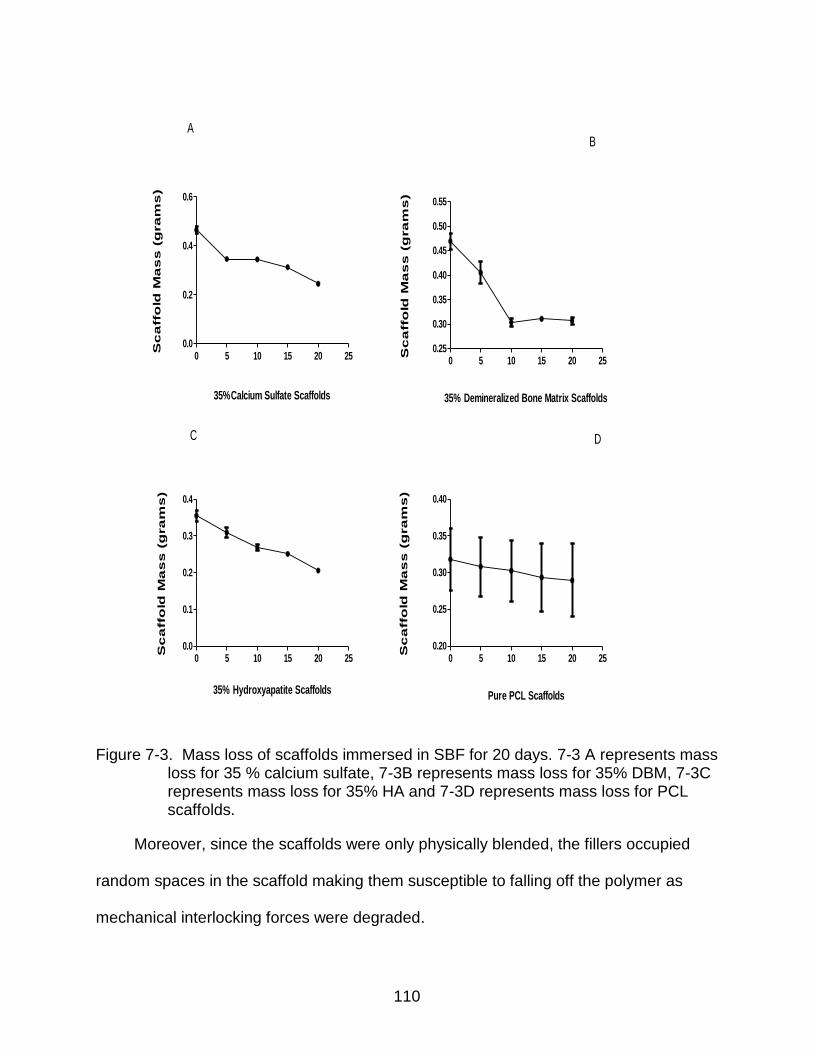
110
35%Calcium Sulfate Scaffolds
Sc
affo
ld M
as
s (
gra
ms
)
0 5 10 15 20 250.0
0.2
0.4
0.6
A
35% Demineralized Bone Matrix ScaffoldsS
ca
ffo
ld M
as
s (
gra
ms
)
0 5 10 15 20 250.25
0.30
0.35
0.40
0.45
0.50
0.55
B
35% Hydroxyapatite Scaffolds
Sc
affo
ld M
as
s (
gra
ms
)
0 5 10 15 20 250.0
0.1
0.2
0.3
0.4
C
Pure PCL Scaffolds
Sc
affo
ld M
as
s (
gra
ms
)
0 5 10 15 20 250.20
0.25
0.30
0.35
0.40
D
Figure 7-3. Mass loss of scaffolds immersed in SBF for 20 days. 7-3 A represents mass loss for 35 % calcium sulfate, 7-3B represents mass loss for 35% DBM, 7-3C represents mass loss for 35% HA and 7-3D represents mass loss for PCL scaffolds.
Moreover, since the scaffolds were only physically blended, the fillers occupied
random spaces in the scaffold making them susceptible to falling off the polymer as
mechanical interlocking forces were degraded.
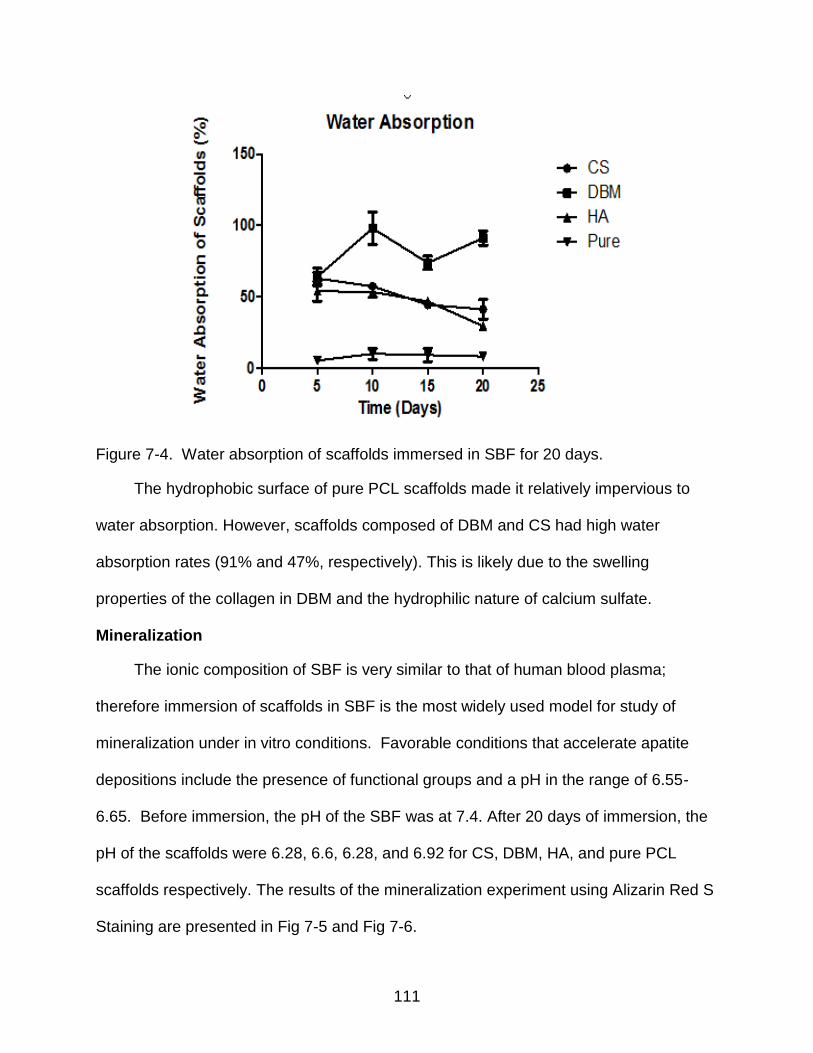
111
Figure 7-4. Water absorption of scaffolds immersed in SBF for 20 days.
The hydrophobic surface of pure PCL scaffolds made it relatively impervious to
water absorption. However, scaffolds composed of DBM and CS had high water
absorption rates (91% and 47%, respectively). This is likely due to the swelling
properties of the collagen in DBM and the hydrophilic nature of calcium sulfate.
Mineralization
The ionic composition of SBF is very similar to that of human blood plasma;
therefore immersion of scaffolds in SBF is the most widely used model for study of
mineralization under in vitro conditions. Favorable conditions that accelerate apatite
depositions include the presence of functional groups and a pH in the range of 6.55-
6.65. Before immersion, the pH of the SBF was at 7.4. After 20 days of immersion, the
pH of the scaffolds were 6.28, 6.6, 6.28, and 6.92 for CS, DBM, HA, and pure PCL
scaffolds respectively. The results of the mineralization experiment using Alizarin Red S
Staining are presented in Fig 7-5 and Fig 7-6.
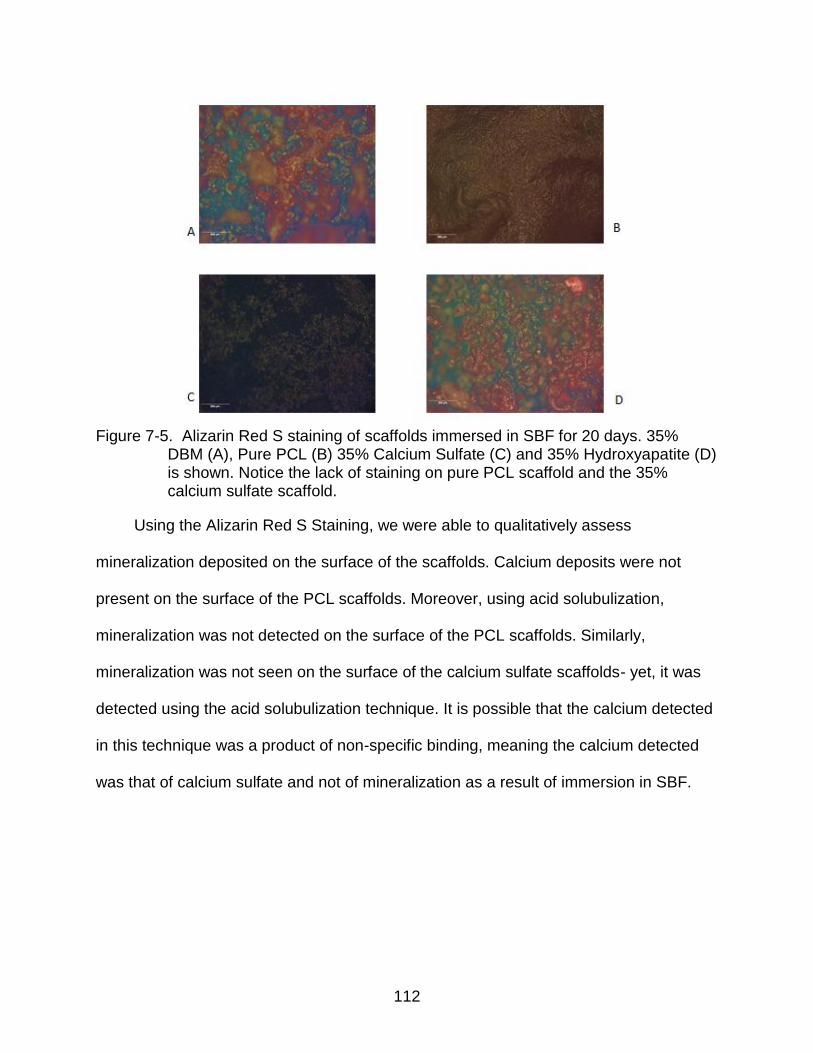
112
Figure 7-5. Alizarin Red S staining of scaffolds immersed in SBF for 20 days. 35%
DBM (A), Pure PCL (B) 35% Calcium Sulfate (C) and 35% Hydroxyapatite (D) is shown. Notice the lack of staining on pure PCL scaffold and the 35% calcium sulfate scaffold.
Using the Alizarin Red S Staining, we were able to qualitatively assess
mineralization deposited on the surface of the scaffolds. Calcium deposits were not
present on the surface of the PCL scaffolds. Moreover, using acid solubulization,
mineralization was not detected on the surface of the PCL scaffolds. Similarly,
mineralization was not seen on the surface of the calcium sulfate scaffolds- yet, it was
detected using the acid solubulization technique. It is possible that the calcium detected
in this technique was a product of non-specific binding, meaning the calcium detected
was that of calcium sulfate and not of mineralization as a result of immersion in SBF.
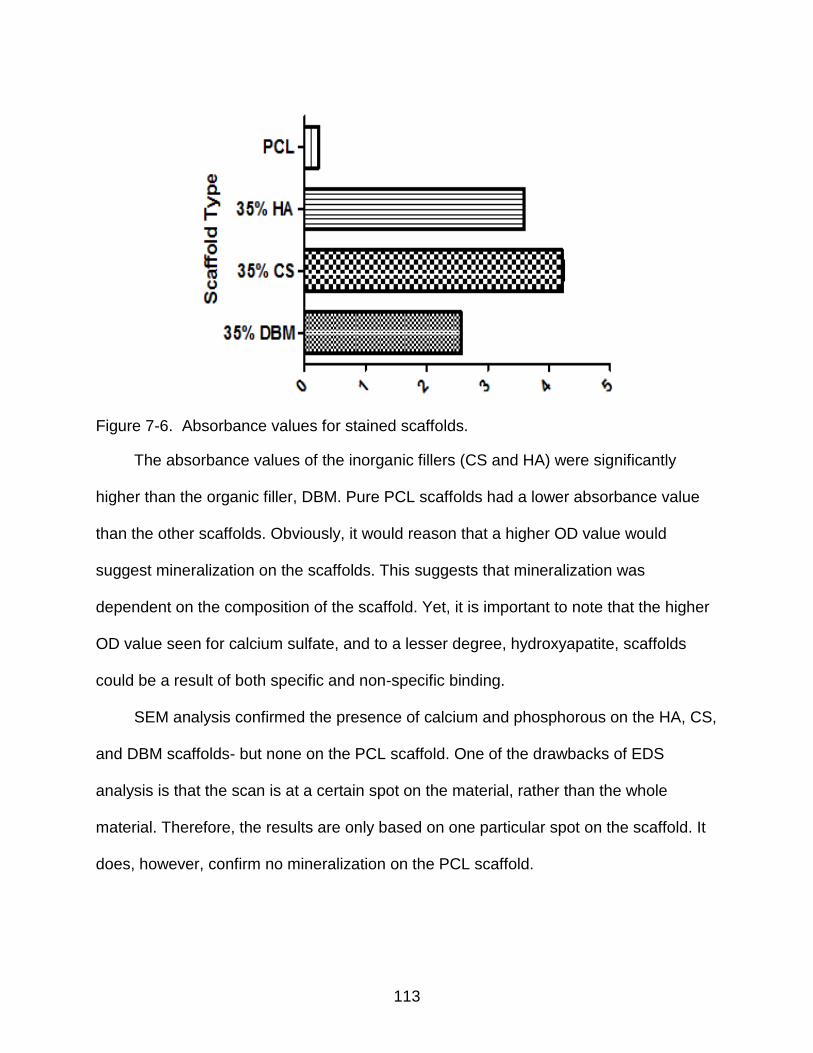
113
Figure 7-6. Absorbance values for stained scaffolds.
The absorbance values of the inorganic fillers (CS and HA) were significantly
higher than the organic filler, DBM. Pure PCL scaffolds had a lower absorbance value
than the other scaffolds. Obviously, it would reason that a higher OD value would
suggest mineralization on the scaffolds. This suggests that mineralization was
dependent on the composition of the scaffold. Yet, it is important to note that the higher
OD value seen for calcium sulfate, and to a lesser degree, hydroxyapatite, scaffolds
could be a result of both specific and non-specific binding.
SEM analysis confirmed the presence of calcium and phosphorous on the HA, CS,
and DBM scaffolds- but none on the PCL scaffold. One of the drawbacks of EDS
analysis is that the scan is at a certain spot on the material, rather than the whole
material. Therefore, the results are only based on one particular spot on the scaffold. It
does, however, confirm no mineralization on the PCL scaffold.
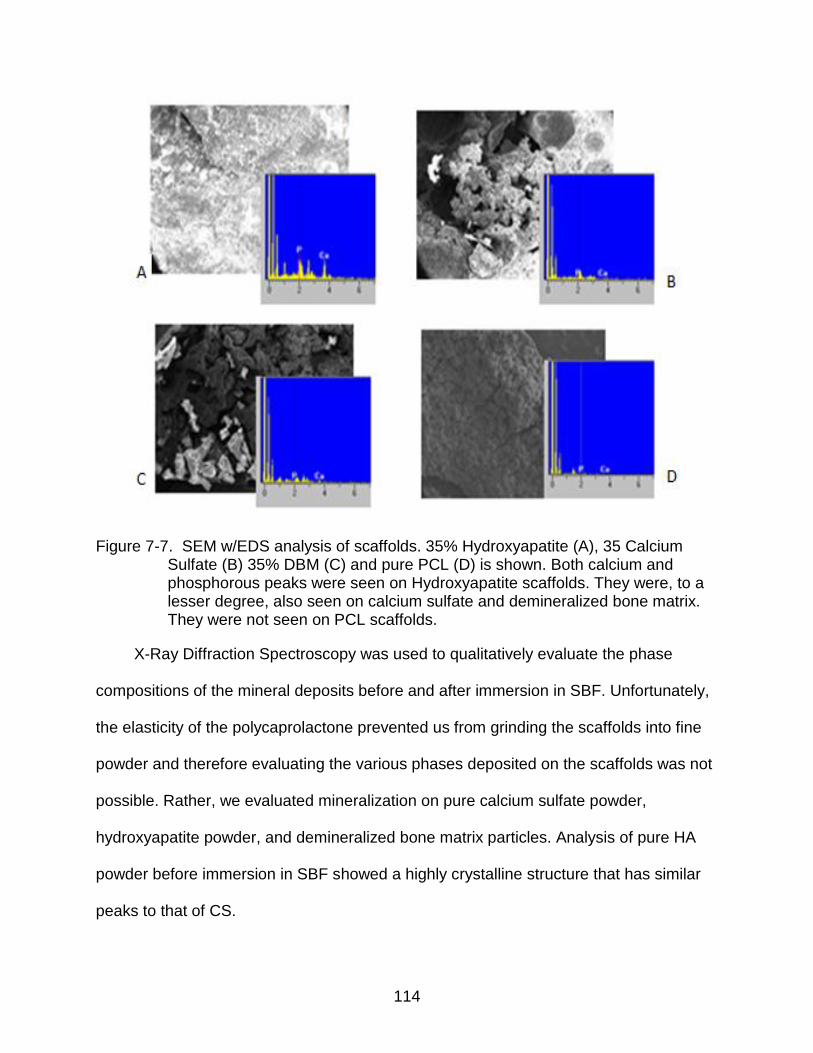
114
Figure 7-7. SEM w/EDS analysis of scaffolds. 35% Hydroxyapatite (A), 35 Calcium Sulfate (B) 35% DBM (C) and pure PCL (D) is shown. Both calcium and phosphorous peaks were seen on Hydroxyapatite scaffolds. They were, to a lesser degree, also seen on calcium sulfate and demineralized bone matrix. They were not seen on PCL scaffolds.
X-Ray Diffraction Spectroscopy was used to qualitatively evaluate the phase
compositions of the mineral deposits before and after immersion in SBF. Unfortunately,
the elasticity of the polycaprolactone prevented us from grinding the scaffolds into fine
powder and therefore evaluating the various phases deposited on the scaffolds was not
possible. Rather, we evaluated mineralization on pure calcium sulfate powder,
hydroxyapatite powder, and demineralized bone matrix particles. Analysis of pure HA
powder before immersion in SBF showed a highly crystalline structure that has similar
peaks to that of CS.
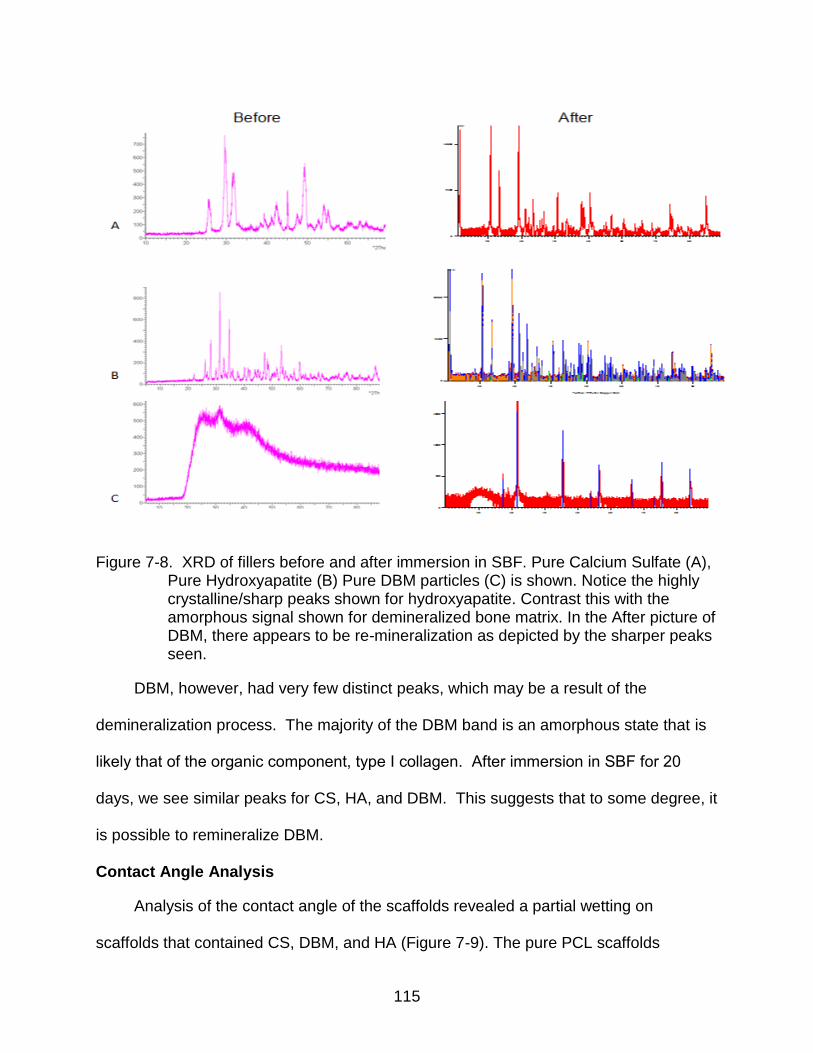
115
Figure 7-8. XRD of fillers before and after immersion in SBF. Pure Calcium Sulfate (A), Pure Hydroxyapatite (B) Pure DBM particles (C) is shown. Notice the highly crystalline/sharp peaks shown for hydroxyapatite. Contrast this with the amorphous signal shown for demineralized bone matrix. In the After picture of DBM, there appears to be re-mineralization as depicted by the sharper peaks seen.
DBM, however, had very few distinct peaks, which may be a result of the
demineralization process. The majority of the DBM band is an amorphous state that is
likely that of the organic component, type Ι collagen. After immersion in SBF for 20
days, we see similar peaks for CS, HA, and DBM. This suggests that to some degree, it
is possible to remineralize DBM.
Contact Angle Analysis
Analysis of the contact angle of the scaffolds revealed a partial wetting on
scaffolds that contained CS, DBM, and HA (Figure 7-9). The pure PCL scaffolds
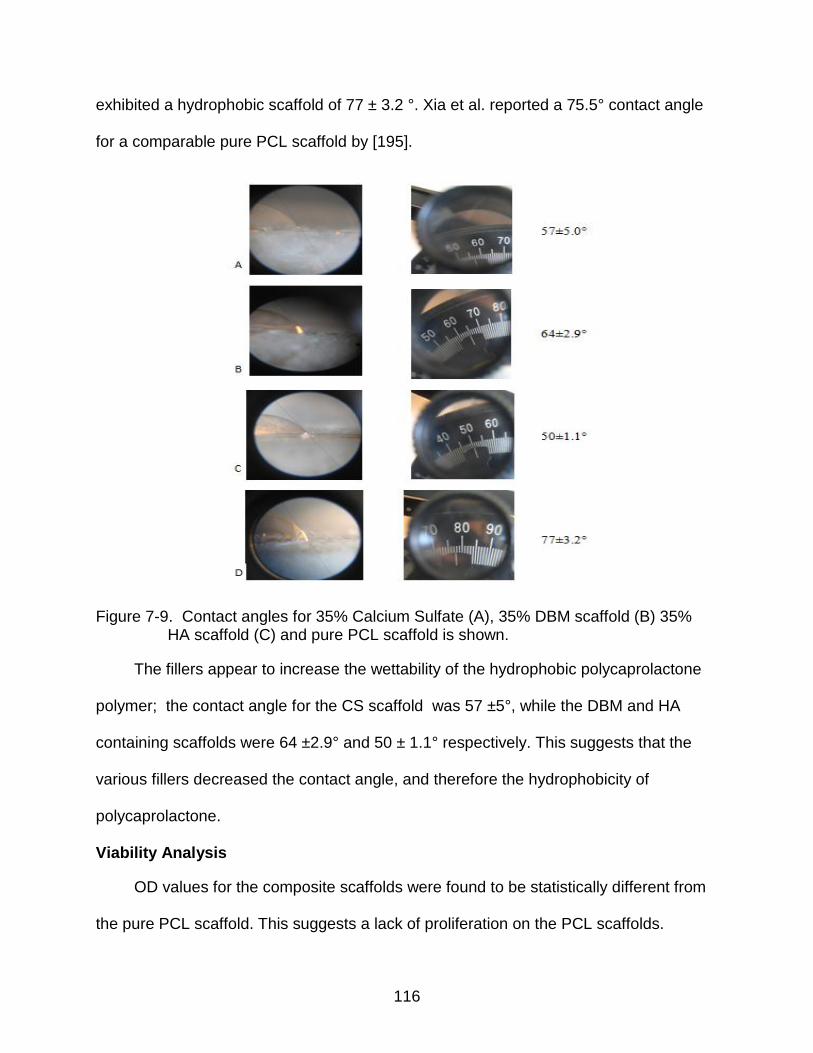
116
exhibited a hydrophobic scaffold of 77 ± 3.2 °. Xia et al. reported a 75.5° contact angle
for a comparable pure PCL scaffold by [195].
Figure 7-9. Contact angles for 35% Calcium Sulfate (A), 35% DBM scaffold (B) 35% HA scaffold (C) and pure PCL scaffold is shown.
The fillers appear to increase the wettability of the hydrophobic polycaprolactone
polymer; the contact angle for the CS scaffold was 57 ±5°, while the DBM and HA
containing scaffolds were 64 ±2.9° and 50 ± 1.1° respectively. This suggests that the
various fillers decreased the contact angle, and therefore the hydrophobicity of
polycaprolactone.
Viability Analysis
OD values for the composite scaffolds were found to be statistically different from
the pure PCL scaffold. This suggests a lack of proliferation on the PCL scaffolds.
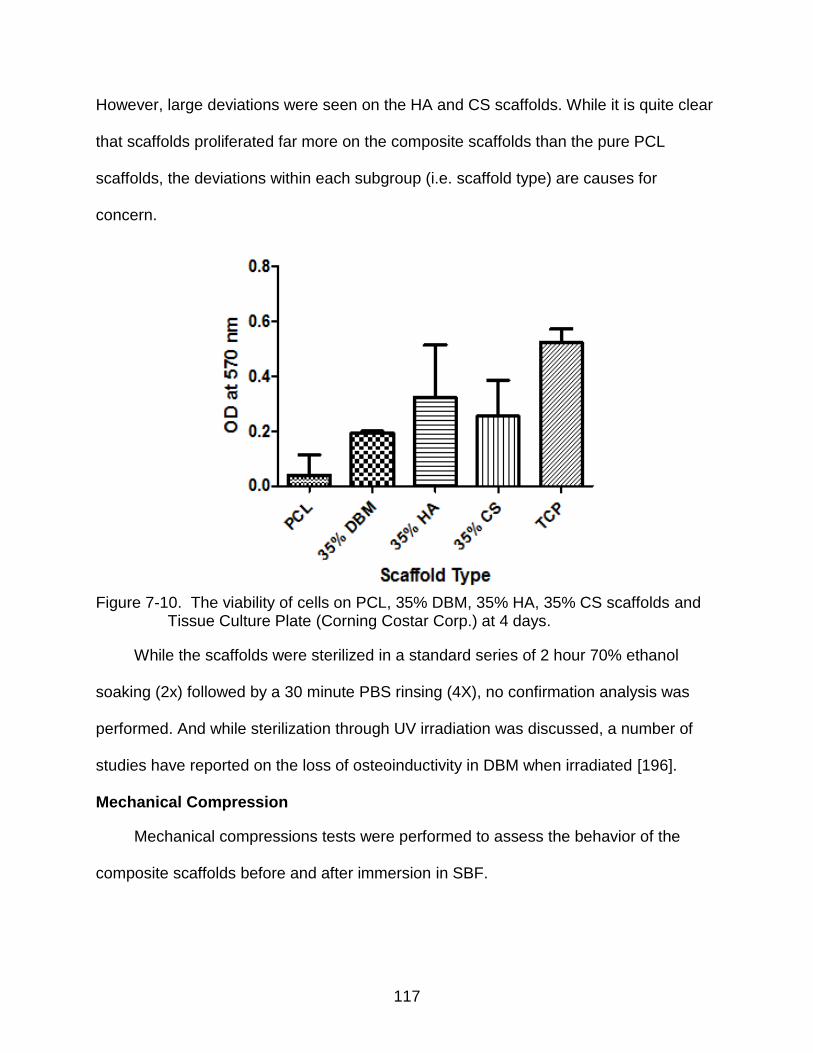
117
However, large deviations were seen on the HA and CS scaffolds. While it is quite clear
that scaffolds proliferated far more on the composite scaffolds than the pure PCL
scaffolds, the deviations within each subgroup (i.e. scaffold type) are causes for
concern.
Figure 7-10. The viability of cells on PCL, 35% DBM, 35% HA, 35% CS scaffolds and
Tissue Culture Plate (Corning Costar Corp.) at 4 days.
While the scaffolds were sterilized in a standard series of 2 hour 70% ethanol
soaking (2x) followed by a 30 minute PBS rinsing (4X), no confirmation analysis was
performed. And while sterilization through UV irradiation was discussed, a number of
studies have reported on the loss of osteoinductivity in DBM when irradiated [196].
Mechanical Compression
Mechanical compressions tests were performed to assess the behavior of the
composite scaffolds before and after immersion in SBF.
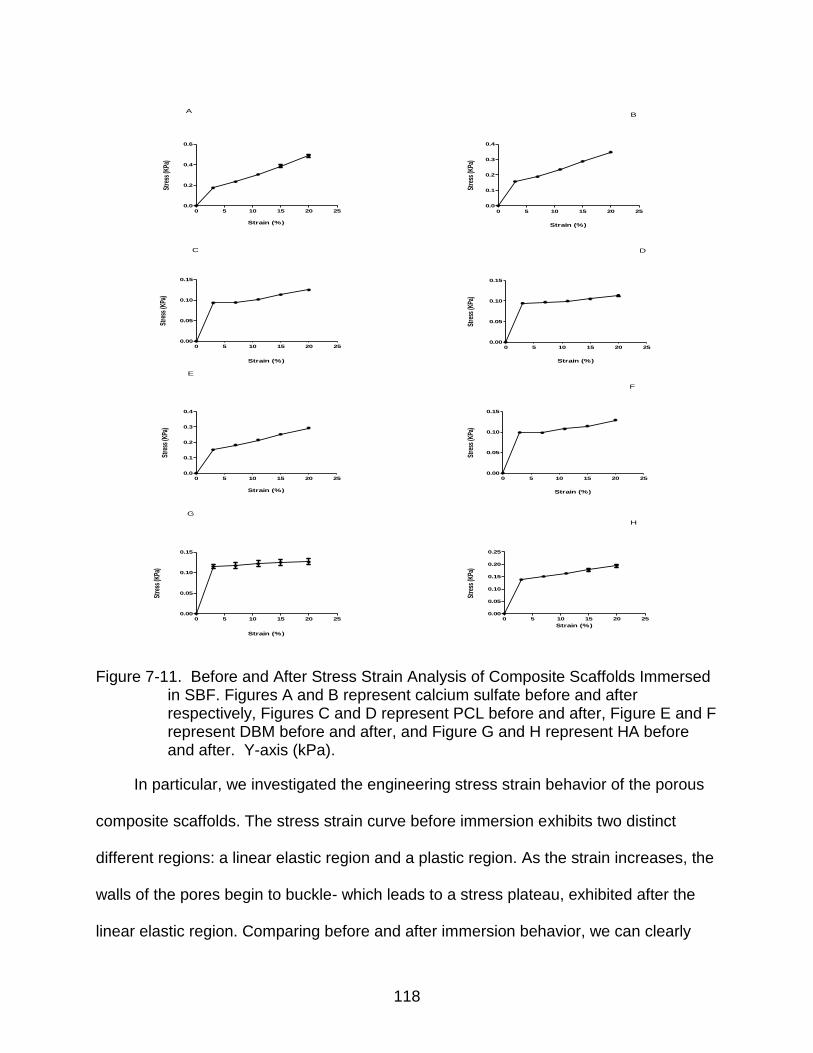
118
Strain (%)
Stre
ss (K
Pa)
0 5 10 15 20 250.0
0.2
0.4
0.6
A
Strain (%)
Stre
ss (K
Pa)
0 5 10 15 20 25
0.0
0.1
0.2
0.3
0.4
B
Strain (%)
Stre
ss (K
Pa)
0 5 10 15 20 250.00
0.05
0.10
0.15
C
Strain (%)
Stre
ss (K
Pa)
0 5 10 15 20 250.00
0.05
0.10
0.15
D
Strain (%)
Stre
ss (K
Pa)
0 5 10 15 20 250.0
0.1
0.2
0.3
0.4
E
Strain (%)
Stre
ss (K
Pa)
0 5 10 15 20 250.00
0.05
0.10
0.15
F
Strain (%)
Stre
ss (K
Pa)
0 5 10 15 20 250.00
0.05
0.10
0.15
G
Strain (%)
Stre
ss (K
Pa)
0 5 10 15 20 250.00
0.05
0.10
0.15
0.20
0.25
H
Figure 7-11. Before and After Stress Strain Analysis of Composite Scaffolds Immersed in SBF. Figures A and B represent calcium sulfate before and after respectively, Figures C and D represent PCL before and after, Figure E and F represent DBM before and after, and Figure G and H represent HA before and after. Y-axis (kPa).
In particular, we investigated the engineering stress strain behavior of the porous
composite scaffolds. The stress strain curve before immersion exhibits two distinct
different regions: a linear elastic region and a plastic region. As the strain increases, the
walls of the pores begin to buckle- which leads to a stress plateau, exhibited after the
linear elastic region. Comparing before and after immersion behavior, we can clearly
119
see that this plateau region is smoother and extends for a longer period before
immersion for all of the composite scaffolds. PCL, however, varied little in behavior
before and after immersion. Based on this data it would reason that the scaffolds,
initially, behaved in a manner consistent with its composite nature. Basically, 35%
calcium sulfate scaffolds took on the behavior of calcium sulfate. Initially, the curve of
the 35% calcium sulfate scaffolds exhibits a pattern consistent with that of a brittle
material. Yet, after immersion in SBF, and more importantly, loss of mass- its behavior
resembles that of a thermoplastic polymer (i.e. polycaprolactone).
Discussion
The purpose of this study was to determine the effects of adding Demineralized
Bone Matrix, Calcium Sulfate and Hydroxyapatite to the Polycaprolactone polymer. The
bulk of this work was conducted on analyzing formation of mineral on the surface of the
scaffold. The ability of an implant to bond with native bone in vivo is paramount to its
success as an effective bone substitute. According to Kokubo, we can predict the
behavior of a bone substitute in vivo by immersing it in SBF. We assessed mineral
formation on the scaffold through Alizarin Red S staining, Scanning Electron Microscopy
and X- ray Dispersive Spectroscopy. We also examined the mass loss and water
absorption of the various scaffolds.
High mass loss and water uptake was mostly seen in the 35% DBM and CS
scaffolds. This was not surprising, as DBM has a high collagen content and readily
absorbs water. Although calcium sulfate does not have high swelling properties, its
surface is prone to cracking- which can lead to significant mass loss. While we were
able to visually validate a “softening” of the scaffolds, we performed compression tests,
to quantitatively assess this “softening.” The test confirmed our assessment.
120
The plateau region of the stress-strain curve of the composite scaffolds after
immersion were not as smooth and displayed some unevenness previously not seen.
We can deduce that the addition of the fillers to the polycaprolactone polymer was the
likely source of this result. Comparing the ultimate compressive strengths (determined
from stress strain curve by applying the load until the scaffold was fractured) of the
scaffolds before and after immersion- there was a clear but consistent outcome; the
addition of the fillers produced a stiffer scaffold, but subsequent to immersion in SBF for
20 days, the composite scaffolds behaved like the softer polycaprolactone polymer
[Figure 7-12]. This result was more pronounced in scaffolds that lost the most mass
(35% Calcium Sulfate, 35% Demineralized Bone Matrix).
Detection of the mineral deposits on the scaffolds revealed newly mineralized
deposits. In Figure 7-5, stained calcium deposits (shown in red) were more prevalent on
the 35% DBM and 35% HA scaffolds. The 35% CS scaffold, along with the PCL
scaffold, did not stain for any mineral deposits. Positive red staining shows the presence
of calcium deposits. We further analyzed mineral deposits using SEM with EDS
analysis. All the composite scaffolds, to some degree, possessed signals for calcium
and phosphorous. Yet, it was still not definitive, that mineralization was occurring due to
immersion in SBF.
In order to definitively determine whether any new mineral deposits were being
formed on the scaffolds, we performed diffraction analysis. Unfortunately, due to the
elasticity of polycaprolactone, the scaffolds were unable to be analyzed as is- as the
protocol required finely ground material. Therefore, we analyzed mineralization of the
fillers (calcium sulfate, demineralized bone matrix, and hydroxyapatite) alone. Before
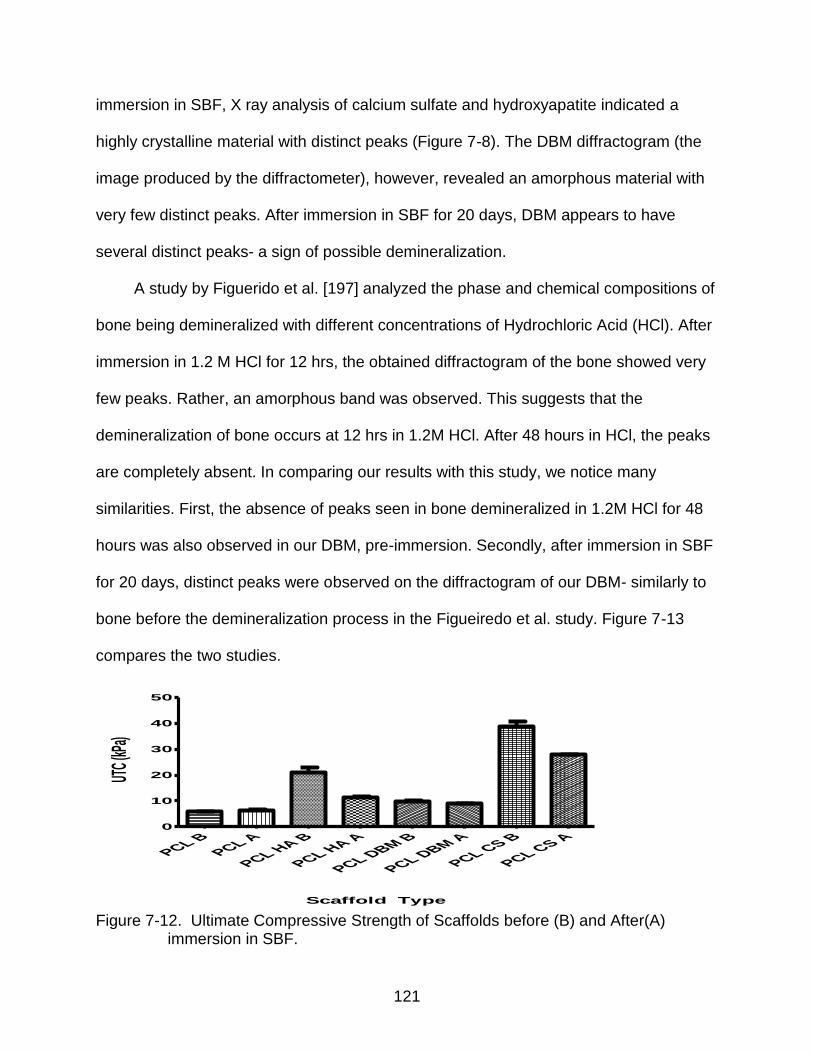
121
immersion in SBF, X ray analysis of calcium sulfate and hydroxyapatite indicated a
highly crystalline material with distinct peaks (Figure 7-8). The DBM diffractogram (the
image produced by the diffractometer), however, revealed an amorphous material with
very few distinct peaks. After immersion in SBF for 20 days, DBM appears to have
several distinct peaks- a sign of possible demineralization.
A study by Figuerido et al. [197] analyzed the phase and chemical compositions of
bone being demineralized with different concentrations of Hydrochloric Acid (HCl). After
immersion in 1.2 M HCl for 12 hrs, the obtained diffractogram of the bone showed very
few peaks. Rather, an amorphous band was observed. This suggests that the
demineralization of bone occurs at 12 hrs in 1.2M HCl. After 48 hours in HCl, the peaks
are completely absent. In comparing our results with this study, we notice many
similarities. First, the absence of peaks seen in bone demineralized in 1.2M HCl for 48
hours was also observed in our DBM, pre-immersion. Secondly, after immersion in SBF
for 20 days, distinct peaks were observed on the diffractogram of our DBM- similarly to
bone before the demineralization process in the Figueiredo et al. study. Figure 7-13
compares the two studies.
Scaffold Type
UTC (
kPa)
PCL BPCL A
PCL HA B
PCL HA A
PCL DBM B
PCL DBM A
PCL CS B
PCL CS A0
10
20
30
40
50
Figure 7-12. Ultimate Compressive Strength of Scaffolds before (B) and After(A)
immersion in SBF.
122
Contact angle is measured in terms of adsorption. The ability of a surface to
adsorb molecules onto its surface largely depends on the energy interactions of the
substrate (scaffold). Based on our analysis, it is clear that adding fillers to the
polycaprolactone polymer increased its wettability/hydrophilicity.
HA Scaffold> CS Scaffold> DBM Scaffold> PCL scaffold
This is notable, as mammalian cells are anchorage dependent and tend to favor
(in terms of adhesion and proliferation) modestly water-wettable or hydrophilic surfaces
exhibiting a water contact angle Θ<60°[42].
In vitro viability test demonstrated that the activity (proliferation) of the cells on the
PCL scaffold was significantly less than those on the composite scaffolds. As a matter
of fact, the highest cellular proliferation was found with the HA scaffold. It is interesting
to note that the order of the scaffolds in terms of higher cellular proliferation was parallel
to the order of hydrophilicity observed on the scaffolds. This suggests a relationship
between hydrophilicity of the surface of the scaffold and cell adhesion and proliferation.
Initially, both a 4 & 7 day AlamarBlue analysis was planned for the viability test.
However, the leaking of the CO2 tank prevented a 7 day reading. Future studies should
include both days.
Composite scaffolds of PCL-DBM, PCL-CS, PCL-HA and pure PCL scaffolds were
prepared by a solvent casting/porogen leaching technique. The composites were
shown to improve contact angle, bioactivity as well as mechanical properties when
compared to the pure PCL scaffolds. Mechanical analysis of the composite scaffolds
indicated a stiffer and “tougher” material. While this is encouraging, the ultimate
compressive strengths obtained (both before and after immersion) are far less than that
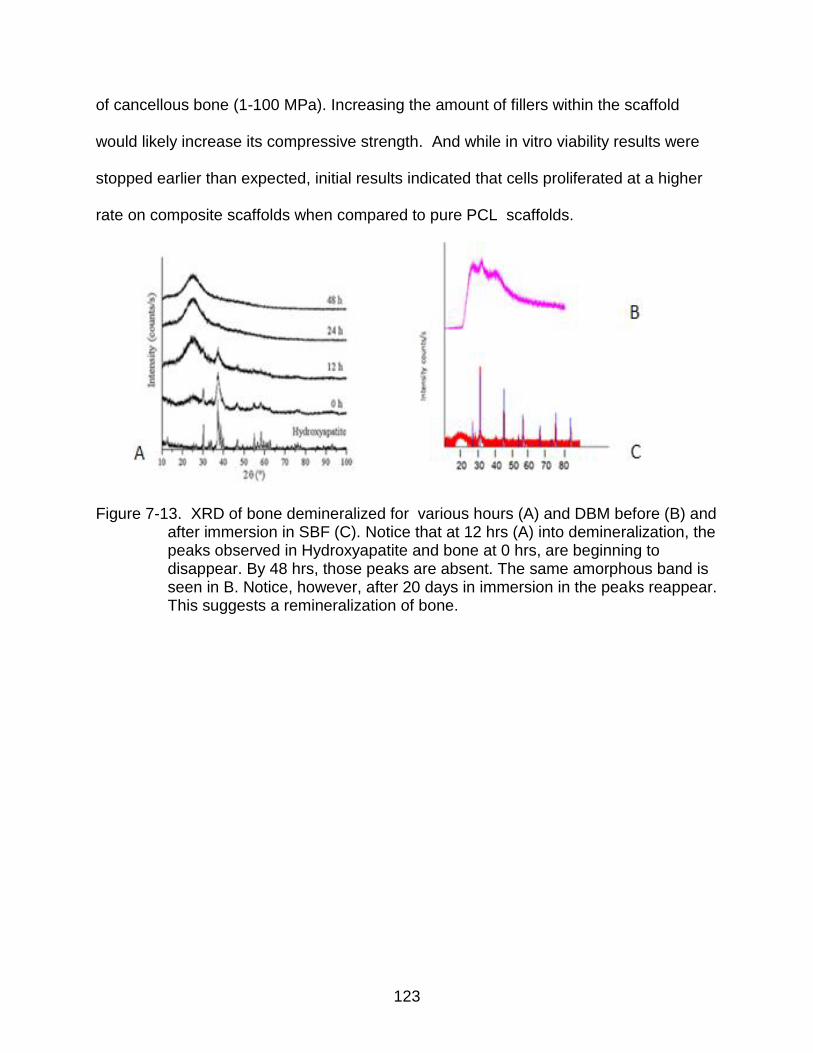
123
of cancellous bone (1-100 MPa). Increasing the amount of fillers within the scaffold
would likely increase its compressive strength. And while in vitro viability results were
stopped earlier than expected, initial results indicated that cells proliferated at a higher
rate on composite scaffolds when compared to pure PCL scaffolds.
Figure 7-13. XRD of bone demineralized for various hours (A) and DBM before (B) and
after immersion in SBF (C). Notice that at 12 hrs (A) into demineralization, the peaks observed in Hydroxyapatite and bone at 0 hrs, are beginning to disappear. By 48 hrs, those peaks are absent. The same amorphous band is seen in B. Notice, however, after 20 days in immersion in the peaks reappear. This suggests a remineralization of bone.

124
CHAPTER 8 ANALYSIS OF OSTEOINDUCTIVE ACTIVITY OF POROUS POLYCAPROLACTONE-
DEMINERALIZED BONE MATRIX SCAFFOLDS FOR BONE REPAIR: A PRELIMINARY STUDY
Introductory Remarks
In this study, myogenic C2C12 cells which have been shown to express
osteoblastic markers in the presence of BMPs were employed [154]. The aim of this
study was to investigate and analyze the behavior of C2C12 cells on porous and non-
porous PCL-DBM scaffolds. The behavior of these cells on porous and non-porous PCL
scaffolds is also reported. In particular, we wanted to evaluate the ability for these
scaffolds to support C2C12 cell adhesion, growth and expression.
We used Alamar Blue to detect cell viability and growth. ALP expression and total
calcium content were employed to detect osteoblastic expression. Surface
characterization of the scaffolds was visualized by Alizarin Red S staining and scanning
electron microscopy.
Scaffold Preparation
PCL (molecular weight 80 kDa) and the solvent, glacial acetic acid, were both
purchased from Sigma-Aldrich. Sieved sodium chloride particles (<100 μm) was
selected as the porogen. Demineralized Bone Matrix (mean size 687 μm) was
generously donated by Regeneration Technologies (RTIX, Alachua, FL).The size of the
DBM and sodium chloride particles were confirmed using laser diffraction with a
Beckman Coulter LS 1320 (Beckman Coulter Inc., Fullerton, CA). PCL/DBM composite
scaffolds were formed by using a solvent casting/porogen leaching technique.
Initially, PCL pellets were dissolved in glacial acetic acid at a concentration of 25%
(w/v) in a beaker and stirred at 65°C. Once the PCL was completely dissolved (1-2 hrs),

125
sodium chloride (NaCl) particles at 90% w/w of PCL were added. The polymer solution
was allowed to cool at room temperature for 30 minutes. Once the temperature of the
polymer solution reached 37°C, the polymer solution was cast into well culture
microplates (Corning Life Sciences).
Demineralized bone matrix (at 35% wt/wt of the PCL/Glacial Acetic Acid) was then
added to the PCL-DBM resulting scaffolds. The scaffolds were then placed in distilled
water to remove any remaining solvent and/or porogen. The scaffolds were freeze dried
overnight.
Sample Preparation
Four types of scaffolds were fabricated for this study. Porous and non- porous
35% DBM scaffolds and porous and non- porous PCL scaffold. The samples were cut
into 5 * 5 mm pieces and sterilized with an ethanol- PBS soaking sequence. The
samples were then kept in basal media overnight before cells were added.
Cell Culture
C2C12, murine myoblasts, were maintained in in Dulbecco’s modified Eagle’s
medium (DMEM), supplemented with 10% (v/v) fetal bovine serum and 5% (v/v) 10
U/ml penicillin/streptomycin at 5% CO2 and 37°. All cell culture reagents were bought
from Sigma-Aldrich. For experiments, all scaffolds were seeded with 1 * 10^4 per cm2
of scaffold surface and cultured in basal medium before and after seeding on scaffolds.
Media was changed twice every week. While seeding scaffolds with cells, initially an
aliquot of cell suspension was deposited on the scaffold. After 10 seconds, media was
added to the scaffold to completely immerse the scaffold in liquid. To induce mineral
formation by C2C12 cells onto the scaffolds, the basal media was replaced with
complete medium containing 10 mm b-Glycerophosphate (bGP) (Sigma-Aldrich, St.

126
Louis, MO) and 50 mg/ml ascorbic acid (Sigma Aldrich). This was done during the
seeding of the cells. Cells on the well plate (Corning Costar Corp.) were used for the
control.
Statistics
Three porous PCL and PCL-DBM scaffolds were each tested in two separate
experiments (Proliferation and Alkaline Phosphatase). For the quantification of
mineralization, three additional scaffolds (of both PCL and PCL-DBM) were used.
Nonporous scaffolds were used for the Alizarin Red S Staining as well as for SEM
microscopy. All statistical analysis was conducted using the GraphPad Instat program.
The data within each scaffold type was examined between time points and analyzed
using a one-way analysis of variance (ANOVA) with statistical significance at p<0.05.
Further, data comparing the scaffolds was examined using two- way analysis of
variance (ANOVA) with statistical significance at p<0.05. Post-hoc analysis was
conducted using the Tukey test. The values were expressed as the mean± standard
error (n=3).
Alkaline Phosphatase Activity (ALP)
Alkaline Phosphatase activity was measured following incubation of cells on the
scaffold after 10 days using an ALP kit (Millipore). The manufacturer’s protocol was
adapted to account for the scaffold. Briefly, scaffolds were dried on a clean paper
towel. The scaffolds were cut in half and then wet weight measurements were taken.
Each scaffold was placed in 15 ml conical tube and 2 steel balls and 2 mls cell lysis
solution was added to the tube. The scaffolds were then disintegrated using a vortexer
three times for 10 seconds. In between cycles, the tubes were placed on ice. The
contents of the tube were then transferred into a microcentrifuge tube and then
127
centrifuged at 300G for 10 min at 4°C. The ALP activity was then measured following
incubation of the transferred contents and 1 ml of p- nitrophenylphosphate substrate
solution. The production of p-nitrophenol in the presence of ALP was then measured by
monitoring light absorbance by the solution at 405 nm. Results are expressed in terms
of OD.
Alizarin Red S Staining
Mineralized nodules were stained using Alizarin Red S Staining on the scaffold
surfaces. Briefly, the specimens were washed three times with phosphate-buffered
saline (PBS), fixed in 3.7 vol % formaldehyde in PBS for 10 min, and stained with 1 mL
of 40 mM alizarin red staining, with the pH adjusted to 4.1, for 30 min. Excess and
unbound dye was rinsed off the scaffolds using DI water and blotting paper. The
scaffolds were then observed using an optical microscope (Olympus BX60 w/SPOT
Insight Digital Camera).
Calcium Assay
Calcium deposition was measured following incubation of cells on the scaffold
after 14 days. The manufacturer’s protocol was adapted to account for the scaffold.
Briefly, scaffolds were dried on a clean paper towel. The scaffolds were cut in half and
then wet weight measurements were taken. Each scaffold was placed in 15 ml conical
tube and 2 steel balls and 2 mls of 5% Trichloroacetic acid solution was added to the
tube. The scaffolds were then disintegrated using a vortexer three times for 10 seconds.
In between cycles, the tubes were placed on ice. The tubes were then incubated at
room temperature for 30 minutes. The contents of the tube were then transferred into a
microcentrifuge tube and then centrifuged at 300G for 10 min at 4°C. 2 mls of 5%
Trichloroacetic acid (TCA) was added to the original tube. Once again, the original tube

128
was incubated for 30 minutes and centrifuged at 300G for 10 min. The two
corresponding TCA solutions were then combined and transferred into a clean
microcentrifuge tube. The contents were then transferred to a 96 well plate and
absorbance was read at 550 nm.
SEM Analysis
The scaffolds were fixed in Karnovsky’s fixative (2% paraformaldehyde, 2.5%
glutaraldehyde and .2 M sodium cacodylate buffer) for 2 hours, and then post-fixed in
1% osmium tetroxide. The uncoated scaffolds were then examined using a field
emission SEM (S-HITACHI 3000N).
Results
Cultured C2C12 cells on 3-D scaffolds were analyzed for viability, proliferation and
osteoblastic expression. C2C12 cells on tissue cultured plate (TCP) were used as
control. Obviously, the two dimensionality and smooth surface of the culture plate is not
an accurate control when compared to the 3D scaffolds. Nevertheless, results are
reported. The progression of the C2C12 cells is illustrated in Figure 8-1.

129
Figure 8-1. C2C12 cells cultured on tissue culture plate. A. C2C12 cells at Day 1. B.
Day 4. Proliferation of cells on TCP. C. Day 10 Cells beginning to show osteoblastic morphology (rounded shape). D. Proliferation of C2C12 cells on Day 14.
Alkaline Phosphatase Expression
Compared to the PCL scaffold, ALP activity in the 35% DBM was significantly
higher. However, ALP activity in the 35% DBM scaffold compared to the cells cultured
on TCP was not. This suggests that cells proliferated at a higher rate on the 35% DBM
scaffold compared to the PCL scaffold. The results for the scaffolds are reported in
Figure 8-2.
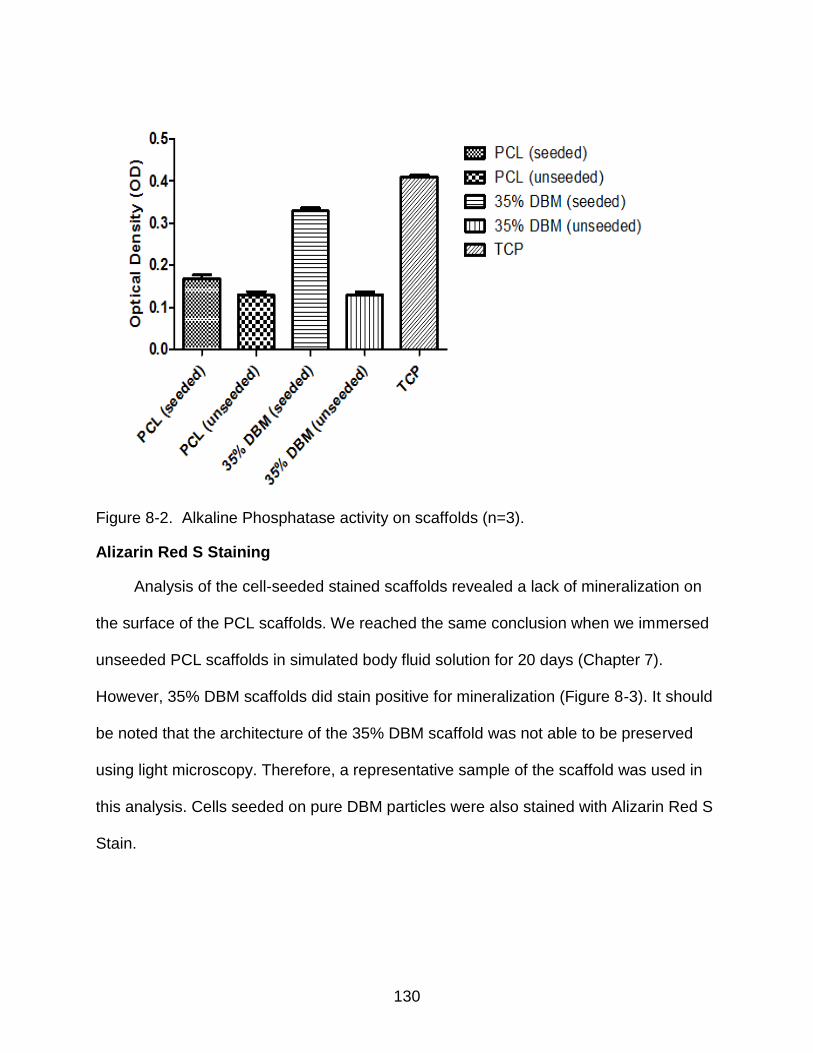
130
Figure 8-2. Alkaline Phosphatase activity on scaffolds (n=3).
Alizarin Red S Staining
Analysis of the cell-seeded stained scaffolds revealed a lack of mineralization on
the surface of the PCL scaffolds. We reached the same conclusion when we immersed
unseeded PCL scaffolds in simulated body fluid solution for 20 days (Chapter 7).
However, 35% DBM scaffolds did stain positive for mineralization (Figure 8-3). It should
be noted that the architecture of the 35% DBM scaffold was not able to be preserved
using light microscopy. Therefore, a representative sample of the scaffold was used in
this analysis. Cells seeded on pure DBM particles were also stained with Alizarin Red S
Stain.
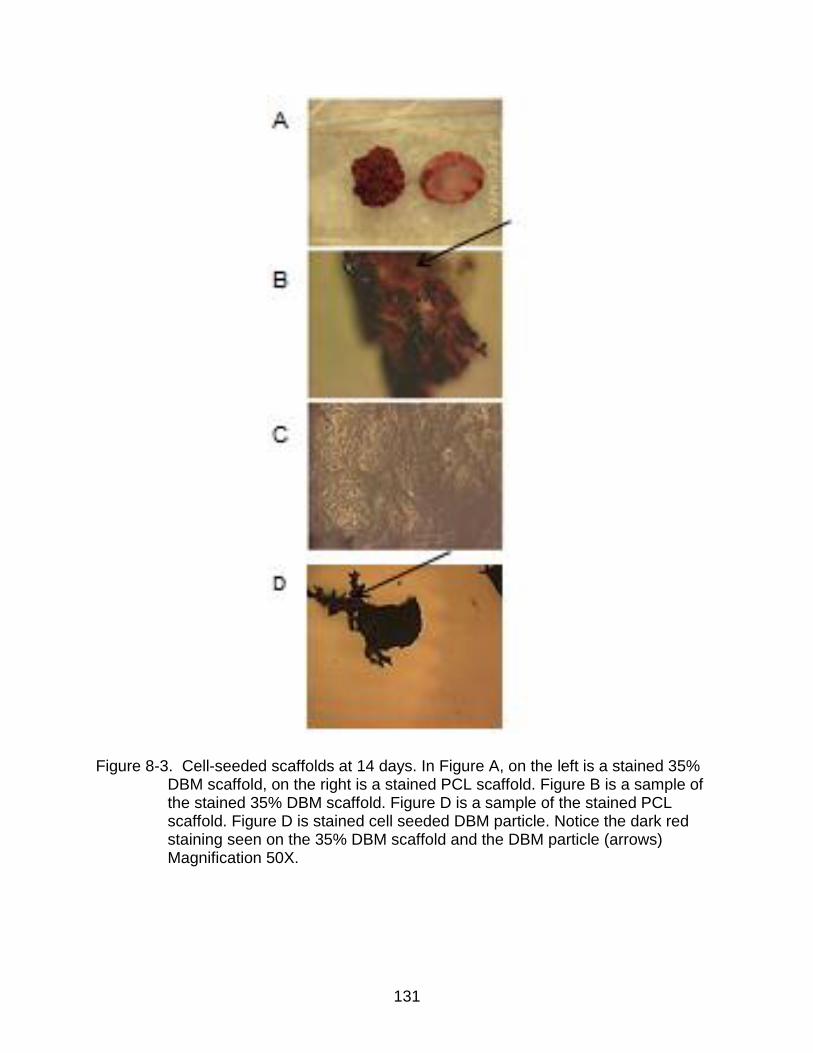
131
Figure 8-3. Cell-seeded scaffolds at 14 days. In Figure A, on the left is a stained 35% DBM scaffold, on the right is a stained PCL scaffold. Figure B is a sample of the stained 35% DBM scaffold. Figure D is a sample of the stained PCL scaffold. Figure D is stained cell seeded DBM particle. Notice the dark red staining seen on the 35% DBM scaffold and the DBM particle (arrows) Magnification 50X.
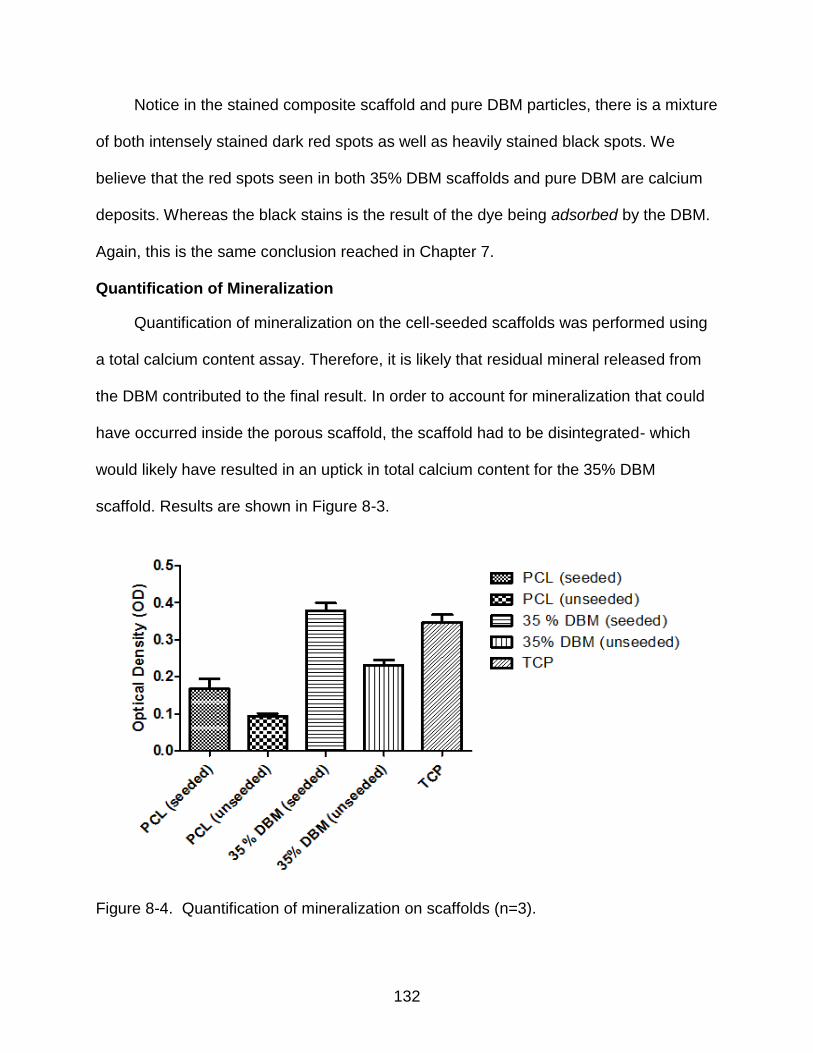
132
Notice in the stained composite scaffold and pure DBM particles, there is a mixture
of both intensely stained dark red spots as well as heavily stained black spots. We
believe that the red spots seen in both 35% DBM scaffolds and pure DBM are calcium
deposits. Whereas the black stains is the result of the dye being adsorbed by the DBM.
Again, this is the same conclusion reached in Chapter 7.
Quantification of Mineralization
Quantification of mineralization on the cell-seeded scaffolds was performed using
a total calcium content assay. Therefore, it is likely that residual mineral released from
the DBM contributed to the final result. In order to account for mineralization that could
have occurred inside the porous scaffold, the scaffold had to be disintegrated- which
would likely have resulted in an uptick in total calcium content for the 35% DBM
scaffold. Results are shown in Figure 8-3.
Figure 8-4. Quantification of mineralization on scaffolds (n=3).
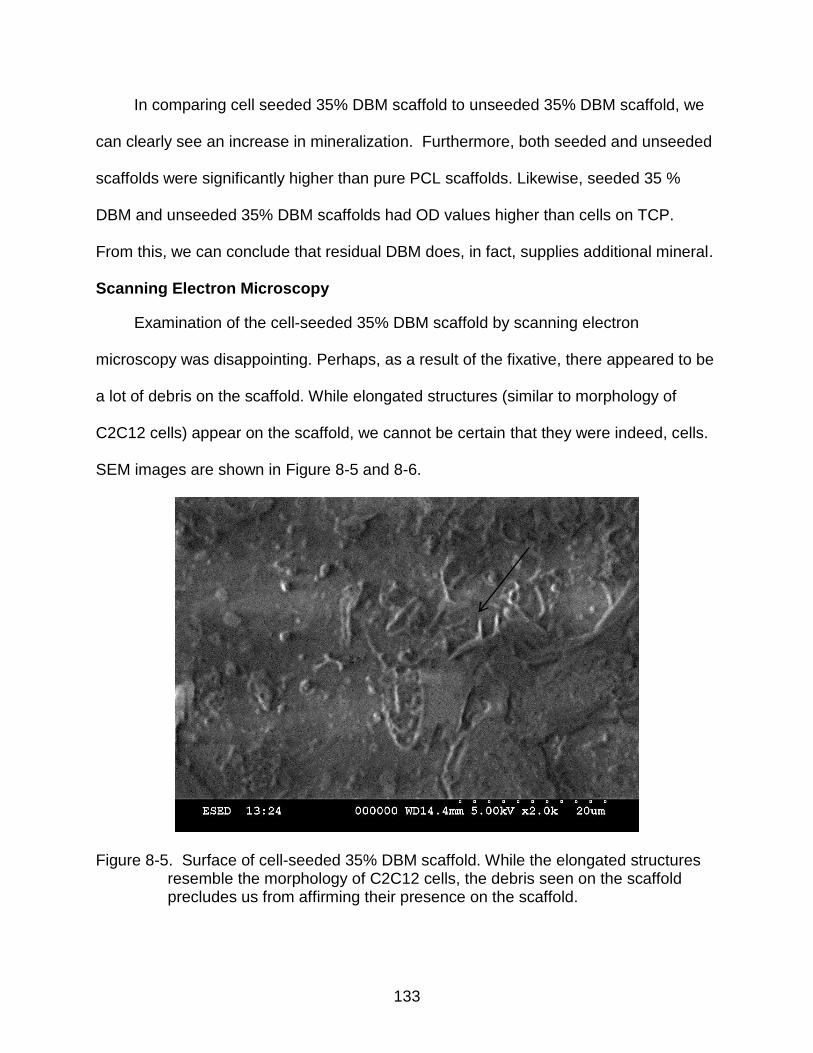
133
In comparing cell seeded 35% DBM scaffold to unseeded 35% DBM scaffold, we
can clearly see an increase in mineralization. Furthermore, both seeded and unseeded
scaffolds were significantly higher than pure PCL scaffolds. Likewise, seeded 35 %
DBM and unseeded 35% DBM scaffolds had OD values higher than cells on TCP.
From this, we can conclude that residual DBM does, in fact, supplies additional mineral.
Scanning Electron Microscopy
Examination of the cell-seeded 35% DBM scaffold by scanning electron
microscopy was disappointing. Perhaps, as a result of the fixative, there appeared to be
a lot of debris on the scaffold. While elongated structures (similar to morphology of
C2C12 cells) appear on the scaffold, we cannot be certain that they were indeed, cells.
SEM images are shown in Figure 8-5 and 8-6.
Figure 8-5. Surface of cell-seeded 35% DBM scaffold. While the elongated structures resemble the morphology of C2C12 cells, the debris seen on the scaffold precludes us from affirming their presence on the scaffold.

134
Figure 8-6. Surface of cell-seeded 35% DBM scaffold.
Discussion
An illuminating method to understanding the behavior of a biomaterial in vivo is to
observe the behavior of cells on the biomaterial in vitro. Obviously, the body being a
multifaceted system of organs- each replete with its own complex network, cannot be
wholly replicated. However, in vitro cell culture analysis allows us to closely mimic the
challenges found in the human body.
Bone regeneration is a complex process that involves many types of cells and
events that are interdependent. The construction of a bone substitute should take these
factors into account. In particular, like natural bone, this bone substitute should degrade
in vivo whilst promoting viable cells to lay new bone.

135
Our approach in this study was to design a composite that combined a
biodegradable polymer with an osteoconductive/osteoinductive material. The polymer,
polycaprolactone, has been employed for many tissue engineering products- such as
stents. The demineralized bone matrix, used in this study, has been shown to induce
ectopic bone formation in mouse models. However, its inferior handling properties make
it susceptible to migration upon implantation in vivo. The addition of DBM dispersed
throughout the PCL results in a scaffold that 1) reinforces and increases the
compressive strength of the scaffold 2) provides an additional source of mineral for the
remodeling process and 3) provides a cadre of bone morphogenic proteins that induce
pluripotent cells into an osteoblastic lineage.
We used a number of analytical assays to monitor and assess the behavior of the
cells on the various scaffolds. We used an Alkaline Phosphatase kit to quantify its
expression on the scaffolds. And mineralization on the scaffolds was assessed 2 weeks
post seeding on the scaffolds using both a stain and assay kit. ALP production is a mid-
marker expression of osteoblasts, typically detected around 10 days [90-93].
Mineralization, on the other hand, is typically detected on the 14th day.
In vitro testing of cellular behavior on TCP is not a complicated task. However, on
a 3D scaffold, it can be. In order to account for this, protocols for biochemical assays
had to be modified. A schematic of the process used in the biochemical assay for both
ALP production and total calcium content is shown in Fig 8-7.
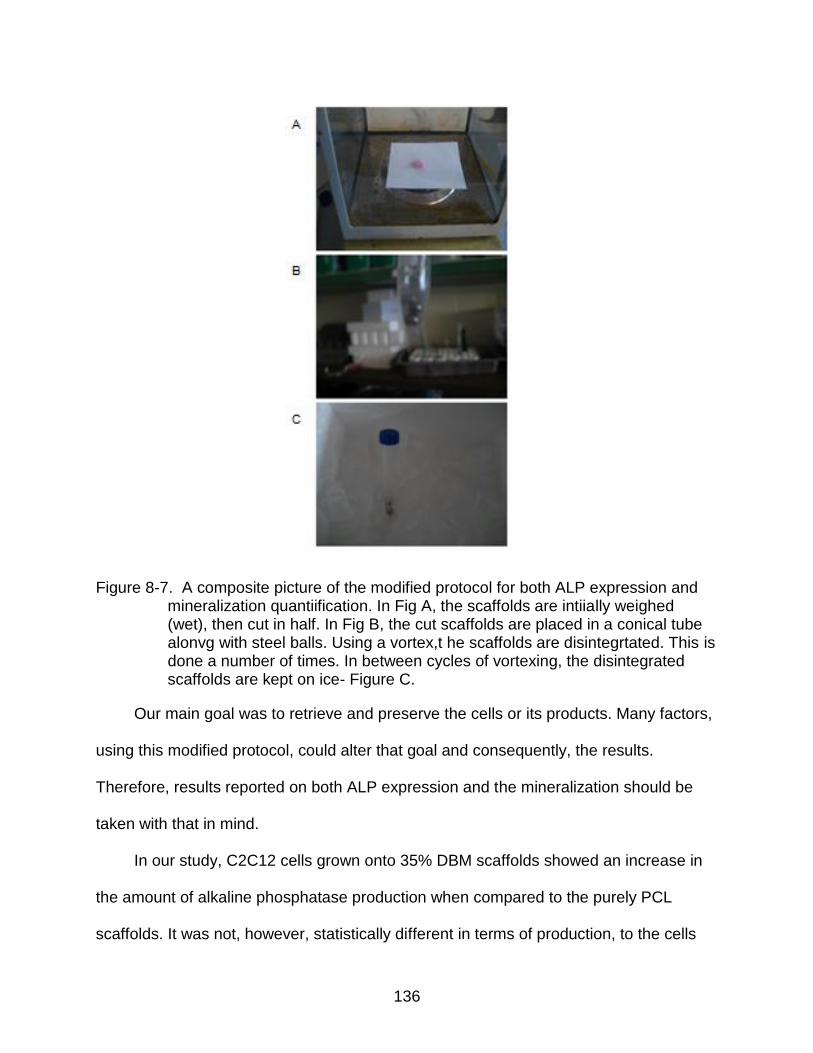
136
Figure 8-7. A composite picture of the modified protocol for both ALP expression and mineralization quantiification. In Fig A, the scaffolds are intiially weighed (wet), then cut in half. In Fig B, the cut scaffolds are placed in a conical tube alonvg with steel balls. Using a vortex,t he scaffolds are disintegrtated. This is done a number of times. In between cycles of vortexing, the disintegrated scaffolds are kept on ice- Figure C.
Our main goal was to retrieve and preserve the cells or its products. Many factors,
using this modified protocol, could alter that goal and consequently, the results.
Therefore, results reported on both ALP expression and the mineralization should be
taken with that in mind.
In our study, C2C12 cells grown onto 35% DBM scaffolds showed an increase in
the amount of alkaline phosphatase production when compared to the purely PCL
scaffolds. It was not, however, statistically different in terms of production, to the cells
137
cultured on TCP. In quantifying the mineralization of the cells on the scaffold, we
detected more mineralization (as noted by OD value) on 35% DBM versus pure PCL
scaffolds. It would be inaccurate, however, to ascribe total calcium content to cellular
production, rather than a combination of residual mineral left in the DBM and cellular
production. To account for this, we also report OD values for unseeded scaffolds.
Alizarin Red S Staining showed a mineral rich layer on the surface of 35% DBM
scaffolds. Little to no mineral formation was seen on the surface of the PCL scaffold.
Alizarin uptake is proportional to mineral formation, so it would reason that the addition
of DBM (in particularly, the residual calcium and phosphate ions) aided in the formation
of mineral on its surface.
The limitations of these methods, and subsequently its findings, are not lost on the
authors. A true comparison cannot be made between a 3D scaffold and a flat surface,
such as tissue culture plate. Secondly, the process of disintegrating the scaffolds can
provide inaccurate results. For example, in disintegrating the scaffolds, we found it
easier to disintegrate the composite scaffolds than the purely PCL scaffolds. The
rubbery, elastic nature of PCL prevented us from fully disintegrating the scaffold- as was
done for the composite scaffold. Furthermore, the addition of Glucocorticoids
(Dexamethasone in combination with ascorbic acid and beta-Glycerophosphate)
prevents us from solely identifying DBM as the singular source behind osteoinduction.
Lastly, our results would need to be confirmed using primary human osteoblasts.
C2C12 cells were chosen because they were pluripotent, capable of expression
osteoblastic markers and readily available.
138
To conclude, in this preliminary work, we sought to analyze and observe the
behavior of pluripotent C2C12 cells on a composite scaffold of the osteoconductive and
osteoinductive material, demineralized bone matrix, and the biodegradable polymer,
polycaprolactone. What we observed was that the C2C12 cells produced or expressed
osteoblastic markers more than the pure PCL scaffold. The findings of this study give
added weight to the theory that DBM can induce pluripotent cells into an osteoblastic
lineage.
139
CHAPTER 9 SUMMARY AND FUTURE DIRECTIONS
Introductory Remarks
Tissue Engineering combines living cells with a support structure that degrades in
vivo, leaving behind a 3D assembly that is functionally, structurally, and mechanically
equal to – or better than – the native tissue it replaced . Cell selection and material
selection are two key components for a successful tissue engineered replacement.
Designing, constructing, and optimizing those key components to maximize their
respective advantages is a challenge that will continue well beyond this dissertation.
The field of tissue engineering has come to serve as both the hope for patients with
bone related injuries and the inspiration for researchers to develop the next generation
of viable bone graft substitutes. Bone is a dynamic tissue that serves a biological,
chemical and mechanical purpose in vivo. Thus, the successful bone graft substitute
must account for all three factors.
Bone substitutes have been made from natural polymers such as chitosan and
coral to synthetic polymers, such as poly (lactide-co-glycolide) and polycaprolactone.
Nevertheless, consistent in these bone substitutes is the combination of a
biodegradable material and a biological additive- morphogenic proteins, growth factors
or cells. The complexity of bone renders the development of a complex bone substitute.
Plaster of Paris (calcium sulfate hemihydrate, CaSO4) has been used as a bone
substitute since 1892. Surprisingly, it is still being used today. Much work has been
done on the development of new composite designs that take into account all three
functions of bone- yet, more work is clearly needed. This is the motivation that drove the
work described in this dissertation.
140
The work, thus far, is heavily focused on the synthesis, characterization,
modification and in vitro degradation of the scaffold. A comparative analysis of the
effects of demineralized bone matrix, hydroxyapatite, and calcium sulfate on
polycaprolactone polymer is also presented. Finally, we discuss preliminary results on
the behavior of pluripotent C2C12 cells on our composite scaffold.
The broad hypothesis behind the construct of this composite scaffold was simple;
the combination of an osteoinductive/osteoconductive demineralized bone matrix
coupled with a biodegradable and biocompatible polymer would yield a scaffold capable
of encouraging and enhancing the formation of new bone in vivo even as the scaffold
degraded.
Synthesis, Characterization and In Vitro Evaluation of Composite Scaffolds
Initially, our work focused on the synthesis of the pure polycaprolactone scaffold
using a salt porogen technique. Analysis of the scaffolds using scanning electron
microscopy revealed an uneven, slightly porous scaffold that retained sodium chloride
particles. We sought to reduce the amount of sodium chloride through ultrasonication
and altering the washing sequence. Using SEM with EDS analysis, scaffolds sonicated
for 1 and 3 hours and those washed at 37°C and 45°C revealed little to no residual salt
particles. Those sonicated for a longer time or washed at a higher temperature were
characterized by higher residual sodium chloride particles, a lightly porous surface and
a gummy like appearance.
We further explored the physical and chemical characteristics of the scaffolds by
varying DBM content within the scaffold using mass loss, pH measurements, and
surface mineralization studies. In our degradation studies, the scaffolds were immersed
in SBF solution similar in ionic concentration to that of human plasma.

141
The mass of all scaffold types declined over the 7 week experiment; however,
some declined more than others. The mass of the 50% DBM declined by nearly 43%,
while those of the pure PCL scaffolds only declined by 7%. Since the DBM was only
physically blended into the scaffold, we expected a decline in scaffold mass. The pH of
the SBF solution for the composite scaffolds dipped slightly through the 7 week
experiment. The SBF solution that contained pure PCL scaffolds remained stable
throughout. It is possible that the fluctuations in the pH of the composite scaffolds, in
particular the 50% DBM scaffold, was a result of residual acidic solvent that possibly
remained in the scaffold.
Calcium deposits were observed on the composite scaffolds. According to
Kokubo, mineralization on the surface of the scaffold can be used to predict in vivo
behavior. We observed mineralization using both the Von Kossa Staining [Figure 6-5]
and SEM imaging [Figure 6-9]. It was particularly pronounced in the 35% and 50% DBM
scaffolds. While the 50% DBM scaffold theoretically contained more nucleation sites for
mineralization, no significant difference in mineralization on the 35% and 50% DBM
scaffolds was seen. There was, however, a lack of mineralization on both the PCL
polymer and the 25% DBM scaffold. This finding was affirmed with EDS analysis. While
the signals of calcium and phosphorous were higher for the 50% DBM scaffold, it was
not significantly different from that of the 35% DBM scaffold.
In Vitro Evaluation of the Effects of Adding Common Bone Void Fillers to a Polycaprolactone Scaffold
In Chapter 7, we compared the effects of adding common bone void fillers such as
hydroxyapatite (HA), calcium sulfate (CS) and demineralized bone matrix (DBM) to a
142
polycaprolactone (PCL) scaffold. Specifically, we examined the in vitro degradation and
reprecipitation behavior of the scaffolds after 20 days in simulated body fluid.
The hydrophobic surface of pure PCL scaffolds made it relatively impervious to
water absorption and mass loss. However, the swelling properties of the collagen in
DBM and the hydrophilic nature of the CS produced scaffolds with significant mass loss
(34 % and 56% respectively) and high water absorption rates (91 % and 47 %
respectively). The ultimate compressive strength of the calcium sulfate added scaffold
post immersion was reduced by nearly a third (28%) and the ultimate compressive
strength of the demineralized bone matrix added scaffold was reduced by 10%.
Detection of the mineral deposits on the scaffolds revealed newly mineralized
deposits on the all composite scaffolds. Figure 7-5 shows the stained calcium deposits
seen on the 35% DBM and 35% HA scaffolds, and to a lesser extent on the 35% CS
scaffolds. They were not seen on the pure PCL scaffolds. Further analysis of
mineralization using X ray diffraction before and after immersion in SBF revealed the
surface mineralization detected to be a result of calcium and phosphate binding- rather
than residual mineral within the fillers.
The potential for the composite scaffolds to support cellular activity was examined
by seeding C2C12 mouse muscle cells on the scaffolds and analyzing for cellular
proliferation. Using an AlamarBlue viability assay, proliferation of the cells on the PCL
scaffold was significantly less than those on the composite scaffolds. Furthermore, we
found a clear correlation between water contact angle and C2C12 proliferation: the
lower the contact angle (hydrophilicity), the higher the proliferation.
143
C2C12 Cell Proliferation and Differentiation on Composite Scaffolds
The influence of demineralized bone matrix in composite scaffolds on pluripotent
C2C12 cells were analyzed using Alkaline Phosphatase (ALP) expression, mineral
deposits on the scaffolds’ surface and total calcium content. Unseeded composite and
pure scaffolds were also analyzed for ALP expression and total calcium content in order
to account for residual mineral content left in the DBM. Analysis indicated that C2C12
cells produced or expressed osteoblastic markers more on the composite scaffolds than
the pure PCL scaffold.
Alkaline Phosphate activity was assessed at Day 10. Compared to the PCL
scaffold, ALP activity in the 35% DBM was significantly higher. However, ALP activity in
the 35% DBM scaffold compared to the cells cultured on TCP was not. This suggests
that cells proliferated at a higher rate on the 35% DBM scaffold compared to the PCL
scaffold. Removal of the cells and/or its products presented us with some challenges.
The scaffold had to be completely disintegrated using a fairly complex procedure
involving steel balls and centrifugation at high speeds. The elasticity of the scaffolds, in
particular the pure PCL scaffold, prevented the complete disintegration of the scaffold.
This possibly could have had a dampening effect on ALP analysis.
Analysis of the Alizarin Red stained scaffolds revealed a lack of new mineralization
on the surface of the cell seeded PCL scaffolds. We reached the same conclusion when
we immersed unseeded PCL scaffolds in simulated body fluid solution for 20 days
(Chapter 7). However, 35% DBM scaffolds did stain positive for new mineralization.
While the Alizarin Red staining was able to quantify new mineral formation on the
scaffold, it also heavily stained residual mineral from the 35% DBM scaffold. To account
for the non-specific staining, total calcium content was measured using both cell seeded
144
and unseeded scaffolds at Day 14. In comparing cell seeded 35% DBM scaffold to
unseeded 35% DBM scaffold, we can clearly see an increase in mineralization. Both
seeded and unseeded composite scaffolds were significantly higher than seeded and
unseeded PCL scaffolds.
Final Conclusions and Future Directions
While the preliminary work presented in this dissertation is encouraging, there are
a number of features of this scaffold that can be improved. Although the mechanical
properties of this scaffold are enough to handle and hold the very flaky DBM, it is not
sufficient for a weight bearing defect site. The addition of DBM could help in this regard.
Secondly, the immersion of scaffolds in SBF before cell seeding would aid in the
formation of bone by osteoblasts by providing additional ions for mineralization. We saw
in Chapter 6 that 35% DBM scaffolds immersed in SBF formed a layer mineralization on
its surface after 14 days in SBF. Furthermore, the effects of high temperatures on DBM
should be examined. Attempts were made to determine if DBM in extreme temperatures
(4°C and 65°C) lost or reduced its osteoinductive potential when compared to DBM at
room temperature. Unfortunately, the DBM incubated at high temperatures in media
produced bacterial spores and the experiment was stopped. Future work should
explore this topic.
Moving towards the gold standard of an autograft is the challenge of bone tissue
engineering. While great strides have been made, an aging population coupled with a
great number of soldiers returning home with bone related injuries sustained in battle-
the need for a viable and effective bone substitute has never been so high.

145
APPENDIX PROTOCOLS
Analytical Assay: Alkaline Phosphatase Activity
Cell lysis solution: Triton X-100, 0.2% (v/v) + 5 mM magnesium chloride in DI water
ALP kit
Sodium hydroxide solution, 0.2 M
Paper towel
Razor blade
Eppendorf tubes
Microcentrifuge tubes with screw cap, 2 ml
Steel balls
Parafilm
Analytical balance
MiniBeadBeater
Microcentrifuge
Microtitration plate
Microplate reader
Waterbath
1. Grow C2C12 cells on scaffolds in 12 well plates
2. Dry scaffolds on clean paper towel for 3 min.
3. Measure wet weight of the scaffolds. Cut scaffolds into halves and measure the wet
weight of halves.
4. Put each scaffold into a labeled Microcentrifuge tube.
5. Add 2 steel balls and 1 ml cell lysis solution per tube.
6. Disintegrate scaffold by using a MiniBeadBeater 3 times at 25,000 rpm for 10s.
Place on ice between cycles for cooling.
7. Transfer the content of the tube into a clean labeled tube without transferring the steel
balls.
8. Centrifuge at 300 g for 10 min at 4 C.
9. Transfer the supernate into a clean, labeled tube. Avoid destruction of the pellet.
10. Run ALP assay immediately.

146
Analytical Assay: Total Calcium
TCA 5%: trichloroacetic acid 5% (v/v) in DI water
Calcium standard 10 mg/dl
Calcium binding reagent
Calcium buffer reagent
Paper towel
Razor blade
Microcentrifuge tubes with screw cap, 2 ml
Steel balls
Parafilm
Analytical balance
MiniBeadBeater
Microcentrifuge
Microtiter plate
Microplate reader
Protocol:
1. Grow C2C12 cells on scaffolds in 12 well plates
2. Dry scaffolds on clean paper towel for 3 min.
3. Measure wet weight of the scaffolds. Cut scaffolds into halves and measure the wet
weight of halves.
4. Transfer each scaffold into a labeled Microcentrifuge tube.
5. Add 2 steel balls and 1 ml TCA 5% per tube.
6. Close tube firmly and wrap with Parafilm.
7. Disintegrate scaffold by using a MiniBeadBeater 3 times at 25,000 rpm for 10s.
Place on ice between cycles for cooling.
8. Incubate the tubes at room temperature for 20 min.
9. Centrifuge at 3000 g for 10 min at 4 C.
10. Pipette the supernate into a clean, labeled tube without disrupting the pellet.
11. Add 1 ml of TCA 5% into the tube with the steel balls.
12. Incubate the tubes at room temp for 30 min.
13. Combine the 2 corresponding TCA solutions.
14. Centrifuge at 3000g for 10 min.
15. Transfer supernate into clean, labeled tube without disrupting the pellet.
16. Run Calcium Assay as described.

147
LIST OF REFERENCES
1. Beller, G. 2010 The cost of our aging population. Journal of Nuclear Cardiology, 17(3), 345-346. (doi: 10.1007/s12350-010-9234-2)
2. Burg, K. J. L., Porter, S., & Kellam, J. F. 2000 Biomaterial developments for bone tissue engineering. Biomaterials, 21(23), 2347-2359. (doi: 10.1016/s0142-9612(00)00102-2)
3. Laurie, S. W., Kaban, L. B., Mulliken, J. B., & Murray, J. E. 1984 Donor-site morbidity after harvesting rib and iliac bone. Plastic and Reconstructive Surgery, 73(6), 933-938.
4. Paderni, S., Terzi, S., & Amendola, L. 2009 Major bone defect treatment with an osteoconductive bone substitute. Musculoskeletal Surgery, 93(2), 89-96. (doi: 10.1007/s12306-009-0028-0)
5. Arrington, E. D., Smith, W. J., Chambers, H. G., Bucknell, A. L., & Davino, N. A. 1996 Complications of Iliac Crest Bone Graft Harvesting. Clinical Orthopaedics and Related Research, 329, 300-309.
6. Sowers, M. R., Clark, M. K., Hollis, B., Wallace, R. B., & Jannausch, M. 1992 Radial bone mineral density in pre- and perimenopausal women: A prospective study of rates and risk factors for loss. Journal of Bone and Mineral Research, 7(6), 647-657. (doi: 10.1002/jbmr.5650070609)
7. Fatayerji, D., & Eastell, R. 1999 Age-Related Changes in Bone Turnover in Men. Journal of Bone and Mineral Research, 14(7), 1203-1210. (doi: 10.1359/jbmr.1999.14.7.1203)
8. Teitelbaum, S. L. 2000 Bone Resorption by Osteoclasts. Science, 289(5484), 1504-1508. (doi:10.1126/science.289.5484.1504)
9. Ducy, P., Schinke, T., & Karsenty, G. 2000 The Osteoblast: A Sophisticated Fibroblast under Central Surveillance. Science, 289(5484), 1501-1504. (doi: 10.1126/science.289.5484.1501)
10. Rodan, G. A. 1992 Introduction to bone biology. Bone, 13, Supplement 1(0), S3-S6. (doi: 10.1016/s8756-3282(09)80003-3)
11. Kearney, J. N., Bojar, R., & Holland, K. T. 1993 Ethylene oxide sterilisation of allogenic bone implants. Clinical Materials, 12(3), 129-135. (doi: 10.1016/0267-6605(93)90063-d)
12. Zhang, Q., Cornu, O., & Delloye, C. 1997 Ethylene oxide does not extinguish the osteoinductive capacity of demineralized bone: A reappraisal in rats. Acta Orthopaedica, 68(2), 104-108. (doi:10.3109/17453679709003989 )
148
13. Haimi, S., Vienonen, A., Hirn, M., Pelto, M., Virtanen, V., & Suuronen, R. 2008 The effect of chemical cleansing procedures combined with peracetic acid–ethanol sterilization on biomechanical properties of cortical bone. Biologicals, 36(2), 99-104.( doi: 10.1016/j.biologicals.2007.06.001)
14. Woodard, J. R., Hilldore, A. J., Lan, S. K., Park, C. J., Morgan, A. W., Eurell, J. A. C., Wagoner Johnson, A. J. 2007 The mechanical properties and osteoconductivity of hydroxyapatite bone scaffolds with multi-scale porosity. Biomaterials, 28(1), 45-54. (doi: 10.1016/j.biomaterials.2006.08.021)
15. Marie, P. 1997 Growth factors and bone formation in osteoporosis: roles for IGF-I and TGF-beta. Revue du rhumatisme (English ed.), 64(1), 44-53.
16. Shea, L. D., Wang, D., Franceschi, R. T., & Mooney, D. J. 2000 Engineered bone development from a pre-osteoblast cell line on three-dimensional scaffolds. Tissue engineering, 6(6), 605-617.
17. Yang, X., Tare, R. S., Partridge, K. A., Roach, H. I., Clarke, N. M. P., Howdle, S. M.,Oreffo, R. O. C. 2003 Induction of Human Osteoprogenitor Chemotaxis, Proliferation, Differentiation, and Bone Formation by Osteoblast Stimulating Factor-1/Pleiotrophin: Osteoconductive Biomimetic Scaffolds for Tissue Engineering. Journal of Bone and Mineral Research, 18(1), 47-57. (doi: 10.1359/jbmr.2003.18.1.47)
18. Kenley, R. A., Yim, K., Abrams, J., Ron, E., Turek, T., Marden, L. J., & Hollinger, J. O. 1993 Biotechnology and Bone Graft Substitutes. Pharmaceutical Research, 10(10), 1393-1401. (doi: 10.1023/a:1018902720816)
19. Yeong, W.-Y., Chua, C.-K., Leong, K.-F., & Chandrasekaran, M. 2004 Rapid prototyping in tissue engineering: challenges and potential. Trends in Biotechnology, 22(12), 643-652. (doi: 10.1016/j.tibtech.2004.10.004)
20. Borenstein, J. T., Terai, H., King, K. R., Weinberg, E. J., Kaazempur-Mofrad, M. R., & Vacanti, J. P. 2002 Microfabrication Technology for Vascularized Tissue Engineering. Biomedical Microdevices, 4(3), 167-175. (doi: 10.1023/a:1016040212127)
21. Friedman, E. A., & Friedman, A. L. 2006 Payment for donor kidneys: Pros and cons. Kidney Int, 69(6), 960-962.
22. Griffith, L. G., & Naughton, G. 2002 Tissue Engineering--Current Challenges and Expanding Opportunities. Science, 295(5557), 1009-1014. (doi: 10.1126/science.1069210)
23. Lendeckel, S., Jödicke, A., Christophis, P., Heidinger, K., Wolff, J., Fraser, J. K., Howaldt, H.-P. 2004 Autologous stem cells (adipose) and fibrin glue used to treat widespread traumatic calvarial defects: case report. Journal of Cranio-Maxillofacial Surgery, 32(6), 370-373. (doi: 10.1016/j.jcms.2004.06.002)
149
24. Kemp, P. 2005 Cell therapy – back on the up-curve. Regenerative Medicine, 1(1), 9-14.( doi: 10.2217/17460751.1.1.9)
25. Ryan, J., Barry, F., Murphy, J., & Mahon, B. 2005 Mesenchymal stem cells avoid allogeneic rejection. Journal of Inflammation, 2(1), 1-11. (doi: 10.1186/1476-9255-2-8 )
26. Hutmacher, D. W. 2000 Scaffolds in tissue engineering bone and cartilage. Biomaterials, 21(24), 2529-2543. (doi: 10.1016/s0142-9612(00)00121-6)
27. Rai, B., Teoh, S. H., Hutmacher, D. W., Cao, T., & Ho, K. H. 2005 Novel PCL-based honeycomb scaffolds as drug delivery systems for rhBMP-2. Biomaterials, 26(17), 3739-3748. (doi: 10.1016/j.biomaterials.2004.09.052)
28. Eppley, B. L., Pietrzak, W. S., & Blanton, M. W. 2005 Allograft and Alloplastic Bone Substitutes: A Review of Science and Technology For the Craniomaxillofacial Surgeon. Journal of Craniofacial Surgery, 16(6), 981-989. (doi: 910.1097/1001.scs.0000179662.0000138172.dd.)
29. Burchardt, H. 1983 The biology of bone graft repair. Clinical Orthopaedics and Related Research 174, 28-42.
30. Schwartz, H. E., Matava, M. J., Proch, F. S., Butler, C. A., Ratcliffe, A., Levy, M., & Butler, D. L. 2006 The Effect of Gamma Irradiation on Anterior Cruciate Ligament Allograft Biomechanical and Biochemical Properties in the Caprine Model at Time Zero and at 6 Months After Surgery. The American Journal of Sports Medicine, 34(11), 1747-1755. (doi: 10.1177/0363546506288851)
31. Kearney, J. N. 2005 Guidelines on processing and clinical use of skin allografts. Clinics in Dermatology, 23(4), 357-364. (doi: 10.1016/j.clindermatol.2004.07.018)
32. Nguyen, H., Morgan, D. A. F., & Forwood, M. R. 2011 Validation of 11 kGy as a Radiation Sterilization Dose for Frozen Bone Allografts. The Journal of Arthroplasty, 26(2), 303-308.(doi: 10.1016/j.arth.2010.03.032)
33. Cook, P. 2011 What Constitutes Adequate Public Consultation? Xenotransplantation Proceeds in Australia. Journal of Bioethical Inquiry, 8(1), 67-70. (doi: 10.1007/s11673-010-9269-8.)
34. Miron, R. J., Hedbom, E., Saulacic, N., Zhang, Y., Sculean, A., Bosshardt, D. D., & Buser, D. 2011 Osteogenic Potential of Autogenous Bone Grafts Harvested with Four Different Surgical Techniques. Journal of Dental Research, 90(12), 1428-1433. (doi: 10.1177/0022034511422718)
35. Sipe, J. D. 2002 Tissue Engineering and Reparative Medicine. Annals of the New York Academy of Sciences, 961(1), 1-9. (doi: 10.1111/j.1749-6632.2002.tb03040.x)

150
36. Nair, L. S., & Laurencin, C. T. 2007 Biodegradable polymers as biomaterials. Progress in Polymer Science, 32(8–9), 762-798. (doi: 10.1016/j.progpolymsci.2007.05.017)
37. Sonia, T. A., & Sharma, C. P. 2012 An overview of natural polymers for oral insulin delivery. Drug Discovery Today, 17(13–14), 784-792. (doi: 10.1016/j.drudis.2012.03.019)
38. Wu, K. J., & Odom, R. W. (1998). Peer Reviewed: Characterizing Synthetic Polymers by MALDI MS. Analytical Chemistry, 70(13), 456A-461A. (doi: 10.1021/ac981910q )
39. Piskin, E. 1995 Biodegradable polymers as biomaterials. Journal of Biomaterials Science, Polymer Edition, 6(9), 775-795. (doi: 10.1163/156856295x00175)
40. Coombes, A. G. A., & Meikle, M. C. 1994 Resorbable synthetic polymers replacements for bone graft. Clinical Materials, 17(1), 35-67. (doi: 10.1016/0267-6605(94)90046-9)
41. Tayalia, P., & Mooney, D. J. 2009 Controlled Growth Factor Delivery for Tissue Engineering. Advanced Materials, 21(32-33), 3269-3285. (doi: 10.1002/adma.200900241)
42. Takezawa, T. 2003 A strategy for the development of tissue engineering scaffolds that regulate cell behavior. Biomaterials, 24(13), 2267-2275.( doi: 10.1016/s0142-9612(03)00038-3)
43. Oh, S. H., Park, I. K., Kim, J. M., & Lee, J. H. 200 In vitro and in vivo characteristics of PCL scaffolds with pore size gradient fabricated by a centrifugation method. Biomaterials, 28(9), 1664-1671. (doi: 10.1016/j.biomaterials.2006.11.024 )
44. Chen, V. J., & Ma, P. X. 2004 Nano-fibrous poly(l-lactic acid) scaffolds with interconnected spherical macropores. Biomaterials, 25(11), 2065-2073. (doi: 10.1016/j.biomaterials.2003.08.058)
45. Karande, T. S., Ong, J. L., & Agrawal, C. M. 2004 Diffusion in Musculoskeletal Tissue Engineering Scaffolds: Design Issues Related to Porosity, Permeability, Architecture, and Nutrient Mixing. Annals of Biomedical Engineering, 32(12), 1728-1743. (doi: 10.1007/s10439-004-7825-2)
46. Yang, Y., Bolikal, D., Becker, M. L., Kohn, J., Zeiger, D. N., & Simon, C. G. 2008 Combinatorial Polymer Scaffold Libraries for Screening Cell-Biomaterial Interactions in 3D. Advanced Materials, 20(11), 2037-2043. (doi: 10.1002/adma.200702088)
151
47. Pham, D. T., & Gault, R. S. 1998 A comparison of rapid prototyping technologies. International Journal of Machine Tools and Manufacture, 38(10–11), 1257-1287. (doi: 10.1016/s0890-6955(97)00137-5)
48. M K Sah, J Sadanand and K Pramanik. Computational Approaches in Tissue Engineering. International Journal of Computer Applications 27(4), 13-20.
49. Hutmacher, D. W., Sittinger, M., & Risbud, M. V. 2004 Scaffold-based tissue engineering: rationale for computer-aided design and solid free-form fabrication systems. Trends in Biotechnology, 22(7), 354-362.( doi: 10.1016/j.tibtech.2004.05.005)
50. Chen, Z., Li, D., Lu, B., Tang, Y., Sun, M., & Xu, S. 2005 Fabrication of osteo-structure analogous scaffolds via fused deposition modeling. Scripta Materialia, 52(2), 157-161. (doi: 10.1016/j.scriptamat.2004.08.006)
51. Hou, Q., Grijpma, D. W., & Feijen, J. 2003 Porous polymeric structures for tissue engineering prepared by a coagulation, compression moulding and salt leaching technique. Biomaterials, 24(11), 1937-1947. (doi: 10.1016/s0142-9612(02)00562-8)
52. Buckwalter, J. A., Glimcher, M. J., Cooper, R. R., & Recker, R. 1996 Bone biology. II: Formation, form, modeling, remodeling, and regulation of cell function. Instructional course lectures, 45, 387-399.
53. Gimble, J., & Nuttall, M. 2004 Bone and fat. Endocrine, 23(2), 183-188. (doi: 10.1385/endo:23:2-3:183)
54. Meier, D. E., Orwoll, E. S., & Jones, J. M. 1984 Marked disparity between trabecular and cortical bone loss with age in healthy men. Measurement by vertebral computed tomography and radial photon absorptiometry. Annals of internal medicine, 5, 605-612.
55. Hill, P. A. 1998 Bone remodelling. British journal of orthodontics, 25(2), 101-107.
56. Ecarot-Charrier, B., Glorieux, F. H., van der Rest, M., & Pereira, G. 1983 Osteoblasts isolated from mouse calvaria initiate matrix mineralization in culture. The Journal of Cell Biology, 96(3), 639-643.( doi: 10.1083/jcb.96.3.639)
57. Heinegård, D., & Oldberg, A. 1989. Structure and biology of cartilage and bone matrix noncollagenous macromolecules. The FASEB Journal, 3(9), 2042-2051.
58. Osaka, A., Miura, Y., Takeuchi, K., Asada, M., & Takahashi, K. 1991 Calcium apatite prepared from calcium hydroxide and orthophosphoric acid. Journal of Materials Science: Materials in Medicine, 2(1), 51-55. (doi: 10.1007/bf00701687)
152
59. Clarke, B. 2008 Normal Bone Anatomy and Physiology Clinical Journal of the American Society of Nephrology 3 (Supplement 3), S131-S13. (doi: 10.2215/cjn.04151206)
60. Parfitt, A. 1984 The cellular basis of bone remodeling: The quantum concept reexamined in light of recent advances in the cell biology of bone. Calcified Tissue International, 36(0), S37-S45. (doi: 10.1007/bf02406132.)
61. Kogianni, G., & Noble, B. 2007 The biology of osteocytes. Current Osteoporosis Reports, 5(2), 81-86. (doi: 10.1007/s11914-007-0007-z)
62. Aarden, E. M., Nijweide, P. J., & Burger, E. H. 1994 Function of osteocytes in bone. Journal of Cellular Biochemistry, 55(3), 287-299. (doi: 10.1002/jcb.240550304)
63. Franz-Odendaal, T. A., Hall, B. K., & Witten, P. E. 2006 Buried alive: How osteoblasts become osteocytes. Developmental Dynamics, 235(1), 176-190. (doi: 10.1002/dvdy.20603)
64. Miller, S. C. 1989 Bone lining cells: structure and function. Scanning microscopy, 3(3), 953-960; Discussion 960-951.
65. Miller, S., & Jee, W. 1987 The bone lining cell: A distinct phenotype?. Calcified Tissue International, 41(1), 1-5. (doi: 10.1007/bf02555122)
66. Islam, A., Glomski, C., & Henderson, E. S. 1990 Bone lining (endosteal) cells and hematopoiesis: A light microscopic study of normal and pathologic human bone marrow in plastic-embedded sections. The Anatomical Record, 227(3), 300-306. (doi: 10.1002/ar.1092270304)
67. Boyce, B. F., Yao, Z., Zhang, Q., Guo, R., Lu, Y. A. N., Schwarz, E. M., & Xing, L. 2007 New Roles for Osteoclasts in Bone. Annals of the New York Academy of Sciences, 1116(1), 245-254. (doi: 10.1196/annals.1402.084)
68. Lorenzo, J. A. 2011 Do osteoclasts have dual roles: Bone resorption and antigen presentation?. IBMS BoneKEy, 8(1), 37-40. (10.1138/20110488)
69. Blair, H. C., Kahn, A. J., Crouch, E. C., Jeffrey, J. J., & Teitelbaum, S. L. 1986 Isolated osteoclasts resorb the organic and inorganic components of bone. The Journal of Cell Biology, 102(4), 1164-1172.( doi: 10.1083/jcb.102.4.1164)
70. Murphy, G. and J. J. Reynolds 2003 Extracellular Matrix Degradation. Connective Tissue and Its Heritable Disorders pp. 343-384. New York, New York: John Wiley & Sons

153
71. Neutzsky-Wulff, A., Sorensen, M., Kocijancic, D., Leeming, D., Dziegiel, M., Karsdal, M., & Henriksen, K. 2010 Alterations in osteoclast function and phenotype induced by different inhibitors of bone resorption - implications for osteoclast quality. BMC Musculoskeletal Disorders, 11(1), 109.
72. Rosenzweig, A. and R. J. Pignolo 2011 Osteobiology of Aging: Fractures in the Elderly, pp. 3-42. New York, New York: Humana Press.
73. Long, M., & Rack, H. J. 1998 Titanium alloys in total joint replacement—a materials science perspective. Biomaterials, 19(18), 1621-1639. (doi: 10.1016/s0142-9612(97)00146-4)
74. Galante, J., Rostoker, W., & Ray, R. D. 1970. Physical properties of trabecular bone Calcified Tissue International, 5(1), 236-246.
75. Cummine, J., & Nade, S. 1977 Osteogenesis after bone and bone-marrow transplantation: I. Studies with combined myelo-osseous grafts in the guinea pig. Acta Orthopaedica, 48(1), 15-24. (doi: 10.3109/17453677708985105)
76. Tanaka, Y., Nakayamada, S., & Okada, Y. 2005 Osteoblasts and osteoclasts in bone remodeling and inflammation. Current drug targets. Inflammation and allergy, 4(3), 325-328.
77. Mosekilde, L. 2000 Age-related changes in bone mass, structure, and strength - effects of loading. Zeitschrift für Rheumatologie, 59(7), I1-I9. (doi: 10.1007/s003930070031 )
78. Barrère, F., van Blitterswijk, C. A., & de Groot, K. 2006 Bone regeneration: molecular and cellular interactions with calcium phosphate ceramics. International Journal of Nanomedicine, 1(3), 317-332.
79. Manolagas, S. C. 1999 Editorial: Cell Number Versus Cell Vigor—What Really Matters to a Regenerating Skeleton? Endocrinology, 140(10), 4377-4381. (doi: 10.1210/en.140.10.4377)
80. Parfitt, A. M. 2002 Targeted and nontargeted bone remodeling: relationship to basic multicellular unit origination and progression. Bone, 30(1), 5-7.
81. Jilka, R. L. 2003 Biology of the basic multicellular unit and the pathophysiology of osteoporosis. Medical and Pediatric Oncology, 41(3), 182-185. (doi: 10.1002/mpo.10334)
82. Manolagas, S. C., & Jilka, R. L. 1995 Bone Marrow, Cytokines, and Bone Remodeling — Emerging Insights into the Pathophysiology of Osteoporosis. New England Journal of Medicine, 332(5), 305-311. (doi:10.1056/NEJM199502023320506)
154
83. Mundy, G. R. 1995 Bone remodeling and its disorders pp. 21-23. London, United Kingdom Taylor and Francis.
84. Raisz, L. G. 1999 Physiology and Pathophysiology of Bone Remodeling. Clinical Chemistry, 45(8), 1353-1358.
85. Vaes, G. 1988 Cellular biology and biochemical mechanism of bone resorption. A review of recent developments on the formation, activation, and mode of action of osteoclasts. Clinical Orthopaedics and Related Research 231, 239-271.
86. Dodds, R. A., Connor, J. R., James, I. E., Lee Rykaczewski, E., Appelbaum, E., Dul, E., & Gowen, M. 1995 Human osteoclasts, not osteoblasts, deposit osteopontin onto resorption surfaces: An in vitro and ex vivo study of remodeling bone. Journal of Bone and Mineral Research, 10(11), 1666-1680. (doi: 10.1002/jbmr.5650101109)
87. Cowles, E. A., M. E. DeRome, et al. 1998 Mineralization and the Expression of Matrix Proteins During In Vivo Bone Development Calcified Tissue International, 62(1), 74-82. (doi: 10.1007/s00223990039)
88. Miyazawa, K. 1989 Immunological investigation of intestinal, liver, kidney, bone, placental and serum alkaline phosphatase in cattle. Japanese journal of veterinary science, 51(2), 309-314.
89. Seibel, M. J. 2000 Molecular Markers of Bone Turnover: Biochemical, Technical and Analytical Aspects. Osteoporosis International, 11(18), S18-S29. (doi: 10.1007/s001980070003)
90. Sabokbar, A., Millett, P. J., Myer, B., & Rushton, N. 1994 A rapid, quantitative assay for measuring alkaline phosphatase activity in osteoblastic cells in vitro. Bone and Mineral, 27(1), 57-67. (doi: 10.1016/s0169-6009(08)80187-0.)
91. Anderson, H. C., Hsu, H. H., Morris, D. C., Fedde, K. N., & Whyte, M. P. 1997 Matrix vesicles in osteomalacic hypophosphatasia bone contain apatite-like mineral crystals. Am J Pathol., 151(6, 1555–1561.
92. Beck, G. R. (2003). Inorganic phosphate as a signaling molecule in osteoblast differentiation. Journal of Cellular Biochemistry, 90(2), 234-243. (doi: 10.1002/jcb.10622)
93. Gorter de Vries, I., Quartier, E., Boute, P., Wisse, E., & Coomans, D. 1987 Immunocytochemical Localization of Osteocalcin in Developing Rat Teeth. Journal of Dental Research, 66(3), 784-790. (doi:10.1177/00220345870660031601)
94. Butler, W. T. 1989 The Nature and Significance of Osteopontin. Connective Tissue Research, 23(2-3), 123-136. (doi:10.3109/03008208909002412)

155
95. Eriksen, E. F., Brixen, K., & Charles, P. 1995 New markers of bone metabolism: clinical use in metabolic bone disease. European Journal of Endocrinology, 132(3), 251-263. (doi:0.1530/eje.0.1320251)
96. Butler WT, Ridall AL, McKee MD. 1996 Osteopontin. Principles of Bone Biology pp. 167–182. San Diego, CA: Academic Press
97. Gerstenfeld, L. C., & Shapiro, F. D. 1996 Expression of bone-specific genes by hypertrophic chondrocytes: Implications of the complex functions of the hypertrophic chondrocyte during endochondral bone development. Journal of Cellular Biochemistry, 62(1), 1-9. (doi: 10.1002/(sici)1097-4644(199607)62:1<1::aid-jcb1>3.0.co;2-x)
98. Fujisawa, K., & Kuboki, Y. 1992 Affinity of bone sialoprotein and several other bone and dentin acidic proteins to collagen fibrils. Calcified Tissue International, 51(6), 438-442.( doi: 10.1007/bf00296677)
99. Maillard, C., Malaval, L., & Delmas, P. D. 1992 Immunological screening of SPARC/Osteonectin in nonmineralized tissues. Bone, 13(3), 257-264. (doi: 10.1016/8756-3282(92)90206-c)
100. 100.Guweidhi, A., Kleeff, J., Adwan, H., Giese, N. A., Wente, M. N., Giese, T., Friess, H. 2005 Osteonectin influences growth and invasion of pancreatic cancer cells. Annals of Surgery, 242(2), 224-234.
101. Rodríguez, I. R., Moreira, E. F., Bok, D., & Kantorow, M. 2000 Osteonectin/SPARC Secreted by RPE and Localized to the Outer Plexiform Layer of the Monkey Retina. Investigative Ophthalmology & Visual Science, 41(9), 2438-2444.
102. Viguet-Carrin, S., Garnero, P., & Delmas, P. 2006 The role of collagen in bone strength. Osteoporosis International, 17(3), 319-336. (doi: 10.1007/s00198-005-2035-9)
103. Goustin, A. S., Leof, E. B., Shipley, G. D., & Moses, H. L. 1986 Growth Factors and Cancer. Cancer Research, 46(3), 1015-1029.
104. Mundy, G. R. 1996 Regulation of Bone Formation by Bone Morphogenetic Proteins and Other Growth Factors. Clinical Orthopaedics and Related Research, 324, 24-27.
105. Riley, E. H., Lane, J. M., Urist, M. R., Lyons, K. M., & Lieberman, J. R. 1996 Bone Morphogenetic Protein-2: Biology and Applications. Clinical Orthopaedics and Related Research, 324, 39-46.
106. Bostrom, M. P. G., & Camacho, N. P. 1998 Potential Role of Bone Morphogenetic Proteins in Fracture Healing. Clinical Orthopaedics and Related Research, 355, S274-S282.

156
107. Heckman, J. D., Boyan, B. D., Aufdemorte, T. B., & Abbott, J. T. 1991 The use of bone morphogenetic protein in the treatment of non-union in a canine model. The Journal of bone and joint surgery. American Volume, 73(5), 750-764.
108. Sandhu, H. S., Khan, S. K., Suh, D. S., & Boden, S. B. 2001 Demineralized bone matrix, bone morphogenetic proteins, and animal models of spine fusion: an overview. European Spine Journal, 10(0), S122-S131. (doi: 10.1007/s005860100303)
109. Reddi, H. 2000 Interplay between bone morphogenetic proteins and cognate binding proteins in bone and cartilage development: noggin, chordin and DAN. Arthritis Research & Therapy, 3(1), 1-5. (doi: 10.1186/ar133)
110. Israel, D. I., Nove, J., Kerns, K. M., Kaufman, R. J., Rosen, V., Cox, K. A., & Wozney, J. M. 1996 Heterodimeric Bone Morphogenetic Proteins Show Enhanced Activity In Vitro and In Vivo. Growth Factors, 13(3-4), 291-300. (doi:10.3109/08977199609003229)
111. Cho, K. W. Y., & Blitz, I. L. 1998 BMPs, Smads and metalloproteases: extracellular and intracellular modes of negative regulation. Current Opinion in Genetics & Development, 8(4), 443-449. (doi: 10.1016/s0959-437x(98)80116-0 )
112. Li, B. 2008 Bone Morphogenetic Protein-Smad Pathway as Drug Targets for Osteoporosis and Cancer Therapy. Endocrine, Metabolic & Immune Disorders drug targets, 8(3), 208-219. (doi: 10.2174/187153008785700127)
113. Kawabata, M., Imamura, T., & Miyazono, K. 1998 Signal transduction by bone morphogenetic proteins. Cytokine &; Growth Factor Reviews, 9(1), 49-61. (doi: 10.1016/s1359-6101(97)00036-1)
114. Haydon, R. C., Luu, H. H., & He, T.-C. 2007 Osteosarcoma and Osteoblastic Differentiation: A New Perspective on Oncogenesis. Clinical Orthopaedics and Related Research, 454, 237-246 (210.1097/BLO.1090b1013e31802b31683c.)
115. Nakashima, M. 1994 Induction of Dentin Formation on Canine Amputated Pulp by Recombinant Human Bone Morphogenetic Proteins (BMP)-2 and -4. Journal of Dental Research, 73(9), 1515-1522. (doi: 10.1177/00220345940730090601)
116. Ahrens, M., Ankenbauer, T., Schroder, D., Hollnagel, A., Mayer, H., & Gross, G. 1993 Expression of human bone morphogenetic proteins-2 or -4 in murine mesenchymal progenitor C3H10T1/2 cells induces differentiation into distinct mesenchymal cell lineages. DNA and Cell Biology, 12(10), 871-880.
117. Dimitriou, R., Tsiridis, E., & Giannoudis, P. V. 2005 Current concepts of molecular aspects of bone healing. Injury, 36(12), 1392-1404. doi: 10.1016/j.injury.2005.07.019
157
118. Schindeler, A., McDonald, M. M., Bokko, P., & Little, D. G. 2008 Bone remodeling during fracture repair: The cellular picture. Seminars in Cell & Developmental Biology, 19(5), 459-466. (doi: 10.1016/j.semcdb.2008.07.004)
119. Stewart, M. G. 2005. Head, face, and neck trauma: Comprehensive management. pp. 89-90. New York, New York: Thieme.
120. LaStayo, P. C., Winters, K. M., & Hardy, M. 2003 Fracture healing: Bone healing, fracture management, and current concepts related to the hand. Journal of Hand Therapy, 16(2), 81-93. (doi: 10.1016/s0894-1130(03)80003-0)
121. Lieberman, J. R., & Friedlaender, G. E. 2005 Bone regeneration and repair biology and clinical applications, Retrieved from http://public.eblib.com/EBLPublic/PublicView.do?ptiID=603590
122. Schenk, R. 1978 Histology of Fracture Repair and Non-Union Bulletin of the Swiss Association for Study of Internal Fixation, pp. 14. Bern, Switzerland: Swiss Association for Study of Internal Fixation
123. Rahn, B. A. 1971 Primary Bone Healing: An Experimental Study in the Rabbit. Journal of bone and joint surgery American volume, 53(4), 783.
124. Draenert, Y. 1980 Gap healing of compact bone. Scanning electron microscopy 4, 103-111.
125. Claes, L., Recknagel, S., Ignatius, A. 2012 Fracture healing under healthy and inflammatory conditions Nat Rev Rheumatol, 8(3), 133-143. (doi: 10.1038/nrrheum.2012.1)
126. Perren, S. M. 1979 Physical and biological aspects of fracture healing with special reference to internal fixation. Clinical Orthopaedics and Related Research 138, 175-196.
127. Shapiro, F. 2008 Bone development and its relation to fracture repair. The role of mesenchymal osteoblasts and surface osteoblasts. European cells & materials, 15, 53-76.
128. Weatherholt, A. M., Fuchs, R. K., & Warden, S. J. 2012 Specialized Connective Tissue: Bone, the Structural Framework of the Upper Extremity. Journal of Hand Therapy, 25(2), 123-132. (doi: 10.1016/j.jht.2011.08.003)
129. Zioupos, P. 2001Ageing Human Bone: Factors Affecting its Biomechanical Properties and the Role of Collagen. Journal of Biomaterials Applications, 15(3), 187-229. (doi: 10.1106/5juj-tfj3-jvva-3rj0)
158
130. Ozaki, A., Tsunoda, M., Kinoshita, S., & Saura, R. 2000 Role of fracture hematoma and periosteum during fracture healing in rats: interaction of fracture hematoma and the periosteum in the initial step of the healing process. Journal of Orthopaedic Science, 5(1), 64-70. (doi: 10.1007/s007760050010 )
131. Schmidt-Bleek, K., Schell, H., Lienau, J., Schulz, N., Hoff, P., Pfaff, M., Duda, G. 2012 nitial immune reaction and angiogenesis in bone healing. Journal of Tissue Engineering and Regenerative Medicine, (doi: 10.1002/term.1505)
132. Kalfas, I. H. 2001 Principles of bone healing. Neurosurgical Focus, 10(4), 1-4. (doi: 10.3171/foc.2001.10.4.2)
133. Hoppenfeld, S., & Murthy, V. L. 2000 Treatment and rehabilitation of fractures, pp. 303. Philadelphia, Pa: Lippincott Williams & Wilkins.
134. Marzona, L., & Pavolini, B. 2009 Play and players in bone fracture healing match. Clinical cases in mineral and bone metabolism: the official journal of the Italian Society of Osteoporosis, Mineral Metabolism, and Skeletal Diseases, 6(2), 159-162.
135. McKibbin, B. 1978 The biology of fracture healing in long bones. The Journal of bone and joint surgery. British volume, 60-B(2), 150-162.
136. Sen, M. K., & Miclau, T. 2007 Autologous iliac crest bone graft: Should it still be the gold standard for treating nonunions? Injury, 38(1, Supplement), S75-S80. (doi: 10.1016/j.injury.2007.02.012.)
137. Campanacci, M., & Costa, P. 1979 Total resection of distal femur or proximal tibia for bone tumours. Autogenous bone grafts and arthrodesis in twenty-six cases. Journal of Bone & Joint Surgery British Volume, 61-B(4), 455-463.
138. Giannoudis, P. V., Dinopoulos, H., & Tsiridis, E. 2005 Bone substitutes: An update. Injury, 36(3, Supplement), S20-S27. (doi: 10.1016/j.injury.2005.07.029)
139. Joshi, A., & Kostakis, G. C. 2004 An investigation of post-operative morbidity following iliac crest graft harvesting. Br Dent J, 196(3), 167-171. (10.1038/sj.bdj.4810945)
140. Nguyen, H., Morgan, D., & Forwood, M. 2007 Sterilization of allograft bone: effects of gamma irradiation on allograft biology and biomechanics. Cell and Tissue Banking, 8(2), 93-105. (doi: 10.1007/s10561-006-9020-1)
141. Vaz, K., Verma, K., Protopsaltis, T., Schwab, F., Lonner, B., & Errico, T. 2010 Bone grafting options for lumbar spine surgery: a review examining clinical efficacy and complications. SAS Journal, 4(3), 75-86.( doi: 10.1016/j.esas.2010.01.004 )
159
142. Greenwald, A. S., Boden, S. D., Goldberg, V. M., Khan, Y., Laurencin, C. T., Rosier, R. N., & American Academy of Orthopaedic Surgeons. The Committee on Biological, I. 2001 Bone-graft substitutes: facts, fictions, and applications. The Journal of bone and joint surgery. American volume, 83-A Suppl 2 Pt 2, 98-103.
143. Bostrom, M. P. G., & Seigerman, D. A. 2005 The Clinical Use of Allografts, Demineralized Bone Matrices, Synthetic Bone Graft Substitutes and Osteoinductive Growth Factors: A Survey Study. HSS Journal, 1(1), 9-18. (doi: 10.1007/s11420-005-0111-5 )
144. Harakas, N. K. 1984 Demineralized Bone-Matrix-Induced Osteogenesis. Clinical Orthopaedics and Related Research, 188, 239-251.
145. Wolfinbarger, L., L. M. Eisenlohr, et al. 2008. Demineralized Bone Matrix: Maximizing New Bone Formation for Successful Bone Implantation Musculoskeletal Tissue Regeneration: Biological Materials and Methods, pp. 93-117. Totowa, NJ: Humana Press
146. Goebel, J. A., & Jacob, A. 2005 Use of Mimix hydroxyapatite bone cement for difficult ossicular reconstruction. Otolaryngology - Head and Neck Surgery, 132(5), 727-734. (doi: 10.1016/j.otohns.2005.01.023 )
147. Sottosanti, J. S. 1995 Calcium sulfate-aided bone regeneration: a case report. Periodontal clinical investigations : Official publication of the Northeastern Society of Periodontists, 17(2), 10-15.
148. Beuerlein, M. J. S., & McKee, M. D. 2010 Calcium Sulfates: What Is the Evidence? Journal of Orthopaedic Trauma, 24, S46-S51 (10.1097/BOT.1090b1013e3181cec1048e.)
149. Glazer, P. A., Spencer, U. M., Alkalay, R. N., & Schwardt, J. 2001 In vivo evaluation of calcium sulfate as a bone graft substitute for lumbar spinal fusion. The Spine Journal, 1(6), 395-401. (doi: 10.1016/s1529-9430(01)00108-5 )
150. Petruskevicius, J., Nielsen, S., Kaalund, S., Knudsen, P. R., & Overgaard, S. 2002 No effect of Osteoset ®, a bone graft substitute, on bone healing in humans: A prospective randomized double-blind study. Acta Orthopaedica, 73(5), 575-578. (doi: doi:10.1080/000164702321022875 )
151. Barrack, R. L. 2005 Bone Graft Extenders, Substitutes, and Osteogenic Proteins. The Journal of Arthroplasty, 20, 94-97. (doi: 10.1016/j.arth.2005.03.025)
152. Schoelles K, Snyder D, Kaczmarek J, et al. 2005 The Role of Bone Growth Stimulating Devices and Orthobiologics in Healing Nonunion Fractures. Agency for Healthcare Research and Quality. Retrieved from http://www.cms.hhs.gov/determinationprocess/downloads/id29TA.pdf
160
153. Katagiri, T., Yamaguchi, A., Komaki, M., Abe, E., Takahashi, N., Ikeda, T., Suda, T. 1994 Bone morphogenetic protein-2 converts the differentiation pathway of C2C12 myoblasts into the osteoblast lineage. The Journal of Cell Biology, 127(6), 1755-1766. (doi: 10.1083/jcb.127.6.1755 )
154. Cheng, H., Jiang, W., Phillips, F. M., Haydon, R. C., Peng, Y., Zhou, L., He, T. C. 2003 Osteogenic activity of the fourteen types of human bone morphogenetic proteins (BMPs). The Journal of bone and joint surgery. American volume, 85-A(8), 1544-1552.
155. Bauer, T. W., & Muschler, G. F. 2000 Bone Graft Materials: An Overview of the Basic Science. Clinical Orthopaedics and Related Research, 371, 10-27.
156. Schmitt, J. M., Hwang, K., Winn, S. R., & Hollinger, J. O. 1999 Bone morphogenetic proteins: An update on basic biology and clinical relevance. Journal of Orthopaedic Research, 17(2), 269-278. (doi: 10.1002/jor.1100170217)
157. Walker DH, Wright NM. 2002 Bone morphogenic proteins and spinal fusion. Neurosurg Focus 13(6),1-13.
158. Urist, M. R., Silverman, B. F., Düring, K., DubuC, F. L., & Rosenberg, J. M. 1967 24 The Bone Induction Principle. Clinical Orthopaedics and Related Research, 53, 243-284.
159. Wozney, J., Rosen, V., Celeste, A., Mitsock, L., Whitters, M., Kriz, R., Wang, E. 1988 Novel regulators of bone formation: molecular clones and activities. Science, 242(4885), 1528-1534. (doi: 10.1126/science.3201241)
160. Pagani, F., Francucci, C. M., & Moro, L. 2005 Markers of bone turnover: biochemical and clinical perspectives. [Review]. J Endocrinol Invest, 28(10), 8-13.
161. Lewandrowski, K. U., Tomford, W. W., Michaud, N. A., Schomacker, K. T., & Deutsch, T. F. 1997 An Electron Microscopic Study on the Process of Acid Demineralization of Cortical Bone. Calcified Tissue International, 61(4), 294-297. (doi: 10.1007/s002239900338)
162. Pietrzak, W. S., Perns, S. V., Keyes, J., Woodell-May, J., & McDonald, N. M. 2005 Demineralized Bone Matrix Graft: A Scientific and Clinical Case Study Assessment. The Journal of Foot and Ankle Surgery, 44(5), 345-353. (doi: 10.1053/j.jfas.2005.07.006)
163. Zhang, M., Powers, R. M., Jr., & Wolfinbarger, L., Jr. 1997 Effect(s) of the demineralization process on the osteoinductivity of demineralized bone matrix. [Research Support, Non-U S Gov't]. J Periodontol, 68(11), 1085-1092.
161
164. Damien, C. J., Parsons, J. R., Prewett, A. B., Rietveld, D. C., & Zimmerman, M. C. 1994 Investigation of an organic delivery system for demineralized bone matrix in a delayed-healing cranial defect model. Journal of Biomedical Materials Research, 28(5), 553-561. (doi: 10.1002/jbm.820280505)
165. Lye, K. W., Deatherage, J. R., & Waite, P. D. 2008 The Use of Demineralized Bone Matrix for Grafting During Le Fort I and Chin Osteotomies: Techniques and Complications. Journal of Oral and Maxillofacial Surgery, 66(8), 1580-1585. (doi: 10.1016/j.joms.2007.12.003.)
166. Han, B., Tang, B., & Nimni, M. E. 2003 Quantitative and sensitive in vitro assay for osteoinductive activity of demineralized bone matrix. Journal of Orthopaedic Research, 21(4), 648-654. (doi: 10.1016/s0736-0266(03)00005-6 )
167. Liu, L., Wang, Y., Shen, X., & Fang, Y. e. 2005 Preparation of chitosan-g-polycaprolactone copolymers through ring-opening polymerization of ϵ-caprolactone onto phthaloyl-protected chitosan. Biopolymers, 78(4), 163-170. (doi: 10.1002/bip.20261)
168. Agarwal, S., & Speyerer, C. 2010 Degradable blends of semi-crystalline and amorphous branched poly(caprolactone): Effect of microstructure on blend properties. Polymer, 51(5), 1024-1032. (doi: 10.1016/j.polymer.2010.01.020 )
169. Hutmacher, D. W., Schantz, T., Zein, I., Ng, K. W., Teoh, S. H., & Tan, K. C. 2001 Mechanical properties and cell cultural response of polycaprolactone scaffolds designed and fabricated via fused deposition modeling. Journal of Biomedical Materials Research, 55(2), 203-216. (doi: 10.1002/1097-4636(200105)55:2<203::aid-jbm1007>3.0.co;2-7 )
170. Priya, S. G., Jungvid, H., & Kumar, A. 2008 Skin tissue engineering for tissue repair and regeneration. Tissue engineering. Part B, Reviews, 14(1), 105-118.
171. Ragamouni, S. 2009 Preparation and Characterization of Poly (ε-caprolactone) PCL Scaffolds for Tissue Engineering Applications. Retrieved from http://ethesis.nitrkl.ac.in/1458/1/final_thesis_with_page_nu.pdf
172. Ginde, R. M., & Gupta, R. K. 1987 In vitro chemical degradation of poly(glycolic acid) pellets and fibers. Journal of Applied Polymer Science, 33(7), 2411-2429.(doi: 10.1002/app.1987.070330712)
173. Goepferich, A., Karydas, D., Langer, R. 1995 Predicting drug release from cylindric polyanhydride matrix discs", European J. of Pharm. and Biopharm, 41(2): 81-87.
174. Bergsma, J. E., de Bruijn, W. C., Rozema, F. R., Bos, R. R. M., & Boering, G. (1995). Late degradation tissue response to poly(l-lactide) bone plates and screws. Biomaterials, 16(1), 25-31. (doi: 10.1016/0142-9612(95)91092-d)
162
175. Vert, M. 2009 Degradable and bioresorbable polymers in surgery and in pharmacology: beliefs and facts. Journal of Materials Science: Materials in Medicine, 20(2), 437-446.( doi: 10.1007/s10856-008-3581-4)
176. Shimao, M. 2001 Biodegradation of plastics. Current Opinion in Biotechnology, 12(3), 242-247. (doi: 10.1016/s0958-1669(00)00206-8)
177. Tamjid, E., Bagheri, R., Vossoughi, M., & Simchi, A. (2011). Effect of TiO2 morphology on in vitro bioactivity of polycaprolactone/TiO2 nanocomposites. Materials Letters, 65(15–16), 2530-2533. (doi: 10.1016/j.matlet.2011.05.037)
178. Commandeur, S., Van Beusekom, H. M. M., & Van Der Giessen, W. J. 2006 Polymers, Drug Release, and Drug-Eluting Stents. Journal of Interventional Cardiology, 19(6), 500-506. (doi: 10.1111/j.1540-8183.2006.00198.x)
179. Fahmy, T. M., Fong, P. M., Goyal, A., & Saltzman, W. M. 2005 Targeted for drug delivery. Materials Today, 8 (8), 18-26. (doi: 10.1016/s1369-7021(05)71033-6)
180. Michea, L., Ferguson, D. R., Peters, E. M., Andrews, P. M., Kirby, M. R., & Burg, M. B. 2000 Cell cycle delay and apoptosis are induced by high salt and urea in renal medullary cells. American Journal of Physiology - Renal Physiology, 278(2), F209-F218.
181. Han, B., Yang, Z., & Nimni, M. 2005 Effects of moisture and temperature on the osteoinductivity of demineralized bone matrix. Journal of Orthopaedic Research, 23(4), 855-861. (doi: 10.1016/j.orthres.2004.11.007)
182. Kokubo, T., & Takadama, H. 2006 How useful is SBF in predicting in vivo bone bioactivity? Biomaterials, 27(15), 2907-2915.(doi: 10.1016/j.biomaterials.2006.01.017)
183. Nagano, M., Nakamura, T., Kokubo, T., Tanahashi, M., & Ogawa, M. 1996 Differences of bone bonding ability and degradation behaviour in vivo between amorphous calcium phosphate and highly crystalline hydroxyapatite coating. Biomaterials, 17(18), 1771-1777. (doi: 10.1016/0142-9612(95)00357-6)
184. Albrektsson, T. A., & Johansson, C. J. 2001 Osteoinduction, osteoconduction and osseointegration. European Spine Journal, 10(0), S96-S101. (doi: 10.1007/s005860100282)
185. Johnson, R., Harrison, D., Tucci, M., Tsao, A., Lemos, M., Puckett, A., Benghuzzi, H. 1997 Fibrous capsule formation in response to ultrahigh molecular weight polyethylene treated with peptides that influence adhesion. Biomedical sciences instrumentation, 34, 47-52.
186. Webster, T. J. 2001 Nanophase ceramics: The future orthopedic and dental implant material. Advances in Chemical Engineering 27, 125-166
163
187. Gotman, I. 1997 Characteristics of metals used in implants. Journal of endourology / Endourological Society, 11(6), 383-389.
188. Nelson, C. L., McLaren, A. C., McLaren, S. G., Johnson, J. W., & Smeltzer, M. S. 2005 Is Aseptic Loosening Truly Aseptic? Clinical Orthopaedics and Related Research, 437, 25-30. (10.1097/1001.blo.0000175715.0000168624.0000175713d.)
189. Kim, H.-M., Himeno, T., Kokubo, T., & Nakamura, T. 2005 Process and kinetics of bonelike apatite formation on sintered hydroxyapatite in a simulated body fluid. Biomaterials, 26(21), 4366-4373.(doi: 10.1016/j.biomaterials.2004.11.022 )
190. Li, P., Kangasniemi, I., de Groot, K., & Kokubo, T. 1994 Bonelike Hydroxyapatite Induction by a Gel-Derived Titania on a Titanium Substrate. Journal of the American Ceramic Society, 77(5), 1307-1312. (doi: 10.1111/j.1151-2916.1994.tb05407.x)
191. Dias, A. G., Gibson, I. R., Santos, J. D., & Lopes, M. A. 2007 Physicochemical degradation studies of calcium phosphate glass ceramic in the CaO–P2O5–MgO–TiO2 system. Acta Biomaterialia, 3(2), 263-269. (doi: 10.1016/j.actbio.2006.09.009)
192. Zyman, Z., Weng, J., Liu, X., Zhang, X., & Ma, Z. 1993 Amorphous phase and morphological structure of hydroxyapatite plasma coatings. Biomaterials, 14(3), 225-228. (doi: 10.1016/0142-9612(93)90027-y)
193. Schweizer, S., & Taubert, A. 2007 Polymer-Controlled, Bio-Inspired Calcium Phosphate Mineralization from Aqueous Solution. Macromolecular Bioscience, 7(9-10), 1085-1099.(doi: 10.1002/mabi.200600283)
194. Lievremont, M., Potus, J., & Guillou, B. 1982 Use of Alizarin Red S for Histochemical Staining of Ca2+ in the Mouse; Some Parameters of the Chemical Reaction in vitro. Cells Tissues Organs, 114(3), 268-280.
195. Li, X., Shi, J., Dong, X., Zhang, L., & Zeng, H. 2008 A mesoporous bioactive glass/polycaprolactone composite scaffold and its bioactivity behavior. Journal of Biomedical Materials Research Part A, 84A(1), 84-91. (doi: 10.1002/jbm.a.31371)
196. Han, B., Yang, Z., & Nimni, M. 2008 Effects of gamma irradiation on osteoinduction associated with demineralized bone matrix. Journal of Orthopaedic Research, 26(1), 75-82. (doi: 10.1002/jor.20478)
197. Figueiredo, M., Cunha, S., Martins, G., Freitas, J., Judas, F., & Figueiredo, H. 2011 Influence of hydrochloric acid concentration on the demineralization of cortical bone. Chemical Engineering Research and Design, 89(1), 116-124.(doi: 10.1016/j.cherd.2010.04.013)
164
BIOGRAPHICAL SKETCH
Titilayo Moloye was born to Dr. Olugbemi Moloye and Mrs. Yinka Moloye. She has
two sisters, Olajompo Moloye and Dolapo Moloye. She was born in Ibadan, Nigeria but
grew up in Tallahassee, FL. Upon graduation, she will be moving to Alexandria, VA
where she will begin her career as a patent examiner with the United States Patent and
Trademark Office.