Embed Size (px)
Citation preview
NewEngland RuralPeer Maine Average StateAverage U.S.Average HighestState LowestState
NewEngland RuralPeer Maine Average StateAverage U.S.Average HighestState LowestState
NewEngland RuralPeer Maine Average StateAverage* U.S.Average HighestState LowestState
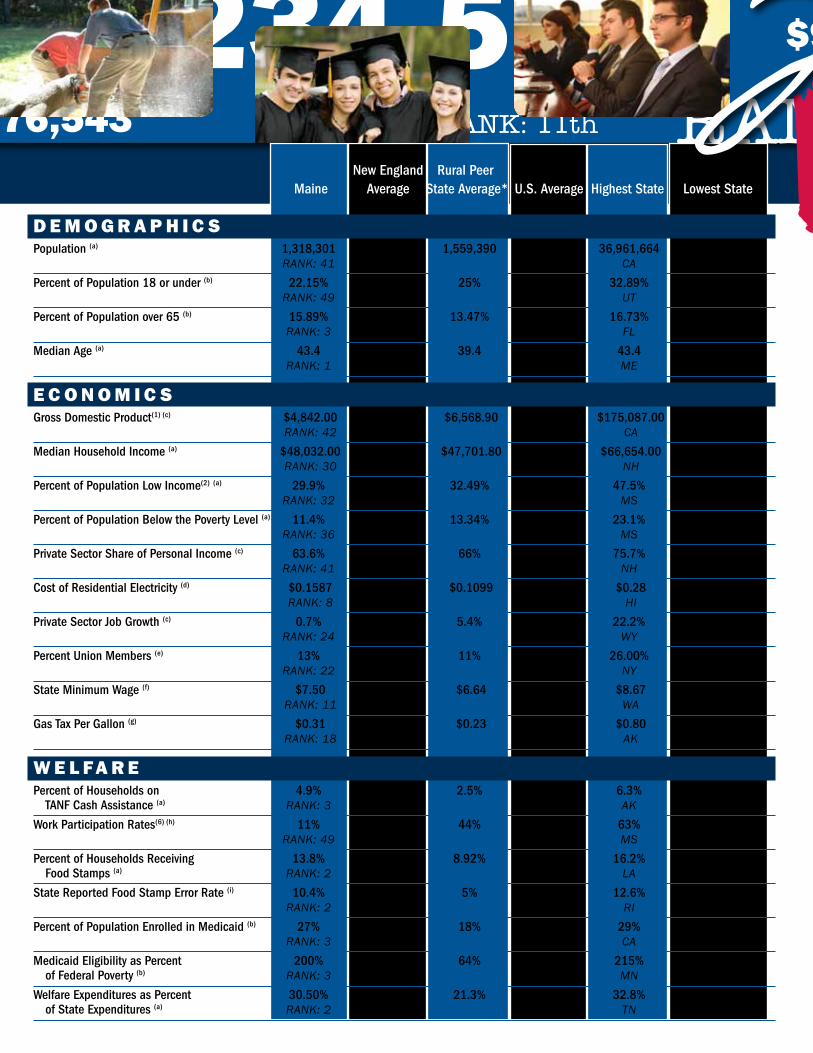
D E M O G R A P H I C SPopulation(a) 1,318,301 2,622,284 1,559,390 11,807,944 36,961,664 544,270
Rank:41 Ca WY
PercentofPopulation18orunder(b) 22.15% 23.3% 25% 25.38% 32.89% 19.53% Rank:49 UT DC
PercentofPopulationover65(b) 15.89% 13.31% 13.47% 12.71% 16.73% 8.07% Rank:3 FL ak
MedianAge(a) 43.4 41.14 39.4 38.4 43.4 29.4 Rank:1 ME UT
E C O N O M I C S GrossDomesticProduct(1)(c) $4,842.00 $11,189.80 $6,568.90 $24,998.96 $175,087.00 $2,511.00
Rank:42 Ca DC
MedianHouseholdIncome(a) $48,032.00 $59,210.20 $47,701.80 $50,803.00 $66,654.00 36,650.00 Rank:30 nH MS
PercentofPopulationLowIncome(2)(a) 29.9% 24.94% 32.49% 33% 47.5% 19.9% Rank:32 MS nH
PercentofPopulationBelowthePovertyLevel(a) 11.4% 9.88% 13.34% 14.3% 23.1% 7.8% Rank:36 MS nH
PrivateSectorShareofPersonalIncome(c) 63.6% 71.59% 66% 69.3% 75.7% 7.2% Rank:41 nH DC
CostofResidentialElectricity(d) $0.1587 $0.1678 $0.1099 $0.1218 $0.28 $0.08 Rank:8 HI ID
PrivateSectorJobGrowth(c) 0.7% -0.01% 5.4% -0.1% 22.2% -18% Rank:24 WY MI
PercentUnionMembers(e) 13% 15.14% 11% 12.3% 26.00% 4.9% Rank:22 nY nC
StateMinimumWage(f) $7.50 $7.81 $6.64 $6.04 $8.67 $- Rank:11 Wa aL,Tn,MS,SC,La
GasTaxPerGallon(g) $0.31 $0.29 $0.23 $0.28 $0.80 $0.14 Rank:18 ak WY
W E l fA R E PercentofHouseholdson 4.9% 2.9% 2.5% 2.6% 6.3% 1.3%
TANFCashAssistance(a) Rank:3 ak La
WorkParticipationRates(6)(h) 11% 32% 44% 29% 63% 3% Rank:49 MS aZ
PercentofHouseholdsReceiving 13.8% 7.2% 8.92% 8.8% 16.2% 4.2%FoodStamps(a) Rank:2 La WY
StateReportedFoodStampErrorRate(i) 10.4% 6.7% 5% 5.7% 12.6% 1.9% Rank:2 RI SD
PercentofPopulationEnrolledinMedicaid(b) 27% 18% 18% 19% 29% 10% Rank:3 Ca nV
MedicaidEligibilityasPercent 200% 149% 64% 86% 215% 8%ofFederalPoverty(b) Rank:3 Mn ak
WelfareExpendituresasPercent 30.50% 25.9% 21.3% 23.7% 32.8% 12.9%ofStateExpenditures(a) Rank:2 Tn WY
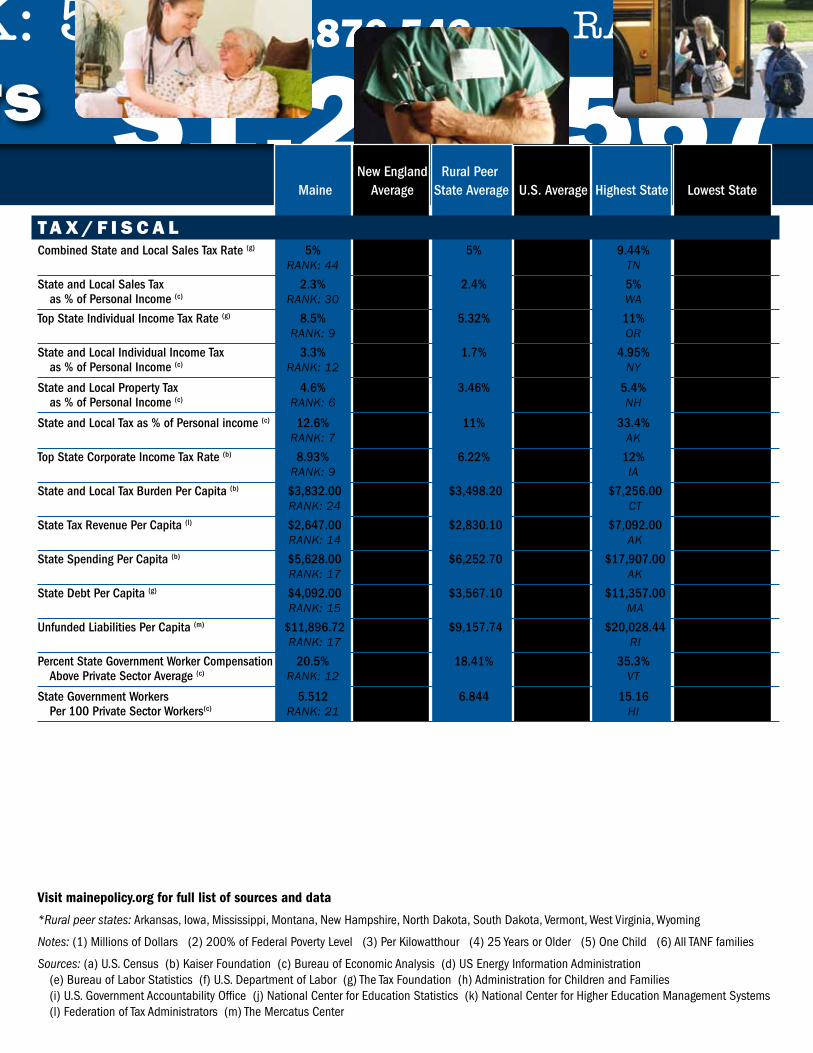
TA x / f I S C A l CombinedStateandLocalSalesTaxRate(g) 5% 5.05% 5% 6.27% 9.44% 0%
Rank:44 Tn OR,Mn,nH,DE
StateandLocalSalesTax 2.3% 1.3% 2.4% 2.53% 5% 0%as%ofPersonalIncome(c) Rank:30 Wa OR,Mn,nH,DE
TopStateIndividualIncomeTaxRate(g) 8.5% 6.35% 5.32% 5.67% 11% 0% Rank:9 OR TX,nV,FL,WY,Wa,SD,ak
StateandLocalIndividualIncomeTax 3.3% 2.6% 1.7% 2.53% 4.95% 0%as%ofPersonalIncome(c) Rank:12 nY TX,nV,FL,WY,Wa,SD,ak
StateandLocalPropertyTax 4.6% 4.59% 3.46% 3.4% 5.4% 1.5%as%ofPersonalIncome(c) Rank:6 nH aL
StateandLocalTaxas%ofPersonalincome(c) 12.6% 10.93% 11% 11.04% 33.4% 8.3% Rank:7 ak SD
TopStateCorporateIncomeTaxRate(b) 8.93% 8.35% 6.22% 6.51% 12% 0.00% Rank:9 Ia MI,nV,OH,SD,TX,Wa,WY
StateandLocalTaxBurdenPerCapita(b) $3,832.00 $5,033.00 $3,498.20 $3,920.96 $7,256.00 $2,067.00 Rank:24 CT aL
StateTaxRevenuePerCapita(l) $2,647.00 $2,944.00 $2,830.10 $2,334.00 $7,092.00 $1,567.00 Rank:14 ak SC
StateSpendingPerCapita(b) $5,628.00 $6,534.00 $6,252.70 $4,926.00 $17,907.00 $3,380.00 Rank:17 ak TX
StateDebtPerCapita(g) $4,092.00 $8,006.40 $3,567.10 $3,415.00 $11,357.00 $773.00 Rank:15 Ma Tn
UnfundedLiabilitiesPerCapita(m) $11,896.72 $12,116.25 $9,157.74 $10,741.56 $20,028.44 $4,882.29 Rank:17 RI nE
PercentStateGovernmentWorkerCompensation 20.5% 13.96% 18.41% 6.47% 35.3% -6.7%AbovePrivateSectorAverage(c) Rank:12 VT Ma
StateGovernmentWorkers 5.512 5.186 6.844 4.739 15.16 3.133Per100PrivateSectorWorkers(c) Rank:21 HI IL
Visit mainepolicy.org for full list of sources and data
*Rural peer states: Arkansas, Iowa, Mississippi, Montana, New Hampshire, North Dakota, South Dakota, Vermont, West Virginia, Wyoming
Notes: (1) Millions of Dollars (2) 200% of Federal Poverty Level (3) Per Kilowatthour (4) 25 Years or Older (5) One Child (6) All TANF families
Sources: (a) U.S. Census (b) Kaiser Foundation (c) Bureau of Economic Analysis (d) US Energy Information Administration (e) Bureau of Labor Statistics (f) U.S. Department of Labor (g) The Tax Foundation (h) Administration for Children and Families (i) U.S. Government Accountability Office (j) National Center for Education Statistics (k) National Center for Higher Education Management Systems (l) Federation of Tax Administrators (m) The Mercatus Center
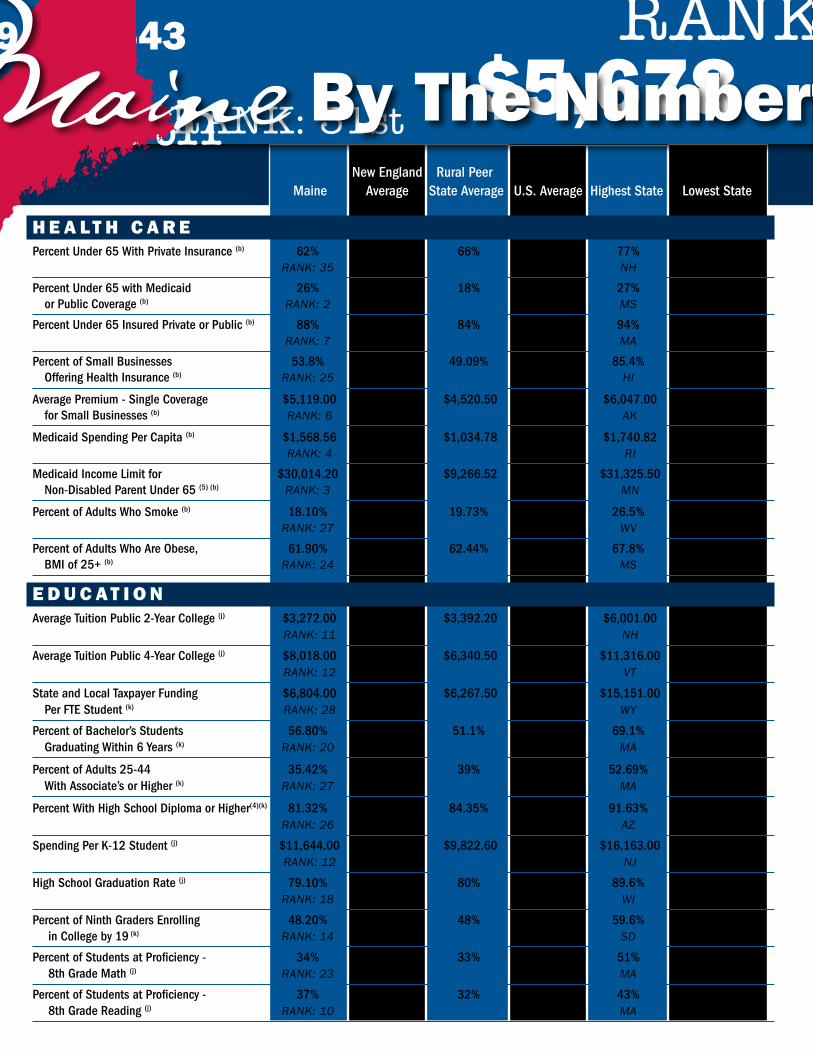
H E A lT H C A R E PercentUnder65WithPrivateInsurance(b) 62% 71% 66% 62% 77% 50%
Rank:35 nH nM
PercentUnder65withMedicaid 26% 18% 18% 20% 27% 10%orPublicCoverage(b) Rank:2 MS UT
PercentUnder65InsuredPrivateorPublic(b) 88% 89% 84% 82% 94% 72% Rank:7 Ma TX
PercentofSmallBusinesses 53.8% 60.36% 49.09% 55% 85.4% 39.5%OfferingHealthInsurance(b) Rank:25 HI MT
AveragePremium-SingleCoverage $5,119.00 $5,092.80 $4,520.50 $4,669.00 $6,047.00 $3,717.00forSmallBusinesses(b) Rank:6 ak aR
MedicaidSpendingPerCapita(b) $1,568.56 $1,345.20 $1,034.78 $1,027.48 $1,740.82 $420.38 Rank:4 RI nV
MedicaidIncomeLimitfor $30,014.20 $21,709.30 $9,266.52 $12,773.71 $31,325.50 $2,476.90Non-DisabledParentUnder65(5)(b) Rank:3 Mn aR
PercentofAdultsWhoSmoke(b) 18.10% 16.58% 19.73% 18.91% 26.5% 9.3% Rank:27 WV UT
PercentofAdultsWhoAreObese, 61.90% 57.34% 62.44% 60.8% 67.8% 49.8%BMIof25+(b) Rank:24 MS DC
E D u C AT I O N AverageTuitionPublic2-YearCollege(j) $3,272.00 $4,002.40 $3,392.20 $2,137.00 $6,001.00 $586.00
Rank:11 nH Ca
AverageTuitionPublic4-YearCollege(j) $8,018.00 $9,049.80 $6,340.50 $6,319.00 $11,316.00 $3,057.00 Rank:12 VT WY
StateandLocalTaxpayerFunding $6,804.00 $6,452.80 $6,267.50 $7,059.00 $15,151.00 $3,167.00PerFTEStudent(k) Rank:28 WY VT
PercentofBachelor’sStudents 56.80% 64.40% 51.1% 55.9% 69.1% 22.1%GraduatingWithin6Years(k) Rank:20 Ma ak
PercentofAdults25-44 35.42% 47.16% 39% 39.26% 52.69% 28.3%WithAssociate’sorHigher(k) Rank:27 Ma WV
PercentWithHighSchoolDiplomaorHigher(4)(k) 81.32% 87.4% 84.35% 89.63% 91.63% 79.62% Rank:26 aZ VT
SpendingPerK-12Student(j) $11,644.00 $12,927.00 $9,822.60 $9,683.00 $16,163.00 $5,706.00 Rank:12 nJ UT
HighSchoolGraduationRate(j) 79.10% 82.6% 80% 74.9% 89.6% 51.3% Rank:18 WI nV
PercentofNinthGradersEnrolling 48.20% 48.9% 48% 44% 59.6% 26.4%inCollegeby19(k) Rank:14 SD nV
PercentofStudentsatProficiency- 34% 39% 33% 32% 51% 17%8thGradeMath(j) Rank:23 Ma MS
PercentofStudentsatProficiency- 37% 37% 32% 30% 43% 17%8thGradeReading(j) Rank:10 Ma MS
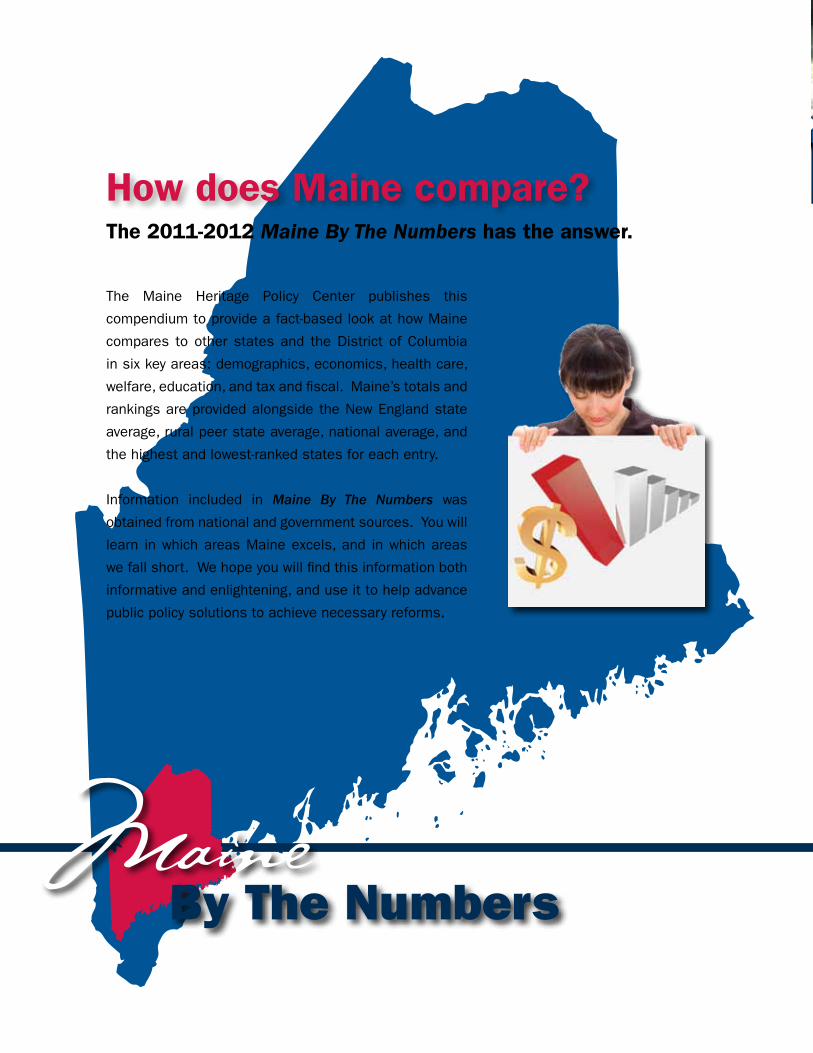
By The NumbersHow does Maine compare?
The Maine Heritage Policy Center publishes this
compendium to provide a fact-based look at how Maine
compares to other states and the District of Columbia
in six key areas: demographics, economics, health care,
welfare, education, and tax and fiscal. Maine’s totals and
rankings are provided alongside the New England state
average, rural peer state average, national average, and
the highest and lowest-ranked states for each entry.
Information included in Maine By The Numbers was
obtained from national and government sources. You will
learn in which areas Maine excels, and in which areas
we fall short. We hope you will find this information both
informative and enlightening, and use it to help advance
public policy solutions to achieve necessary reforms.
The 2011-2012 Maine By The Numbers has the answer.
By The Numbers
NewEngland RuralPeer Maine Average StateAverage U.S.Average HighestState LowestState
NewEngland RuralPeer Maine Average StateAverage U.S.Average HighestState LowestState
NewEngland RuralPeer Maine Average StateAverage* U.S.Average HighestState LowestState
D E M O G R A P H I C SPopulation(a) 1,318,301 2,622,284 1,559,390 11,807,944 36,961,664 544,270
Rank:41 Ca WY
PercentofPopulation18orunder(b) 22.15% 23.3% 25% 25.38% 32.89% 19.53% Rank:49 UT DC
PercentofPopulationover65(b) 15.89% 13.31% 13.47% 12.71% 16.73% 8.07% Rank:3 FL ak
MedianAge(a) 43.4 41.14 39.4 38.4 43.4 29.4 Rank:1 ME UT
E C O N O M I C S GrossDomesticProduct(1)(c) $4,842.00 $11,189.80 $6,568.90 $24,998.96 $175,087.00 $2,511.00
Rank:42 Ca DC
MedianHouseholdIncome(a) $48,032.00 $59,210.20 $47,701.80 $50,803.00 $66,654.00 36,650.00 Rank:30 nH MS
PercentofPopulationLowIncome(2)(a) 29.9% 24.94% 32.49% 33% 47.5% 19.9% Rank:32 MS nH
PercentofPopulationBelowthePovertyLevel(a) 11.4% 9.88% 13.34% 14.3% 23.1% 7.8% Rank:36 MS nH
PrivateSectorShareofPersonalIncome(c) 63.6% 71.59% 66% 69.3% 75.7% 7.2% Rank:41 nH DC
CostofResidentialElectricity(d) $0.1587 $0.1678 $0.1099 $0.1218 $0.28 $0.08 Rank:8 HI ID
PrivateSectorJobGrowth(c) 0.7% -0.01% 5.4% -0.1% 22.2% -18% Rank:24 WY MI
PercentUnionMembers(e) 13% 15.14% 11% 12.3% 26.00% 4.9% Rank:22 nY nC
StateMinimumWage(f) $7.50 $7.81 $6.64 $6.04 $8.67 $- Rank:11 Wa aL,Tn,MS,SC,La
GasTaxPerGallon(g) $0.31 $0.29 $0.23 $0.28 $0.80 $0.14 Rank:18 ak WY
W E l fA R E PercentofHouseholdson 4.9% 2.9% 2.5% 2.6% 6.3% 1.3%
TANFCashAssistance(a) Rank:3 ak La
WorkParticipationRates(6)(h) 11% 32% 44% 29% 63% 3% Rank:49 MS aZ
PercentofHouseholdsReceiving 13.8% 7.2% 8.92% 8.8% 16.2% 4.2%FoodStamps(a) Rank:2 La WY
StateReportedFoodStampErrorRate(i) 10.4% 6.7% 5% 5.7% 12.6% 1.9% Rank:2 RI SD
PercentofPopulationEnrolledinMedicaid(b) 27% 18% 18% 19% 29% 10% Rank:3 Ca nV
MedicaidEligibilityasPercent 200% 149% 64% 86% 215% 8%ofFederalPoverty(b) Rank:3 Mn ak
WelfareExpendituresasPercent 30.50% 25.9% 21.3% 23.7% 32.8% 12.9%ofStateExpenditures(a) Rank:2 Tn WY
TA x / f I S C A l CombinedStateandLocalSalesTaxRate(g) 5% 5.05% 5% 6.27% 9.44% 0%
Rank:44 Tn OR,Mn,nH,DE
StateandLocalSalesTax 2.3% 1.3% 2.4% 2.53% 5% 0%as%ofPersonalIncome(c) Rank:30 Wa OR,Mn,nH,DE
TopStateIndividualIncomeTaxRate(g) 8.5% 6.35% 5.32% 5.67% 11% 0% Rank:9 OR TX,nV,FL,WY,Wa,SD,ak
StateandLocalIndividualIncomeTax 3.3% 2.6% 1.7% 2.53% 4.95% 0%as%ofPersonalIncome(c) Rank:12 nY TX,nV,FL,WY,Wa,SD,ak
StateandLocalPropertyTax 4.6% 4.59% 3.46% 3.4% 5.4% 1.5%as%ofPersonalIncome(c) Rank:6 nH aL
StateandLocalTaxas%ofPersonalincome(c) 12.6% 10.93% 11% 11.04% 33.4% 8.3% Rank:7 ak SD
TopStateCorporateIncomeTaxRate(b) 8.93% 8.35% 6.22% 6.51% 12% 0.00% Rank:9 Ia MI,nV,OH,SD,TX,Wa,WY
StateandLocalTaxBurdenPerCapita(b) $3,832.00 $5,033.00 $3,498.20 $3,920.96 $7,256.00 $2,067.00 Rank:24 CT aL
StateTaxRevenuePerCapita(l) $2,647.00 $2,944.00 $2,830.10 $2,334.00 $7,092.00 $1,567.00 Rank:14 ak SC
StateSpendingPerCapita(b) $5,628.00 $6,534.00 $6,252.70 $4,926.00 $17,907.00 $3,380.00 Rank:17 ak TX
StateDebtPerCapita(g) $4,092.00 $8,006.40 $3,567.10 $3,415.00 $11,357.00 $773.00 Rank:15 Ma Tn
UnfundedLiabilitiesPerCapita(m) $11,896.72 $12,116.25 $9,157.74 $10,741.56 $20,028.44 $4,882.29 Rank:17 RI nE
PercentStateGovernmentWorkerCompensation 20.5% 13.96% 18.41% 6.47% 35.3% -6.7%AbovePrivateSectorAverage(c) Rank:12 VT Ma
StateGovernmentWorkers 5.512 5.186 6.844 4.739 15.16 3.133Per100PrivateSectorWorkers(c) Rank:21 HI IL
Visit mainepolicy.org for full list of sources and data
*Rural peer states: Arkansas, Iowa, Mississippi, Montana, New Hampshire, North Dakota, South Dakota, Vermont, West Virginia, Wyoming
Notes: (1) Millions of Dollars (2) 200% of Federal Poverty Level (3) Per Kilowatthour (4) 25 Years or Older (5) One Child (6) All TANF families
Sources: (a) U.S. Census (b) Kaiser Foundation (c) Bureau of Economic Analysis (d) US Energy Information Administration (e) Bureau of Labor Statistics (f) U.S. Department of Labor (g) The Tax Foundation (h) Administration for Children and Families (i) U.S. Government Accountability Office (j) National Center for Education Statistics (k) National Center for Higher Education Management Systems (l) Federation of Tax Administrators (m) The Mercatus Center
H E A lT H C A R E PercentUnder65WithPrivateInsurance(b) 62% 71% 66% 62% 77% 50%
Rank:35 nH nM
PercentUnder65withMedicaid 26% 18% 18% 20% 27% 10%orPublicCoverage(b) Rank:2 MS UT
PercentUnder65InsuredPrivateorPublic(b) 88% 89% 84% 82% 94% 72% Rank:7 Ma TX
PercentofSmallBusinesses 53.8% 60.36% 49.09% 55% 85.4% 39.5%OfferingHealthInsurance(b) Rank:25 HI MT
AveragePremium-SingleCoverage $5,119.00 $5,092.80 $4,520.50 $4,669.00 $6,047.00 $3,717.00forSmallBusinesses(b) Rank:6 ak aR
MedicaidSpendingPerCapita(b) $1,568.56 $1,345.20 $1,034.78 $1,027.48 $1,740.82 $420.38 Rank:4 RI nV
MedicaidIncomeLimitfor $30,014.20 $21,709.30 $9,266.52 $12,773.71 $31,325.50 $2,476.90Non-DisabledParentUnder65(5)(b) Rank:3 Mn aR
PercentofAdultsWhoSmoke(b) 18.10% 16.58% 19.73% 18.91% 26.5% 9.3% Rank:27 WV UT
PercentofAdultsWhoAreObese, 61.90% 57.34% 62.44% 60.8% 67.8% 49.8%BMIof25+(b) Rank:24 MS DC
E D u C AT I O N AverageTuitionPublic2-YearCollege(j) $3,272.00 $4,002.40 $3,392.20 $2,137.00 $6,001.00 $586.00
Rank:11 nH Ca
AverageTuitionPublic4-YearCollege(j) $8,018.00 $9,049.80 $6,340.50 $6,319.00 $11,316.00 $3,057.00 Rank:12 VT WY
StateandLocalTaxpayerFunding $6,804.00 $6,452.80 $6,267.50 $7,059.00 $15,151.00 $3,167.00PerFTEStudent(k) Rank:28 WY VT
PercentofBachelor’sStudents 56.80% 64.40% 51.1% 55.9% 69.1% 22.1%GraduatingWithin6Years(k) Rank:20 Ma ak
PercentofAdults25-44 35.42% 47.16% 39% 39.26% 52.69% 28.3%WithAssociate’sorHigher(k) Rank:27 Ma WV
PercentWithHighSchoolDiplomaorHigher(4)(k) 81.32% 87.4% 84.35% 89.63% 91.63% 79.62% Rank:26 aZ VT
SpendingPerK-12Student(j) $11,644.00 $12,927.00 $9,822.60 $9,683.00 $16,163.00 $5,706.00 Rank:12 nJ UT
HighSchoolGraduationRate(j) 79.10% 82.6% 80% 74.9% 89.6% 51.3% Rank:18 WI nV
PercentofNinthGradersEnrolling 48.20% 48.9% 48% 44% 59.6% 26.4%inCollegeby19(k) Rank:14 SD nV
PercentofStudentsatProficiency- 34% 39% 33% 32% 51% 17%8thGradeMath(j) Rank:23 Ma MS
PercentofStudentsatProficiency- 37% 37% 32% 30% 43% 17%8thGradeReading(j) Rank:10 Ma MS
By The Numbers NewEngland RuralPeer Maine Average StateAverage U.S.Average HighestState LowestState
NewEngland RuralPeer Maine Average StateAverage U.S.Average HighestState LowestState
NewEngland RuralPeer Maine Average StateAverage* U.S.Average HighestState LowestState
D E M O G R A P H I C SPopulation(a) 1,318,301 2,622,284 1,559,390 11,807,944 36,961,664 544,270
Rank:41 Ca WY
PercentofPopulation18orunder(b) 22.15% 23.3% 25% 25.38% 32.89% 19.53% Rank:49 UT DC
PercentofPopulationover65(b) 15.89% 13.31% 13.47% 12.71% 16.73% 8.07% Rank:3 FL ak
MedianAge(a) 43.4 41.14 39.4 38.4 43.4 29.4 Rank:1 ME UT
E C O N O M I C S GrossDomesticProduct(1)(c) $4,842.00 $11,189.80 $6,568.90 $24,998.96 $175,087.00 $2,511.00
Rank:42 Ca DC
MedianHouseholdIncome(a) $48,032.00 $59,210.20 $47,701.80 $50,803.00 $66,654.00 36,650.00 Rank:30 nH MS
PercentofPopulationLowIncome(2)(a) 29.9% 24.94% 32.49% 33% 47.5% 19.9% Rank:32 MS nH
PercentofPopulationBelowthePovertyLevel(a) 11.4% 9.88% 13.34% 14.3% 23.1% 7.8% Rank:36 MS nH
PrivateSectorShareofPersonalIncome(c) 63.6% 71.59% 66% 69.3% 75.7% 7.2% Rank:41 nH DC
CostofResidentialElectricity(d) $0.1587 $0.1678 $0.1099 $0.1218 $0.28 $0.08 Rank:8 HI ID
PrivateSectorJobGrowth(c) 0.7% -0.01% 5.4% -0.1% 22.2% -18% Rank:24 WY MI
PercentUnionMembers(e) 13% 15.14% 11% 12.3% 26.00% 4.9% Rank:22 nY nC
StateMinimumWage(f) $7.50 $7.81 $6.64 $6.04 $8.67 $- Rank:11 Wa aL,Tn,MS,SC,La
GasTaxPerGallon(g) $0.31 $0.29 $0.23 $0.28 $0.80 $0.14 Rank:18 ak WY
W E l fA R E PercentofHouseholdson 4.9% 2.9% 2.5% 2.6% 6.3% 1.3%
TANFCashAssistance(a) Rank:3 ak La
WorkParticipationRates(6)(h) 11% 32% 44% 29% 63% 3% Rank:49 MS aZ
PercentofHouseholdsReceiving 13.8% 7.2% 8.92% 8.8% 16.2% 4.2%FoodStamps(a) Rank:2 La WY
StateReportedFoodStampErrorRate(i) 10.4% 6.7% 5% 5.7% 12.6% 1.9% Rank:2 RI SD
PercentofPopulationEnrolledinMedicaid(b) 27% 18% 18% 19% 29% 10% Rank:3 Ca nV
MedicaidEligibilityasPercent 200% 149% 64% 86% 215% 8%ofFederalPoverty(b) Rank:3 Mn ak
WelfareExpendituresasPercent 30.50% 25.9% 21.3% 23.7% 32.8% 12.9%ofStateExpenditures(a) Rank:2 Tn WY
TA x / f I S C A l CombinedStateandLocalSalesTaxRate(g) 5% 5.05% 5% 6.27% 9.44% 0%
Rank:44 Tn OR,Mn,nH,DE
StateandLocalSalesTax 2.3% 1.3% 2.4% 2.53% 5% 0%as%ofPersonalIncome(c) Rank:30 Wa OR,Mn,nH,DE
TopStateIndividualIncomeTaxRate(g) 8.5% 6.35% 5.32% 5.67% 11% 0% Rank:9 OR TX,nV,FL,WY,Wa,SD,ak
StateandLocalIndividualIncomeTax 3.3% 2.6% 1.7% 2.53% 4.95% 0%as%ofPersonalIncome(c) Rank:12 nY TX,nV,FL,WY,Wa,SD,ak
StateandLocalPropertyTax 4.6% 4.59% 3.46% 3.4% 5.4% 1.5%as%ofPersonalIncome(c) Rank:6 nH aL
StateandLocalTaxas%ofPersonalincome(c) 12.6% 10.93% 11% 11.04% 33.4% 8.3% Rank:7 ak SD
TopStateCorporateIncomeTaxRate(b) 8.93% 8.35% 6.22% 6.51% 12% 0.00% Rank:9 Ia MI,nV,OH,SD,TX,Wa,WY
StateandLocalTaxBurdenPerCapita(b) $3,832.00 $5,033.00 $3,498.20 $3,920.96 $7,256.00 $2,067.00 Rank:24 CT aL
StateTaxRevenuePerCapita(l) $2,647.00 $2,944.00 $2,830.10 $2,334.00 $7,092.00 $1,567.00 Rank:14 ak SC
StateSpendingPerCapita(b) $5,628.00 $6,534.00 $6,252.70 $4,926.00 $17,907.00 $3,380.00 Rank:17 ak TX
StateDebtPerCapita(g) $4,092.00 $8,006.40 $3,567.10 $3,415.00 $11,357.00 $773.00 Rank:15 Ma Tn
UnfundedLiabilitiesPerCapita(m) $11,896.72 $12,116.25 $9,157.74 $10,741.56 $20,028.44 $4,882.29 Rank:17 RI nE
PercentStateGovernmentWorkerCompensation 20.5% 13.96% 18.41% 6.47% 35.3% -6.7%AbovePrivateSectorAverage(c) Rank:12 VT Ma
StateGovernmentWorkers 5.512 5.186 6.844 4.739 15.16 3.133Per100PrivateSectorWorkers(c) Rank:21 HI IL
Visit mainepolicy.org for full list of sources and data
*Rural peer states: Arkansas, Iowa, Mississippi, Montana, New Hampshire, North Dakota, South Dakota, Vermont, West Virginia, Wyoming
Notes: (1) Millions of Dollars (2) 200% of Federal Poverty Level (3) Per Kilowatthour (4) 25 Years or Older (5) One Child (6) All TANF families
Sources: (a) U.S. Census (b) Kaiser Foundation (c) Bureau of Economic Analysis (d) US Energy Information Administration (e) Bureau of Labor Statistics (f) U.S. Department of Labor (g) The Tax Foundation (h) Administration for Children and Families (i) U.S. Government Accountability Office (j) National Center for Education Statistics (k) National Center for Higher Education Management Systems (l) Federation of Tax Administrators (m) The Mercatus Center
H E A lT H C A R E PercentUnder65WithPrivateInsurance(b) 62% 71% 66% 62% 77% 50%
Rank:35 nH nM
PercentUnder65withMedicaid 26% 18% 18% 20% 27% 10%orPublicCoverage(b) Rank:2 MS UT
PercentUnder65InsuredPrivateorPublic(b) 88% 89% 84% 82% 94% 72% Rank:7 Ma TX
PercentofSmallBusinesses 53.8% 60.36% 49.09% 55% 85.4% 39.5%OfferingHealthInsurance(b) Rank:25 HI MT
AveragePremium-SingleCoverage $5,119.00 $5,092.80 $4,520.50 $4,669.00 $6,047.00 $3,717.00forSmallBusinesses(b) Rank:6 ak aR
MedicaidSpendingPerCapita(b) $1,568.56 $1,345.20 $1,034.78 $1,027.48 $1,740.82 $420.38 Rank:4 RI nV
MedicaidIncomeLimitfor $30,014.20 $21,709.30 $9,266.52 $12,773.71 $31,325.50 $2,476.90Non-DisabledParentUnder65(5)(b) Rank:3 Mn aR
PercentofAdultsWhoSmoke(b) 18.10% 16.58% 19.73% 18.91% 26.5% 9.3% Rank:27 WV UT
PercentofAdultsWhoAreObese, 61.90% 57.34% 62.44% 60.8% 67.8% 49.8%BMIof25+(b) Rank:24 MS DC
E D u C AT I O N AverageTuitionPublic2-YearCollege(j) $3,272.00 $4,002.40 $3,392.20 $2,137.00 $6,001.00 $586.00
Rank:11 nH Ca
AverageTuitionPublic4-YearCollege(j) $8,018.00 $9,049.80 $6,340.50 $6,319.00 $11,316.00 $3,057.00 Rank:12 VT WY
StateandLocalTaxpayerFunding $6,804.00 $6,452.80 $6,267.50 $7,059.00 $15,151.00 $3,167.00PerFTEStudent(k) Rank:28 WY VT
PercentofBachelor’sStudents 56.80% 64.40% 51.1% 55.9% 69.1% 22.1%GraduatingWithin6Years(k) Rank:20 Ma ak
PercentofAdults25-44 35.42% 47.16% 39% 39.26% 52.69% 28.3%WithAssociate’sorHigher(k) Rank:27 Ma WV
PercentWithHighSchoolDiplomaorHigher(4)(k) 81.32% 87.4% 84.35% 89.63% 91.63% 79.62% Rank:26 aZ VT
SpendingPerK-12Student(j) $11,644.00 $12,927.00 $9,822.60 $9,683.00 $16,163.00 $5,706.00 Rank:12 nJ UT
HighSchoolGraduationRate(j) 79.10% 82.6% 80% 74.9% 89.6% 51.3% Rank:18 WI nV
PercentofNinthGradersEnrolling 48.20% 48.9% 48% 44% 59.6% 26.4%inCollegeby19(k) Rank:14 SD nV
PercentofStudentsatProficiency- 34% 39% 33% 32% 51% 17%8thGradeMath(j) Rank:23 Ma MS
PercentofStudentsatProficiency- 37% 37% 32% 30% 43% 17%8thGradeReading(j) Rank:10 Ma MS
By The Numbers
NewEngland RuralPeer Maine Average StateAverage U.S.Average HighestState LowestState
NewEngland RuralPeer Maine Average StateAverage U.S.Average HighestState LowestState
NewEngland RuralPeer Maine Average StateAverage* U.S.Average HighestState LowestState
D E M O G R A P H I C SPopulation(a) 1,318,301 2,622,284 1,559,390 11,807,944 36,961,664 544,270
Rank:41 Ca WY
PercentofPopulation18orunder(b) 22.15% 23.3% 25% 25.38% 32.89% 19.53% Rank:49 UT DC
PercentofPopulationover65(b) 15.89% 13.31% 13.47% 12.71% 16.73% 8.07% Rank:3 FL ak
MedianAge(a) 43.4 41.14 39.4 38.4 43.4 29.4 Rank:1 ME UT
E C O N O M I C S GrossDomesticProduct(1)(c) $4,842.00 $11,189.80 $6,568.90 $24,998.96 $175,087.00 $2,511.00
Rank:42 Ca DC
MedianHouseholdIncome(a) $48,032.00 $59,210.20 $47,701.80 $50,803.00 $66,654.00 36,650.00 Rank:30 nH MS
PercentofPopulationLowIncome(2)(a) 29.9% 24.94% 32.49% 33% 47.5% 19.9% Rank:32 MS nH
PercentofPopulationBelowthePovertyLevel(a) 11.4% 9.88% 13.34% 14.3% 23.1% 7.8% Rank:36 MS nH
PrivateSectorShareofPersonalIncome(c) 63.6% 71.59% 66% 69.3% 75.7% 7.2% Rank:41 nH DC
CostofResidentialElectricity(d) $0.1587 $0.1678 $0.1099 $0.1218 $0.28 $0.08 Rank:8 HI ID
PrivateSectorJobGrowth(c) 0.7% -0.01% 5.4% -0.1% 22.2% -18% Rank:24 WY MI
PercentUnionMembers(e) 13% 15.14% 11% 12.3% 26.00% 4.9% Rank:22 nY nC
StateMinimumWage(f) $7.50 $7.81 $6.64 $6.04 $8.67 $- Rank:11 Wa aL,Tn,MS,SC,La
GasTaxPerGallon(g) $0.31 $0.29 $0.23 $0.28 $0.80 $0.14 Rank:18 ak WY
W E l fA R E PercentofHouseholdson 4.9% 2.9% 2.5% 2.6% 6.3% 1.3%
TANFCashAssistance(a) Rank:3 ak La
WorkParticipationRates(6)(h) 11% 32% 44% 29% 63% 3% Rank:49 MS aZ
PercentofHouseholdsReceiving 13.8% 7.2% 8.92% 8.8% 16.2% 4.2%FoodStamps(a) Rank:2 La WY
StateReportedFoodStampErrorRate(i) 10.4% 6.7% 5% 5.7% 12.6% 1.9% Rank:2 RI SD
PercentofPopulationEnrolledinMedicaid(b) 27% 18% 18% 19% 29% 10% Rank:3 Ca nV
MedicaidEligibilityasPercent 200% 149% 64% 86% 215% 8%ofFederalPoverty(b) Rank:3 Mn ak
WelfareExpendituresasPercent 30.50% 25.9% 21.3% 23.7% 32.8% 12.9%ofStateExpenditures(a) Rank:2 Tn WY
TA x / f I S C A l CombinedStateandLocalSalesTaxRate(g) 5% 5.05% 5% 6.27% 9.44% 0%
Rank:44 Tn OR,Mn,nH,DE
StateandLocalSalesTax 2.3% 1.3% 2.4% 2.53% 5% 0%as%ofPersonalIncome(c) Rank:30 Wa OR,Mn,nH,DE
TopStateIndividualIncomeTaxRate(g) 8.5% 6.35% 5.32% 5.67% 11% 0% Rank:9 OR TX,nV,FL,WY,Wa,SD,ak
StateandLocalIndividualIncomeTax 3.3% 2.6% 1.7% 2.53% 4.95% 0%as%ofPersonalIncome(c) Rank:12 nY TX,nV,FL,WY,Wa,SD,ak
StateandLocalPropertyTax 4.6% 4.59% 3.46% 3.4% 5.4% 1.5%as%ofPersonalIncome(c) Rank:6 nH aL
StateandLocalTaxas%ofPersonalincome(c) 12.6% 10.93% 11% 11.04% 33.4% 8.3% Rank:7 ak SD
TopStateCorporateIncomeTaxRate(b) 8.93% 8.35% 6.22% 6.51% 12% 0.00% Rank:9 Ia MI,nV,OH,SD,TX,Wa,WY
StateandLocalTaxBurdenPerCapita(b) $3,832.00 $5,033.00 $3,498.20 $3,920.96 $7,256.00 $2,067.00 Rank:24 CT aL
StateTaxRevenuePerCapita(l) $2,647.00 $2,944.00 $2,830.10 $2,334.00 $7,092.00 $1,567.00 Rank:14 ak SC
StateSpendingPerCapita(b) $5,628.00 $6,534.00 $6,252.70 $4,926.00 $17,907.00 $3,380.00 Rank:17 ak TX
StateDebtPerCapita(g) $4,092.00 $8,006.40 $3,567.10 $3,415.00 $11,357.00 $773.00 Rank:15 Ma Tn
UnfundedLiabilitiesPerCapita(m) $11,896.72 $12,116.25 $9,157.74 $10,741.56 $20,028.44 $4,882.29 Rank:17 RI nE
PercentStateGovernmentWorkerCompensation 20.5% 13.96% 18.41% 6.47% 35.3% -6.7%AbovePrivateSectorAverage(c) Rank:12 VT Ma
StateGovernmentWorkers 5.512 5.186 6.844 4.739 15.16 3.133Per100PrivateSectorWorkers(c) Rank:21 HI IL
Visit mainepolicy.org for full list of sources and data
*Rural peer states: Arkansas, Iowa, Mississippi, Montana, New Hampshire, North Dakota, South Dakota, Vermont, West Virginia, Wyoming
Notes: (1) Millions of Dollars (2) 200% of Federal Poverty Level (3) Per Kilowatthour (4) 25 Years or Older (5) One Child (6) All TANF families
Sources: (a) U.S. Census (b) Kaiser Foundation (c) Bureau of Economic Analysis (d) US Energy Information Administration (e) Bureau of Labor Statistics (f) U.S. Department of Labor (g) The Tax Foundation (h) Administration for Children and Families (i) U.S. Government Accountability Office (j) National Center for Education Statistics (k) National Center for Higher Education Management Systems (l) Federation of Tax Administrators (m) The Mercatus Center
H E A lT H C A R E PercentUnder65WithPrivateInsurance(b) 62% 71% 66% 62% 77% 50%
Rank:35 nH nM
PercentUnder65withMedicaid 26% 18% 18% 20% 27% 10%orPublicCoverage(b) Rank:2 MS UT
PercentUnder65InsuredPrivateorPublic(b) 88% 89% 84% 82% 94% 72% Rank:7 Ma TX
PercentofSmallBusinesses 53.8% 60.36% 49.09% 55% 85.4% 39.5%OfferingHealthInsurance(b) Rank:25 HI MT
AveragePremium-SingleCoverage $5,119.00 $5,092.80 $4,520.50 $4,669.00 $6,047.00 $3,717.00forSmallBusinesses(b) Rank:6 ak aR
MedicaidSpendingPerCapita(b) $1,568.56 $1,345.20 $1,034.78 $1,027.48 $1,740.82 $420.38 Rank:4 RI nV
MedicaidIncomeLimitfor $30,014.20 $21,709.30 $9,266.52 $12,773.71 $31,325.50 $2,476.90Non-DisabledParentUnder65(5)(b) Rank:3 Mn aR
PercentofAdultsWhoSmoke(b) 18.10% 16.58% 19.73% 18.91% 26.5% 9.3% Rank:27 WV UT
PercentofAdultsWhoAreObese, 61.90% 57.34% 62.44% 60.8% 67.8% 49.8%BMIof25+(b) Rank:24 MS DC
E D u C AT I O N AverageTuitionPublic2-YearCollege(j) $3,272.00 $4,002.40 $3,392.20 $2,137.00 $6,001.00 $586.00
Rank:11 nH Ca
AverageTuitionPublic4-YearCollege(j) $8,018.00 $9,049.80 $6,340.50 $6,319.00 $11,316.00 $3,057.00 Rank:12 VT WY
StateandLocalTaxpayerFunding $6,804.00 $6,452.80 $6,267.50 $7,059.00 $15,151.00 $3,167.00PerFTEStudent(k) Rank:28 WY VT
PercentofBachelor’sStudents 56.80% 64.40% 51.1% 55.9% 69.1% 22.1%GraduatingWithin6Years(k) Rank:20 Ma ak
PercentofAdults25-44 35.42% 47.16% 39% 39.26% 52.69% 28.3%WithAssociate’sorHigher(k) Rank:27 Ma WV
PercentWithHighSchoolDiplomaorHigher(4)(k) 81.32% 87.4% 84.35% 89.63% 91.63% 79.62% Rank:26 aZ VT
SpendingPerK-12Student(j) $11,644.00 $12,927.00 $9,822.60 $9,683.00 $16,163.00 $5,706.00 Rank:12 nJ UT
HighSchoolGraduationRate(j) 79.10% 82.6% 80% 74.9% 89.6% 51.3% Rank:18 WI nV
PercentofNinthGradersEnrolling 48.20% 48.9% 48% 44% 59.6% 26.4%inCollegeby19(k) Rank:14 SD nV
PercentofStudentsatProficiency- 34% 39% 33% 32% 51% 17%8thGradeMath(j) Rank:23 Ma MS
PercentofStudentsatProficiency- 37% 37% 32% 30% 43% 17%8thGradeReading(j) Rank:10 Ma MS
By The Numbers
The Maine Heritage Policy Center (MHPC) is a nonpartisan, not-for-profit research and advocacy organization
committed to proven free market reforms that create greater prosperity and limited government in Maine.
MHPC researches and formulates innovative public policy solutions in five key areas: economy/taxation,
education, health care, government transparency and constitutional government.
Governed by an independent Board of Directors, MHPC relies on the generous support from individuals,
corporations, and foundations, and does not accept government funds or perform contract work.
Contributions to The Maine Heritage Policy Center are tax-deductible to the extent allowed by law.
Post Office Box 7829 | Portland, Maine 04112207.321.2550 | www.mainepolicy.org | [email protected]