Embed Size (px)
Citation preview
BY THE NUMBERS: CANADIAN GHG EMISSIONS 1
Lawrence National Centre for Policy and Management
Lawrence National Centre for Policy and Management
Lawrence National Centre for Policy and Management
Lawrence National Centre for Policy and Management
Lawrence National Centre for Policy and Management
Lawrence National Centre for Policy and Management
Unit logo examples
Unit full signature examples
PMS 3308PMS 268
PMS 3308PMS 268 Lawrence National Centre
for Policy and Management
CMYK
100% K
Cool Grey 9
Reverse Reference
Reverse Version
Light GreyPMS Cool Grey 7
C 0M 0 Y 0K 47
Warm GreyPMS 416
C 28M 185 Y 29K 51
Light Warm GreyPMS 414
C 13M 8 Y 17K 26
SandPMS 4525
C 9M 12 Y 47K 18
Paul Boothe and Félix-A. Boudreault Lawrence National Centre for Policy and ManagementIvey Business School at Western University
BY THE NUMBERS:CANADIAN GHG EMISSIONS

BY THE NUMBERS: CANADIAN GHG EMISSIONS
© 2016, Lawrence National Centre for Policy and ManagementThe views expressed in this paper are our own and should not be attributed to any other individual or organization. This research was supported, without editorial input, by the Ontario Ministry of Environment and Climate Change. Such support does not indicate endorsement of the contents of the paper by the Government of Ontario.
BY THE NUMBERS: CANADIAN GHG EMISSIONS 3
EXECUTIVE SUMMARY
• Canada’sgreenhousegas(GHG)emissionscurrentlyrepresentabout1.6percentoftheglobaltotal.Canadaisamongthetop10globalemittersandoneofthelargestdevelopedworldpercapitaemitterofGHGs.
• CanadianfederalgovernmentshavecommittedtoreduceannualGHGemissionsfromthecurrentlevelof726megatonnes(Mt)to622Mtin2020and525Mtin2030.
• WithinCanada,GHGemissionsvarywidelyacrossprovincesrangingfrom267MtinAlbertato1.8MtinPEIin2013.
• Inpercapitaterms,SaskatchewanandAlbertaareamongthedevelopedworld’slargestemittersat68and67tonnesrespectively.PercapitaemissionsinBC,Ontario,andQuebecareinthe10-14tonnerange,comparabletobestperformersinWesternEurope.
• ForprovinceswithannouncedGHGemissiontargets,thelevelofambitionvarieswidely.Albertaplanstoincreaseemissionstowards2020,andthenreturntotoday’slevelsby2030,whileOntarioQuebecandManitobaplantoreduceemissionsby56,27and8Mtrespectively.
• Evenifallprovincialtargetswerefullyachieved,CanadawouldstillneedtoreduceGHGemissionsbyanadditional45Mtin2020and55Mtin2030tomeetitsinternationalcommitments.
PAUL BOOTHE AND FÉLIX-A. BOUDREAULT
BY THE NUMBERS: CANADIAN GHG EMISSIONS
1. http://cait.wri.org/historical, consulted January 2016. 2. http://data.worldbank.org/indicator/SP.POP.TOTL, consulted January 2016.3. http://www4.unfccc.int/submissions/INDC/Published%20Documents/Canada/1/INDC%20-%20Canada%20-%20English.pdf, consulted January 20164. http://unfccc.int/focus/indc_portal/items/9240.php, consulted January 2016.
INTRODUCTION
AlothaschangedrecentlyintheworldofCanadianclimatechangepolicy.WiththeelectionofnewgovernmentsinAlbertaandOttawa,thereisasensethatreducinggreenhousegasemissions(GHGs)isbackonthepolicyagenda.Thepreviousfederalgovernment’sapproachofambitioustargetspluspolicyinactionis,ifoneistobelievethepronouncementsoffederalandprovincialpoliticalleaders,abouttobereplacedbyoneofambitioustargetsplusvigorouspolicyaction.EvenprovincesthathaverelativelylowemissionsbyCanadianstandardshavepledgedtodomore.Thepreviousgovernment’sambitious2030targetsubmittedtotheUnitedNationsFrameworkConventiononClimateChange(UNFCCC),theUNbodyresponsibleforclimatechangenegotiations,hasbeencharacterizedbythenewgovernmentas‘afloorratherthanaceiling.’FederalandprovincialofficialshavebeguntomeettoworkouthowtheywillcoordinatetheiractionstoachieveCanada’stargets.
Yet,despitethisflurryofactivityandthepromiseofconcreteactiontoreduceGHGs,citizenshaverelativelylittleunderstandingofthesimplearithmeticofclimatechangetargets.GiventhemagnitudeofthechallengefacingCanadaandthedelicatenegotiationsthatareyettocome,itisimportantthateveryoneshareaclearunderstandingofwhatwillberequiredbyindividualprovincesandindustriesifCanadaistomatchitsnewrhetoricwithaction.
Inthispaper,welayoutthesimplearithmeticofGHGemissions.WebeginbycomparingCanadatoaselectionofothercountries.WethendisaggregateCanadianemissionsbyprovinceandlookatthetargetsthatdifferentprovinceshavesetfor2020and2030.Wehopethatthisanalysiswillhelpprovidebothacommonunderstandingofthecurrentsituationandafirmfoundationfortacklingthechallengewefaceasasociety.
CANADA IN THE WORLD
Accordingtothelateststatistics,Canadaemitsabout1.6percentoftheworld’sGHGemissions.1Despitethisrelativelylowshare,Canadaisamongthetop10globalemittersonanabsolutebasis,andstandsfirmlyinthetop3foremissionspercapita.Bywayofcomparison,Canada’spopulationmakesupabout0.5percentoftheworldtotalsothatouremissions’shareisabout3timesourpopulationshare.2
CanadaplayedanactiveroleinDecember2015attheParisCOP21(21rstConferenceoftheParties)whichledtoaglobalagreementonmitigation,adaptationandfinancingofclimatechangeaction.ThenewLiberalgovernmentindicatedthat‘Canadaisback’andwantstodoitspartinreducingGHGsathome,andhelpingdevelopingcountriesthatarealreadyfacinghardshipbecauseofclimatechange.
InMay2015,theformerConservativegovernmentsubmitteditsIntendedNationallyDeterminedContribution(INDC)3totheUNFCCCindicatinganeconomy-widetargetofreducingGHGemissionsby30percentbelow2005levelsby2030.Followingthefall2015election,theLiberalGovernmentindicatedthatitconsideredthetargettobea‘floor’,suggestingthataconsultationprocesswithprovinceswouldbelaunchedtodesignacredibleplanforCanadathatmightleadtoanevenmoreambitiousreductiontarget.
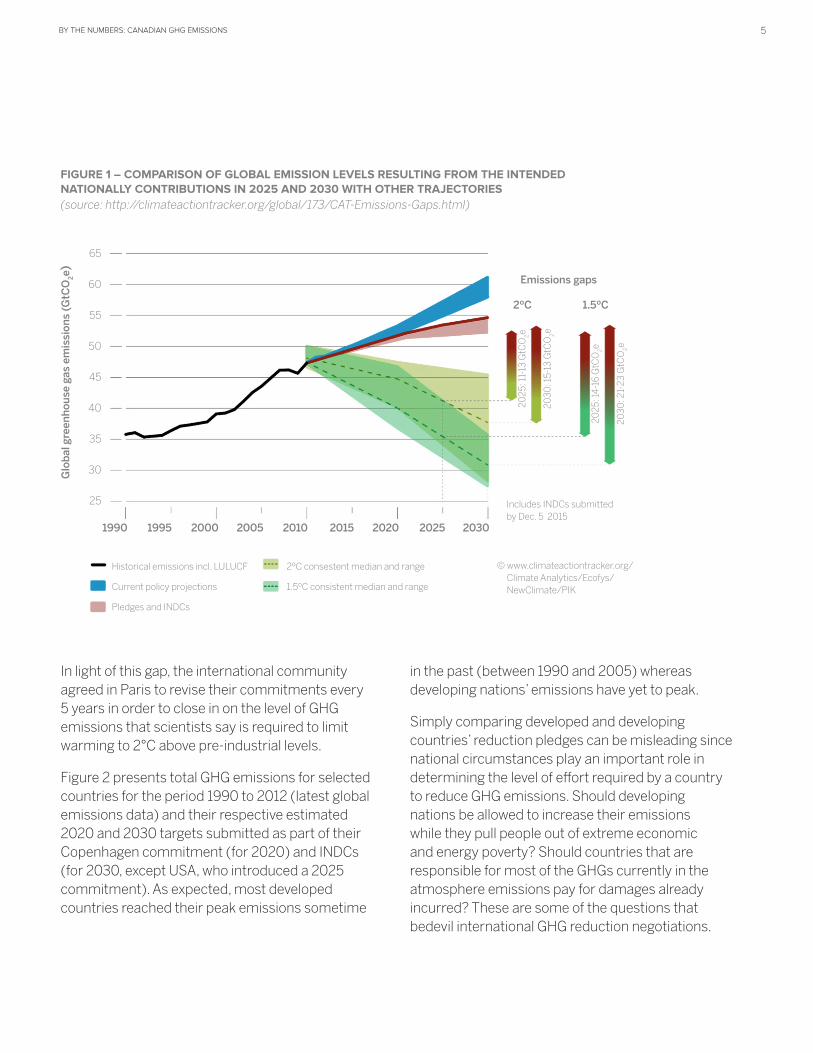
InordertoassessthecumulativeeffectofallINDCsreceivedbeforetheParisConference,theUnitedNationsFrameworkConventiononClimateChangecommissionedasynthesisReport.4Itconcludesthat“aggregateglobalemissionlevelsresultingfromtheimplementationofINDCswillnotfallwithinthe2°Cscenario”,letalonethe1.5°Cscenariothatsomecountries,includingCanada,wereadvocating.Somehaveestimatedthatemissionsin2025willbe11-13gigatonnes(Gt)higherthanthe2°Cscenario,andasmuchas15-17Gthigherby2030(seeFigure1).Toputthegapinperspective,Chinaemittedapproximately11Gtin2012and16GtistheequivalentofthetotalemissionsbyChinaandtheUnitedStatesfor2012.
BY THE NUMBERS: CANADIAN GHG EMISSIONS 5
inthepast(between1990and2005)whereasdevelopingnations’emissionshaveyettopeak.
Simplycomparingdevelopedanddevelopingcountries’reductionpledgescanbemisleadingsincenationalcircumstancesplayanimportantroleindeterminingthelevelofeffortrequiredbyacountrytoreduceGHGemissions.Shoulddevelopingnationsbeallowedtoincreasetheiremissionswhiletheypullpeopleoutofextremeeconomicandenergypoverty?ShouldcountriesthatareresponsibleformostoftheGHGscurrentlyintheatmosphereemissionspayfordamagesalreadyincurred?ThesearesomeofthequestionsthatbedevilinternationalGHGreductionnegotiations.
Inlightofthisgap,theinternationalcommunityagreedinParistorevisetheircommitmentsevery5yearsinordertocloseinonthelevelofGHGemissionsthatscientistssayisrequiredtolimitwarmingto2°Cabovepre-industriallevels.
Figure2presentstotalGHGemissionsforselectedcountriesfortheperiod1990to2012(latestglobalemissionsdata)andtheirrespectiveestimated2020and2030targetssubmittedaspartoftheirCopenhagencommitment(for2020)andINDCs(for2030,exceptUSA,whointroduceda2025commitment).Asexpected,mostdevelopedcountriesreachedtheirpeakemissionssometime
FIGURE 1 – COMPARISON OF GLOBAL EMISSION LEVELS RESULTING FROM THE INTENDED NATIONALLY CONTRIBUTIONS IN 2025 AND 2030 WITH OTHER TRAJECTORIES(source: http://climateactiontracker.org/global/173/CAT-Emissions-Gaps.html)
Glo
bal
gre
enh
ou
se g
as e
mis
sio
ns
(GtC
O2e)
Emissions gaps
2ºC 1.5ºC
65
60
55
50
45
40
35
30
25
1990 1995 2000 2005 2010 2015 2020 2025 2030
IncludesINDCssubmittedbyDec.52015
©www.climateactiontracker.org/ClimateAnalytics/Ecofys/NewClimate/PIK
Historicalemissionsincl.LULUCF
Currentpolicyprojections
PledgesandINDCs
2ºCconsestentmedianandrange
1.5ºCconsistentmedianandrange
2025
:11-
13G
tCO
2e
2030
:15-
13G
tCO
2e
2025
:14
-16
GtC
O2e
2030
:21-
23G
tCO
2e
BY THE NUMBERS: CANADIAN GHG EMISSIONS
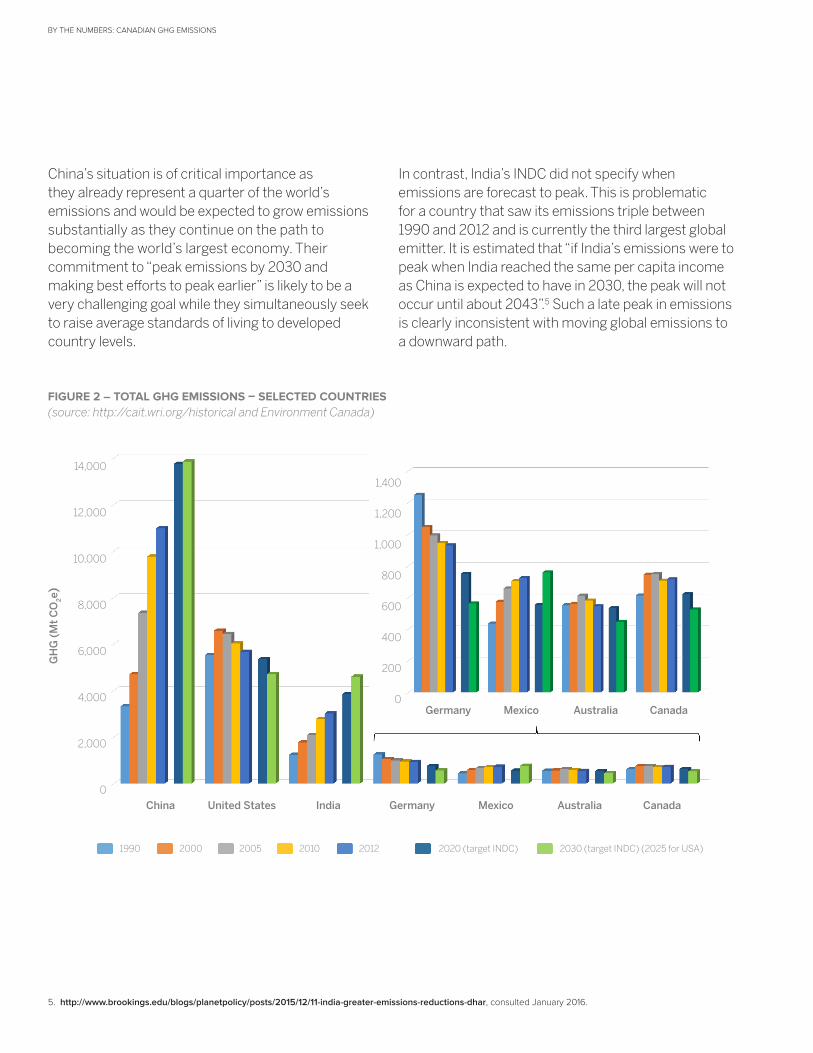
FIGURE 2 – TOTAL GHG EMISSIONS – SELECTED COUNTRIES (source: http://cait.wri.org/historical and Environment Canada)
China’ssituationisofcriticalimportanceastheyalreadyrepresentaquarteroftheworld’semissionsandwouldbeexpectedtogrowemissionssubstantiallyastheycontinueonthepathtobecomingtheworld’slargesteconomy.Theircommitmentto“peakemissionsby2030andmakingbesteffortstopeakearlier”islikelytobeaverychallenginggoalwhiletheysimultaneouslyseektoraiseaveragestandardsoflivingtodevelopedcountrylevels.
Incontrast,India’sINDCdidnotspecifywhenemissionsareforecasttopeak.Thisisproblematicforacountrythatsawitsemissionstriplebetween1990and2012andiscurrentlythethirdlargestglobalemitter.Itisestimatedthat“ifIndia’semissionsweretopeakwhenIndiareachedthesamepercapitaincomeasChinaisexpectedtohavein2030,thepeakwillnotoccuruntilabout2043”.5Suchalatepeakinemissionsisclearlyinconsistentwithmovingglobalemissionstoadownwardpath.
GH
G (
Mt
CO
2e)
14,000
12,000
10,000
8,000
6,000
4,000
2,000
0
1,400
1,200
1,000
800
600
400
200
0
China United States India Germany Mexico Australia Canada
Germany Mexico Australia Canada
5. http://www.brookings.edu/blogs/planetpolicy/posts/2015/12/11-india-greater-emissions-reductions-dhar, consulted January 2016.
1990 2000 2005 2010 2012 2020(targetINDC) 2030(targetINDC)(2025forUSA)
BY THE NUMBERS: CANADIAN GHG EMISSIONS 7
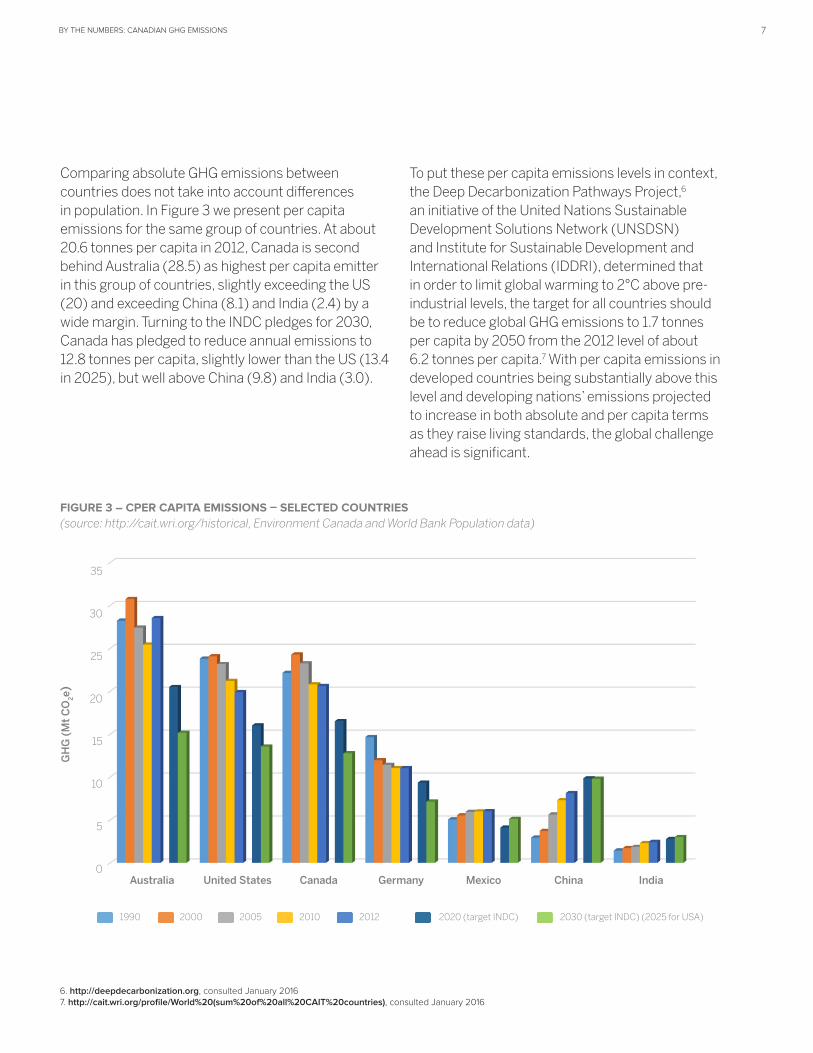
Toputthesepercapitaemissionslevelsincontext,theDeepDecarbonizationPathwaysProject,6aninitiativeoftheUnitedNationsSustainableDevelopmentSolutionsNetwork(UNSDSN)andInstituteforSustainableDevelopmentandInternationalRelations(IDDRI),determinedthatinordertolimitglobalwarmingto2°Cabovepre-industriallevels,thetargetforallcountriesshouldbetoreduceglobalGHGemissionsto1.7tonnespercapitaby2050fromthe2012levelofabout6.2tonnespercapita.7Withpercapitaemissionsindevelopedcountriesbeingsubstantiallyabovethislevelanddevelopingnations’emissionsprojectedtoincreaseinbothabsoluteandpercapitatermsastheyraiselivingstandards,theglobalchallengeaheadissignificant.
ComparingabsoluteGHGemissionsbetweencountriesdoesnottakeintoaccountdifferencesinpopulation.InFigure3wepresentpercapitaemissionsforthesamegroupofcountries.Atabout20.6tonnespercapitain2012,CanadaissecondbehindAustralia(28.5)ashighestpercapitaemitterinthisgroupofcountries,slightlyexceedingtheUS(20)andexceedingChina(8.1)andIndia(2.4)byawidemargin.TurningtotheINDCpledgesfor2030,Canadahaspledgedtoreduceannualemissionsto12.8tonnespercapita,slightlylowerthantheUS(13.4in2025),butwellaboveChina(9.8)andIndia(3.0).
35
30
25
20
15
10
5
0Australia United States Canada Germany Mexico China India
GH
G (
Mt
CO
2e)
1990 2000 2005 2010 2012 2020(targetINDC) 2030(targetINDC)(2025forUSA)
FIGURE 3 – CPER CAPITA EMISSIONS – SELECTED COUNTRIES (source: http://cait.wri.org/historical, Environment Canada and World Bank Population data)
6. http://deepdecarbonization.org, consulted January 20167. http://cait.wri.org/profile/World%20(sum%20of%20all%20CAIT%20countries), consulted January 2016
BY THE NUMBERS: CANADIAN GHG EMISSIONS
CANADA AT HOME
ThedatapresentedintheprevioussectionshowsthatwhileCanadacontributesonlyabout1.6percentofglobalemissions,itisoneoftheworld’stoptenemittersandalsooneoftheitshighestpercapitaemitters.However,theseaggregatestatisticsmaskagooddealofdiversitywithrespecttobothemissionsandclimatepolicyacrossthecountry.InthissectionwedelvemoredeeplyintoCanadianresultsbyprovince.
Inthelastfewyears,muchoftheactiontocombatclimatechangehascomethroughprovincialgovernmentpolicies.SuchpoliciesincludeacarbontaxinBritishColumbia,anewly-announcedhybridofacarbontaxandemissionstradingschemeinAlberta,acap-and-tradesysteminQuebecthatwillshortlybejoinedbyOntarioandManitoba,andstringentelectricityregulationsinOntariotophaseoutcoalandincentivizerenewableenergy.Table1summarizesprovincialplansandcommitmentsasofJanuary2016.
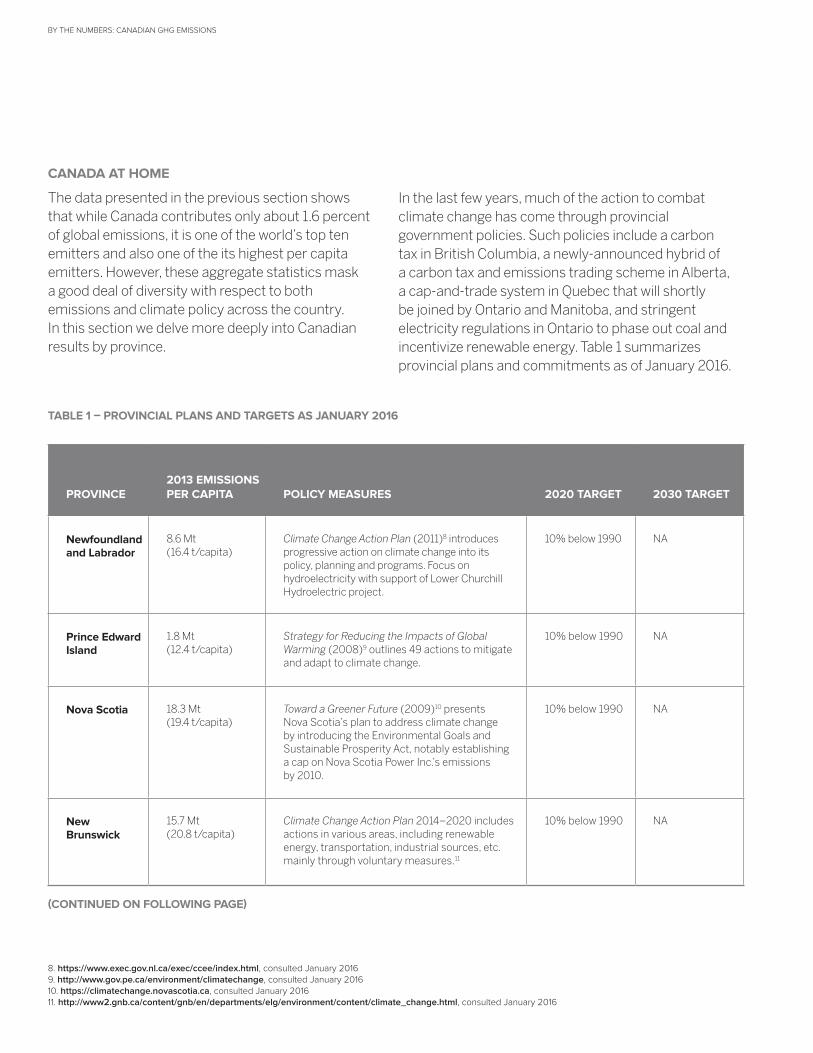
TABLE 1 – PROVINCIAL PLANS AND TARGETS AS JANUARY 2016
PROVINCE2013 EMISSIONS PER CAPITA POLICY MEASURES 2020 TARGET 2030 TARGET
Newfoundland and Labrador
8.6Mt(16.4t/capita)
Climate Change Action Plan (2011)8introducesprogressiveactiononclimatechangeintoitspolicy,planningandprograms.FocusonhydroelectricitywithsupportofLowerChurchillHydroelectricproject.
10%below1990 NA
Prince Edward Island
1.8Mt(12.4t/capita)
Strategy for Reducing the Impacts of Global Warming (2008)9outlines49actionstomitigateandadapttoclimatechange.
10%below1990 NA
Nova Scotia 18.3Mt(19.4t/capita)
Toward a Greener Future (2009)10presentsNovaScotia’splantoaddressclimatechangebyintroducingtheEnvironmentalGoalsandSustainableProsperityAct,notablyestablishingacaponNovaScotiaPowerInc.’semissionsby2010.
10%below1990 NA
New Brunswick
15.7Mt(20.8t/capita)
Climate Change Action Plan2014–2020includesactionsinvariousareas,includingrenewableenergy,transportation,industrialsources,etc.mainlythroughvoluntarymeasures.11
10%below1990 NA
8. https://www.exec.gov.nl.ca/exec/ccee/index.html, consulted January 20169. http://www.gov.pe.ca/environment/climatechange, consulted January 201610. https://climatechange.novascotia.ca, consulted January 201611. http://www2.gnb.ca/content/gnb/en/departments/elg/environment/content/climate_change.html, consulted January 2016
(CONTINUED ON FOLLOWING PAGE)
BY THE NUMBERS: CANADIAN GHG EMISSIONS 9
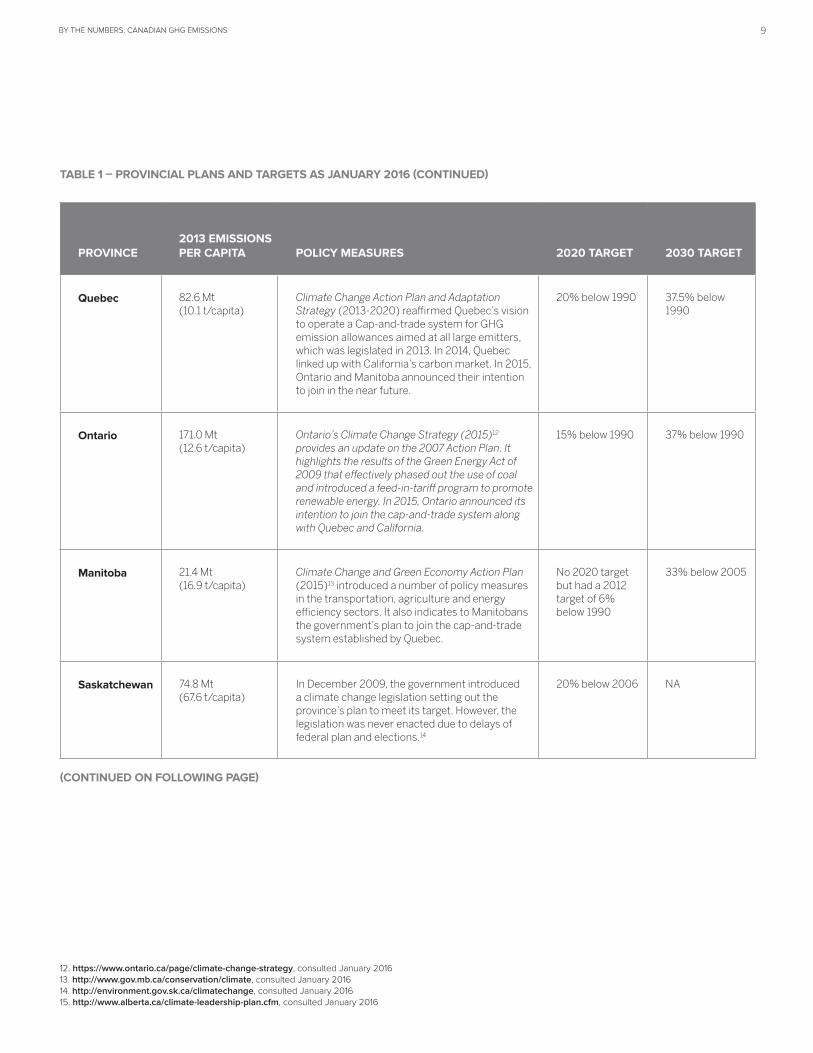
TABLE 1 – PROVINCIAL PLANS AND TARGETS AS JANUARY 2016 (CONTINUED)
PROVINCE2013 EMISSIONS PER CAPITA POLICY MEASURES 2020 TARGET 2030 TARGET
Quebec 82.6Mt(10.1t/capita)
Climate Change Action Planand Adaptation Strategy(2013-2020)reaffirmedQuebec’svisiontooperateaCap-and-tradesystemforGHGemissionallowancesaimedatalllargeemitters,whichwaslegislatedin2013.In2014,QuebeclinkedupwithCalifornia’scarbonmarket.In2015,OntarioandManitobaannouncedtheirintentiontojoininthenearfuture.
20%below1990 37.5%below1990
Ontario 171.0Mt(12.6t/capita)
Ontario’s Climate Change Strategy (2015)12 provides an update on the 2007 Action Plan. It highlights the results of the Green Energy Act of 2009 that effectively phased out the use of coal and introduced a feed-in-tariff program to promote renewable energy. In 2015, Ontario announced its intention to join the cap-and-trade system along with Quebec and California.
15%below1990 37%below1990
Manitoba 21.4Mt(16.9t/capita)
Climate Change and Green Economy Action Plan (2015)13introducedanumberofpolicymeasuresinthetransportation,agricultureandenergyefficiencysectors.ItalsoindicatestoManitobansthegovernment’splantojointhecap-and-tradesystemestablishedbyQuebec.
No2020targetbuthada2012targetof6%below1990
33%below2005
Saskatchewan 74.8Mt(67.6t/capita)
InDecember2009,thegovernmentintroducedaclimatechangelegislationsettingouttheprovince’splantomeetitstarget.However,thelegislationwasneverenactedduetodelaysoffederalplanandelections.14
20%below2006 NA
12. https://www.ontario.ca/page/climate-change-strategy, consulted January 201613. http://www.gov.mb.ca/conservation/climate, consulted January 201614. http://environment.gov.sk.ca/climatechange, consulted January 201615. http://www.alberta.ca/climate-leadership-plan.cfm, consulted January 2016
(CONTINUED ON FOLLOWING PAGE)
BY THE NUMBERS: CANADIAN GHG EMISSIONS
TABLE 1 – PROVINCIAL PLANS AND TARGETS AS JANUARY 2016 (CONTINUED)
PROVINCE2013 EMISSIONS PER CAPITA POLICY MEASURES 2020 TARGET 2030 TARGET
Alberta 267.0Mt(66.6t/capita)
Alberta’s Climate Leadership Plan(2015)15presentsthenewstrategyonclimatechangebasedonrecommendationsputforwardbytheClimateChangeAdvisoryPanel.Detailsofthefinalstrategyarebeingdeveloped,buttheplancovers4keyareas:Phasingoutcoal-generatedelectricityanddevelopingmorerenewableenergy,implementinganewcarbonprice,legislatedoilsandsemissionlimit,andimplementinganewmethaneemissionreductionplan.
Implementationoftheplanisexpectedtoreduceemissionsby20Mtfrombusiness-as-usualscenario(297Mt).
Implementationoftheplanisexpectedtoreduceemissionsby50Mtfrombusiness-as-usualscenario(320Mt).
British Columbia
62.8Mt(13.7t/capita)
Climate Action Plan (2008)16introducesshort,mediumandlong-termtargetsaswellasanumberofprovinciallegislations,includingtheCarbonTaxAct.
33%below2007 40%below2007(targethasbeenproposedbutnotadopted)
Territories 2.0Mt(17.6t/capita)
Yukon Government Climate Change Action Plan (2009),17 NWT’s A Greenhouse Gas Strategy 2011-2015(2011)18andNunavut’sClimate Change Strategy(2003)19allintroduceanumberofmeasurestomitigatebutalsoadapttoclimatechange.
Yukon:CarbonneutralGovernmentrelatedemissionsNWT:limitto+66%from2005
NWT:Returnto2005levels
CANADA 726.1Mt(20.7t/capita)
Federalmeasurestodateincludesectoralregulations(lightandheavyvehicles,electricitystandardsforcoal-firedgeneration,energyefficiencymeasures,etc.)
17%below2005 30%below2005
16. http://www2.gov.bc.ca/gov/content/environment/climate-change/policy-legislation-programs, consulted January 2016. 17. http://www.env.gov.yk.ca/air-water-waste/ccactionplan.php, consulted January 2016.18. https:///www.enr.gov.nt.ca/programs/nwt-climate-change, consulted January 2016. 19. http:///climatechangenunavut.ca, consulted January 2016.20. http:///www.iisd.org/pdf/2012/bc_carbon_tax.pdf, consulted January 2016.
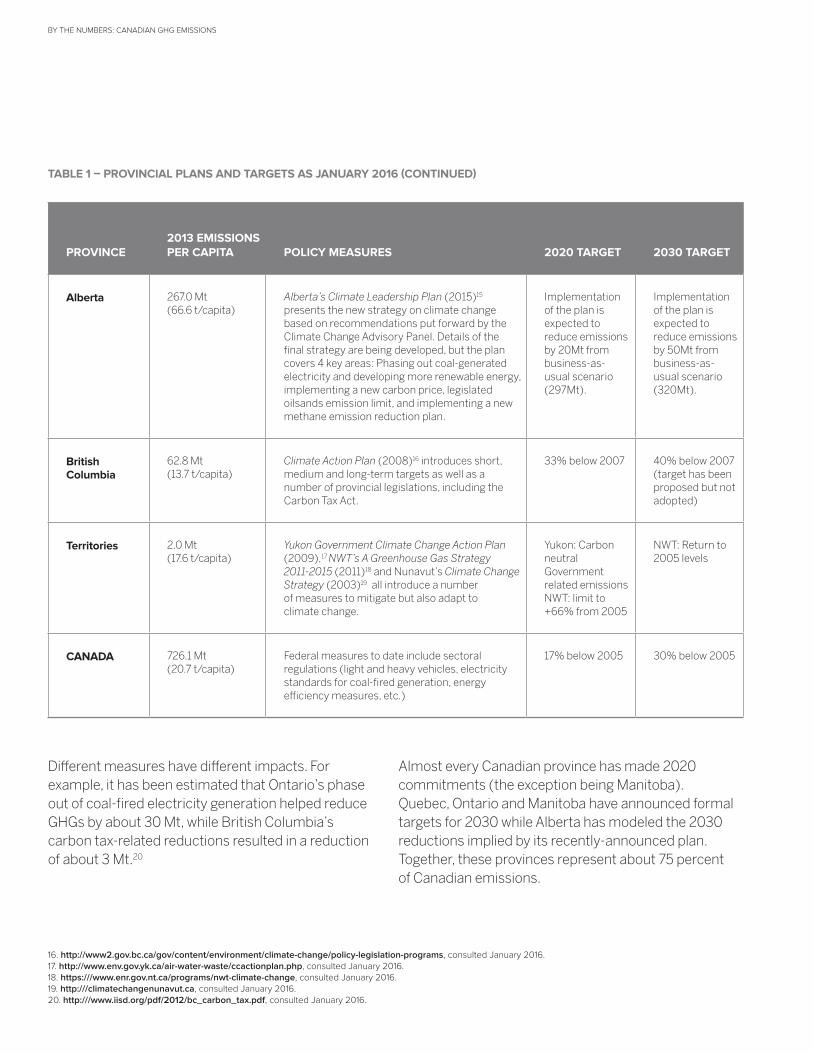
Differentmeasureshavedifferentimpacts.Forexample,ithasbeenestimatedthatOntario’sphaseoutofcoal-firedelectricitygenerationhelpedreduceGHGsbyabout30Mt,whileBritishColumbia’scarbontax-relatedreductionsresultedinareductionofabout3Mt.20
AlmosteveryCanadianprovincehasmade2020commitments(theexceptionbeingManitoba).Quebec,OntarioandManitobahaveannouncedformaltargetsfor2030whileAlbertahasmodeledthe2030reductionsimpliedbyitsrecently-announcedplan.Together,theseprovincesrepresentabout75percentofCanadianemissions.
BY THE NUMBERS: CANADIAN GHG EMISSIONS 11
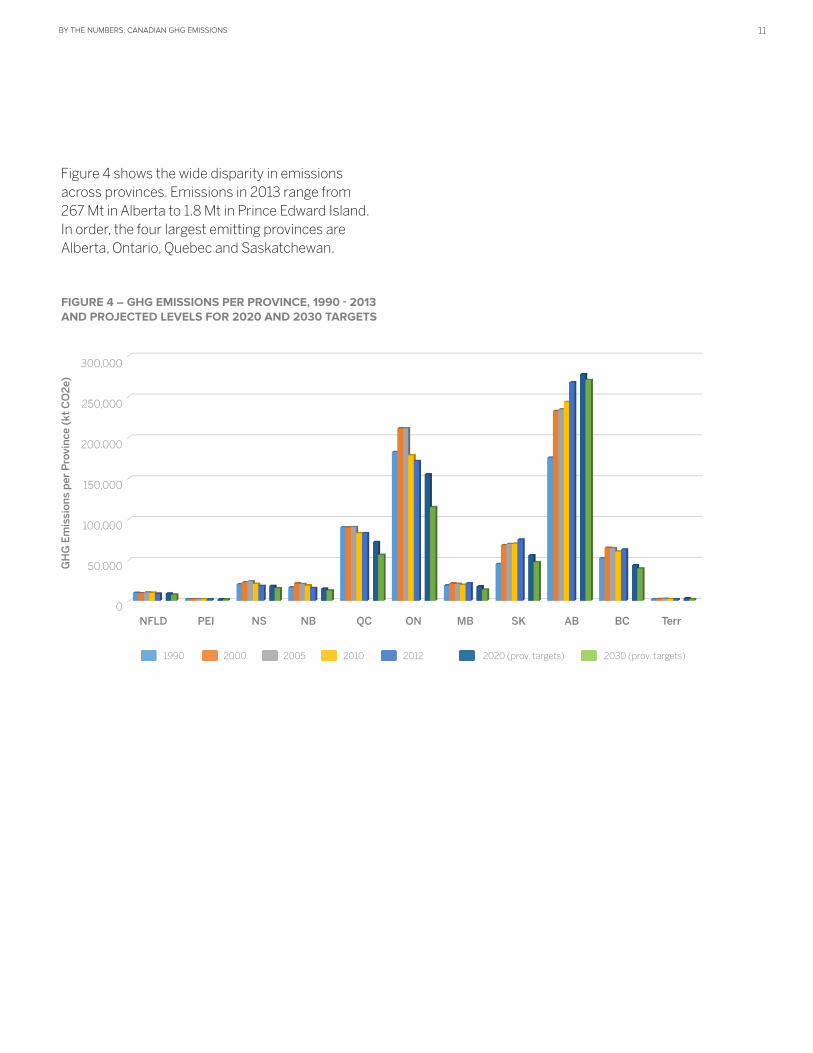
Figure4showsthewidedisparityinemissionsacrossprovinces.Emissionsin2013rangefrom267MtinAlbertato1.8MtinPrinceEdwardIsland.Inorder,thefourlargestemittingprovincesareAlberta,Ontario,QuebecandSaskatchewan.
NFLD PEI NS NB QC ON MB SK AB BC Terr
1990 2000 2005 2010 2012 2020(prov.targets) 2030(prov.targets)
FIGURE 4 – GHG EMISSIONS PER PROVINCE, 1990 - 2013 AND PROJECTED LEVELS FOR 2020 AND 2030 TARGETS
300,000
250,000
200.000
150,000
100,000
50.000
0
GH
G E
mis
sio
ns
per
Pro
vin
ce (
kt C
O2
e)
PROVINCE2013 EMISSIONS PER CAPITA POLICY MEASURES 2020 TARGET 2030 TARGET
Alberta 267.0Mt(66.6t/capita)
Alberta’s Climate Leadership Plan(2015)15presentsthenewstrategyonclimatechangebasedonrecommendationsputforwardbytheClimateChangeAdvisoryPanel.Detailsofthefinalstrategyarebeingdeveloped,buttheplancovers4keyareas:Phasingoutcoal-generatedelectricityanddevelopingmorerenewableenergy,implementinganewcarbonprice,legislatedoilsandsemissionlimit,andimplementinganewmethaneemissionreductionplan.
Implementationoftheplanisexpectedtoreduceemissionsby20Mtfrombusiness-as-usualscenario(297Mt).
Implementationoftheplanisexpectedtoreduceemissionsby50Mtfrombusiness-as-usualscenario(320Mt).
British Columbia
62.8Mt(13.7t/capita)
Climate Action Plan (2008)16introducesshort,mediumandlong-termtargetsaswellasanumberofprovinciallegislations,includingtheCarbonTaxAct.
33%below2007 40%below2007(targethasbeenproposedbutnotadopted)
Territories 2.0Mt(17.6t/capita)
Yukon Government Climate Change Action Plan (2009),17 NWT’s A Greenhouse Gas Strategy 2011-2015(2011)18andNunavut’sClimate Change Strategy(2003)19allintroduceanumberofmeasurestomitigatebutalsoadapttoclimatechange.
Yukon:CarbonneutralGovernmentrelatedemissionsNWT:limitto+66%from2005
NWT:Returnto2005levels
CANADA 726.1Mt(20.7t/capita)
Federalmeasurestodateincludesectoralregulations(lightandheavyvehicles,electricitystandardsforcoal-firedgeneration,energyefficiencymeasures,etc.)
17%below2005 30%below2005
BY THE NUMBERS: CANADIAN GHG EMISSIONS
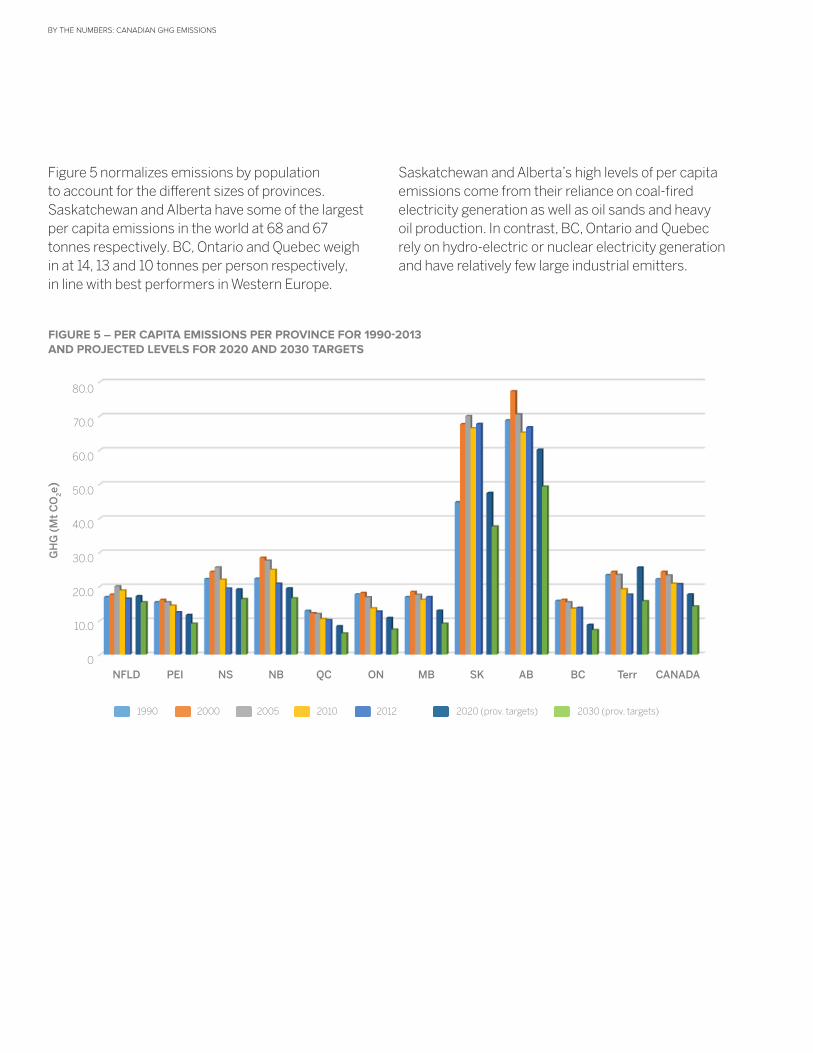
Figure5normalizesemissionsbypopulationtoaccountforthedifferentsizesofprovinces.SaskatchewanandAlbertahavesomeofthelargestpercapitaemissionsintheworldat68and67tonnesrespectively.BC,OntarioandQuebecweighinat14,13and10tonnesperpersonrespectively,inlinewithbestperformersinWesternEurope.
SaskatchewanandAlberta’shighlevelsofpercapitaemissionscomefromtheirrelianceoncoal-firedelectricitygenerationaswellasoilsandsandheavyoilproduction.Incontrast,BC,OntarioandQuebecrelyonhydro-electricornuclearelectricitygenerationandhaverelativelyfewlargeindustrialemitters.
80.0
70.0
60.0
50.0
40.0
30.0
20.0
10.0
0
GH
G (
Mt
CO
2e)
FIGURE 5 – PER CAPITA EMISSIONS PER PROVINCE FOR 1990-2013 AND PROJECTED LEVELS FOR 2020 AND 2030 TARGETS
NFLD PEI NS NB QC ON MB SK AB BC Terr CANADA
1990 2000 2005 2010 2012 2020(prov.targets) 2030(prov.targets)
BY THE NUMBERS: CANADIAN GHG EMISSIONS 13
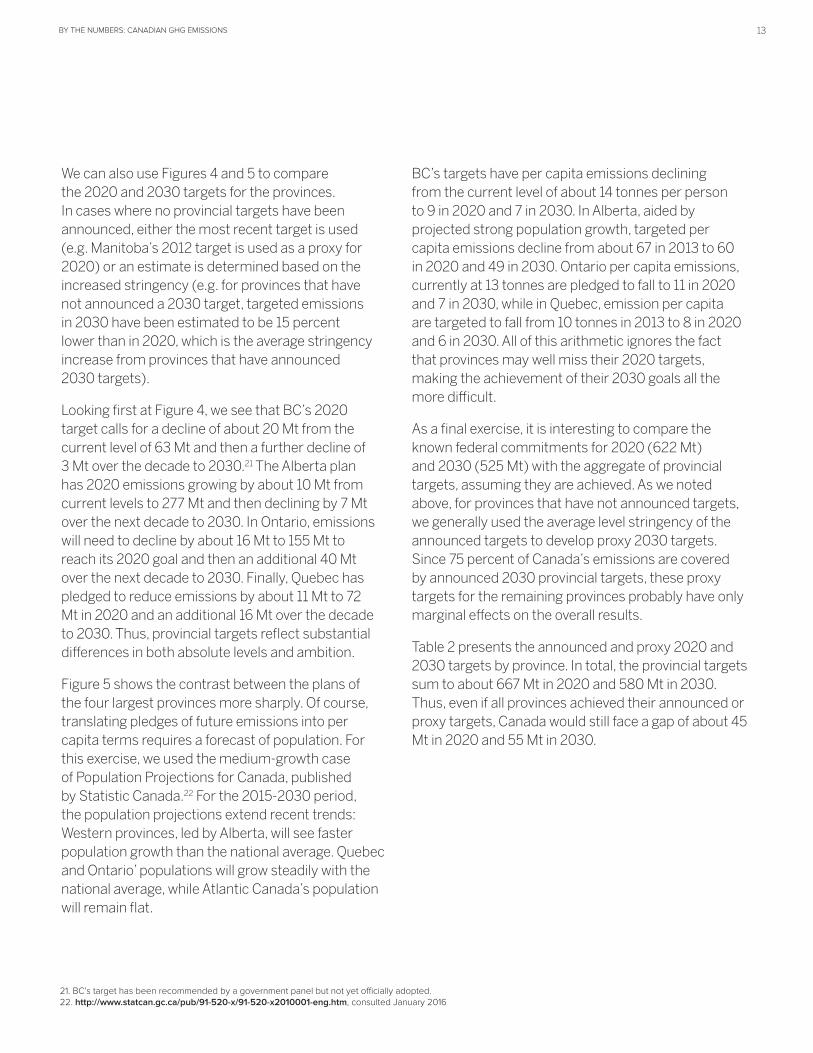
WecanalsouseFigures4and5tocomparethe2020and2030targetsfortheprovinces.Incaseswherenoprovincialtargetshavebeenannounced,eitherthemostrecenttargetisused(e.g.Manitoba’s2012targetisusedasaproxyfor2020)oranestimateisdeterminedbasedontheincreasedstringency(e.g.forprovincesthathavenotannounceda2030target,targetedemissionsin2030havebeenestimatedtobe15percentlowerthanin2020,whichistheaveragestringencyincreasefromprovincesthathaveannounced2030targets).
LookingfirstatFigure4,weseethatBC’s2020targetcallsforadeclineofabout20Mtfromthecurrentlevelof63Mtandthenafurtherdeclineof3Mtoverthedecadeto2030.21TheAlbertaplanhas2020emissionsgrowingbyabout10Mtfromcurrentlevelsto277Mtandthendecliningby7Mtoverthenextdecadeto2030.InOntario,emissionswillneedtodeclinebyabout16Mtto155Mttoreachits2020goalandthenanadditional40Mtoverthenextdecadeto2030.Finally,Quebechaspledgedtoreduceemissionsbyabout11Mtto72Mtin2020andanadditional16Mtoverthedecadeto2030.Thus,provincialtargetsreflectsubstantialdifferencesinbothabsolutelevelsandambition.
Figure5showsthecontrastbetweentheplansofthefourlargestprovincesmoresharply.Ofcourse,translatingpledgesoffutureemissionsintopercapitatermsrequiresaforecastofpopulation.Forthisexercise,weusedthemedium-growthcaseofPopulationProjectionsforCanada,publishedbyStatisticCanada.22Forthe2015-2030period,thepopulationprojectionsextendrecenttrends:Westernprovinces,ledbyAlberta,willseefasterpopulationgrowththanthenationalaverage.QuebecandOntario’populationswillgrowsteadilywiththenationalaverage,whileAtlanticCanada’spopulationwillremainflat.
BC’stargetshavepercapitaemissionsdecliningfromthecurrentlevelofabout14tonnesperpersonto9in2020and7in2030.InAlberta,aidedbyprojectedstrongpopulationgrowth,targetedpercapitaemissionsdeclinefromabout67in2013to60in2020and49in2030.Ontariopercapitaemissions,currentlyat13tonnesarepledgedtofallto11in2020and7in2030,whileinQuebec,emissionpercapitaaretargetedtofallfrom10tonnesin2013to8in2020and6in2030.Allofthisarithmeticignoresthefactthatprovincesmaywellmisstheir2020targets,makingtheachievementoftheir2030goalsallthemoredifficult.
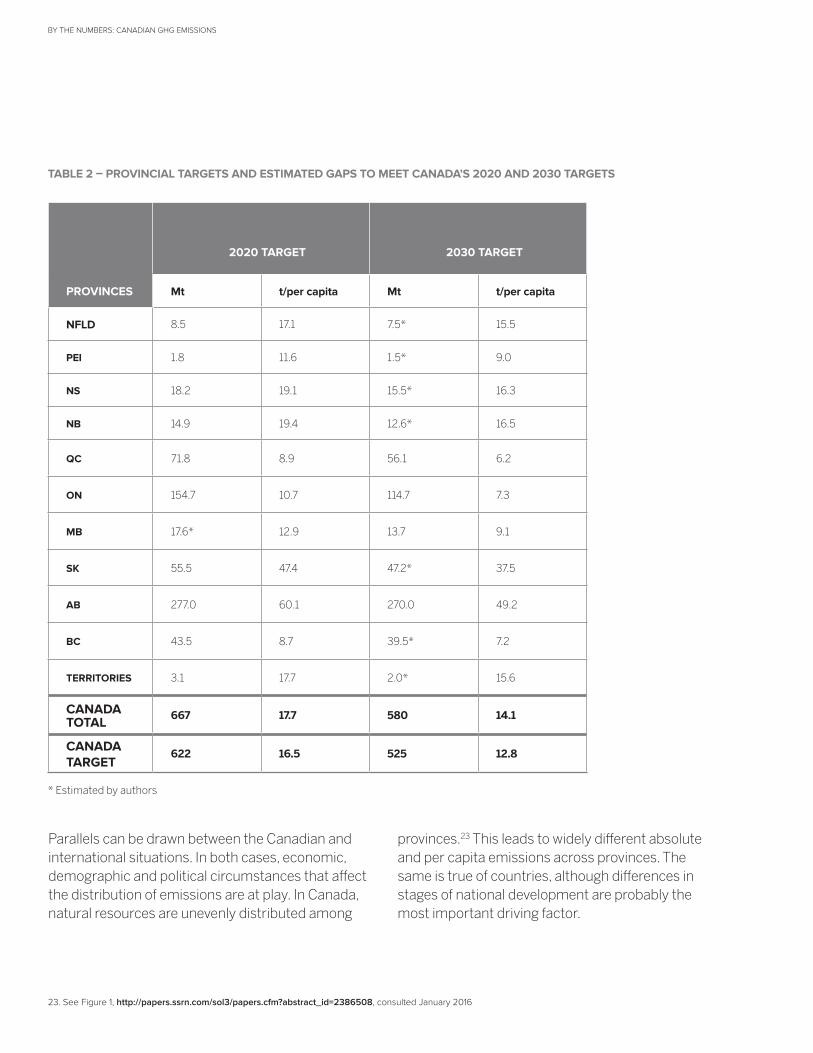
Asafinalexercise,itisinterestingtocomparetheknownfederalcommitmentsfor2020(622Mt)and2030(525Mt)withtheaggregateofprovincialtargets,assumingtheyareachieved.Aswenotedabove,forprovincesthathavenotannouncedtargets,wegenerallyusedtheaveragelevelstringencyoftheannouncedtargetstodevelopproxy2030targets.Since75percentofCanada’semissionsarecoveredbyannounced2030provincialtargets,theseproxytargetsfortheremainingprovincesprobablyhaveonlymarginaleffectsontheoverallresults.
Table2presentstheannouncedandproxy2020and2030targetsbyprovince.Intotal,theprovincialtargetssumtoabout667Mtin2020and580Mtin2030.Thus,evenifallprovincesachievedtheirannouncedorproxytargets,Canadawouldstillfaceagapofabout45Mtin2020and55Mtin2030.
21. BC’s target has been recommended by a government panel but not yet officially adopted.22. http://www.statcan.gc.ca/pub/91-520-x/91-520-x2010001-eng.htm, consulted January 2016
BY THE NUMBERS: CANADIAN GHG EMISSIONS
TABLE 2 – PROVINCIAL TARGETS AND ESTIMATED GAPS TO MEET CANADA’S 2020 AND 2030 TARGETS
PROVINCES
2020 TARGET 2030 TARGET
Mt t/per capita Mt t/per capita
NFLD 8.5 17.1 7.5* 15.5
PEI 1.8 11.6 1.5* 9.0
NS 18.2 19.1 15.5* 16.3
NB 14.9 19.4 12.6* 16.5
QC 71.8 8.9 56.1 6.2
ON 154.7 10.7 114.7 7.3
MB 17.6* 12.9 13.7 9.1
SK 55.5 47.4 47.2* 37.5
AB 277.0 60.1 270.0 49.2
BC 43.5 8.7 39.5* 7.2
TERRITORIES 3.1 17.7 2.0* 15.6
CANADA TOTAL 667 17.7 580 14.1
CANADA TARGET
622 16.5 525 12.8
provinces.23Thisleadstowidelydifferentabsoluteandpercapitaemissionsacrossprovinces.Thesameistrueofcountries,althoughdifferencesinstagesofnationaldevelopmentareprobablythemostimportantdrivingfactor.
ParallelscanbedrawnbetweentheCanadianandinternationalsituations.Inbothcases,economic,demographicandpoliticalcircumstancesthataffectthedistributionofemissionsareatplay.InCanada,naturalresourcesareunevenlydistributedamong
23. See Figure 1, http://papers.ssrn.com/sol3/papers.cfm?abstract_id=2386508, consulted January 2016
*Estimatedbyauthors
BY THE NUMBERS: CANADIAN GHG EMISSIONS 15
SignificantchallengeslieaheadforCanadaasitworkstomeetitsGHGemissiontargets,andthosechallengesparalleltheonesfacedbytheinternationalcommunity.FindingwaystoequitablysharetheburdenofGHGemissionreductionsandpracticalmechanismstoallowregionalandnationaleconomiestotransitiontoalow-carbonworldwilltesttheingenuityandwillofpoliticalleadersathomeandabroad.
CONCLUSIONS

BY THE NUMBERS: CANADIAN GHG EMISSIONS
IveyBusinessSchoolWesternUniversity1255WesternRoadLondon,OntarioN6G0N1Telephone:519.661.4253
lawrencecentre.ca
Lawrence National Centre for Policy and Management
Lawrence National Centre for Policy and Management
Lawrence National Centre for Policy and Management
Lawrence National Centre for Policy and Management
Lawrence National Centre for Policy and Management
Lawrence National Centre for Policy and Management
Unit logo examples
Unit full signature examples
PMS 3308PMS 268
PMS 3308PMS 268 Lawrence National Centre
for Policy and Management
CMYK
100% K
Cool Grey 9
Reverse Reference
Reverse Version
Light GreyPMS Cool Grey 7
C 0M 0 Y 0K 47
Warm GreyPMS 416
C 28M 185 Y 29K 51
Light Warm GreyPMS 414
C 13M 8 Y 17K 26
SandPMS 4525
C 9M 12 Y 47K 18