Embed Size (px)
Citation preview

1
THE LARGER EUROPE: TECHNOLOGICALCONVERGENCE AND LABOUR MIGRATION
By the Ingenue TeamMichel Aglietta and Vladimir Borgy (Cepii), Jean Château (Ocde),Michel Juillard (Cepremap), Jacques le Cacheux, Gilles Le Garrec,
Vincent Touzé (Ofce)
For the International ConferenceThe New Borders of Europe
Marrakech, 16-17 March 2005

2
ABSTRACT
We investigate the long-run growth of Europe in the world economy. The research covers thefirst half of the XXI° century. The basic trends that will shape the growth regime in the globaleconomy are the demographic transition and the diffusion of technological progress. We usethe framework of INGENUE, an OLG model which divides the world in ten broad regions.Hypotheses are elaborated on the basic trends and discussed in an historical perspective.Structural changes are then introduced into INGENUE to make prospective scenarios.
A baseline scenario is built to outline the main macroeconomic features of the broad regions.This scenario being used as a benchmark is deliberately conservative as far as structural andinstitutional changes are concerned. It depicts Western Europe as an ageing low-growthregion, accumulating net foreign assets and enjoying an appreciating real exchange rate.These are the characteristics of a permanent creditor in a world growth regime supported bycapital mobility.
The frontiers of Europe are investigated in the last part of the paper by means of twoalternative scenarios. First it is assumed that EU enlargement accelerates the technologicalcatch-up of Eastern Europe and boosts growth. Second labour mobility is simulated. Becausethe cost of financing public retirement is higher in Western Europe, a policy of immigration isimplemented to eschew the decline of the labour force. Both the beneficial effects on WesternEurope and the adverse effects on the regions of emigration are displayed.

3
CONTENT
Introduction
I. The new Great transformation : Demographic transition and technologicalconvergence in the XXIst century.
II. The conjecture of a world growth regime• Crucial hypotheses on world growth• A tool to study the macroeconomic consistency of the growth regime:
the INGENUE 2 model
II Main macroeconomic characteristics of the central scenario: Europe in achanging world
IV Alternative prospects in the relationships between Western Europe and itsneighbourhood• Faster convergence in Eastern Europe• Labour migration from the East and the South
Conclusion
4
INTRODUCTIONIn the early years of the XXI° century the world we are living in is in flux. Globalisation isdeepening. It is no longer restricted to international exchanges in trade and finance.Technology transfers gain momentum. The countries able to assimilate its arcane can jumpseveral stages in the international division of labour in some sectors and areas while still beingin utter backwardness in others. Heterogeneity makes their development highly unbalancedbut it fosters potential opportunities for both foreign and advanced domestic firms.Management systems, accounting and information standards are also part of the process ofglobalisation. Multinational firms are no longer exclusively Western and Japanese spreadingworld-wide. They are challenged by multinationals originating in other parts of the world,making competition fierce in truly world-wide markets.
Therefore the conjecture of a growth regime significantly different from the past stages ofcapitalist development can be contemplated. After World War II only in Western Europe thecatching-up process to the leading country was able to be interactive amongst the convergingcountries, making an integrated region. Growth in Japan and in the so-called Asian dragonswas both domestic and export-led, without reciprocal dynamic relationships. Exports wereessentially driven to the U.S. market. domestic production was import substitute from the U.S.and Western Europe. In the first half of the XXI° century, for reasons underlined below,multiple poles of integrated development will rise. This makes world growth a regime thatrequires a model linking together vastly populated regions of the globe, catching up at theirown speed.
To study what the world growth regime will stand for in the next decades and what the scopeof Europe is likely to be, section I depicts the demographic and technological forces that willfoster convergence in the present half century. Section II introduces the conjecture of theworld growth regime, discussing the crucial hypotheses and outlining the INGENUE 2 model.Section III describes the macroeconomic features of the baseline scenario and the place ofEurope in a changing world. Section IV defines alternative prospects in the relationships ofWestern Europe with its neighbourhood. One is faster convergence in Eastern Europe due toeconomic integration; the other is a flow of labour migrations from the East and the South(the Mediterranean contour and Sub-Saharan Africa). Finally the paper concludes on thebenefits for Europe from being a pole of attraction.

5
I. THE NEW GREAT TRANSFORMATION: DEMOGRAPHIC TRANSITION ANDTECHNOLOGICAL CONVERGENCE IN THE XXI° CENTURY
Growth in the world economy is shaped by secular trends in its most structural long-rundeterminants. Two factors stand out. The first is the change in the demographic structure inthe different parts of the world. The second is the diffusion of technological progress, asexpressed by trends in total factor productivity growth. These factors have always beenprevalent in the rise of capitalism world-wide. Mobility of labour, capital and ideas haveintermeshed. The stages of capitalist development are connected with different directions ofthis mobility.
• Demographic expansion, migration and economic development.
In the late XIX° century there was an impetus to globalisation prodded by a joint expansion ofEuropean capital and labour in under-populated overseas territories. The momentum wasimpressive indeed. For the average of the years 1880-1913 the net flow of capital exports forthe total of 13 European countries reached 3.5% of their aggregate GDP. In comparison thesame measure of overall capital mobility was 2% in the 1930’s and 1.5% in the thirty mightyyears after World War II. It rose again after the first oil shock to 2.7% in the last decade of theXX° century [Taylor, 1996].
The most striking feature of the world growth regime in the late XIX° century however wasthe complementarity between capital export from Europe and the emigration of its population.In the UK 3% of the initial population emigrated in the 1880’s, 5.2% in the 1890’s plagued bya severe recession, 2% in the growth years of the first decade of the XX° century. In Spain thefigures were respectively 1.5, 6, 5.2% and in Sweden 2.9, 7.2 and 3.5%. These figures werevery high for countries with a long tradition of capitalist development. But in the lands ofimmigration they were properly astonishing. Indeed in the 1890’s the population swelled 9%with immigration in addition to the natural expansion in the US, 17% in Australia and 25% inArgentina.
It was a transplant of the European labour force which was young, productive and attracted byhigher wages or entrepreneurial income as settlers. Because of capital imports, the expatriatedlabour force benefited from fast technological progress in railways and sea transportation,converted into low costs of the primary commodities entering into European manufacturingindustries. Therefore the labour migration of the time entailed an international division oflabour whereby the real cost of wage goods diminished in Europe, while emigration helpedsustaining an increase in real wages after the turn of the XX° century. Meanwhile capitalexports from Europe and capital accumulation in Europe occurred in alternate phases of thefinancial cycle, preserving a stable long-run interest rate.
This world growth regime was broken by World War I and the ensuing monetary disorders,culminating in the world depression which fragmented international trade. It was not until the1960’s that another pattern of world growth emerged. It was very different from the former.Huge institutional changes after World War II had rooted a self-sustaining growth process inWestern countries. It was based upon a virtuous circle encompassing the baby boom, fastproductivity gains, matching real wage increases, progressive social transfers and massconsumption. In the 1960’s trade opening under sequential GATT rounds enhanced aconvergence club in OECD countries. This process entailed primarily domestic migrationsfrom rural to urban areas. It was supplemented by immigration from the so-called ThirdWorld after completion of decolonisation. This immigration was stirred on the supply side by
6
the demographic explosion in the Third World, by the dislocation of traditional agriculturalstructures and the deterioration in the terms of trade that spread mass poverty in the mega-cities. On the demand side it was attracted by a chronic shortage of low-skilled labour in thefast-growing consumer durable goods industries. This migration pattern went on to the early1980’s and in some respect still goes on chiefly in North America and to a lesser extent inEurope.
• New Prospect between demography and economy in the XXI° century
After the European demographic expansion of the XIX° century and the speed-up ofpopulation growth in the second half of the XX° century, the demographic transition willimprint the first half of the XXI° century. It is a sequential and lengthy process of ageing. Thedeveloped countries, the Eastern European countries, Russia and a decade later China, areageing from the top of the age structure. Most of the developing world is ageing from thebottom of the pyramid.
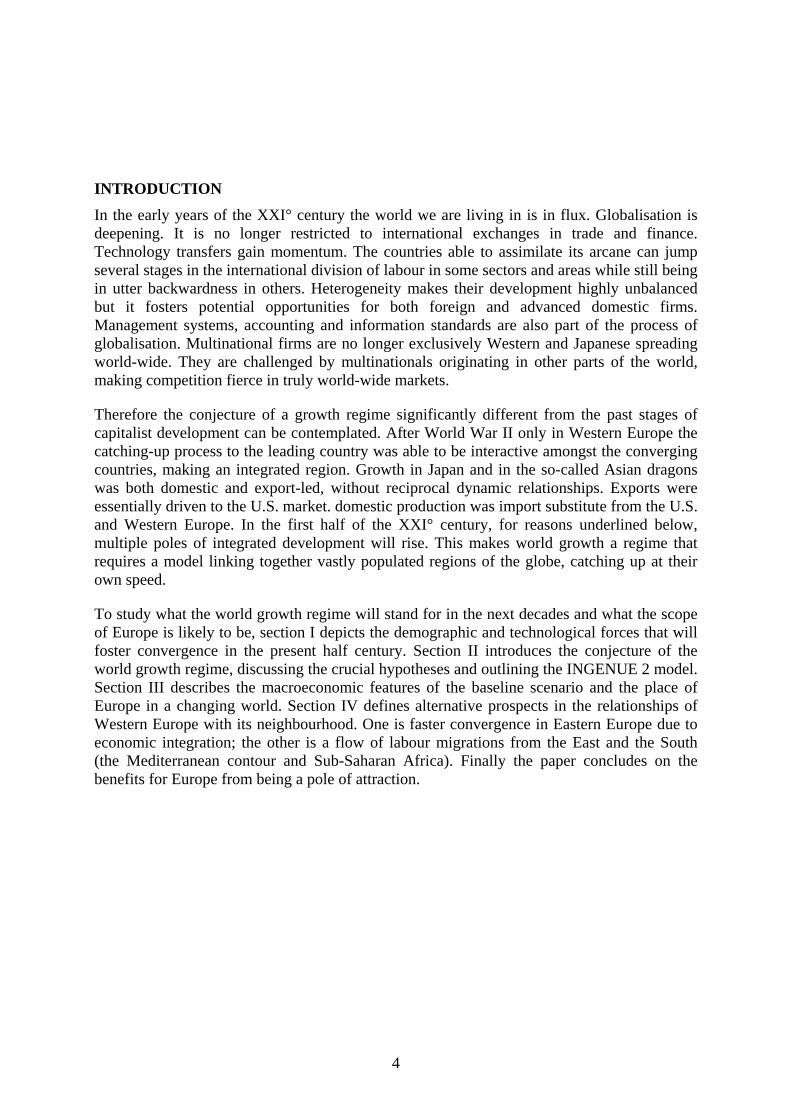
When the world is broken in ten regions, according to the nomenclature adopted inINGENUE 2, a sharp contrast will arise in the rate of growth of the labour force. It willdecline throughout the half century in Russia (very fast), Eastern Europe, Western Europe andJapan. It will decline more moderately in North America (after 2010) and China (after 2020).It will decelerate but grow until 2050 in South America, India and the Mediterraneancountries (outside Europe). The most atypical region is Africa where the labour force willhardly decelerate at all (Figure 1). Contrary to the XIX° century when Europe possessed boththe capital and the human resources to conquer the world and to the post-World War II era,when OECD countries where leaders in the growth regime, the upcoming decades have thepotential for a new growth regime based upon a widespread, albeit not generalised, catching-up.
Figure 1 :
Working age population annual growth rate 1960-2050
-2,0
-1,0
0,0
1,0
2,0
3,0
4,0
1960 1970 1980 1990 2000 2010 2020 2030 2040 2050
N. America W. Europe Japan S. America MediterraneanAfrica Russia China India E. Europe
The conjecture is that the size and the dynamism of the population in large continentalcountries will become the preponderant factor in domestic development because theirgovernments are aware of the need for investing in infrastructure, health and education.

7
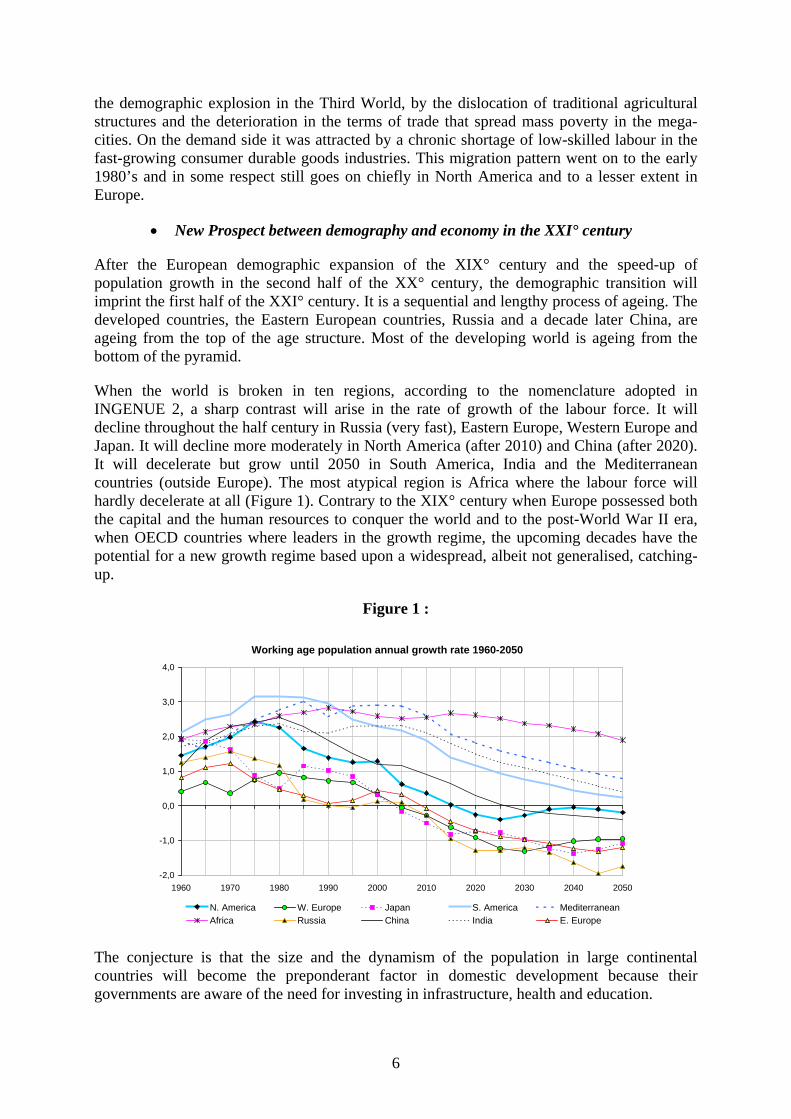
Figure 2 :
High Savers Ratio (age group 45-69 yrs in percentage of total population) 1960-2050
5
10
15
20
25
30
35
40
1960 1965 1970 1975 1980 1985 1990 1995 2000 2005 2010 2015 2020 2025 2030 2035 2040 2045 2050
N. America W. Europe Japan S. America MediterraneanAfrica Russia China India E. Europe
As the leading OECD countries concentrate the largest part of world capital, the growthregime will depend on international capital rather than labour mobility. An intergenerationaltransfer of resources via capital export from the rich ageing countries to the labour forcegrowing countries will make the world regions strongly interdependent. We alreadyadvocated this approach in former papers based upon INGENUE 1, the first version of themodel. Indeed the idea of a mutually advantageous exchange, whereby wealthy households inrich countries export their saving to growth-hungry countries, is the core insight in theINGENUE project. Figure 2 illustrates why this intergenerational exchange will arise.
One can see that the proportion of high savers in total population follows a wave pattern thatpropagates from one region of the world to the next through the decades. The ratio culminatesfirst in Japan as soon as 1995 and remains at high level until 2030. Then North America willhave its maximum in 2010 and Western Europe in 2015, Eastern Europe, Russia and China in2030. All are regions where the labour force will decline and thus hamper growth in thefuture. On the contrary the regions found on figure 1 as the potentially fast-growing regionswill see a progressive ageing leading to an increase of the high savers ratio which will notculminate before 2050. It follows that saving will flow from early high savers to late highsavers in the coming decades. However, for this scenario to arise, an engine of growth isrequired. This is the international diffusion of technological progress.
• The spread of technological progress
A synthetic measure of technological progress for a whole economy is total factorproductivity (TFP) at constant prices. Estimating TFP is an appallingly difficult task for theten world regions of INGENUE 2. We define TFP as a Hicksian neutral technologicalprogress in a Solow growth model. It means that there exists a production frontier shiftingover time. In such a framework the aggregate product is a function of the services of capitaland labour and of technological progress defined as TFP. Therefore the latter is computedwith the use of the production function. The stock of capital and the national account datawere drawn from Heston-Summers data base (2002). They were aggregated in $1996 for theregions of the INGENUE breakdown. Ad hoc adjustments were made for missing data. Theelasticity parameter for the impact of capital in the production function was held the same at
8
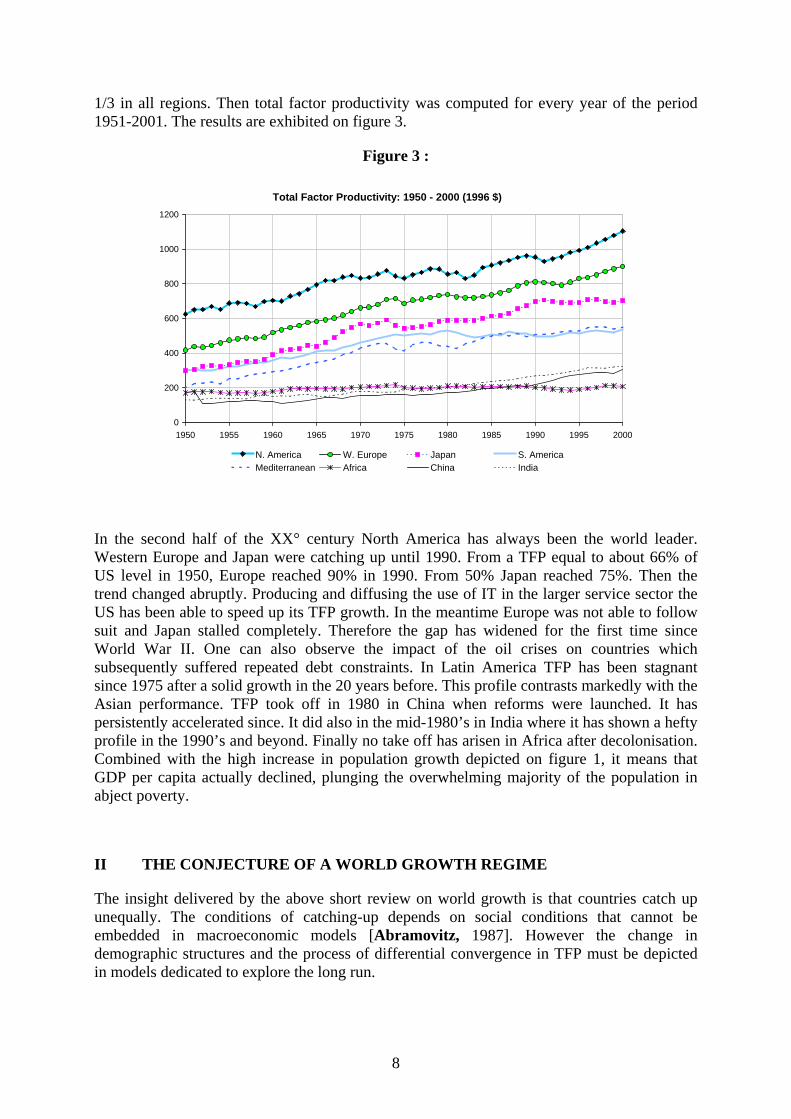
1/3 in all regions. Then total factor productivity was computed for every year of the period1951-2001. The results are exhibited on figure 3.
Figure 3 :
Total Factor Productivity: 1950 - 2000 (1996 $)
0
200
400
600
800
1000
1200
1950 1955 1960 1965 1970 1975 1980 1985 1990 1995 2000
N. America W. Europe Japan S. AmericaMediterranean Africa China India
In the second half of the XX° century North America has always been the world leader.Western Europe and Japan were catching up until 1990. From a TFP equal to about 66% ofUS level in 1950, Europe reached 90% in 1990. From 50% Japan reached 75%. Then thetrend changed abruptly. Producing and diffusing the use of IT in the larger service sector theUS has been able to speed up its TFP growth. In the meantime Europe was not able to followsuit and Japan stalled completely. Therefore the gap has widened for the first time sinceWorld War II. One can also observe the impact of the oil crises on countries whichsubsequently suffered repeated debt constraints. In Latin America TFP has been stagnantsince 1975 after a solid growth in the 20 years before. This profile contrasts markedly with theAsian performance. TFP took off in 1980 in China when reforms were launched. It haspersistently accelerated since. It did also in the mid-1980’s in India where it has shown a heftyprofile in the 1990’s and beyond. Finally no take off has arisen in Africa after decolonisation.Combined with the high increase in population growth depicted on figure 1, it means thatGDP per capita actually declined, plunging the overwhelming majority of the population inabject poverty.
II THE CONJECTURE OF A WORLD GROWTH REGIME
The insight delivered by the above short review on world growth is that countries catch upunequally. The conditions of catching-up depends on social conditions that cannot beembedded in macroeconomic models [Abramovitz, 1987]. However the change indemographic structures and the process of differential convergence in TFP must be depictedin models dedicated to explore the long run.

9
A provocative mechanism was proposed by Lucas (2000) to explain both the divergence inreal income per capita between countries for a considerable period of time, then aconvergence that might occur in the present century. This mechanism is worth considering.
The takeoff of individual countries starts at random. After the initial shock they follow agrowth regime à la Solow. The trend of their total factor productivity is the faster, the largerthe distance of their income per capita to that of the leader. This dynamic leads to aconvergence toward the productivity level of the leader. Therefore the later a country beginsits takeoff, the faster it can grow. World growth is just a weighted average of individualtrajectories.
Still the speedup of technological revolutions is another stylised fact that shape trends ofproductivity gains. A suggestion to model this feature is the following: the probability that aparticular country takes off at a particular time is an increasing function of world income percapita. The latter is a proxy for the stock of technological knowledge already accumulated bythe countries that preceded newcomers in the technological age [Temple, 1999].
This assumption rests on the diffusion of technological progress. The knowledge inventedsomewhere is a non-rival good. It can be used anywhere with the caveat that relevantinstitutions and policies have been established. In embodying both the faster growth in a latetakeoff and a higher probability of takeoffs as long as the world becomes moretechnologically knowledgeable, Lucas shows that a clever calibration can deliver interestingsimulations. During a long a period of two centuries after the first industrial revolution,income inequalities between countries widen; then they will shrink in the XXI° century.
• Crucial hypotheses on world growth
How can we accommodate this suggestion in the INGENUE framework? Figure 3 gave thepath of TFP for the second half of the XX° century. It exhibits partial catching up of thedifferent world regions to North America. This catching-up was interrupted in the 1990’s bythe IT revolution which erupted earlier in the US. We assume that North America will remainthe technological leader until 2050, that the diffusion of IT will be completed in the wholeeconomy and that there will be no further technological revolution in the baseline scenario.Therefore North America TFP will return to its long-run growth trend of 1.5% per year. Witha 2/3 share of labour income in GDP, it means a 2.25% steady growth in labour productivity.
For the rest of the world there will be a region-specific catching-up process in TFP. Thedifferential speed of catching up reflects the discrepancies in the social and institutionalconditions of assimilating IT in different parts of the world, combined with the levels of TFPalready reached.
The level of total factor productivity in the zone at the technological frontier (North America)is tA ,1 . It is supposed to grow at 1.5% per year: 1,1,1 )1( −+= tt AgA with g=1.5%. The diffusionof technological progress to a zone i is given by the following equation :
[ ]⎥⎥⎦
⎤
⎢⎢⎣
⎡−++=
−
−
−− 1,
1,1
1,1
,1
1,
, )1(1ti
ttt
t
tt
ti
ti
AA
AA
AA
µµλ
The first bracket captures the speed-up in the rate of technological progress due to theshortening of diffusion in technological innovations. It means that λ is an accelerator to theconvergence in the growth rates (the chosen value is 0.001) The second bracket embodies a
10
brake due to the difficulties to create the social conditions proper to assure a speedy diffusion.µ is the brake factor to the convergence in level. There is a caveat however. To make accountfor the attractiveness of Europe upon its neighbour regions we assume that these regions willconverge to the European target. As a result:
Western Europe, Japan, China, India and South America will converge to North America.
Eastern Europe, Russia, Mediterranean world, Africa will converge to Western Europe.
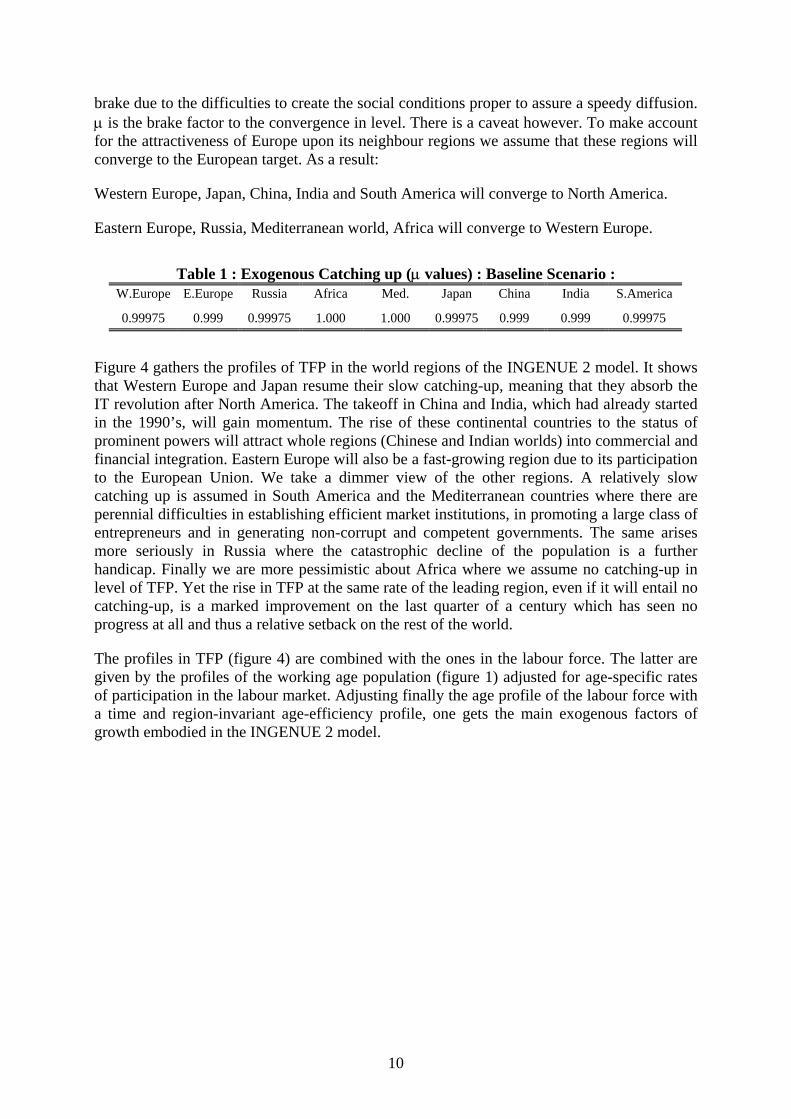
Table 1 : Exogenous Catching up (µ values) : Baseline Scenario :W.Europe E.Europe Russia Africa Med. Japan China India S.America
0.99975 0.999 0.99975 1.000 1.000 0.99975 0.999 0.999 0.99975
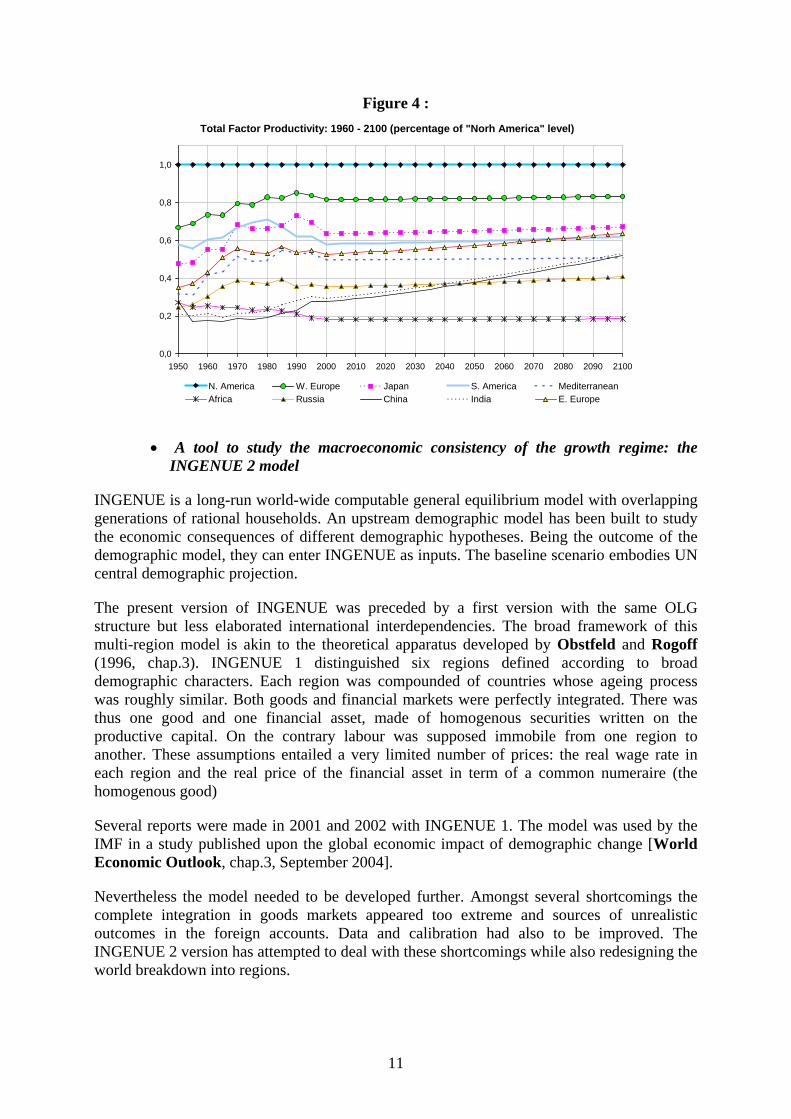
Figure 4 gathers the profiles of TFP in the world regions of the INGENUE 2 model. It showsthat Western Europe and Japan resume their slow catching-up, meaning that they absorb theIT revolution after North America. The takeoff in China and India, which had already startedin the 1990’s, will gain momentum. The rise of these continental countries to the status ofprominent powers will attract whole regions (Chinese and Indian worlds) into commercial andfinancial integration. Eastern Europe will also be a fast-growing region due to its participationto the European Union. We take a dimmer view of the other regions. A relatively slowcatching up is assumed in South America and the Mediterranean countries where there areperennial difficulties in establishing efficient market institutions, in promoting a large class ofentrepreneurs and in generating non-corrupt and competent governments. The same arisesmore seriously in Russia where the catastrophic decline of the population is a furtherhandicap. Finally we are more pessimistic about Africa where we assume no catching-up inlevel of TFP. Yet the rise in TFP at the same rate of the leading region, even if it will entail nocatching-up, is a marked improvement on the last quarter of a century which has seen noprogress at all and thus a relative setback on the rest of the world.
The profiles in TFP (figure 4) are combined with the ones in the labour force. The latter aregiven by the profiles of the working age population (figure 1) adjusted for age-specific ratesof participation in the labour market. Adjusting finally the age profile of the labour force witha time and region-invariant age-efficiency profile, one gets the main exogenous factors ofgrowth embodied in the INGENUE 2 model.
11
Figure 4 :Total Factor Productivity: 1960 - 2100 (percentage of "Norh America" level)
0,0
0,2
0,4
0,6
0,8
1,0
1950 1960 1970 1980 1990 2000 2010 2020 2030 2040 2050 2060 2070 2080 2090 2100
N. America W. Europe Japan S. America MediterraneanAfrica Russia China India E. Europe
• A tool to study the macroeconomic consistency of the growth regime: theINGENUE 2 model
INGENUE is a long-run world-wide computable general equilibrium model with overlappinggenerations of rational households. An upstream demographic model has been built to studythe economic consequences of different demographic hypotheses. Being the outcome of thedemographic model, they can enter INGENUE as inputs. The baseline scenario embodies UNcentral demographic projection.
The present version of INGENUE was preceded by a first version with the same OLGstructure but less elaborated international interdependencies. The broad framework of thismulti-region model is akin to the theoretical apparatus developed by Obstfeld and Rogoff(1996, chap.3). INGENUE 1 distinguished six regions defined according to broaddemographic characters. Each region was compounded of countries whose ageing processwas roughly similar. Both goods and financial markets were perfectly integrated. There wasthus one good and one financial asset, made of homogenous securities written on theproductive capital. On the contrary labour was supposed immobile from one region toanother. These assumptions entailed a very limited number of prices: the real wage rate ineach region and the real price of the financial asset in term of a common numeraire (thehomogenous good)
Several reports were made in 2001 and 2002 with INGENUE 1. The model was used by theIMF in a study published upon the global economic impact of demographic change [WorldEconomic Outlook, chap.3, September 2004].
Nevertheless the model needed to be developed further. Amongst several shortcomings thecomplete integration in goods markets appeared too extreme and sources of unrealisticoutcomes in the foreign accounts. Data and calibration had also to be improved. TheINGENUE 2 version has attempted to deal with these shortcomings while also redesigning theworld breakdown into regions.

12
In INGENUE 2 the world is compounded of ten regions according to a mix of geographicaland demographic criteria, ranked by decreasing order of ageing:
Western Europe and Japan, which are the regions with decreasing labour force fromthe present or the next decade onwards amongst the most developed regions
Eastern Europe, and the Russian world, ageing as fast the former from a muchlower level of income per capita
North America (including also Australia and new Zealand) and the Chinese world(China and surrounding East Asian countries) whose labour force growth will turnslightly negative around 2020
South America, the Mediterranean world (including non-European countries aroundthe Mediterranean Sea and the Near East) and the larger Indian world (includingPakistan and South East Asia on top of India). These regions have already beeninvolved in the process of ageing but they will keep a growing labour force until2050
Africa is the region where the demographic transition has hardly started and whoseworking age population will still grow at 2% per annum in 2050.
The model is set in sequential time with a unit period made of five years. In each region 21generations overlap. Therefore no individual is supposed to live longer than 105 years. Theymay give birth until they reach 50 years of age according to their fertility calendar. Unlessspecified otherwise in distinct scenarios (like the ones presented in section IV), no migrationis supposed to occur between regions. People are assumed to become “adults” and enter thelabour force in the beginning of their fifth period of life (age 20). It follows that there are 17overlapping cohorts of “adults” and 4 cohorts of “young”. The latter are dependent until theyturn 20. Thus there is a cost per child proportional to the parents’ consumption. The laboursupply is exogenously given in each region. It is compounded of the working age populationup to the retirement age adjusted to an exogenous age-specific participation ratio. In someregions children may work from the age of 10. Their labour income is embodied in theirparents’ budget constraint.
The main features of the macroeconomic framework are outlined below in non-technicalterms.
Household behaviour. On entering the labour force at the age of 20 an individualmaximizes a life-time utility function. It is written as the discounted value of rationallyexpected future streams of consumption over his (her) entire life (life cycle hypothesis)plus the discounted value of the instantaneous utility of leaving a voluntary bequest tochildren at some age T (subject to survival until that age). Bequests received from parentsenter the budget constraint of the individual. For each individual of age a at time t there is abudget constraint. On the expenditure side it encompasses the consumption (costs ofchildren included) and saving of each individual of age a at period t. On the income sidethere is the financial income on accumulated saving if the individual of age a-1 at time t-1has survived between t-1 and t, corrected by the survival probability of generation age a-1.This adjustment amounts to the mechanism of a perfect annuity market that pool death riskdue to the uncertain life time of individuals. There is also a non-financial income whichdepends on the age of the individual respective to threshold ages: net labour income (after

13
social security taxes) modulated by an age-efficiency profile for people in full labouractivity; a mix of labour income and pension benefits for people partially retired (reducedlabour activity) ; full pension benefits for people entirely retired. The life time utilityprogram is maximized under the intertemporal budget constraint, taking prices, socialcontributions and benefits as given. [Modigliani, 1986]
Public sector. It is confined to a public Pay As You Go (PAYG) pension scheme in allregions. It operates under a defined-benefit rule. It pays a proportion of the current netwage (replacement ratio) to retirees. It is financed by a payroll tax on labour income. Theexogenous parameters are the retirement age and the replacement ratio. They are region-specific. The contribution rate is determined so as to balance the budget period by period.
Production system. Goods are heterogeneous. In each region there is an intermediate goodssector. It uses labour and capital to produce a region-specific intermediate good with aconstant return-to-scale Cobb-Douglas production function. The final goods sector is theproduct of a CES combination of a domestic intermediate good and a foreign intermediategood imported by the region from a world market (Backus and alii, 1995). Thishomogenous world good is “produced” by a fictive world producer as the output of a CEScombination of all intermediate goods exported by the regions. All production functionsare augmented by TFP coefficients.
Firm behaviour. In each type of sector, firms act on competitive markets. They maximizetheir profit under their production constraint, taking prices as given. In the domesticintermediate good sector the constraint is intertemporal, since the production functiondepends on the stock of capital which is depreciated and accumulated. Intermediate goodsproducers thus maximize net present value of future cash-flows, i.e. production valueminus wage cost and capital cost. The latter depends on the depreciation rate which is itselfaffected by international capital market imperfections. To express these imperfections in acompact way, an ad hoc assumption has been formulated. The depreciation rate is higher indebtor regions. More precisely the higher their net foreign debt ratio to their stock ofcapital, the higher the depreciation rate in those regions. Therefore this debt constraintincreases the required gross rate of return on capital in debtor regions, which in turn lowersthe demand for capital and thus the equilibrium capital/ labour ratio resulting from thefirst-order condition. Other type producers face a more simple maximization problem.Domestic goods producers and the world producer maximize current profit subject to theirCES production functions.
General equilibrium. Initial conditions are: the capital stock in each region, the agedistribution of saving in each region, the initial prices of domestic commodities.Exogenous variables and parameters are: the demographic profiles in each region that areoutputs of the demographic upstream model, the coefficients of the TFP determination inintermediary and final sector of each region, the social security policy parameters in eachregion. The competitive world equilibrium stems from five set of equations: intertemporalutility maximization of households, intertemporal profit maximization of firms inintermediate goods sectors, period profit maximization of firms in final goods sectors,period profit maximization of the world producer, market clearing conditions. The marketscleared in each period are: the markets for intermediate goods, final goods, labour in eachregion and the market for the world intermediate good.
Walras’s law and accounting conventions. The equations enumerated here abovedetermine all relative equilibrium prices, i.e. all prices in term of a common numeraire.
14
The prices involved in the model are: prices of domestic intermediate and final goods,domestic wage rate, price of the world intermediate good and world interest rate. Regionalinterest yields, real exchange rates in terms of final goods, terms of trade of intermediarygoods can easily be deduced from the set of equilibrium real prices. Therefore a numeraireis needed to fix one absolute price. The price of the intermediate good in North America isset equal to one. This convention allows us to express values in constant dollars. FinallyWalras’s law implies that the world financial market equilibrium is the redundant equation.This market is automatically cleared.
III. MAIN MACROECONOMIC CHARACTERISTICS OF BASELINESCENARIO: EUROPE IN A CHANGING WORLD
The baseline scenario is the outcome of a long and weary process of calibration. To put themodel on an acceptable track on the projection phase starting in 2000, an adjustment must bemade. It is why the model computation shall begin at an initial date as far in the past as thedata permit it. The initialisation is the five year period beginning in 1950 where initial stocksof capital, household assets and an age distribution of savings are estimated.
An opening of the world economy is supposed from 1955 onwards. The further degree ofopening follows the historical data on country shares in world trade and country ratios ofopenness and then aggregated to the INGENUE regions. Historical data for total factorproductivity are injected up to 2000. The law of motion explained in section II is usedthereafter. Huge past changes in the world economy are introduced as shocks. The collapse ofthe USSR in 1990 has given birth to a fast-track opening of Eastern Europe accompanied byan unexpected and massive write-off of the capital stock. China and India has opened muchfaster than before. Furthermore the IT revolution starting in North America led to a speed upin total factor productivity growth. This higher growth is assumed to be temporary and will bephased out in the present decade, TFP growth returning to its long-run average.
The baseline scenario is not easy to depict since it is a dynamic rational expectations generalequilibrium, whereby newcomers appear in each period of time. Any order of description issomewhat arbitrary because it could give the false impression of a recursive causal system ofdetermination between blocks of relations. It is just a narrative device in vernacular language.
• Regional growth
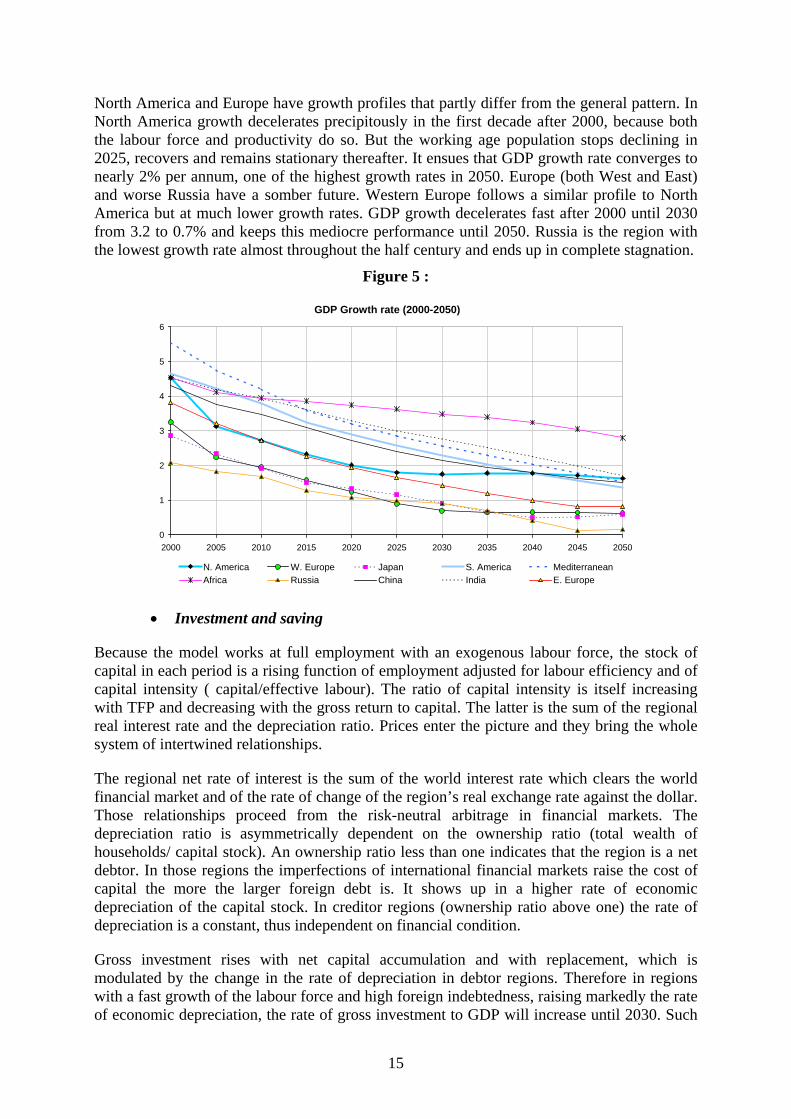
Assumptions regarding technological convergence are conservative in the baseline scenario.Besides the parameters that define public pension systems perpetuate existing policies in thebeginning of the XXI° century. Therefore the pattern of the GDP regional growth rates largelyfollows that of the regional labour force growth rates. Two characteristics stand out (figure 5).Firstly there is a general slowdown in growth because the working age population growth ratediminishes in all regions but Africa after 2000. Secondly the dispersion in the growth rates isalmost as large in 2050 as in 2000, because ageing is a lengthy process with countervailingimpacts on the labour force of less-developed countries. Nevertheless convergence in totalfactor productivity has an impact since the dispersion in the growth rates of the labour force issubstantially higher in 2050 than in 2000, while the dispersion in the GDP growth rates isslightly lower. The Chinese region, which encompasses already developed countries, is theone where the catching up is the fastest. It is why its growth rate matches other regions withmuch higher growth in their labour force.
15
North America and Europe have growth profiles that partly differ from the general pattern. InNorth America growth decelerates precipitously in the first decade after 2000, because boththe labour force and productivity do so. But the working age population stops declining in2025, recovers and remains stationary thereafter. It ensues that GDP growth rate converges tonearly 2% per annum, one of the highest growth rates in 2050. Europe (both West and East)and worse Russia have a somber future. Western Europe follows a similar profile to NorthAmerica but at much lower growth rates. GDP growth decelerates fast after 2000 until 2030from 3.2 to 0.7% and keeps this mediocre performance until 2050. Russia is the region withthe lowest growth rate almost throughout the half century and ends up in complete stagnation.
Figure 5 :
GDP Growth rate (2000-2050)
0
1
2
3
4
5
6
2000 2005 2010 2015 2020 2025 2030 2035 2040 2045 2050
N. America W. Europe Japan S. America MediterraneanAfrica Russia China India E. Europe
• Investment and saving
Because the model works at full employment with an exogenous labour force, the stock ofcapital in each period is a rising function of employment adjusted for labour efficiency and ofcapital intensity ( capital/effective labour). The ratio of capital intensity is itself increasingwith TFP and decreasing with the gross return to capital. The latter is the sum of the regionalreal interest rate and the depreciation ratio. Prices enter the picture and they bring the wholesystem of intertwined relationships.
The regional net rate of interest is the sum of the world interest rate which clears the worldfinancial market and of the rate of change of the region’s real exchange rate against the dollar.Those relationships proceed from the risk-neutral arbitrage in financial markets. Thedepreciation ratio is asymmetrically dependent on the ownership ratio (total wealth ofhouseholds/ capital stock). An ownership ratio less than one indicates that the region is a netdebtor. In those regions the imperfections of international financial markets raise the cost ofcapital the more the larger foreign debt is. It shows up in a higher rate of economicdepreciation of the capital stock. In creditor regions (ownership ratio above one) the rate ofdepreciation is a constant, thus independent on financial condition.
Gross investment rises with net capital accumulation and with replacement, which ismodulated by the change in the rate of depreciation in debtor regions. Therefore in regionswith a fast growth of the labour force and high foreign indebtedness, raising markedly the rateof economic depreciation, the rate of gross investment to GDP will increase until 2030. Such

16
conditions point out Africa whose capital starts from a low base. India follows a similarpattern albeit less strongly. With a constant depreciation ratio, and an interest rate decliningwith the world rate, North America keeps a rate of gross investment to GDP remarkablysteady. This is not the case of Japan and Western Europe. Despite the lowest real interest ratesdue to the continuous appreciation of their real exchange rates, leading to a low cost of capitalindeed, those regions have such a declining labour force that it impinges negatively uponcapital accumulation. Yet the rise in capital intensity counteracts the effect of the labour force.It is why the rate of investment declines less than it does in faster growing regions like Chinaand South America. Finally Russia has a peculiar profile, because there is an exogenous shockon investment in the early 2000’s to recover from the collapse of the 1990’s which led to thescrapping of more than half of the capital stock; hence the humped-shape curve of Russianrate of investment, which remains by far the lowest of all regions (Figure 6).
Figure 6 :Evolution of the gross investment to GDP ratio
10
12
14
16
18
20
22
24
26
28
30
2000 2005 2010 2015 2020 2025 2030 2035 2040 2045 2050
N. America W. Europe Japan S. America MediterraneanAfrica Russia China India E. Europe
Net saving in each region is the aggregate of individual savings in the life cycle. It depends onthe demographic structure (high savers ratio and dependency ratio), on the expectation offuture income and on the parameters of the PAYG pension systems. Demographicdeterminants are prevalent. Regions with the fastest-increasing dependency ratios are the oneswith the fastest-decreasing net saving rate, namely Japan, Western Europe, Eastern Europe,Russia. Meanwhile this gloomy demographic factor is compounded with a slow expectedprogression in income (figure 7). In China, India, South America and the Mediterranean, thehigh savers ratio and the dependency ratio rise in tandem. In the early decades, while thepopulation is still young, those regions grow faster than more demographically mature ones. Itfollows that young people expecting higher future income indulge in debt, reducing theoverall saving rate. Like for investment, Africa and North America have more steady savingratios throughout the half century.

17
Figure 7 :Evolution of the Net Saving (in percentage of GNP)
0
5
10
15
20
25
30
2000 2005 2010 2015 2020 2025 2030 2035 2040 2045 2050
N. America W. Europe Japan S. America MediterraneanAfrica Russia China India E. Europe
• Prices
In INGENUE 2 a lot of prices regulate markets. It has already been observed that the grossrate of return on capital influences capital intensity in each region. Relative prices of domesticintermediate to final goods and world intermediate to domestic final goods are factors ofcompetitiveness which determine the share of domestically-produced intermediate goods andworld-imported intermediate goods contributing to the production of final goods in eachregion. The domestic price of final goods is itself a non-linear combination of domestic andworld prices of intermediate goods. The relative price of the domestic intermediate goodsprice to the world price, i.e. the terms of trade, determines regional exports. The world priceof intermediate goods is a non-linear average of the intermediate prices of the differentregions. Finally the real exchange rate of a region relative to North America is the relativeprice of this region price of final goods to the price of final goods in North America. Becausethe North American intermediate price is taken as numeraire and the internal relative price inthis region is roughly constant, one can say that real exchange rates are defined in constantdollars.
The world real interest rate is declining over the fifty year period. This is due to global ageing.Figures 1 and 2 show that the working age population is decelerating or declining absolutelywhile the age group of high savers is growing in one region after another. As a result theworld saving investment equilibrium is tilted more and more toward a lower equilibrium rate.This downward trend provides the general profile of regional real interest rates (figure 8). Thehierarchy of regional real interest rates is linked to the rate of change of the real exchangerates. The real interest rates regulate investment and saving flows as explained here above.The gap between investment and saving is the current account balance of each region. It isfinanced by capital flows whose amounts are such that yield differentials between differentregions cancel out in every period.

18
Figure 8 :Regional annual real interest rate
3,0
4,0
5,0
6,0
7,0
8,0
9,0
2000 2005 2010 2015 2020 2025 2030 2035 2040 2045 2050
N. America W. Europe Japan S. America MediterraneanAfrica Russia China India E. Europe
• Exchange rates and world finance
The world financial equilibrium allocates capital flows which finance current accountimbalances modulated by real exchange rate changes. Nevertheless the equilibrium infinancial markets is a stock equilibrium. Exchange rates are affected by net foreign assets.They move with the net financial positions of the regions to create future surpluses or deficits,so that current accounts are balanced in the very long run, i.e. there is no more accumulationof net foreign assets or debts. In INGENUE the magnitude of financial positions is measuredby the ownership ratio. This is the ratio of the aggregate wealth accumulated by households inthe region to the capital stock laid out in the region. Hence a ratio above one is tantamount toa creditor position against the rest of the world, a ratio less than one to a debtor position.Despite the general interdependence of prices one can roughly say that the world interest rateis the price which equilibrates the world financial market as a whole, matching total aggregatewealth and world capital stock.
Real exchange rates appreciate relatively to North America in the two regions that haveconsistently a ownership ratio higher than North America (figure 9). Nevertheless, except inthese two regions and in Russia, the latter due to terms of trade effects, exchange rate changesare not much sensitive to the stocks of financial assets. The paths of the exchange rates aremostly parallel to the one of North America.

19
Figure 9 :Evolution of Real Exchange Rate (2000-2050)
0,0
0,5
1,0
1,5
2,0
2,5
2000 2005 2010 2015 2020 2025 2030 2035 2040 2045 2050
N. America W. Europe Japan S. America MediterraneanAfrica Russia China India E. Europe
The ownership ratios are mainly determined by cumulative current account balances The moststriking feature is the divergent profile of North America. It is due to an assumed change inhousehold behaviour. The deficit in the early years of the century is, as every one knows, dueto the low saving rate of households in the US. It has been assumed that this behaviour willnot be sustainable in the long run. American households will converge to the saving behaviourobserved in other regions in the early decades. With this structural change and with apopulation consistently younger than in Japan and Europe, the rise in saving in North Americais conveyed into a double improvement in the current account balance (figure 10) and theownership ratio.
The main teaching for the other regions is a shrinking of the discrepancies in current accountsalong the half century. Japan and Western Europe remain continuously in surplus but less andless with the augmentation of their dependency ratio. The Mediterranean region is in surplusfor most of the time but goes into a slight deficit in the last two decades. Africa, India andEastern Europe, with large current account deficits at the start of the century, are reducing itas long as their growth rate is diminishing and their households save more because they getolder and richer.
Ownership ratios do not show the same converging pattern, because regions accumulate eithernet foreign assets or debts because the sign of the current account balance does not changealong the fifty year period.. It was observed on figure 10, which depicts current accountbalances as a percentage of world GDP, that the polarisation between creditor and debtorregions will persist with the notable exception of North America. Therefore the profiles of theownership ratio do not exhibit any convergence. The building of a strong creditor position inNorth America stands out. The slight improvement in the debtor position of Africa andEastern Europe stems from the steady reduction of the deficit in those two regions. In India,where the improvement is less pronounced, the ownership ratio is continuously deteriorating.India will become the largest debtor according to this measure in the last decade before 2050.

20
Figure 10 :Evolution of Current Account Balance (percentage of World GDP) :
-0,4
-0,3
-0,2
-0,1
0,0
0,1
0,2
0,3
0,4
0,5
0,6
2000 2005 2010 2015 2020 2025 2030 2035 2040 2045 2050
N. America W. Europe Japan S. America MediterraneanAfrica Russia China India E. Europe
Figure 11 :Ownership Ratio
0,70
0,75
0,80
0,85
0,90
0,95
1,00
1,05
1,10
1,15
1,20
2000 2005 2010 2015 2020 2025 2030 2035 2040 2045 2050
N. America W. Europe Japan S. America MediterraneanAfrica Russia China India E. Europe
• Foreign trade
In INGENUE tradable goods are intermediary. Regions export on a world market where afictive world producer “produces” a world intermediate good. They compete on theirdomestic markets against imports of the world intermediate goods. Therefore thecompetitiveness of each region depends on the terms of trade against the world producerwhose price is itself an average of intermediate goods prices in the different regions.
Three regions have ever-rising terms of trade, i.e. loss of competitiveness: Japan, WesternEurope, Russia. The other regions have constant or slightly declining terms of trade (figure12). The weak growth in the three former regions, much weaker than in others (figure 5),pushes prices upwards. In Japan and Western Europe those rising prices generate thewidening trade deficit to match the demand of intermediate goods by the final goods sector.

21
(figure 13). In Russia the population declines more than anywhere else and the consumptionper capita is lower. Furthermore Russian intermediary products are primary commodities instrong world demand. It ensues that the valuing effect of the terms of trade takes over. Afterdeteriorating alongside Japan and Western Europe, the Russian trade balance turns around toan increasing surplus thereafter. Most other regions with little change in competitivenessimprove their trade balance, moving from deficit to surplus.
Figure 12 :Terms of Trade (2000-2050)
0,0
0,5
1,0
1,5
2,0
2,5
3,0
2000 2005 2010 2015 2020 2025 2030 2035 2040 2045 2050
N. America W. Europe Japan S. America MediteraneanAfrica Russia China India E. Europe
Figure 13 :Evolution of Trade Balance (percentage of regional GDP) :
-3,0
-2,0
-1,0
0,0
1,0
2,0
3,0
2000 2005 2010 2015 2020 2025 2030 2035 2040 2045 2050
N. America W. Europe Japan S. America MediterraneanAfrica Russia China India E. Europe

22
IV ALTERNATIVE PROSPECTS IN THE RELATIONSHIPS BETWEENWESTERN EUROPE AND ITS NEIGHBOURHOOD
The baseline scenario has shown the salient feature of Western Europe in the first half of theXXI° century. It is an ageing region, most advanced in the demographic transition. It benefitsfrom globalisation as a perennial creditor region. European growth will get lower and lower.But the accumulated wealth of its household will give them the opportunity to draw apermanent income from the rest of the world on its ownership of foreign asset. But it is well-known that the public pension scheme in Western Europe is expensive. Different scenarioshave already been studied with INGENUE 1, involving policy reforms within WesternEurope. They were conceived to diminish the cost of financing retirement benefits, either inlimiting the social contribution rate or in boosting growth via the postponement of theretirement age. Another view is improving the benefits that Western Europe draws from itsrelationships with the rest of the world.
Since the frontiers of a larger Europe are not well-defined, it might be relevant to assess theconsequences of tighter links between Western Europe and regions wrongly or rightlyperceived to be in its backyard. One such structural change is already in motion. It is thetentative economic integration of always more remote territories. Another fashionable view isthe opening to larger flows of migrants from nearby territories.
Studying these alternative scenarios within the INGENUE framework is not that easyhowever. In its present version INGENUE 2 is not fitted to simulate the consequences ofprivileged trade links with some outer regions rather than others. Technically such a scenariowould entail modifications in some of the equations, not only changes in exogenousparameters. Given the complexity of the dynamic resolution in this forward-looking generalequilibrium model, the exercise, while feasible, would have been too time-consuming to beimplemented right away. On the contrary, privileged demographic links, i.e. immigration toWestern Europe coming preferentially from neighbour regions; involve exogenous changes inthe upstream demographic model and are immediately feasible.
Considering those technical constraints two types of alternative scenarios are analysed below.The first is a faster technological convergence in Eastern Europe. It might be justified by aneconomic dynamism launched by the prospect of the participation to a larger economiccommunity. But the positive consequences of enhancing growth in Eastern Europe arediffused world-wide instead of being preferentially directed towards Western Europe. SinceEastern Europe is such a small economic region, its impact on Western Europe is weak. Mostinteresting is the impact on Eastern Europe itself, due to the multiple linkages with the worldeconomy that are modelled in INGENUE 2.
The second scenario explores a labour force immigration into Western Europe originatedpreferentially, but not fully, in Eastern Europe and in the Mediterranean. The advocates ofsuch policies have no ideas on the order of magnitude of the economic effects and do not careabout the dire effects of the population haemorrhage on the countries exporting their labourforce. Therefore this first exercise with the INGENUE 2 model delivers results which are amatter of concern.

23
1. Faster convergence in Eastern Europe
In sharp contrast with the baseline scenario, a catching up of Eastern Europe total factorproductivity to the level of Western Europe is assumed over the course of the XXI° century(figure 14). If it can be sustained the speed-up in TFP growth will also mark a deep changefrom the laggard stance of productivity in the last three decades of the XX° century. Thereforethis hypothetical gain in productive efficiency is by no means a prevision. It is rather arepresentation of the wishful thinking of the EC Commission, where it is fashionable toexpect that the enlargement of the European market can make wonders.
Figure 14 :Total Factor Productivity: 1960 - 2100 (percentage of "Norh America" level)
0,0
0,2
0,4
0,6
0,8
1,0
1950
1960
1970
1980
1990
2000
2010
2020
2030
2040
2050
2060
2070
2080
2090
2100
N. America W. Europe E. Europe
Assuming that the trend in TFP will move upward as soon as the countries involved enter theEC and that the future evolution to a complete catching-up is expected, GDP growth rate willjump 1% above the growth rate in the baseline scenario. It will then slow down steadily, butstay above baseline growth well after 2050 (Figure 15).

24
Figure 15 :GDP Growth rate
(difference from baseline scenario)
-0,20
0,00
0,20
0,40
0,60
0,80
1,00
1,20
1995
2005
2015
2025
2035
2045
2055
2065
2075
2085
2095
W. Europe E. Europe
The dynamic can be easily understood. On the supply side a permanent higher TFP increaseslabour productivity; hence production since the labour force is fully employed. On thedemand side it entails an expectation of higher future income. The latter induces householdsto diminish saving and raise consumption. As a consequence the average private consumptionper capita jumps immediately higher in consistency with the forward-looking view ofhouseholds. Then it rises systematically above its baseline level.
A higher growth profile requires capital accumulation. With a lag of one period investmentgrowth follows GDP growth: it jacks up 1.7% ahead of the baseline rate of growth. The gapshrinks steadily thereafter but remains positive until 2050. The slowdown in investmentgrowth is regulated by the cost of capital. Because domestic saving does not match investmentneeds, net saving actually being under baseline until 2025, an inflow of foreign capital fills inthe gap in the investment saving balance. It is attracted by a higher interest rate in EasternEurope. It follows a hump-shaped profile with a maximum in 2015 (Figure 16).

25
Figure 16 :Regional annual real interest rate
(Percentage point difference from baseline scenario)
-0,10
-0,05
0,00
0,05
0,10
0,15
1995
2005
2015
2025
2035
2045
2055
2065
2075
2085
2095
W. Europe E. Europe
The foreign accounts of Eastern Europe are regulated by the real exchange rate and by theterms of trade. Both prices diminish relative to baseline. The real exchange rate depreciates aslong as the regional real interest rate is higher than the world interest rate. The depreciation isfostered by the hypothetical convergence in TFP which lowers domestic prices. The sameimpact, admittedly amplified, arises on the terms of trade. The improved competitiveness willboost exports and mitigate imports. Therefore the trade balance and the current accountbalance show the same profile.
In the first two decades the rise in both consumption and investment calls for higher importsof intermediate goods financed by capital inflows. The trade balance turns negative relative tothe baseline scenario, because exports are discouraged and imports stimulated by the strongdomestic demand. After about two decades the investment saving balance swings to aninverted pattern. As explained above the investment growth rate slows down steadfastly whilethe working age population diminishes. People take advantage of their higher real income tosave more. Both the trade and the current account balances turn to surplus (Figure 17). As aresult the ownership ratio relative to baseline scenario exhibits a U curve with a minimumaround 2020 (figure 18).

26
Figure 17 :Evolution of Trade Balance (percentage of regional GDP) :
(difference from baseline scenario)
-0,80
-0,60
-0,40
-0,20
0,00
0,20
0,40
0,60
1995
2005
2015
2025
2035
2045
W. Europe E. Europe
Figure 18 :Ownership Ratio
(Percentage point difference from baseline scenario)
-0,030
-0,025
-0,020
-0,015
-0,010
-0,005
0,000
0,005
0,010
0,015
0,020
1995
2005
2015
2025
2035
2045
W. Europe E. Europe
2. Labour migration from the East and the South
The second alternative scenario has another aim. It is to shed some insight in the debate aboutimmigration into Western Europe. [Héran, 2002]. In the baseline scenario Western Europehas the highest social security contribution rate in the world. It is due to the relatively highreplacement ratio people enjoy at constant policy and to the highest dependency ratio. Thecontribution rate is expected to increase steadily from 17% in 2000 to 32% in 2050.Meanwhile the dependency ratio will rise from 43% of the working age population to 98%.
27
Amongst the policies to alleviate the financial burden on the public retirement system,immigration rides high in the mind of UN and Euro technocrats. Some political leaders seamalso ready to embrace the idea that an influx of migrants is the best way to save the Europeanwelfare system. Let us notice that this policy stance is quite at odds with the mutuallybeneficial intergenerational exchange upheld in the INGENUE project. We do think that thefirst best way is to enhance a world growth regime via intense technology transfers at low costand sustained capital exports. In the present stage of capitalist development the opportunityraised by the growing labour force in the most populated regions of the world should be met.According to this perspective it is questionable to draw flows of labour out of their countries.
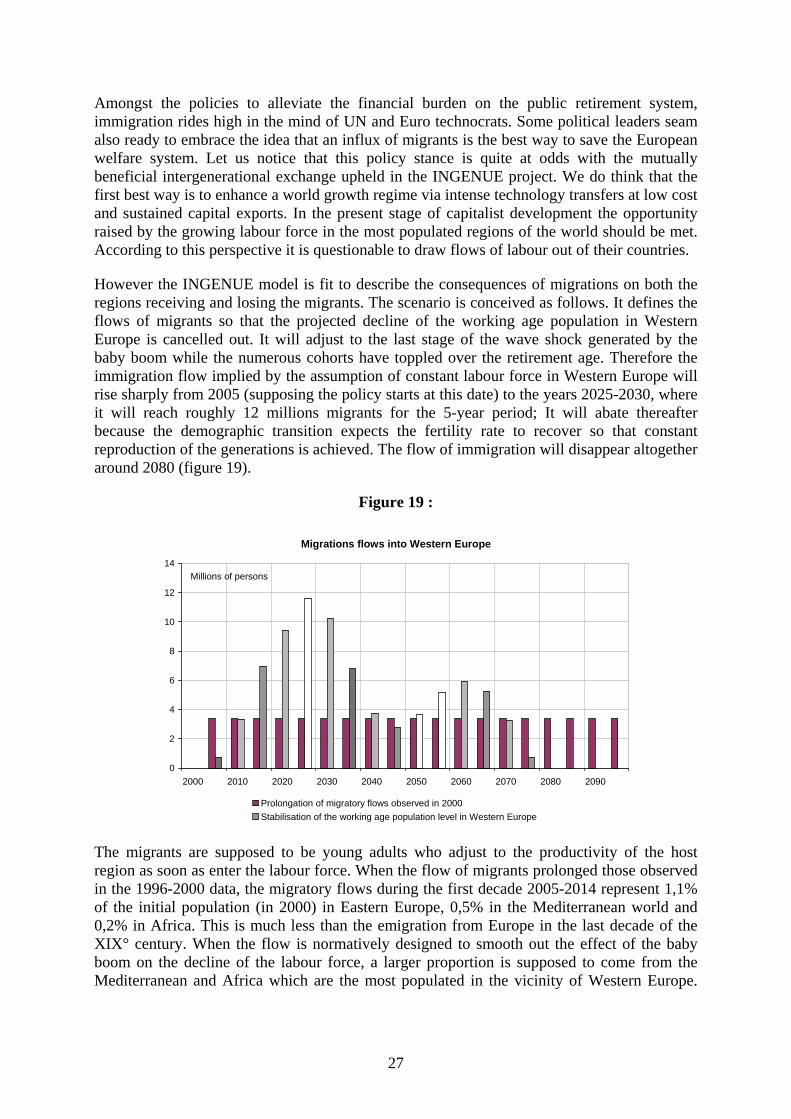
However the INGENUE model is fit to describe the consequences of migrations on both theregions receiving and losing the migrants. The scenario is conceived as follows. It defines theflows of migrants so that the projected decline of the working age population in WesternEurope is cancelled out. It will adjust to the last stage of the wave shock generated by thebaby boom while the numerous cohorts have toppled over the retirement age. Therefore theimmigration flow implied by the assumption of constant labour force in Western Europe willrise sharply from 2005 (supposing the policy starts at this date) to the years 2025-2030, whereit will reach roughly 12 millions migrants for the 5-year period; It will abate thereafterbecause the demographic transition expects the fertility rate to recover so that constantreproduction of the generations is achieved. The flow of immigration will disappear altogetheraround 2080 (figure 19).
Figure 19 :
Migrations flows into Western Europe
0
2
4
6
8
10
12
14
2000 2010 2020 2030 2040 2050 2060 2070 2080 2090
Prolongation of migratory flows observed in 2000Stabilisation of the working age population level in Western Europe
Millions of persons
The migrants are supposed to be young adults who adjust to the productivity of the hostregion as soon as enter the labour force. When the flow of migrants prolonged those observedin the 1996-2000 data, the migratory flows during the first decade 2005-2014 represent 1,1%of the initial population (in 2000) in Eastern Europe, 0,5% in the Mediterranean world and0,2% in Africa. This is much less than the emigration from Europe in the last decade of theXIX° century. When the flow is normatively designed to smooth out the effect of the babyboom on the decline of the labour force, a larger proportion is supposed to come from theMediterranean and Africa which are the most populated in the vicinity of Western Europe.

28
11% of total migrants will come from Eastern Europe, 32% from the Mediterranean, 25%from Africa, 32% from the rest of the world.
• Domestic consequences of migrations
As defined to smooth out the working age population in Western Europe, the scenario has alarge impact since it lowers the dependency ratio in 2050 from about 1 in the baselinescenario to 0.65. It follows that the financing of the PAYG system is dramatically improved.The social security contribution rate falls continuously in percentage of baseline. This meansthat in 2050 the contribution rate is only 24% in the high migration variant against 32% in thebaseline, because migrants contribute massively to its financing. It is a huge improvement.Indeed the deterioration of the contribution ratio would be only 7%, since it amounts to 17%in 2000.
The impact on the growth rate is substantial. The inflow of young workers expecting higherwages boosts consumption which spurs a speed up in the growth rate until 2030 where it is1% higher than in the baseline scenario. Then the stock of earlier migrants enter the highsaving stage of their life cycle. The increase in saving moderates consumption and the growthrate flattens but at 1% above baseline until 2050 (figure 20).
The mirror effect of the improving economic situation in Western Europe due to immigrationis a limited deterioration in the two main regions of emigration: Eastern Europe and theMediterranean. The magnitude of the deterioration depends on the loss of potential workersrelative to the total of the labour force in the region. It is why in Eastern Europe, a regionmuch advanced in ageing and already suffering from a declining population, the adverseconsequences of emigration are more critical.
Figure 20 :
GDP Growth rate(difference from baseline scenario)
-0,60
-0,40
-0,20
0,00
0,20
0,40
0,60
0,80
1,00
1,20
1995 2000 2005 2010 2015 2020 2025 2030 2035 2040 2045 2050
W. Europe Mediterranean Africa E. Europe
Nevertheless the level of consumption per capita is less than in the baseline scenario inWestern Europe until the very end of the half-century. The reason lies in the productionsector. The inflow of workers reduces capital intensity relative to baseline. The marginalproductivity of capital is raised and the interest rate as well. Conversely labour productivity isdiminished with a lower capital intensity. The real wage rate, being a decreasing function of

29
the return on capital on the factor price frontier, is itself on a slower path than in baseline. Itensues that relatively to the baseline scenario consumption is less augmented than totalpopulation; hence consumption per capita is lower. Around 2030, when saving gainsmomentum the interest rate recedes a bit because saving grows faster than investment.Furthermore figure 19 shows that the flow of new migrants will be receding fast after 2030.Therefore the growth of consumption per capita relative to baseline turns positive from 2025onwards. The level moves upward again but does not overtake baseline before 2045 (figure21).
The opposite occurs in emigrating regions. But the impact is diffused over several regions andmitigated by the size of the labour force. The modest fall in the interest rate and thesubsequent increase in productivity persists for almost the entire span of the fifty year period.Only Eastern Europe and the Mediterranean exhibit a non-negligible elevation ofconsumption per capita.
Figure 21 :
Consumption per capita (level)(Percentage point difference from baseline scenario)
-0,04
-0,03
-0,02
-0,01
0,00
0,01
0,02
0,03
0,04
1995 2000 2005 2010 2015 2020 2025 2030 2035 2040 2045 2050
W. Europe Mediterranean Africa E. Europe
• Migrations and the foreign accounts
Because of the rise in interest rate, the saving investment balance stays more in surplus than inthe baseline scenario. The current account balance, which was already in surplus in baseline(figure 10), is therefore more so. The real exchange rate is depreciated relative to baselinesince the real interest rate is higher. Yet it still appreciates slightly during the half-century. Itfollows from the improvement of the current account balance that Western Europe reinforcesits creditor position in the world economy. The ownership ratio rises systematically abovebaseline. The regions of emigration with slightly appreciating exchange rates relative tobaseline stay more in deficit and more in debt. The change in the trade account balance ismore pronounced. It reflects the scissors effect in the saving investment balance due to theinverted U-shape of migration flows. Therefore the trade balance is negative then positiverelative to baseline in Eastern Europe and the Mediterranean (figure 22).
Figure 22 :

30
Evolution of Trade Balance (percentage of regional GDP) :(difference from baseline scenario)
-0,40
-0,30
-0,20
-0,10
0,00
0,10
0,20
0,30
0,40
1995 2000 2005 2010 2015 2020 2025 2030 2035 2040 2045 2050
W. Europe Mediterranean Africa E. Europe
CONCLUSION
In the next half-century Europe is likely to be a low-growth region, because of its adversedemographic profile and its slow progression in total factor productivity. Nevertheless it willbenefit from the advance of globalisation. Being one of the two regions (with Japan) wherereal interest rates are persistently the lowest, Western Europe will be a permanent creditor,accumulating net foreign assets for the whole half-century. Its real exchange rate will alsoappreciate consistently. Therefore European households will gain from globalisation in bothincome drawn from the yield of their foreign assets and in purchasing power relative to otherregions. It is why consumption per capita measured at PPP will take over North America after2015 and rise thereafter in sympathy with real exchange rate appreciation.
The baseline scenario is conservative however. It does not embody a significant accelerationin the catching-up process, except to some extent in China and India. The world-wideconsequences of a much faster increase in TFP would change the pattern of world growthdramatically. This world growth scenario will be left to further study. In the present paper itwas illustrated by an hypothetical catching-up in the small region of Eastern Europe. As soonas it occurs, the structural change in production entails a jump in the growth rate in theforward-looking framework of INGENUE. Growth must be supported by capitalaccumulation financed by capital inflows attracted by the rise in interest rate. The reversal ofcapital flows will come later when people get richer and save more while the growth ratedeclines steadily.
The former scenario illustrates the virtue of capital mobility and technological diffusion withthe proviso that investments to assimilate technological progress are efficient in the importingcountry. This scenario must be contrasted with international labour mobility. Migration flowsboost growth in the importing region but weaken it in the exporting ones. They also pull apartthe financing of the public pension system as much as migrants are young productive adults.Therefore even if the migrants themselves might be better-off, migration is a mechanism toredistribute wealth in favour of the richer regions at odds with a world growth regime.
BIBLIOGRAPHY
31
ABRAMOVITZ M., 1987, catching up, forging ahead and falling behind, Journal of Economichistory, vol 46, n°2
BACKUS D., KEHOE P. and KINDLAND F., 1995, International business cycles : theory andevidence, in Cooley ed., Frontiers of business cycle research, Princeton Univ. Press
BEAUDRY P. AND GREEN D., 2000, Population growth, technological adoption and economicoutcomes in the information era, NBER, December
HERAN.F, les recherches sur l’immigration et l’insertion : avancées, débats, perspectives, inF.Heran, M. Aoudaï et J.L.Richard, immigration, marché du travail, Intégration, Rapport duCGP, 2002.
IMF, 2004, How Will demographic change affect the global economy?, World economicOutlook, chap.3, September.
INGENUE, 2001, « Vieillissement démographique, et transferts internationaux d’épargne :premiers enseignements du modèle INGENUE, Revue d’Economie Politique
INGENUE, 2001, « Macroeconomic consequences of pension reforms in Europe : aninvestigation with the INGENUE world model », Working Paper CEPII-CEPREMAP-OFCE,December
INGENUE, 2002, « transition démographique, croissance mondiale et équilibres financiersinternationaux, », in M. Aglietta, D. Blanchet et F.Heran, Démographie et Economie, Conseild’Analyse Economique, La Documentation Française, chap.3, pp.121-186
INGENUE, 2002, « A long-term model for the world economy, », in J.O. Hairault and H.Kempf, eds., Market imperfections and macroeconomic dynamics, Kluwer AcademicPublishers, chap.3, pp. 51-73
INGENUE, 2002, Globalisation financière, vieillissement et convergence mondiale, Revuede l’OFCE, Hors série, mars.
LUCAS R., 2000, Some macroeconomics for the XXI° century, Journal of EconomicPerspective, vol 14, n°1, pp. 159-168
MODIGLIANI F.,1986, Life cycle, individual thrift, and the wealth of nations, Nobel lecture,American economic review, vol 76, n°3, June.
OBSTFELD M. and ROGOFF K., 1996, Foundations of International Macroeconomics, MITPress, chap. 3
OBSTFELD M. and ROGOFF K., 2000, The six major puzzles in internationalMacroeconomics: is there a common cause?, NBER Working Paper, n0 7777, July
PHELPS E.S.,1966, Models of technical progress and the golden rule of research, Review ofEconomic Studies, April
REISEN H., 2000, Pensions, savings and capital flows, OECD, Edward Elgar

32
TAYLOR A.M., 1996, International capital mobility in history: the saving - investmentrelationship, NBER Working Paper, n° 5743
TEMPLE J, 1999, The new growth evidence, Journal of Economic Literature, vol 37, n°1
WILLIAMSON J., 1997, Globalisation, convergence and history, Journal of EconomicHistory, vol.56, June