Embed Size (px)
Citation preview
Papers and Proceedings of the Royal Society of Tasmania, Volume 136, 2002 159
WATER QUALITY IN KARSTLANDS AT MOLE CREEK, TASMANIA
by Rolan Eberhard and Ian Houshold
(with seven tables, one text-figure and two appendices)
EBERHARD, R. & HousHOLD, I., 2002 (31 :xii): Water quality in karstlands: a reconnaissance survey at Mole Creek, Tasmania. Papers and Proceedings of the Royal Society of Tasmania 136: 159-172. https://doi.org/10.26749/rstpp.136.159ISSN 0080-4703. Department of Primary Industries, Water and Environment, Nature Conservation Branch, GPO Box 44, Hobart, Tasmania 7001, Australia.
Samples from 28 sites at Mole Creek were analysed for a range of water quality indicators. Low or negligible bacterial counts were o brained for sites with mainly forested catchments; cleared catchments gave more variable and generally higher resulrs. Higher turbidity and nitrate levels were recorded in cleared catchments, suggesting increased erosion and nutrient loading of streams. A comparison of water quality parameters at srreamsinks and related springs shows that the karst aquifer is not an efficient water purifier. Rapid capture of surface runoff via solucional openings, coupled with the pipe-like efficiency with which karst conduits transfer the water, constrains the potential for the karst aquifer to ameliorate water pollution problems. This connection between surface and underground environments is a key consideration for sustainable land management in karstlands. We conclude that karst aquifers have more in common with surface streams than non-karstic ground-water systems, in terms of their water purification properties. Water from two bores was found to be relatively free of microbiological pollution, despite being located in disturbed catchments. This suggests that ground-water sourced from bores is less affected by activities at the surface, alrhough further work is required to confirm this. Key Words: karst, water quality, coliforms, ground-water, geoconservation, land management, Mole Creek.
INTRODUCTION
Protection of water quality in karstlands is a significant health and environmental issue (Ford & Williams 1989, Gillieson 1996, Drew & Hotz! 1999). Ground-water circulation in karst typically involves integrated networks of solutionally enlarged conduits, including cave systems, with high hydraulic conductivity. Pollution from point inputs and diffuse sources entering karstic conduits can rapidly contaminate aquifers, threatening ecosystems and creating hazards for human health. These problems can be compounded by a range of practices, such as allowing stock access to streams with resultant fouling of waterways, land application of chemicals for agricultural, silvicultural and other purposes, inappropriately sited and maintained septic and grey-water systems and use of sinkholes and caves for disposal of waste including animal carcases.
Tasmania's karstlands are developed primarily in folded and faulted Ordovician limestones and Precambrian dolomites that occur across a spectrum of physiographic contexts ranging from coastal to alpine. The land use setting of the karsts encompasses forestry, agriculture, mining and urban settlement as well as essentially undisturbed wilderness in Crown reserves. There are few data on the effects of the various land uses on water quality within Tasmanian karst systems, although attention has been drawn to some unsustainable practices (Kiernan 1984, Houshold 1995, Eberhard 2001).
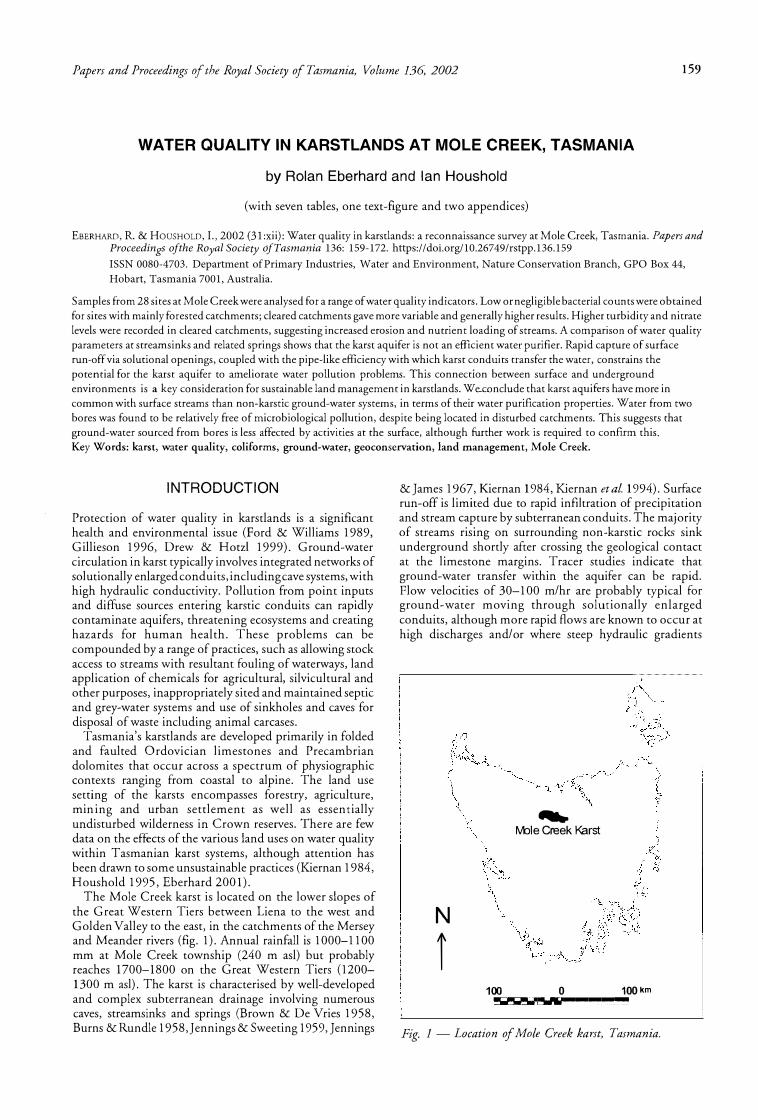
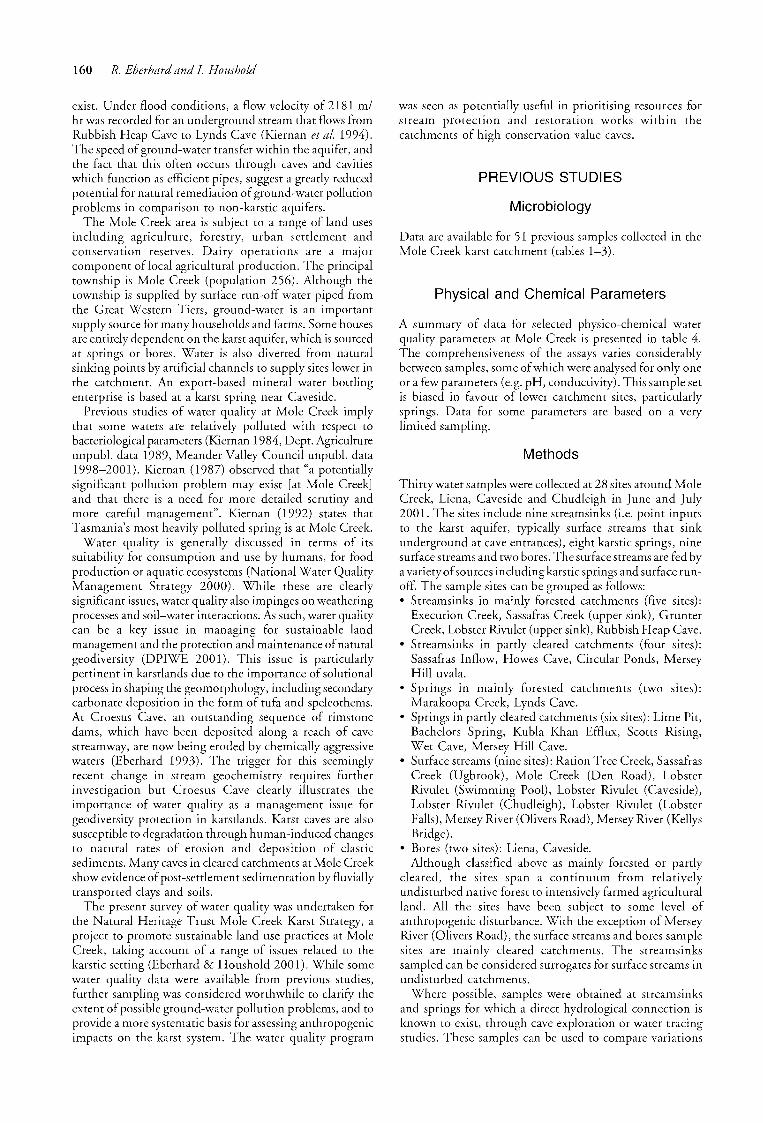
The Mole Creek karst is located on the lower slopes of the Great Western Tiers between Liena to the west and Golden Valley to the east, in the catchments of the Mersey and Meander rivers (fig. 1). Annual rainfall is 1000-1100 mm at Mole Creek township (240 m asl) but probably reaches 1700-1800 on the Great Western Tiers (1200-1300 m asl). The karst is characterised by well-developed and complex subterranean drainage involving numerous caves, streamsinks and springs (Brown & De Vries 1958, Burns & Rundle 1958, Jennings & Sweeting 1959,Jennings
&James 1967, Kiernan 1984, Kiernan eta!. 1994). Surface run-off is limited due to rapid infiltration of precipitation and stream capture by subterranean conduits. The majority of streams rising on surrounding non-karstic rocks sink underground shortly after crossing the geological contact at the limestone margins. Tracer studies indicate that ground-water transfer within the aquifer can be rapid. Flow velocities of 30-100 m/hr are probably typical for ground-water moving through solutionally enlarged conduits, although more rapid flows are known to occur at high discharges and/ or where steep hydraulic gradients
N
r
..... f'vble Creek l<arst
100 100km
•""'liiii/�l""'iiiil'lo,;;,,----·J'·�---J-... _J ... -----
0
Fig. I - Location of Mole Creek karst, Tasmania.
160 R. Eberhard and I Houshold
exist. Under flood conditions, a flow velocity of 2181 m/hr was recorded for an underground stream that flows fromRubbish Heap Cave to Lynds Cave (Kiernan et ale 1994).The speed ofground-water transfer within the aquifer, andthe fact that this often occurs through caves and cavitieswhich function as efficient pipes, suggest a greatly reducedpotential for natural remediation ofground-water pollutionproblems in comparison to non-karstic aquifers.
The Mole Creek area is subject to a range of land usesincluding agriculture, forestry, urban settlement andconservation reserves. Dairy operations are a majorcomponent of local agricultural production. The principaltownship is Mole Creek (population 256). Although thetownship is supplied by surface run-off water piped fromthe Great Western Tiers, ground-water is an importantsupply source for many households and farms. Some housesare entirely dependent on the karst aquifer, which is sourcedat springs or bores. Water is also diverted from naturalsinking points by artificial channels to supply sites lower inthe catchment. An export-based mineral water bottlingenterprise is based at a karst spring near Caveside.
Previous studies of water quality at Mole Creek implythat some waters are relatively polluted with respect tobacteriological parameters (Kiernan 1984, Dept. Agricultureunpub!. data 1989, Meander Valley Council unpub!. data1998-2001). Kiernan (1987) observed that "a potentiallysignificant pollution problem may exist [at Mole Creek]and that there is a need for more detailed scrutiny andmore careful management". Kiernan (1992) states thatTasmania's most heavily polluted spring is at Mole Creek.
Water quality is generally discussed in terms of itssuitability for consumption and use by humans, for foodproduction or aquatic ecosystems (National Water QualityManagement Strategy 2000). While these are clearlysignificant issues, water quality also impinges on weatheringprocesses and soil-water interactions. As such, water qualitycan be a key issue in managing for sustainable landmanagement and the protection and maintenance ofnaturalgeodiversity (DPIWE 2001). This issue is particularlypertinent in karstlands due to the importance of solutionalprocess in shaping the geomorphology, including secondarycarbonate deposition in the form of tufa and speleothems.At Croesus Cave, an outstanding sequence of rimstonedams, which have been deposited along a reach of cavestreamway, are now being eroded by chemically aggressivewaters (Eberhard 1993). The trigger for this seeminglyrecent change in stream geochemistry requires furtherinvestigation but Croesus Cave clearly illustrates theimportance of water quality as a management issue forgeodiversity protection in karstlands. Karst caves are alsosusceptible to degradation through human-induced changesto natural rates of erosion and deposition of clasticsediments. Many caves in cleared catchments at Mole Creekshow evidence ofpost-settlement sedimentation by fluviallytransported clays and soils.
The present survey of water quality was undertaken forthe Natural Heritage Trust Mole Creek Karst Strategy, aproject to promote sustainable land use practices at MoleCreek, taking account of a range of issues related to thekarstic setting (Eberhard & Houshold 2001). While somewater quality data were available from previous studies,further sampling was considered worthwhile to clarify theextent ofpossible ground-water pollution problems, and toprovide a more systematic basis for assessing anthropogenicimpacts on the karst system. The water quality program
was seen as potentially useful in prioritising resources forstream protection and restoration works within thecatchments of high conservation value caves.
STUDIES
Microbiology
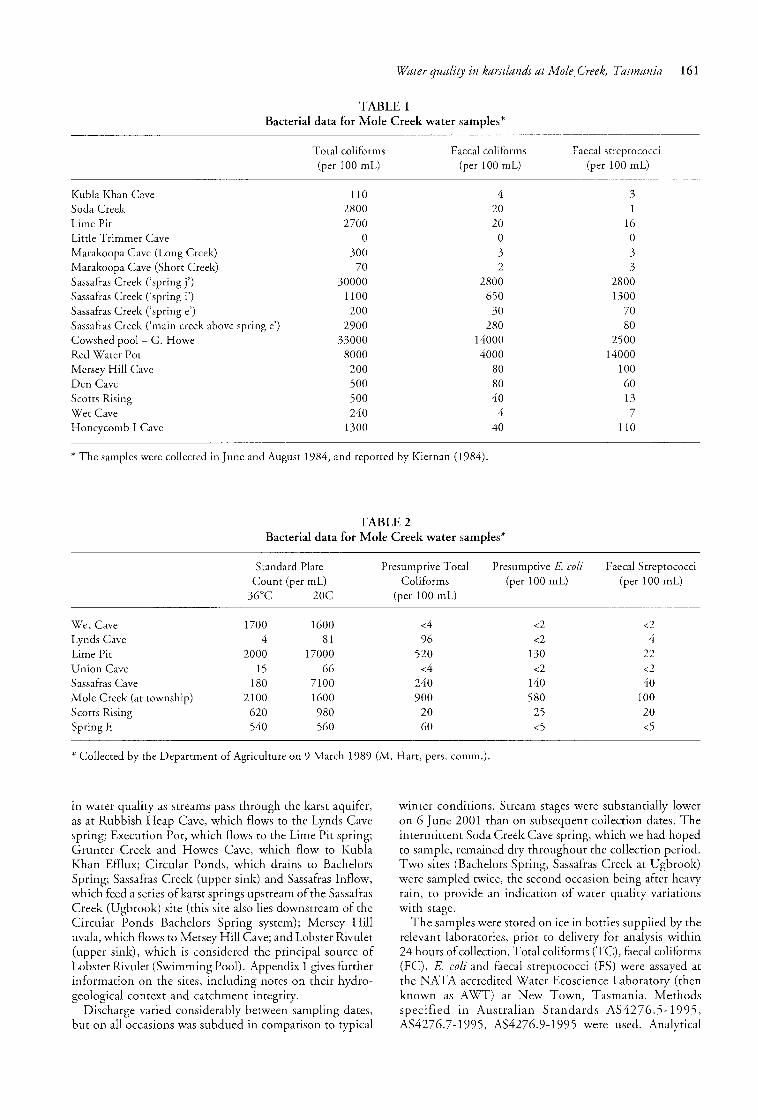
Data are available for 51 previous samples collected in theMole Creek karst catchment (tables 1-3).
Physical and Chemical Parameters
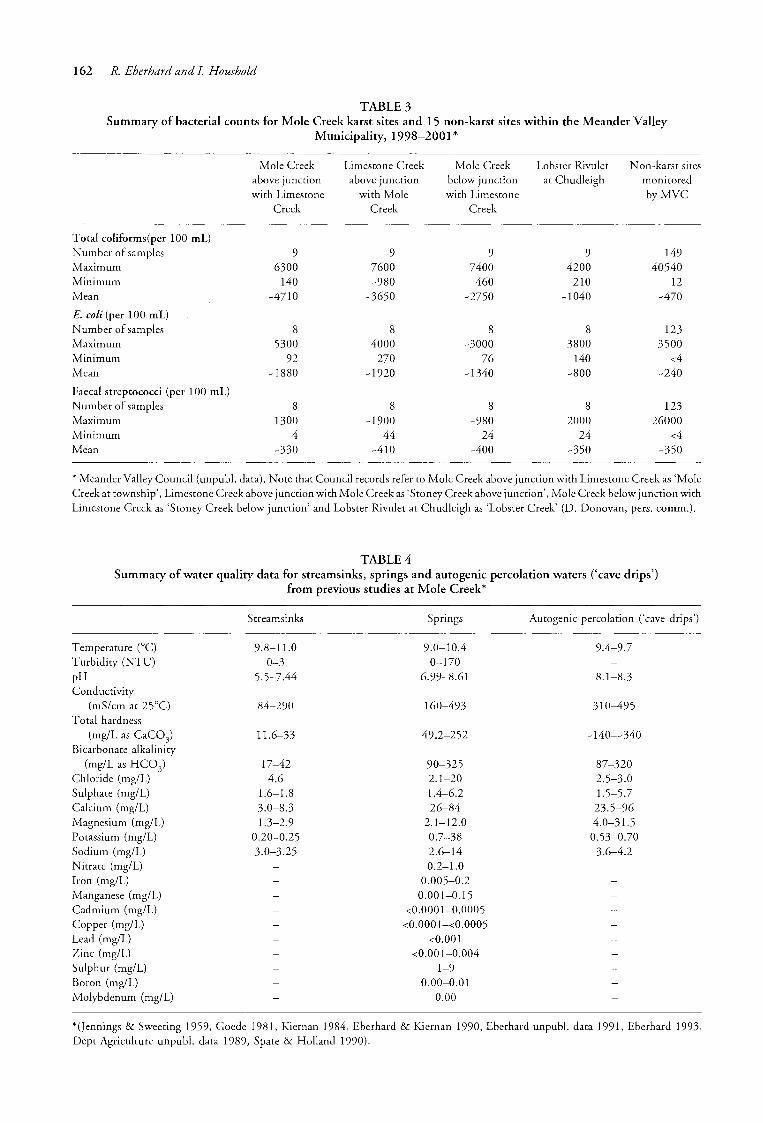
A summary of data for selected physico-chemical waterquality parameters at Mole Creek is presented in table 4.The comprehensiveness of the assays varies considerablybetween samples, some ofwhich were analysed for only oneor a few parameters (e.g. pH, conductivity). This sample setis biased in favour of lower catchment sites, particularlysprings. Data for some parameters are based on a verylimited sampling.
Methods
Thirty water samples were collected at 28 sites around MoleCreek, Liena, Caveside and Chudleigh in June and July2001. The sites include nine streamsinks (i.e. point inputsto the karst aquifer, typically surface streams that sinkunderground at cave entrances), eight karstic springs, ninesurface streams and two bores. The surface streams are fed bya variety ofsources including karstic springs and surface runoff. The sample sites can be grouped as follows:• Streamsinks in mainly forested catchments (five sites):
Execution Creek, Sassafras Creek (upper sink), GrunterCreek, Lobster Rivulet (upper sink), Rubbish Heap Cave.
• Streamsinks in partly cleared catchments (four sites):Sassafras Inflow, Howes Cave, Circular Ponds, MerseyHill uvala.
• Springs in mainly forested catchments (two sites):Marakoopa Creek, Lynds Cave.
• Springs in partly cleared catchments (six sites): Lime Pit,Bachelors Spring, Kubla Khan Efflux, Scotts Rising,Wet Cave, Mersey Hill Cave.
• Surface streams (nine sites): Ration Tree Creek, SassafrasCreek (Ugbrook), Mole Creek (Den Road), LobsterRivulet (Swimming Pool), Lobster Rivulet (Caveside),Lobster Rivulet (Chudleigh), Lobster Rivulet (LobsterFalls), Mersey River (Olivers Road), Mersey River (KellysBridge).
• Bores (two sites): Liena, Caveside.Although classified above as mainly forested or partly
cleared, the sites span a continuum from relativelyundisturbed native forest to intensively farmed agriculturalland. All the sites have been subject to some level ofanthropogenic disturbance. With the exception of MerseyRiver (Olivers Road), the surface streams and bores samplesites are mainly cleared catchments. The streamsinkssampled can be considered surrogates for surface streams inundisturbed catchments.
Where possible, samples were obtained at streamsinksand springs for which a direct hydrological connection isknown to exist, through cave exploration or water tracingstudies. These samples can be used to compare variations
Water in karstlands Tasmania 161
TABLE 1Bacterial data for Mole Creek water samples*
Kubla Khan CaveSoda CreekLime PitLittle Trimmer CaveMarakoopa Cave (Long Creek)Marakoopa Cave (Short Creek)Sassafras Creek ('spring j')Sassafras Creek ('spring i')Sassafras Creek ('spring e')Sassafras Creek ('main creek above spring e')Cowshed pool- G. HoweRed Water PotMersey Hill CaveDen CaveScotts RisingWet CaveHoneycomb I Cave
Total coliforms(per 100 mL)
11028002700
o300
7030000
1100200
290033000
8000200500500240
1300
Faecal coliforms(per 100 mL)
42020o32
2800650
30280
140004000
8080404
40
Faecal streptococci(per 100 mL)
31
16·o33
28001300
7080
250014000
10060137
110
* The samples were collected in June and August 1984, and reported by Kiernan (1984).
TABLE 2Bacterial data for Mole Creek water samples*
Standard Plate Presumptive Total Presumptive E. coli Faecal StreptococciCount (per mL) Coliforms (per 100 mL) (per 100 mL)
36°C 20C (per 100 mL)
Wet Cave 1700 1600 <4 <2 <2Lynds Cave 4 81 96 <2 4Lime Pit 2000 17000 520 130 22Union Cave 15 66 <4 <2 <2Sassafras Cave 180 7100 240 140 40Mole Creek (at township) 2100 1600 900 580 100Scotts Rising 620 980 20 25 20Spring E 540 560 60 <5 <5
* Collected by the Department of Agriculture on 9 March 1989 (M. Hart, pers. comm.).
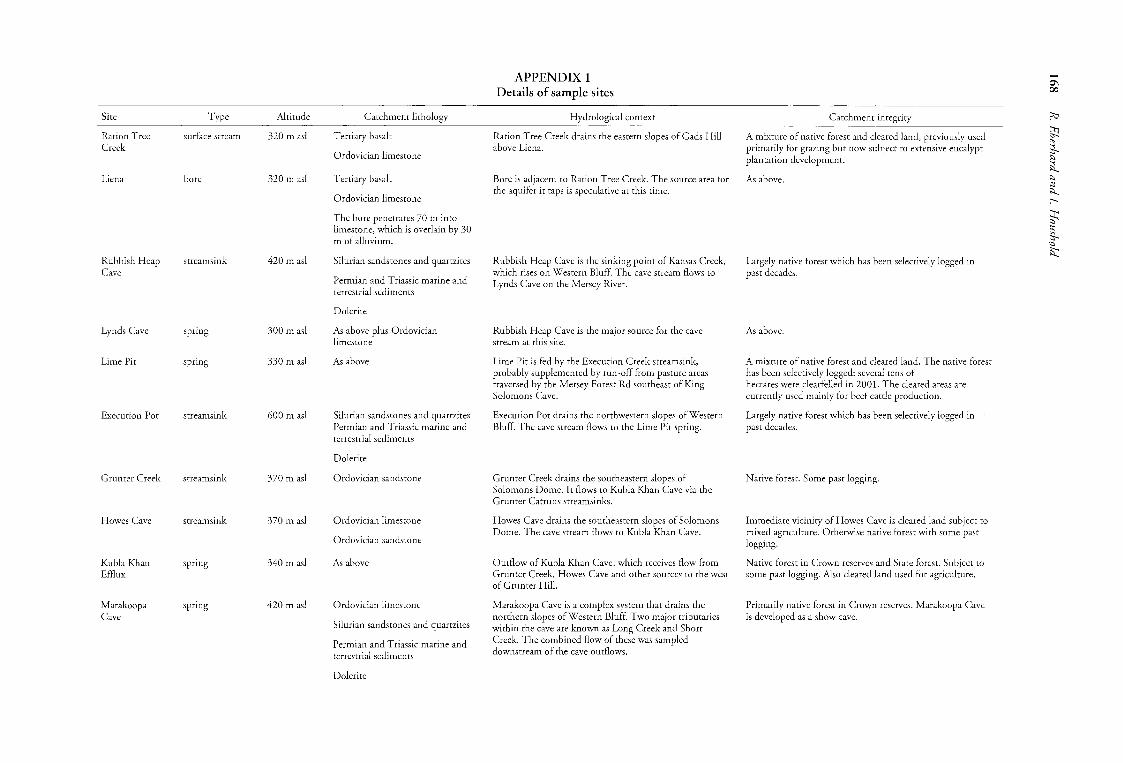
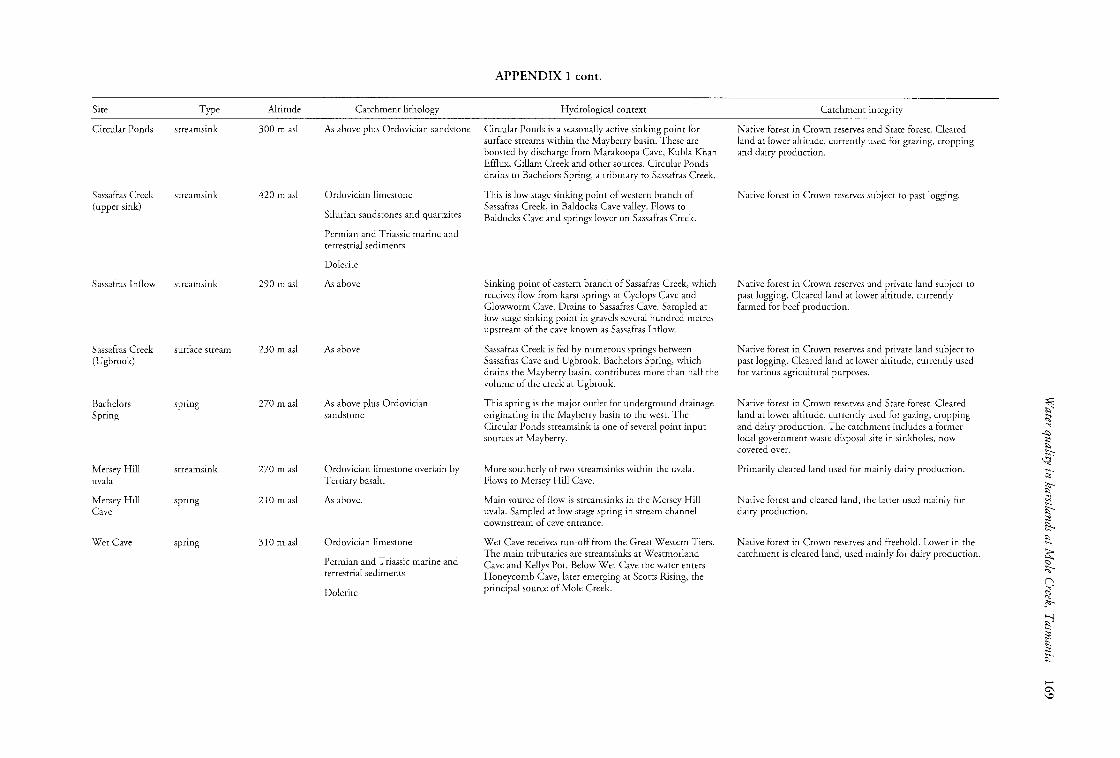
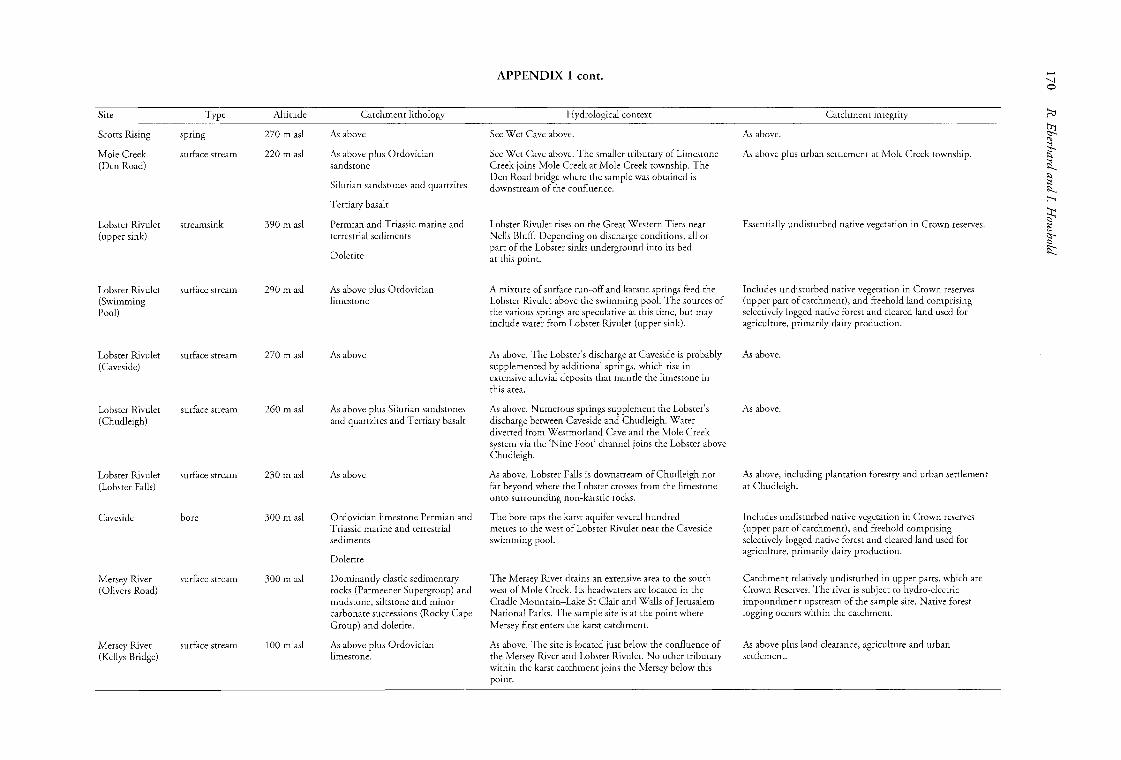
in water quality as streams pass through the karst aquifer,as at Rubbish Heap Cave, which flows to the Lynds Cavespring; Execution Pot, which flows to the Lime Pit spring;Grunter Creek and Howes Cave, which flow to KublaKhan Efflux; Circular Ponds, which drains to BachelorsSpring; Sassafras Creek (upper sink) and Sassafras Inflow,which feed a series ofkarst springs upstream of the SassafrasCreek (Ugbrook) site (this site also lies downstream of theCircular Ponds-Bachelors Spring system); Mersey Hilluvala, which flows to Mersey Hill Cave; and Lobster Rivulet(upper sink), which is considered the principal source ofLobster Rivulet (Swimming Poo!). Appendix 1 gives furtherinformation on the sites, including notes on their hydrogeological context and catchment integrity.
Discharge varied considerably between sampling dates,but on all occasions was subdued in comparison to typical
winter conditions. Stream stages were substantially loweron 6 June 2001 than on subsequent collection dates. Theintermittent Soda Creek Cave spring, which we had hopedto sample, remained dry throughout the collection period.Two sites (Bachelors Spring, Sassafras Creek at Ugbrook)were sampled twice, the second occasion being after heavyrain, to provide an indication of water quality variationswith stage.
The samples were stored on ice in bottles supplied by therelevant laboratories, prior to delivery for analysis within24 hours ofcollection. Total coliforms (TC), faecal coliforms(FC), E. coli and faecal streptococci (FS) were assayed atthe NATA accredited Water Ecoscience Laboratory (thenknown as AWT) at New Town, Tasmania. Methodsspecified in Australian Standards AS4276.5-1995,AS4276.7-1995, AS4276.9-1995 were used. Analytical
162 R. Eberhard and I Houshold
TABLE 3Summary of bacterial counts for Mole Creek karst sites and 15 non-karst sites within the Meander Valley
Municipality, 1998-2001*
Mole Creek Limestone Creek Mole Creek Lobster Rivulet N on-karst sitesabove junction above junction below junction at Chudleigh monitoredwith Limestone with Mole with Limestone byMVC
Creek Creek Creek
Total coliforms(per 100 mL)Number of samples 9 9 9 9 149Maximum 6300 7600 7400 4200 40540Minimum 140 ~980 460 210 12Mean ~4710 ~3650 ~2750 ~1040 ~470
E. coli (per 100 mL)N umber of samples 8 8 8 8 123Maximum 5300 4000 ~3000 3800 3500Minimum 92 270 76 140 <4Mean ~1880 ~1920 ~1340 ~800 ~240
Faecal streptococci (per 100 mL)Number of samples 8 8 8 8 123Maximum 1300 ~1900 ~980 2000 26000Minimum 4 44 24 24 <4Mean ~330 ~410 ~400 ~350 ~350
* Meander Valley Council (unpub!. data). Note that Council records refer to Mole Creek above junction with Limestone Creek as 'MoleCreek at township', Limestone Creek above junction with Mole Creek as 'Stoney Creek above junction', Mole Creek below junction withLimestone Creek as 'Stoney Creek below junction' and Lobster Rivulet at Chudleigh as 'Lobster Creek' (D. Donovan, pers. comm.).
TABLE 4Summary of water quality data for streamsinks, springs and autogenic percolation waters ('cave drips')
from previous studies at Mole Creek*
Streamsinks Springs Autogenic percolation ('cave drips')
Temperature (OC) 9.8-11.0 9.0-10.4 9.4-9.7Turbidity (NTU) 0-3 0-170pH 5.5-7.44 6.99-8.61 8.1-8.3Conductivity
(mS/cm at 25°C) 84-290 160-493 310-495Total hardness
(mg/L as CaC03) 11.6-33 49.2-252 ~140-~340
Bicarbonate alkalinity(mg/L as HC03) 17-42 90-325 87-320
Chloride (mg/L) 4.6 2.1-20 2.5-3.0Sulphate (mg/L) 1.6-1.8 1.4-6.2 1.5-5.7Calcium (mg/L) 3.0-8.3 26-84 23.5-96Magnesium (mg/L) 1.3-2.9 2.1-12.0 4.0-31.5Potassium (mg/L) 0.20-0.25 0.7-38 0.53-0.70Sodium (mg/L) 3.0-3.25 2.6-14 3.6-4.2Nitrate (mg/L) 0.2-1.0Iron (mg/L) 0.005-0.2Manganese (mg/L) 0.001-0.15Cadmium (mg/L) <0.0001-0.0005Copper (mg/L) <0.0001-<0.0005Lead (mg/L) <0.001Zinc (mg/L) <0.001-0.004Sulphur (mg/L) 1-9Boron (mg/L) 0.00-0.01Molybdenum (mg/L) 0.00
*Gennings & Sweeting 1959, Goede 1981, Kiernan 1984, Eberhard & Kiernan 1990, Eberhard unpub!. data 1991, Eberhard 1993,Dept Agriculture unpub!. data 1989, Spate & Holland 1990).
Services Tasmania undertook chemical analyses (exceptammonia) in accordance with NATA requirements. Thefollowing parameters were assessed:• Alkalinity by APHA Method 2320/4500-C02;• Anions by Ion Chromatography APHA Method 411 OC;• Ammonia by Ion Selective Electrode APHA Method
4500-NH3;• Metals by APHA Method 3030/3120;• Cations by APHA Method 3030/3120.
Temperature, pH and total dissolved solids (TDS) weremeasured in situ using WTW field pH and conductivitymeters. The instruments were calibrated in standardssupplied by the manufacturer before each pH andconductivity measurement.
Turbidity was measured ex situ using a Hach 2100Pmodel optical principle turbidimeter. Samples were collectedin polythene bottles and refrigerated for periods of days toweeks prior to analysis. As turbidity can change unlessmeasured within 24 hours of collection (Chapman 1996),turbidity data obtained in this study should be consideredindicative only.
RESULTS
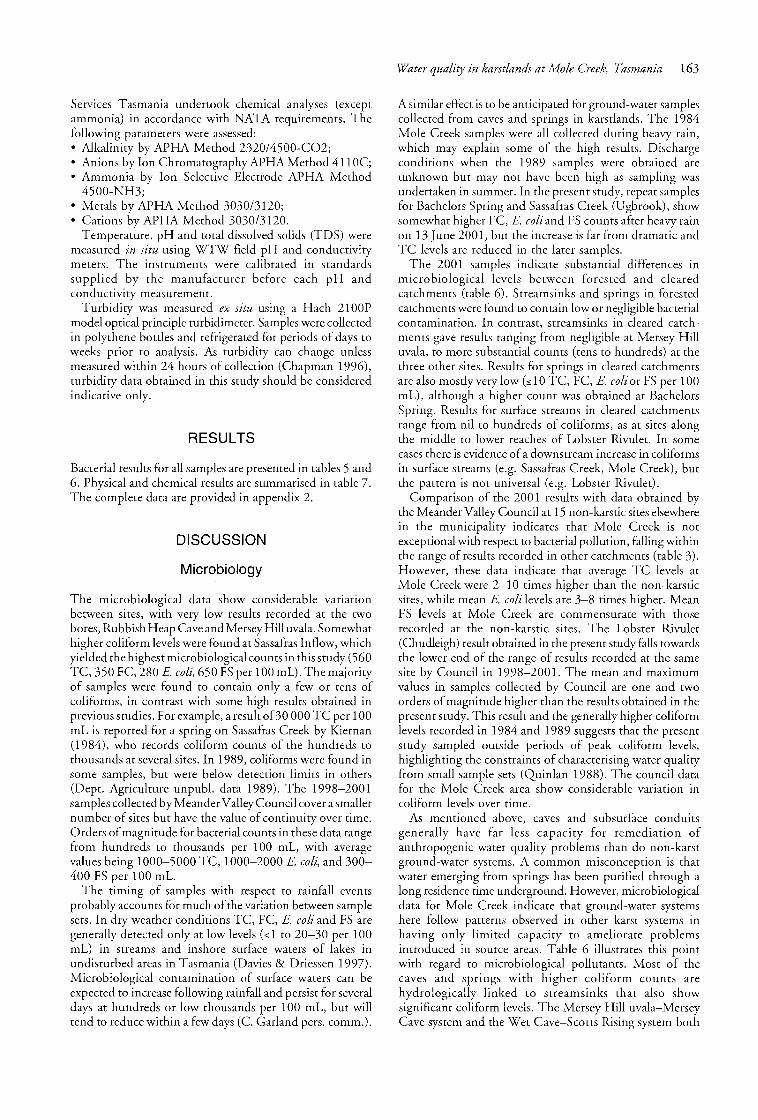
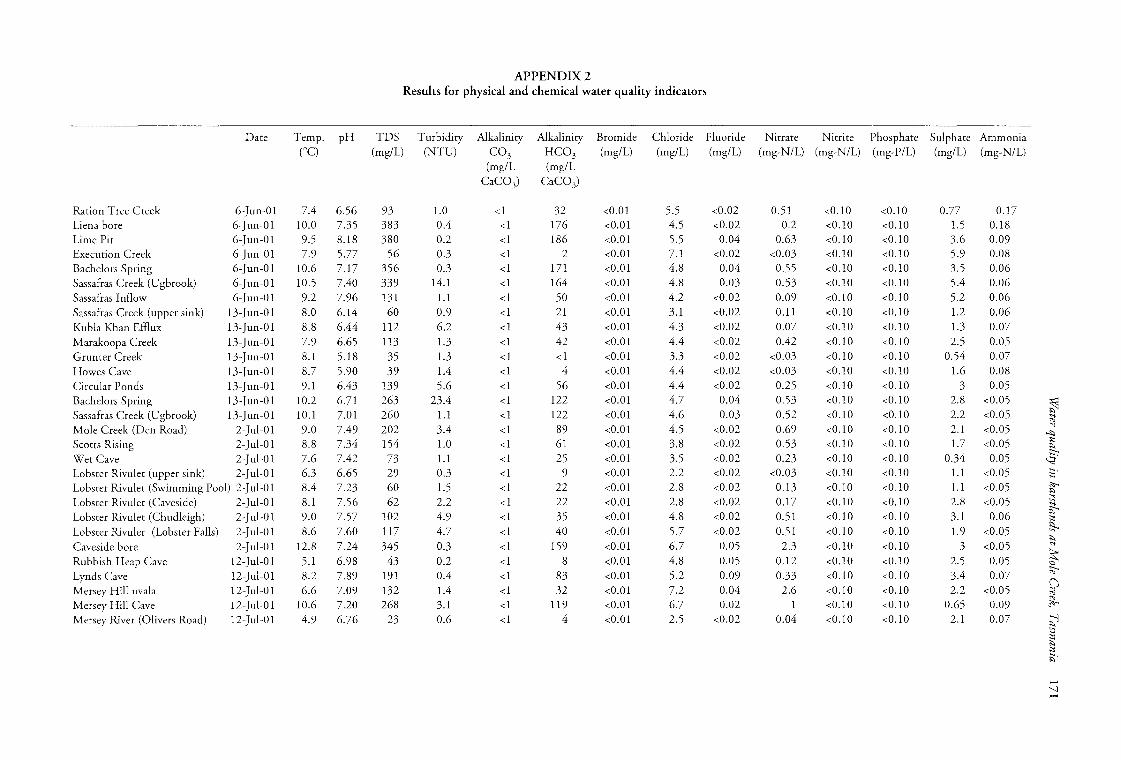
Bacterial results for all samples are presented in tables 5 and6. Physical and chemical results are summarised in table 7.The complete data are provided in appendix 2.
DISCUSSION
Microbiology
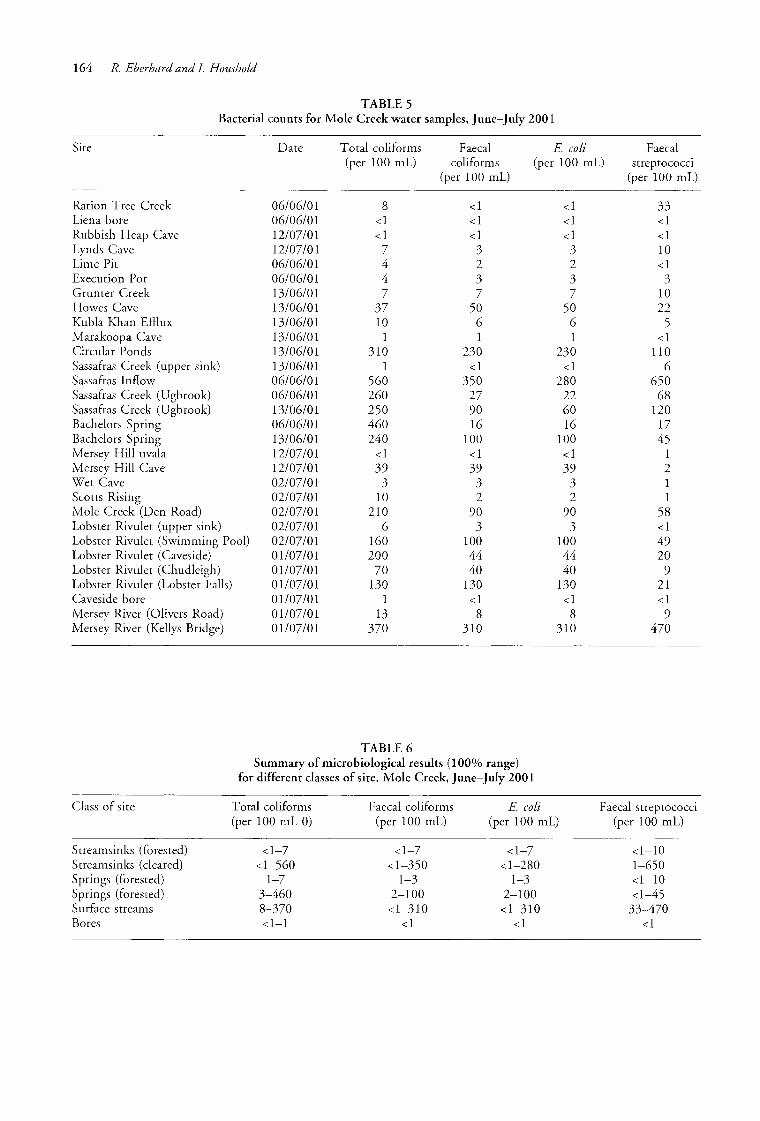
The microbiological data show considerable vanatlonbetween sites, with very low results recorded at the twobores, Rubbish Heap Cave and Mersey Hill uvala. Somewhathigher coliform levels were found at Sassafras Inflow, whichyielded the highest microbiological counts in this study (560TC, 350 FC, 280 E. coli, 650 FS per 100 mL). The majorityof samples were found to contain only a few or tens ofcoliforms, in contrast with some high results obtained inprevious studies. For example, a result of30 000 TC per 100mL is reported for a spring on Sassafras Creek by Kiernan(1984), who records coliform counts of the hundreds tothousands at several sites. In 1989, coliforms were found insome samples, but were below detection limits in others(Dept. Agriculture unpubl. data 1989). The 1998-2001samples collected by Meander Valley Council cover asmallernumber of sites but have the value of continuity over time.Orders ofmagnitude for bacterial counts in these data rangefrom hundreds to thousands per 100 mL, with averagevalues being 1000-5000 TC, 1000-2000 E. coli, and 300400 FS per 100 mL.
The timing of samples with respect to rainfall eventsprobably accounts for much ofthe variation between samplesets. In dry weather conditions TC, FC, E. coli and FS aregenerally detected only at low levels « 1 to 20-30 per 100mL) in streams and inshore surface waters of lakes inundisturbed areas in Tasmania (Davies & Driessen 1997).Microbiological contamination of surface waters can beexpected to increase following rainfall and persist for severaldays at hundreds or low thousands per 100 mL, but willtend to reduce within a few days (C. Garland pers. comm.).
Water quality in karstlands at Mole Creek, Tasmania 163
A similar effect is to be anticipated for ground-water samplescollected from caves and springs in karstlands. The 1984Mole Creek samples were all collected during heavy rain,which may explain some of the high results. Dischargeconditions when the 1989 samples were obtained areunknown but may not have been high as sampling wasundertaken in summer. In the present study, repeat samplesfor Bachelors Spring and Sassafras Creek (Ugbrook), showsomewhat higher FC, E. coli and FS counts after heavy rainon 13 June 2001, but the increase is far from dramatic andTC levels are reduced in the later samples.
The 2001 samples indicate substantial differences inmicrobiological levels between forested and clearedcatchments (table 6). Streamsinks and springs in forestedcatchments were found to contain low or negligible bacterialcontamination. In contrast, streamsinks in cleared catchments gave results ranging from negligible at Mersey Hilluvala, to more substantial counts (tens to hundreds) at thethree other sites. Results for springs in cleared catchmentsare also mostly very low (s10 TC, FC, E. coli or FS per 100mL), although a higher count was obtained at BachelorsSpring. Results for surface streams in cleared catchmentsrange from nil to hundreds of coliforms, as at sites alongthe middle to lower reaches of Lobster Rivulet. In somecases there is evidence ofa downstream increase in coliformsin surface streams (e.g. Sassafras Creek, Mole Creek), butthe pattern is not universal (e.g. Lobster Rivulet).
Comparison of the 2001 results with data obtained bythe Meander Valley Council at 15 non-karstic sites elsewherein the municipality indicates that Mole Creek is notexceptional with respect to bacterial pollution, falling withinthe range of results recorded in other catchments (table 3).However, these data indicate that average TC levels atMole Creek were 2-10 times higher than the non-karsticsites, while mean E. coli levels are 3-8 times higher. MeanFS levels at Mole Creek are commensurate with thoserecorded at the non-karstic sites. The Lobster Rivulet(Chudleigh) result obtained in the present study falls towardsthe lower end of the range of results recorded at the samesite by Council in 1998-2001. The mean and maximumvalues in samples collected by Council are one and twoorders of magnitude higher than the results obtained in thepresent study. This result and the generally higher coliformlevels recorded in 1984 and 1989 suggests that the presentstudy sampled outside periods of peak coliform levels,highlighting the constraints of characterising water qualityfrom small sample sets (Quinlan 1988). The council datafor the Mole Creek area show considerable variation incoliform levels over time.
As mentioned above, caves and subsurface conduitsgenerally have far less capacity for remediation ofanthropogenic water quality problems than do non-karstground-water systems. A common misconception is thatwater emerging from springs has been purified through along residence time underground. However, microbiologicaldata for Mole Creek indicate that ground-water systemshere follow patterns observed in other karst systems inhaving only limited capacity to ameliorate problemsintroduced in source areas. Table 6 illustrates this pointwith regard to microbiological pollutants. Most of thecaves and springs with higher coliform counts arehydrologically linked to streamsinks that also showsignificant coliform levels. The Mersey Hill uvala-MerseyCave system and the Wet Cave-Scotts Rising system both
164 R. Eberhard and I Houshold
TABLE 5Bacterial counts for Mole Creek water samples, June-July 2001
Site Date Total coliforms Faecal E. coli Faecal(per 100 mL) coliforms (per 100 mL) streptococci
(per 100 mL) (per 100 mL)
Ration Tree Creek 06/06/01 8 <1 <1 33Liena bore 06/06/01 <1 <1 <1 <1Rubbish Heap Cave 12/07/01 <1 <1 <1 <1Lynds Cave 12/07/01 3 3 10Lime Pit 06/06/01 4 2 2 <1Execution Pot 06/06/01 4 3 3 3Grunter Creek 13/06/01 7 7 7 10Howes Cave 13/06/01 37 50 50 22Kubla Khan Efflux 13/06/01 10 6 6 5Marakoopa Cave 13/06/01 1 1 1 <1Circular Ponds 13/06/01 310 230 230 110Sassafras Creek (upper sink) 13/06/01 1 <1 <1 6Sassafras Inflow 06/06/01 560 350 280 650Sassafras Creek (Dgbrook) 06/06/01 260 27 22 68Sassafras Creek (Dgbrook) 13/06/01 250 90 60 120Bachelors Spring 06/06/01 460 16 16 17Bachelors Spring 13/06/01 240 100 100 45Mersey Hill uvala 12/07/01 <1 <1 <1 1Mersey Hill Cave 12/07/01 39 39 39 2Wet Cave 02/07/01 3 3 3 1Scotts Rising 02/07/01 10 2 2 1Mole Creek (Den Road) 02/07/01 210 90 90 58Lobster Rivulet (upper sink) 02/07/01 6 3 3 <1Lobster Rivulet (Swimming Pool) 02/07/01 160 100 100 49Lobster Rivulet (Caveside) 01/07/01 200 44 44 20Lobster Rivulet (Chudleigh) 01/07/01 70 40 40 9Lobster Rivulet (Lobster Falls) 01/07/01 130 130 130 21Caveside bore 01/07/01 1 <1 <1 <1Mersey River (Olivers Road) 01/07/01 13 8 8 9Mersey River (Kellys Bridge) 01/07/01 370 310 310 470
TABLE 6Summary of microbiological results (100% range)
for different classes of site, Mole Creek, June-]uly 2001
Class of site Total coliforms Faecal coliforms E. coli Faecal streptococci(per 100 mL 0) (per 100 mL) (per 100 mL) (per 100 mL)
Streamsinks (forested) <1-7 <1-7 <1-7 <1-10Streamsinks (cleared) <1-560 <1-350 <1-280 1-650Springs (forested) 1-7 1-3 1-3 <1-10Springs (forested) 3-460 2-100 2-100 <1-45Surface streams 8-370 <1-310 <1-310 33-470Bores <1-1 <1 <1 <1
Water in karstlands at Mole Tasmania 165
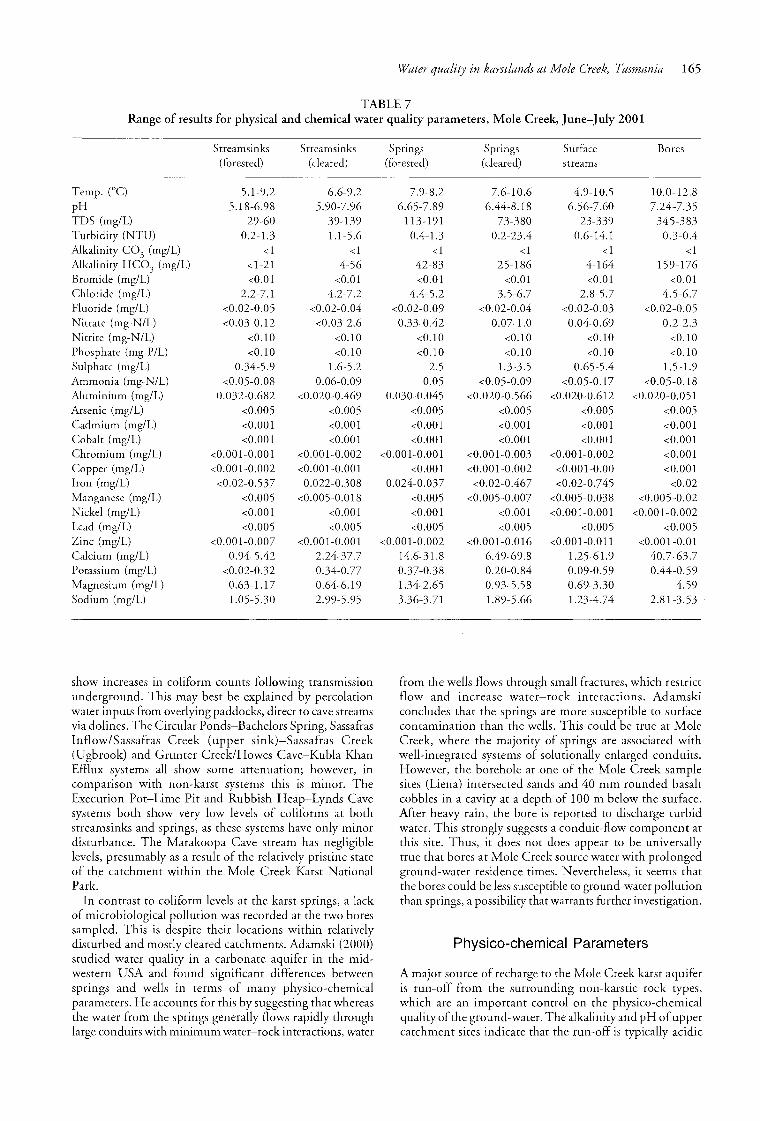
TABLE 7results for physical and chemical water parameters, Mole June-July 2001
Streamsinks Streamsinks Springs Springs Surface Bores(forested) (cleared) (forested) (cleared) streams
Temp. (OC) 5.1-9.2 6.6-9.2 7.9-8.2 7.6-10.6 4.9-10.5 10.0-12.8pH 5.18-6.98 5.90-7.96 6.65-7.89 6.44-8.18 6.56-7.60 7.24-7.35TDS (mg/L) 29-60 39-139 113-191 73-380 23-339 345-383Turbidity (NTU) 0.2-1.3 1.1-5.6 0.4-1.3 0.2-23.4 0.6-14.1 0.3-0.4Alkalinity C03 (mg/L) <1 <1 <1 <1 <1 <1Alkalinity HC03 (mg/L) <1-21 4-56 42-83 25-186 4-164 159-176Bromide (mg/L) <0.01 <0.01 <0.01 <0.01 <0.01 <0.01Chloride (mg/L) 2.2-7.1 4.2-7.2 4.4-5.2 3.5-6.7 2.8-5.7 4.5-6.7Fluoride (mg/L) <0.02-0.05 <0.02-0.04 <0.02-0.09 <0.02-0.04 <0.02-0.03 <0.02-0.05Nitrate (mg-NIL) <0.03-0.12 <0.03-2.6 0.33-0.42 0.07-1.0 0.04-0.69 0.2-2.3Nitrite (mg-N/L) <0.10 <0.10 <0.10 <0.10 <0.10 <0.10Phosphate (mg-PIL) <0.10 <0.10 <0.10 <0.10 <0.10 <0.10Sulphate (mg/L) 0.34-5.9 1.6-5.2 2.5 1.3-3.5 0.65-5.4 1.5-1.9Ammonia (mg-N/L) <0.05-0.08 0.06-0.09 0.05 <0.05-0.09 <0.05-0.17 <0.05-0.18Aluminium (mg/L) 0.032-0.682 <0.020-0.469 0.030-0.045 <0.020-0.566 <0.020-0.612 <0.020-0.051Arsenic (mg/L) <0.005 <0.005 <0.005 <0.005 <0.005 <0.005Cadmium (mg/L) <0.001 <0.001 <0.001 <0.001 <0.001 <0.001Cobalt (mg/L) <0.001 <0.001 <0.001 <0.001 <0.001 <0.001Chromium (mg/L) <0.001-0.001 <0.001-0.002 <0.001-0.001 <0.001-0.003 <0.001-0.002 <0.001Copper (mg/L) <0.001-0.002 <0.001-0.001 <0.001 <0.001-0.002 <0.001-0.00 <0.001Iron (mg/L) <0.02-0.537 0.022-0.308 0.024-0.037 <0.02-0.467 <0.02-0.745 <0.02Manganese (mg/L) <'0.005 <0.005-0.018 <0.005 <0.005-0.007 <0.005-0.038 <0.005-0.02Nickel (mg/L) <0.001 <0.001 <0.001 <0.001 <0.001-0.001 <0.001-0.002Lead (mg/L) <0.005 <0.005 <0.005 <0.005 <0.005 <0.005Zinc (mg/L) <0.001-0.007 <0.001-0.001 <0.001-0.002 <0.001-0.016 <0.001-0.011 <0.001-0.01Calcium (mg/L) 0.94-5.42 2.24-37.7 14.6-31.8 6.49-69.8 1.25-61.9 40.7-63.7Potassium (mg/L) <0.02-0.32 0.34-0.77 0.37-0.38 0.20-0.84 0.09-0.59 0.44-0.59Magnesium (mg/L) 0.63-1.17 0.64-6.19 1.34-2.65 0.93-5.58 0.69-3.30 4.59Sodium (mg/L) 1.05-5.30 2.99-5.95 3.36-3.71 1.89-5.66 1.23-4.74 2.81-3.53
show increases in coliform counts following transmissionunderground. This may best be explained by percolationwater inputs from overlying paddocks, direct to cave streamsvia dolines. The Circular Ponds-Bachelors Spring, SassafrasInflow/Sassafras Creek (upper sink)-Sassafras Creek(Ugbrook) and Grunter Creek/Howes Cave-Kubla KhanEfflux systems all show some attenuation; however, incomparison with non-karst systems this is minor. TheExecution Pot-Lime Pit and Rubbish Heap-Lynds Cavesystems both show very low levels of coliforms at bothstreamsinks and springs, as these systems have only minordisturbance. The Marakoopa Cave stream has negligiblelevels, presumably as a result of the relatively pristine stateof the catchment within the Mole Creek Karst NationalPark.
In contrast to coliform levels at the karst springs, a lackof microbiological pollution was recorded at the two boressampled. This is despite their locations within relativelydisturbed and mostly cleared catchments. Adamski (2000)studied water quality in a carbonate aquifer in the midwestern USA and found significant differences betweensprings and wells in terms of many physico-chemicalparameters. He accounts for this by suggesting that whereasthe water from the springs generally flows rapidly throughlarge conduits with minimum water-rock interactions, water
from the wells flows through small fractures, which restrictflow and increase water-rock interactions. Adamskiconcludes that the springs are more susceptible to surfacecontamination than the wells. This could be true at MoleCreek, where the majority of springs are associated withwell-integrated systems of solutionally enlarged conduits.However, the borehole at .one of the Mole Creek samplesites (Liena) intersected sands and 40 mm rounded basaltcobbles in a cavity at a depth of 100 m below the surface.After heavy rain, the bore is reported to discharge turbidwater. This strongly suggests a conduit-flow component atthis site. Thus, it does not does appear to be universallytrue that bores at Mole Creek source water with prolongedground-water residence times. Nevertheless, it seems thatthe bores could be less susceptible to ground-water pollutionthan springs, a possibility that warrants further investigation.
Physico-chemical Parameters
A major source of recharge to the Mole Creek karst aquiferis run-off from the surrounding non-karstic rock types,which are an important control on the physico-chemicalquality ofthe ground-water. The alkalinity and pH ofuppercatchment sites indicate that the run-off is typically acidic
166 R. Eberhard and I Houshold
waters low in dissolved ions. This study found that run-offfrom Standard Hill, as sampled at Grunter Creek andHowes Cave, is considerably more acid than that from theWestern Tiers, which is a major source area for the remainderof the karst. The tannin-stained appearance of run-off fromStandard Hill suggests that acidity is boosted by drainagethrough peat soils. This effect is sufficiently pronounced tocause water emerging from karst springs at Kubla KhanEfflux and Bachelors Spring, which receive much of theirflow from Standard Hill, to be slightly acidic. This isnotwithstanding the buffering effect of contact with thelimestone as the water passes through the aquifer. All othersprings sampled in this and previous studies are aboutneutral or slightly alkaline, as would be expected due tocarbonate dissolution processes within the aquifer. Levels ofdissolved ions are low for all species analysed with theexception of calcium. The highest levels of calcium wererecorded at springs, bores and surface streams fed primarilyby springs. This conforms to accepted models of groundwater geochemistrywithin karst aquifers, whereby dissolutionofthe karstic bedrock releases calcium into solution (Ford &Williams 1989).
Two parameters show a relationship with catchmentdisturbance. Streamsinks and springs in forested catchmentsshow low levels of turbidity (0.2-1.3 NTU) , whereasturbidity at streamsinks, springs and surface streams incleared catchments is more variable and often higher (0.223.4 NTU). The difference between the medians isstatistically significant (U=34; P<0.05, Mann-Whitney Utest). Multiple samples along individual streams (LobsterRivulet, Sassafras Creek and Mole Creek) all show increasingturbidity in the downstream direction, which would beconsistent with a correlation between turbidity and theextent and intensity of disturbance. Of the ,..,80 resultsobtained by Eberhard (unpub!. data 1991), the highestlevels of turbidity were recorded in disturbed catchments:Lime Pit (1-170 NTU) , Scotts Cave (12-126 NTU) , SodaCreek (0-10 NTU) and Sassafras Creek (8 NTU). Themain cause of turbidity is the presence of fine suspendedsolids such as mineral particles derived from either erosionofsoils in the catchment or erosion ofstream banks (Gippel1994).
The data also provide some evidence of a link betweencatchment disturbance and stream nutrient levels. Nitratelevels in forested catchments were found to fall in the range<0.03-0.42 mg-N/L, whereas a range of <0.03-2.3 mg-NIL was recorded in cleared catchments. The differencebetween the medians is statistically significant (U=26;P<0.05, Mann-Whitney U-test). Nitrate levels of 4.1-4.6mglL were recorded at Den Cave, Mersey Hill Cave andDen Spring by Kiernan (1984), but the significance ofthese data is difficult to assess. Nitrite and phosphate levelswere below detection limits at all sites sampled in thepresent study. Sulphate levels show no obvious pattern,with the highest result (5.9 mg/L) being a sample fromExecution Creek in a forested catchment. Ammonia levelsare low in all samples (s 0.18 mg-N/L). Elevated nutrientlevels could be expected in disturbed catchments due tovarious effects including application of fertilisers, increasedstream temperatures due to reduced stream shading fromvegetation, excretion by stock and effluent from septicsystems.
The above discussion suggests that, with the probableexception of turbidity, the effects of catchment lithologydominate over catchment disturbance as a control on
physico-chemical water quality parameters. However, amore detailed analysis of catchment effects is hampered bythe small data set, precluding a more rigorous statisticalcomparison of different classes of site.
Comparison of physico-chemical data for streamsinksand related springs shows the following patterns:• For the majority of systems, transmission through
subsurface conduits has resulted in an increase intemperature, pH, TDS, turbidity, alkalinity, fluoride,nitrate, potassium, calcium and magnesium. Most ofthese increases are to be expected in karst systems inwinter months. An interesting exception to this is theMersey Hill uvala-Mersey Hill Cave system that showsan apparent decrease in calcium and magnesium at thesame time as an increase in TDS and alkalinity. Wesuspect this is an error in either data collection or analysis.
• Increasing levels of nitrate are an as yet unexplainedphenomenon in many karst systems, occurring in bothnatural and disturbed systems. Increases are, therefore,not necessarily linked with fertiliser inputs; however,where levels exceed more than one order of magnitude,this should be suspected (1. Houshold, unpub!. data).Although levels are low, nitrate concentrations in somesprings at Mole Creek show more than order ofmagnitudeincrease over their related streamsinks. This suggests thatapplication ofartificial fertilisers and sources ofammonia,typical ofmany agricultural and urban systems, is havinga detectable influence on the nutrient status ofthe groundwater. Data from overseas indicate that nitrate used inagricultural systems is readily transferred to karst aquifers(Nebbache et al. 2001).
• Levels of chloride, sulphate, aluminium, iron, zinc andsodium exhibit approximately equal distribution ofincrease and decrease in concentration, most likelyreflecting specific catchment lithologies and soil types.
• In only a very few systems was a decrease in theconcentration of a species recorded. The majority ofdecreases were for iron, aluminium and ammonia, alllikely to be lost through oxidation. The iron andaluminium may be precipitated out of solution, and theammonia rapidly oxidised to nitrate.Most of the other metals analysed showed very low
concentrations, which did not appear to change as a resultof transport through cave systems.
CONCLUSIONS
Variations in water quality at Mole Creek are explicable inrelation to natural factors such as soils and lithology withinthe catchment or whether the site is located upstream ordownstream of the karst aquifer. Water quality is alsoaffected by anthropogenic factors. Compared to sites inmainly forested, relatively pristine parts of the catchment,sites in partly cleared, disturbed parts of the catchmentgenerally showed higher levels ofmicrobiological pollution,turbidity and dissolved nitrate. The microbiological andphysico-chemical parameters mostly show little attenuationafter flowing through the karst aquifer for distances ofhundreds to thousands of metres, implying that the karstaquifer has a limited or negligible effect in amelioratingwater pollution. Rapid capture of surface run-off viasolutional openings such as sinkholes, caves and streamsinks,coupled with the pipe-like efficiency with which karsticconduits transfer water to downstream outlets, evidently
constrain the adsorption ofpollutants onto clays and organicsor their breakdown through microbiological processes. Thisconnectivitybetween surface and underground environmentsis a key consideration for sustainable land management inkarstlands. We conclude that karst aquifers have more incommon with surface streams, as opposed to non-karsticground-water systems, in terms of their water purificationproperties. Bores may be an exception to the general pattern
the two sampled in this study did not show obvious signsofpollution, despite being located in disturbed catchments.The possibility that these sites are less affected by catchmentactivities warrants further investigation.
ACKNOWLEDGMENTS
We thankstaffatWater Ecoscience Laboratory andAnalyticalServices Tasmania for analysing the samples. Dr ChristianGarland (Water Ecoscience Laboratory) provided helpfuladvice on a draft of this paper, as did Stefan Eberhard(Caveworks, WA). Michael Hart (Department of PrimaryIndustries, Water and Environment) gave permission to useunpublished data collected at Mole Creek in 1989. DannyDonovan at Meander Valley Council supplied results fromCouncil's water quality program. We also thank Mole Creeklandowners who gave access to sites on private property.This work was facilitated by the Natural Heritage Trust,which provided funding support for the Mole Creek KarstStrategy.
REFERENCES
Adamski, lC., 2000: Geochemistry of the Springfield Plateauaquifer of the Ozark Plateaus Province in Arkansas,Kansas, Missouri and Okalahoma, USA. HydrologicalProcesses 14(5): 849-866.
BROWN, F.R. & DE VRIES, M.H., 1958: The subterraneanhydrology of the Mole Creek area. Bulletin of theTasmanian Caverneering Club, 1(3): 9-15.
BURNS, K. & RUNDLE, A., 1958: The geology of the Mole Creekcaverns. Bulletin of the Tasmanian Caverneering Club,1(3): 3-8.
CHAPMAN, D., 1996: Water Quality Assessments. 2nd edition, E. &F.N. Spon, London.
DAVIES, P.E. & DRIESSEN, M.M., 1997: Surface Water Quality atThree Key Locations in the Tasmanian Wilderness WorldHeritage Area: Report on a Pilot Monitoring Program.Wildlife Report 97/2, Parks and Wildlife Service,Tasmania, Hobart.
DEPARTMENT OF PRIMARY INDUSTRIES, WATER AND ENVIRONMENT,2001: Mole Creek Karst National Park and ConservationArea Draft Management Plan 2001. Parks and WildlifeService, Tasmania, Hobart.
DREW, D. & HOTZL, H., 1999: Karst Hydrogeology and HumanActivities: Impacts, Consequences and Implications.International Contributions to Hydrogeology 20, AABalkema, Rotterdam.
EBERHARD, R., 1993: Large-scale Erosion ofGours in Croesus Cave,Tasmania. Grad. Dip. Env. Studs. Hons. thesis, Universityof Tasmania.
EBERHARD, R. & KIERNAN, K., 1990: Little Trimmer project:instrumented monitoring of the undergroundenvironment. In S. Brooks (Ed.): Cave Leeuwin 1991,Proceedings of the 18th Biennial Conference of theAustralian Speleological Federation: 66-69.
Water quality in karstlands at Mole Creek, Tasmania 167
EBERHARD, R. & HOUSHOLD, 1., 2001: River management inkarst terrains: issues to be considered with an examplefrom Mole Creek, Tasmania. In Rutherfurd, 1., Sheldon,F., Brierly, G. & Kenyon, C., (Eds): Third AustralianStream Management Conference Proceedings, 27-29 August2001, Brisbane: 197-203.
EBERHARD, S., 2001: Cave fauna monitoring and management atIda Bay, Tasmania. Records of the Western AustralianMuseum, Supplement 64: 97-104.
FORD, D.C. & WILLIAMS, P.W., 1989: Karst Geomorphology andHydrology. Unwin Hyman, London.
GILLIESON, D., 1996: Caves: Processes, Development andManagement. Basil Blackwell, Oxford.
GIPPEL, C., 1994: Monitoring turbidity in stream water. AustralianJournal ofSoil and Water Conservation 7(4): 37-44.
GOEDE, A., 1981: Variation in hardness of cave drips at twoTasmanian sites. Helictite, 19: 57-67.
HOUSHOLD, 1., 1995: Karst impacts and environmental rehabilitation of a limestone quarry at Lune River, southernTasmania. In Henderson, K., Houshold, 1. & Middleton,G. (Eds): Cave and Karst Management in Australasia 11:Proceedings of the Eleventh Australasian Conference onCave andKarst Management. Australasian Cave and KarstManagement Association and Parks and Wildlife Service,Tasmania: 138-175.
JENNINGS, J.N. & JAMES, B.N., 1967: Underground watermovements in the Lobster Rivulet Mole Creek divide,Tasmania. Australian Journal ofScience 30(3): 108-109.
JENNINGS, J.N. & SWEETING, M.M., 1959: Water chemistry data.In Kiernan, K., 1984: Land Use in Karst Areas: ForestryOperations and the Mole Creek Caves. Report to theForestry Commission and National Parks & WildlifeService, Tasmania: 301.
KIERNAN, K., 1984: Land Use in Karst Areas: Forestry Operationsand the Mole Creek Caves. Report to the ForestryCommission and National Parks & Wildlife Service,Tasmania.
KIERNAN, K., 1987: Ground-water pollution beneath a farmingdistrict. Institute ofAustralian Geographers 22nd Conference,Geography and Public Policy Program Abstracts, Canberra,24-28 August 1987: 67-68.
KIERNAN, K., 1992: Karst hydrogeology in Tasmania. InternationalContributions to Hydrogeology 13: 377-392.
KIERNAN, K., EBERHARD, R. & SHANNON, C.H.C., 1994: Furtherhydrogeological investigations of the Mill Creek-KansasCreek area, northern Tasmania. Tasforests 6: 7-22.
NATIONAL WATER QUALITY MANAGEMENT STRATEGY, 2000:Australian and New Zealand Drinking Water GuidelinesfOr Fresh and Marine Water Quality. Australian and NewZealand Environment and the Agriculture and ResourceManagement Council of Australia and New Zealand.
NEBBACHE, S., FEENY, V., POUDEVIGNE, 1. & ALARD, D., 2001:Turbidity and nitrate transfer in karstic aquifers in ruralareas: the Brionne Basin case study. Journal ofEnvironmental Management 62: 389-398.
QUINLAN, J.F., 1988: Protocol for reliable monitoring ofgroundwater quality in karst terranes. Karst Hydrogeologyand Karst Environment Protection. Proceedings of the21 st Congress of the International Association ofHydrogeologists. Geological Publishing House, Beijing:888-893.
SPATE, A.P. & HOLLAND, E.A., 1990: Croesus Cave, Mole Creek,Tasmania: A Review of Resources, Visitor Impacts andManagement Issues. Report to Forestry Commission,Tasmania.
(accepted 9 December 2002)
HydrologlCal context
Ration Tree Creek drains the eastern slopes of Gads Hillabove Liena.
~
~~
~~~~
~~
~~~~
~
p....I.
0\00
In
As above.
A mixture of native forest and cleared land, previously usedfor grazing but now to extensive eucalypt
point of Kansas Creek,cave stream flows to
Bore is adjacent to Ration Tree Creek. The source area forthe aquifer it taps is speculative at this time.
APPENDIX 1Details of sample sites
Rubbish Heap Cave is thewhich rises on Western Bluff.Lynds Cave on the Mersey River.Permian and Triassic marine and
terrestrial sediments
Catchment lithology
Tertiary basalt
Ordovician limestone
Tertiary basalt
Ordovician limestone
The bore penetrates 70 mintolimestone, which is overlain by 30m of alluvium.
Silurian sandstones and quartzites
Altitude
320 m asl
320 m asl
420 m asl
bore
Type
surface stream
streamsink
Liena
Ration TreeCreek
Rubbish HeapCave
Site
Dolerite
Lynds Cave spring 300 m asl As above plus Ordovicianlimestone
Rubbish Heap Cave is the major source for the cavestream at this
As above.
Lime Pit
Execution Pot
spring
streamsink
330 m asl
600 m asl
As above
Silurian sandstones and quartzitesPermian and Triassic marine andterrestrial sediments
Lime Pit is fed by the Execution Creek streamsink,probably supplemented by run-off from oasture areastraversed by the Mersey Forest RdSolomons
Execution Pot drains the northwestern slopes ofWesternBluff. The cave stream flows to the Lime Pit spring.
A mixture of native forest and cleared land. The native foresthas been several tens ofhectares were in 2001. The cleared areas arecurrently used mainly for beef cattle production.
has been selectivelv IOQ"Q"ed in
Dolerite
Grunter Creek streamsink 370 m asl Ordovician sandstone Grunter Creek drains the southeastern slopes ofSolomons Dome. It flows to Kubla Khan Cave via theGrunter Catruns streamsinks.
Native forest. Some past
Howes Cave streamsink 370 m asl Ordovician limestone
Ordovician sandstone
Howes Cave drains the southeasternDome. The cave stream flows to Kubla
of SolomonsCave.
Immediate of Howes Cave is cleared land subject tomixed native forest with some pastlogging.
Kubla KhanEfflux
spring 340 m asl As above Outflow of Kubla Khan Cave, which receives flow fromGrunter Creek, Howes Cave and other sources to the westof Grunter Hill.
Native forest in Crown reserves and State forest.some past logging. Also cleared land used for agnculture.
to
MarakoopaCave
spring 420 m asl Ordovician limestone
Silurian sandstones and quartzites
Permian and Triassic marine andterrestrial sediments
Marakoopa Cave is a complex system that drains thenorthern slopes ofWestern Bluff. Two major tributarieswithin the cave are known as Long Creek and ShortCreek. The combined flow of these was sampleddownstream of the cave outflows.
Primarily native forest in Crown reserves. Marakoopa Caveis develooed as a show cave.
Dolerite
APPENDIX 1 cont.
Site Type Altitude Catchment lithology Hydrological context Catchment integrity
Ordovician limestone
Silurian sandstones and quartzites
Native forest in Crown reserves and State forest. Clearedland at lower altitude, currently used for grazing, croppingand dairy production.
Circular Ponds
Sassafras Creek(upper sink)
streamsink
streamsink
300 m asl
420 m asl
As above plus Ordovician sandstone Circular Ponds is a seasonally active sinking point forsurface streams within the Mayberry basin. These areboosted by discharge from Marakoopa Cave, Kubla KhanEfflux, Gillam Creek and other sources. Circular Pondsdrains to Bachelors Spring, a tributary to Sassafras Creek.
This is low stage sinking point of western branch ofSassafras Creek, in Baldocks Cave valley. Flows toBaldocks Cave and springs lower on Sassafras Creek.
Native forest in Crown reserves to past
Permian and Triassic marine andterrestrial sediments
Dolerite
Sassafras Creek surface stream 230 m asl As above(Ugbrook)
Bachelors spring 270 m asl As above plus OrdovicianSpring sandstone ~
~'i
~~~~~.
~.
~~~
~~
~~~
~~
to
forlatter used
Native forest in Crown reserves andCleared land at lower
Primarily cleared land used for mainly dairy production.
Native forest in Crown reserves andpast logging. Cleared land at lower
agricultural purposes.
Native forest and cleared land,dairy production.
Native forest in Crown reserves and State forest. Clearedland at lower altitude, currently used forand dairy production. The catchmentlocal2:overnment waste disposal site
over.
Native forest in Crown reserves and freehold. Lower in thecatchment is cleared land, used mainly for dairy production.
Sinking point of eastern branch of Sassafras Creek, whichreceives flow from karst springs at Cyclops Cave andGlowworm Cave. Drains to Sassafras Cave. Sampled atlow stage sinking point in gravels several hundred metresupstream of the cave known as Sassafras Inflow.
Sassafras Creek is fed by numerous springs betweenSassafras Cave and Ugbrook. Bachelors Spring, whichdrains the Mayberry basin, contributes more than half thevolume of the creek at Ugbrook.
This spring is the major outlet for undergroundoriginating in the Mayberry basin to the west. TheCircular Ponds streamsink is one of several point inputsources at Mayberry.
Main source of flow is streamsinks in theuvala. Sampled at low stage spring in streamdownstream of cave entrance.
More southerly of two streamsinks within the uvala.Flows to Mersey Hill Cave.
Wet Cave receives run-off from the Great Western Tiers.The main tributaries are streamsinks at WestmorlandCave and Kellys Pot. Below Wet Cave the water entersHoneycomb Cave, later emerging at Scotts Rising, theprincipal source of Mole Creek.
Permian and Triassic marine andterrestrial sediments
Dolerite
Ordovician limestone
As above
Ordovician limestone overlain byTertiary basalt.
As above.
290 m asl
270 m asl
310 m asl
210 m asl
streamsink
streamsink
spring
spring
Mersey Hilluvala
Sassafras Inflow
Mersey HillCave
Wet Cave
~~~~~.
p....d
0\\t)
Site Type Altitude
Scotts Rising spring 270 m asl
Mole Creek surface stream 220 m asl(Den Road)
Essentially undisturbed native vegetation in Crown reserves.Lobster Rivulet(upper sink)
streamsink 390 m asl
Catchment lithology
As above
As above plus Ordoviciansandstone
Silurian sandstones and quartzites
Tertiary basalt
Permian and Triassic marine andterrestrial sediments
Dolerite
APPENDIX 1 cont.
Hydrological context
See Wet Cave above.
See Wet Cave above. The smaller tributary of LimestoneCreek joins Mole Creek at Mole Creek township. TheDen Road bridge where the sample was obtained isdownstream of the confluence.
Lobster Rivulet rises on the Great Western Tiers nearNeIls Bluff. Depending on discharge conditions, all orpart of the Lobster sinks underground into its bedat this point.
As above.
As above
Catchment integrity
urban settlement at Mole Creek township.
""""""'.Jo
~
~~
~~~~
~~
~~~~
~
Lobster Rivulet surface stream 290 m asl As above plus Ordovician(Swimming limestonePool)
Lobster Rivulet surface stream 270 m asl As above(Caveside)
Lobster Rivulet surface stream 260 m asl As above plus Silurian sandstones(Chudleigh) and quartzites and Tertiary basalt
Lobster Rivulet(Lobster Falls)
Caveside
Mersey River(Olivers Road)
Mersey River(Kellys Bridge)
surface stream
bore
surface stream
surface stream
230 m asl
300 m asl
300 m asl
100 m asl
As above
Ordovician limestone Permian andTriassic marine and terrestrialsediments
Dolerite
Dominantly clastic sedimentaryrocks (Parmeener Supergroup) andmudstone, siltstone and minorcarbonate successions (Rocky CapeGroup) and dolerite.
As above plus Ordovicianlimestone.
A mixture of surface run-off and karstic springs feed theLobster Rivulet above the swimming pool. The sources ofthe various springs are speculative at this time, but mayinclude water from Lobster Rivulet (upper sink).
As above. The Lobster's discharge at Caveside is probablysupplemented by additional springs, which rise inextensive alluvial deposits that mantle the limestone inthis area.
As above. Numerous springs supplement the Lobster'sdischarge between Caveside and Chudleigh. Waterdiverted from Westmorland Cave and the Mole Creeksystem via the 'Nine Foot' channel joins the Lobster aboveChudleigh.
As above. Lobster Falls is downstream of Chudleigh notfar beyond where the Lobster crosses from the limestoneonto surrounding non-karstic rocks.
The bore taps the karst aquifer several hundredmetres to the west of Lobster Rivulet near the Cavesideswimming pool.
The Mersey River drains an extensive area to the southwest of Mole Creek. Its headwaters are located in theCradle Mountain-Lake St Clair and Walls ofJerusalemNational Parks. The sample site is at the point whereMersey first enters the karst catchment.
As above. The site is located just below the confluence ofthe Mersey River and Lobster Rivulet. No other tributarywithin the karst catchment joins the Mersey below thispoint.
vegetatIOn in Crown reservescatchment), and freehold land comprising
native forest and cleared land used fordairy production.
As above.
As above.
As above, including plantation forestry and urban settlementat Chudleigh.
UprrPT'lT1r\n in Crown reservescomprising
native forest and cleared land used fordairy production.
As above plus land clearance, agriculture and urbansettlement.
APPENDIX 2Results for physical and chemical water quality indicators
Date Temp. pH TDS Turbidity Alkalinity Alkalinity Bromide Chloride Fluoride Nitrate Nitrite Phosohate Sulohate Ammonia(OC) (mg/L) (NTU) C03 HC03 (mg/L) (mg/L) (mg/L)
(mg/L (mg/LCaC03) CaC03)
Ration Tree Creek 6-]un-Ol 7.4 6.56 93 1.0 <1 32 <0.01 5.5 <0.02 0.51 <0.10 <0.10 0.77 0.17Liena bore 6-]un-Ol 10.0 7.35 383 0.4 <1 176 <0.01 4.5 <0.02 0.2 <0.10 <0.10 1.5 0.18Lime Pit 6-]un-Ol 9.5 8.18 380 0.2 <1 186 <0.01 5.5 0.04 0.63 <0.10 <0.10 3.6 0.09Execution Creek 6-]un-Ol 7.9 5.77 56 0.3 <1 2 <0.01 7.1 <0.02 <0.03 <0.10 <0.10 5.9 0.08Bachelors Spring 6-]un-Ol 10.6 7.17 356 0.3 <1 171 <0.01 4.8 0.04 0.55 <0.10 <0.10 3.5 0.06Sassafras Creek (Ugbrook) 6-]un-Ol 10.5 7.40 339 14.1 <1 164 <0.01 4.8 0.03 0.53 <0.10 <0.10 5.4 0.06Sassafras Inflow 6-]un-Ol 9.2 7.96 131 1.1 <1 50 <0.01 4.2 <0.02 0.09 <0.10 <0.10 5.2 0.06Sassafras Creek (upper sink) 13-]un-Ol 8.0 6.14 60 0.9 <1 21 <0.01 3.1 <0.02 0.11 <0.10 <0.10 1.2 0.06Kubla Khan Efflux 13-]un-Ol 8.8 6.44 112 6.2 <1 43 <0.01 4.3 <0.02 0.07 <0.10 <0.10 1.3 0.07Marakoopa Creek 13-]un-Ol 7.9 6.65 113 1.3 <1 42 <0.01 4.4 <0.02 0.42 <0.10 <0.10 2.5 0.05Grunter Creek 13-]un-Ol 8.1 5.18 35 1.3 <1 <1 <0.01 3.3 <0.02 <0.03 <0.10 <0.10 0.54 0.07Howes Cave 13-]un-Ol 8.7 5.90 39 1.4 <1 4 <0.01 4.4 <0.02 <0.03 <0.10 <0.10 1.6 0.08Circular Ponds 13-]un-Ol 9.1 6.43 139 5.6 <1 56 <0.01 4.4 <0.02 0.25 <0.10 <0.10 3 0.05Bachelors Spring 13-]un-Ol 10.2 6.71 263 23.4 <1 122 <0.01 4.7 0.04 0.53 <0.10 <0.10 2.8 <0.05
~Sassafras Creek (Ugbrook) 13-]un-Ol 10.1 7.01 260 1.1 <1 122 <0.01 4.6 0.03 0.52 <0.10 <0.10 2.2 <0.05 ~
Mole Creek (Den Road) 2-]ul-Ol 9.0 7.49 202 3.4 <1 89 <0.01 4.5 <0.02 0.69 <0.10 <0.10 2.1 <0.05 ~
~
Scotts Rising 2-]ul-Ol 8.8 7.34 154 1.0 <1 61 <0.01 3.8 <0.02 0.53 <0.10 <0.10 1.7 <0.05 ~~
Wet Cave 2-]ul-O 1 7.6 7.42 73 1.1 <1 25 <0.01 3.5 <0.02 0.23 <0.10 <0.10 0.34 0.05 ~
~
Lobster Rivulet (upper sink) 2-]ul-O 1 6.3 6.65 29 0.3 <1 9 <0.01 2.2 <0.02 <0.03 <0.10 <0.10 1.1 <0.05 ~.
~
Lobster Rivulet (Swimming Pool) 2-]ul-Ol 8.4 7.23 60 1.5 <1 22 <0.01 2.8 <0.02 0.13 <0.10 <0.10 1.1 <0.05 ~Lobster Rivulet (Caveside) 2-]ul-Ol 8.1 7.56 62 2.2 <1 22 <0.01 2.8 <0.02 0.17 <0.10 <0.10 2.8 <0.05 ~
~Lobster Rivulet (Chudleigh) 2-]ul-Ol 9.0 7.57 102 4.9 <1 35 <0.01 4.8 <0.02 0.51 <0.10 <0.10 3.1 0.06 ~
Lobster Rivuler (Lobster Falls) 2-]ul-01 8.6 7.60 117 4.7 <1 40 <0.01 5.7 <0.02 0.51 <0.10 <0.10 1.9 <0.05 ~~
Caveside bore 2-]ul-O 1 12.8 7.24 345 0.3 <1 159 <0.01 6.7 0.05 2.3 <0.10 <0.10 3 <0.05 ~
Rubbish Heap Cave 12-]ul-Ol 5.1 6.98 43 0.2 <1 8 <0.01 4.8 0.05 0.12 <0.10 <0.10 2.5 0.05 ~Lynds Cave 12-]ul-01 8.2 7.89 191 0.4 <1 83 <0.01 5.2 0.09 0.33 <0.10 <0.10 3.4 0.07 ~
QMersey Hill uvala 12-]ul-O 1 6.6 7.09 132 1.4 <1 32 <0.01 7.2 0.04 2.6 <0.10 <0.10 2.2 <0.05 ~~
Mersey Hill Cave 12-]ul-O 1 10.6 7.20 268 3.1 <1 119 <0.01 6.7 0.02 1 <0.10 <0.10 0.65 0.09 ~
Mersey River (0livers Road) 12-]ul-O1 4.9 6.76 23 0.6 <1 4 <0.01 2.5 <0.02 0.04 <0.10 <0.10 2.1 0.07 ~v,
~~~
~.
~
'-l~
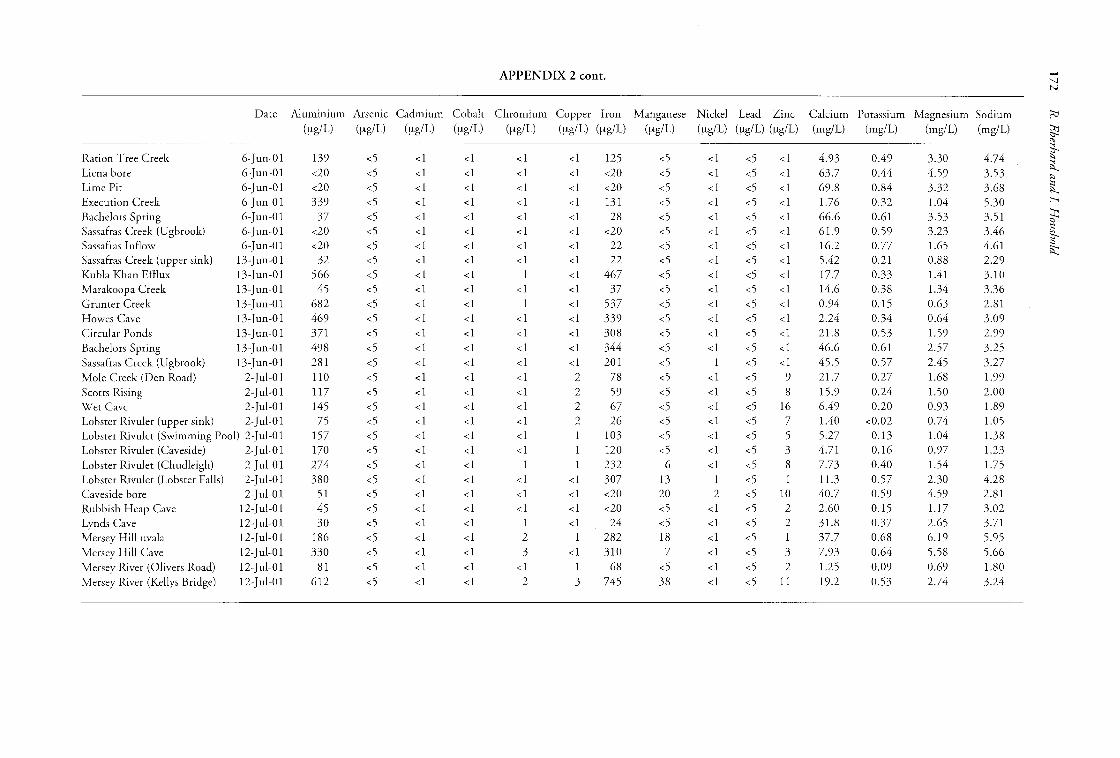
APPENDIX 2 cont.
Date Aluminium Arsenic Cadmium Cobalt Chromium Copper Iron Manganese Nickel Lead Zinc Calcium Potassium Sodium ~
(lJ,g/L) (lJ,g/L) (lJ,g/L) (lJ,g/L) (lJ,g/L) (lJ,g/L) (lJ,g/L) ~~
~Ration Tree Creek 6-]un-Ol 139 <5 <1 <1 <1 <1 125 <5 <1 <5 <1 4.93 0.49 3.30 4.74 ~
~Liena bore 6-]un-Ol <20 <5 <1 <1 <1 <1 <20 <5 <1 <5 <1 63.7 0.44 4.59 3.53 ~
Lime Pit 6-]un-Ol <20 <5 <1 <1 <1 <1 <20 <5 <1 <5 <1 69.8 0.84 3.32 3.68 ~
~
Execution Creek 6-]un-Ol 339 <5 <1 <1 <1 <1 131 <5 <1 <5 <1 1.76 0.32 1.04 5.30 ~
Bachelors Spring 6-]un-Ol 37 <5 <1 <1 <1 <1 28 <5 <1 <5 <1 66.6 0.61 3.53 3.51 ~Sassafras Creek (Ugbrook) 6-]un-Ol <20 <5 <1 <1 <1 <1 <20 <5 <1 <5 <1 61.9 0.59 3.23 3.46
~~
~
Sassafras Inflow 6-]un-Ol <20 <5 <1 <1 <1 <1 22 <5 <1 <5 <1 16.2 0.77 1.65 4.61 <:::::>
~Sassafras Creek (upper sink) 13-]un-Ol 32 <5 <1 <1 <1 <1 22 <5 <1 <5 <1 5.42 0.21 0.88 2.29Kubla Khan Efflux 13-]un-OI 566 <5 <1 <1 1 <1 467 <5 <1 <5 <1 17.7 0.33 1.41 3.10
Creek 13-]un-Ol 45 <5 <1 <1 <1 <1 37 <5 <1 <5 <1 14.6 0.38 1.34 3.36Grunter Creek 13-]un-Ol 682 <5 <1 <1 1 <1 537 <5 <1 <5 <1 0.94 0.15 0.63 2.81Howes Cave 13-]un-OI 469 <5 <1 <1 <1 <1 339 <5 <1 <5 <1 2.24 0.34 0.64 3.09Circular Ponds 13-]un-Ol 371 <5 <1 <1 <1 <1 308 <5 <1 <5 <1 21.8 0.53 1.59 2.99Bachelors Spring 13-]un-Ol 498 <5 <1 <1 <1 <1 344 <5 <1 <5 <1 46.6 0.61 2.57 3.25Sassafras Creek (Ugbrook) 13-]un-Ol 281 <5 <1 <1 <1 <1 201 <5 1 <5 <1 45.5 0.57 2.45 3.27Mole Creek (Den Road) 2-]ul-Ol 110 <5 <1 <1 <1 2 78 <5 <1 <5 9 21.7 0.27 1.68 1.99Scotts Rising 2-]ul-Ol 117 <5 <1 <1 <1 2 59 <5 <1 <5 8 15.9 0.24 1.50 2.00Wet Cave 2-]ul-Ol 145 <5 <1 <1 <1 2 67 <5 <1 <5 16 6.49 0.20 0.93 1.89Lobster Rivulet (upper sink) 2-]ul-Ol 75 <5 <1 <1 <1 2 26 <5 <1 <5 7 1.40 <0.02 0.74 1.05Lobster Rivulet (Swimming Pool) 2-]ul-O 1 157 <5 <1 <1 <1 1 103 <5 <1 <5 5 5.27 0.13 1.04 1.38Lobster Rivulet (Caveside) 2-]ul-O1 170 <5 <1 <1 <1 1 120 <5 <1 <5 3 4.71 0.16 0.97 1.23Lobster Rivulet (Chudleigh) 2-]ul-OI 274 <5 <1 <1 1 1 232 6 <1 <5 8 7.73 0.40 1.54 1.75Lobster Rivulet (Lobster Falls) 2-]ul-Ol 380 <5 <1 <1 <1 <1 307 13 1 <5 1 11.3 0.57 2.30 4.28Caveside bore 2-]ul-O1 51 <5 <1 <1 <1 <1 <20 20 2 <5 10 40.7 0.59 4.59 2.81Rubbish Heap Cave 12-]ul-Ol 45 <5 <1 <1 <1 <1 <20 <5 <1 <5 2 2.60 0.15 1.17 3.02
Cave 12-]ul-Ol 30 <5 <1 <1 1 <1 24 <5 <1 <5 2 31.8 0.37 2.65 3.71Mersey Hill uvala 12-]ul-Ol 186 <5 <1 <1 2 1 282 18 <1 <5 1 37.7 0.68 6.19 5.95Mersey Hill Cave 12-]ul-Ol 330 <5 <1 <1 3 <1 310 7 <1 <5 3 7.93 0.64 5.58 5.66
River (0livers Road) 12-]ul-Ol 81 <5 <1 <1 <1 1 68 <5 <1 <5 2 1.25 0.09 0.69 1.80River (Kellvs Bridge) 12-]ul-Ol 612 <5 <1 <1 2 3 745 38 <1 <5 11 19.2 0.53 2.74 3.24