Embed Size (px)
Citation preview
Changing Dynamics In The Indian Veg Oil Complex
With Special Reference to Palm Oil
By
Govindbhai G. Patel
Managing Partner
G. G. Patel & Nikhil Research Company
At
POTS 2012
Mumbai
On 8th
June, 2012
IMPORT PATTERN & DOMESTIC
PRODUCTION
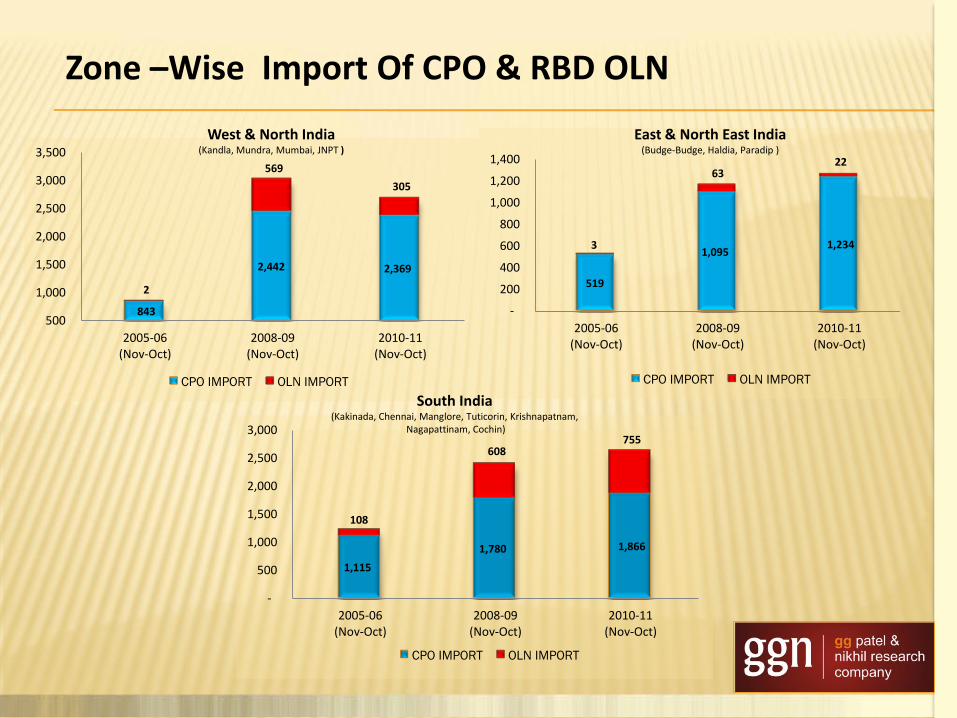
843
2,442 2,369
2
569
305
500
1,000
1,500
2,000
2,500
3,000
3,500
2005-06 (Nov-Oct)
2008-09 (Nov-Oct)
2010-11 (Nov-Oct)
CPO IMPORT OLN IMPORT
West & North India (Kandla, Mundra, Mumbai, JNPT )
519
1,095 1,234 3
63 22
-
200
400
600
800
1,000
1,200
1,400
2005-06 (Nov-Oct)
2008-09 (Nov-Oct)
2010-11 (Nov-Oct)
CPO IMPORT OLN IMPORT
East & North East India (Budge-Budge, Haldia, Paradip )
1,115
1,780 1,866
108
608 755
-
500
1,000
1,500
2,000
2,500
3,000
2005-06 (Nov-Oct)
2008-09 (Nov-Oct)
2010-11 (Nov-Oct)
CPO IMPORT OLN IMPORT
South India (Kakinada, Chennai, Manglore, Tuticorin, Krishnapatnam,
Nagapattinam, Cochin)
Zone –Wise Import Of CPO & RBD OLN
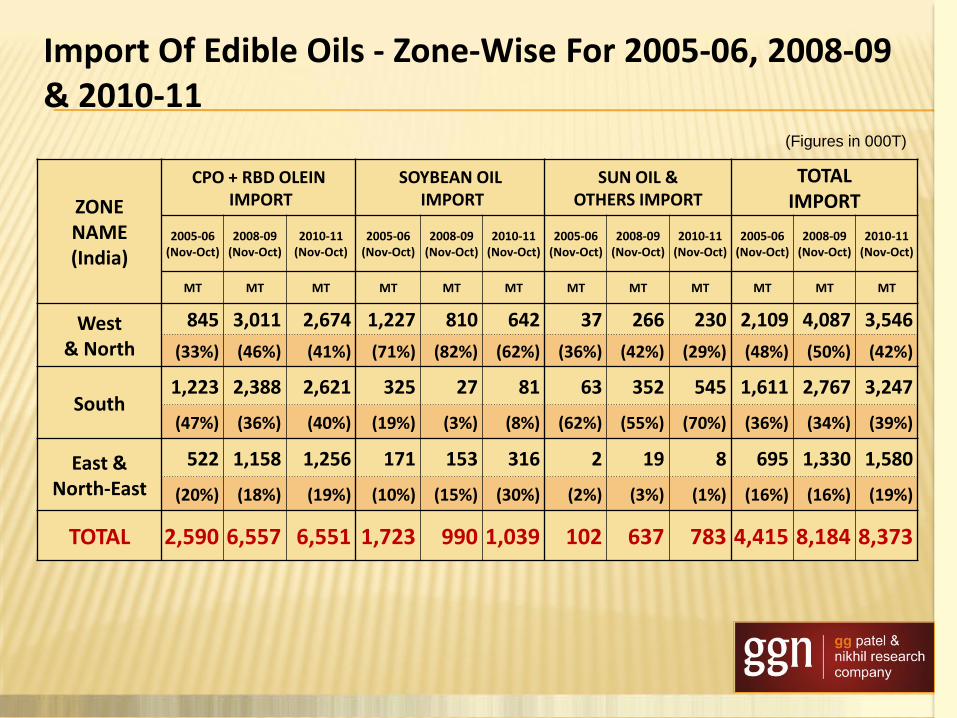
ZONE NAME (India)
CPO + RBD OLEIN IMPORT
SOYBEAN OIL IMPORT
SUN OIL & OTHERS IMPORT
TOTAL IMPORT
2005-06 (Nov-Oct)
2008-09 (Nov-Oct)
2010-11 (Nov-Oct)
2005-06 (Nov-Oct)
2008-09 (Nov-Oct)
2010-11 (Nov-Oct)
2005-06 (Nov-Oct)
2008-09 (Nov-Oct)
2010-11 (Nov-Oct)
2005-06 (Nov-Oct)
2008-09 (Nov-Oct)
2010-11 (Nov-Oct)
MT MT MT MT MT MT MT MT MT MT MT MT
West & North
845 3,011 2,674 1,227 810 642 37 266 230 2,109 4,087 3,546
(33%) (46%) (41%) (71%) (82%) (62%) (36%) (42%) (29%) (48%) (50%) (42%)
South 1,223 2,388 2,621 325 27 81 63 352 545 1,611 2,767 3,247
(47%) (36%) (40%) (19%) (3%) (8%) (62%) (55%) (70%) (36%) (34%) (39%)
East & North-East
522 1,158 1,256 171 153 316 2 19 8 695 1,330 1,580
(20%) (18%) (19%) (10%) (15%) (30%) (2%) (3%) (1%) (16%) (16%) (19%)
TOTAL 2,590 6,557 6,551 1,723 990 1,039 102 637 783 4,415 8,184 8,373
(Figures in 000T)
Import Of Edible Oils - Zone-Wise For 2005-06, 2008-09 & 2010-11
-
500
1,000
1,500
2,000
2,500
3,000
3,500
2005-06 (Nov-Oct)
2006-07 (Nov-Oct)
2007-08 (Nov-Oct)
2008-09 (Nov-Oct)
2009-10 (Nov-Oct)
2010-11 (Nov-Oct)
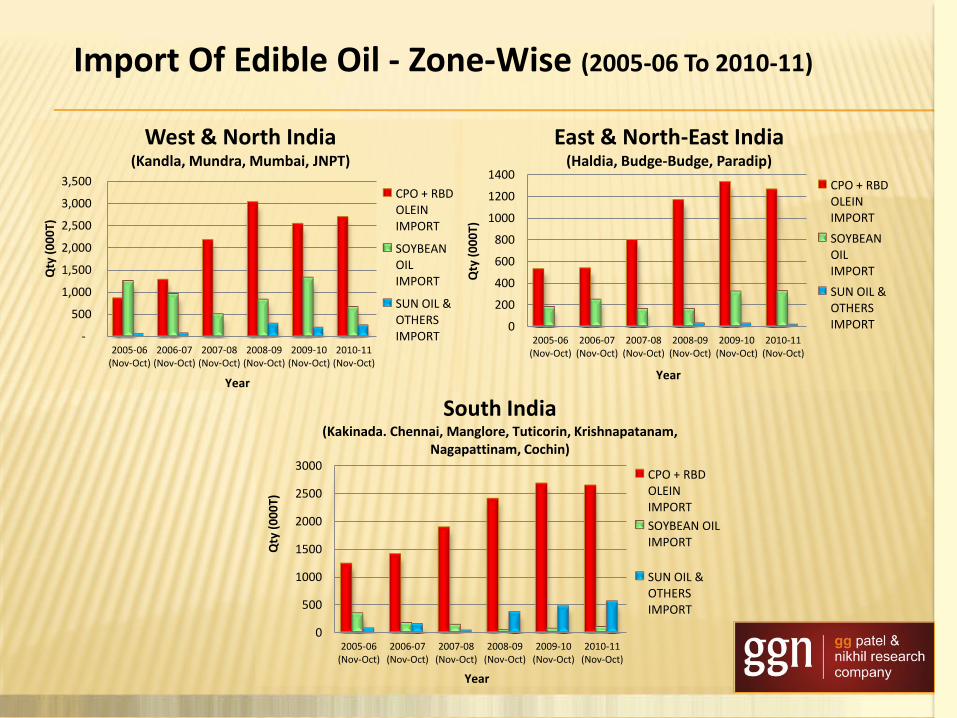
West & North India (Kandla, Mundra, Mumbai, JNPT)
CPO + RBD OLEIN IMPORT
SOYBEAN OIL IMPORT
SUN OIL & OTHERS IMPORT
Qty
(0
00
T)
Year
0
200
400
600
800
1000
1200
1400
2005-06 (Nov-Oct)
2006-07 (Nov-Oct)
2007-08 (Nov-Oct)
2008-09 (Nov-Oct)
2009-10 (Nov-Oct)
2010-11 (Nov-Oct)
East & North-East India (Haldia, Budge-Budge, Paradip)
CPO + RBD OLEIN IMPORT
SOYBEAN OIL IMPORT
SUN OIL & OTHERS IMPORT
Qty
(0
00
T)
Year
0
500
1000
1500
2000
2500
3000
2005-06 (Nov-Oct)
2006-07 (Nov-Oct)
2007-08 (Nov-Oct)
2008-09 (Nov-Oct)
2009-10 (Nov-Oct)
2010-11 (Nov-Oct)
South India (Kakinada. Chennai, Manglore, Tuticorin, Krishnapatanam,
Nagapattinam, Cochin)
CPO + RBD OLEIN IMPORT
SOYBEAN OIL IMPORT
SUN OIL & OTHERS IMPORT
Year
Qty
(0
00
T)
Import Of Edible Oil - Zone-Wise (2005-06 To 2010-11)
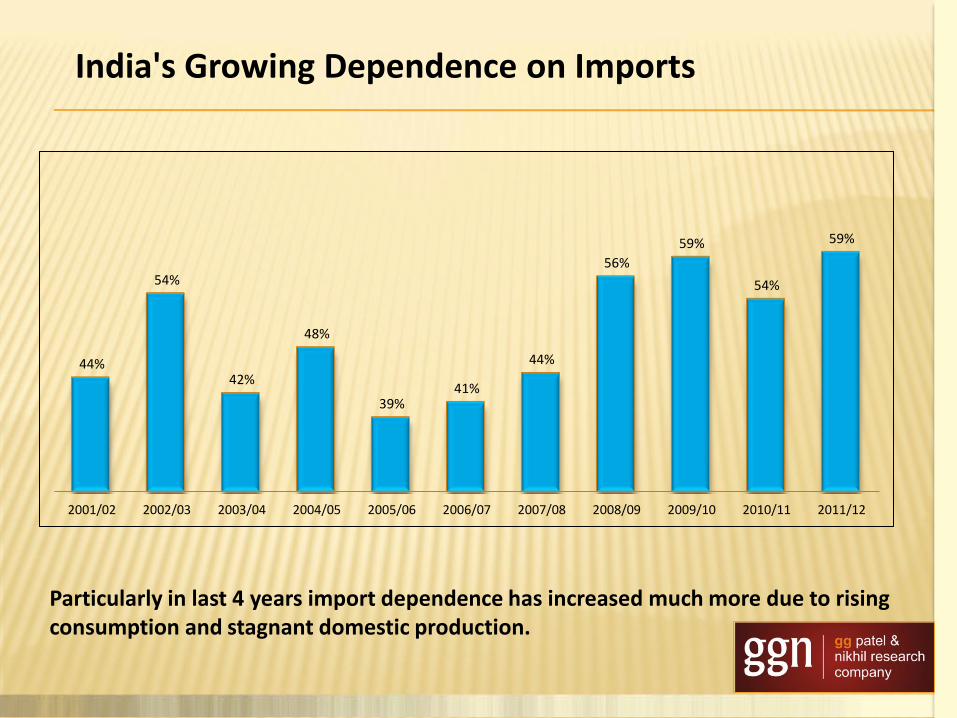
44%
54%
42%
48%
39% 41%
44%
56%
59%
54%
59%
2001/02 2002/03 2003/04 2004/05 2005/06 2006/07 2007/08 2008/09 2009/10 2010/11 2011/12
Particularly in last 4 years import dependence has increased much more due to rising consumption and stagnant domestic production.
India's Growing Dependence on Imports

5.64 4.32
6.07 5.54 6.90 6.80 7.00 6.34 6.20
7.25 6.65
4.42 5.12
4.40 5.04 4.42 4.71
5.61
8.18 8.82
8.37 9.70
2001/02 2002/03 2003/04 2004/05 2005/06 2006/07 2007/08 2008/09 2009/10 2010/11 2011/12
Domestic Production
Import
Figures in Mln.Tn
Stagnant Domestic oil production is leading to higher imports YOY to feed the growing Indian demand.
Import & Domestic Production
*
* Estimate
59%
41%
54%
46%
59%
41% 44%
56%
44%
56%
41%
59% 61%
39% 48%
52%
42%
58%
54%
46%
44%
56%
CONSUMPTION
Palm is the main oil in, Out of Home consumption like HORECA, chips - savory manufacturers etc.
The Lower and middle class Indian consumers are very price sensitive and switch to cheaper oils.
Palm being the cheapest edible oil lower by Rs 50-100 per 10 kgs or $100-200 per tonne from other edible oils is used in blending with other oils.
It is consumed the most by lower class & lower middle class of Indian society.
A big proportion of Palm oil imported in India is due to a cheaper substitution of other oils and to fill the gap of other oils.
Though lower usage in house hold consumption by middle class, but some have started consuming Palm oil.
Consumption And Characteristics of Indian Consumer In Reference to Palm Oil
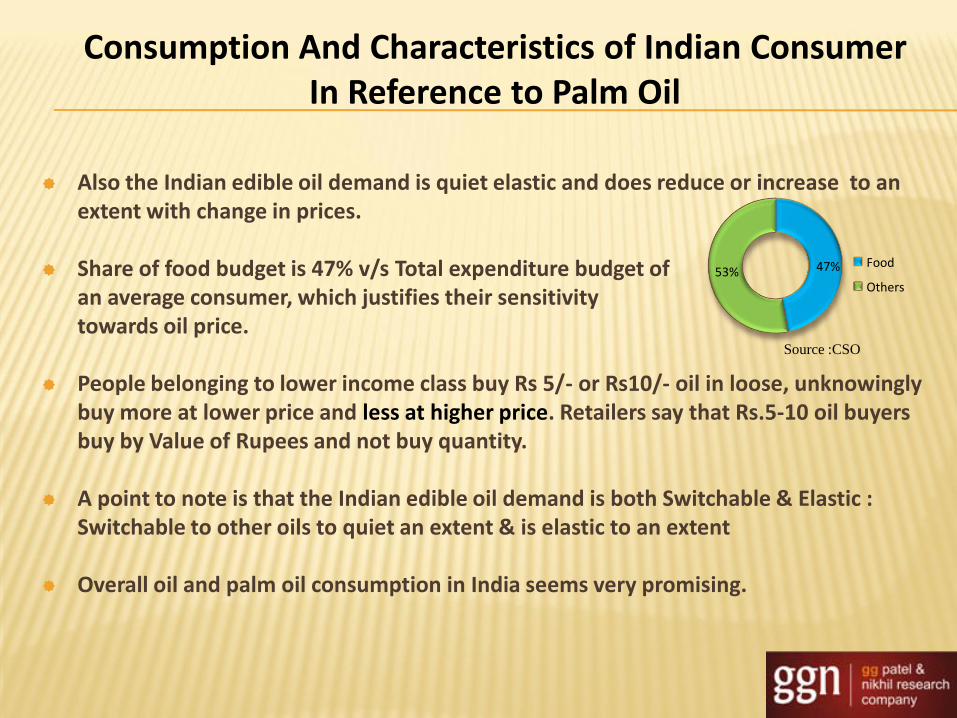
Also the Indian edible oil demand is quiet elastic and does reduce or increase to an extent with change in prices.
Share of food budget is 47% v/s Total expenditure budget of an average consumer, which justifies their sensitivity towards oil price.
People belonging to lower income class buy Rs 5/- or Rs10/- oil in loose, unknowingly
buy more at lower price and less at higher price. Retailers say that Rs.5-10 oil buyers buy by Value of Rupees and not buy quantity.
A point to note is that the Indian edible oil demand is both Switchable & Elastic : Switchable to other oils to quiet an extent & is elastic to an extent
Overall oil and palm oil consumption in India seems very promising.
47% 53% Food
Others
Source :CSO
Consumption And Characteristics of Indian Consumer In Reference to Palm Oil
Demand drives in India
Consistent GDP growth rate at or above 8 % in last 5 years (But current year it may be
below 7%).
The big emerging Indian middle class.
The double digit growth of out of home consumption of edible oils.
Per capita consumption of Edible oils in India at 13.15 kg (2011-12) which is still a lot
below threshold level of consumption.
Even with a moderate population growth the absolute increase in number of people is
quiet High.
India has a Promising Demand Growth
Schemes like NREGA and rising labor income is increasing the income level of people who are consuming much below the all India level.
Rising Urban population.
Supply of edible oils by the Government at subsidized rates under PDS which is mainly palm oil.
Duty Free-Regime: Zero percent duty on imports has facilitated lower oil price to consumers and in turn push demand.
India has a Promising Demand Growth
Current Consumption Regionally
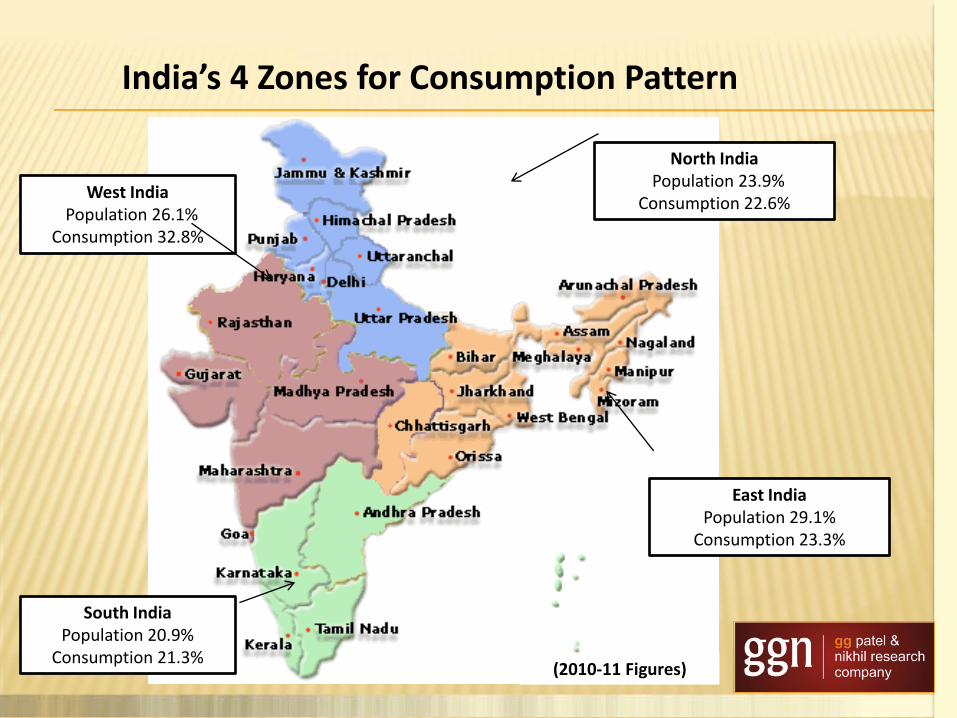
North India Population 23.9%
Consumption 22.6%
East India Population 29.1%
Consumption 23.3%
South India Population 20.9%
Consumption 21.3%
West India Population 26.1%
Consumption 32.8%
(2010-11 Figures)
India’s 4 Zones for Consumption Pattern

Per Capita
Andhra Pradesh 13.2
Assam 10.5
Bihar 10.4
Chhattisgarh 10.2
Delhi 17.5
Gujarat 22.6
Haryana 9.4
Jharkhand 12.4
Karnataka 13.0
Kerela 10.2
Madhya Pradesh 10.4
Maharastra 18.6
Orrisa 7.6
Pun jab, J&K 14.5
Rajasthan 12.0
Tamilnadu 12.5
Uttar Pradesh 10.5
West Bengal 14.1
Other states & Union territories 12.4
All India 12.8
• Big Variation in Consumption in different Regions/States. • Gujarat/Maharashtra i.e. in West has 18-23 kg per capita consumption.
Whereas • Orissa/Bihar i.e. in East has 7-10 kg per capita consumption. • Overall edible oil is 12.8kgs & incl. Non Edible is 14.3 Kgs. (2010-11).
State Wise PER Capita Consumption (2010-11)
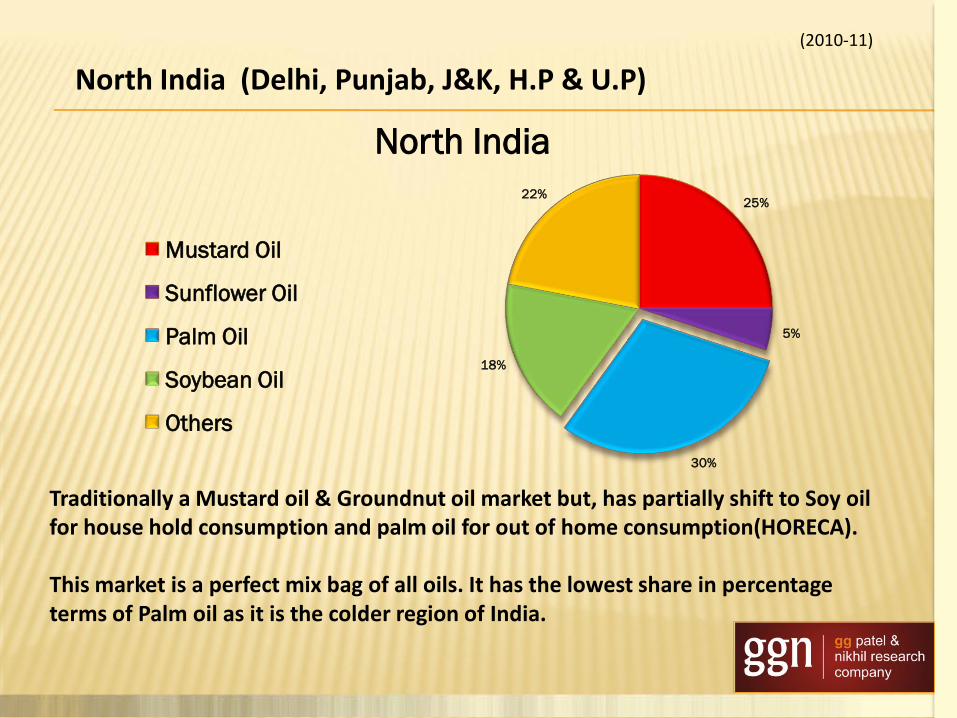
(2010-11)
North India (Delhi, Punjab, J&K, H.P & U.P)
Traditionally a Mustard oil & Groundnut oil market but, has partially shift to Soy oil for house hold consumption and palm oil for out of home consumption(HORECA). This market is a perfect mix bag of all oils. It has the lowest share in percentage terms of Palm oil as it is the colder region of India.
25%
5%
30%
18%
22%
North India
Mustard Oil
Sunflower Oil
Palm Oil
Soybean Oil
Others
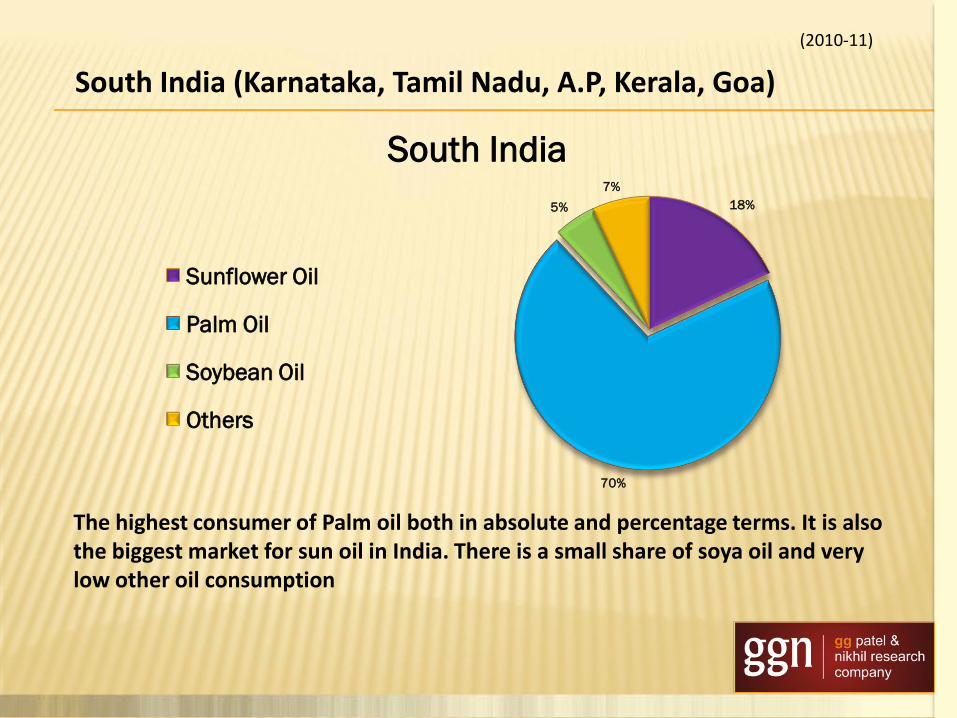
(2010-11)
South India (Karnataka, Tamil Nadu, A.P, Kerala, Goa)
18%
70%
5%
7%
South India
Sunflower Oil
Palm Oil
Soybean Oil
Others
The highest consumer of Palm oil both in absolute and percentage terms. It is also the biggest market for sun oil in India. There is a small share of soya oil and very low other oil consumption

(2010-11)
West India (Gujarat, Maharashtra, Rajasthan & M.P)
7%
6%
37%
25%
25%
West India
Mustard Oil
Sunflower Oil
Palm Oil
Soybean Oil
Others
This is the most prosperous region of India having the highest per capita consumption of edible oil. Acceptability of Palm oil has improved and it has nearly 35% share. But even with 35% share this region is the second highest consumer of Palm oil on account of high per capita consumption. This is the highest Soy oil consuming region as the major domestic Soybean crop is grown and there is a good house hold demand of this oil. The Mustard oil consumption is 9% which is majorly in Rajasthan.

(2010-11)
East India (West Bengal, Orissa, Bihar, Assam, C.G., Jharkhand)
29%
40%
6%
25%
East India
Mustard Oil
Palm Oil
Soybean Oil
Others
This is the lowest per capita consuming region due to lower income levels. This has 40 % share of Palm Oil, but this is the second region after south where broadly the whole of the region has accepted Palm oil in the house hold. This is the biggest market of Mustard oil(29% share).

Sales of above Brands are approx. 135,000 / 165,000 MT per month
Major brands of RBD Palmolein
Ruchi Gold Malaya Gold Pallan
Palm King Jhoola Bavarchi
Ruchi Star Payal Shree Hari
Jubilee First Class Vijya
Rag Gold Gemini Palmolien
Anchor Shakti Kalaiman
Himani Mayur Gokul
Emami Health Alpha Scooter
Robini Palm Jyoti Gold Mahor
Tamilnadu Arasn Gold Drop Vibhor
Future Consumption Pattern

10.1 9.6
10.3 10.9 11.4 11.8
12.4
14.1 14.8
15.7 16.3
17.3
18.4 19.5
20.7
5
8
11
14
17
20
Consumption Of Edible Oils In India (in ml T)
Demand Scenario of Next 5 Years Due to high growth in income levels, increasing trend in spending & better living standards;
India promises to continue high growth in consumption of edible oils and Indian consumption may reach 21 ml T by 2015/16.

Current V/s Forecasted share of Different Oils in Consumption
3%
17%
14%
6%
7%
43%
10%
GN SBO RAPE SUN CSO PALM OTHER
1% 18%
12%
7%
6%
46%
10%
2015-16
GN SBO RAPE SUN CSO PALM OTHER
21 mil. tonnes 15.7 mil. tonnes
* Composition of import will depend on price difference between different oils.
2010-11
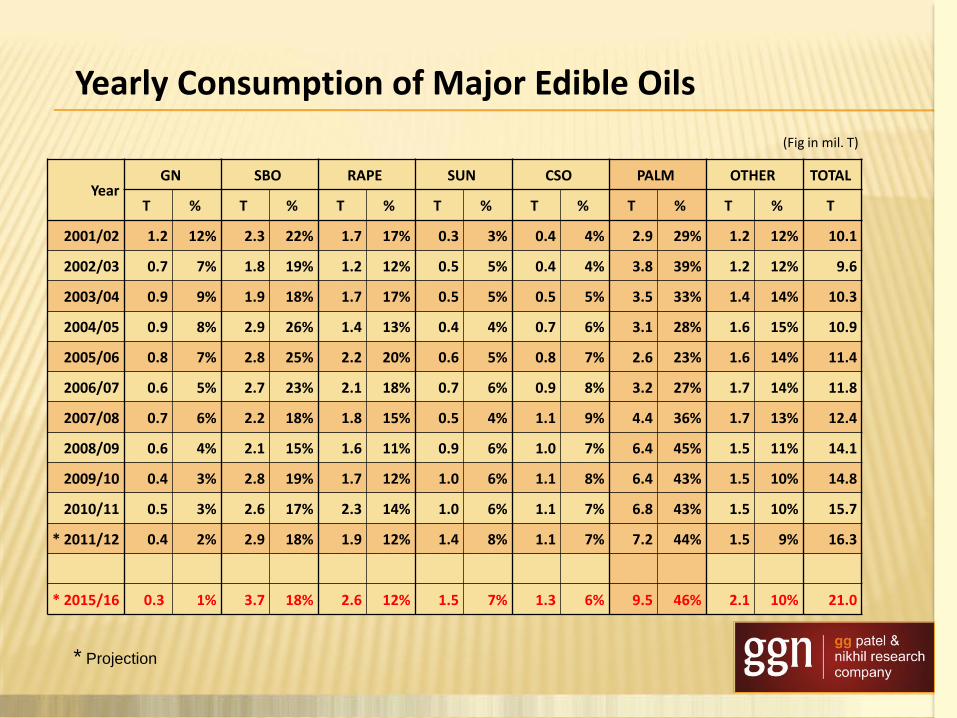
(Fig in mil. T)
* Projection
Year GN SBO RAPE SUN CSO PALM OTHER TOTAL
T % T % T % T % T % T % T % T
2001/02 1.2 12% 2.3 22% 1.7 17% 0.3 3% 0.4 4% 2.9 29% 1.2 12% 10.1
2002/03 0.7 7% 1.8 19% 1.2 12% 0.5 5% 0.4 4% 3.8 39% 1.2 12% 9.6
2003/04 0.9 9% 1.9 18% 1.7 17% 0.5 5% 0.5 5% 3.5 33% 1.4 14% 10.3
2004/05 0.9 8% 2.9 26% 1.4 13% 0.4 4% 0.7 6% 3.1 28% 1.6 15% 10.9
2005/06 0.8 7% 2.8 25% 2.2 20% 0.6 5% 0.8 7% 2.6 23% 1.6 14% 11.4
2006/07 0.6 5% 2.7 23% 2.1 18% 0.7 6% 0.9 8% 3.2 27% 1.7 14% 11.8
2007/08 0.7 6% 2.2 18% 1.8 15% 0.5 4% 1.1 9% 4.4 36% 1.7 13% 12.4
2008/09 0.6 4% 2.1 15% 1.6 11% 0.9 6% 1.0 7% 6.4 45% 1.5 11% 14.1
2009/10 0.4 3% 2.8 19% 1.7 12% 1.0 6% 1.1 8% 6.4 43% 1.5 10% 14.8
2010/11 0.5 3% 2.6 17% 2.3 14% 1.0 6% 1.1 7% 6.8 43% 1.5 10% 15.7
* 2011/12 0.4 2% 2.9 18% 1.9 12% 1.4 8% 1.1 7% 7.2 44% 1.5 9% 16.3
* 2015/16 0.3 1% 3.7 18% 2.6 12% 1.5 7% 1.3 6% 9.5 46% 2.1 10% 21.0
Yearly Consumption of Major Edible Oils
Out Of Home Consumption

Hotel Restaurants
Catering
Palm :- KING Of Horeca

The out of Home consumption covers users like – Manufacturers of Chips, Snacks, Biscuits, Restaurants, Hawkers, Bakeries & non edible uses like Paints, Hair oil etc.
The annual consumption of edible oils in OHC was 4.5 mln mt in 2009/10
Out of Home Consumption
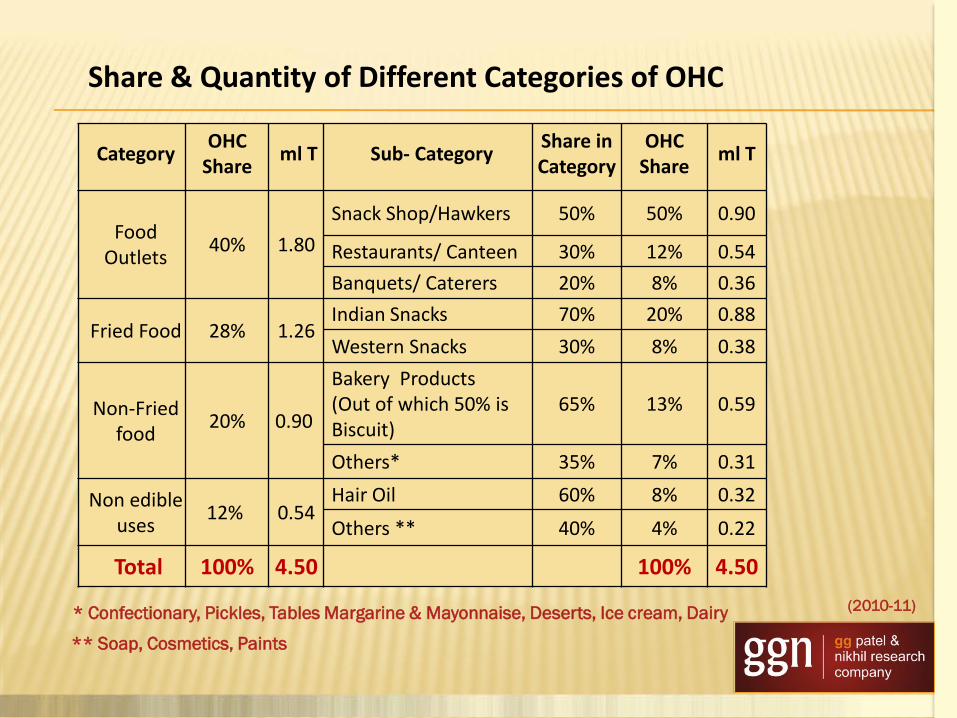
Category OHC
Share ml T Sub- Category
Share in Category
OHC Share
ml T
Food Outlets
40% 1.80
Snack Shop/Hawkers 50% 50% 0.90
Restaurants/ Canteen 30% 12% 0.54
Banquets/ Caterers 20% 8% 0.36
Fried Food 28% 1.26 Indian Snacks 70% 20% 0.88
Western Snacks 30% 8% 0.38
Non-Fried food
20% 0.90
Bakery Products (Out of which 50% is Biscuit)
65% 13% 0.59
Others* 35% 7% 0.31
Non edible uses
12% 0.54 Hair Oil 60% 8% 0.32
Others ** 40% 4% 0.22
Total 100% 4.50 100% 4.50
* Confectionary, Pickles, Tables Margarine & Mayonnaise, Deserts, Ice cream, Dairy (2010-11)
** Soap, Cosmetics, Paints
Share & Quantity of Different Categories of OHC
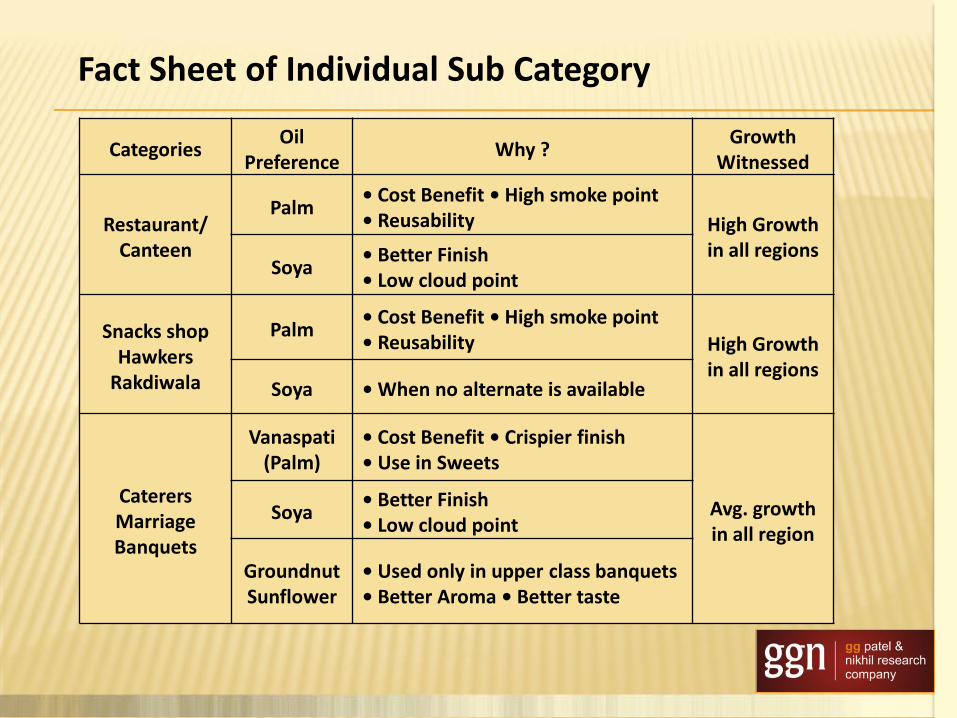
Categories Oil
Preference Why ?
Growth Witnessed
Restaurant/ Canteen
Palm • Cost Benefit • High smoke point • Reusability High Growth
in all regions Soya
• Better Finish • Low cloud point
Snacks shop Hawkers
Rakdiwala
Palm • Cost Benefit • High smoke point • Reusability High Growth
in all regions Soya • When no alternate is available
Caterers Marriage Banquets
Vanaspati (Palm)
• Cost Benefit • Crispier finish • Use in Sweets
Avg. growth in all region
Soya • Better Finish • Low cloud point
Groundnut Sunflower
• Used only in upper class banquets • Better Aroma • Better taste
Fact Sheet of Individual Sub Category

House Hold Consumption
of Oils

House Hold Consumption in India is about 70% and in absolute terms 10 to 11 ml T.
Indian household earlier preferred domestic oils like Groundnut, Rapeseed & Cotton but are now shifting to Palm, Soya & Sun.
But acceptability of Palm in household is drastically different in diff. regions of India.
House Hold Consumption

Palm has a major share in this area in house hold.
The South Indians already had acceptability for Coconut and smoothly shifted to its lower priced cousin Palm.
South India

Palm usage in house hold is extremely low in this region.
The North Indians still prefer the domestic oils and Soya. Palm usage is very limited in house hold to Vanaspati (Hydrogenated Oils). In manufacturing of Vanaspati about 80% Palm oil & its by products are used.
North India
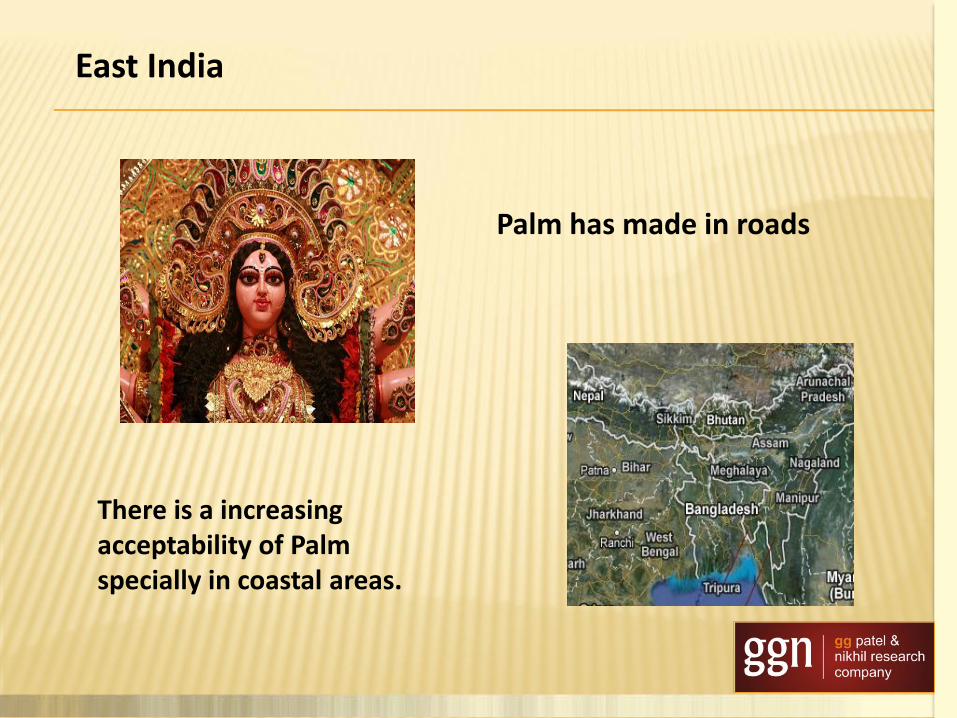
Palm has made in roads
There is a increasing acceptability of Palm specially in coastal areas.
East India
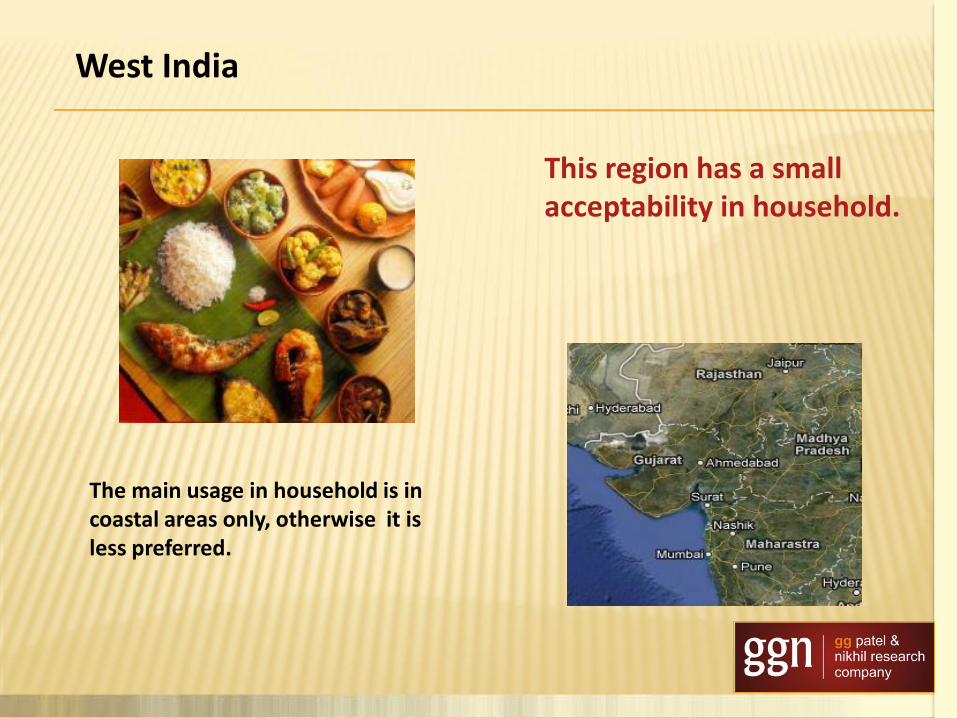
This region has a small acceptability in household.
The main usage in household is in coastal areas only, otherwise it is less preferred.
West India

PRESENT STATUS OF
PALM OIL REFINING/FRACTIONATION
INDUSTRY

Zone Import Ports States Catered
West & North Zone
Kandla, Mundra, Mumbai, JNPT
Gujarat, Maharashtra, M.P., Punjab, Delhi, Haryana, J&K,
Himachal Pradesh, U.P.,
South Zone Kakinada, Chennai, Manglore,
Tuticorin, Krishnapatanam, Nagapattinam, Cochin
Karnataka, Tamil Nadu, Andhra Pradesh, Kerala, Goa
East & North-East
Zone Haldia, Budge-Budge, Paradip
West Bengal, Bihar, Orissa, Assam, Chhatisgarh, Jarkhand,
U.P.
Zones – Import Ports – State Catered

Zone Name
(India)
CPO
Import
2010-11
(Nov-Oct)
Aprx use in
Vanaspati,
Margarine,
Bakery
Shortening
etc.
(Without
Fractionation)
Avlble for
Fractionation
Fractionation
capacity/day
(At Ports &
Inland)
Annual
installed
Fractionation
capacity on
300 working
days
Approx % of
Fractionation
capacity
utilisation
ml T ml T ml T MT/day ml T %
West & North 2.37 0.90 1.47 12,500 3.75 39.2%
43.3% 69.2% 35.3% 34.2% 34.2%
South 1.87 0.27 1.60 11,950 3.58 44.7%
34.2% 20.8% 38.4% 32.7% 32.7%
East & North-
East
1.23 0.13 1.10 12,100 3.63 30.3%
22.5% 10.0% 26.4% 33.1% 33.1%
TOTAL 5.47 1.30 4.17 36,550 10.96 38.0%
100.0% 100.0% 100.0% 100.0% 100.0%
Estimate of Fractionation Capacity Utilisation

Out of the total usage of edible oils (2010-11) largest consumption is of Palm oil
1. Out of Home consumption of Palm Oil is More in comparison of other Oils.
2. Average Import of edible grade Palm oil in current year may 6,00,000/month.
Out of which :
CPO usage may be as under (Approximate):
Present Status of Palm Oil Market in India
Palm Soybean Mustard Cottonseed Sunflower GN Others
42.9% 16.5% 14.5% 7.0% 6.5% 3.1% 9.5%
RBD Oln CPO Total
1,50,000 4,50,000 6,00,000
MT/month
Vanaspati, Margarine, Shortening etc. 40,000
Biscuit, Frying, Vanaspati & other food industry (RBD PO) 60,000
Fractionation Use 3,50,000
Total 4,50,000
Problems of Fractionation & Refining Industry
1. Conversion Cost is more in comparison with cost of manufacturers situated in Malaysia,
Indonesia, US, Argentina, Brazil, Europe etc. due to lower scale of capacities of each factory and also due to lower capacity utilisation.
2. Due to recent change in Indonesia’s export duty structure, which favours more export of RBD Palmolein and less export of CPO, the Palm Oil Refining Industry is very much affected. Malaysian Industry is also equally affected.
3. Presently export duty from Indonesia, on CPO is $ 214/T (19.50% on base Price of $ 1,098) and export duty on RBD Palmolein in Bulk is $ 111/T (10% on base price of $ 1,113). Hence duty difference between CPO & OLN is $ 103/T. Even considering conversion cost of $ 30/T, realisation to Indonesian Exporter is more by $ 73/T which enables Indonesian exporter to sell OLN at much cheaper rate. Export duty on RBD OLN in packed form is much less @ 4% only.
4. Import duty on RBD Palmolein in India is 7.73% on fixed Tariff Value of $ 484/T which amounts to $ 37/T and hence effective duty is 3.60% only on present market price. This makes the Indian manufacturer at a very much disadvantage and cannot compete with cheaper import of RBD OLN from Indonesia.
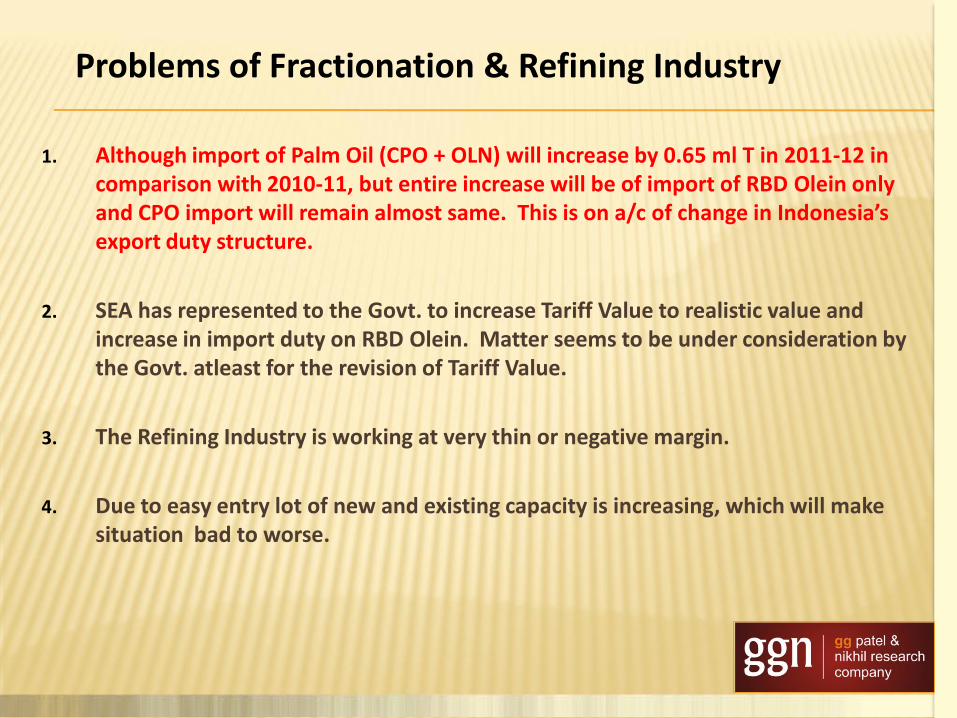
1. Although import of Palm Oil (CPO + OLN) will increase by 0.65 ml T in 2011-12 in
comparison with 2010-11, but entire increase will be of import of RBD Olein only and CPO import will remain almost same. This is on a/c of change in Indonesia’s export duty structure.
2. SEA has represented to the Govt. to increase Tariff Value to realistic value and increase in import duty on RBD Olein. Matter seems to be under consideration by the Govt. atleast for the revision of Tariff Value.
3. The Refining Industry is working at very thin or negative margin.
4. Due to easy entry lot of new and existing capacity is increasing, which will make situation bad to worse.
Problems of Fractionation & Refining Industry

1. Govt. Has identified 1 ml Ha. for Oil Palm but till now Palm is grown only on 0.11 ml Ha. only.
2. Present production of Palm Oil in India is only about 70,000T/year.
3. Govt. should declare Oil Palm as Plantation Crop so that Corporates can own land and grow Oil Palm.
4. I will urge the Malaysian Plantations to enter into Palm Oil production in India and also provide technology and better seed.
Indian Production of Palm Oil

1. Share in House Hold consumption is very low.
2. As Palm oil solidifies, people feel there is something wrong in it.
3. There is perception in upper middle & upper class people that Palm oil is not a good oil.
4. Palm oil is still considered a poor man’s oil.
Drawbacks Of Palm Oil

1. Marketing of the Brand Palm needs to be done. 2. Propagating usage of higher quality oil – Like
Super Olein and high IV oil.
3. To make consumer aware that Palm oil contains low Trans-fatty Acid in comparison with Soybean oil.
4. Low cloud oil should be marketed.
5. More quantity should be marketed in consumer packs, so that it increases house-hold consumption.
What can be done
• Founders – Govindbhai Patel & Nirav Desai Formed in 2008-09.
• Country’s only reliable research company on agro commodities.
• Provides NON BIASED & GRASS ROOT-STATISTICS & INFORMATION.
• Report Frequency – DAILY , WEEKLY & MONTHLY.
• Proprietary services for exclusivity of data.
(include surveys on crops, consumer behavior, consumption pattern, market trends, etc.)
GGN Research

Thank You


![PySession4 - it.uu.se filePySession4 February 5, 2019 In [1]: import pandas as pd import numpy as np import matplotlib.pyplot as plt import sklearn.preprocessing as skl_pre import](https://img.pdfslide.us/doc/110x75/5cb2863a88c993f5708be449/pysession4-ituuse-february-5-2019-in-1-import-pandas-as-pd-import-numpy.jpg)
![Welcome [] · Zülküf Küçüközer TriangleCanvas.java import javax.microedition.lcdui.Graphics; import javax.microedition.lcdui.game.*; import javax.microedition.m3g.*;](https://img.pdfslide.us/doc/110x75/5d31f91d88c9937a3b8ccf67/welcome-zuelkuef-kuecuekoezer-trianglecanvasjava-import-javaxmicroeditionlcduigraphics.jpg)