Embed Size (px)
Citation preview

Presentation on
Trade Statistics of
Pakistan By
MR. SHAUKAT ZAMANDIRECTOR
Pakistan Bureau of StatisticsGovernment of Pakistan
Web Site:www.pbs.gov.pkE-mail: [email protected]
1

INTRODUCTION
No country in today’s world can afford to remain inisolation. Countries have to import commodities fromabroad which are either not produced in the country orare in short supply and also those which accrue someother benefits from their imports, commodities which arein surplus in the country are exported. Even if there areno surpluses, exports have to be made to pay off for theimports, which are essential for economic developmentof the country. Owing to competition, a country canobtain optimum advantage from its buying and selling inthe world only through having adequate knowledge oftrade data. Foreign Trade Statistics are alsoindispensable for planning of economic development,forming commercial policies, conducting tradenegotiations, making bilateral, regional and internationalarrangements for promotion of trade.
2

Foreign Trade Statistics of Pakistan is being compiled regularly since 1947.Initially from 1947 to 1950 the ‘Department of Commercial Intelligence andStatistics’ of the Ministry of Commerce undertook the work of recording thetrade statistics. The work of trade statistics compilation was taken over byPakistan Bureau of Statistics (then Central Statistics Office) in September,1950. In the beginning it continued to compile few series on trade statisticsmanually on the basis of weekly/monthly returns of imports and exportssupplied by the land, sea and air customs. With the passage of time,improvements in the system of recording of trade statistics have been madegradually. A scheme for codification of trade information was introduced inearly, 1952 and trade data were processed on the ‘Bureau of Britishtabulation unit’ and later strengthened on new IBM system in 1954, Itfurther developed by installation of IBM Computer 360-30 by establishinga ‘Data Processing Centre’ in PBS in the 1969 and trade statistics wasprocessed from July, 1970. The trade statistics is now being processed onCompaq Alpha Server DS20E System by ‘Data Processing Centre’ to meetthe growing requirements of different users of trade statistics.
I- HISTORICAL BACKGROUND:
3

II- METHODOLOGY
Pakistan is using methodology/guidelines contained in the U.N.Statistics
Division (UNSD) manual for compilation of “International Merchandise Trade
Statistics, concepts and definitions in ESCAP region”. Changes made by the
UNSD have been taken into consideration from time to time and amendments
are made in the compilation of Pakistan Merchandise Trade Statistics,
accordingly hence, PBS figures are recorded at the time of movement of goods
into or from Pakistan’s Custom boundary.
4

Basic source of information:
Bills of entry in case of imports and shipping bills in case of exports, which
have been modified/revised and named as “Goods Declaration” (GD) were
the basic documents used in compilation of Merchandise Trade Statistics.
The importers/exporters or their agents have to submit to the customs
authorities ‘Goods Declaration’ (GD) for each consignment of imports or
exports made by them along with copies of invoices for necessary
clearance. One copy each of these documents were being collected by the
staff of PBS from each and every sea, air and land custom stations/points in
the country but after the atomization of trade data by the Federal Board of
Revenue (PRAL and WEBOC System), P.B.S. has made arrangements
with PRAL in order to obtain the soft copy of import/export data from their
system on monthly basis on the following format.
III- COVERAGE
5

S.NO CUSTOMS SATTION
G.D. NO DATE COMMODITY DESCRIPTION
PCT
CODE
UNIT
OF
QTY
QUANTITY ASSESSED VALUE
IN ACTUAL
PK. RS. ON
C.I.F. BASIS FOR
IMPORTS AND
F.O.B. FOR
EXPORTS
COUNTRY
NAME/
CODE
BASIS OF VALUATION:
IMPORTS Imports are compiled on the basis of cost, insurance and
freight (C.I.F) and import duty not included.
EXPORTS: Exports are compiled on the basis of free on board (F.O.B)
and freight & insurance not included.
6

The difference between the value of
commodities exported and imported is known
as the Balance of Trade. If exports exceed
imports, the balance of Trade is said to be
favourable, and if imports exceed exports the
balance of trade will be un-favourable.
BALANCE OF TRADE
7

Export Imports and Balance of Trade from 2011-2017
EXPORTS IMPORTS BALANCE OF TRADE
Dollars in billion Dollars in billion Dollars in billion
JULY-JUNE, 2011-2012 23.6 44.9 -21.3
JULY-JUNE, 2012-2013 24.5 44.9 -20.4
JULY-JUNE, 2013-2014 25.1 45.1 -20.0
JULY-JUNE, 2014-2015 23.7 45.8 -22.1
JULY-JUNE, 2015-2016 20.8 44.7 -23.9
JULY-JUNE, 2016-2017 * 20.4 53.0 -32.6
*Provisional

IV- PROVISIONAL MONTHLY ADVANCE RELEASE
ON FOREIGN TRADE STATISTICS
After getting the total figures of Import & Export for eachmonth from F.B.R, Summary on Merchandise Trade comprisingof Imports, Exports and Balance of Trade is prepared andreleased up to 10th of each month . Monthly Advance Releaseon Merchandise Trade Statistics is issued up to 20th of eachmonth based on Provisional data of major items of Imports (46items) and Exports (46 items) along with the data for theprevious and corresponding months, cumulative since July andbrief analysis of the trade performance is being prepared for thegovernment functionaries and other agencies and further at theend of month final reports are issued as and when the coverage,checking and editing of the data is completed . The formats ofsummary totals and Advance Press Release on Merchandisetrade statistics are as follows:
9

V- COMPILATION CRITERIA
After getting the secondary data from F.B.R
systems, statistical validity of each record is
being checked by applying various computer
edit checks. In case of any discrepancy found in
the data, then the F.B.R is consulted for its
clarification/rectification.
10

VI-Harmonized Commodity Description & Coding System of Trade Data
From July, 1989 to June, 2002, ‘Pakistan Standard Trade Classification
Revision-3 (PSTC-R-3)’ were being used for the compilation and
dissemination of Merchandise Trade Statistics. In pursuance of the
recommendation of United Nation Statistics Division (UNSD) for
adoption of “Harmonized Commodity Description and Coding System”
(HS) for compilation and dissemination of external trade statistics of
Pakistan, the P.B.S started compilation of trade statistics through customs
records on “Harmonized System” (HS) from July,2002.
11

a) HS CODING SYSTEM
� HS Code at 2-digit level i.e. 01-99 represents “Chapters”.
Example:
Chapter 08 ‘Edible fruits & Nuts; (Peels of Citrus fruits and melons)
� HS Code at 4-digit level represents “Heading Numbers”.
Example:
0804 – Dates, figs, pineapples & guavas. (Mangoes & mangoes teens fresh or dried)
� HS Code at 6-digit level represents “Sub-Heading Numbers” at international level.
Example:
0804.10 - Dates� HS Code at 8-digit level represents “National Sub-Heading
Numbers”.
Example:
0804.1010 – Dates fresh
0804.1020 – Dates Dried
12

b) PSTC-R-3 Coding System
� PSTC-R-3 Code at 1 digit level 0-9 represents “Sections”
Example:
Section 4 – Animal & Vegetable oils, fats & waxes.
� PSTC-R-3 Code at 2 digit level represents “Division Code
Example:
Division 41 – Animal oil and fats.
� PSTC-R-3 Code at 3 digit level represents “Group Code”
Example:
411 - Animal oil and fats. = Group Code
� PSTC-R-3 Code at 4 digit level represents “Sub-Group Code”
Example:
4111 – fats and oils and their fractions of fish or marine mammals, whether or not refined, but not chemically modified = Sub Group Code.
� PSTC-R-3 Code at 5 digit level represents “Item Code”
Example:
41111 – fish liver oil and their fractions = Item Code
� PSTC-R-3 Code at 7 digit level represents “Sub-Item Code”
Example:
4111101 – Cod liver oil = Sub Item Code.
13

VII- TRANSACTIONS OF EXPORTS/IMPORTS:
The following transactions of exports & imports are excluded while
compiling foreign trade statistics of Pakistan:
i) Articles of baggage and personal effects of passengers.
ii) Afghanistan Trade in transit through Pakistan
iii) Imports into bonds.
iv) Sale of imported goods in Duty Free Shops in Pakistan.
v) Defense Stores (Not valued military goods but if commercial
value is declared on GD then the value will be included)
vi) Gold and Silver coins or Bullion and Currency Notes.
vii) Relief goods of no commercial value
14

VIII- PREPARATION OF STATISTICAL REPORTS
After the finalization of data file, the following monthly/annual reports are
generated:
i) Country by commodity.
ii) Commodity by country
iii) By areas, and Countries/Territories.
iv) By Economic Categories.
v) By Commodity Group.
NOTE
Imported goods subsequently re-exported to foreign countries without
further modification are excluded from export statistics, lists are tabulated
separately. Goods exported and returned to Pakistan by the importing
countries without any modification or change in the original form or shape
are considered re-imported and excluded from imports but tabulated
separately.
15

Merchandise Trade Indices are being computed since inception of
trade statistics section. Such indices were first computed with 1954-
55 base. However, changes have been taking place from time to time
in the composition and direction of trade, the base year of these
indices have subsequently been changed to 1960-61, 1969-70,
1975-76 and 1980-81. As per decision of National Accounts
Committee that the base of all economic indicators be shifted from
1980-81 to 1990-91, accordingly new series of trade indices of
quantum and unit values of exports, imports and terms of trade
1990-91 as base, are being computed since July,1991 on
quarterly/annually basis.
IX- FOREIGN TRADE INDICES:
16

X COMPUTATION OF INDICES:Lspeyer’s formula is being used for the computation of these indices
which is as under:-
i) Unit Value Index
Σ Pn QoIV= Χ 100
Σ Po Qo
ii. Quantum Index
Σ Qn PoIQ= Χ 100
Σ Qo PoWhereIV Stands for Index of Unit Values. IQ Stands for Quantity Index.Po Stands for Unit Value of each item in the base year.Pn Stands for Unit Value of each item in the current year.Qo Stands for Quantity data of each item in the base year.Qn Stands for Quantity of each item in the current year.
17

XI- TERMS OF TRADE
The formula used in calculating the index of terms of trade as under:-
Index of unit values of exports
----------------------------------- X 100
Index of unit values of imports
Example:-
Terms of Trade calculation for the year 2014-15=
Index of unit values of exports
------------------------------------- X 100
Index of unit values of imports
759.21---------- X 100 = 54.051,404.72
18
XII- DISSEMINATION OF TRADE DATA/PUBLICATIONS:
Merchandise Trade Statistics of Pakistan are being disseminated in
electronic readable form on CDs/DVDs. Publication and Reports supplied
to the following users:
a) International Users:
� United Nations (UN)
� International Monetary Fund (IMF)
� World Bank
� Economic and Social Commission for Asia & Pacific (ESCAP)
� Asia Development Bank (ADB)
� World Trade Organization (WTO)
� South Asia Association for Regional Cooperation. (SAARC)
� Economic Cooperation Organization (ECO)
� Organization of Islamic Cooperation (OIC)
19

b) National Users:
i) Ministry of Commerce
ii) Ministry of Finance
iii) Planning Development Division.
iv) Trade Development Authority of Pakistan.
v) State Bank of Pakistan
vi) Federal Board of Revenue (FBR)
vii) Federation of Pakistan Chambers of CommerceIndustry.(FPCCI)
viii)Chamber of Commerce & Industry. (CCI)
ix) National Accounts Committee.
x) Students, Researchers & Traders.
20

c) Merchandise Trade Statistics are published in the following
publications:
1) Economic Survey of Pakistan
2) Statistical Pocket Book Punjab
3) Statistical Bulletin, State Bank of Pakistan
d) Merchandise Trade Statistics are published in the publications
of following International organizations:
1) United Nations (UN)
2) International Monetary Fund(IMF)
3) Economic & Social Commission for Asia & Pacific.(ESCAP)
e) Merchandise Trade Statistics are published by PBS in the
following publications;
a) Monthly Review of Foreign Trade (which is available on
web Site) www.pbs.gov.pk
b) Foreign Trade Statistics of Pakistan-Export & Import (annual)
c) Monthly Bulletin of Statistics
d) Pakistan Statistical Year Book
e) Statistical Pocket Book of Pakistan
21

XIII TRADE IN SERVICES
Trade in Services is one of the important
factor on the basis of which balance of
payments of a country is finalized. Firstly a
manual providing guide lines on the
procedure of recording trade in services
statistics on International level was
published in the year 2002. It is also a
useful tool for Governments which
provides useful statistical information
pertaining to international negotiations on
trade in services.
22

XIV- Source of Data
P.B.S is collecting the secondary
trade in services data from the
State Bank of Pakistan (S.B.P). The
State Bank is following the guide
lines mentioned in IMF Balance of
Payment Manual Sixth edition
(BPM6).
23

XV-Data Dissemination
P.B.S is compiling the secondary
data on trade in services in the
format as being used for preparing
the merchandise trade statistics by
the P.B.S. The same is being
provided to Ministry of commerce
and also displayed on P.B.S.
website each month. The data is
usually lag behind one month as
compared to merchandise trade.
24

Sectors of trade in services
The following sectors are covered in Trade in services:
Export of Services
A. TRANSPORTAION
B. TRAVEL
C. COMMUNICATION SERVICES
D. CONSTRUCTION SERVICES
E. INSURANCE SERVICES
F. FINANCIAL SERVICES
G. COMPUTER AND INFORMATION SERVICES
H. ROYALTIES AND LICENSE FEES
I. OTHER BUSINESS SERVICES
J. PERSONAL, CULTURAL, AND RECREATIONAL SERVICES
K. GOVERNMENT SERVICES, n.i.e.
25

Import of Services
A. TRANSPORTAION
B. TRAVEL
C. COMMUNICATION SERVICES
D. CONSTRUCTION SERVICES
E. INSURANCE SERVICES
F. FINANCIAL SERVICES
G. COMPUTER AND INFORMATION SERVICES
H. ROYALTIES AND LICENSE FEES
I. OTHER BUSINESS SERVICES
J. PERSONAL, CULTURAL, AND RECREATIONAL
SERVICES
K. GOVERNMENT SERVICES, n.i.e.
26

27Exports
Imports
Balance of Trade Rs. In Million
Dollars in Million
Series
Rs. $ Rs. $ Rs. $
Exports of Services 46,443.59 443.29 41,010.83 391.56 13.25 13.21
Imports of Services 89,154.50 850.96 90,168.17 860.89 -1.12 -1.15
Balance of Trade -42,710.91 -407.67 -49,157.34 -469.33 -13.11 -13.14
Series
Rs. $ Rs. $ Rs. $
Exports of Services 46,443.59 443.29 43,952.10 420.25 5.67 5.48
Imports of Services 89,154.50 850.96 77,746.45 743.37 14.67 14.47
Balance of Trade -42,710.91 -407.67 -33,794.35 -323.12 26.38 26.17
Series
Rs. $ Rs. $ Rs. $
Exports of Services 581,584.85 5,554.93 569,010.74 5,458.92 2.21 1.76
Imports of Services 955,625.39 9,127.53 924,040.22 8,864.96 3.42 2.96
Balance of Trade -374,040.54 -3,572.60 -355,029.48 -3,406.04 5.35 4.89
* Provisional figures based on figures provided by the State Bank of Pakistan.
** Revised by SBP
NOTE:-
Dollar value is converted into Rupees on monthly average exchange rate provided by SBP.
June, 2017 (1$=Rs.104.770211), May, 2017 (1$=Rs. 104.738087) and June, 2016 (1$=Rs. 104.586375 ) respectively.
NOTE: Due to roundings effects some totals and percentages may not tally.
GOVERNMENT OF PAKISTAN
PAKISTAN BUREAU OF STATISTICS
KARACHI
SUMMARY (TRADE IN SERVICES)
June, 2017
% Change in
* June, 2017 ** May, 2017 June, 2017 over
May, 2017
* June, 2017 ** June, 2016 June, 2017 over
%Change in
2016 - 2017 2015 - 2016 July - June, 2015 - 2016
June, 2016
* July - June ** July - June July - June, 2016 - 2017 over
%Change in

28
GOVERNMENT OF PAKISTAN
PAKISTAN BUREAU OF STATISTICS
KARACHI
TRADE IN SERVICES (SUMMARY)
June, 2017
Rs. In Million
Dollars in Thousands
* June, 2017 * May, 2017 % Change in June, 2017
Description over May, 2017
Rs $ Rs $ Rs $
Export of Services (TOTAL) 46,443.59 443,290.00 41,010.83 391,556.00 13.25 13.21
1.Manufacturing services on physical inputs owned by others 0.00 0.00 0.00 0.00 0.00 0.00
2.Maintenance and repair services n.i.e. 147.73 1,410.00 59.70 570.00 147.45 147.37
3. Transport 8,678.11 82,830.00 8,813.71 84,150.00 -1.54 -1.57
4. Travel 2,083.87 19,890.00 3,135.86 29,940.00 -33.55 -33.57
5.Construction services 637.00 6,080.00 722.69 6,900.00 -11.86 -11.88
6. Insurance and Pension services 449.47 4,290.00 173.87 1,660.00 158.51 158.43
7. Financial services 2,184.46 20,850.00 766.68 7,320.00 184.92 184.84
8. Charges for the use of intellectual services 107.91 1,030.00 56.56 540.00 90.79 90.74
9. Telecommunication, Computer and information services 9,110.83 86,960.00 8,808.47 84,100.00 3.43 3.40
10. Other business services 11,097.89 105,926.00 11,018.66 105,202.00 0.72 0.69
11. Personal, cultural, and recreational services 199.48 1,904.00 211.99 2,024.00 -5.90 -5.93
12. Government services, n.i.e. 11,746.84 112,120.00 7,242.64 69,150.00 62.19 62.14
Import of Services (TOTAL) 89,154.50 850,955.00 90,168.17 860,891.00 -1.12 -1.15
1.Manufacturing services on physical inputs owned by others 0.00 0.00 0.00 0.00 0.00 0.00
2.Maintenance and repair services n.i.e. 733.17 7,000.00 733.23 7,000.00 -0.01 0.00
3. Transport 35,456.43 338,421.00 34,549.54 329,866.00 2.62 2.59
4. Travel 18,546.43 177,020.00 20,456.40 195,310.00 -9.34 -9.36
5.Construction services 1,347.34 12,860.00 97.41 930.00 1283.16 1282.80
6. Insurance and Pension services 1,699.06 16,217.00 1,971.69 18,825.00 -13.83 -13.85
7. Financial services 2,989.09 28,530.00 2,971.42 28,370.00 0.59 0.56
8. Charges for the use of intellectual services 1,772.71 16,920.00 3,150.52 30,080.00 -43.73 -43.75
9. Telecommunication, Computer and information services 4,159.38 39,700.00 2,819.56 26,920.00 47.52 47.47
10. Other business services 15,393.89 146,930.00 16,306.68 155,690.00 -5.60 -5.63
11. Personal, cultural, and recreational services 135.57 1,294.00 209.90 2,004.00 -35.41 -35.43
12. Government services, n.i.e. 6,921.43 66,063.00 6,901.82 65,896.00 0.28 0.25
Rs. In Million
Dollars in Thousands
* July - June July - June % Change in July - June, 2016 -2017
Description 2016 - 2017 2015 -2016 over July - June, 2015 - 2016
Rs $ Rs $ Rs $
Export of Services (TOTAL) 581,584.85 5,554,927.64 569,010.74 5,458,915.97 2.21 1.76
1.Manufacturing services on physical inputs owned by others 0.00 0.00 0.00 0.00 0.00 0.00
2.Maintenance and repair services n.i.e. 730.79 6,980.00 229.32 2,200.00 218.68 217.27
3. Transport 104,887.76 1,001,821.00 117,299.94 1,125,340.00 -10.58 -10.98
4. Travel 33,743.88 322,300.00 33,658.56 322,910.00 0.25 -0.19
5.Construction services 7,547.61 72,090.00 4,394.55 42,160.00 71.75 70.99
6. Insurance and Pension services 10,721.07 102,401.00 5,470.26 52,480.00 95.99 95.12
7. Financial services 13,698.57 130,840.00 11,556.55 110,870.00 18.54 18.01
8. Charges for the use of intellectual services 798.84 7,630.00 2,095.13 20,100.00 -61.87 -62.04
9. Telecommunication, Computer and information services 98,272.90 938,640.00 82,203.98 788,640.00 19.55 19.02
10. Other business services 120,943.67 1,155,176.64 106,214.64 1,018,990.97 13.87 13.36
11. Personal, cultural, and recreational services 2,159.80 20,629.00 2,992.07 28,705.00 -27.82 -28.13
12. Government services, n.i.e. 188,079.96 1,796,420.00 202,895.74 1,946,520.00 -7.30 -7.71
Import of Services (TOTAL) 955,625.39 9,127,525.00 924,040.22 8,864,961.00 3.42 2.96
1.Manufacturing services on physical inputs owned by others 0.00 0.00 0.00 0.00 0.00 0.00
2.Maintenance and repair services n.i.e. 8,108.79 77,450.00 10,466.25 100,410.00 -22.52 -22.87
3. Transport 374,407.17 3,576,099.00 342,493.44 3,285,778.00 9.32 8.84
4. Travel 184,275.28 1,760,080.00 191,651.90 1,838,650.00 -3.85 -4.27
5.Construction services 2,579.74 24,640.00 7,028.57 67,430.00 -63.30 -63.46
6. Insurance and Pension services 24,576.28 234,737.00 26,563.48 254,842.00 -7.48 -7.89
7. Financial services 26,144.96 249,720.00 21,254.58 203,910.00 23.01 22.47
8. Charges for the use of intellectual services 22,812.45 217,890.00 19,087.53 183,120.00 19.51 18.99
9. Telecommunication, Computer and information services 40,213.10 384,090.00 39,274.75 376,790.00 2.39 1.94
10. Other business services 206,217.69 1,969,660.00 216,287.87 2,075,000.00 -4.66 -5.08
11. Personal, cultural, and recreational services 1,451.11 13,860.00 885.58 8,496.00 63.86 63.14
12. Government services, n.i.e. 64,838.82 619,299.00 49,046.27 470,535.00 32.20 31.62
* Provisional figures based on figures provided by the State Bank of Pakistan.
** Revised by SBP

Implementation of New
Recommendations of
IMTS 2010 in Pakistan

IMTS 2010 Implementation Plan
Chapter I: Coverage and Time of
Recording
New encouragement
1. Goods for processing as well as goods
resulting from such processing where no
change of ownership takes place: Include
and explicitly identify (preferably by
special coding) in your trade statistics
(para. 1.21)
Chapter II: Trade System
New recommendation
2. Reimports and re-exports: Include and
identify (code) separately for analytical
purposes (paras. 2.16 and 2.18)
Pakistan has implemented this
recommendation.
Pakistan has implemented this
recommendation.

IMTS 2010 Implementation Plan
Chapter III: Commodity Classifications
New recommendation
3. Standard International Trade
Classification (SITC): Use SITC for the
dissemination and the analysis of trade
statistics according to user requirements
(para. 3.19)
Pakistan has implemented this
recommendation.

IMTS 2010 Implementation Plan
Chapter VI: Partner Country
New recommendation
4. Calculation of trade balances: Use
imports by country of origin and exports
by country of last known destination (para.
6.27)
Chapter VII: Mode Of Transport
New recommendation
5. Compilation of mode of transport:
Compile and disseminate international
merchandise trade statistics by mode of
transport at the most detailed commodity
level (as a new data dimension) (para.
7.1)
Pakistan has implemented this
recommendation.
Pakistan has implemented this
recommendation.

IMTS 2010 Implementation Plan
Chapter VII: Mode Of Transport
New recommendation
6. Recording of mode of transport: Record
as mode of transport the means of
transport used when goods enter or leave
the economic territory (para. 7.1)
New recommendation
7. Classification: Clearly indicate the
contents of the categories used; countries
are encouraged to follow the suggested
classification for the compilation and
reporting of trade statistics by mode of
transport (paras. 7.2-7.3)
Pakistan has implemented this
recommendation.
Mode of transport that are relevant
to Pakistan: - sea, railway, road,
air, pipeline, cable (detailed
product are available).
And for postal, homogenous code
assigned.

IMTS 2010 Implementation Plan
Chapter VIII: Data Compilation
Strategies
New recommendation
8. Use of customs records: Use customs
records as the main and normally
preferred data source (para. 8.2)
New recommendation
9. Institutional arrangements: Consider
the establishment of the institutional
arrangements necessary to ensure the
compilation of high quality trade statistics
as a matter of high priority and periodically
review their effectiveness (para. 8.17)
100% transactions from customs
declarations.
Pakistan has established good
networking/ relationship with Royal
Malaysian Customs.

IMTS 2010 Implementation Plan
Chapter IX: Data Quality And
Metadata
New recommendation
10. Metadata categories: Cover at least
the categories of metadata provided in
para. 9.23 (para. 9.23)
New recommendation
11. Metadata as high priority: View the
development of metadata as a high
priority and consider their dissemination
an integral part of the dissemination of
international merchandise trade statistics
(para. 9.25)
Presently, Pakistan has plan to
develop metadata
Presently, Pakistan has plan to
develop metadata

IMTS 2010 Implementation Plan
Chapter X: Dissemination
New recommendation
12. Data dissemination: Treat all users
equally and disseminate data without
preference to any national or international
user group. Choose the dissemination
format that best suits the users’ needs
(para. 10.13)
Pakistan releases data through:
1) website
i) Pakistan External Trade
Statistics System (4, 6 & 8
digits HS),
ii) softcopy publication (pdf
format),
iii) highlights and key statistics;
2) hardcopy publication.

Harmonized
System
meaning
� The Harmonized Commodity Description and Coding System, also known as the Harmonized System (HS) of tariffs is an internationally
standardized system of names and numbers to
classify traded products.
� It came into effect in 1988 and has since been
developed and maintained by the World
Customs Organization

structure
� The HS is organized into 21 sections and 99
chapters, accompanied with general rules of
interpretation and explanatory notes.
� the system assigns goods to sections, and then
proceeds to assign these goods to their specific
chapter, heading, and subheading.
� The HS assigns up to a total of 8 digits at the tariff-
rate (legal) level. Two extra digits may also be
assigned as statistical reporting numbers for a
total of 10 digits to be listed on entries.

For example :
1. HS code 0205.00 means : the fifth heading of
Chapter 2, which has not been subdivided;
2. HS code 0103.10 means : the third heading of
Chapter 1, first subheading which has not been
further subdivided;

Countries following HS
o The system is used by more than 200 countries. Over 98
% of the merchandise in international trade is classified
in terms of the HS.
o It comprises about 5,000 commodity groups; each
identified by a six digit code
o Afghanistan
o India
o Argentina +
o Australia +
o Austria +
o (207 as per 18 September 2014)
HS coding for products
� 0104 Live sheep and goats.
� 010410 Sheep
� 010420 Goats
� 070951 Mushrooms, fresh or chilled
� 070952 Truffles, fresh or chilled
o 070960 Fruits of genus Capiscum or Pimenta
o 070970 Spinach, fresh or chilled
070990 Other vegetables, fresh or chilled,
o 0710 Vegetables, frozen
o 071010 Potatoes, frozen

Chapters and sections in
hs
� SECTION I: LIVE ANIMALS; ANIMAL PRODUCTS
(chap 1-5)
� SECTION II: VEGETABLE PRODUCTS(6-14)
� SECTION III: ANIMAL OR VEGETABLE FATS AND OILS
AND THEIR CLEAVAGE PRODUCTS; PREPARED
EDIBLE FATS; ANIMAL OR VEGETABLE WAXES
� SECTION IV: PREPARED FOODSTUFFS; BEVERAGES,
SPIRITS, AND VINEGAR; TOBACCO AND
MANUFACTURED TOBACCO SUBSTITUTES

uses
� Customs tariffs
� Collection of international trade statistics
� Rules of origin
� Collection of internal taxes
� Trade negotiations
� Transport tariffs and statistics
� Monitoring of controlled goods (e.g., wastes, narcotics, chemical weapons, ozone layer depleting substance ,endangered species
� Areas of Customs controls and procedures, including risk assessment, information technology and compliance.

Re-basing of
External Trade
Indices

46
HISTORY OF TRADE INDICES
……1947
1954-55
1960-61
1969-70
1975-76
1980-81
1990-91
2013-14
Current
New (Proposed)

47
CURRENT TRADE INDICES (1990-91)
At present PBS is computing the following
indicators on quarterly and annual basis.
� Unit Value Index of Imports
� Unit Value Index of Exports
� Quantum Index of Imports
� Quantum Index of Exports
� Terms of Trade

48
COMPUTATION OF INDICES
Laspeyer’s formula is being used for the computation of these indices which is as under:-
i) Unit Value Index = (Σ PnQo / Σ PoQo) x 100
ii. Quantum Index = (Σ QnPo/ Σ QoPo) x 100
iii. Terms of Trade = (Unit Value index of Exports/ Unit Value Index of Imports) x 100
Where
Po Stands for Unit Value of each item in the base year.
Pn Stands for Unit Value of each item in the current year.
Qo Stands for Quantity data of each item in the base year.
Qn Stands for Quantity of each item in the current year.

49
SELECTION OF ITEMS FOR TRADE INDICESSELECTION OF ITEMS FOR TRADE INDICES
Selection criteria:
� All import/export items which are significantly traded during
base year are selected.
� Items whose value accounted for less than 0.01% of total
value of Groups are dropped.

50
ITEMS GROUPS (2013-2014=100) (1 of 3)
• HS coding system
Section
Description Chapters
1 Live Animals, Animals Products 01-05
2 Vegetable Product 06-14
3 Animal Vegetable Fats, Oil & Waxes etc. 15
4 Preparation Food Stuff, Beverages, Tobacco etc. 16-24
5 Mineral Products 25-27
6 Product of Chemical & Allied Industries 28-38
7 Plastic and Articles thereof etc. 39-40

51
ITEMS GROUPS (2013-2014=100) (2 of 3)
• HS coding system
Section
Description Chapters
8Raw Hides and Skins, Leather, Fur-skin and Art thereof
41-43
9 Wood & Art of wood, Charcoal, cork etc. 44-46
10Pulp of wood or of other Fibrous cellulosic material, paper board & Art thereof
47-49
11 Textile and Textile article 50-63
12 Footwear, walking stick, umbrellas etc. 64-67
13Article of stone, glass, glass wear, plaster cement, Asbestos, Ceramic Product etc.
68-70
14Natural or cultural pearls pre/semi precious stone etc.
71

52
ITEMS GROUPS (2013-2014=100) (3 of 3)
• HS coding system
Sectio
n
Description Chapte
rs
15 Base Metals & Article of base metal 72-83
16Machinery and Mech. Elect. Appliances.
Equip Parts. 84-85
17Vehicle, Aircraft, Vessel of Associated
Transports, Equip. 86-89
18Optical photographic med.& Surgical
Instruments’ etc. 90-92
19Arms & Ammunition Parts & Associates
thereof. 93
20 Misc. Manufactured Article 94-96
21 Work of art, collectors prices & Antiques. 97-99

53
COVERAGE OF DATA (1 of 2)
All transactions through sea, air and land on government, semi-government and private accountsExports (included):
� Supplies & fueling to foreign ships & aircrafts
� Exports by parcel post
Exports (excluded):
� Defense stores.
� Gold & Silver coin or bullion and currency notes.
� Articles of Baggage and Personal effects of passengers.
� Relief goods/goods of no commercial value.
� Trade in transit through Pakistan.

54
COVERAGE OF DATA (2 of 2)
Imports (included):� All good released by custom either directly or from bonded warehouses
for consumption or re-export.
� Diplomatic privileges and parcel posts.
Imports (excluded):� Imports into Bond.
� Defense stores where values have not been indicated by Defense Authorities.
� Gold and Silver coins or bullion and currency.
� Articles of baggage’s and personal effects of passengers.
� Trade in transit through Pakistan.
� Sales of duty free shops.
� Relief goods/goods of no commercial value.
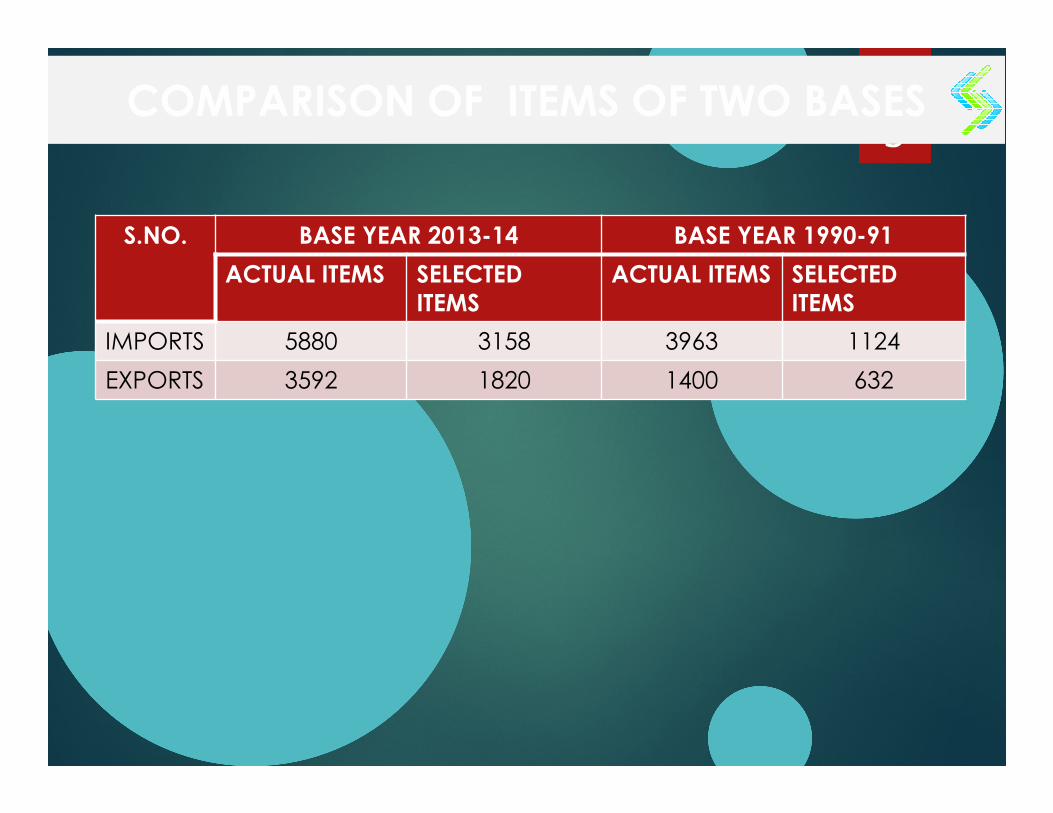
S.NO. BASE YEAR 2013-14 BASE YEAR 1990-91
ACTUAL ITEMS SELECTED
ITEMS
ACTUAL ITEMS SELECTED
ITEMS
IMPORTS 5880 3158 3963 1124
EXPORTS 3592 1820 1400 632
55
COMPARISON OF ITEMS OF TWO BASESCOMPARISON OF ITEMS OF TWO BASES

QUARTER BASE YEAR 2013-14 GROWTH BASE YEAR 1990-91 GROWT
H
QUANT
UM
UNIT
VALUE
RATE QUANT
UM
UNIT
VALUE
RATE
JUL-SEP
2014
92.70 105.70 ------ 201.64 753.27 ------
OCT-DEC
2014
97.68 104.79 -0.86% 205.65 762.69 1.19%
JAN-MAR
2015
93.81 103.30 -1.42% 197.74 769.06 0.85%
APR-JUN
2015
93.56 103.82 0.50% 176.75 758.81 -1.33
ANNUAL
2014-15
94.44 104.40 ----- 195.45 759.21 ------
56
COMPARISON OF INDICES OF TWO BASES (EXPORTS)COMPARISON OF INDICES OF TWO BASES (EXPORTS)

QUARTER BASE YEAR 2013-14 GROWTH BASE YEAR 1990-91 GROWTH
QUANTUM UNIT
VALUE
RATE QUANTUM UNIT
VALUE
RATE
JUL-SEP
2015
87.35 100.44 -2.76% 187.10 712.89 -5.18%
OCT-DEC
2015
90.52 100.87 0.43% 193.24 701.89 -1.54%
JAN-MAR
2016
90.34 102.54 1.66% 228.18 703.02 0.16%
APR-JUN
2016
86.96 101.61 -0.91% 206.13 702.28 -0.11%
ANNUAL
2015-16
88.79 101.37 -2.13% 203.66 705.02 -7.13%
57
COMPARISON OF INDICES OF TWO BASES (EXPORTS)COMPARISON OF INDICES OF TWO BASES (EXPORTS)

QUARTER BASE YEAR 2013-14 GROWTH BASE YEAR 1990-91 GROWTH
QUANTUM UNIT
VALUE
RATE QUANTUM UNIT
VALUE
RATE
JUL-SEP
2014
117.52 98.90 ------ 302.77 1441.98 ------
OCT-DEC
2014
118.60 94.82 -4.13% 303.82 1401.74 1.19%
JAN-MAR
2015
98.27 93.35 -1.55% 290.10 1376.64 0.85%
APR-JUN
2015
123.06 94.14 0.85% 302.25 1398.50 -1.33
ANNUAL
2014-15
114.36 95.30 ----- 299.74 1404.72 ------
58
COMPARISON OF INDICES OF TWO BASES (IMPORTS)COMPARISON OF INDICES OF TWO BASES (IMPORTS)

QUARTER BASE YEAR 2013-
14
GROW
TH
BASE YEAR 1990-91 GROWTH
QUANTU
M
UNIT
VALUE
RATE QUANTUM UNIT
VALUE
RATE
JUL-SEP
2015
134.15 95.37 1.31% 290.52 1328.20 -5.03%
OCT-DEC
2015
128.19 92.24 -3.28% 355.81 1238.67 -6.74%
JAN-MAR
2016
119.17 90.79 -1.57% 304.06 1214.84 -1.92%
APR-JUN
2016
129.17 92.53 1.92% 372.45 1224.39 0.79%
ANNUAL
2015-16
127.67 92.60 -2.83% 330.71 1251.53 -10.91%
59
COMPARISON OF INDICES OF TWO BASES (IMPORTS)COMPARISON OF INDICES OF TWO BASES (IMPORTS)

Thank You